Evaluation of Sustainable Use of Water Resources in Beijing Based on Rough Set and Fuzzy Theory

1
Beijing Key Laboratory of Energy Safety and Clean Utilization, North China Electric Power University, Renewable Energy Institute, Beijing 102206, China
2
Key Laboratory of Water Cycle and Related Land Surface Process, Institute of Geographic Sciences and Natural Resources Research, Chinese Academy of Sciences, Beijing100101,China
3
University of Chinese Academy of Sciences, Beijing 100049, China
*
Author to whom correspondence should be addressed.
Water 2017, 9(11), 852; https://doi.org/10.3390/w9110852
Submission received: 8 August 2017
/
Revised: 15 October 2017
/
Accepted: 31 October 2017
/
Published: 3 November 2017
Abstract
:Water resources are not only the essence of human life, but also an important prerequisite which ensures the economic and social development of a country or city. Due to chronically global overexploitation, water crises have started to emerge. China, for example, is experiencing acute water scarcity. Even its capital, Beijing, faces enormous challenges in the sustainable use of water resources. Combining the compound system of social, economic, and ecological environments with the current situation in Beijing, this study established an evaluation index system. To determine the weight, the rough set theory was adopted in the index layer, fuzzy theory was employed in the rule layer and set pair analysis method, and attribute recognition theory was used as evaluation methods. In order to verify the accuracy of the results, the weights of indices were taken into the evaluation methods mentioned above after being calculated by using the analytic hierarchy process (AHP) and entropy weight method, respectively. The matter-element model was used to evaluate the system and the Spearman correlation coefficient method aimed to compare all the results of the evaluation. The results indicated that water use efficiency and water management have been increasingly improved in Beijing on a yearly basis. Additionally, the results of the Spearman correlation coefficient method showed that the method of weight determination based on rough set and fuzzy theory is feasible in the evaluation of sustainable use of water resources.
1. Introduction
To satisfy human needs without affecting future generations, the concept of “sustainable development” was established, which laid the foundation of the sustainable use of natural resources. To achieve the goal of making humans and nature coexist harmoniously, as well as coordinating social development with environmental protection, the key lies in prioritizing sustainable use of water resources [1]. Confronted with water pollution and water shortage, Beijing, the capital of China, is now counting the cost of rapid urbanization and paying the consequence. The densely-populated metropolis is in the process of transforming its role, but the growing water crisis has become a bottleneck that impedes its pathway to long-term prosperity. Therefore, it is necessary to fully understand the current situation and development tendency of the water resources in Beijing to provide references for its urban long-term planning.
There are a large number of studies regarding sustainable utilization evaluation at home and abroad, but a unified standard and recognized method have not yet formed. The most common methods that previous studies on the evaluation of the sustainability of water resources adopted consist of three parts: establish an evaluation index system, determine the weight of each index, and bring weight into the evaluation methods to determine the rating level [2]. This study focuses on obtaining weights. The methods of attribute weighting so far can be divided into subjective weighting methods, objective weighting methods, combining weighting methods, and the no-weighting method. Subjective weighting methods mainly reflect decision-maker’s intention. Hence, the decision and evaluation results are often highly subjective and arbitrary. Though weights determined by objective weighting methods are based on mathematical theories, it may overlook the decision-maker’s preferences. The no-weighting method is easy to perform. However, this method is bound to lose information more or less in that it transforms the characteristics of all problems into numbers, all the reasoning into numerical calculation, without explaining the reasoning process and reasoning basis. In conclusion, to minimize the shortcomings of each method, this study adopts the weighting method that integrates the advantages of subjectivity and objectivity. Rough set theory is used to determine the index layer weight and the rule layer weight is determined based on non-structural decision fuzzy theory [3].
Rough set theory was proposed by Polish scholar Pawlak in 1982 [4] and was extended by him in 2007 [5]. After that, Yao examined and compared conceptual and computational formulations of two fundamental concepts of rough sets in 2015 [6]. Then D’Eer et al. studied how these new approximation operators related to existing ones in terms of partial order relations in 2016 [7]. In the field of water resources, this method was utilized to predict the urban water demand or evaluate water renewability [8]. Proposed by American scholar Zadeh in 1965, fuzzy theory was applied to many domains by a large number of researchers; like Atanassov et al., who gave a definition of the concept ‘intuitionistic fuzzy set’ in 1986 [9]; Deschrijver et al., who established the relationships between intuitionistic fuzzy sets, L-fuzzy sets, interval-valued fuzzy sets, and interval-valued intuitionistic fuzzy sets in 2003 [10]; and Didier et al., who promoted agricultural water productivity (AWP) through optimally allocating limited agricultural water resources with the coordination of related elements in 2017 [11]. Additionally, this method helps to mitigate the optimal flood control problem or optimize the design of groundwater remediation systems [12,13] in the area of water resources. Now, the rough set theory based on knowledge granularity and attribute significance and non-structural decision fuzzy theory will be combined to form the subjective and objective method of combining weighting which will be utilized to determine the weight of each index of the built system.
Firstly, based on the society-economy-environment compound system (RSWRS system) [14], an evaluation index system of the sustainable use of water resources was constructed in this study. Secondly, the weight determination methods of rough set theory based on knowledge granularity and attribute significance were applied to determine the index layer weights, and then the non-structural decision fuzzy theory was used to assure rule layer weights [15]. Moreover, the obtained weights were added to attribute recognition (AR) and set pair analysis (SPA) method [16] to acquire evaluation results. To verify the accuracy of the results, the analytic hierarchy process method and entropy weight method were utilized, respectively, to find index weights which were added to the above evaluation methods [17,18]. The matter-element model [19] was used to evaluate the system and obtained seven sets of evaluation results in total. Finally, the Spearman rank correlation coefficient (SRCC) method was applied to analyze the overall correlation and a natural conclusion would be drawn [20].
2. Methods
2.1. RSWRS System
Sustainable utilization of water resources is a multi-objective issue that is coherent with society, economy, and ecological environments, etc. This study divided water resources sustainable utilization RSWRS system into social subsystem, economic subsystem and environmental subsystem [21]. These three subsystems depend on each other, influence and restrict each other. With the change of time and the development of events, they promote the development of the compound system of water resources so as to realize the water sustainable development goals. The core of water sustainable utilization is to improve the water-use efficiency and increase the comprehensive benefits of water utilization in the three subsystems of society, economy, and ecology. In the social subsystem, on the premise of satisfying people’s basic living water needs, the goals are to realize the recycled and highly efficient use of fresh water resources, reduce the waste of water resources, raise awareness of water conservation, improve water-use efficiency, and maximize the social benefits of limited freshwater resources [22]. In the economic subsystem, the goals are to achieve efficient use of water resources in various production departments, meet the requirements of water intake of various industries, and ensure stable and sustainable water supply, and increase the economic benefits of unilateral water by comprehensive methods, including updating the technology and making reasonable policy, etc. In the ecological environment system, the goals are to keep the ecological environment in balance within a certain period of time, and encourage water conservation to enhance self-purification of water. In addition, the speed of exploring freshwater resources, groundwater resources in particular, should be controlled within the speed of self-purification of water so as to improve the ecological benefits. Only when the three subsystems meet their corresponding requirements and realize the maximization of comprehensive benefits can the use of water resources become a sustainable, virtuous circle [23]. After trawling through the relevant literature, and combining the current economic, social, environmental situations of Beijing in recent years, the indicators are preliminarily selected in each subsystem, and the results are shown in Table 1.
2.1.1. Index Determination
According to the present situation of water resources sustainable utilization evaluation index system, the selection of evaluation indicators for sustainable use of water resources should follow the following principles through mining and analyzing the connotation of sustainable utilization: the index can fully embody the connotation and goal of sustainable use of regional water resources; the meaning and substance of unnecessary overlap between the indices should be reduced as far as possible; in ensuring sustainable core concept of the complete case, reduce the number of indicators; combine the regional and universality of indicators; and the index has good maneuverability and practicability [32]. Based on the principles above, the final indicators are determined (see Table 2).
2.1.2. Index Ideal Set Partition
The ideal set of indicators is the benchmark for evaluating sustainable development. Taking the overall situation in China and the specific situation in Beijing into consideration, the index set of the ideal index is determined on the basis of international standard. As for indicators which are generally accepted, score them according to relevant regulations and standards. As for those that have not been widely recognized, score them referring to actual development situation. The target ideal set is determined by ideal (I), good (II), general (III), early warning (IV), and bad (V) levels, respectively. The standards of the sustainable use of water resources in Beijing are shown in Table 3.
2.2. Rough Set
Rough set theory is a new data processing method proposed by Polish scholar Pawlak. This method can effectively process and mine incomplete, imprecise, and inaccurate data [4]. The rough set theory can deal with, and describe, the uncertain problem relatively objectively, and does not need other knowledge sets except the existing dataset. The method of weighting based on the knowledge granularity and attribute importance of rough sets can avoid relying too much on the subjectivity and empirical knowledge of experts. From an objective point of view, it mines the correlation between data and indicators and then determines the weight.
2.2.1. Method Introduction
In rough sets, knowledge is related to categories, and knowledge has granularity. In the domain, an equivalence class becomes a knowledge granule. The granularity of knowledge measures the importance of equivalence classes, and it can be reflected by the roughness of knowledge representation. Rough set theory intends to process data through granulation of knowledge, analyze the data structure through objective means, and dig out more knowledge. The method of weight determination is through data mining and integration to find out the attribute importance of each index to determine its corresponding weight. In the case of a known set of information, it can be divided into known decision-making attributes of the decision-making system and the unknown decision-making attributes of the information system. Since the decision attribute of the research object is unknown, this study chooses the weight determination method based on information system [33].
Definition One: assume that is a knowledge base, represents the division of a domain formed by the knowledge R. Then, the granularity of the knowledge R is denoted as GD(R), and:
The resolution of R is recorded as , among them , represents the cardinality of the set X.
As defined above, the larger the granularity of knowledge, the smaller the resolution. When R is an equal relation (), the granularity of R gets the minimum value , when R is a domain relation (), the granularity of R is 1 [34].
Assume that is an information system, is a subset of attributes, is an attribute; calculate the importance of x for X, that is, to calculate the increase of resolution after adding attribute x in X, the larger the increase, the more important x is to the X. Therefore, the attribute importance of knowledge granularity is defined below.
Definition Two: Assume is an attributes set, is an attribute, the importance of x for X, denoted by , which is defined as:
Among which, .
represents an increase in resolution caused by the addition of attribute x in X. Therefore, the bigger the , x is more important than X. However, if the X is not distinguishable after adding x, it will make the attribute significance becomes 0. Therefore, in the final weight determination scheme, by adding the importance of the attribute itself, the definition three will define it.
Definition Three: Assume is an attribute, the importance of x itself is denoted by , and defined as:
Combined with the above two definitions, the final attribute importance of the index is denoted as , and defined as:
This definition effectively avoids that the attribute importance becomes 0, and in light of determining the importance it considers the attribute importance of the attribute of knowledge granularity and attribute importance of its own at the same time, so the result is more objective [34].
Then the attribute significance of the index from each rule layer is normalized separately to obtain the weights.
2.2.2. Calculation Procedure
- (1)
- Calculate the division of the conditional attribute set C on the domain U, that is .
- (2)
- Calculate , among which represents the cardinality of a knowledge particle, that is, the number of elements contained in a collection.
- (3)
- Calculate the division of the single attribute x on the domain U, that is , thus calculate .
- (4)
- In turn, after each condition attribute x is removed, require the classification of attribute set X on the domain U, and calculate .
- (5)
- Calculate the importance of attribute c, that is .
- (6)
- Calculate the weights .
2.3. Fuzzy Theory
When analyzing the AHP model, Professor Chen proposed the fuzzy theory and method of non-structural decision-making [35]. In this study, the method is used to determine the weights of social, economic, and ecological subsystems, and the specific calculation process is as follows:
- (1)
- Set an index in the system as , and compare the elements and of the index set. If is more important than , then . If is as important as , then . If is more important than , then . The binary comparison matrix E is finally obtained, and specific conversion relationships are shown in Table 4.
- (2)
- Add all rows of the comparison matrix E and arrange the results in descending order to obtain the order of importance of each index.
- (3)
- According to the importance of sorting, combining with relevant empirical knowledge, build the binary comparison judgment matrix .
- (4)
- Sum each row of the matrix (without the fuzzy scale value of self-comparison which is 0.5), the result vector is the relative importance of target set P to quantify the feature vector:
- (5)
- Normalize the vector to get the weight of the index set.
2.4. Other Methods
The determination of the weight of indicators is a central part of the evaluation of sustainable use of water resources, which has been described in detail above. Then the paper briefly introduces other weight determination methods, the evaluation method and the Spearman rank correlation coefficient method, as shown in Table 5 (the calculation steps and formulas are shown in Appendix A).
3. Analysis and Evaluation of Sustainable Use of Water Resources in Beijing
3.1. Data
This study selected the 2004–2015 sustainable use of water resources in Beijing as the object of evaluation. The evaluation index data is from the national economic and social development announcement from 2005 to 2016 in Beijing, Beijing water resources bulletin, and the National Bureau of statistics data, and through the relevant calculation, the specific data is shown in Table 6.
3.2. Determination of the Index Weight
Before using rough sets to calculate the index weight, we need to establish a table. According to the evaluation of the sustainable use of water resources in Beijing, 2004–2015 Beijing statistical data (see Table 6) and the five sets of standard data (see Table 3) were selected. The actual data of the 12 groups accord with the principle of data processing by rough set and fuzzy theory, which fully reflects the development tendency of Beijing water resources in recent years. Five sets of ideal data, which represents the sustainability of the five standard states, respectively: ideal, good, general, early warning, bad, and fully improves the comprehensiveness and accuracy of the information set.
The required data is discrete, so it needs discretization of the given information set. In the established sustainable utilization system of water resources, the indicators are divided into five levels. Therefore, each index value has a corresponding sustainable utilization situation, which take values from 1 to 5. It is noteworthy that the discrete indices varying from 1 to 5 do not mean that they have the same gradient, it just represents the state of sustainable development and the actual range of variation in each indicator is inconsistent.
Based on the calculation methods above, we apply Equation (2) to calculate , Equation (3) to calculate , and Equation (4) to calculate . After normalizing , the weights are obtained and the results are shown in Table 7.
3.3. Determination of the Rule Layer Weight
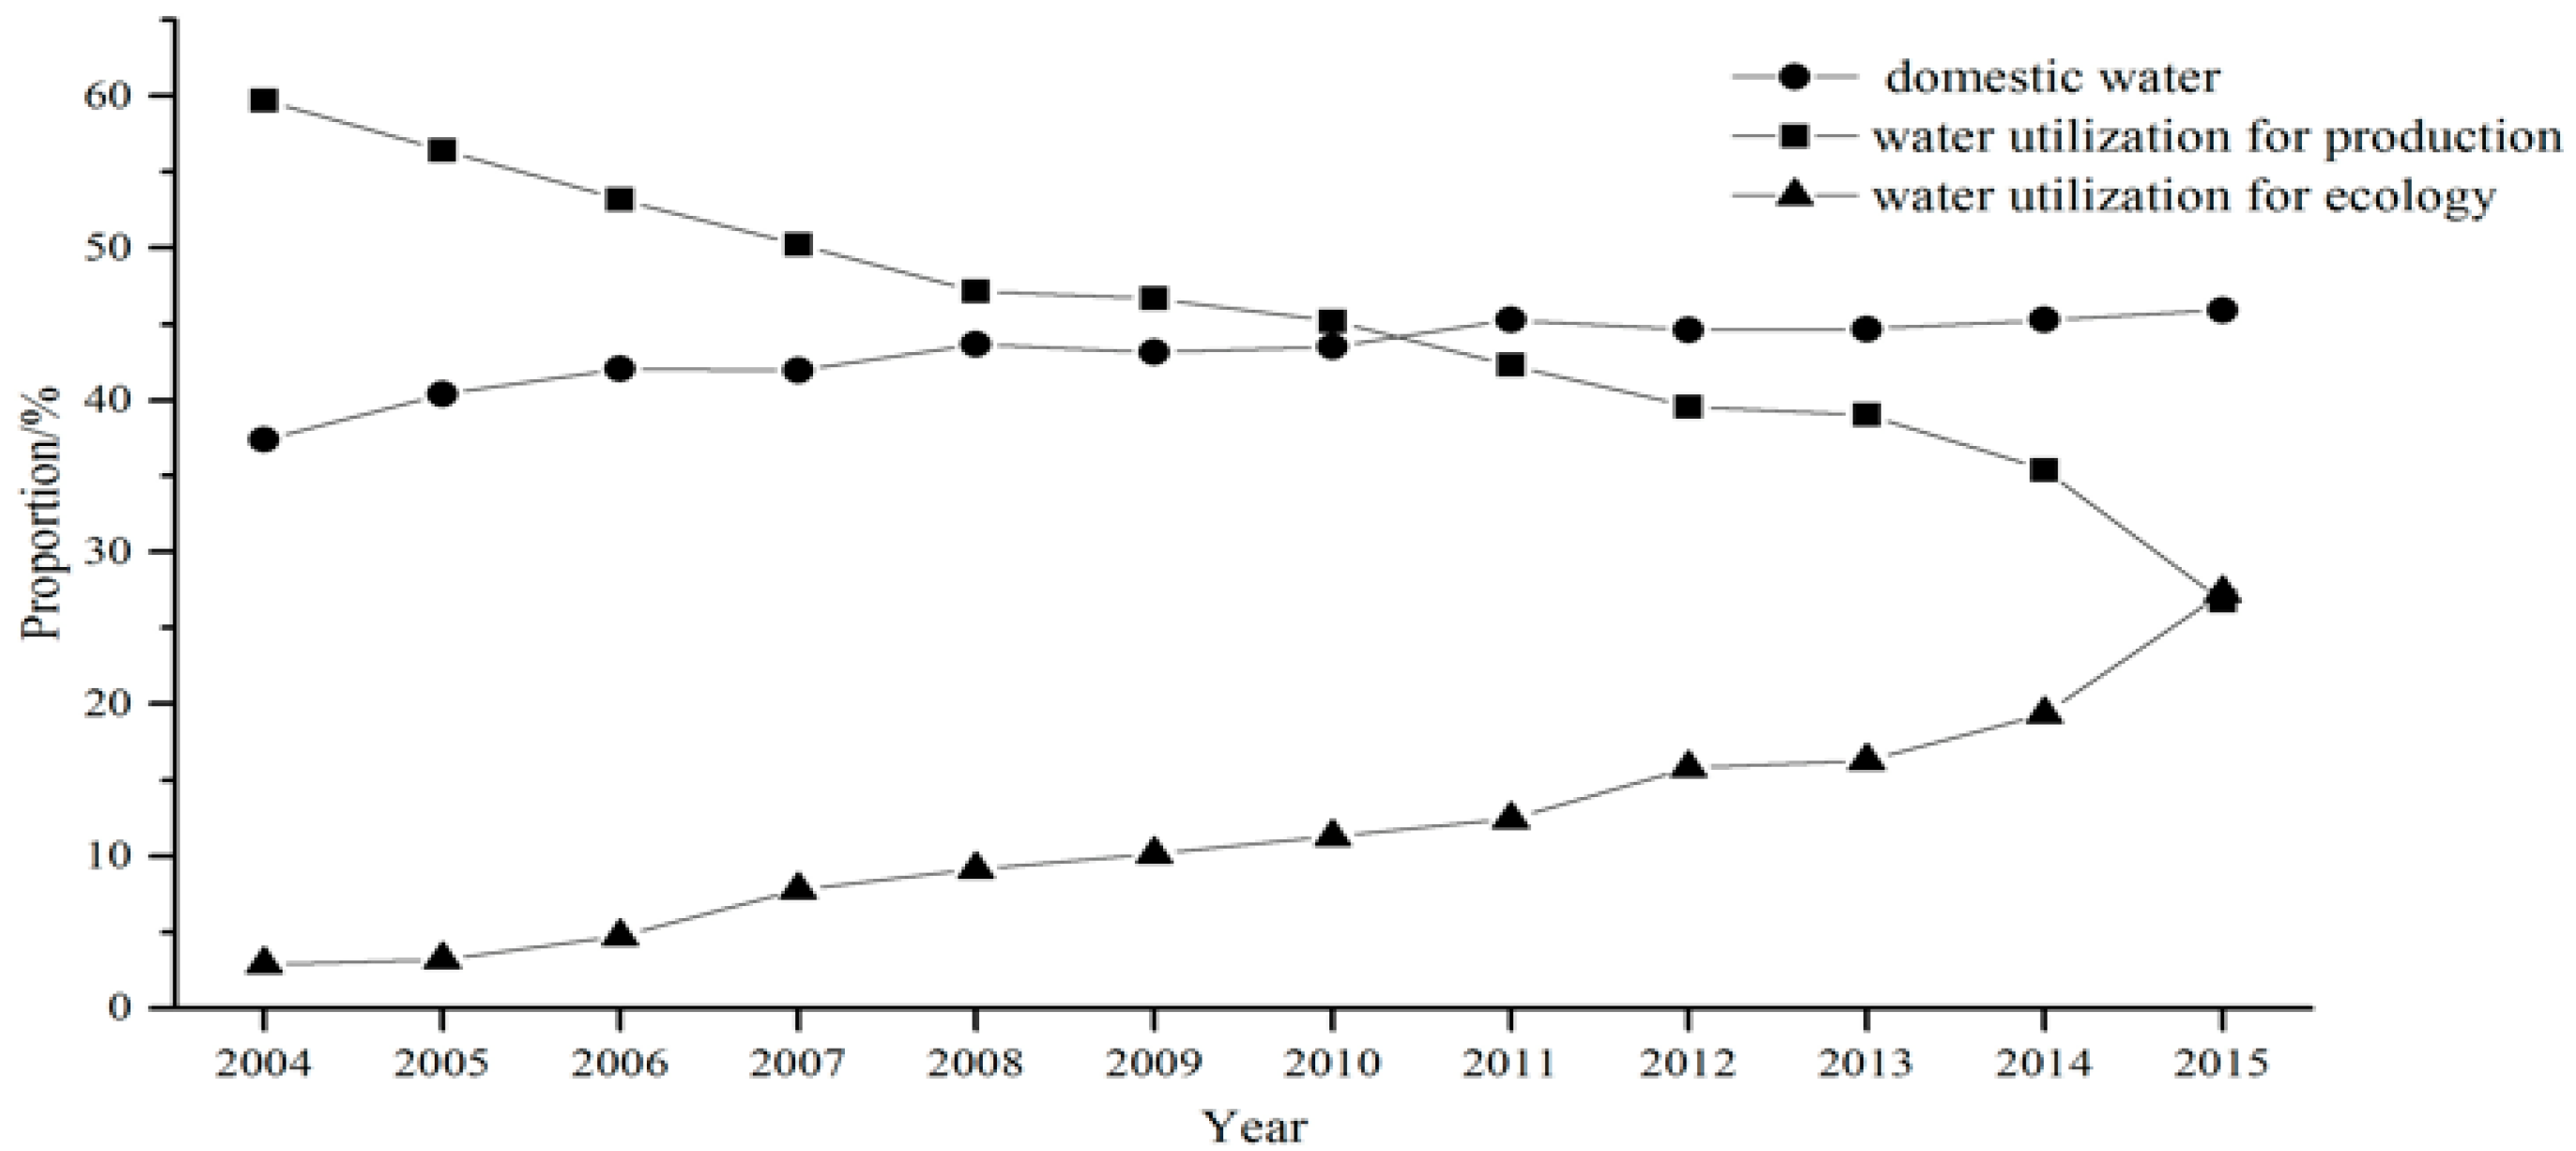
Water required for the water use departments, to a certain extent, indirectly reflects the sustainable utilization degree of water resources. After analysis, the main water use departments of social, economic, and ecological environment subsystems are domestic water, production water, and ecological water use, respectively. Therefore, the water use of each department can show the importance of the subsystem to the sustainable use of water resources.
Figure 1 depicts the proportion of water utilization structure from 2004 to 2015 in Beijing in terms of ratio of domestic, productive, and ecological use of water.
It is clear from Figure 1 that, as urban transformation and industry upgrading had been further accelerating in Beijing since 2004, the proportion of water consumption was decreasing year by year. Ecological water use and domestic water consumption showed an increasing trend. After 2010, domestic water has exceeded production water for the first time, which indicated that the transformation of the capital function gradually transferred to the people. From this, for Beijing, domestic water is the most important, which is followed by production water, and ecological water is the least important.
Firstly, set an index set: . represent social subsystems, economic subsystems, and ecological subsystems, respectively (the first step of Section 3 in chapter 2). Secondly, the binary comparison matrix E is constructed subjectively based on the importance of the three subsystems described by the last paragraph. Next, build the binary comparison judgment matrix according to the Equation (5) and Table 4:
Then, the quantized eigenvalue vector of relative importance of target set P can be obtained according to Equation (6):
Finally, the normalized weights of three subsystems are determined: 0.413, 0.333, and 0.254.
3.4. Evaluation Results and Analysis
3.4.1. Evaluation Results
The weights of the index layer (Table 7) obtained above are multiplied by the weights of the corresponding subsystems to obtain the final index weights () which will be put into set pair analysis method and attribute recognition evaluation method, respectively.
Take the set pair analysis method based on rough set and fuzzy theory as an example: the connection degrees between the index j (j = 1, 2, 2, the Set Pair responding evaluation level standards (Table 3) are obtained according to the steps and formulas of the set pair analysis method (refer to Table A3 of Appendix A) and the result is shown in Table 8 (take 2015 as an example). Then calculate the weighted connection degree (Step 6) and, finally, the evaluation level is determined. The result is shown in Table 9.
In order to assess the accuracy of the result, they are compared with five sets of evaluation results: set pair analysis and attribute recognition based on entropy weight, set pair analysis and attribute recognition, which are based on AHP, and the matter-element model. The results are shown in Table 10.
3.4.2. Interpretation of Results
As can be seen from Table 10, the rating scale for all evaluation methods is level II, IV, or V in 2004–2007, level II or III in 2008–2014, and level I or II in 2015, which shows that the sustainable use of water resources in Beijing from 2004 to 2015 is on the rise. The largest level difference of evaluation results of 2005–2007 is two, and it is one in other years, which shows that different evaluation methods have great influence on the results of evaluation and the determination of weights is critical.
Spearman rank correlation coefficient method was used to estimate the strength of the correlations between the results of evaluation and the other six results. The results are illustrated in Table 11.
As shown in Table 11, the correlation coefficient based on rough set and fuzzy theory is higher than that obtained by other methods. Among them, the average correlation coefficient of SPAro is 0.976, which is the highest of these seven sets of evaluation results. The correlation coefficient of ARro is 0.972, which is the third highest. This shows that the weights based on rough sets and fuzzy theory are feasible in the evaluation of sustainable use of water resources.
The SPAro is selected as the result of the evaluation of the sustainable use of water resources in Beijing. The results of SPAro evaluation and the timeline chart are drawn, and the results are shown in Figure 2.
Figure 2 indicates that the rank of sustainable use of water resources in Beijing from 2004 to 2015, is on the rise in general, but there has been a dramatic fluctuation from 2004 to 2007. The reasons can be elaborated as follows: In 2004, the situation of sustainable use of water resources in Beijing was abominable because of economy-oriented goals, an extensive development pattern, and a lack of awareness of environmental protection. The grain yield output, water industrial output value, sewage treatment rate, etc., were the lowest in nearly 12 years; the daily water consumption per capita was the highest in nearly 12 years. With the development of science and technology, and people’s awareness of water resources protection, the standard rate of various indices in Beijing have been greatly improved since 2005. Compared with 2004, the output value of unilateral grain yield and unilateral water industry in Beijing, respectively, increased by 38.9% and 23.5% in 2005, and the daily water consumption per capita decreased by 48.3%. Therefore, the evaluation for 2005 was good. This result indicated that applying scientific technology methods to improve industrial and agricultural water utilization efficiency and raise people’s awareness of water conservation can greatly promote the sustainable use of water resources. However, the order of evaluation for 2006 was an early warning caused by the unusual dry weather and generally low precipitations nationwide. This result is also consistent with the results of Wang et al. [27] in their study of sustainable use of water resources in Beijing.
Since 2007, the evaluation level of the sustainable use of water resources in Beijing has been good or general, except for some understandable fluctuations in a certain year. For instance, the grades of evaluation for 2008, 2009 and 2013 were all normal, which was related to the fluctuation of an index value in the corresponding year. In 2008 and 2013, soil erosion and the modulus of soil erosion in mountain slopes in Beijing were higher, which resulted in a lower level of evaluation. In 2009, the daily water consumption per capita was the highest in recent years in that the number of migrants to Beijing increased by 33.2% in 2007 and most of them reside in suburban or rural areas, according to the statistics. These migrants had a weak sense of water resources protection and water saving, which led to higher daily water consumption per capita and finally caused the general evaluation grade. Since 2014 when the central route of south–north water transfer project completed and began to transfer water from the Danjiangkou reservoir to Beijing, the shortage of water resources has been greatly alleviated and water supply has been guaranteed. Furthermore, Beijing has vigorously established projects related to reclaimed water and enacted relevant laws and regulations in recent years, which have raised the awareness of people to protect water resources. The sustainable utilization level of water resources in Beijing is expected to improve.
4. Conclusions
In this study, the water resources system was divided into three subsystems: social, economic, and ecological environments. Through the selection of evaluation indices, the evaluation index system of sustainable use of water resources in Beijing was constructed. Applying the method of knowledge granularity and attribute importance of rough set theory, the weights of the index layer were calculated. The weights of the three subsystems in the rule layer were determined by the fuzzy theory of non-structural decision making. The weights are taken into the set pair analysis and attribute recognition theory, respectively, to establish a sustainable assessment model of water resources in Beijing based on the water resources complex system. Data from 2004 to 2015 in Beijing was substituted to evaluate and analyze the situation of sustainable use of water resources in Beijing in the past 12 years. In order to verify the accuracy of the results, the analytic hierarchy process and entropy weight method were used to find the weight of the index, which was taken into the above evaluation method, and the matter-element model was used to evaluate the system to acquire seven groups of evaluation results. The evaluation results of seven groups were analyzed with the Spearman rank correlation coefficient method. The results reveal that the overall situation of sustainable use of water resources in Beijing is getting better year by year. The weights based on rough sets and fuzzy theory are feasible in the evaluation of sustainable use of water resources. This method not only takes into consideration the intention of the decision-maker, but also takes full advantage of the internal relation of the data, which makes the evaluation result very scientific and provides a new reference for the evaluation of the sustainable use of water resources.
Acknowledgments
This work was supported by the National Key R and D Program of China (grant No. 2016YFC0401406), and the Famous Teachers Cultivation Planning for Teaching of North China Electric Power University (the Fourth Period).
Author Contributions
Baohui Men conceived the research theme; Huanlong Liu provided data and designed the analytical approach proposed; Wei Tian performed analysis; and Huanlong Liu and Haoyue Liu wrote the paper.
Conflicts of Interest
The authors declare no conflict of interest.
Appendix A

Table A1.
The step and formula of AHP.
| Step | Formula |
|---|---|
| |
| |
| |
| |
| |
Table A2.
The steps and formulas of EW.
| Step | Formula |
|---|---|
| Benefit index: Cost index: |
| In the formula: |
|
Table A3.
The step and formula of SPA.
| Step | Formula |
|---|---|
| |
| |
| |
| |
| |
| |
|
Table A4.
The step and formula of AR.
| Step | Formula |
|---|---|
| In the formula: |
| |
|
Table A5.
The step and formula of MEM.
| Step | Formula |
|---|---|
| Benefit index: Cost index: |
| Benefit index: Cost index: |
| |
| |
| |
| |
| |
|
Table A6.
The step and formula of SRCC.
| Step | Formula |
|---|---|
| Calculate the correlation coefficient. |
Note: j (j = 1, 2,…, J) represents the index; m (m = 1, 2,…, M) represents the year; x represents the index data; represents the threshold value (Table 3 in the main text) represents the rank difference of two evaluation methods; and n represents the sum of evaluation methods.
References
- Hoekstra, A.Y.; Chapagain, A.K.; Oel, P.R.V. Advancing water footprint assessment research: Challenges in monitoring progress towards sustainable development goal 6. Water 2017, 9. [Google Scholar] [CrossRef]
- Deng, L.; Chen, S.; Karney, B. Comprehensive evaluation method of urban water resources utilization based on dynamic reduct. Water Resour. Manag. 2012, 26, 2733–2745. [Google Scholar] [CrossRef]
- Dubois, D.; Prade, H. Weighted minimum and maximum operations in fuzzy set theory. Inform. Sci. 1986, 39, 205–210. [Google Scholar] [CrossRef]
- Pawlak, Z. Rough sets and intelligent data analysis. Inform. Sci. 2002, 147. [Google Scholar] [CrossRef]
- Pawlak, Z.; Skowron, A. Rough sets: Some extensions. Inform. Sci. 2007, 177, 28–40. [Google Scholar] [CrossRef]
- Yao, Y. The two sides of the theory of rough sets. Knowl. Based. Syst. 2015, 80, 67–77. [Google Scholar] [CrossRef]
- D’Eer, L.; Restrepo, M.; Cornelis, C.; Gómez, J. Neighborhood operators for covering-based rough sets. Inform. Sci. 2016, 336, 21–44. [Google Scholar] [CrossRef]
- An, A.; Shan, N.; Chan, C.; Cercone, N.; Ziarko, W. Discovering rules for water demand prediction: An enhanced rough-set approach. Eng. Appl. Artif. Intell. 1996, 9, 645–653. [Google Scholar] [CrossRef]
- Atanassov, K.T. Intuitionistic fuzzy sets. Fuzzy Sets Syst. 1986, 20, 87–96. [Google Scholar] [CrossRef]
- Deschrijver, G.; Kerre, E.E. On the relationship between some extensions of fuzzy set theory. Fuzzy Sets Syst. 2003, 133, 227–235. [Google Scholar] [CrossRef]
- Zhao, J.; Li, M.; Guo, P.; Zhang, C.; Tan, Q. Agricultural water productivity oriented water resources allocation based on the coordination of multiple factors. Water 2017, 9. [Google Scholar] [CrossRef]
- Esogbue, A.O.; Theologidu, M.; Guo, K. On the application of fuzzy sets theory to the optimal flood control problem arising in water resources systems. Fuzzy Sets Syst. 1992, 48, 155–172. [Google Scholar] [CrossRef]
- Guan, J.; Aral, M.M. Optimal design of groundwater remediation systems using fuzzy set theory. Water Resour. Res. 2004, 40, 62–74. [Google Scholar] [CrossRef]
- Song, S.B.; Cai, H.J. Comprehensive assessment method for region sustainable water resources. Adv. Water Sci. 2005, 16, 244–249. (In Chinese) [Google Scholar]
- Beynon, M. Reducts within the variable precision rough sets model: A further investigation. Eur. J. Oper. Res. 2001, 134, 592–605. [Google Scholar] [CrossRef]
- Zou, Q.; Zhou, J.; Zhou, C.; Song, L.; Guo, J. Comprehensive flood risk assessment based on set pair analysis-variable fuzzy sets model and fuzzy AHP. Stoch. Environ. Res. Risk Assess. 2013, 27, 525–546. [Google Scholar] [CrossRef]
- Peng, S.H.; Tang, C. Blending the analytic hierarchy process and fuzzy logical systems in Scenic beauty assessment of check dams in streams. Water 2015, 7, 6983–6998. [Google Scholar] [CrossRef]
- Ding, X.; Chong, X.; Bao, Z.; Zhang, S. Fuzzy comprehensive assessment method based on the entropy weight method and its application in the water environmental safety evaluation of the Heshangshan drinking water source area, Three Gorges Reservoir area, China. Water 2017, 9. [Google Scholar] [CrossRef]
- Wu, Y.N.; Yang, Y.S.; Feng, T.T.; Kong, L.N.; Liu, W.; Fu, L.J. Macro-site selection of wind/solar hybrid power station based on Ideal Matter-Element Model. Int. J. Electr. Power Energy Syst. 2013, 50, 76–84. [Google Scholar]
- Zar, J.H. Significance testing of the spearman rank correlation coefficient. J. Am. Stat. Assoc. 1972, 67, 578–580. [Google Scholar] [CrossRef]
- Yang, G.; He, X.L.; Li, J.F.; Jia, X.J. The research of water resource sustainable utilization in Manas River. Acta Ecol. Sin. 2011, 9, 2407–2413. (In Chinese) [Google Scholar]
- Condon, A.G.; Richards, R.A.; Rebetzke, G.J.; Farquhar, G.D. Breeding for high water-use efficiency. J. Exp. Bot. 2004, 55, 2447–2460. [Google Scholar] [CrossRef] [PubMed]
- Gendron, C. Beyond environmental and ecological economics: Proposal for an economic sociology of the environment. Ecol. Econ. 2014, 105, 240–253. [Google Scholar] [CrossRef]
- Liu, Z.J.; Zhang, M.; Wang, Z.Y.; Li, X.Y. A comprehensive assessment of the sustainable utilization of water resources in Zhengzhou city based on the ANN evaluation method. China Rural Water Hydropower 2008, 12, 55–58, 62. (In Chinese) [Google Scholar]
- Zhou, N.Q.; Zhao, L.; Shen, X.P.; Li, Z.Z. A DPS1R model for vulnerability assessment of water resources system in ChangZhuTan area. J. Tongji Univ. Nat. Sci. 2013, 7, 1061–1066. (In Chinese) [Google Scholar]
- Cherp, A.; Jewell, J.; Vinichenko, V.; Bauer, N.; Cian, E. Global energy security under different climate policies, GDP growth rates and fossil resource availabilities. Clim. Chang. 2016, 136, 83–94. [Google Scholar] [CrossRef]
- Wang, H.S.; Yue, B.; Wang, J.; Lei, K.; Zong, Y.Y.; Wang, Y.W.; Hou, Y.N.; Tong, M.H. The study of the evaluation of water resources sustainable utilization in Beijing. Environ. Sustain. Dev. 2011, 36, 69–73. (In Chinese) [Google Scholar]
- Halkijevic, I.; Vukovic, Z.; Vouk, D. Indicators and a Neuro-Fuzzy based model for the evaluation of water supply sustainability. Water Res. Manag. 2017, 31, 3683–3693. [Google Scholar] [CrossRef]
- Eggers, S.; Griesser, M.; Ekman, J. Predator-induced reductions in nest visitation rates are modified by forest cover and food availability. Behav. Ecol. 2008, 19, 1056–1062. [Google Scholar] [CrossRef]
- Sellaro, R.; Crepy, M.; Trupkin, S.A.; Karayekov, E.; Buchovsky, A.S.; Rossi, C.; Casal, J.J. Cryptochrome as a sensor of the blue/green ratio of natural radiation in Arabidopsis. Plant Physiol. 2010, 154, 401–409. [Google Scholar] [CrossRef] [PubMed]
- Chen, W.; Xu, X.Y.; Wang, H.R.; Wang, W. The evaluation of water resources sustainable utilization in Beijing based on improved bank correlation analysis. J. Nat. Res. 2015, 30, 164–176. (In Chinese) [Google Scholar]
- Gallardo, B.; Gascón, S.; Quintana, X.; Comín, F.A. How to choose a biodiversity indicator—Redundancy and complementarity of biodiversity metrics in a freshwater ecosystem. Ecol. Indic. 2011, 11, 1177–1184. [Google Scholar] [CrossRef]
- Hu, T.; Lv, B.C.; Chen, G. Uncertainty knowledge representation method based on rough sets. Comput. Sci. 2000, 27, 90–92, 98. (In Chinese) [Google Scholar]
- Liu, S.Z. The Research on Attribute Weight Based on Rough Set in the Forest Ecosystem Health Evaluation. Master’s Thesis, CSUFT, Changsha, China, 2014. (In Chinese). [Google Scholar]
- Ke, L.N.; Wang, Q.M.; Geng, Y.D.; Zhang, L. The island sustainable development evaluation model and its application in Changhai County based on the non-structural decision fuzzy set theory. Trans. Oceanol. Limnol. 2013, 1, 159–166. (In Chinese) [Google Scholar]
- Yu, F.M.; Du, Z.C. Dynamic Analysis of Coupling Relationship between Economic Development and Ecological Environment Based on Entropy Method—A Case Study of Xi an City. Meteorol. Environ. Res. 2011, 9, 62–66. [Google Scholar]
- Chong, T.; Yi, S.; Che, H. Application of set pair analysis method on occupational hazard of coal mining. Saf. Sci. 2017, 92, 10–16. [Google Scholar] [CrossRef]
- Pan, G.; Xu, Y.; Yu, Z.; Song, S.; Zhang, Y. Analysis of river health variation under the background of urbanization based on entropy weight and matter-element model: A case study in Huzhou City in the Yangtze River Delta, China. Environ. Res. 2015, 139, 31–35. [Google Scholar] [CrossRef] [PubMed]
Figure 1.
The water utilization proportion for life, production and ecology from 2004 to 2015.

Figure 2.
The evaluation level determined by SPAro from 2004 to 2015.

Table 1.
Three subsystems, criteria, and preliminary indicators.
| Rule Layer | Criteria | Index |
|---|---|---|
| Economic subsystem | Agriculture | The grain yield per unit water [24] |
| Water efficiency of irrigation [25] | ||
| Industry | The value of industrial output per unit water [24] | |
| Repeated use rate of industrial water [25] | ||
| Industrial water quota [25] | ||
| Tertiary industry | Third industry accounted for the proportion of total GDP [26] | |
| Comprehensive index | Ten thousand Yuan GDP water consumption [24] | |
| GDP growth rate [26] | ||
| Environmental subsystem | Water quality | Water quality compliance rate in water function area [25] |
| Water pollution comprehensive index [24] | ||
| Reuse of water resources | Sewage disposal rate [27] | |
| The use of recycled water [28] | ||
| Plant | Forest cover rate [29] | |
| Green ratio [30] | ||
| The loss of soil and water | Soil erosion modulus of water loss and soil erosion in sloping land [25] | |
| The ratio of water and soil loss control [27] | ||
| Groundwater | Funnel area/whole area [24] | |
| Groundwater level change rate [25] | ||
| Social subsystem | Human | Density of population [27] |
| Natural growth rate of population [27] | ||
| Per capita water resources [27] | ||
| Daily water consumption per capita [25] | ||
| Consciousness of saving water [24] | ||
| City | Urbanization level [31] | |
| The popular rate of tap water [25] |
Table 2.
Three subsystems, final indicators, and units.
| Rule Layer | Index | Unit |
|---|---|---|
| Economic subsystem | The grain yield per unit water u11 | kg/m3 |
| The value of industrial output per unit water u12 | Yuan/m3 | |
| Ten thousand Yuan GDP water consumption u13 | m3/104 Yuan | |
| Third industry accounted for the proportion of total GDP u14 | % | |
| Environmental subsystem | Water quality compliance rate in water function area u21 | % |
| Forest cover rate u22 | % | |
| Sewage disposal rate u23 | % | |
| Soil erosion modulus of water loss and soil erosion in sloping land u24 | t/km2 | |
| Funnel area/whole area u25 | % | |
| Social subsystem | Density of population u31 | person/km2 |
| Urbanization level u32 | % | |
| Per capita water resources u33 | m3/(person and year) | |
| Daily water consumption per capita u34 | L/person |
Table 3.
Index assessment criteria.
| Index | I | II | III | IV | V |
|---|---|---|---|---|---|
| u11 | >1.8 | 1.5–1.8 | 1.2–1.5 | 0.8–1.2 | <0.8 |
| u12 | >800 | 600–800 | 400–600 | 200–400 | <200 |
| u13 | <50 | 50–150 | 150–250 | 250–350 | >350 |
| u14 | >75 | 75–60 | 60–50 | 50–40 | <40 |
| u21 | >80 | 70–80 | 60–70 | 45–60 | <45 |
| u22 | >60 | 50–60 | 30–50 | 10–30 | <10 |
| u23 | >95 | 85–95 | 75–85 | 65–75 | <65 |
| u24 | <100 | 100–200 | 200–500 | 500–1000 | >1000 |
| u25 | <1 | 1–5 | 5–10 | 10–15 | >15 |
| u31 | <200 | 200–500 | 500–800 | 800–1200 | >1200 |
| u32 | >85 | 75–85 | 65–75 | 55–65 | <55 |
| u33 | >4000 | 3000–4000 | 2000–3000 | 1000–2000 | <1000 |
| u34 | <160 | 160–180 | 180–200 | 200–220 | >220 |
Table 4.
Relationship table of fuzzy mood operators and the fuzzy scales.
| Fuzzy Mood | Equal | Slightly | Somewhat | Rather | Obvious | Remarkably |
| Fuzzy Scale | 0.5 | 0.55 | 0.6 | 0.65 | 0.7 | 0.75 |
| Fuzzy Mood | Very | Extra | Exceeding | Extreme | Incomparable | |
| Fuzzy Scale | 0.8 | 0.85 | 0.9 | 0.95 | 1 |
Table 5.
Brief introduction of other methods.
| Methods | Introduction |
|---|---|
| EW | The Entropy Weight (EW) method of objective weighting, according to the basic principle of information theory, can be interpreted that information is a measure of degree of order system. Entropy is a measure of the degree of disorder of the system. When the information entropy is very small, the amount of information provided by the index is larger, which plays the greater role in the comprehensive evaluation, and the weight is higher [36]. EW is implemented to determine weights in this study. |
| AHP | Analytic hierarchy process (AHP) is a subjective method that allows the user to visually assess the relative weight of more than one standard or multiple options according to the given standard. Even if the quantitative rating is not available, the decision-makers can still recognize that a standard is more important than another [17]. AHP is used to calculate weights in this study. |
| SPA | The set pair analysis (SPA) method is a set of system theory to deal with the uncertainty of analysis, it is not only a technical means, but also a decision-making system that reflects dialectical thinking. SPA is used widely since it turns the problem of uncertainty into mathematical problems by introducing the concept of the connection degree [37]. The confirmed weights are analyzed with SPA for evaluation in this study. |
| AR | The attribute recognition (AR) method is a qualitative measure of the relationship between the discussion questions and different methods of qualitative description and the relationship between the corresponding measure, which has the advantages of simple calculation and good operation. The results are more reliable. It has been applied quite extensive in the evaluation of soil and water resources and environment in the field of the gas system. The confirmed weights are analyzed with AR for evaluation in this study. |
| MEM | The matter-element model (MEM) is a method of solving the multiple indicators evaluation problem. It can be abstracted as a complex problem visualization model. It indicates the results that may completely reflect the comprehensive quality of things by establishing a quality evaluation model of multiple-index performance parameters and using quantitative results. Additionally, it is easy to use a computer to solve [38]. The confirmed weights are analyzed with MEM for evaluation in this study. |
| SRCC | The Spearman rank correlation coefficient (SRCC) method is used to describe the degree of correlation and direction between the two variables. Original variable distribution is not required in this method, which belongs to the non-parametric statistical method. In this study, this method was used to obtain the close degree of each evaluation results and other results of the evaluation, and the highest correlation coefficient is selected as the final evaluation result [20]. |
Table 6.
The actual data corresponding to each index from 2004 to 2015.
| Index | 2004 | 2005 | 2006 | 2007 | 2008 | 2009 | 2010 | 2011 | 2012 | 2013 | 2014 | 2015 |
|---|---|---|---|---|---|---|---|---|---|---|---|---|
| u11 | 0.54 | 0.75 | 0.91 | 0.87 | 1.11 | 1.1 | 1.07 | 1.19 | 1.22 | 1.06 | 0.78 | 0.98 |
| u12 | 203.2 | 251.0 | 293.8 | 362.2 | 409.9 | 442.9 | 546.2 | 608.5 | 673.7 | 696.6 | 736.1 | 976.6 |
| u13 | 57.27 | 49.5 | 42.25 | 35.35 | 31.56 | 29.21 | 24.94 | 22.12 | 20.07 | 18.92 | 17.08 | 16.6 |
| u14 | 68 | 70 | 72 | 73 | 75 | 76 | 75 | 76 | 77 | 78 | 76 | 80 |
| u21 | 57.9 | 54 | 58.7 | 49 | 47.5 | 46 | 48 | 51 | 48.5 | 46 | 47 | 53.4 |
| u22 | 35.4 | 35.5 | 35.9 | 36.5 | 36.5 | 36.7 | 37 | 37.6 | 38.6 | 40.1 | 41 | 41.6 |
| u23 | 53.9 | 62.4 | 73.2 | 76.2 | 78.9 | 80.3 | 81 | 82 | 83 | 84.6 | 86.1 | 87.9 |
| u24 | 117.2 | 151.3 | 145.3 | 139.4 | 219.7 | 65.8 | 94.9 | 103.4 | 747.9 | 294.4 | 194.4 | 238.5 |
| u25 | 5.95 | 5.95 | 6.23 | 6.26 | 6.27 | 6.38 | 6.44 | 6.45 | 6.39 | 6.44 | 6.45 | 6.43 |
| u31 | 910 | 937 | 976 | 1021 | 1079 | 1133 | 1196 | 1230 | 1261 | 1289 | 1311 | 1323 |
| u32 | 79 | 83.6 | 84.3 | 84.5 | 84.9 | 85 | 85.9 | 86.2 | 86.2 | 86.3 | 86.3 | 86.5 |
| u33 | 143.0 | 151.2 | 141.5 | 148.2 | 205.5 | 126.6 | 124.2 | 134.7 | 193.2 | 118.6 | 95.2 | 124.0 |
| u34 | 226.8 | 152.9 | 154.7 | 166.8 | 187.2 | 192.1 | 174.9 | 172.6 | 171.8 | 196.9 | 187.5 | 183.8 |
Table 7.
The calculating results of rough sets (), and weight.
| Rule Layer | Index | Weight | |||
|---|---|---|---|---|---|
| Economic subsystem | u11 | 0.37 | 0.64 | 1.02 | 0.30 |
| u12 | 0.45 | 0.75 | 1.20 | 0.36 | |
| u13 | 0.07 | 0.48 | 0.55 | 0.16 | |
| u14 | 0.00 | 0.62 | 0.62 | 0.18 | |
| Environmental subsystem | u21 | 0.14 | 0.40 | 0.54 | 0.14 |
| u22 | 0.00 | 0.40 | 0.40 | 0.10 | |
| u23 | 0.55 | 0.70 | 1.24 | 0.32 | |
| u24 | 0.60 | 0.73 | 1.33 | 0.34 | |
| u25 | 0.00 | 0.40 | 0.40 | 0.10 | |
| Social subsystem | u31 | 0.27 | 0.64 | 0.91 | 0.27 |
| u32 | 0.13 | 0.64 | 0.77 | 0.23 | |
| u33 | 0.00 | 0.40 | 0.40 | 0.12 | |
| u34 | 0.54 | 0.74 | 1.28 | 0.38 |
Table 8.
The connection degrees between index j and level I–V (2015).
| Index | I | II | III | IV | V |
|---|---|---|---|---|---|
| u11 | −1.00 | −1.00 | 0.10 | 1.00 | −0.10 |
| u12 | 1.00 | 0.64 | −1.00 | −1.00 | −1.00 |
| u13 | 1.00 | −0.34 | −1.00 | −1.00 | −1.00 |
| u14 | 1.00 | 0.88 | −1.00 | −1.00 | −1.00 |
| u21 | −1.00 | −1.00 | 0.26 | 1.00 | −0.26 |
| u22 | −1.00 | 0.39 | 1.00 | −0.39 | −1.00 |
| u23 | −0.37 | 1.00 | 0.37 | −1.00 | −1.00 |
| u24 | −1.00 | 0.74 | 1.00 | −0.74 | −1.00 |
| u25 | −1.00 | 0.43 | 1.00 | −0.43 | −1.00 |
| u31 | −1.00 | −1.00 | −1.00 | −0.23 | 1.00 |
| u32 | 1.00 | 0.97 | −1.00 | −1.00 | −1.00 |
| u33 | −1.00 | −1.00 | −1.00 | −0.40 | 1.00 |
| u34 | −1.00 | 0.62 | 1.00 | −0.62 | −1.00 |
Table 9.
The weighted connection degrees and evaluation level.
| Year | Weighted Connection Degrees | Evaluation Level | ||||
|---|---|---|---|---|---|---|
| I | II | III | IV | V | ||
| 2004 | −0.60 | −0.35 | −0.47 | −0.09 | 0.07 | V |
| 2005 | −0.24 | −0.05 | −0.46 | −0.07 | −0.30 | II |
| 2006 | −0.20 | −0.06 | −0.24 | −0.03 | −0.56 | IV |
| 2007 | −0.29 | −0.04 | −0.16 | −0.05 | −0.56 | II |
| 2008 | −0.58 | −0.11 | 0.24 | 0.03 | −0.66 | III |
| 2009 | −0.41 | −0.17 | 0.02 | 0.00 | −0.62 | III |
| 2010 | −0.33 | 0.20 | −0.09 | −0.33 | −0.58 | II |
| 2011 | −0.29 | 0.26 | −0.08 | −0.42 | −0.64 | II |
| 2012 | −0.35 | 0.12 | −0.11 | −0.29 | −0.54 | II |
| 2013 | −0.45 | −0.03 | 0.01 | −0.22 | −0.56 | III |
| 2014 | −0.38 | 0.18 | −0.20 | −0.48 | −0.42 | II |
| 2015 | −0.29 | 0.17 | −0.14 | −0.50 | −0.56 | II |
Table 10.
The evaluation results based on seven methods from 2004 to 2015.
| Year | SPAro | ARro | SPAen | ARen | SPAan | ARan | MEM |
|---|---|---|---|---|---|---|---|
| 2004 | V | V | V | V | V | V | V |
| 2005 | II | IV | II | II | II | IV | IV |
| 2006 | IV | IV | IV | IV | II | IV | IV |
| 2007 | II | IV | II | IV | II | II | IV |
| 2008 | III | III | III | III | III | III | III |
| 2009 | III | III | III | III | III | III | III |
| 2010 | II | III | II | III | II | II | III |
| 2011 | II | II | II | III | II | II | II |
| 2012 | II | II | II | III | II | II | II |
| 2013 | III | III | II | III | III | III | III |
| 2014 | II | II | II | II | II | III | III |
| 2015 | II | I | II | I | II | I | I |
Note: Set pair analysis based on rough set and fuzzy theory (SPAro); attribute recognition based on rough set and fuzzy theory (ARro); set pair analysis based on entropy weight (SPAen); attributes recognition based on entropy weight (ARen); set pair analysis based on analytic hierarchy process (SPAan); attribute recognition based on analytic hierarchy process (ARan).
Table 11.
Spearman rank correlation coefficient.
| Methods | SPAro | ARro | SPAen | ARen | SPAan | ARan | MEM | Average |
|---|---|---|---|---|---|---|---|---|
| SPAro | 1.000 | 0.965 | 0.965 | 0.972 | 0.986 | 0.979 | 0.962 | 0.976 |
| Arro | 0.965 | 1.000 | 0.930 | 0.979 | 0.951 | 0.979 | 0.997 | 0.972 |
| SPAen | 0.965 | 0.930 | 1.000 | 0.937 | 0.951 | 0.944 | 0.927 | 0.951 |
| Aren | 0.972 | 0.979 | 0.937 | 1.000 | 0.958 | 0.958 | 0.976 | 0.969 |
| SPAan | 0.986 | 0.951 | 0.951 | 0.958 | 1.000 | 0.965 | 0.948 | 0.966 |
| Aran | 0.979 | 0.979 | 0.944 | 0.958 | 0.965 | 1.000 | 0.983 | 0.973 |
| MEM | 0.962 | 0.997 | 0.927 | 0.976 | 0.948 | 0.983 | 1.000 | 0.970 |
© 2017 by the authors. Licensee MDPI, Basel, Switzerland. This article is an open access article distributed under the terms and conditions of the Creative Commons Attribution (CC BY) license (http://creativecommons.org/licenses/by/4.0/).
Share and Cite
MDPI and ACS Style
Men, B.; Liu, H.; Tian, W.; Liu, H. Evaluation of Sustainable Use of Water Resources in Beijing Based on Rough Set and Fuzzy Theory. Water 2017, 9, 852. https://doi.org/10.3390/w9110852
AMA Style
Men B, Liu H, Tian W, Liu H. Evaluation of Sustainable Use of Water Resources in Beijing Based on Rough Set and Fuzzy Theory. Water. 2017; 9(11):852. https://doi.org/10.3390/w9110852
Chicago/Turabian StyleMen, Baohui, Huanlong Liu, Wei Tian, and Haoyue Liu. 2017. "Evaluation of Sustainable Use of Water Resources in Beijing Based on Rough Set and Fuzzy Theory" Water 9, no. 11: 852. https://doi.org/10.3390/w9110852
Note that from the first issue of 2016, this journal uses article numbers instead of page numbers. See further details here.