Study on Storm-Water Management of Grassed Swales and Permeable Pavement Based on SWMM


Department of Civil Engineering, Nanjing University of Aeronautics and Astronautics, Nanjing 210016, China
*
Author to whom correspondence should be addressed.
Water 2017, 9(11), 840; https://doi.org/10.3390/w9110840
Submission received: 28 September 2017
/
Revised: 17 October 2017
/
Accepted: 26 October 2017
/
Published: 31 October 2017
(This article belongs to the Special Issue Sponge Cities: Emerging Approaches, Challenges and Opportunities)
Abstract
:Grassed swales and permeable pavement that have greater permeable underlying surface relative to hard-pressing surface can cooperate with the city pipe network on participating in urban storm flood regulation. This paper took Nanshan village in Jiangsu Province as an example, the storm-water management model (SWMM) was used to conceptualize the study area reasonably, and the low-impact development (LID) model and the traditional development model were established in the region. Based on the storm-intensity equation, the simulation scene employed the Chicago hydrograph model to synthesize different rainfall scenes with different rainfall repetition periods, and then contrasted the storm-flood-management effect of the two models under the condition of using LID facilities. The results showed that when the rainfall repetition period ranged from 0.33a to 10a (a refers to the rainfall repetition period), the reduction rate of total runoff in the research area that adopted LID ranged from 100% to 27.5%, while the reduction rate of peak flow ranged from 100% to 15.9%, and when the values of unit area were the same, the combined system (permeable pavement + grassed swales) worked more efficiently than the sum of the individuals in the reduction of total runoff and peak flow throughout. This research can provide technical support and theoretical basis for urban LID design.
1. Introduction
China is in a period of rapid urbanization, with expansion of city scale and concentration of human population. Due to this process, the natural characteristics of the land are changed by various anthropogenic activities. The original forestland, farmland and grassland are gradually transformed into impermeable construction land. These anthropogenic activities are among the most important pollutant sources [1]; numerous pollutants are introduced into the urban environment by vehicular traffic, industrial processes, building construction and commercial activities, and are carried by storm-water. Above all, the impact of urbanization on the water environment includes increased risks in terms of floods, erosion and degradation of stream habitats, and deterioration of water quality [2,3]. In addition, the recharge of shallow groundwater resources has been attenuated with the reduction in potential infiltration and recharge. The storm-water runoff originates from residential and commercial areas having large amounts of impervious area connected to the storm-water system known as directly connected impervious areas (DCIAs) [4]. Therefore, the control and utilization of rainwater is imperative, and rainwater drainage systems should be changed from the traditional rainwater drainage into systems that mainly rely on permeability and combine with storage and drainage [5,6]. The concept of sponge city construction emerges as the times require.
The concept of sponge city refers to the city that can absorb water like a sponge. Sponge cities break through the traditional concept of drainage in urban rainwater management, relying on the sunken lawn, grassed swales, green roof, permeable pavement, bioretention swales and other infrastructure, and take them as carriers, taking full account of the operational safety of urban infrastructure and urban water security in the absence of floods. Reasonable resource utilization of rainwater and maintenance of a good hydrological and ecological environment can be made at the same time as the comprehensive utilization of a variety of ecological technologies including penetration, retention, storage, purification, reuse, efflux and so on, which supplement the groundwater and regulate the water cycle.
Grassed swales are an important part of the sponge city, which is a landscape surface-drainage system planted with vegetation [7,8]. Grassed swales allow surface runoff to be detained, filtered and to penetrate at a lower flow rate [9]. As a new type of ecological measure, grassed swales can be used to collect road-surface runoff, and replace the gully, ditch or part of the rainwater pipe network. Grassed swales can not only absorb rainwater, but also pretreat rainwater with plant roots, which controls the runoff of contaminants from the source [10]. If grassed swales are substituted for a traditional underground drainage system, the problem—that traditional sewage pipes and rainwater pipelines were connected randomly or improperly—can be solved.
Pervious asphalt pavement refers to a kind of asphalt pavement structure that is composed of a highly porous mixture that allows road surface water to enter the subgrade [11]. Compared with the present urban roads that mainly have a dense type of pavement, the pervious asphalt pavement can effectively replenish the groundwater; the urban heat island effect would be alleviated, the peak flow during rainstorms and the pressure of the urban drainage system would be reduced, and the vehicle running noise would also be reduced significantly, while the safety and comfort of driving would be improved effectively [12]. Since pervious asphalt pavement can significantly improve the ecological and environmental efficiency of the road, it has attracted widespread attention at home and abroad.
Since the design and construction of a sponge project are unlikely to occur simultaneously, and it is hard to adjust after implementation, it comes to be an inevitable trend that software models are used for simulating the effect of the sponge facilities in projects [13,14]. Green infrastructure is increasingly being considered for application in urban storm-water management designs. Many municipalities, regulatory agencies and advocacy groups promote the use of low-impact development (LID) to reduce runoff and increase infiltration. To show LID benefits, engineers must quantify the advantages of green versus traditional grey infrastructure [15]. Rainfall-runoff models can be classified into three types: physically based models, conceptual models and empirical models. In this latter class of models, the catchment is considered as a black box, without any reference to the internal processes that control the transformation of rainfall to runoff. In recent years, some models derived from studies on artificial intelligence have found increasing use [16]. Currently, storm-water management model (SWMM) and Hydro CAD (http://www.hydrocad.net/company.htm) are the most-commonly used simulation software for LID, and the former is the most-widely used. A comprehensive hydrological model, like SWMM, has been widely used for rainfall-runoff simulation. In recent years, simple and effective modern modeling techniques have also brought great attention to the prediction of runoff with rainfall input [17]. SWMM is a hydrodynamic rainfall-runoff simulation model developed by the US Environmental Protection Agency that includes a hydrology, hydraulic and water-quality module. It has functions of simulating urban rainfall-runoff processes (including the ground runoff, current in drainage systems, the process of flood regulation and storage), BOD (biochemical oxygen demand), COD (chemical oxygen demand), and the migration and diffusion of total phosphorus, total nitrogen and six other kinds of pollutants. The latest version, SWMM 5.1 (United States Environmental Protection Agency, Washington, DC, USA), set up eight LID technical facilities including grassed swales, roof closure facilities, rain water tanks, permeable pavements, infiltration ditchs, green roofs, rain gardens and bioretention units in the LID module [18].
At present, most of the research on sponge cities in China focus on municipal roads, residential quarters or urban area planning, but are rarely concerned with how to quantitatively analyze the sponge facilities involved in urban rainwater management. It is not difficult to make source reductions for permeable pavement and grassed swales because of the large area and permeability of the underlying surface; the difficulty is how to cooperate with the rainwater pipe network, import exogenous rainwater and perform the functions of halfway transmission, terminal regulation and storage [19]. Nanshan village, Tianwang Town, Jurong, Jiangsu Province, is a demonstration point of the National Key Technology Support Program. In this paper, Nanshan village was selected as the research area, where the permeable pavement and grassed swales were arranged reasonably with local conditions in the overall planning of the village [20]. The traditional development model and the LID model based on SWMM were established to simulate the runoff regulation effect in the study area under various rainfall repetition periods [21]. Finally, comparison of the rainfall regulation effect between permeable pavement and grassed swales was done individually. The results of this study can provide guidance for the selection and arrangement of LID facilities in urban areas, and can also provide some technical support for the construction of sponge cities in China.
2. Research Procedure
2.1. Situation of Research Area
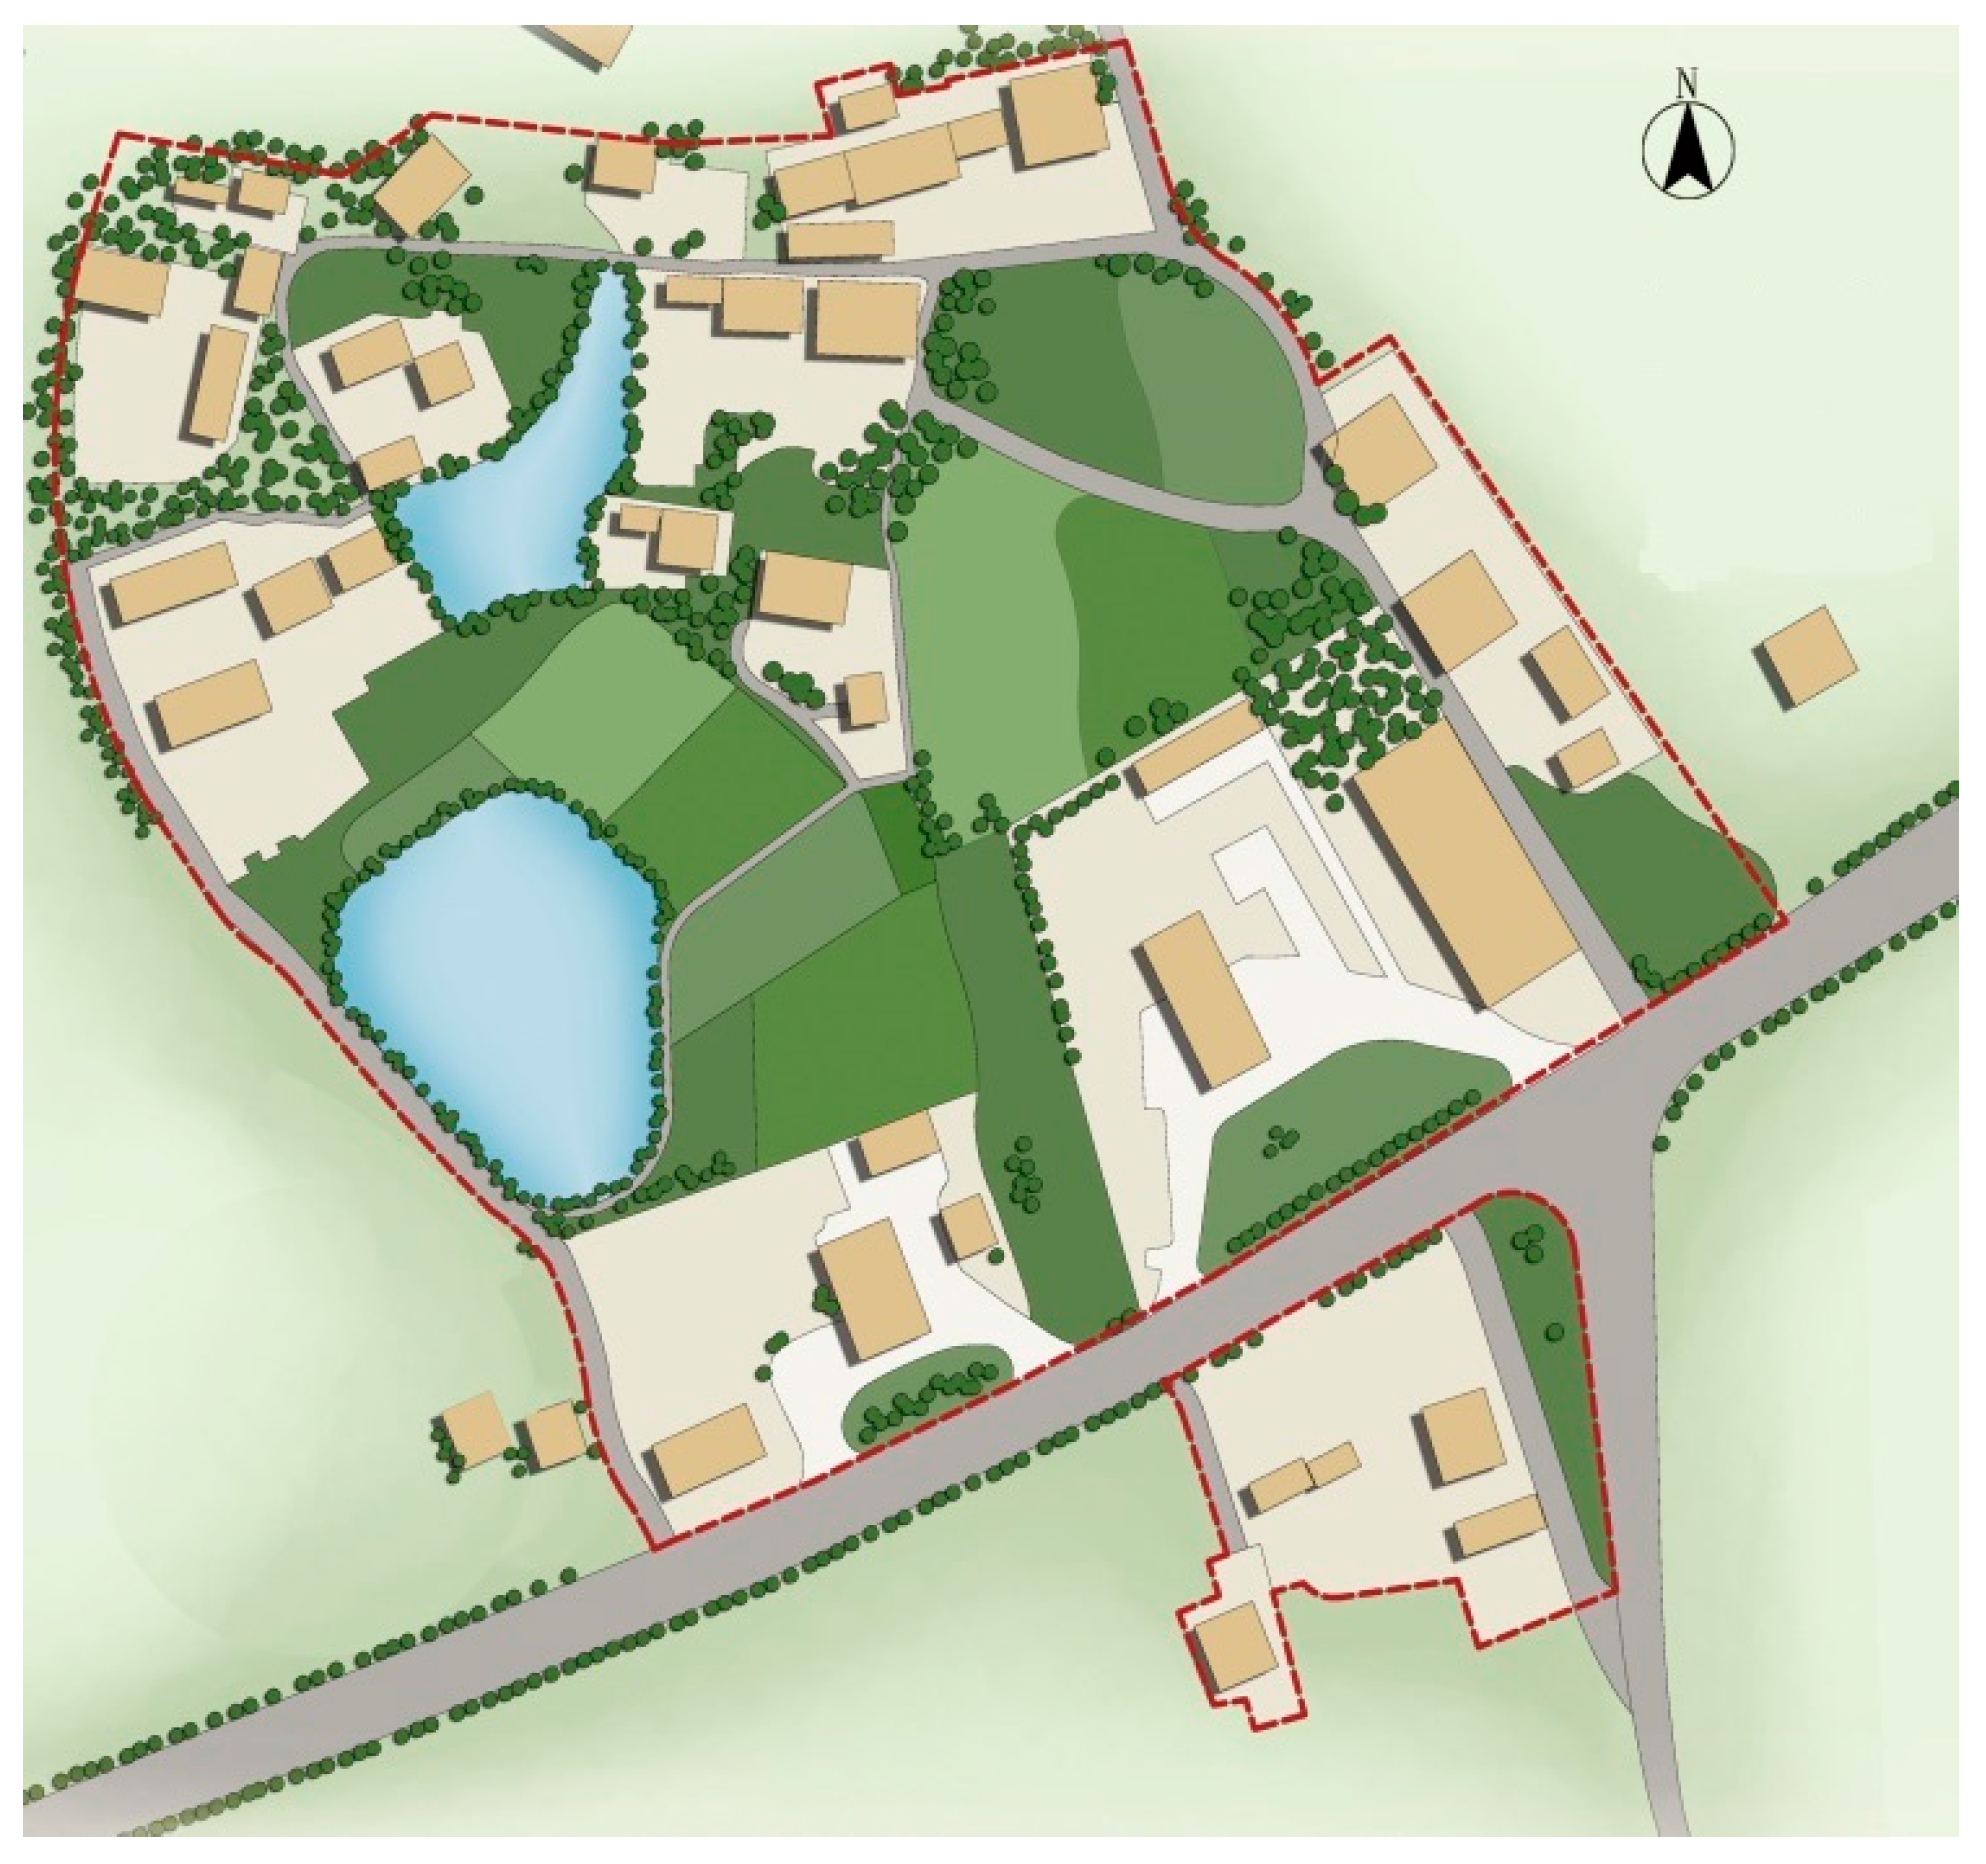
Nanshan village lies in the north of Fushan Cherry Garden, adjacent to S340 provincial highway. The research area was named a national demonstration site in rural characteristic tourism and the design area is about four hectares. The village is located in a subtropical zone with subtropical monsoon climate with four distinctive seasons, and the annual average natural precipitation is 1188 mm, which is mainly concentrated from May to September. The plan of the research area is shown in Figure 1.
2.2. Sub-Catchment Generalization
The topography of the region, low in south and high in north, has a roughly ladder-like distribution, and the region is composed of 25% permeable area and 75% impervious area. The generalized area is divided into nine water catchments and one outfall. A generalized sketch map of sub-basin arrangement can be seen in Figure 2, where c1 to c9 refer to catchment and S1 to S9 mean pipe system.
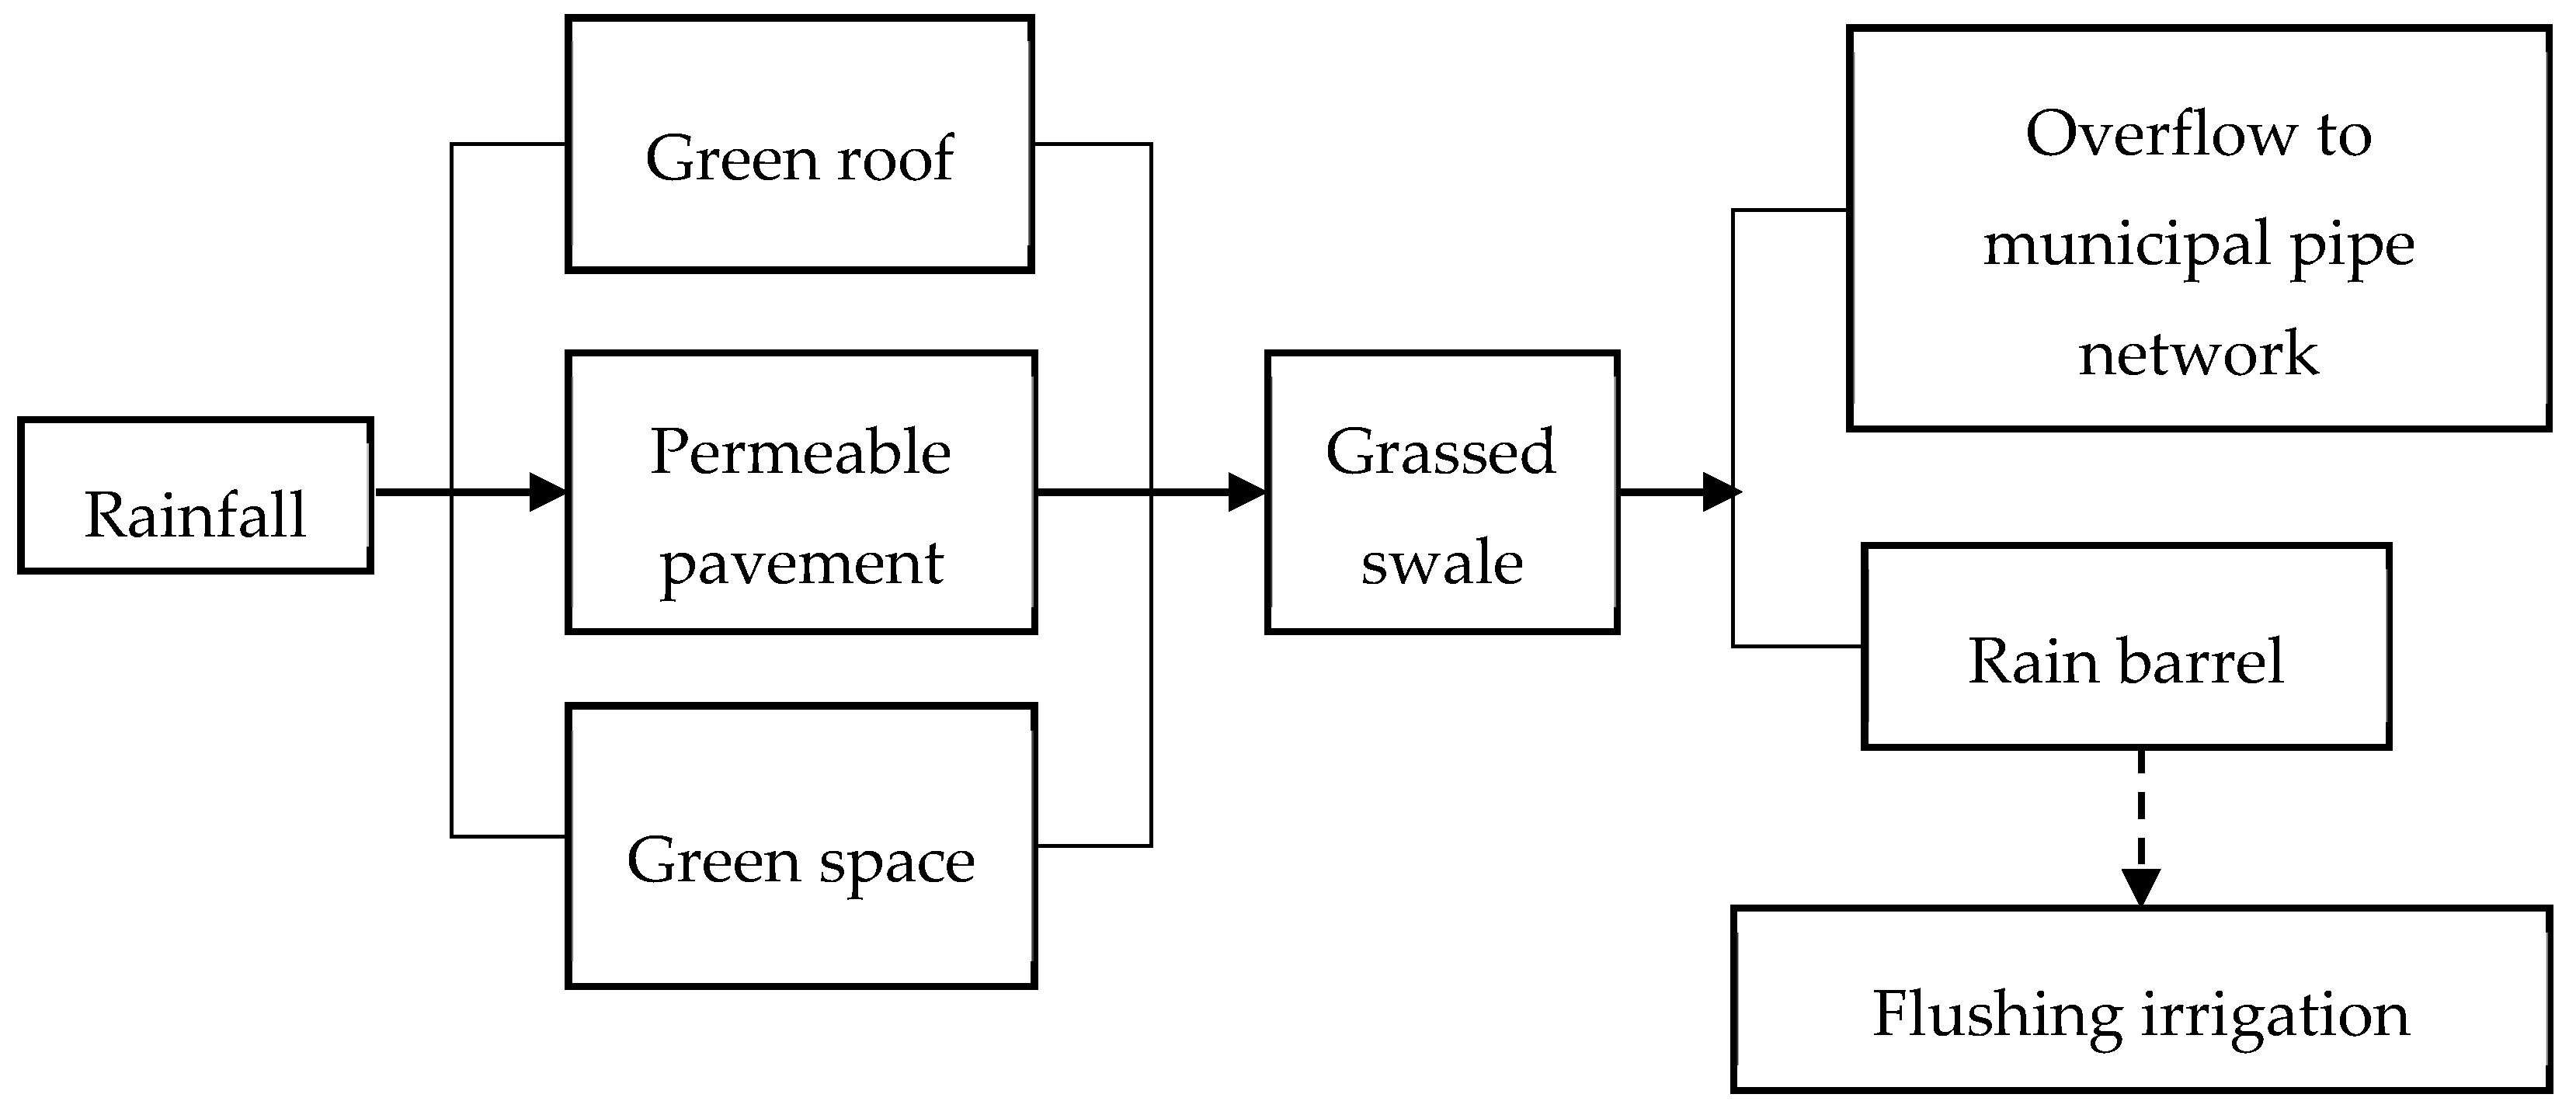
In the LID model, permeable pavement and grass swales were arranged in the catchment. The area of grassed swales is 800 square meters, accounting for 4% of the total area, while the area of permeable pavement is 2450 square meters, accounting for 12.25% of the total area. After infiltration and treatment of grassed swale and permeable pavement, rainwater overflows into the municipal rainwater pipe network. The drainage path of runoff in the LID model is shown in Figure 3.
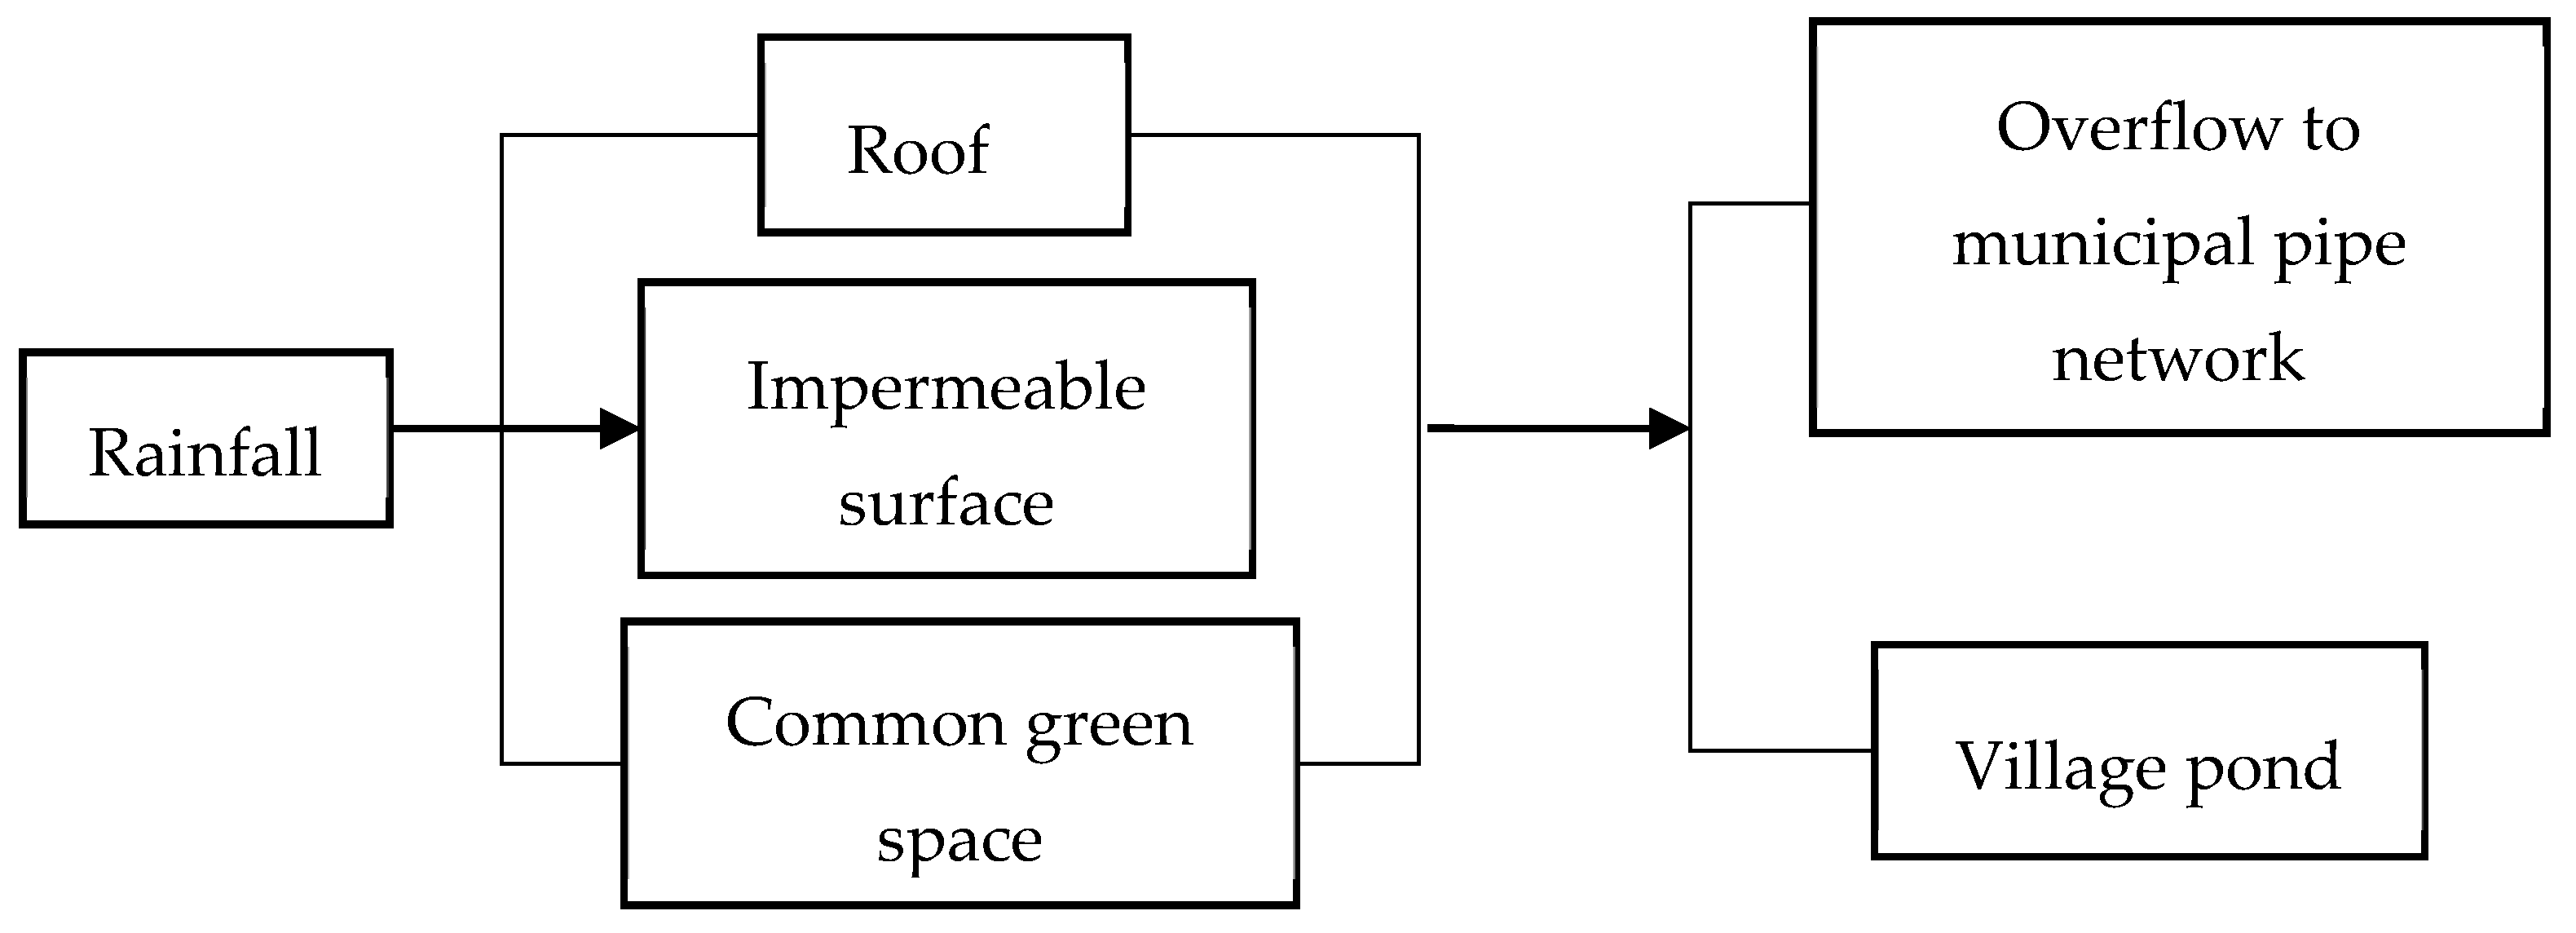
In the traditional development model, there were no LID facilities. The drainage path of runoff in the traditional development model is shown in Figure 4.
2.3. Selection of Model Parameters
The Horton model, with maximum infiltration rate of 76.2 mm/h, minimum infiltration rate of 3.18 mm/h and attenuation constant of 4.12 per hour according to soil characteristics was adopted to simulate the rainfall infiltration [22]. The nonlinear reservoir model was chosen to calculate the runoff generation at each grid while the equation of kinetic wave was adopted to calculate the pipeline transmission system [23]. In addition, the determination of parameters, which is also determined by the field geotechnical exploration reports and previous settings on the underlying surface, refers to typical values in the user manual and related documents [24]. Parameters of grass swale and permeable pavement are shown in Table 1.
2.4. Designed Rainfall
Design of rainfall hyetograph refers to the distribution of total rainfall in the designed phase, and it is the boundary condition for delay of simulation based on the hydraulic model; it is also the key module to calculate the designed flow of the drainage pipe network [25].
The Chicago rainfall hydrograph model is a rainfall process based on a rainstorm intensity Equation [26], and Equation (1) has been adopted as a widespread rainstorm intensity equation in China [27]. Equation (1) can reflect the regular pattern of rainfall distribution over time:
where q refers to the rainfall intensity of rainfall duration (L/s ha); p refers to the repetition period of designing rainfall (a); td refers to the rainfall duration (min); and A1, C, b and n are local parameters, calculated by a statistical method.
The rainstorm intensity equation of Jurong is Equation (2) [28].
Peak coefficient r is the only parameter of the Chicago rainfall hydrograph [29], and the hydrograph can be calculated by Equations (3) and (4). Accurate determination of peak coefficient r is the key to fit the curve of designed rainfall:
where ibefore refers to the rainfall intensity before peak flow (mm/min); iafter refers to the rainfall intensity after peak flow (mm/min); tb refers to the time before peak flow (min); ta refers to the time after peak flow (min); and r refers to the ratio of peak flow time and rainfall duration (peak coefficient).
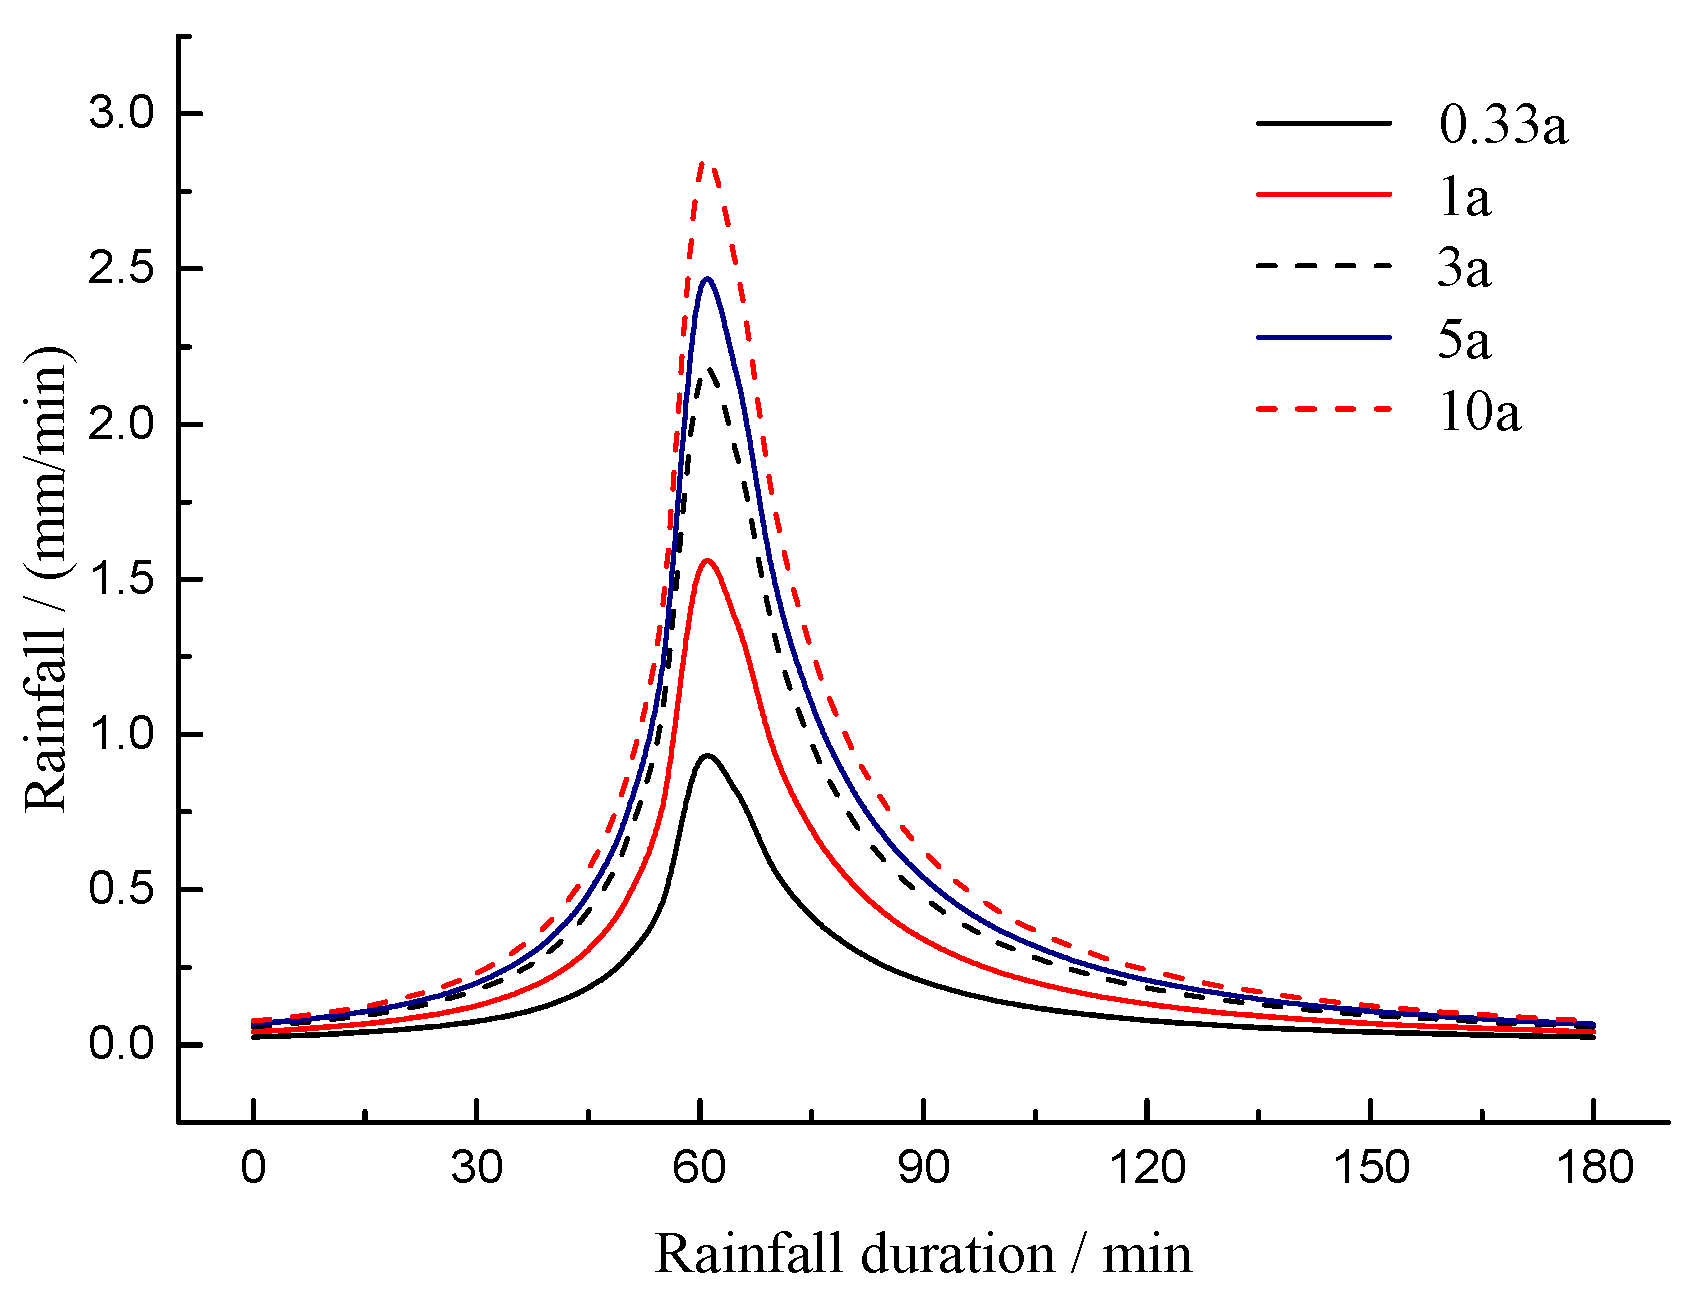
In this research, the rainfall duration was set as 3 h and the peak coefficient was set as 0.34 [30]. The distribution with time of rainfall under different rainfall repetition periods is shown in Table 2, and the rainfall hydrograph curve of various repeating rainfall periods when the rainfall peak coefficient is 0.34 is shown in Figure 5.
3. Results and Discussion
3.1. Comparison of LID and Traditional Development
The total runoff of outfall changed with the rainfall intensity under the LID model and the traditional development model, and the simulation results can be seen in Figure 6. The total rainfall here was the product of rainfall and catchment area, so its unit had changed. The rainfall repetition periods were 0.33a, 1a, 3a, 5a and 10a, the rainfall duration was 3 h and the simulation time was 4 h; total runoff, peak flow, runoff-yielding time and peak-flow occurrence time can be seen in Table 3.
According to Table 3, the total rainfalls over 3 h were 1080, 2052, 2865, 3247 and 3765 m3 when the rainfall repetition periods were 0.33a, 1a, 3a, 5a and 10a, respectively. After the management effect of LID (i.e., permeable pavement + grassed swales), the outfall runoff was decreased in all groups. Especially, when the rainfall repetition period was 0.33a, the outfall had no flow. According to the comparison from Figure 6, it can be seen that the peak flow was reduced by 0.377, 0.286, 0.335, 0.227 and 0.119 m3/s when the rainfall repetition periods were 0.33a, 1a, 3a, 5a and 10a, respectively. With the comparative analysis of sub-catchment runoff control data, it is proposed that the runoff reduction in the traditional development model mainly depends on the infiltration of the surface permeable area, while the runoff reduction in the LID model mainly depends on reduction at the source, infiltration at halfway and regulation on the terminal.
Grassed swale and permeable pavement were conducive to reducing the peak flow under different rainfall repetition periods; however, as the rainfall repetition period and rainfall intensity increased, the runoff reduction efficiency decreased. When the rainfall repetition period was 10a, the difference in values of peak flow, runoff-yielding time and peak-flow occurrence time between the two models was negligible. The result is consistent with the simulation results of the effect of the rainwater garden’s regulation and control of the urban rainwater runoff from Jiake Li et al. [31]. Furthermore, in Li’s design model, the rainwater garden accounts for 2% of the total land area, while the rainfall repetition periods were 2a, 5a, 10a and 20a, the total runoff reduction was more than 25.69% and the peak flow occurrence time was delayed by 5–7 min.
It can be seen from Figure 7 that when the rainfall intensity rises to a certain extent, the difference value of the total runoff between the two development models tends to be downward, indicating that all LID facilities have entered a saturated state, and the regulation and storage of the LID model are not obvious at this point.
3.2. Comparison of Combined System and Single LID Facility
The rainfall repetition individual LID controls, one 5-year 3 h of rainfall event period was set as 5a while the rainfall duration was set as 3 h, the LID facilities (including grassed swales and permeable pavement) were simulated in the study area individually, and the simulation results were compared with the traditional development model and LID model; the final results can be seen in Table 4.
It can be seen from Table 4 that the LID facilities have effect in reducing total runoff and peak flow, delaying the runoff-yielding time and peak-flow occurrence time. Particularly, the combined system (i.e., permeable pavement + grassed swales) worked more efficiently than the sum of the individuals in the reduction of total runoff and peak flow, and the delay of peak-flow occurrence time throughout. The reason is that after runoff from sub-catchment areas infiltrates through the grassed swales and permeable pavement surface, the water in storage layers of permeable pavement can infiltrate into the grassed swales through lateral infiltration. The grassed swales reduce the runoff velocity in the transmission of rainwater runoff, which results in the time delay or elimination in runoff-yielding. The connection of an internal infiltration path between the individual LID facilities increases the water-storage space of the sub-catchment area, which leads to a reduction in peak flow and delay in the occurrence time of peak flow.
When the values of unit area are the same, the efficiency of the LID facilities on the total runoff reduction is ranked as: combined system (i.e., permeable pavement + grassed swales) > permeable pavement > grassed swales. The efficiency of the peak-flow reduction is ranked as: combined system (i.e., permeable pavement + grassed swales) > permeable pavement > grassed swales. The efficiency of delay in peak-flow occurrence time is ranked as: combined system (i.e., permeable pavement + grassed swales) > permeable pavement > grassed swales. The reason is that the permeable pavement is composed of surface course, cushion course and porous base course, so that the runoff on the surface can infiltrate freely from top to bottom in the permeable pavement, and finally recharge groundwater. Per unit area, the permeable pavement has a larger reservoir space than grassed swales, the rainwater in the water-storage formation continues to infiltrate after rainfall, and finally the extra water overflows and discharges. The effect of delay in runoff-yielding time is ranked as: combined system (i.e., permeable pavement + grassed swales) > grassed swales > permeable pavement. The reason is that grassed swales have a larger Manning coefficient on the surface due to plantation coverage (the Manning coefficient on the surface is generally 0.3), which leads to the reduction in runoff velocity, and a slower runoff velocity would increase the transmission time of rainwater runoff from runoff-yield to outfall, resulting in the delay or elimination of runoff-yielding time.
4. Conclusions
This paper presented a research method on storm-water management using SWMM. As a part of this study, the superiority of LID in storm regulation was verified through comparison of the LID model and the traditional development model, and the contrast between the combined system (i.e., permeable pavement + grassed swales) and a single LID facility on the storm-water management effect was further investigated. Based on the results and analysis, the following conclusions were made:
(1) The SWMM model can quantify the management effect of LID facilities on storm-water runoff. According to the nonlinear reservoir theory, the model took the extracted information of land surface as the basis to calculate runoff, hydrodynamic theory was used to compute concentration flow unit by unit, and the computational data can reflect the running effect of sponge facilities. In practical engineering, flow meters and level gauges are arranged in the infall and outfall to monitor actual treatment results, and the actual operating results of LID facilities are to be verified in the follow-up field tests for real-world authentication.
(2) Better results of storm-water management could be obtained through LID, including reduction in the total runoff, decrease in the peak flow, elimination or delay in the runoff-yielding time and delay in the peak-flow occurrence time. When the rainfall repetition period ranged from 0.33a to 10a, the reduction rate of total runoff in the research area where LID facilities were arranged ranged from 100% to 27.5%. The reduction rate of peak flow ranged from 100% to 15.9%. The runoff-yielding time was eliminated or delayed by 13 min to 5 min and the peak-flow occurrence time was eliminated or delayed by 17 min to 5 min after LID treatment.
(3) When the values of unit area are the same, the efficiency of the LID facilities on the total runoff reduction is ranked as: combined system (i.e., permeable pavement + grassed swales) > permeable pavement > grassed swales. The efficiency of the peak-flow reduction is ranked as: combined system (i.e., permeable pavement + grassed swales) > permeable pavement > grassed swales. The effect of delay in runoff-yielding time is ranked as: combined system (i.e., permeable pavement + grassed swales) > grassed swales > permeable pavement. The efficiency of delay in peak-flow occurrence time is ranked as: combined system (i.e., permeable pavement + grassed swales) > permeable pavement > grassed swales. The capacity for storm-water management of permeable pavement and grassed swales was limited, and the combined system was well-operated when the rain was light. However, when the area suffered too much rain in a short time, the management was mostly negligible.
(4) The results can provide reference for the selection and arrangement of LID facilities in urban areas; for example, when the regional space is ample, the united arrangement of LID facilities are recommended in the design of the drainage system, whereas when the area is limited, permeable pavement should be a top priority. Grassed swales and permeable pavement emphasize site-specific recommendations, intensive management, improved efficiency and environmentally sound use of inputs, rather than pursuit of the largest area of sinking space.
Acknowledgments
The authors would like to acknowledge National Key Technology Research and Development Program of the Ministry of Science and Technology of China (2015BAL02B00) and Jiangsu Scientific and Technological Development Program (BE2015349) for its financial support in this project.
Author Contributions
Each author had his own jobs. The first author, Jianguang Xie, had the responsibility of test designs and the construction of SWMM. Chenghao Wu and Hua Li helped to collect the test data and make analysis based on the data. Jianguang Xie wrote this paper and Gengtian Chen had the job of checking the paper on grammar and revision. As the corresponding author, Jianguang Xie was also the person who submitted the paper and kept communication with editors.
Conflicts of Interest
The authors declare no conflict of interest.
References
- Masamba, W.R.L.; Mazvimavi, D. Impact on water quality of land uses along Tamalakane-Boteti River: An outlet of the Okavango Delta. Phys. Chem. Earth Parts A/B/C 2008, 33, 687–694. [Google Scholar] [CrossRef]
- Beniston, J.W.; Lal, R.; Mercer, K.L. Assessing and managing soil quality for urban agriculture in a degraded vacant lot soil. Land Degrad. Dev. 2016, 27, 996–1006. [Google Scholar] [CrossRef]
- Gorgoglione, A.; Gioia, A.; Iacobellis, V.; Piccinni, A.F.; Ranieri, E. A Rationale for Pollutograph Evaluation in Ungauged Areas, Using Daily Rainfall Patterns: Case Studies of the Apulian Region in Southern Italy. Appl. Environ. Soil Sci. 2016, 2016, 9327614. [Google Scholar] [CrossRef]
- Aad, M.P.A.; Suidan, M.T.; Shuster, W.D. Modeling Techniques of Best Management Practices: Rain Barrels and Rain Gardens Using EPA SWMM-5. J. Hydrol. Eng. 2010, 15, 434–443. [Google Scholar] [CrossRef]
- Ji, G.X. Experimental study on urban rainwater infiltration and rainwater drainage system. J. Univ. Shanghai Sci. Technol. 2003, 25, 72–76. [Google Scholar]
- Yang, B.; Xu, T.; Shi, L. Analysis on sustainable urban development levels and trends in China’s cities. J. Clean. Prod. 2017, 141, 868–880. [Google Scholar] [CrossRef]
- Fletcher, T.D.; Peljo, L.; Fielding, J.; Weber, T.R. The Performance of Vegetated Swales for Urban Stormwater Pollution Control. In Proceedings of the Ninth International Conference on Urban Drainage, Portland, OR, USA, 8–13 September 2002; pp. 1–16. [Google Scholar]
- Shen, Z.X.; Kan, L.Y.; Che, S.W. Effects of grass swales structure parameters on storage and pollutant removal of rainfall runoff. J. Shanghai Jiaotong Univ. (Agric. Sci.) 2015, 33, 46–52. [Google Scholar]
- Xu, P.; Xi, W.J.; Sun, K.P.; Ren, X.X.; Zhang, Y.J. The Control Effects of Conveyance Grass Swales in Park on Rainfall Runoff under Moderate and High Rainfall Intensity. Environ. Sci. Technol. 2016, 11, 47–51. (In Chinese) [Google Scholar]
- Huang, Y.; Wei, P.; Li, H.Y.; Zhang, Y. Impact of Vegetated Check Dam and Overflow Weir on Operation of Grass Swale Perforated Pipe System. China Water Wastewater 2015, 13, 99–104. (In Chinese) [Google Scholar]
- Jiang, W.; Sha, A.M.; Xiao, J.J.; Pei, J.Z. Water storage-infiltration model for permeable asphalt pavement and its efficiency. J. Tongji Univ. (Nat. Sci.) 2013, 41, 72–77. (In Chinese) [Google Scholar]
- Brattebo, B.O.; Booth, D.B. Long-term storm water quantity and quality performance of permeable pavement systems. Water Res. 2003, 37, 4369–4376. [Google Scholar] [CrossRef]
- Cai, L.H. Introduction of Hydrological and Hydraulic Models for “Sponge City”. Digit. Landsc. Archit. 2016, 2, 33–43. (In Chinese) [Google Scholar]
- Park, S.Y.; Lee, K.W.; Park, I.H.; Ha, S.R. Effect of the aggregation level of surface runoff fields and sewer network for a SWMM simulation. Desalination 2008, 226, 328–337. [Google Scholar] [CrossRef]
- Mccutcheon, M.; Wride, D. Shades of Green: Using SWMM LID Controls to Simulate Green Infrastructure. J. Water Manag. Model. 2013, R246-15, 289–301. [Google Scholar]
- Granata, F.; Gargano, R.; Marinis, G.D. Support Vector Regression for Rainfall-Runoff Modeling in Urban Drainage: A Comparison with the EPA’s Storm Water Management Model. Water 2016, 8, 69. [Google Scholar] [CrossRef]
- Wang, K.H.; Altunkaynak, A. Comparative Case Study of Rainfall-Runoff Modeling between SWMM and Fuzzy Logic Approach. J. Hydrol. Eng. 2013, 18, 283–291. [Google Scholar] [CrossRef]
- Song, C.P.; Wang, H.C.; Tang, D.S. Research progress and development trend of storm water management model. China Water Wastewater 2015, 16, 16–20. (In Chinese) [Google Scholar]
- Mao, X.; Jia, H.; Yu, S.L. Assessing the ecological benefits of aggregate LID-BMPs through modelling. Ecol. Model. 2017, 353, 139–149. [Google Scholar] [CrossRef]
- Xing, W.; Li, P.; Cao, S.-B.; Gan, L.-L.; Liu, F.-L.; Zuo, J. Layout effects and optimization of runoff storage and filtration facilities based on SWMM simulation in a demonstration area. Water Sci. Eng. 2016, 9, 115–124. [Google Scholar] [CrossRef]
- Guan, Y.H.; Lu, M.; Wang, C. LID Stormwater Control Effect and Water Quality Simulation Based on SWMM. China Rural Water Hydropower 2017, 1, 84–87. (In Chinese) [Google Scholar]
- Jang, S.; Cho, M.; Yoon, J.; Yoon, Y.; Kim, S.; Kim, G.; Kim, L.; Aksoy, H. Using SWMM as a tool for hydrologic impact assessment. Desalination 2007, 212, 344–356. [Google Scholar] [CrossRef]
- Campbell, C.W.; Sullivan, S.M. Simulating time-varying cave flow and water levels using the Storm Water Management Model. Eng. Geol. 2002, 65, 133–139. [Google Scholar] [CrossRef]
- Kuang, X.; Sansalone, J.; Ying, G.; Ranieri, V. Pore-structure models of hydraulic conductivity for permeable pavement. J. Hydrol. 2011, 399, 148–157. [Google Scholar] [CrossRef]
- Fortunato, A.; Oliveri, E.; Mazzola, M.R. Selection of the Optimal Design Rainfall Return Period of Urban Drainage Systems. Procedia Eng. 2014, 89, 742–749. [Google Scholar] [CrossRef]
- Zhang, D.W.; Zhao, D.Q.; Chen, J.N.; Wang, H.Z.; Wang, H.C. Application of Chicago rainfall hydrograph model in simulation of drainage system. Geomat. World 2008, 34, 354–357. (In Chinese) [Google Scholar]
- Jin, J.M. Formulation and application method of urban rainstorm intensity formula. China Munic. Eng. 2010, 1, 38–67. (In Chinese) [Google Scholar]
- Zhuang, Z.F.; Wang, K.Q.; Yang, J.; Chen, B.; Zhu, H.T. Research on new generation rainstorm intensity formula and design of rainfall hyetograph in Zhenjiang. J. Meteorol. Sci. 2015, 35, 506–513. (In Chinese) [Google Scholar]
- Li, W.T.; Sui, J.; Liu, C.L.; Niu, Y.; Zhou, J.H.; Tan, J.X. Analysis of influence of design rainfall peak coefficient on design flow of drainage pipeline network. Water Purif. Technol. 2015, 5, 100–103. (In Chinese) [Google Scholar]
- Xu, S.R.; Wang, Y. Impact analyze of rainfall intensity and interval under low impact development on stormwater control. Sci. Technol. Eng. 2015, 15, 219–223. (In Chinese) [Google Scholar]
- Li, J.; Li, Y.; Shen, B. Simulation of rain garden effects in urbanized area based on SWMM. J. Hydroelectr. Eng. 2014, 33, 60–67. [Google Scholar]
Figure 1.
Plan of Nanshan village in Jurong.

Figure 2.
Generalized sketch map of sub-basin arrangement.

Figure 3.
Drainage path of runoff in the LID model.

Figure 4.
Drainage path of runoff in the traditional development model.

Figure 5.
Rainfall hydrograph of various repeating rainfall periods when the rainfall peak coefficient is 0.34.
Figure 5.
Rainfall hydrograph of various repeating rainfall periods when the rainfall peak coefficient is 0.34.

Figure 6.
Comparison curve of runoff control effect: (a) when rainfall repetition period is 0.33a; (b) when rainfall repetition period is 1a; (c) when rainfall repetition period is 3a; (d) when rainfall repetition period is 5a; (e) when rainfall repetition period is 10a.
Figure 6.
Comparison curve of runoff control effect: (a) when rainfall repetition period is 0.33a; (b) when rainfall repetition period is 1a; (c) when rainfall repetition period is 3a; (d) when rainfall repetition period is 5a; (e) when rainfall repetition period is 10a.

Figure 7.
Rainfall curve under different rainfall intensities.


Table 1.
Table of parameters of LID controls.
| Grassed Swale | Permeable Asphalt | ||||||
|---|---|---|---|---|---|---|---|
| Surface | Surface | Pavement | Water storage | ||||
| Berm height (mm) | 200 | Berm height (mm) | 10 | Thickness (mm) | 150 | Thickness (mm) | 300 |
| Vegetation coverage rate | 0.2 | Manning’s n | 0.011 | Void radio | 0.25 | Void radio | 0.5 |
| Manning’s n | 0.3 | Surface slope (%) | 0.3 | Permeability (mm/h) | 800 | Seepage rate (%) | 250 |
| Surface slope (%) | 0.5 | Clogging factor | 0 | Clogging factor | 0 | ||
| Swale side slope (%) | 4 | ||||||
Table 2.
Distribution of 3 h of rainfall under different rainfall repetition periods.
| Time Step/min | 0.33a * | 1a | 3a | 5a | 10a |
|---|---|---|---|---|---|
| 0 | 0.025 | 0.041 | 0.058 | 0.066 | 0.076 |
| 10 | 0.034 | 0.056 | 0.079 | 0.089 | 0.104 |
| 20 | 0.048 | 0.081 | 0.113 | 0.128 | 0.149 |
| 30 | 0.075 | 0.125 | 0.175 | 0.198 | 0.230 |
| 40 | 0.130 | 0.217 | 0.304 | 0.344 | 0.399 |
| 50 | 0.275 | 0.461 | 0.645 | 0.731 | 0.847 |
| 60 | 0.914 | 1.530 | 2.142 | 2.426 | 2.811 |
| 70 | 0.564 | 0.945 | 1.322 | 1.497 | 1.735 |
| 80 | 0.317 | 0.531 | 0.744 | 0.842 | 0.976 |
| 90 | 0.203 | 0.339 | 0.475 | 0.538 | 0.623 |
| 100 | 0.140 | 0.235 | 0.328 | 0.372 | 0.431 |
| 110 | 0.103 | 0.172 | 0.240 | 0.272 | 0.315 |
| 120 | 0.078 | 0.131 | 0.183 | 0.207 | 0.240 |
| 130 | 0.061 | 0.103 | 0.144 | 0.163 | 0.189 |
| 140 | 0.049 | 0.083 | 0.116 | 0.131 | 0.152 |
| 150 | 0.041 | 0.068 | 0.095 | 0.108 | 0.125 |
| 160 | 0.034 | 0.057 | 0.080 | 0.090 | 0.105 |
| 170 | 0.029 | 0.048 | 0.067 | 0.076 | 0.089 |
| 180 | 0.025 | 0.041 | 0.058 | 0.066 | 0.076 |
Note: * a refers to the rainfall repetition period.
Table 3.
Simulated results of the runoff under different rainfall intensities.
| Simulation Item | 0.33a | 1a | 3a | ||||||||||||||||
| LID | Traditional Development | Difference Value | LID | Traditional Development | Difference Value | LID | Traditional Development | Difference Value | |||||||||||
| Total rainfall (m3) | 1080 | 2052 | 2865 | ||||||||||||||||
| Total runoff (m3) | 0 | 503 | 503 | 323 | 1174 | 851 | 817 | 2007 | 1190 | ||||||||||
| Peak flow (m3/s) | 0.377 | 0.377 | 0.091 | 0.377 | 0.286 | 0.221 | 0.556 | 0.335 | |||||||||||
| Peak-flow occurrence time (min) | 110 | 123 | 106 | 17 | 106 | 94 | 12 | ||||||||||||
| Runoff-yielding time (min) | 38 | 44 | 31 | 13 | 36 | 25 | 11 | ||||||||||||
| Simulation Item | 5a | 10a | |||||||||||||||||
| LID | Traditional Development | Difference Value | LID | Traditional Development | Difference Value | ||||||||||||||
| Total rainfall (m3) | 3247 | 3765 | |||||||||||||||||
| Total runoff (m3) | 1163 | 2598 | 1435 | 2321 | 3200 | 879 | |||||||||||||
| Peak flow (m3/s) | 0.408 | 0.635 | 0.227 | 0.629 | 0.748 | 0.119 | |||||||||||||
| Peak-flow occurrence time (min) | 91 | 80 | 11 | 70 | 65 | 5 | |||||||||||||
| Runoff-yielding time (min) | 25 | 17 | 8 | 13 | 8 | 5 | |||||||||||||
Table 4.
Simulated results of runoff regulation effect under.
| Type of LID Facilities | No LID Facilities | Grassed Swale | Permeable Pavement | Combination of LID Facilities |
|---|---|---|---|---|
| Area ratio | 4% | 12.25% | 16.25% | |
| Total runoff (m3) | 2598 | 2430 | 1730 | 1163 |
| Reduction in total runoff (m3) | 168 | 868 | 1435 | |
| Reduction in total runoff per ha (m3) | 2100 | 3542 | 4416 | |
| Peak flow (m3/s) | 0.635 | 0.583 | 0.509 | 0.408 |
| Reduction in peak flow (m3/s) | 0.052 | 0.126 | 0.227 | |
| Reduction in peak flow per ha (m3/s) | 0.650 | 0.514 | 0.698 | |
| Runoff-yielding time (min) | 17 | 19 | 22 | 25 |
| Reduction in time of runoff-yielding (min) | 2 | 5 | 8 | |
| Reduction in time of runoff-yielding per ha (min) | 25 | 20 | 25 | |
| Peak-flow occurrence time (min) | 80 | 82 | 87 | 91 |
| Reduction in time of peak-flow occurrence (min) | 2 | 7 | 11 | |
| Reduction in time of peak flow occurrence per ha (min) | 25 | 29 | 34 |
© 2017 by the authors. Licensee MDPI, Basel, Switzerland. This article is an open access article distributed under the terms and conditions of the Creative Commons Attribution (CC BY) license (http://creativecommons.org/licenses/by/4.0/).
Share and Cite
MDPI and ACS Style
Xie, J.; Wu, C.; Li, H.; Chen, G. Study on Storm-Water Management of Grassed Swales and Permeable Pavement Based on SWMM. Water 2017, 9, 840. https://doi.org/10.3390/w9110840
AMA Style
Xie J, Wu C, Li H, Chen G. Study on Storm-Water Management of Grassed Swales and Permeable Pavement Based on SWMM. Water. 2017; 9(11):840. https://doi.org/10.3390/w9110840
Chicago/Turabian StyleXie, Jianguang, Chenghao Wu, Hua Li, and Gengtian Chen. 2017. "Study on Storm-Water Management of Grassed Swales and Permeable Pavement Based on SWMM" Water 9, no. 11: 840. https://doi.org/10.3390/w9110840
Note that from the first issue of 2016, this journal uses article numbers instead of page numbers. See further details here.