Performance of Denitrifying Phosphate Removal via Nitrite from Slaughterhouse Wastewater Treatment at Low Temperature


1
School of Environmental Science and Engineering, Xiamen University of Technology, Xiamen 361024, China
2
Key Laboratory of Xiamen University of Technology, Fujian Province University, Xiamen 361024, China
3
Graduate School at Shenzhen, Tsinghua University, Shenzhen 518055, China
4
Civil Engineering, College of Engineering and Informatics, National University of Ireland, Galway H91 CF50, Ireland
*
Author to whom correspondence should be addressed.
Water 2017, 9(11), 818; https://doi.org/10.3390/w9110818
Submission received: 22 August 2017
/
Revised: 19 October 2017
/
Accepted: 19 October 2017
/
Published: 31 October 2017
(This article belongs to the Special Issue Biological Treatment of Wastewater)
Abstract
:This study aims to investigate the effects of the organic loading rate (OLR) and the aeration rate on denitrifying phosphate removal (DPR) from slaughterhouse wastewater treated at a temperature of 11 °C. Three laboratory-scale intermittently aerated sequencing batch reactors (IASBRs) were set up and three OLRs and five aeration rates were employed in the study. The results indicated that efficient removals of nitrogen (N) and phosphorus (P) from DPR were achieved. Furthermore, the intermittent aeration pattern benefitted both the phosphorus-accumulating organisms (PAOs) and the denitrifying phosphorus-accumulating organisms (DPAOs) that accumulated at 11 °C. The ratio of P uptake in the aeration periods/P release in the non-aeration periods was in the range of 0.94–1.10 in the three stages. The relationship between the specific poly-β-hydroxybutyrate (PHB) degradation rate (z), the specific P removal rate (x), and the specific total oxidized nitrogen(TON) reduction rate (y) can be fitted approximately as a plane (, R2 = 0.83).
1. Introduction
Eutrophication is a key driver causing numerous environmental problems, naturally controlled mainly by phosphorus and nitrogen bioavailability [1]. Denitrifying phosphate removal (DPR), which can fulfill simultaneous denitrification and P removal, is a novel technology for biological nutrient removal [2]. Relying on the capacity of denitrifying phosphorus-accumulating organisms (DPAOs), P removal is encouraged to mediate denitrification in the anoxic periods. Compared with the conventional enhanced biological phosphorus removal (EBPR) process, the DPR can reduce 30% of the aeration demand, 50% of the carbon source requirement, and 50% of the sludge production [3].
In a similar metabolic mechanism with the PAOs, the DPAOs utilize an external carbon source to store polyhydroxyalkanoates (PHA, including poly-β-hydroxybutyrate [PHB] and poly-β-hydroxyvalerate [PHV]) in an anaerobic period. Subsequently they employ nitrite (NO2−) or nitrate (NO3−) as the electron acceptor instead of oxygen for P uptake by oxidizing intercellular PHA [4]. Hu et al. [5] stated that DPAOs could be subdivided into two groups: one group (denitrifying phosphorus-accumulating organisms over nitrate [DPAOs-nitrate]) using both oxygen (O2) and NO3− as electron acceptors and the other group (denitrifying phosphorus-accumulating organisms over nitrite [DPAOs-nitrite] using O2, NO2−, and NO3− as electron acceptors. The uncultured “Candidatus Accumulibacter phosphatis”, which is a well-known phosphorus-accumulating organism (PAO), is proved to have the ability to denitrify. Its two main clades are organized as PAO I and PAO II [6]. It is reported that PAO II clade lacked the respiratory nitrate reductase enzyme and could not use nitrate as electron acceptor, while PAO I clade was able to use nitrite and/or nitrate as an electron acceptor [6,7]. Usually, denitrifying dephosphatation via NO3− simulates complete nitrification-denitrification and phosphorus removal by DPAOs-nitrate, whereas denitrifying dephosphatation via NO2− mediated by DPAOs-nitrite simulates partial nitrification-denitrification and phosphorus removal [8]. Therefore, compared with DPR via NO3−, DPR via NO2− is considered as the more economical option.
To achieve DPR via NO2−, DPAOs-nitrite has to be dominant in the alternative anaerobic and aerobic strategy and NO2−-N accumulation is required from efficient partial nitrification. Generally, DPR via NO2− can be influenced by many factors, such as the anaerobic/aerobic reaction time, temperature, dissolved oxygen (DO), pH, carbon substrate, etc. Wang et al. [2] found that reduced anaerobic reaction time (from 150 min to 90 min) enriched the Accumulibacter-PAOs population and promoted the DPR performance. Kastsou et al. (2015) stated that a high volumetric nitrogen loading rate (vNLR = 0.19–0.21 kgN·m−3·d−1), at a low DO concentration of 0.7 mg/L, favored nitrite accumulation and phosphorus uptake via nitrite [9]. Li et al. [10] found that influent organic shock loads significantly influenced nitrogen (N) and P removal from DPR but higher organic shock loads reduced P removal from DPR. In addition, Zeng et al. [11] confirmed that limiting the carbon source benefitted DPR under nitritation. Liu et al. [12] investigated the influence of temperature on DPR and found that more than 80% of P removal from DPR was obtained in the range of 20–30 °C and the removal efficiencies went down with the temperature below 10 °C and above 35 °C. In fact, low temperature inhibits the activities of DPAOs as well as the metabolism of nitrifiers (in particular, ammonium-oxidizing bacteria [AOB]) [13]. Moreover, low nitrification with limited nitrite and nitrate production inhibits anoxic P uptake by a lack of electron acceptors. However, in our previous study, successful partial nitrification and denitrification were achieved at 11 °C by using an intermittent aeration strategy [14]. Notably, compared with the conventional sequencing batch reactor (SBR) technology (AO single-sludge system), the intermittent aeration SBR technology likely benefits to realize denitrifying dephosphatation at low temperature [15]. Furthermore, the intermittent aeration strategy eliminates the requirement for effective control of various operational parameters (especially DO and temperature) to achieve certain circumstance favoring the activity of AOB over NOB, leading to partial nitrification [14].
In the current study, three laboratory-scale intermittently aerated sequencing batch reactors (IASBRs) were set up to treat slaughterhouse wastewater at 11 °C. The DPR process was studied, with focus on the effects of the organic loading rate (OLR) and aeration rate on the DPR via NO2−.
2. Materials and Methods
2.1. Laboratory-Scale Intermittently Aerated Sequencing Batch Reactor (IASBR) Configuration
Three lab-scale intermittently aerated sequencing batch reactors (IASBRs) (SBR1, SBR2, and SBR3) were operated with a working volume of 10 L in a laboratory with the temperature controlled at 11 °C, imitating the annual average temperature in Ireland. The reactors were constantly stirred during the fill, non-aeration and aeration periods, while in the aeration periods air was supplied by air diffusers located at the bottom of the reactors. The sequential operation of the IASBR systems was controlled by a programmable logic controller (PLC) (S7-CPU-224, Siemens, Munich, Germany).The duration of the SBR operation cycle was 12 h, with each cycle comprising fill, non-aeration, aeration, settle, and draw/idle. The time arrangement of the laboratory-scale IASBR is shown in Figure 1.
The SBR reactors were seeded with 8.0 L return sludge taken from a local municipal wastewater treatment plant. The initial mixed liquor suspended solids (MLSS) concentrations in the three reactors after seeding were 4.2 g/L. Two peristaltic pumps (323S, Walson-Marlow, Falmouth, Cornwall, UK) with two swivels were respectively employed to feed the wastewater into the three reactors and to withdraw the treated wastewater.Three average organic loading rates (OLRs) of 0.61, 0.82, and 1.02 gCOD/(L·d) were respectively examined in three stages (Stage 1, Stage 2, and Stage 3) by gradually reducing the hydraulic retention time (HRT). Aeration rates of 0.4, 0.6 and 0.8 L air/min were employed in Stage 1, while aeration rates of 0.6, 0.8 and 1.0 L air/min were tested in Stage 2, and aeration rates of 0.8, 1.0 and 1.2 L air/min were examined in Stage 3. The details of the three-IASBR configurations have been reported in a previous study [14].
2.2. Slaughterhouse Wastewater
Unprocessed slaughterhouse wastewater was collected from a local slaughterhouse wastewater treatment plant (WWTP) and was stored in the laboratory at 11 °C to be used in the experiment. The characteristics of the slaughterhouse wastewater have been fully elaborated in a previous study [14].
2.3. Analytical Procedures
NH4+-N, NO2−-N, NO3−-N, PO43−-P, COD, SS, and VSS were tested by following the standard APHA methods [16]. The TN and TP were measured by using a TOC/TN/TP analyzer (Biotector, Cork, Ireland). The DO concentrations in the reactors were monitored with a multiple probe (HI9828, Hanna, Padova, Italy).The PHB concentrations were analyzed by using a high performance liquid chromatography (Agilent 1200, Agilent Technology, Santa Clara, CA, USA), with an UV index detector and an Aminer HPX-87H column (Bio-Rad, Hercules, CA, USA). The PHB was digested by employing the sulfuric-ethanol method [17].
The procedure of fluorescence in situ hybridization (FISH) analysis of activated sludge was adopted from that used in our previous research [18]. CY3- or fluorescein-labelled oligonucleotide probes were used to specifically stain PAOs and general bacteria (EUB) (Table 1). After Hybridization the samples were observed on a Nikon epifluorescence microscope equipped with suitable filters and a digital imaging system (Nikon, Tokyo, Japan). The biomass fractions of PAOs to general bacteria in sludge samples were evaluated by quantifying the area fraction of cells hybridized with the respective probes on at least 20 randomly distributed microscope images of each sample taken at 1000× magnification.
3. Results and Discussion
3.1. Overall Performance of IASBRs
The characteristics of the effluent of the IASBRs under pseudo-steady state are indicated in Table 2. At the same aeration rate of 0.6 L air/min in Stage 1 and 2, the highest average DO concentrations in the fourth aeration periods were respectively 2.4 and 0.65 mg/L (Figure 2). With the increase of OLR, the removal efficiencies of COD decreased from 98.1 to 97.3%, while the removal efficiencies of TN decreased from 96 to 91.6% and the removal efficiencies of TP increased from 96.4 to 97.9%. Similar, at the same aeration rate of 0.8 L air/min in Stage 1, 2 and 3, the highest average DO concentrations in the fourth aeration periods were respectively 5.45, 4.66 and 1.10 mg/L. With the increase of OLR, the decreasing COD and TN removals and increasing TP removal can be observed in Stage 1 and 2, with exception of poor TP removal in Stage 3 (Table 2). It implied that a low DO concentration was unfavorable to COD and TN removals but benefited TP removal at a low influent OLR.
In the three Stages, the COD removal efficiencies increased with an increase in the aeration rate; however, the TP removal efficiencies decreased with an increase in the aeration rate in stages 1 and 2. In the three stages, all the effluent COD, TN and TP concentrations complied with the discharge standards applicable in Ireland, except of effluent TN concentration at the aeration rate of 0.8 L/min in Stage 3 beyond the discharge standard. Aeration rates of 0.6, 0.8, and 1.2 L air/min, respectively, with the best treatment efficiencies for slaughterhouse wastewater, were considered as the optimum aeration rates for the OLRs at 0.61, 0.82, and 1.02 gCOD/(L·d).
3.2. P Removal via Enhanced Biological Phosphorus Removal (EBPR)
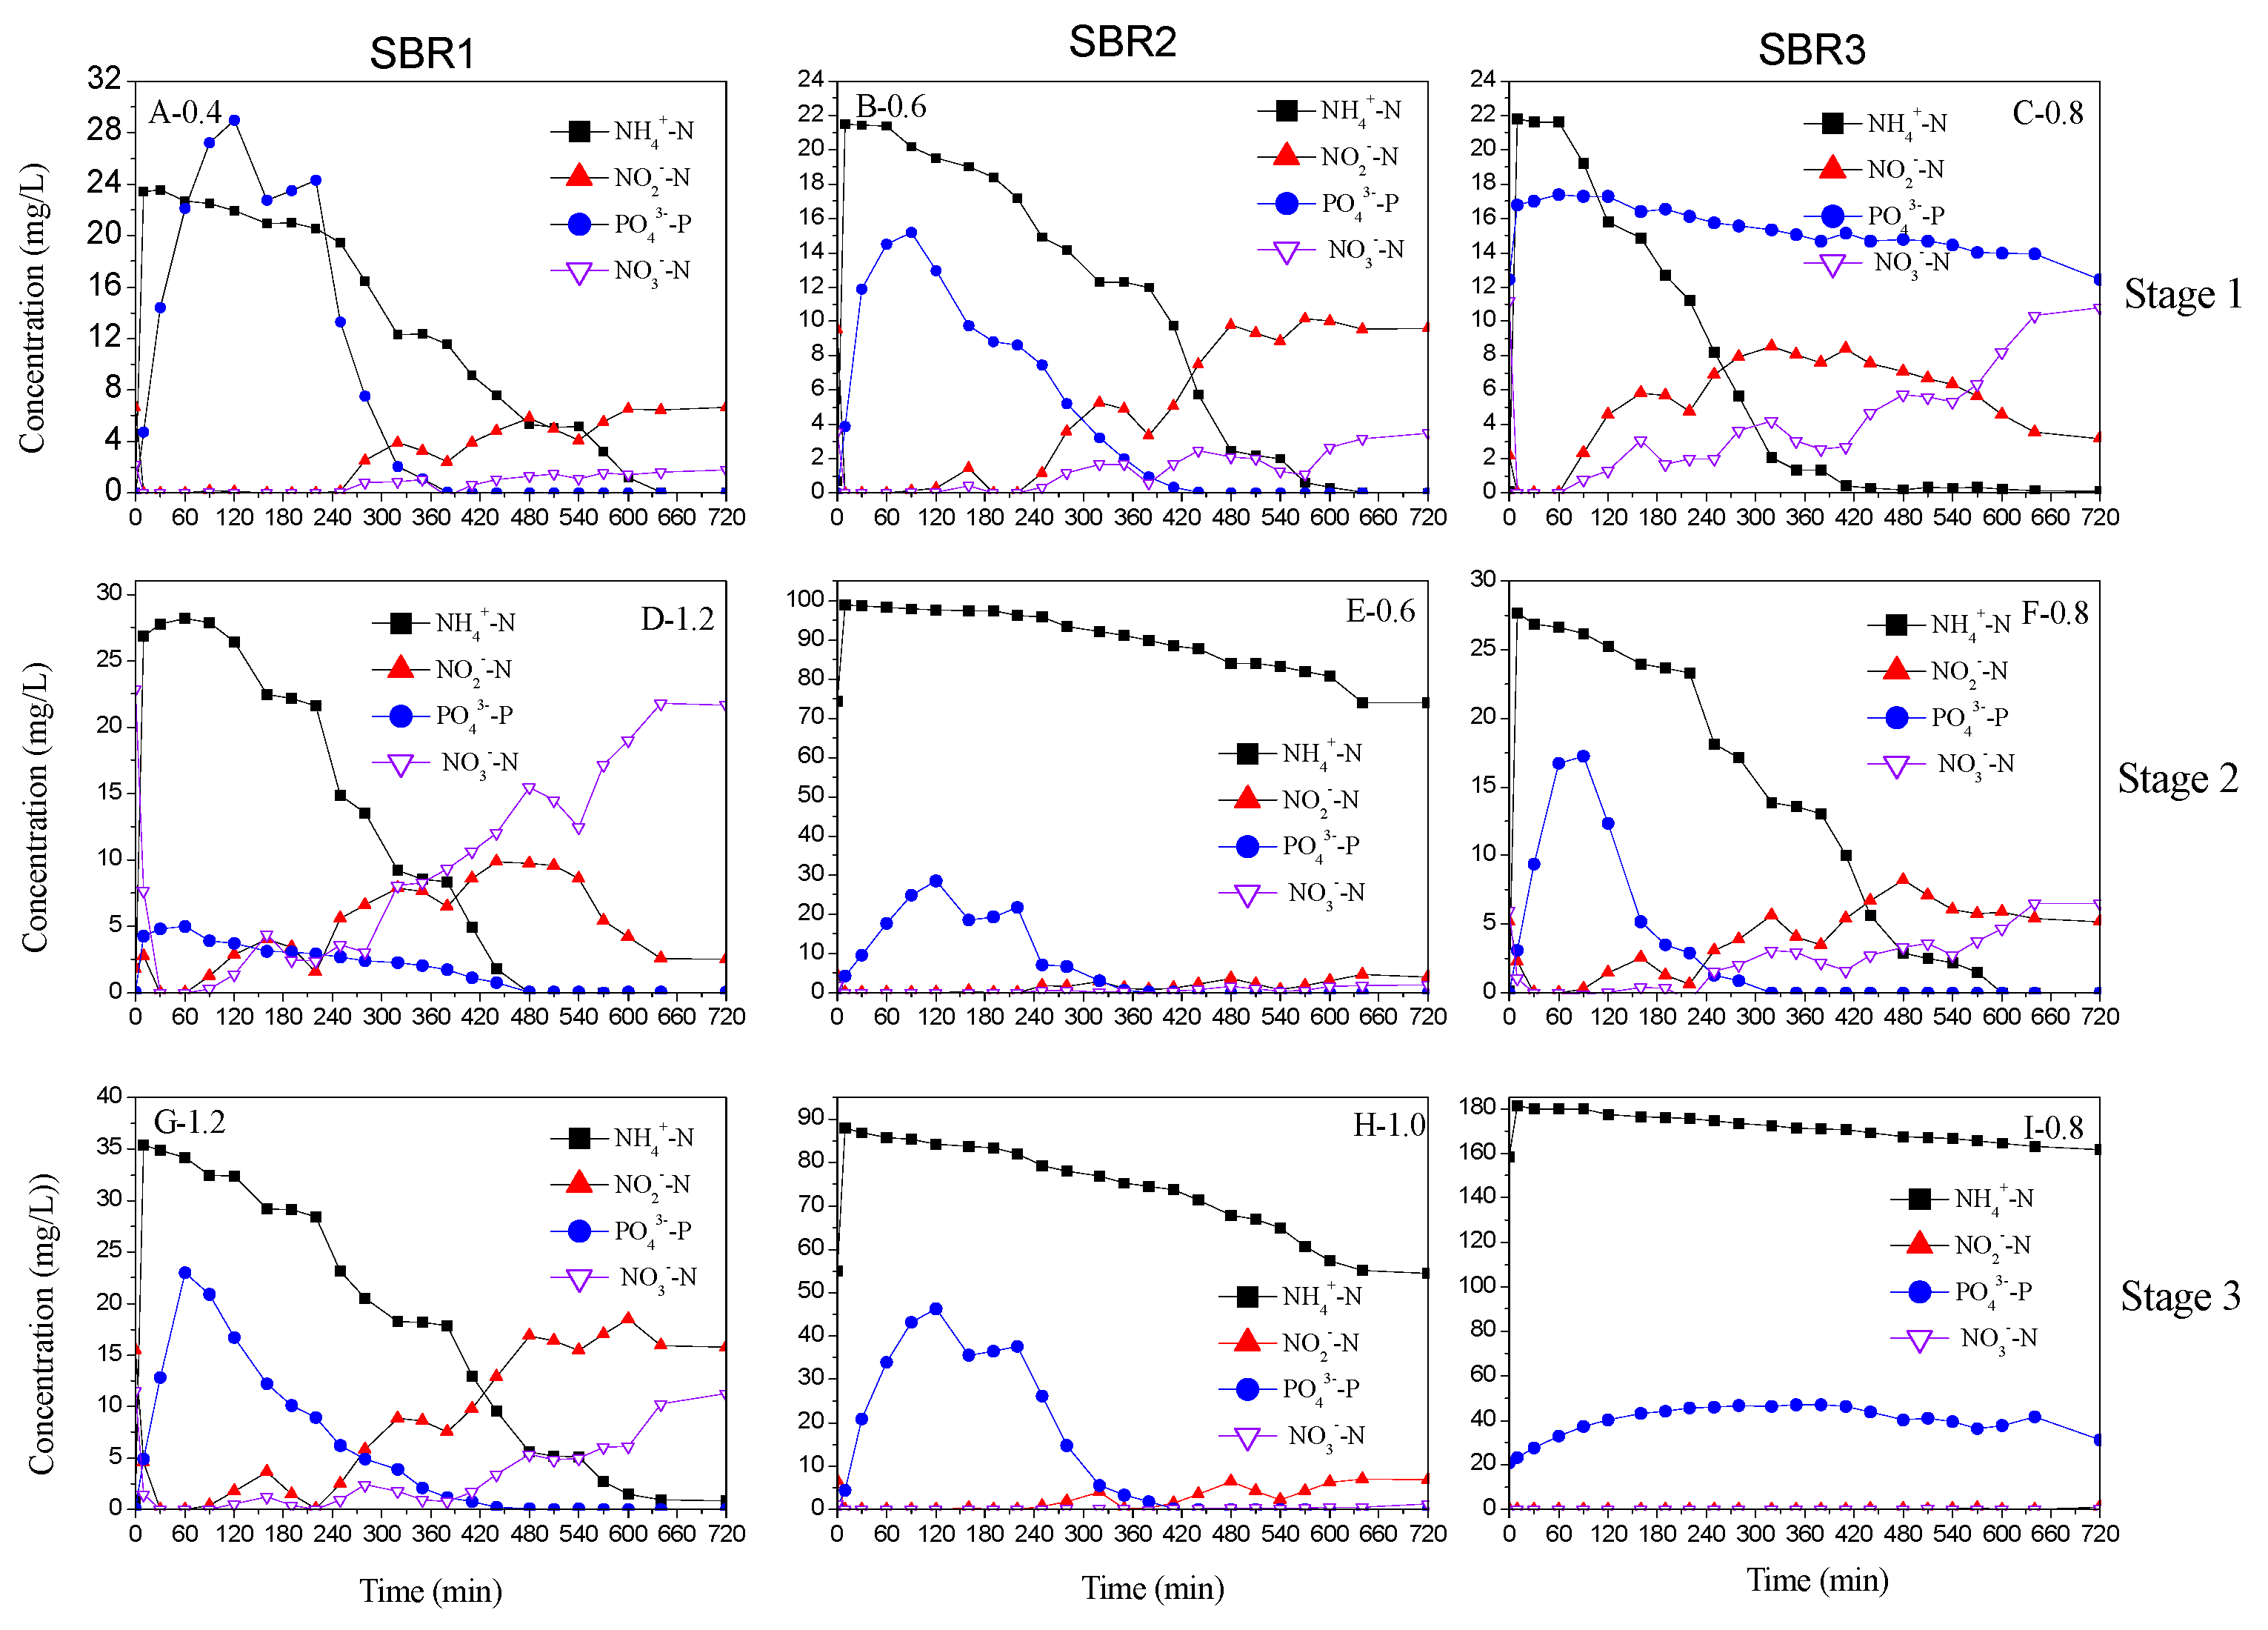
Figure 3 shows the profiles of NH4+-N, NO2−-N, PO43−-P, and total oxidized nitrogen (TON) during a typical operational cycle in the three stages. Influent NH4+-N was completely removed at three aeration rates (0.4, 0.6, and 0.8 L/min) in Stage 1. However, unsatisfactory removal of NH4+-N occurred at 0.6 L/min in Stage 2 and at 0.8 and 1.0 L/min in Stage 3. Superficially, obvious EBPR was taking place at 0.4 L/min in Stage 1, at 0.6 and 0.8 L/min in Stage 2 and at 1.0 and 1.2 L/min in Stage 3 (Figure 3). The amounts of P released during the non-aerobic period and the P uptake during the aerobic period, respectively, are shown in Table 3. In Stage 1, higher PAOs population at the aeration rate of 0.4 L air/min was responsible for higher P released amount in non-aerobic periods and P uptake amount in aeration periods than at 0.6 L air/min (Table 3). Similar phenomenon can be observed in the Stage 2 and 3. It is worth mentioning that the P concentrations were constantly rising for 60–120 min during the first aeration period at an aeration rate of 0.4 L air/min in Stage 1. This is ascribed to the DO concentrations being close to zero, with the COD concentrations were still high (data were not shown) (Figure 2A). Calculations indicate that 267.84 mg P was released during the non-aeration periods (including the 60–120 min period) and there was an uptake of 313.58 mg P during the aeration periods. The ratios of P uptake in the aeration periods/P release during the non-aeration periods were calculated as 1.10. Similar calculations were conducted at 0.6 L/min (the 60–120 min period included) in Stage 2 and at 1.0 L/min (the 60–120 min period included) in Stage 3. As indicated in Table 3, the higher amount of P released during the non-aeration period led to a higher amount of P uptake in the following aeration period. However, there was no obvious difference in the ratio of P uptake in the aeration periods/P release in the non-aeration periods (in the range of 0.94–1.10) in the three stages. The data obtained in the current study were lower than those obtained from other researches. Jeon et al. [19] adopted glucose and acetate as carbon sources to study P removal via EBPR in an anaerobic-aerobic SBR, with the ratio of P uptake during the aeration period/P release in the non-aeration period being approximately 1.17–1.36. In investigating P removal from piggery wastewater in SBR, Obaja et al. [20] obtained a ratio in a high range of 3.0–5.5. The lower values of P uptake during the aeration period/P release in the non-aeration period obtained in the current study can be ascribed to P uptake instead of release occurring during the non-aeration periods, which was responsible for DPR.
3.3. P Removal via Denitrifying Phosphate Removal (DPR) over NO2−
In Stage 1, at 0.4 L/min, the specific P release rates were 4.19, 0.54, −0.71, and 0 mg P release/g VSS·h relevant to four non-aeration periods. The negative value points to P uptake instead of release during the non-aeration period. This suggests that DPR can be achieved in the IASBR by using NO2− or NO3− as the electron acceptor. In the third non-aeration period, 20.41 mg PO43−-P was removed via DPR, whereas 21.11 mg TON was denitrified (including 14.96 mg NO2−-N and 6.15 NO3−-N). This means that 1 mg PO43−-P removed consumed 1.03 mg TON denitrified (including 0.73 mg NO2−-N and 0.30 mg NO3−-N). As indicated in Table 3, the highest ratio of 1.3 of mg TON denitrified/mg PO43−-P removed occurred at 0.6 L/min in Stage 1, leading to the ratio of TON denitrified/P removed via DPR was in the range of 1.03–1.3. In addition, the ratio of DPR via NO2−/DPR via NO3− (μ) was calculated as indicated in Table 3. The lowest μ value of 1.98 was obtained at 0.8 L/min in Stage 2 and the highest μ value of 58.17 was obtained at 1.0 L/min in Stage 3. In Stage 2, 19.23 mg NO2−-N and 9.71 mg NO3−-N were denitrified at 0.8 L/min. In Stage 3, 39.55 mg NO2−-N and 0.68 mg NO3−-N were denitrified at 1.0 L/min. Generally, high amount of NO2−-N accumulated from the partial nitrification in a previous aeration period would give rise to large amount of NO2−-N being denitrified in the following non-aeration period. Therefore, high NO2−-N accumulation from partial nitrification is indicated as a crucial factor in achieving DPR via nitrite.
3.4. Mechanism of DPR via Nitrite
3.4.1. PAOs, DPAOs, and DPAOs-Nitrite Activity
The ratio of anoxic phosphorous uptake to the aerobic phosphorous uptake was used as an approximate index to reflect the fraction of DPAOs in the total PAOs [21]. In the current study, five anoxic periods and four aerobic periods comprised a cycle. Accordingly, the fraction of DPAOs to total PAOs is expressed by the following equation:
where is the ratio of DPAOs to total PAOs, %; represents each non-aeration period (including settling period) in a complete SBR operational cycle and, in this study, = 1, 2, 3, 4, 5; is the amount of P uptake during each non-aeration period; represents each aeration period in a complete SBR operational cycle, and, in this study, = 1, 2, 3, 4; is the amount of P uptake during each aerobic period.
As indicated in Table 3, in the three stages, higher aeration rate favors DPAOs activity. The higher activity of DPAOs of 36.72% occurred at 0.6 L/min than 9% at 0.4 L/min in Stage 1, whereas the higher population of DPAOs in total bacteria was calculated as 3.26% than 0.83% at the 0.4 L/min. This is responsible for the lower amount of P removal via DPR and the lower ratio of TON denitrified/P removed via DPR at 0.4 L/min than that the ratios achieved at 0.6 L/min. Similar phenomenon can be observed in Stage 2 and 3.
In the current study, the ratio of NO2−-N denitrified/TON denitrified is used to present the approximate ratio of the activity of DPAOs-nitrite:
where is the population of DPAOs-nitrite to total bacteria, %; is the amount of NO2−-N denitrified in non-aeration periods with DPR occurred, mg; is the amount of TON denitrified in non-aeration periods, with DPR occurring, mg; DPAOs% is the population of DPAOs to total bacterial. In Stage 1, the amount of NO2−-N reduced via DPR (14.96 mg) at 0.4 L/min was lower than the amount of 33.45 mg at 0.6 L/min, which was due to lower population of DPAOs-nitrite (0.59%) at 0.4 L/min than the population of 2.12% at 0.6 L/min. A similar phenomenon can be observed in Stage 3. In addition, this result implies that a high aeration rate enhances DPR via nitrite or the DPAOs-nitrite activity. By using nitrate as the sole electron acceptor for DPR, Hu et al. [22] found that nitrate load rate affecting activity of DPAOs and low nitrate load could cause DPAOs washed out. It suggested that the concentrations of electron acceptors affected the DPAOs growth. In the current study, with the highest NO2−-N concentration of 18.50 mg/L during the fourth aerobic period at 1.2 L/min in Stage 3, the occurrence of DPR was sufficient in the subsequent non-aerobic period. Similar results were supported by Liu et al. [12] and Tsuneda et al. [21], who found that NO2−-Nin the range of 0–20 mg/L did not inhibit DPR.
3.4.2. Effects of Aeration Rate and Dissolved Oxygen (DO) on DPR via Nitrite
In current study, it was obvious that a high aeration rate enhanced both the growth of DPAOs and the activity of DPAOs-nitrite, however, it conflicted with the previous result that a low DO favoring TP removal at a low OLR. Zhang et al. [23] confirmed that increasing aeration rate benefitted the abilities of both anaerobic P release and anoxic P uptake (from 20 L/h to 30 L/h). However, Wang et al. [24] found that increasing DO concentration (from 0.5 mg/L to 2.0 mg/L) reduced the proportion of DPAOs (from 20 to 17%). The DO concentration has been recognized as a crucial factor in the accumulation of both PAOs and DPAOs. Figure 2 shows the DO concentrations in typical cycles in the three stages. In the intermittent aeration pattern, the DO concentrations during the non-aerobic periods were affected directly by the aeration rate, aeration length, and the DO concentrations in the prior aerobic period. In current study, when DPR occurred, the average DO concentrations did not exceed 0.8 mg/L (the highest was 0.76 mg/L) in the prior aeration period and the average DO concentrations in the subsequent non-aerobic periods were lower than 0.1 mg/L. Thus, the truth was that it was not a high aeration rate but a low DO concentration did enhance both the growth of DPAOs and the activity of DPAOs-nitrite. However, it had to mention that the highest concentrations of DO were 4.67 mg/L during the fourth aerobic period at 0.6 L/min in Stage 1, 7.39 mg/L during the fourth aerobic period at 0.8 L/min in Stage 2, and 7.84 mg/L during the fourth aerobic period at 1.2 L/min in Stage 3, respectively. This implies that the DPAOs had adapted to a wide range of DO concentrations in the intermittent aeration pattern, which is in accordance with the findings of our previous research [15]. Xu et al. [25] confirmed that a high range of DO concentration (2–6 mg/L) did not prevent DPR. More importantly, the DPAOs activity was not inhibited in the intermittent aeration pattern at 11 °C in the current study, which is deemed the lower critical temperature threshold for denitrifying and dephosphatation. Liu et al. [12] had demonstrated that it was viable to accumulate DPAOs with concurrent N and P removal at 15 °C. Consequently, efficient N and P removals from denitrifying dephosphatationwere well performed in intermittent aeration pattern at 11 °C.
3.4.3. Poly-β-Hydroxybutyrate (PHB) Consumed for DPR
In practice, the COD/N requirements are usually higher than the stoichiometric requirement of 2.86 g COD/g N for denitrification in conventional biological nitrogen removal processes [16]. The situation of the unsaturated external carbon required PHA used as an intracellular carbon source to complete thedenitrification process. By using PHB as the carbon source (due to the PHB was main ingredient in PHA), the denitrification reactions from nitrate can be theoretically expressed as Equation (3).
Accordingly, the carbon requirement for denitrification calculated by PHB is approximately 1.11 mol C (PHB)/mol N [2].
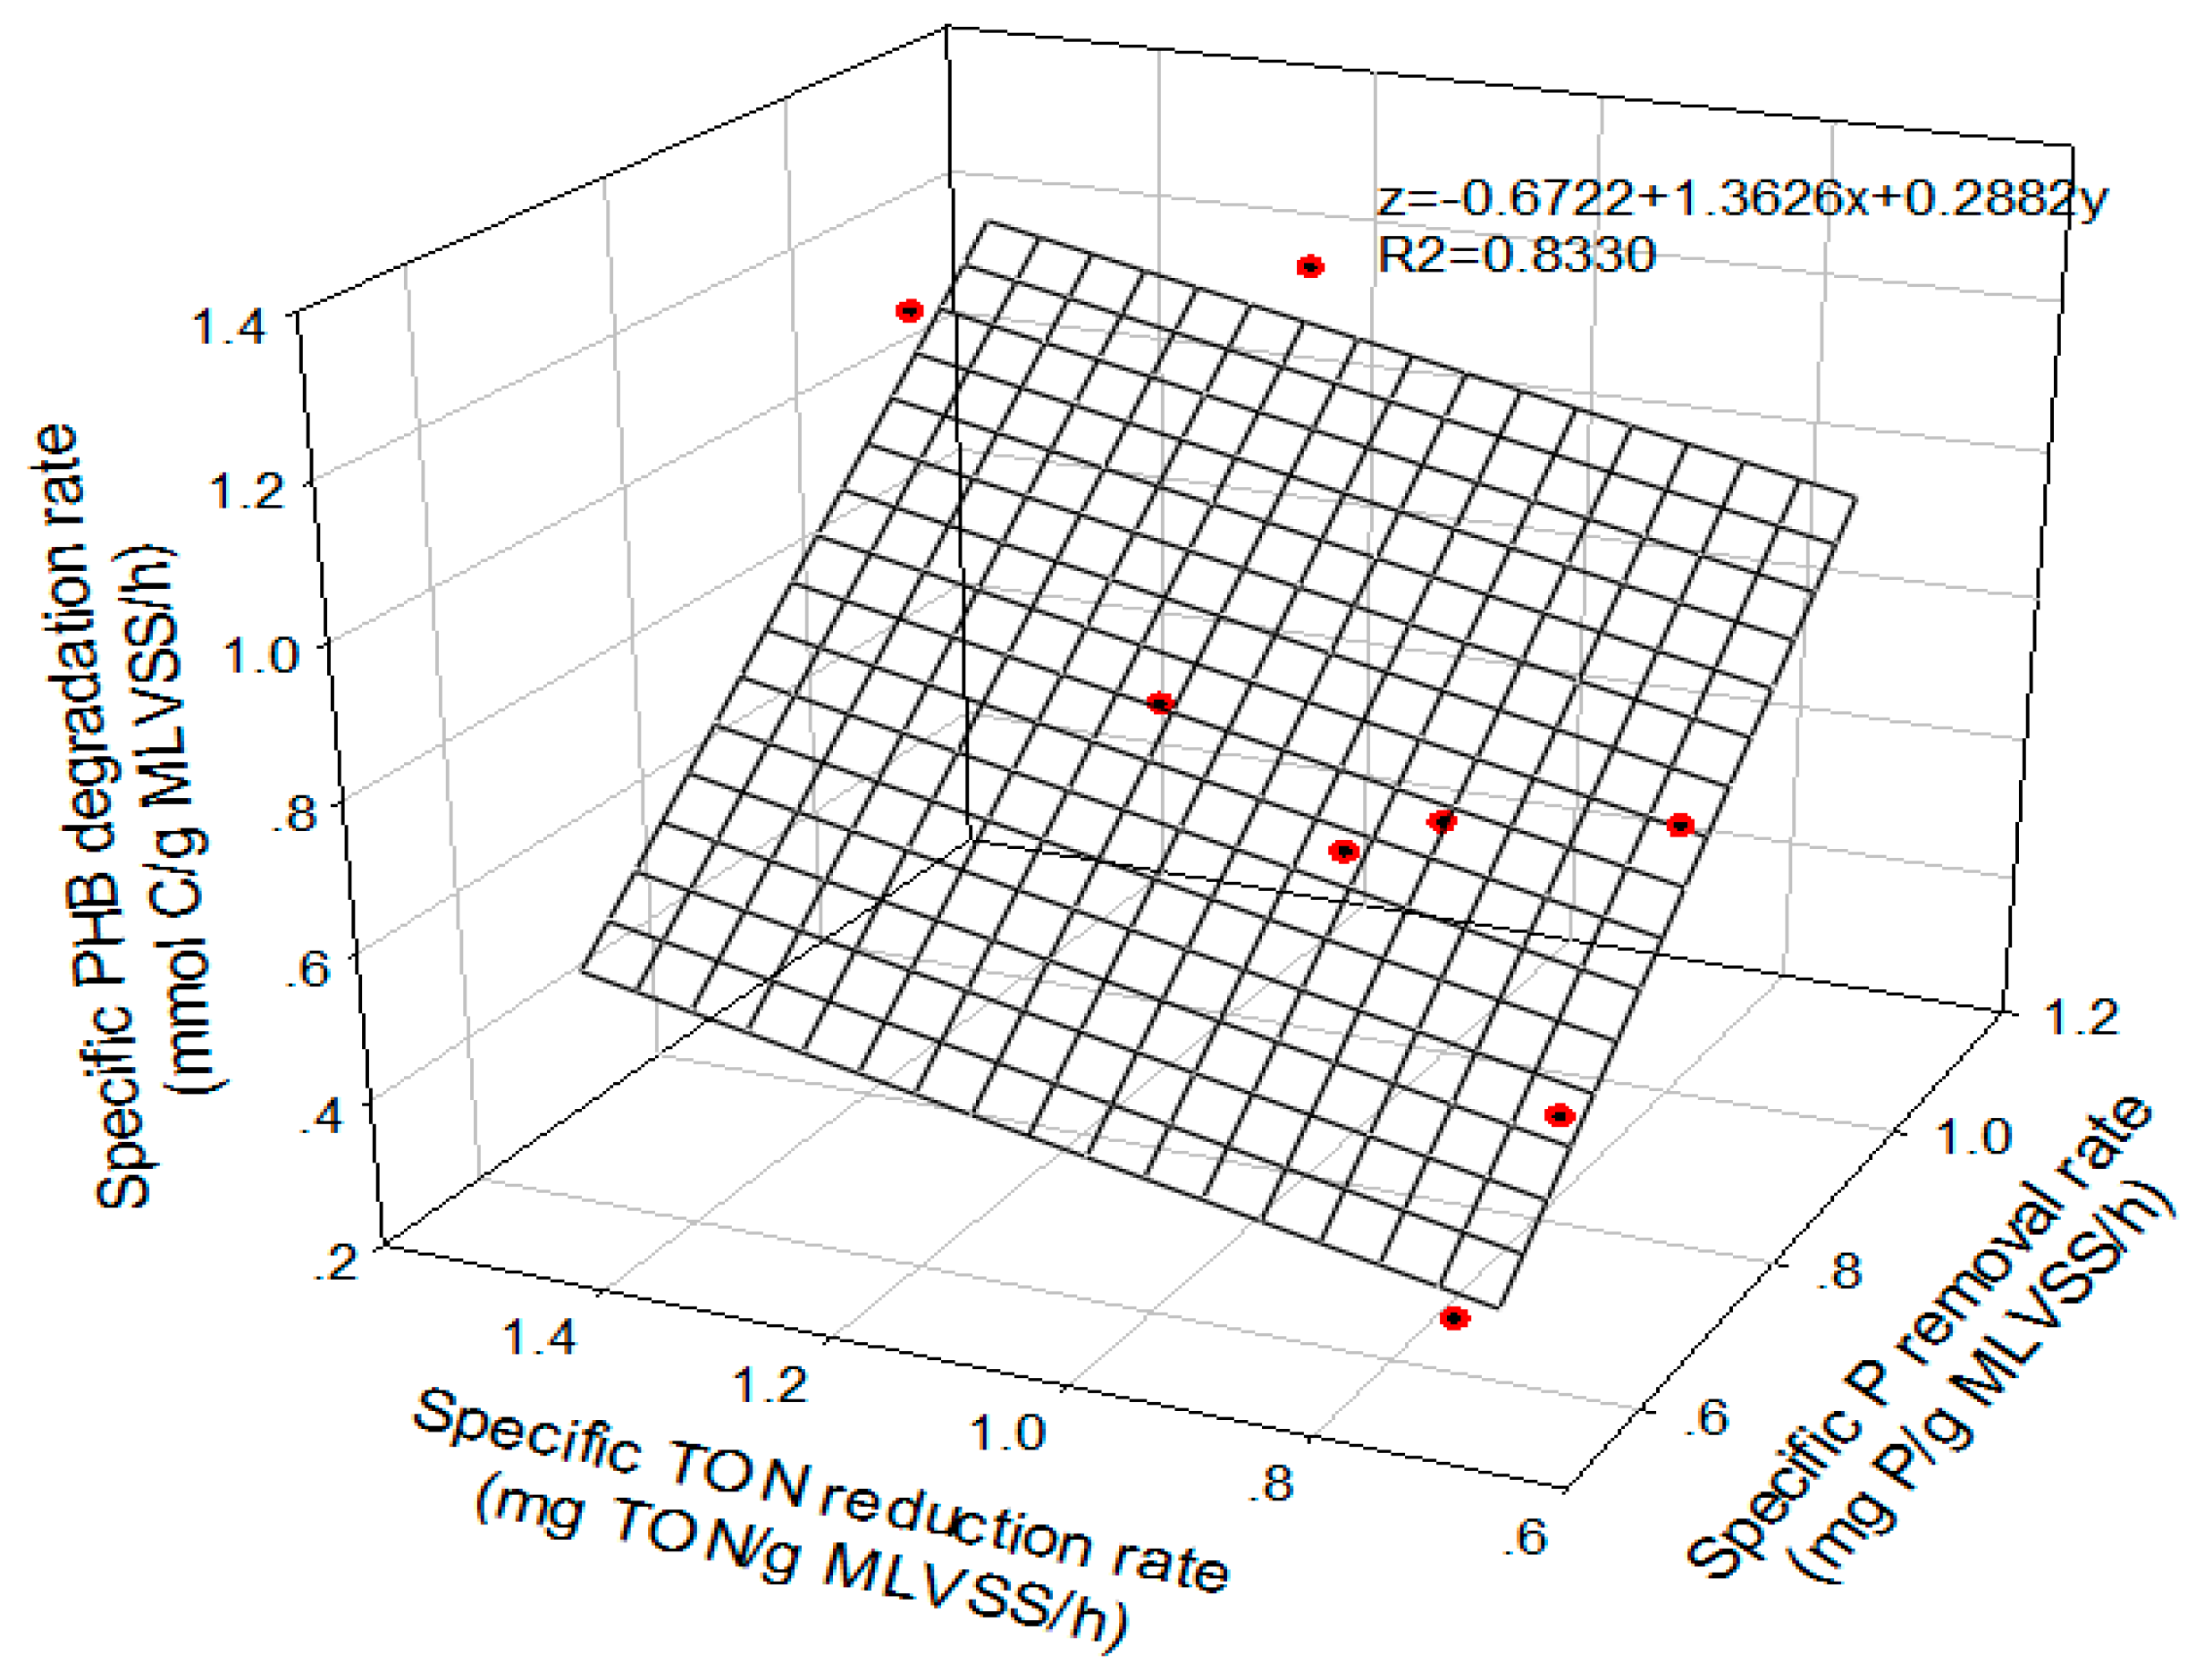
Because of the high TON reduction during the feeding period in the SBR cycle, more than 85% of incoming soluble COD was consumed in the first non-aeration period, whereas the intercellular carbon PHB increased significantly (Figure 4).In the three stages, after large amounts of PHB synthesis in the feast periods, the decreasing of the PHB can be observed in the subsequent aerobic/anoxic periods accompanied by COD depletion. The exception is that PHB slightly increased in the second non-aeration period at 0.4 L/min in Stage 1.Kapagiannidis et al. [26] stated that the biomass PHA content was strongly correlated with the P uptake rate and the ratio of PHA utilized (mol C):P uptake (mol P):N denitrified (mol N) was 1:0.61:0.6 when 50 mg/L COD (acetate) was employed. Meinhold et al. [27] found that the ratio of PHB utilized (mol C):P uptake (mol P):N denitrified (mol N) was approximately 1:2.5:5.26 when PHB was used as the only carbon source and it was 1:1.06:0.99 when 50 mg/L COD (acetate) was added. Similar results were obtained in the present study and the ratio of PHB utilized (mol C):P uptake (mol P):N denitrified (mol N) was approximately in a range of 1:0.51:0.4–1:1.12:1.02. The relationship between the specific PHB degradation rate (z), specific P removal rate (x), and specific TON reduction rate (y) can be fitted approximately as a plane (, R2 = 0.83) (Figure 5). Because PHB was utilized as an energy source for both DPR via NO2− and NO3− in the present study, further studiesare required on the PHB degradation rate in the DPR process via only NO2−.
4. Conclusions
Intermittent aeration pattern benefitted efficient N and P removal from denitrifying dephosphatation at a low temperature. Efficient partial nitrification was a crucial factor in achieving DPR via NO2−. The DPAOs adapted to a wide range of DO concentrations in the intermittent aeration pattern and the low DO concentration benefitted the activity of the DPAOs via NO2−.
Acknowledgments
This study was supported by the Scientific Research Foundation for Returned Overseas Chinese Scholars, the Natural Science Foundation of Fujian Province, China (2016J05140), Leading projects of science and technology in Fujian, China (2016H0039)and the Scientific Research Project of Xiamen Overseas Talents (201631402).
Author Contributions
Min Pan carried out the whole experiment, prepared the first edition of the manuscript and took charge of the whole framework of this work. Xiaoming Huang and Guangxue Wu contributed to the collection and analysis of the experiment data. Yan Yang, Yuansheng Hu and Xinmin Zhan contributed to the last revision of the manuscript.
Conflicts of Interest
The authors declare no conflict of interest.
References
- Chae, S.; Chung, J.; Heo, Y.; Kang, S.; Lee, S.; Shin, H. Full-scale implementation of a vertical membrane bioreactor for simultaneous removal of organic matter and nutrients from municipal wastewater. Water 2015, 7, 1164–1172. [Google Scholar] [CrossRef]
- Wang, Y.; Geng, J.; Ren, Z.; He, W.; Xing, M.; Wu, M.; Chen, S. Effect of anaerobic reaction time on denitrifying phosphorus removal and N2O production. Bioresour. Technol. 2011, 102, 5674–5684. [Google Scholar] [CrossRef] [PubMed]
- Wang, Z.; Meng, Y.; Fan, T.; Du, Y.; Tang, J.; Fan, S. Phosphorus removal and N2O production in anaerobic/anoxic denitrifying phosphorus removal process: Long-term impact of influent phosphorus concentration. Bioresour. Technol. 2015, 179, 585–594. [Google Scholar] [CrossRef] [PubMed]
- Zeng, W.; Li, L.; Yang, Y.; Wang, X.; Peng, Y. Denitrifying phosphorus removal and impact of nitrite accumulation on phosphorus removal in a continuous anaerobic-anoxic-aerobic (A2O) process treating domestic wastewater. Enzyme Microb. Technol. 2011, 48, 134–142. [Google Scholar] [CrossRef] [PubMed]
- Hu, J.Y.; Ong, S.L.; Ng, W.J.; Lu, F.; Fan, X.J. A new method for characterizing denitrifying phosphorus removal bacteria by using three different types of electron acceptors. Water Res. 2003, 37, 3463–3471. [Google Scholar] [CrossRef]
- Camejo, P.Y.; Owen, B.R.; Martirano, J.; Ma, J.; Kapoor, V.; Santodomingo, J.; McMahon, K.D.; Noguera, D.R. Candidatus Accumulibacter phosphatis clades enriched under cyclic anaerobic and microaerobic conditions simultaneously use different electron acceptors. Water Res. 2016, 102, 125–137. [Google Scholar] [CrossRef] [PubMed]
- Rubio-Rincón, F.J.; Lopez-Vazquez, C.M.; Welles, L.; van Loosdrecht, M.C.M.; Brdjanovic, D. Cooperation between Candidatus Competibacter and Candidatus Accumulibacter clade I, in denitrification and phosphate removal processes. Water Res. 2017, 120, 156–164. [Google Scholar] [CrossRef] [PubMed]
- Zhang, S.; Huang, Y.; Hua, Y. Denitrifying dephosphatation over nitrite: Effect of nitrite concentration, organic carbon, and pH. Bioresour. Technol. 2010, 101, 3870–3875. [Google Scholar] [CrossRef] [PubMed]
- Katsou, E.; Malamis, S.; Frison, N.; Fatone, F. Coupling the treatment of low strength anaerobic effluent with fermented biowaste for nutrient removal via nitrite. J. Environ. Manag. 2015, 149, 108–117. [Google Scholar] [CrossRef] [PubMed]
- Li, C.; Wang, T.; Zheng, N.; Zhang, J.; Ngo, H.H.; Guo, W.; Liang, S. Influence of organic shock loads on the production of N2O in denitrifying phosphorus removal process. Bioresour. Technol. 2013, 141, 160–166. [Google Scholar] [CrossRef] [PubMed]
- Zeng, W.; Wang, X.; Li, B.; Bai, X.; Peng, Y. Nitritation and denitrifying phosphorus removal via nitrite pathway from domestic wastewater in a continuous MUCT process. Bioresour. Technol. 2013, 143, 187–195. [Google Scholar] [CrossRef] [PubMed]
- Liu, Y.; Li, X.; Kang, X.; Yuan, Y. Performance of denitrifying phosphorus removal of Acinetobacteria strain at low temperature. Int. Biodeterior. Biodegrad. 2014, 95, 135–138. [Google Scholar] [CrossRef]
- Philips, S.; Laanbroek, H.J.; Verstraete, W. Origin, causes and effects of increased nitrite concentrations in aquatic environments. Rev. Environ. Sci. Biotechnol. 2002, 1, 115–141. [Google Scholar] [CrossRef]
- Pan, M.; Hu, Z.; Liu, R.; Zhan, X. Effects of loading rate and aeration on nitrogen removal and N2O emissions in intermittently aerated sequencing batch reactors treating slaughterhouse wastewater at 11 °C. Bioprocess Biosyst. Eng. 2015, 38, 681–689. [Google Scholar] [CrossRef] [PubMed]
- Pan, M.; Chen, T.; Hu, Z.; Zhan, X. Assessment of nitrogen and phosphorus removal in an intermittently aeration sequencing batch reactor (IASBR) and a sequencing batch reactor (SBR). Water Sci. Technol. 2013, 68, 400–405. [Google Scholar] [CrossRef] [PubMed]
- American Pubilc Health Association (APHA). Standard Methods for the Examination of Water and Wastewater; American Pubilc Health Association: Washington, DC, USA, 1995. [Google Scholar]
- Rodgers, M.; Wu, G. Production of polyhydroxbutyrate by activated sludge performing enhanced biological phosphorus removal. Bioresour. Technol. 2010, 101, 1049–1053. [Google Scholar] [CrossRef] [PubMed]
- Pan, M.; Henry, L.; Liu, R.; Huang, X.; Zhan, X. Nitrogen removal from slaughterhouse wastewater through partial nitrification followed by denitrification in intermittently aerated sequencing batch reactors at 11 °C. Environ. Technol. 2013, 35, 470–477. [Google Scholar] [CrossRef] [PubMed]
- Jeon, C.K.; Lee, D.S.; Park, J.M. Enhanced biological phosphorus removal in an anaerobic-aerobic sequencing batch reactor: Characteristics of carbon metabolism. Water Environ. Res. 2001, 73, 295–300. [Google Scholar] [CrossRef] [PubMed]
- Obaja, D.; Mace, S.; Costa, J.; Sans, C.; Mata-Alvarez, J. Nitrification, denitrification and biological phosphorus removal in piggery wastewater using a sequencing batch reactor. Bioresour. Technol. 2003, 87, 103–111. [Google Scholar] [CrossRef]
- Tsuneda, S.; Ohno, T.; Soejima, K.; Hirata, A. Simultaneous nitrogen and phosphorus removal using denitrifying phosphate-accumulating organisms in a sequencing batch reactor. Biochem. Eng. J. 2006, 27, 191–196. [Google Scholar] [CrossRef]
- Hu, Z.; Wentzel, M.C.; Ekama, G.A. Anoxic growth of phosphate-accumulating organic (PAOs) in biological nutrient removal activated sludge systems. Water Res. 2002, 36, 4927–4937. [Google Scholar] [CrossRef]
- Zhang, W.; Hou, F.; Peng, Y.; Liu, Q.; Wang, S. Optimizing aeration rate in an external nitrification-denitrifying phosphorus removal (ENDPR) system for domestic wastewater treatment. Chem. Eng. J. 2014, 245, 342–347. [Google Scholar] [CrossRef]
- Wang, X.; Wang, S.; Zhao, J.; Dai, X.; Li, B.; Peng, Y. A novel stoichiomentries methodology to quantify functional microorganisms in simultaneous (partial) nitrification-endogenous denitrification and phosphorus removal (SNEDPR). Water Res. 2016, 95, 319–329. [Google Scholar] [CrossRef] [PubMed]
- Xu, X.; Liu, G.; Zhu, L. Enhanced denitrifying phosphorous removal in a novel anaerobic/aerobic/anoxic (AOA) process with the diversion of internal carbon source. Bioresour. Tecnol. 2011, 102, 10340–10345. [Google Scholar] [CrossRef] [PubMed]
- Kapagiannidis, A.G.; Zafiriadis, I.; Aivasidis, A. Comparison between aerobic and anoxic metabolism of denitrifying-EBPR sludge: Effect of biomass poly-hydroxyalkanoates content. New Biotechnol. 2013, 30, 227–237. [Google Scholar] [CrossRef] [PubMed]
- Meinhold, J.; Filipe, C.D.M.; Daigger, G.T.; Isaacs, S. Characterization of the denitrifying fraction of phosphate accumulating organisms in biological phosphate removal. Water Sci. Technol. 1999, 39, 31–42. [Google Scholar]
Figure 1.
Laboratory-scaleintermittently aerated sequencing batch reactor (IASBR) configuration.

Figure 2.
Profiles of dissolved oxygen (DO) concentrations during a typical operational cycle. (A) Stage 1, (B) Stage 2, (C) Stage 3.
Figure 2.
Profiles of dissolved oxygen (DO) concentrations during a typical operational cycle. (A) Stage 1, (B) Stage 2, (C) Stage 3.

Figure 3.
Profiles of NH4+-N, NO2−-N, PO43—P and NO3−-N during a typical operational cycle.

Figure 4.
Profiles of poly-β-hydroxybutyrate (PHB) and COD concentrations during a typical operational cycle (■ variation of PHB, ∆ variation of COD).
Figure 4.
Profiles of poly-β-hydroxybutyrate (PHB) and COD concentrations during a typical operational cycle (■ variation of PHB, ∆ variation of COD).

Figure 5.
The correlation between specific PHB degradation rate, specific P removal rate and specific total oxidized nitrogen (TON) reduction rate in denitrifying phosphate removal (DPR).
Figure 5.
The correlation between specific PHB degradation rate, specific P removal rate and specific total oxidized nitrogen (TON) reduction rate in denitrifying phosphate removal (DPR).


Table 1.
Probes used in fluorescence in situ hybridization (FISH) analysis [16].
Table 1.
Probes used in fluorescence in situ hybridization (FISH) analysis [16].
| Probe | Sequence | Specificity | % Formamide |
|---|---|---|---|
| EUB338 | GCTGCCTCCCGTAGGAGT | General bacteria | 20 |
| PAO651 | CCCTCTGCCAAACTCCAG | Rhodocyclus-related PAOs | 35 |
Table 2.
Effluent characteristics in the three stages.
| Aeration Rate | SS (mg/L) | COD (mg/L) | TN (mg/L) | TP (mg/L) | |
|---|---|---|---|---|---|
| Stage 1 (0.61 gCOD/(L·d)) | 0.4 L/min | 21.3 ± 4.1 a | 133.8 ± 3.3 (97.8%) b | 45.6 ± 5.1 (92.1%) | 1.2 ± 0.1 (96.7%) |
| 0.6 L/min | 27.2 ± 5.5 | 115.2 ± 1.6 (98.1%) | 23.3 ± 0.7 (96%) | 1.3 ± 0.1 (96.4%) | |
| 0.8 L/min | 21.9 ± 4.5 | 110.3 ± 1.6 (98.3%) | 27 ± 2.1 (94.6%) | 13 ± 0.7 (64.3%) | |
| Stage 2 (0.82 gCOD/(L·d)) | 0.6 L/min | 34.4 ± 6.3 | 148.0 ± 1.8 (97.3%) | 44.2 ± 5.8 (91.6%) | 1.0 ± 0.1 (97.9%) |
| 0.8 L/min | 47.6 ± 5.5 | 134.7 ± 1.5 (97.5%) | 12.1 ± 0.8 (97.7%) | 1.0 ± 0.1 (97.9%) | |
| 1.2 L/min | 32.5 ± 4.6 | 122.2 ± 1.6(97.8%) | 26.4 ± 0.5 (94.9%) | 1.2 ± 0.8 (97.4%) | |
| Stage 3 (1.02 gCOD/(L·d)) | 0.8 L/min | 266 ± 25.7 | 158.0 ± 5.1 (97.0%) | 161.4 ± 4.5 (68.2%) | 22.4 ± 2.6 (55.9%) |
| 1.0 L/min | 10.3 ± 1.1 | 143.9 ± 0.8 (97.2%) | 88.4 ± 3.1 (82.6%) | 1.3 ± 0.1 (97.4%) | |
| 1.2 L/min | 37.7 ± 8.6 | 124.5 ± 1.0 (97.6%) | 31.8 ± 0.6 (93.7%) | 1.9 ± 0.1 (96.3%) |
Note: Discharge standard given by Irish EPA (2006): SS 60 mg/L; COD 125–250 or >75% removal; Total nitrogen (TN) 15–40 or >80% removal; Total phosphorus (TP) 2–5 or >80% removal. a Standard deviation. b Percentage removal.
Table 3.
Calculation of P removal respectively from enhanced biological phosphorus removal (EBPR) and denitrifying phosphate removal (DPR).
Table 3.
Calculation of P removal respectively from enhanced biological phosphorus removal (EBPR) and denitrifying phosphate removal (DPR).
| Stage | 1 | 2 | 3 | ||||||
|---|---|---|---|---|---|---|---|---|---|
| Aeration rate (L air/min) | 0.4 | 0.6 | 0.8 | 0.6 | 0.8 | 1.2 | 0.8 | 1.0 | 1.2 |
| PAOs population (% of total bacteria) | 9.2 ± 0.42 | 8.89 ± 0.52 | 2.43 ± 0.32 | 14.21 ± 1.14 | 13.24 ± 1.09 | 10.6 ± 1.22 | 2.22 ± 0.28 | 24.7 ± 1.39 | 15.38 ± 2.19 |
| P released amount in non-aerobic period (mg) | 257.84 | 113.48 | - | 276.13 | 141.85 | - | - | 423.31 | 181.19 |
| P uptake amount in aerobic period (mg) | 284.58 | 108.31 | - | 291.48 | 150.05 | - | - | 444.86 | 170.01 |
| The ratios of P uptake in aerobic period/P releasing in non-aerobic period | 1.10 | 0.95 | - | 1.06 | 1.06 | - | - | 1.05 | 0.94 |
| P removal amount via DPR (mg) | 20.41 | 34.05 | - | 26.97 | 22.60 | - | - | 36.70 | 59.41 |
| The amount of TON reduced via DPR (mg) | 21.11 | 49.28 | - | 28.53 | 28.94 | - | - | 40.23 | 72.03 |
| The amount of NO2−-N reduced via DPR (mg) | 14.96 | 33.45 | - | 21.44 | 19.23 | - | - | 39.55 | 48.56 |
| The amount of NO3−-N reduced via DPR (mg) | 6.15 | 15.93 | 7.09 | 9.71 | 0.68 | 23.47 | |||
| The ratio of TON denitrified/ P removed in via DPR | 1.03 | 1.30 | - | 1.06 | 1.28 | - | - | 1.10 | 1.21 |
| The ratio of DPR via nitrite/DPR via nitrate (μ) | 2.43 | 2.11 | - | 3.02 | 1.98 | - | - | 58.17 | 2.07 |
| 9% | 36.72% | - | 10.17% | 11.37% | - | - | 10.18% | 28.95% | |
| DPAOs population (%) | 0.83 | 3.26 | - | 1.45 | 1.51 | - | - | 2.51 | 4.45 |
| Population of DPAOs via nitrite (%) | 0.59 | 2.12 | - | 1.09 | 1.00 | - | - | 2.56 | 3.00 |
© 2017 by the authors. Licensee MDPI, Basel, Switzerland. This article is an open access article distributed under the terms and conditions of the Creative Commons Attribution (CC BY) license (http://creativecommons.org/licenses/by/4.0/).
Share and Cite
MDPI and ACS Style
Pan, M.; Huang, X.; Wu, G.; Hu, Y.; Yang, Y.; Zhan, X. Performance of Denitrifying Phosphate Removal via Nitrite from Slaughterhouse Wastewater Treatment at Low Temperature. Water 2017, 9, 818. https://doi.org/10.3390/w9110818
AMA Style
Pan M, Huang X, Wu G, Hu Y, Yang Y, Zhan X. Performance of Denitrifying Phosphate Removal via Nitrite from Slaughterhouse Wastewater Treatment at Low Temperature. Water. 2017; 9(11):818. https://doi.org/10.3390/w9110818
Chicago/Turabian StylePan, Min, Xiaoming Huang, Guangxue Wu, Yuansheng Hu, Yan Yang, and Xinmin Zhan. 2017. "Performance of Denitrifying Phosphate Removal via Nitrite from Slaughterhouse Wastewater Treatment at Low Temperature" Water 9, no. 11: 818. https://doi.org/10.3390/w9110818
Note that from the first issue of 2016, this journal uses article numbers instead of page numbers. See further details here.