Article

Single Session of Chiseling Tillage for Soil and Vegetation Restoration in Severely Degraded Shrublands

1
Dead Sea and Arava Science Center, Yotvata 88820, Israel
2
Israel Nature and Parks Authority, Southern District, Beer Sheva 84215, Israel
3
Dead Sea and Arava Science Center, Microbial Metagenomics Division, Masada 86900, Israel
4
Department of Geography and Environmental Development, Ben-Gurion University of the Negev, Beer Sheva 84105, Israel
*
Author to whom correspondence should be addressed.
Water 2018, 10(6), 755; https://doi.org/10.3390/w10060755
Submission received: 10 May 2018 / Revised: 4 June 2018 / Accepted: 7 June 2018 / Published: 9 June 2018
(This article belongs to the Special Issue Ecohydrology of Woodlands and Savannas)

Abstract

:
While tillage of agricultural lands has been used extensively, its utilization for restoring degraded semi-natural lands is rare. This study was conducted in the arid southern Israel in a shrubland which has faced severe degradation processes over time, including soil erosion and compaction, and negation of vegetation recovery. In 2014, research plots were established for assessing the impact of a single chiseling session on the ecosystem’s restoration capacity. The study treatments included deep chiseling (35 cm), shallow chiseling (20 cm), and control (no-tillage). Data on spontaneously-established vegetation was collected one, two, and three years after the plots’ establishment, and soil data was collected once—three years after the plots’ establishment. Assessments of the vegetation parameters revealed a general similarity between the two chiseling treatments, which were generally better than those of the no-till plots. The soil properties revealed generally greater soil quality under the two chiseling treatments than that under the control plots, and a somewhat better soil quality for the deep chiseling than that for the shallow chiseling. Overall, results of this study show that in severely degraded lands, self-restoration processes are hindered, negating the effectiveness of passive restoration practices, and necessitating active intervention practices to stimulate restoration processes.

1. Introduction

Among other factors, soil compaction in open, semi-natural lands is widely acknowledged as imposed by anthropogenic activities. Specifically, anthropogenic traffic, by either pedestrians, bicycles and motorcycles, or off-road vehicles [1], increases the soil compaction, resulting in adverse impact on the soil structure, aggregation, aeration, hydraulic conductivity [2], and microbial biomass and activity [3]. Such soils are mostly compactable under wet to moist conditions, where friction among its particles decreases, allowing them to slide over each other and easing the deformation of the soil structure [4].
Semi-natural lands that have become degraded often undergo passive restoration measures, aimed at halting disturbances and restoring some of the natural functions and ecosystem services. Among these measures, the fencing of the target lands for negating the access of livestock or human is most common. Despite necessitating a relatively long timeframe for recovery [5], such passive strategies could effectively restore degraded lands, allowing self-restoration processes to take place, resulting in the improvement of soil conditions and increase in net primary productivity over time.
At the same time, and despite necessitating relatively shorter time for recovery, active restoration strategies of semi-natural or abandoned lands are less common. This is partially attributed to the comparatively higher costs involved in such intervention procedures [6]. An example is the planting of mixed trees in degraded lands, which was reported to effectively recover the functioning of ecosystem services [5,6]. Another example for an active restoration scheme was reported for Poland, where inversion tillage of a degraded land was conducted for mitigating anthropogenic disturbances, aimed at allowing the establishment of semi-natural grasslands [7]. At the same time, the use of tillage for restoring severely-degraded shrublands is not so common. Yet, such a strategy might be necessary in events where the target lands have been prone to extreme degradation. Specifically, such a management practice might be particularly relevant for drylands, where the limited access to water negates the re-establishment of vegetation and hinders self-restoration processes.
Compared to conventional plow tillage, chiseling plow has two main advantages: (i) loosening of compacted layers while not smashing and crumbling the soil; and (ii) negating the inversion of soil horizons, thereby minimizing disturbance of pedogenesis. The moderate impact of chiseling on pedogenic processes has been realized by several studies. For example, in croplands in south-western Brazil, chiseling was reported to decrease soil compaction in the 10–20 cm depth layer compared to that under no-till [8]. Also, a recent study in croplands in the US state of North Dakota, showed that compared to no-till, chiseling decreased the soil organic carbon pool in the 0–15 cm depth only, while not affecting it in the deeper depths [9]. Regardless, similar to other tillage means, heavy compaction of soil is expected in chiseled croplands with recurring traffic by agricultural machinery, negating the agro-technical advantages of this—comparatively reduced-intensity tillage method.
This study was conducted at the extremely degraded plateau of Sde Zin, which is located in the arid central Negev of Israel. In the early 1970s, the site was proclaimed a national park. Yet, ongoing, intensive traffic by pedestrian and off-road vehicles until 2007 led to severe degradation processes, defined by the extreme compaction of its soil, erosional processes, and negation of vegetation growth. Therefore, in 2014, research plots were established, aimed at assessing the impact of a single chiseling session—to either shallow or deep depths—on the restoration capacity of this degraded shrubland. Parameters of spontaneously-established vegetation were studied after one, two, and three years following the establishment of the plots, and the soil properties were studied three years after the establishment of the plots. The study’s main hypothesis was that the single chiseling session alleviates the soil compaction, improving its hydraulic features and easing re-establishment of vegetation. The secondary hypothesis was that due to the severe compaction and degradation of the soil, shallow chiseling has been capable only of moderately restoring the geo-ecosystem, while deep chiseling resulted in a more pronounced restoration.

2. Materials and Methods

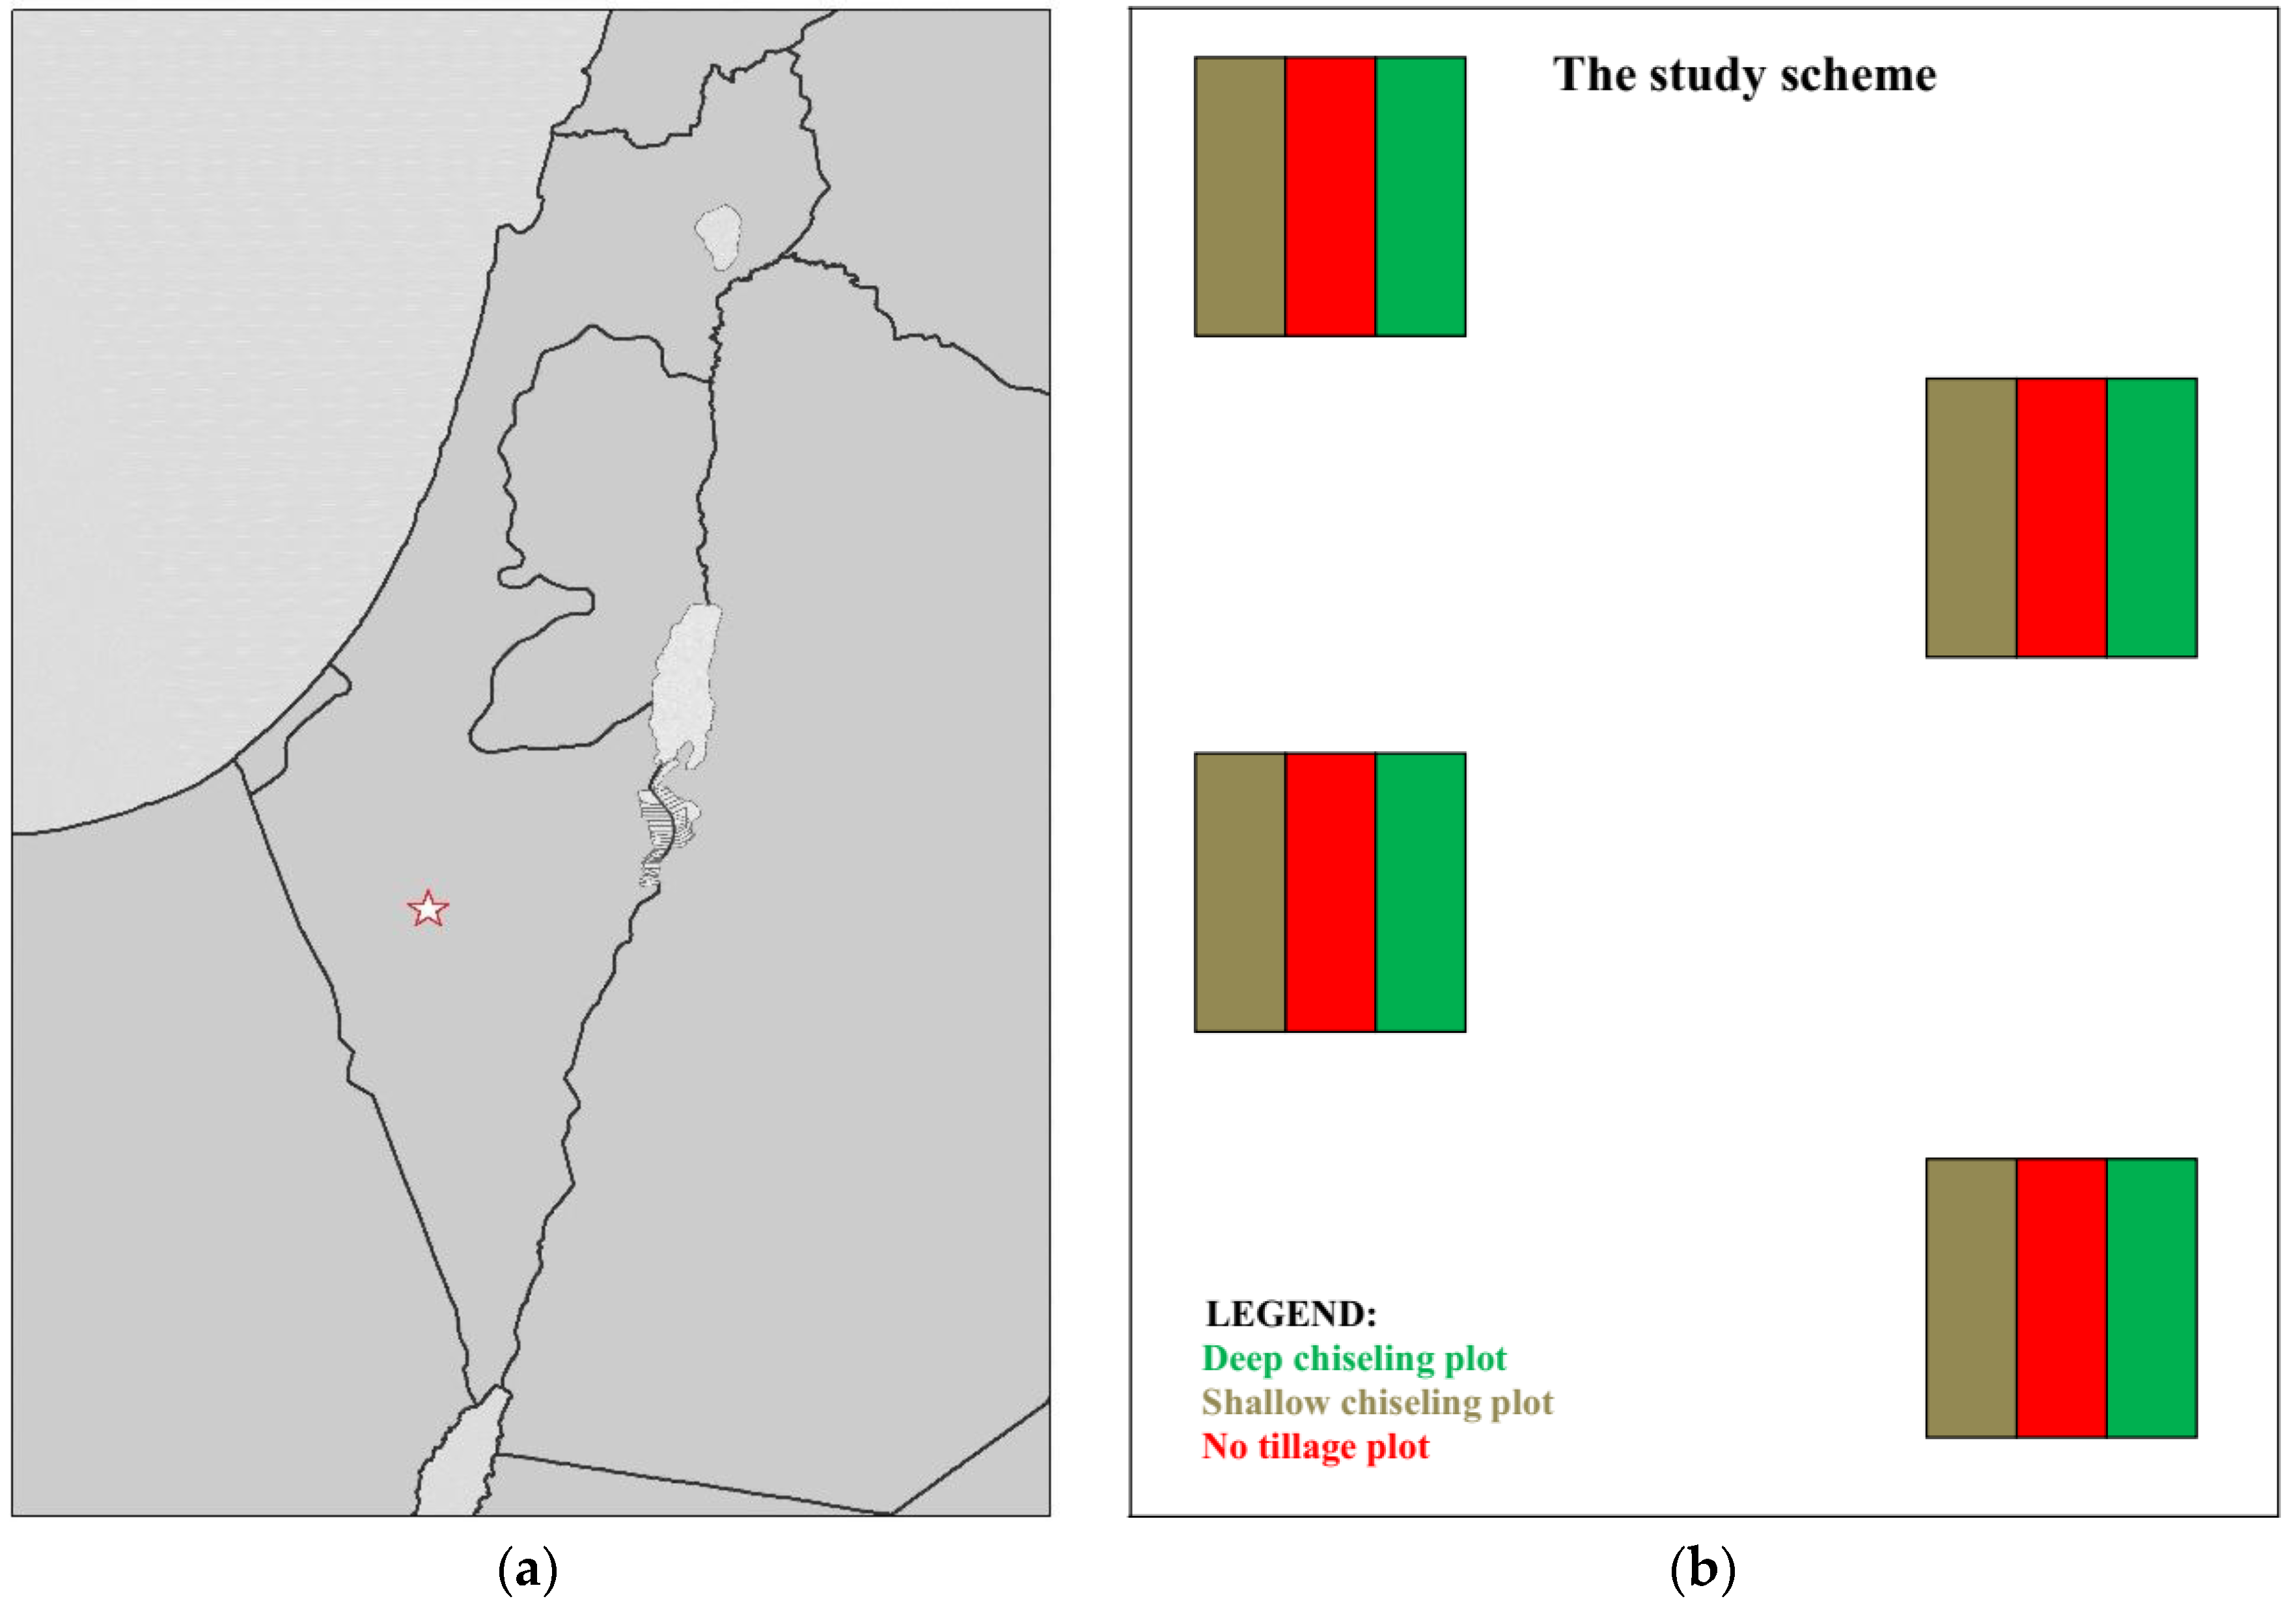
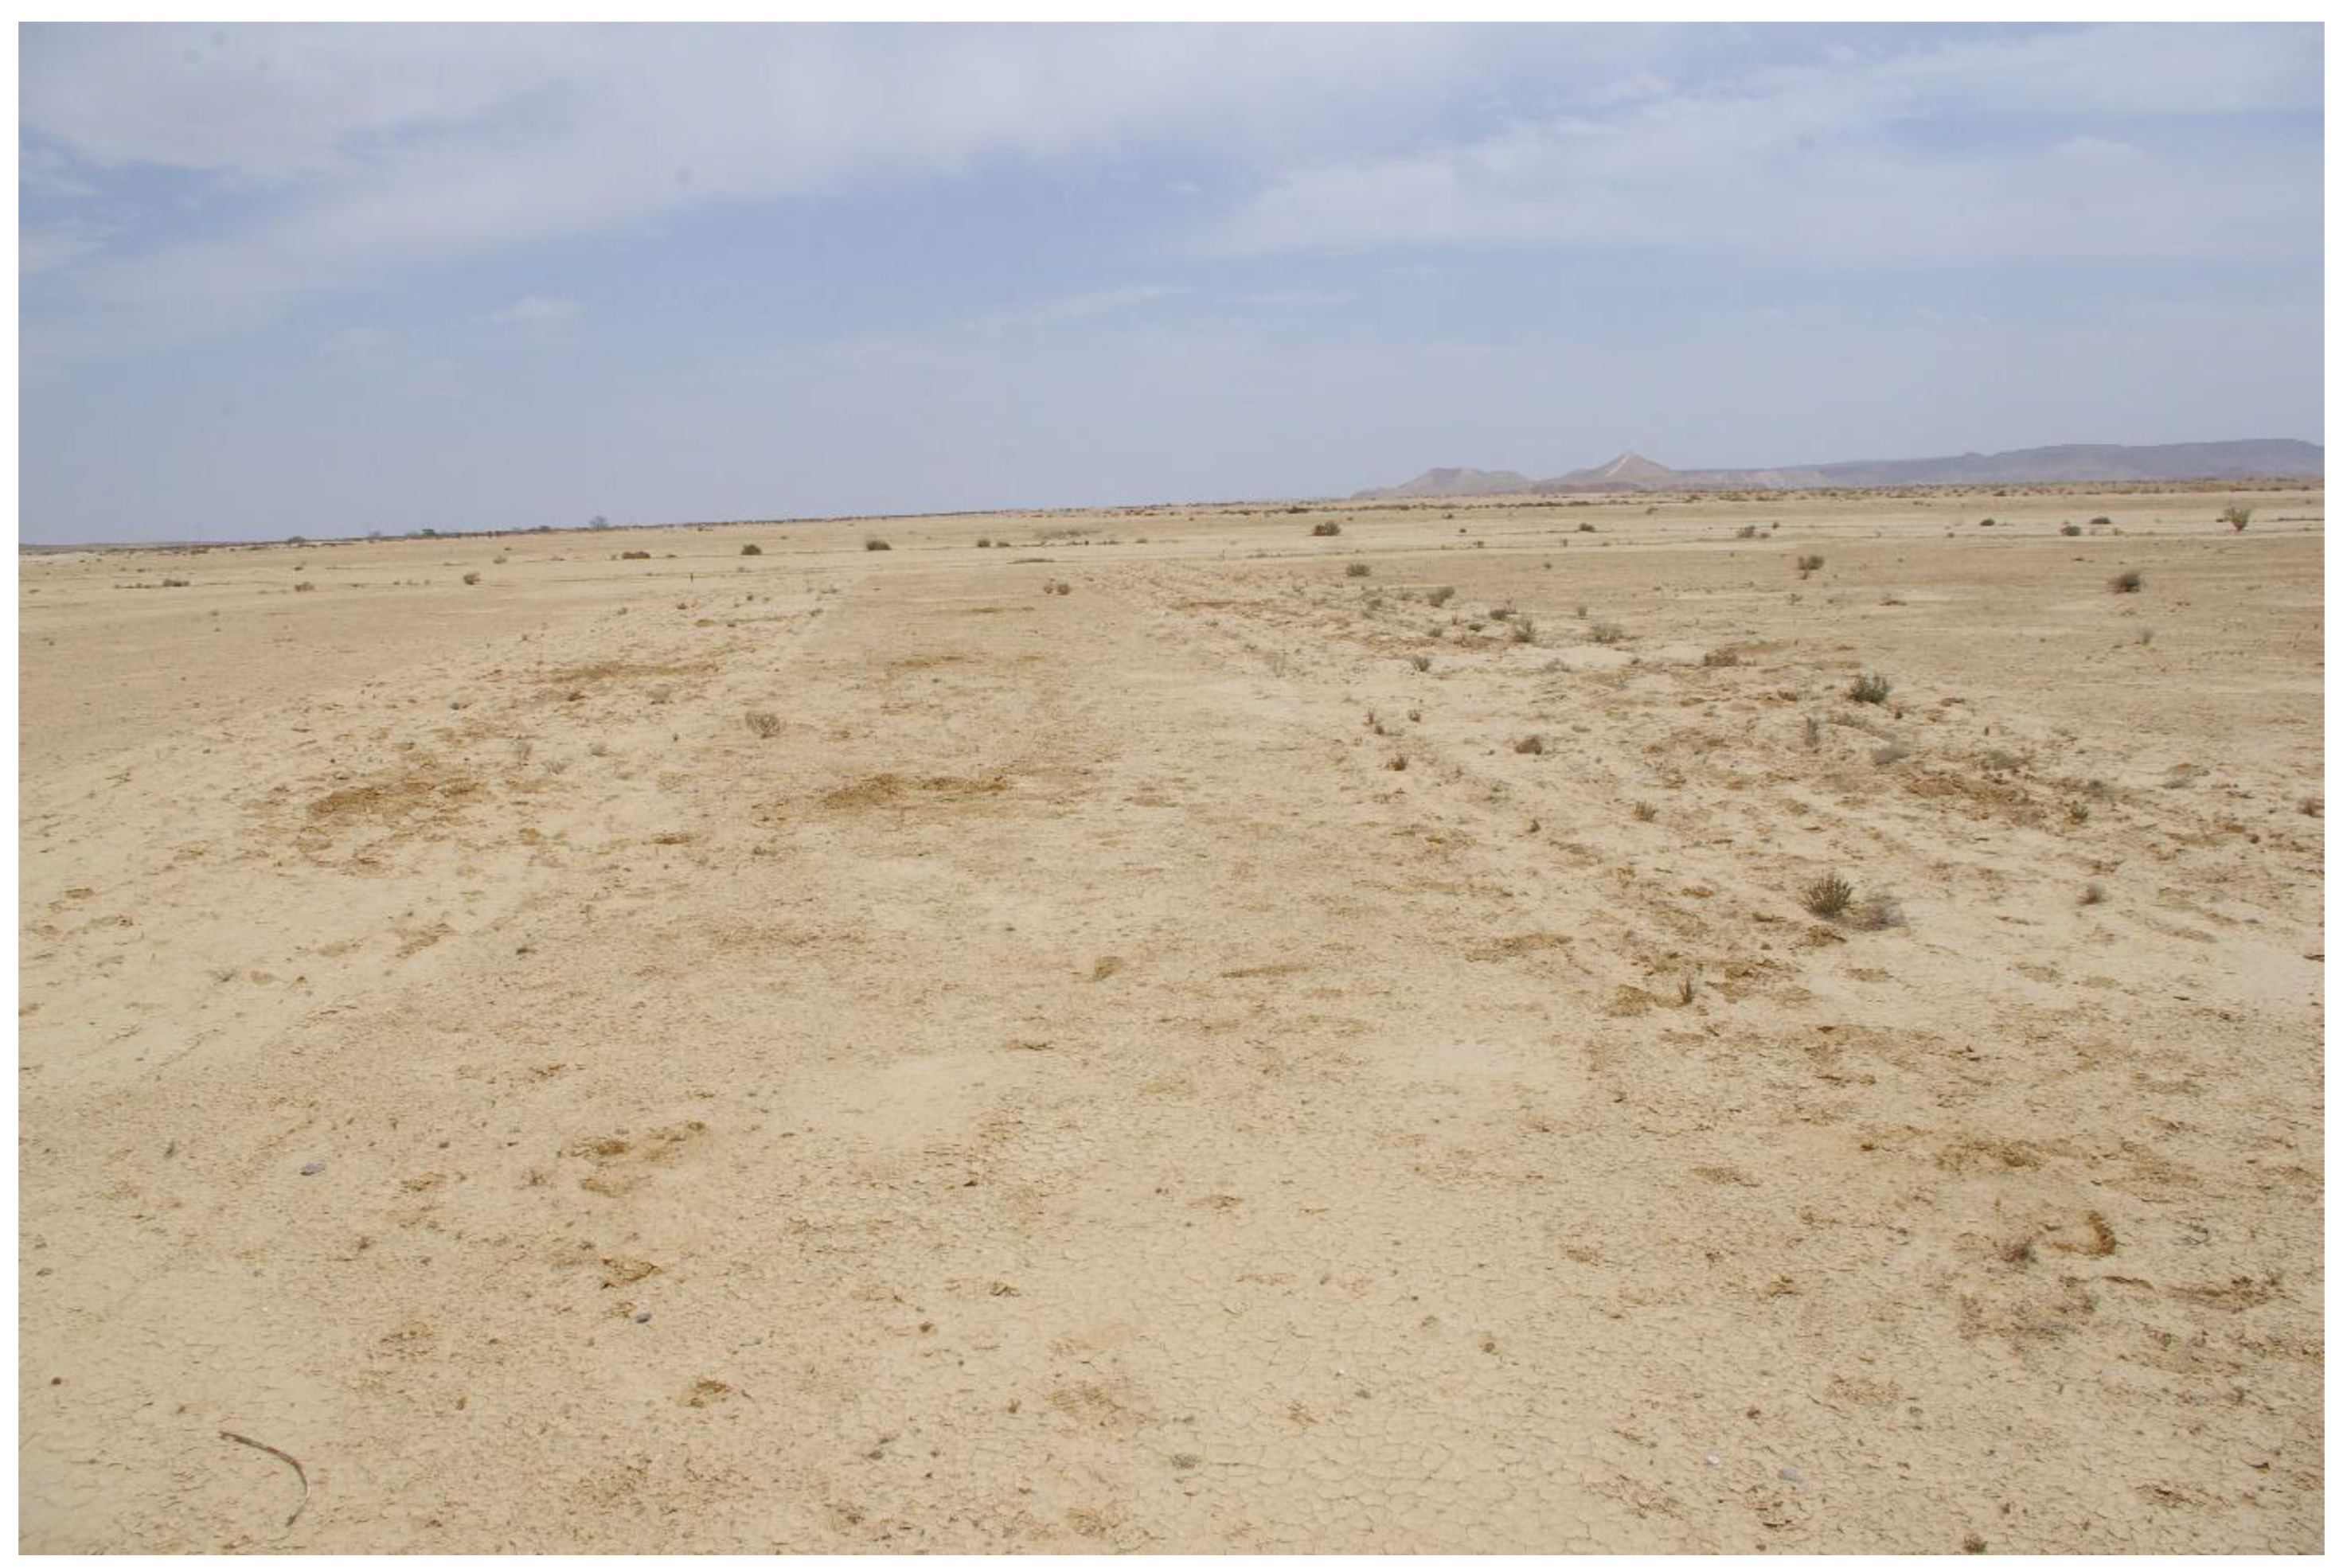
2.1. Regional Settings

The study was conducted in Sde Zin (30° 86′ N, 34° 79′ E, 475 m above sea level: Figure 1a), which covers a plateau of ~10 km2, sprawling between the Zin Valley to the east and Halukim Ridge to the west. Climate of the region is arid, with cold winters and mildish-hot summers. Mean daily temperature ranges between 9 °C in January and 24 °C in July. Mean daily relative air humidity ranges between 68% and 54%, respectively [10]. Mean annual cumulative precipitation is 93 mm, with a high inter-annual variability [11]. Lithology is comprised of the Dead Sea Group’s conglomerate and loess of the Pleistocene [12], and the soil is classified as Calcic Xerosol [13].
Due to its being a tourist attraction, over decades the site has been prone to heavy traffic by pedestrians, bicycles, motorcycles, and off-road vehicles, leading to considerable degradation processes, including extreme soil compaction, severe erosional processes, and negation of vegetation recovery. In 1971—alongside with extensive lands across the region—a part of the Sde Zin was proclaimed as the Gan Ha’Psalim National Park. Yet, the heavy traffic has proceeded, negating processes of self-restoration of the ecosystem. In 2007, the site was legally registered as a national park, allowing for better control of traffic. Means to control this traffic have included guidance, inspection, on-site signposting, and non-consecutive placement of boulders along the main dirt-roads which transect the site.
Data on precipitation throughout the study years (2015–2017) were obtained from the Sde Boqer meteorological station, which is located at a distance of approximately 1 km from the study site. The recorded annual cumulative precipitation was 125 mm, 87 mm, and 53 mm in the rainy seasons of 2014/15, 2015/16, and 2016/17, respectively.

2.2. The Study Design, Soil Sampling, and Analysis

The research plots were established in spring 2014 (under dry soil conditions), at a site that has been included in the national park. The study design encompassed four blocks, each containing three plots, of which one plot pertains to each of the following treatments: (1) one session of deep chiseling to a depth of 35 cm; (2) one session of shallow chiseling to a depth of 20 cm; and (3) control (Figure 1b and Appendix A). The aerial cover of each plot was 180 m2 (30 m length × 6 m width). The minimal distance between each two adjunct blocks was 50 m [14,15].
Assessment of spontaneously-established vegetation was conducted one, two, and three years after the establishment of the plots, i.e., at the peak of the 2015, 2016, and 2017 growing seasons (spring). The vegetation data was collected from three 1 × 1 m randomly selected sub-plots per plot. The collected data included cover percentage of annual and perennial species (for 2015 and 2017 only), and number of annual and perennial species (for each of the years of 2015, 2016, and 2017). Also, the data was utilized for calculating the species richness, Shannon’s diversity index, and Fisher’s alpha parameter.
On-site measurements and sampling of soil were conducted in spring 2017, three years after the establishment of the plots. In each plot, measurements of ground surface roughness were conducted by the chain method in three randomly selected spots. This measurement is based on the principle that when a chain of given length (L1) is placed on a surface, the horizontal distance between the chain edges (L2) will decrease as the roughness increases [16]. The surface roughness (in %) was calculated according to the equation: 1 − (L2/L1). Then, measurements of the soil penetration resistance (using a dynamic penetrometer: [17]) and sampling of soil were conducted at the same three spots and at two depths, of 0–5 cm and 20–25 cm. Soil sampling included an undisturbed 100-mL (5 cm height × 5 cm diameter) core, and a 300-mL bag of disturbed soil, both of which were obtained from each spot and depth.
The soil core samples were studied for bulk density (the core method: [18]), and field capacity (by using a sand-kaolin box: Eijkelkamp©, Giesbeek, The Netherlands). The disturbed soil samples were studied for permanent wilting point (by using a pressure-membrane apparatus: Eijkelkamp©, The Netherlands). Subtracting the values obtained for permanent wilting point from those obtained for field capacity enabled the calculation of available water capacity. The disturbed soil samples were also studied for texture (by the hydrometer method: [19]), gravimetric moisture content (by oven-drying at 105 °C for 24 hr: [20]), calcium carbonate content (by using a calcimeter: [21]), and total organic matter content (by the dry combustion method [22], after fumigation with diluted hydrochloric acid [23]. The results were then divided by 1.724 to calculate the total organic carbon concentration).
For bacterial relative abundance, an additional set of soil samples was collected in sterile 50 mL tubes, kept on ice upon collection, and stored in −80°C for eight hours for DNA extraction. Before DNA extraction, soil was cleaned from the plant root, floral and faunal materials, and stones, and then homogenized. Later, 0.6 g of soil was subjected to DNA extraction by using DNeasy PowerSoil HTP 96 Kit (Qiagen©, Hilden, Germany). Upon extraction, the 16S ribosomeal DNA (rDNA) resembling of bacterial abundance was performed in triplicates on the 7500 Real time PCR (Applied Biosystems© Foster City, CA, USA), by using SYBR Green quantitative polymerase chain reaction (qPCR) as following: 5 µL of DNA template, 10 µL of PerfeCta SYBR Green FastMix, Low ROX (Quanta BioSciences© Beverly, MA, USA), 2 µL of 250 nM of forward F341 (5′-CCT ACG GGA GGC AGC AG-3′) and reverse R519 (5′-GWA TTA CCG CKG CTG-3′) primers [24], and 3 µL PCR-free molecular grade water (Sigma©, Rehovot, Israel) as per the manufacture protocol (Quanta BioSciences©). The soil samples’ 16S rDNA standard was used to quantify the number of fragments [24].
Yearly number of vegetation sub-plots (n) was 4 blocks × 3 treatment plots × 3 sub-plots = 36. Number of soil samples (n) was 4 blocks × 3 treatment plots × 3 spots × 2 depths = 72.

2.3. Statistical Analysis

To evaluate the effect of treatment on the various soil characteristics, we used Linear Mixed Effects models. The fixed effects were treatment type, depth, and their interaction. An exceptional to that was the surface roughness, which was measured only at the ground surface, and therefore the model for its analysis included only the fixed effect of treatment. The random effect was block identity. Models were fitted using function ‘lme’ from package ‘nlme’ [25] in R [26].

3. Results and Discussion

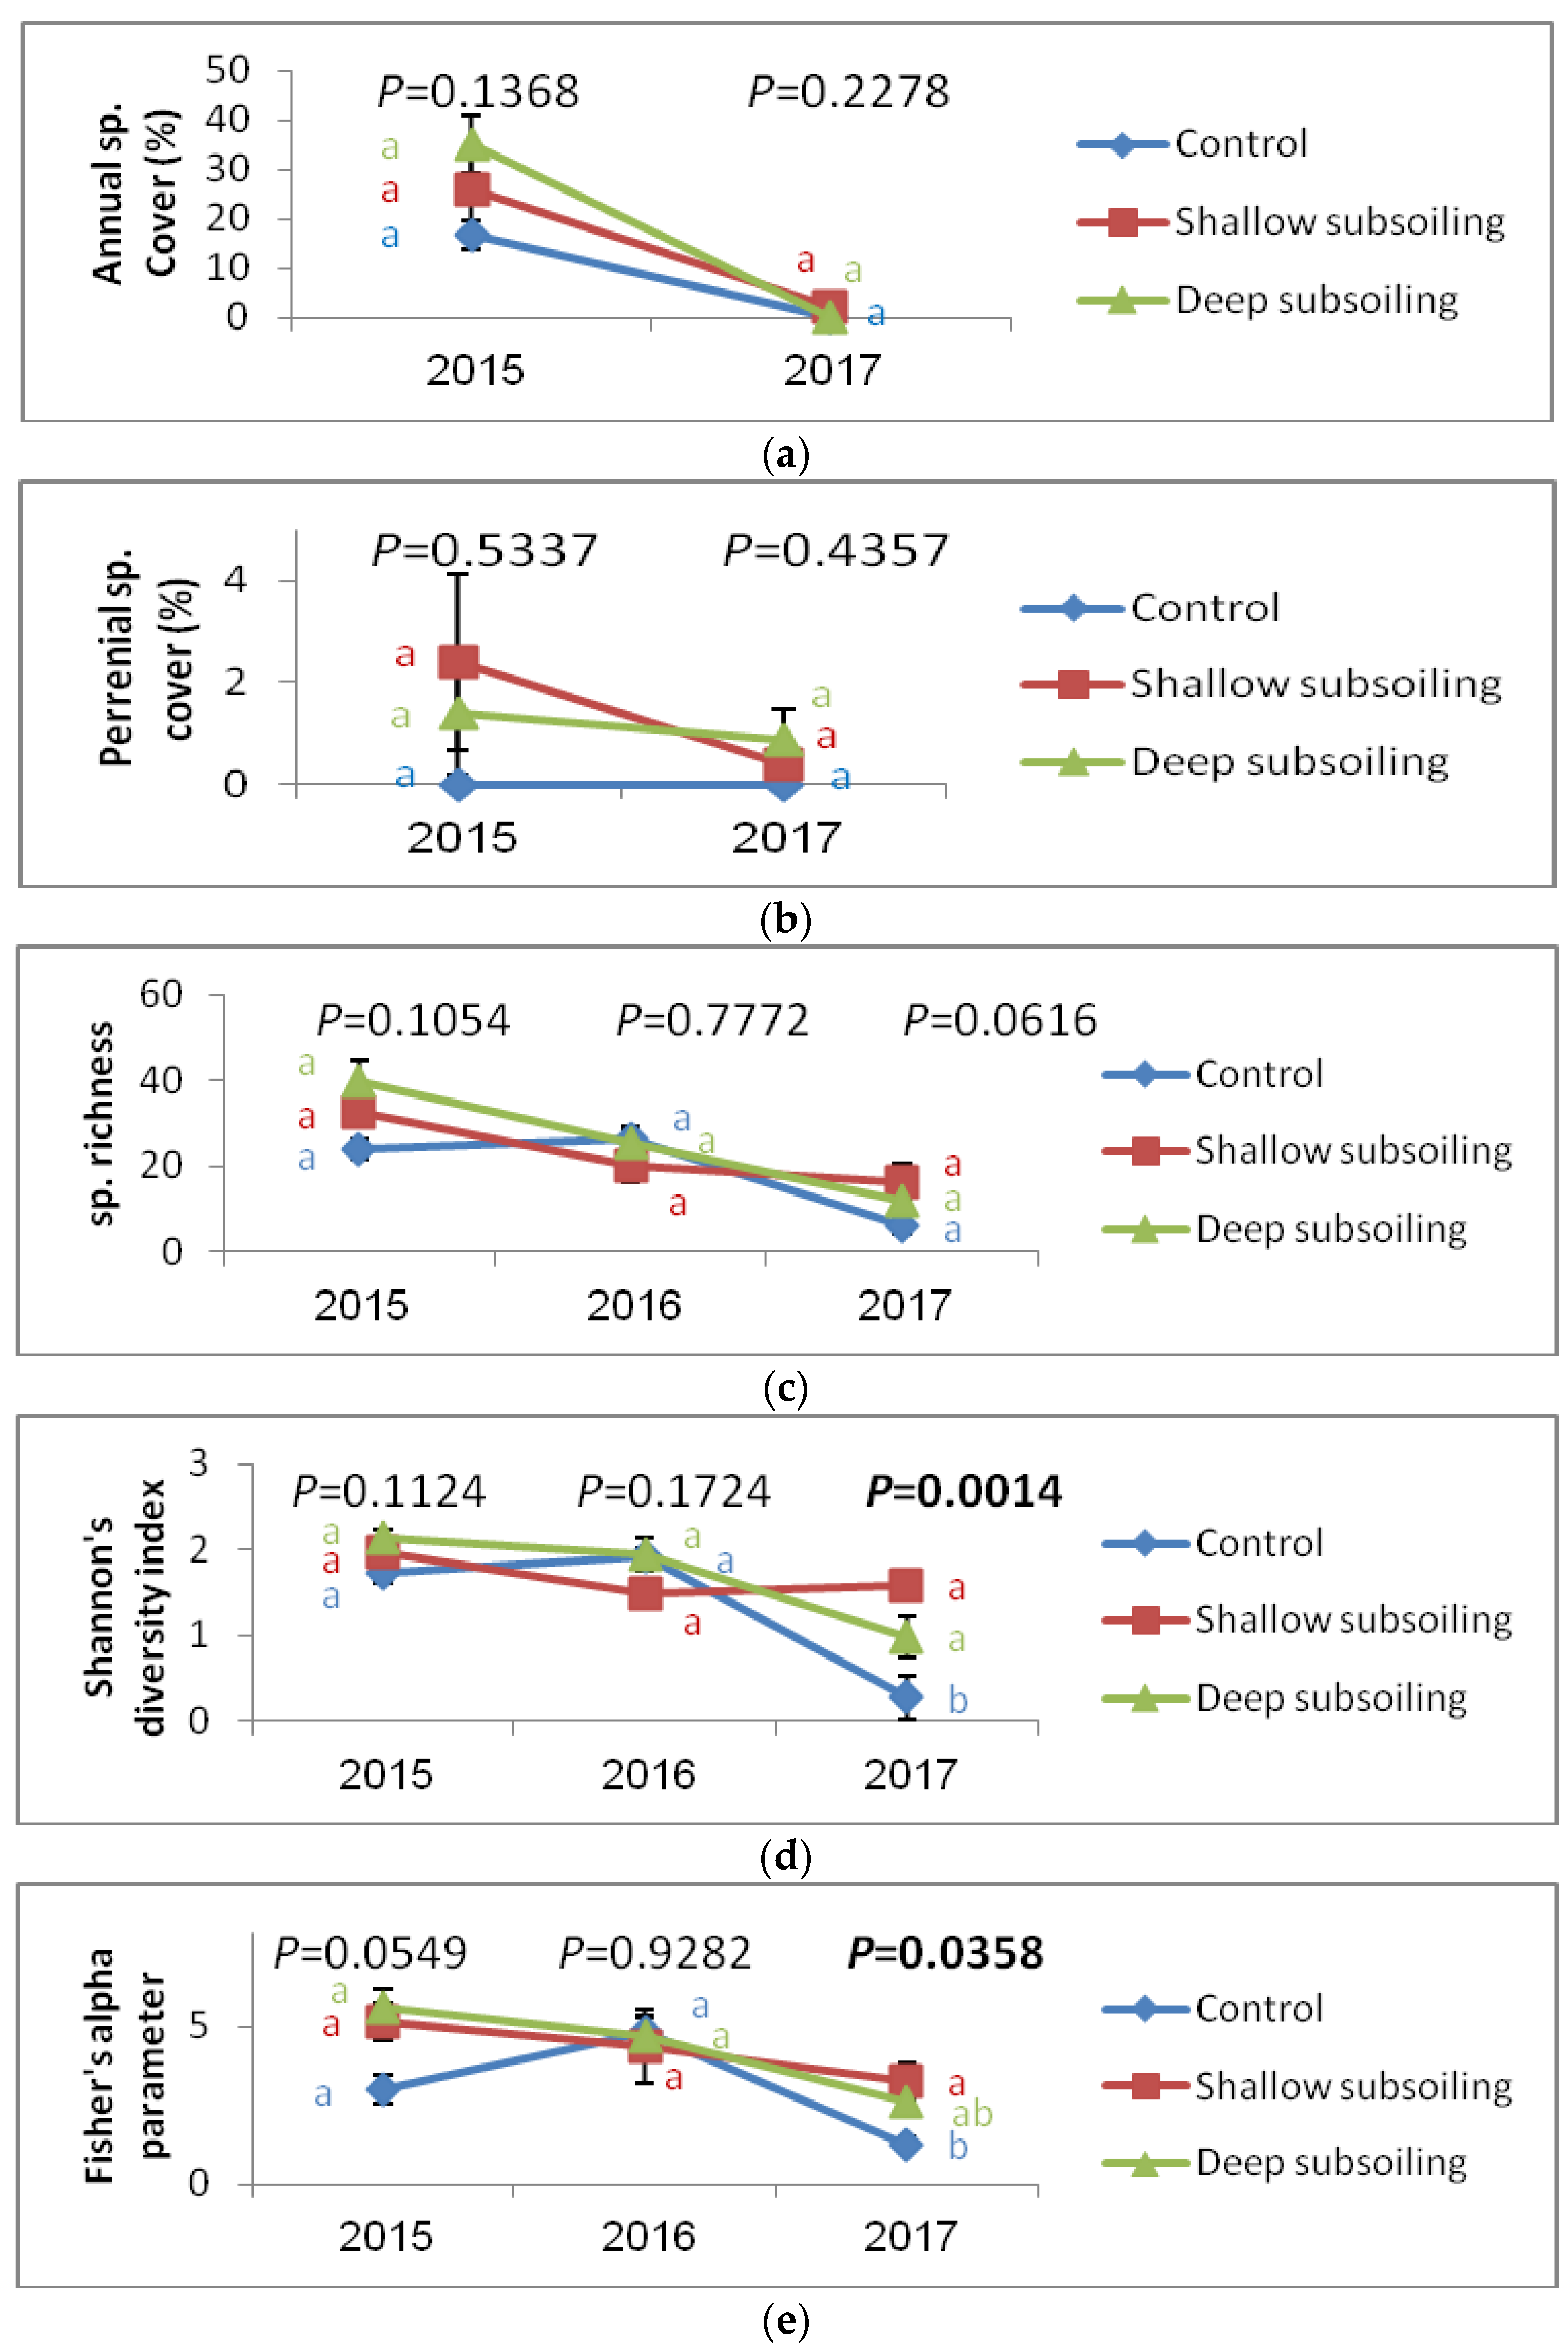
3.1. Above-Ground Processes

Visually, in the studied plots, two main signs indicated the effect of the treatment. The first was the roughness of the ground surface, which was clearly greater under the two chiseling treatments than that under the control plots. This is consistent with the results obtained for the chain method, revealing significant and approximately tenfold greater mean roughness of the ground surface under each of the chiseling treatments than that under the control plots (Table 1). This accords with the general conception of the ground surface roughness being positively affected by tillage. Also, tillage-induced roughness has been acknowledged as having the capacity to control surface processes, with the increased on-site retention of water and hindering of overland flow [27]. Mean ground surface roughness in the deep chiseling plots was significantly and over 30% greater than that in the shallow chiseling plots (Table 1). In addition to the impact on surface processes, these microtopographic-induced changes are expected, over time, to boost patch-scale geodiversity [28], with the resultant increased heterogeneity in microhabitat conditions [29], and greater vegetation species diversity [30].
Visual indications for surface processes of water runoff and soil erosion were observed across the study site, beyond the research plots. These included extensive areas with smooth surfaces, indicating sheet-flow erosion, as well as the sporadic occurrence of rills, which indicate concentrated erosion. Surface processes are known to cause size-sorting of soil particles, with the generally easier and faster redistribution (sorting out) of the smaller-sized fractions [31]. However, the soil texture was not affected by treatment, with similar contents of sand (33.1 ± 1.1%), silt (49.6 ± 3.3%), and clay (17.3 ± 2.8%) among the three study treatments. This could be attributed to the relatively short time-span between the establishment of plots and sampling. Nor was the texture affected by the soil depth, having a loamy texture throughout the profile.
The second visual sign was the spontaneously-established vegetation cover, which existed under the two chiseling treatments to a much greater extent than that under the control plots. It is suggested that in addition to hindering water overland flow, and thereby increasing its on-site infiltration, the chiseling-induced ground surface roughness also eases the trapping of plant seeds, which become ready for on-site germination. To some extent, this accords with previous studies which highlighted the positive impact of surface roughness on trapping of seeds transported by water [32] or wind [33].
The visual indications of vegetation cover were consistent with the data analysis, which revealed somewhat (but not significantly) greater mean cover percentage of annuals (Figure 2a) and perennials (Figure 2b) under the two chiseling treatments than that under the control plots. For the annual species, this was more noticeable for 2015, where the mean cover was ~50% to twofold greater under the chiseling treatments than that under the control plots. For the perennial species,
This was noticeable for both of the years of 2015 and 2017, with the zero cover under the control plots. Overall, the differences for the vegetation cover percentage among the three treatments in 2017 were rather small. This is attributed to the extremely dry rainy season in 2016/17, with the cumulative rainfall of only 57% of the inter-annual average. Regardless, the differences for these variables between the two chiseling treatments were inconsistent.
Similar to the trend for vegetation cover, the shallow and deep chiseling treatments faced a decreasing trend throughout the three-year study period for each of the means of species richness (Figure 2c), Shannon’s diversity index (Figure 2d, despite a minor exception for the shallow chiseling treatment in 2017), and Fisher’s alpha parameter (Figure 2e). At the same time, the control plots faced—for each of these variables—a slight increase between 2015 and 2016, and then a sharp decrease between 2016 and 2017. However, mostly, the treatment effect on means of these variables was not significant. The only exceptions were recorded for the Shannon’s diversity index in 2017, where means under the two chiseling treatments were significantly greater than those under the control plots; and for the Fisher’s alpha parameter, where mean under the shallow chiseling treatment was significantly greater than that under the control plots (and the deep chiseling treatment taking place between them). For each of the last three parameters, means under the deep chiseling treatment were slightly greater than those under the shallow chiseling treatment in 2015 and 2016, while an opposite state was recorded for 2017. This suggests a slight advantage for the deep chiseling treatment under a high-to-normal precipitation regime, and a slight advantage for the shallow chiseling treatment under an extremely low precipitation regime. However, a much longer period of study is needed to verify this observation.
Data on the recorded vegetation species, according to year and treatment are detailed in Appendix B.

3.2. Below-Ground Processes

The main goals of tillage are breaking the mechanical crust cover, loosening soil compaction, increasing soil aeration, and reducing the ground surface penetration resistance [8,34,35]. However, many studies have revealed that compared to no-till systems, conventional tillage causes undesired, opposite impacts, resulting in the deformation of soil structure [36], and increasing bulk density and penetration resistance [37]. Yet, compared to regular agricultural lands, where the largest part of soil compaction is attributed to recurring agricultural machinery traffic [38,39], the relatively slight soil compaction in the tillage plots in our study could be attributed to the scant-to-absence of any type of traffic after the single chiseling session. This is exemplified by the significant and three-quarters smaller mean penetration resistance and 12–15% smaller mean bulk density of soils under the chiseling treatments than that under the control plots (Table 1).
Therefore, assuming homogenous particle density (ρp of 2.65 Mg m−3: [40]), the calculated, significantly greater total porosity under the deep and shallow chiseling treatments than that under the control plots is expected to allow much better aeration of soil. Bulk density and total porosity were not significantly different between the two chiseling treatments, and their means were 4% smaller and 3% greater, respectively, under the deep chiseling plots than those under the shallow chiseling plots (Table 1). The strongly negative and significant (r = −0.57; P < 0.0001) correlation between the ground surface roughness and bulk density, further emphasizes the treatment-induced physical quality of soil, which follows the order of deep chiseling > shallow chiseling > no-tillage.
Also, the smaller the compaction of soil is, the better its hydraulic properties [41]. In our study, this was indicated by the 65–70% greater mean gravimetric soil moisture content under the two chiseling treatments than that under the control plots (Table 1). However, this effect was not significant. Despite not being available for vegetation uptake, the determined hygroscopic-level moisture of soil still indicates its physical quality [42], revealing better soil conditions under the two chiseling treatments than those under the control plots. This was further verified by the strongly positive and significant (r = 0.69; P < 0.0001) correlation between gravimetric moisture content and available water capacity. Further, though not being significantly affected by treatment, the mean available water capacity under the two chiseling treatments was 26–35% greater than that under the control plots. Also, despite that these variables were not significantly different between the two chiseling treatments, the means of gravimetric moisture content and available water capacity were 9% and 7% greater, respectively, under the deep chiseling plots than those under the shallow chiseling plots (Table 1).
In spite of these positive impacts of the single chiseling session on the soil physical quality, it significantly and negatively affected the soil organic carbon concentration. Mean of this variable was 7% and 22% greater under the control plots than that under the deep and shallow chiseling treatments, respectively (Table 1). This negative effect on soil organic carbon is attributed to the increased aeration provided by tillage action, with the expected stimulation of microbial activity, and the resultant greater rates of soil organic carbon decomposition [43]. These effects are consistent with the mean bacterial relative abundance, which was significantly and 3.5 and 2.1 times greater under the deep and shallow chiseling treatments, respectively, than that under the control plots (Table 1).
Actually, the bacterial relative abundance was the only soil feature which was significantly different between the two chiseling treatments. Mean of this variable was 69% greater under the deep than that under the shallow chiseling treatment (Table 1), highlighting the better biological quality of soil under the former than that under the latter. Also, this effect suggests that compared to the remainder of the soil properties, the microbial activity is the most sensitive to tillage. This consists with previous studies, which highlighted the comparatively high sensitivity of microbial biomass and activity to tillage practices [44,45,46]. Also, the strongly positive and significant (r = 0.76; P < 0.0001) correlation between ground surface roughness and bacterial relative abundance, emphasizes the high sensitivity of the latter to the tillage-induced, above-ground changes.
Despite not being significantly affected by treatment, the soil organic carbon stratification ratio, was balanced (~1) for the deep chiseling treatment, and negative (<1) for the shallow chiseling treatment. Regardless, the negative soil organic carbon stratification ratio in the control plots (Table 1) highlights their severe state of soil degradation, with the absence of a characterizing the A horizon at the ground surface (see: [47]).
The soil calcium carbonate content was relatively high across the study site, and not significantly affected by treatment (Table 1). It seems that this is related to the short time span between the establishment of plots and sampling. It is expected that over a longer time span, the better hydraulic properties of soil under the tillage treatments will increase the leaching of calcium carbonate from the tilled layer. One way or another, the restriction of soil microbial activity [48] and reduction of plant-available macronutrients [49] by high contents of calcium carbonate, seem to retard restoration processes under the three studied treatments. To some extent, this could explain the relatively sparse vegetation cover (even) in the chiseling plots.
Unexpectedly, the effect of soil depth was small and non-significant for a large part of the studied variables. This could be attributed to the severe disturbance of ground surface, caused by the combined effect of the extreme compaction and erosional processes, negating ‘normal’ pedogenic processes of horizonation. An exception to that is the mean penetration resistance, which was significantly and 25% greater in the deeper depth than that in the shallower depth. At the same time, the mean gravimetric moisture content, though not being significantly affected by depth, was twofold greater at the deeper depth, than that at the shallower depth. This effect is attributed to the greater evaporation rates at the ground surface than those at the subsoil layers [50]. Regardless, the bacterial relative abundance was significantly and approximately one order of magnitude greater in the shallower depth than that in the deeper depth, indicating the considerably better biological quality at the former (Table 2).
The effect of the interaction between treatment and depth was significant for some of the soil properties. This included the gravimetric moisture content, which had significantly higher means under each of the deep chiseling × deeper depth and shallow chiseling × deeper depth, than those under the remainder of the combinations of treatment and depth. A similar effect of this interaction was recorded for the available water capacity, with the deep chiseling × shallower depth being midway between the combinations of deep chiseling × deeper depth and shallow chiseling × deeper depth above it, and the remainder of the combinations of treatment and depth below it. This interaction was also significant for the bacterial relative abundance, which followed the trend of deep chiseling × shallower depth > shallow chiseling × shallower depth > the remainder of the combinations of treatment and depth (Table 3). To some extent, this interaction demonstrates the overall positive relations between the physical and biotic properties, which determine the soil quality.

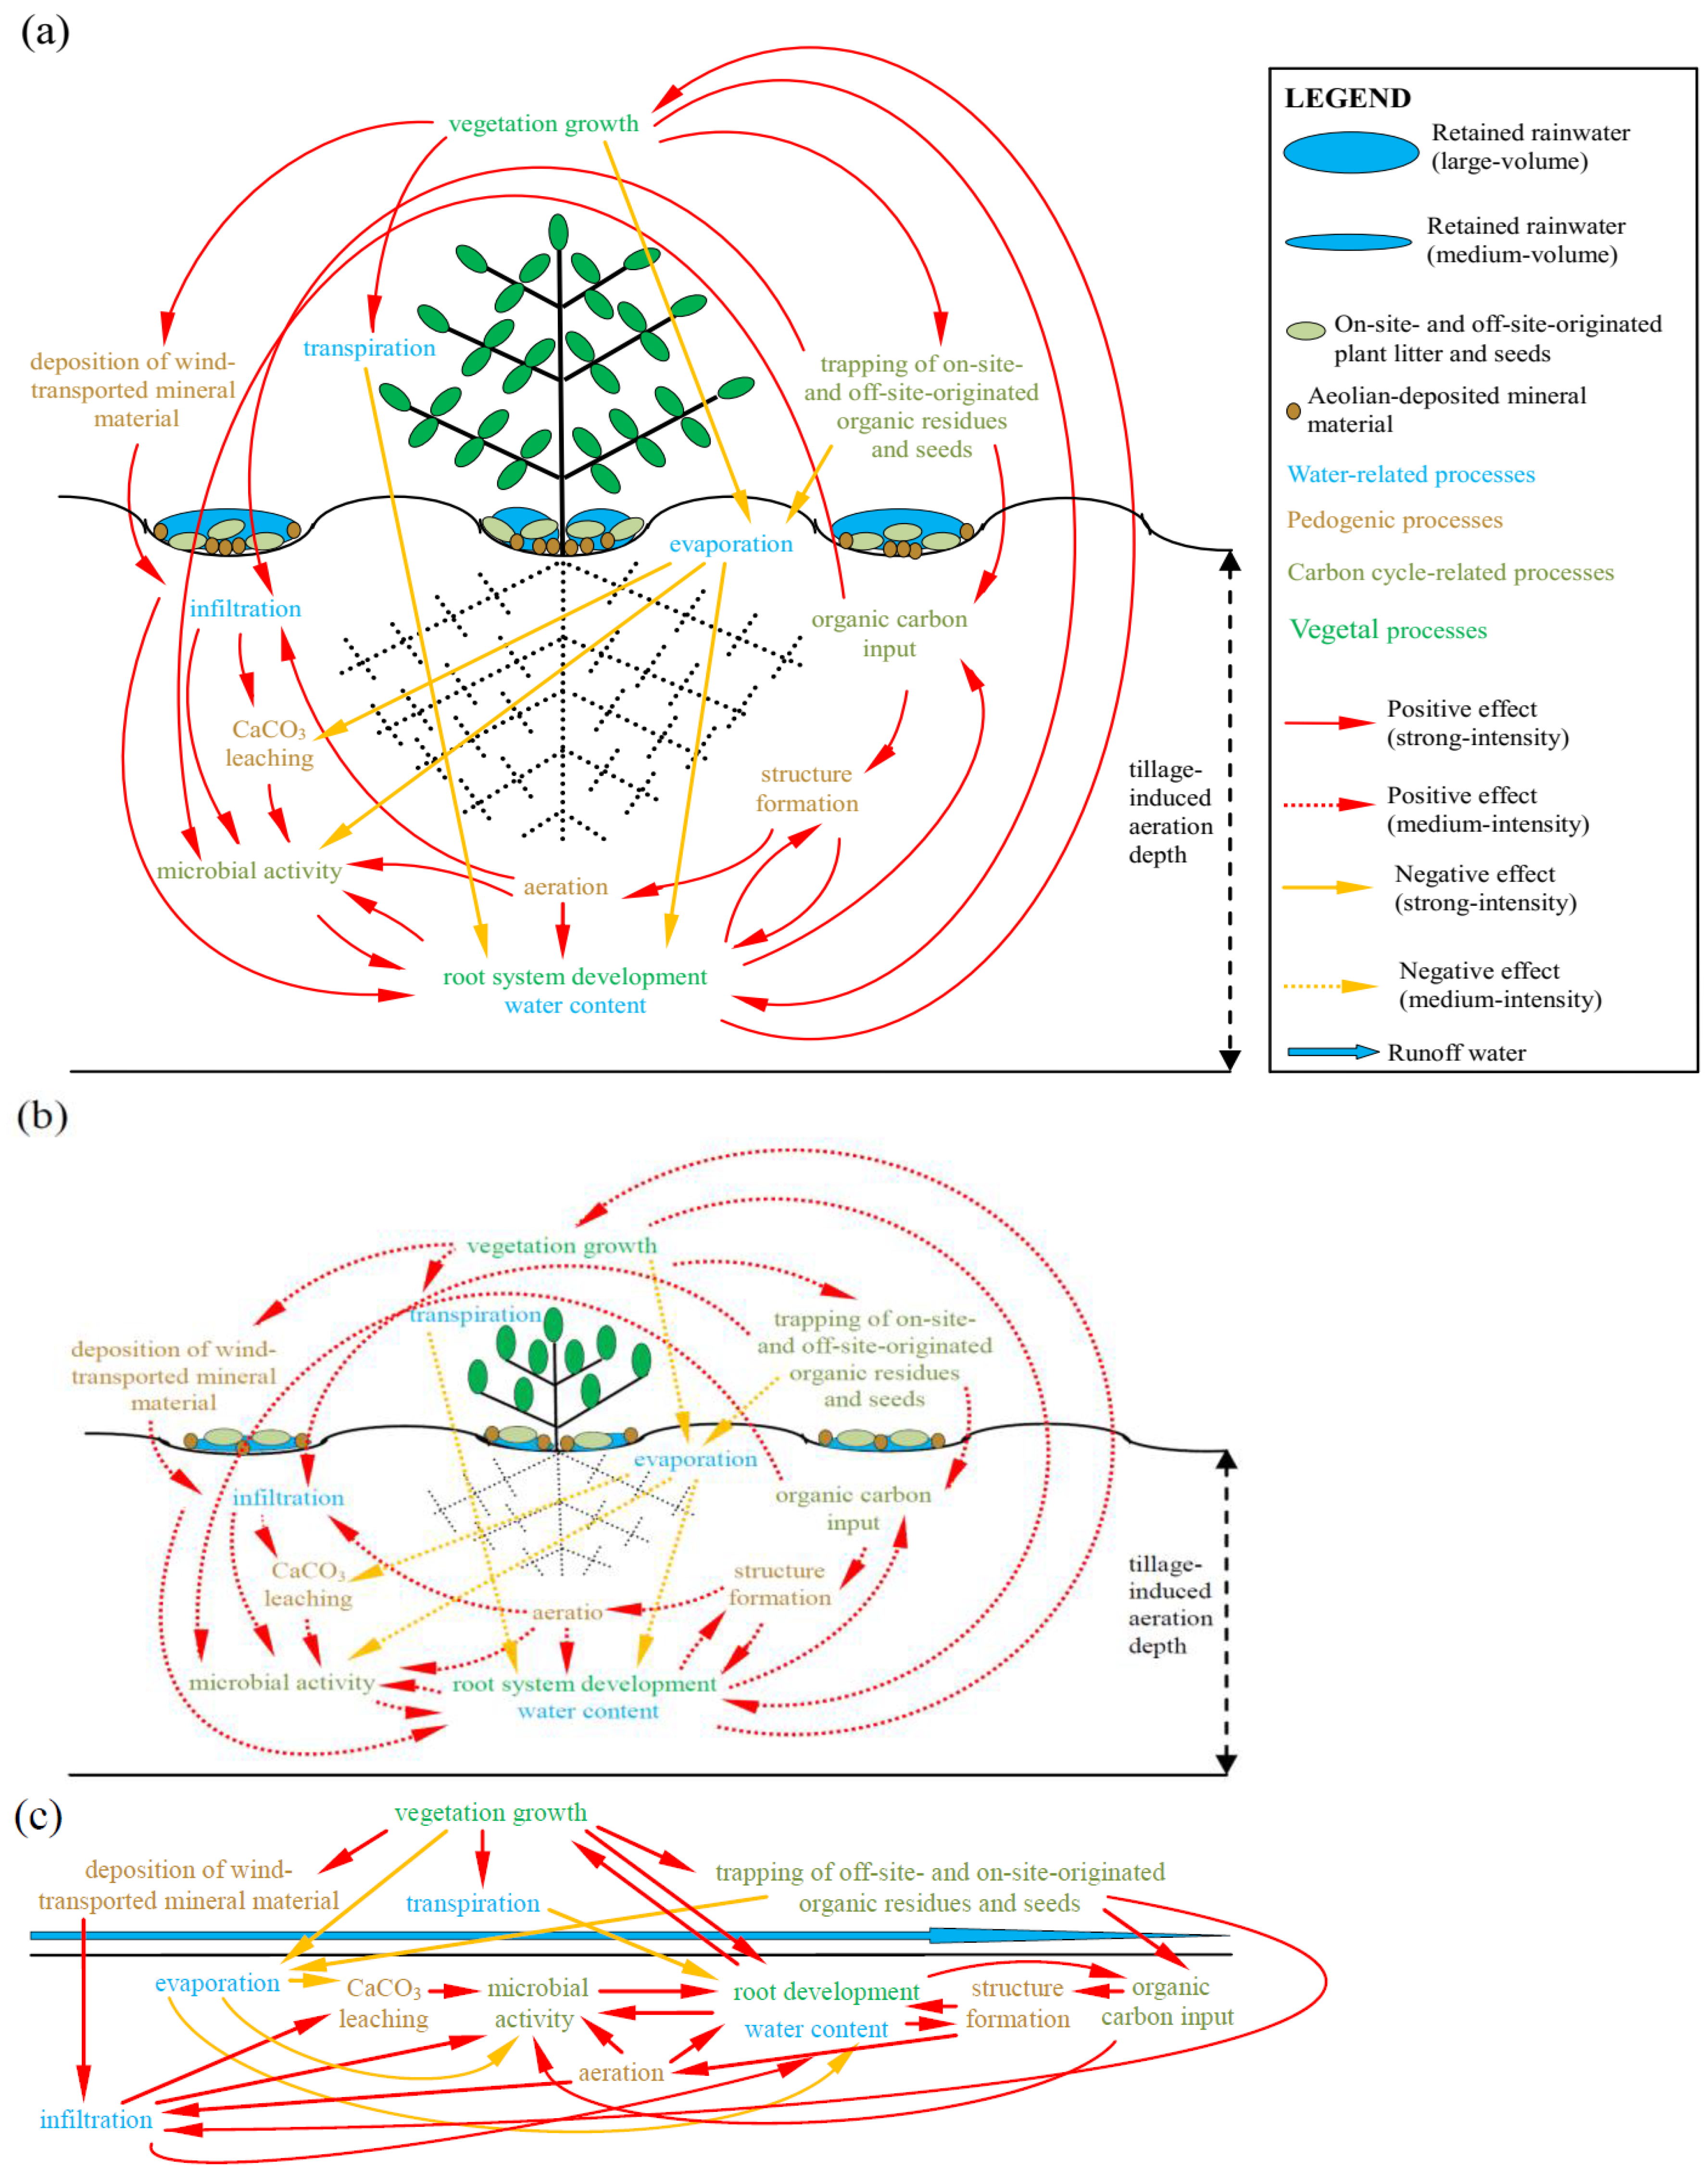
3.3. General Discussion and Implications

It is proposed that over time, the above- and below-ground processes foster each other through mutual feedback loops. The main generators of these feedbacks in the severely degraded and compacted lands are the breaking of the mechanical crust cover, increase in roughness of the ground surface, and the greater aeration of soil. For a schematic illustration of these feedbacks, see Figure 3.
In the deep chiseling plots, the high intensity of surface roughness induced by the tillage action [51], allows the retention of a large amount of raindrops. This water includes both drops falling on-site, as well as drops falling off-site, running on the ground surface, and harvested by the surface micro-topography [52]. Simultaneously, the intensive surface roughness allows the trapping of fine mineral materials and off-site originated organic residues and seeds, which get deposited on-site [53]. Coupled with the breaking of the mechanical crust cover, the trapped mineral materials make the surface more porous, easing water infiltrability. The trapped organic residues shade the ground surface and decrease soil-water loss through evaporation [54], while the trapped seeds become available for germination on-site [29,30]. Water infiltration is accelerated by the intensive aeration of soil, which is induced by the deep chiseling action [55]. The high infiltration rate and decreased evaporation loss increase the availability of water for plant-use [56]. Simultaneously, the high infiltration rates and decreased evaporation loss, increase the leaching of calcium carbonate [57], and stimulate microbial activity [48]. The latter enables high cycling rates of nutrients [49], which become available for plant uptake [58]. Over time, the establishment of vegetation accelerates the trapping of fine mineral materials [59] and organic residues originating off-site [60]. Also, the on-site developed vegetation becomes a source for additional organic residues and seeds [61]. Moreover, the established vegetation shades the ground surface underneath its canopy, further reducing soil-water loss through evaporation [62]. At the same time, the vegetation growth results in the loss of soil-water through transpiration [63]. One way or another, both the deposited and defoliated organic residues become a source for the soil organic carbon pool [64]. The latter increases macro-aggregate formation and stability [65] resulting in better aeration, greater available water capacity [66], and faster root development. These three effects further strengthen the microbial activity, pedogenesis, and vegetation growth [62,66], accelerating the entire chain of geo-ecological feedbacks (Figure 3a). In the shallow chiseling plots, the same feedbacks take place, though to a smaller magnitude, which is determined by the mid-intensity of surface roughness, coupled by the aeration of only a medium soil depth (Figure 3b).
In the no-tillage, control plots, the surface smoothness limits the deposition of fine mineral materials and organic residues and seeds originating off-site [59]. Also, the surface smoothness hinders the on-site retention of raindrops. Coupled with the compaction-induced limited soil aeration [55] and diminished water infiltrability [67], these processes cause the generation of intensive runoff of water [68]. Further, the low infiltrability of water diminishes leaching of calcium carbonate [57], and hinders microbial activity [58]. The no deposition of organic residues allows high evaporation rates [54], and enables no input of organic matter to the soil organic pool, with the resultant small macro-aggregate formation, and low available water capacity [62,66]. The combined effects of these processes allow no germination and establishment of plants, with the resulting retardation of self-restoration processes (Figure 3c).
Overall, results of this study conform to those of previous studies, which showed that under severely degraded lands, self-restoration processes are hindered [69,70,71]. Such conditions negate the effectiveness of passive restoration means, and necessitate active intervention means for commencing restoration processes. Such intervention means are particularly relevant for drylands, where self-restoration processes are hindered by the limited water availability. Therefore, the obtained results support the study’s main hypothesis. At the same time, the results do not completely confirm the study’s secondary hypothesis. This is because even though the advantage of the deep chiseling treatment over the shallow chiseling treatment was apparent for the soil properties, it was not clearly noticeable for the spontaneously-established vegetation properties. This difference between the soil and vegetation responses is assumed to be affected by the greater sensitivity of pedogenic processes than by that of plant community, to tillage management practices. Yet, it is expected that over time, the above-described feedbacks between the soil and plants will be reflected in increasing differences in the vegetation parameters among the three studied treatments. Continuation of this study over a longer time span is therefore needed in order to verify this expectation. It is also necessary for similar studies to be conducted in degraded shrublands in other drylands across the world.

4. Conclusions

In this study, we assessed the use of a single chiseling session as a means for restoring severely degraded and compacted lands. Results of this study revealed that several parameters of spontaneously-established vegetation were generally better under the chiseling treatments than those under the no-tillage plots, but there were no clear and consistent differences between the deep and shallow chiseling treatments. At the same time, soil quality was best under the deep chiseling plots, moderate under the shallow chiseling plots, and worst under the no-tillage plots. It is concluded that the extreme degradation and compaction of soil in the no-tillage plots hinders self-restoration processes. This is particularly relevant for drylands, where limited water availability slows down such processes. Also, it is foreseen that, considering the continued exclusion of any kind of anthropogenic disturbances, the differences among the three treatments will increase over time.

Author Contributions

I.S., Z.S., B.D., E.H., M.D., and A.T. designed the study, reviewed literature, and drafted the manuscript. Z.S., B.D., E.H., A.S., and Y.K. collected the vegetation data and analyzed it. I.S. analyzed the soil samples. A.A.-A. analyzed the soil microbial community. M.D. conducted the statistical analysis.

Funding

The vegetation survey was funded by the Israel Nature and Parks Authority (INPA). The soil analyses were funded by the Israel Science Foundation (ISF), Grant No. 1260/15.

Acknowledgments

We kindly acknowledge the INPA employees for assisting in field work. The authors are grateful to two anonymous reviewers, whose comments allowed for the considerable improvement of the manuscript.

Conflicts of Interest

The authors declare no conflict of interest. The founding sponsors had no role in the design of the study; in the collection, analyses, or interpretation of data; in the writing of the manuscript, and in the decision to publish the results.

Appendix A

Figure A1. Research block, with deep chiseling treatment plot on the right side, shallow chiseling treatment plot on the left side, and a control plot in the middle. Note the greatest surface roughness on the right, intermediate roughness on the left, and smallest roughness in the middle. Photographed by I. Stavi in April 2017, three years after the plots were established.
Water 10 00755 g0a1

Appendix B. Recorded Plant Species, by Year and Treatment.

YearTreatmentSpeciesYearTreatmentSpeciesYearTreatmentSpecies
2015ControlAizoon hispanicum2016ControlAaronsohnia factorovsky2017ControlAtractylis sp.
Anabasis articulata Aizoon hispanicum Avena sp.
Anthemis sp. Andrachne telephioides Erodium crassifolium
Arnebia decumbens Anthemis sp. Gymnarrhena micrantha
Artemisia sieberi Besser Astragalus sp. Haloxylon sp.
Astragalus hamosus Astragalus asterias Hohen Malva aegyptia
Astragalus tribuloides Delile Astragalus hamosus Neotorularia torulosa
Atriplex halimus Astragalus tribuloides Delile Plantago crypsoides
Bassia arabica Atractylis phaeolepis Pomel Plantago ovata
Bassia indica Avena wiestii Reaumuria sp.
Calendula arvensis Calendula arvensis Reichardia tingitana
Carduus argentatus Carduus argentatus Schismus arabicus Nees
Carrichtera annua Centaurea sp. Stipa capensis
Centaurea ammocyanus Centaurea ammocyanus Trigonella stellata
Erodium crassifolium Erodium crassifolium Shallow tillageAaronsohnia factorovsky
Erucaria rostrata Erucaria microcarpa Anthemis sp.
Filago desertorum Pomel Filago desertorum Pomel Arnebia decumbens
Gymnarrhena micrantha Gymnarrhena micrantha Astragalus sp.
Haloxylon salicornicum Hordeum glaucum Avena sp.
Haloxylon scoparium Pomel Lappula spinocarpos Buglossoides tenuiflora
Lappula spinocarpos Leontodon laciniatus Centaurea sp.
Leontodon laciniatus Malva aegyptia Eremopyrum bonaepartis
Malva aegyptia Malva parviflora Erodium crassifolium
Malva parviflora Medicago laciniata Filago desertorum Pomel
Nasturtiopsis coronopifolia Nasturtiopsis coronopifolia Gymnarrhena micrantha
Neotorularia torulosa Plantago sp. Haloxylon sp.
Phalaris minor Pteranthus dichotomus Malva aegyptia
Pteranthus dichotomus Reaumuria hirtella Malva parviflora
Reaumuria hirtella Reichardia tingitana Neotorularia torulosa
Reichardia tingitana Schismus arabicus Nees Plantago crypsoides
Roemeria hybrida Scorzonera papposa Plantago ovata
Salsola inermis Senecio glaucus Pteranthus dichotomus
Schismus arabicus Nees Silene vivianii Reaumuria sp.
Scorzonera papposa Stipa capensis Reichardia tingitana
Silene decipiens Trigonella stellata Salsola inermis
Spergula fallax Shallow tillageAaronsohnia factorovsky Schismus arabicus Nees
Spergularia diandra Anthemis sp. Senecio glaucus
Stipa capensis Arnebia decumbens Silene decipiens
Trigonella stellata Astragalus sp. Stipa capensis
Vulpia myuros Astragalus asterias Hohen Stipagrostis plumosa
Shallow tillageAllium rothii Astragalus hamosus Trigonella stellata
Anthemis sp. Astragalus tribuloides Delile Deep tillageAaronsohnia factorovsky
Arnebia decumbens Avena wiestii Anthemis sp.
Astragalus hamosus Calendula arvensis Avena sp.
Astragalus tribuloides Delile Carduus argentatus Erodium crassifolium
Atriplex halimus Erodium crassifolium Gymnocarpos decander
Avena wiestii Erucaria microcarpa Haloxylon sp.
Bassia arabica Gymnarrhena micrantha Lappula spinocarpos
Bassia indica Hordeum glaucum Malva aegyptia
Calendula arvensis Leontodon laciniatus Nasturtiopsis coronopifolia
Centaurea ammocyanus Malva aegyptia Neotorularia torulosa
Erodium crassifolium Malva parviflora Plantago crypsoides
Erucaria rostrata Nasturtiopsis coronopifolia Pteranthus dichotomus
Filago desertorum Pomel Pteranthus dichotomus Reaumuria sp.
Gymnarrhena micrantha Reaumuria hirtella Salsola inermis
Lappula spinocarpos Reichardia tingitana Schismus arabicus Nees
Leontodon laciniatus Salsola inermis Scorzonera papposa
Malva aegyptia Salsola inermis Silene decipiens
Malva parviflora Schismus arabicus Nees Stipa capensis
Nasturtiopsis coronopifolia Scorzonera papposa Thymelaea hirsuta
Neotorularia torulosa Senecio glaucus Trigonella stellata
Pteranthus dichotomus Silene vivianii
Reaumuria hirtella Sonchus oleraceus
Reichardia tingitana Stipa capensis
Roemeria hybrida Trigonella stellata
Salsola inermis Tulipa systola Stapf
Salsola vermiculata Deep tillageAaronsohnia factorovsky
Schismus arabicus Nees Aizoon hispanicum
Scorzonera papposa Andrachne telephioides
Silene colorata Anthemis sp.
Spergula fallax Atriplex leucoclada
Stipa capensis Avena wiestii
Trigonella stellata Calendula arvensis
Deep tillageAegilops kotschyi Carduus argentatus
Aizoon hispanicum Centaurea ammocyanus
Anthemis sp. Erodium crassifolium
Arnebia decumbens Erucaria microcarpa
Astragalus asterias Hohen Filago desertorum Pomel
Astragalus hamosus Gymnarrhena micrantha
Astragalus tribuloides Delile Hordeum glaucum
Avena wiestii Launaea sp.
Bassia arabica Leontodon laciniatus
Calendula arvensis Malva aegyptia
Carduus argentatus Malva parviflora
Centaurea ammocyanus Medicago laciniata
Eremopyrum bonaepartis Nasturtiopsis coronopifolia
Erodium crassifolium Pteranthus dichotomus
Erucaria rostrata Reaumuria hirtella
Filago desertorum Pomel Reichardia tingitana
Filago pyramidata Salsola inermis
Gymnarrhena micrantha Schismus arabicus Nees
Hordeum glaucum Scorzonera papposa
Ifloga spicata Senecio glaucus
Lappula spinocarpos Sonchus oleraceus
Leontodon laciniatus Spergula fallax
Malva aegyptia Stipa capensis
Malva parviflora Trigonella arabica Delile
Nasturtiopsis coronopifolia Trigonella stellata
Neotorularia torulosa
Pteranthus dichotomus
Reaumuria hirtella
Reichardia tingitana
Roemeria hybrida
Salsola inermis
Salsola tragus
Schismus arabicus Nees
Scorzonera papposa
Silene colorata
Silene decipiens
Sonchus oleraceus
Spergula fallax
Spergularia diandra
Stipa capensis
Trigonella stellata

References

  1. Lei, S.A. Soil compaction from human trampling, biking, and off-road motor vehicle activity in a blackbrush (Coleogyne ramosissima) shrubland. West. N. Am. Nat. 2004, 64, 125–130. [Google Scholar]
  2. Alaoui, A.; Lipiec, J.; Gerke, H.H. A review of the changes in the soil pore system due to soil deformation: A hydrodynamic perspective. Soil Tillage Res. 2011, 115–116, 1–15. [Google Scholar] [CrossRef]
  3. Nawaz, M.F.; Bourrié, G.; Trolard, F. Soil compaction impact and modelling. A review. Agron. Sustain. Dev. 2013, 33, 291. [Google Scholar] [CrossRef]
  4. Soil Compaction in England and Wales. Scoping Study to Assess Soil Compaction Affecting Upland and Lowland Grassland in England and Wales. Appendix 2: The Causes of Soil Compaction; Soil Compaction: London, UK, 2008. [Google Scholar]
  5. Zahawi, R.A.; Reid, J.L.; Holl, K.D. Hidden costs of passive restoration. Restor. Ecol. 2014, 22, 284–287. [Google Scholar] [CrossRef]
  6. Roa-Fuentes, L.L.; Martínez-Garza, C.; Etchevers, J.; Campo, J. Recovery of soil C and N in a tropical pasture: Passive and active restoration. Land Degrad. Dev. 2015, 26, 201–210. [Google Scholar] [CrossRef]
  7. Czerwiński, M.; Kobierski, M.; Golińska, B.; Goliński, P. Applicability of full inversion tillage to semi-natural grassland restoration on ex-arable land. Arch. Agron. Soil Sci. 2015, 61, 785–795. [Google Scholar] [CrossRef]
  8. Cortez, J.W.; Mauad, M.; de Souza, L.C.F.; Rufino, M.V.; de Souza, P.H.N. Agronomic attributes of soybeans and soil resistance to penetration in no-tillage and chiseled surfaces. Eng. Agric. Jaboticabal 2017, 37, 98–105. [Google Scholar]
  9. Chatterjee, A. On-farm comparisons of soil organic carbon under no-tillage and chisel-plow systems. Acta Agric. Scand. B Soil Plant Sci. 2018, 68, 471–476. [Google Scholar] [CrossRef]
  10. Bitan, A.; Rubin, S. Climatic Atlas of Israel for Physical and Environmental Planning and Design, 3rd ed.; Ramot Press: Tel Aviv, Israel, 1991. [Google Scholar]
  11. Israel Meteorological Service Website. Available online: http://www.ims.gov.il/ims/all_tahazit/ (accessed on 8 June 2018).
  12. Avni, Y.; Weiler, N. Geological Map of Israel 1:50,000, Sde Boqer Sheet 18–IV; Geological Survey of Israel: Jerusalem, Israel, 2013.
  13. Singer, A. The Soils of Israel; Springer Verlag: Berlin, Germany, 2007; p. 306. [Google Scholar]
  14. Drori, B.; Hyams, E.; Siegal, Z.; Tsoar, A. Summary of First Year of the Sde Zin Restoration Study: Soil Plowing for Increasing the Diversity and Abundance of Native Vegetation; Unpublished Report; Israel Nature and Parks Authority: Jerusalem, Israel, 2015. (In Hebrew) [Google Scholar]
  15. Tsoar, A.; Drori, B.; Shafir, A.; Hyams, E.; Siegal, Z.; Tzluk, M. Sde Zin Conservation. In Proceedings of the Conference on Organisms as Ecological Engineers, Sde Boqer, Israel, 10 May 2017. (In Hebrew). [Google Scholar]
  16. Saleh, A. Soil roughness measurement: Chain method. J. Soil Water Conserv. 1993, 48, 527–529. [Google Scholar]
  17. Vanags, C.; Minasny, B.; McBratney, A.B. The Dynamic Penetrometer for Assessment of Soil Mechanical Resistance. In Proceedings of the SuperSoil 2004: 3rd Australian New Zealand Soils Conference, Sydney, Australia, 5–9 December 2004. [Google Scholar]
  18. Grossman, R.B.; Reinsch, T.G. Bulk density and linear extensibility. In Methods of Soil Analysis, Part 4, Physical Methods; Dane, J.H., Topp, G.C., Eds.; Soil Science Society of America: Madison, WI, USA, 2002; pp. 201–225. [Google Scholar]
  19. Bouyoucos, G.J. Hydrometer method improved for making particle size analyses of soils. Agron. J. 1962, 54, 464–465. [Google Scholar] [CrossRef]
  20. Gardner, W.G. Water content. In Methods of Soil Analysis, No. 9. American Society of Agronomy; Black, C.A., Ed.; Soil Science Society of America: Madison, WI, USA, 1965; pp. 82–127. [Google Scholar]
  21. Loeppert, R.H.; Suarez, D.L. Carbonate and gypsum. In Methods of Soil Analysis, Part 3, Chemical Methods, Ch. 15; Sparks, D.L., Page, A.L., Helmke, P.A., Loeppert, R.H., Soltanpour, P.N., Tabatabai, M.A., Johnson, C.T., Sumner, M.E., Eds.; SSSA Special Pub.: Madison, WI, USA, 1996; Volume 5, pp. 437–474. [Google Scholar]
  22. Nelson, D.W.; Sommers, L.E. Total carbon, organic carbon, and organic matter. In Methods of Soil Analysis, Part 2. 9; Page, A.L., Helmke, P.A., Loeppert, R.H., Soltanpour, P.N., Tabatabai, M.A., Johnson, C.T., Sumner, M.E., Eds.; American Society of Agronomy: Madison, WI, USA, 1996; pp. 961–1010. [Google Scholar]
  23. Harris, D.; Horwáth, W.R.; van Kessel, C. Acid fumigation of soils to remove carbonates prior to total organic carbon or CARBON-13 isotopic analysis. Soil Sci. Soc. Am. J. 2000, 65, 1853–1856. [Google Scholar] [CrossRef]
  24. Bachar, A.; Al-Ashhab, A.; Soares, M.I.M.; Sklarz, M.Y.; Angel, R.; Ungar, E.D.; Gillor, O. Soil microbial abundance and diversity along a low precipitation gradient. Microb. Ecol. 2010, 60, 453–461. [Google Scholar] [CrossRef] [PubMed]
  25. Pinheiro, J.; Bates, D.; DebRoy, S.; Sarkar, D.; R Core Team. nlme: Linear and Nonlinear Mixed Effects Models. R package Version 3.1-137. 2018. Available online: https://cran.r-project.org/web/packages/nlme/citation.html (accessed on 8 June 2018).
  26. R Core Team. A Language and Environment for Statistical Computing; R Foundation for Statistical Computing: Vienna, Austria, 2018; Available online: https://www.R-project.org/ (accessed on 8 June 2018).
  27. Bramorski, J.; De Maria, I.C.; E Silva, R.L.; Crestana, S. Relations between soil surface roughness, tortuosity, tillage treatments, rainfall intensity and soil and water losses from a red yellow latosol. Rev. Bras. Ciênc. Solo 2012, 36, 1291–1297. [Google Scholar] [CrossRef]
  28. Yizhaq, H.; Stavi, I.; Shachak, M.; Bel, G. Geodiversity increases ecosystem durability to prolonged droughts. Ecol. Complex 2017, 31, 96–103. [Google Scholar] [CrossRef]
  29. Brazier, V. Treading carefully among periglacial landforms. Earth Herit. 2017, 47, 42–44. [Google Scholar]
  30. Hjort, J.; Gordon, J.E.; Gray, M.; Hunter, M.L., Jr. Why geodiversity matters in valuing nature’s stage. Conserv. Biol. 2015, 29, 630–639. [Google Scholar] [CrossRef] [PubMed]
  31. Zhao, P.; Shao, M.A.; Omran, W.; Amer, A.M.M. Effects of erosion and deposition on particle size distribution of deposited farmland soils on the Chinese Loess Plateau. Rev. Bras. Ciênc. Solo 2011, 35, 2135–2144. [Google Scholar] [CrossRef]
  32. Thompson, S.E.; Assouline, S.; Chen, L.; Trahktenbrot, A.; Svoray, T.; Katul, G.G. Secondary dispersal driven by overland flow in drylands: Review and mechanistic model development. Mov. Ecol. 2014, 2, 7. [Google Scholar] [CrossRef] [PubMed] [Green Version]
  33. Ginman, E.L. Dispersal Biology of Orbanche ramosa in South Australia. Master’s Thesis, the School of Earth and Environmental Science, The University of Adelaide, Adelaide, Australia, 2009. [Google Scholar]
  34. Celik, I. Effects of tillage on penetration resistance, bulk density and saturated hydraulic conductivity in a clayey soil conditions. Tarim Bilimleri Derg. J. Agric. Sci. 2011, 17, 143–156. [Google Scholar]
  35. Celik, I.; Gunal, H.; Acar, M.; Gok, M.; Barut, Z.B.; Pamiralan, H. Long-term tillage and residue management effect on soil compaction and nitrate leaching in a Typic Haploxerert soil. Int. J. Plant Prod. 2017, 11, 131–149. [Google Scholar]
  36. Birkas, M.; Dexter, A.; Szemok, A. Tillage-indiced soil compaction, as a climate threat increasing stressor. Cereal Res. Commun. 2009, 37, 379–382. [Google Scholar]
  37. Indoria, A.K.; Rao, C.S.; Sharma, K.L.; Reddy, K.S. Conservation agriculture—A panacea to improve soil physical health. Curr. Sci. 2017, 112, 52–61. [Google Scholar] [CrossRef]
  38. Hamza, M.A.; Anderson, W.K. Soil compaction in cropping systems: A review of the nature, causes and possible solutions. Soil Tillage Res. 2005, 82, 121–145. [Google Scholar] [CrossRef]
  39. Chamen, W.C.T.; Moxey, A.P.; Towers, W.; Balana, B.; Hallett, P.D. Mitigating arable soil compaction: A review and analysis of available cost and benefit data. Soil Tillage Res. 2015, 146, 10–25. [Google Scholar] [CrossRef]
  40. Danielson, R.E.; Sutherland, P.L. Porosity. In Methods of Soil Analysis. Part 1. No. 9. Physical and Mineralogical Methods, 2nd ed.; Klute, A., Ed.; American Society of Agronomy: Madison, WI, USA, 1986; pp. 443–461. [Google Scholar]
  41. Zhang, S.L.; Grip, H.; Lovdahl, L. Effect of soil compaction on hydraulic properties of two loess soils in China. Soil Tillage Res. 2006, 90, 117–125. [Google Scholar] [CrossRef]
  42. Stavi, I.; Shem-Tov, R.; Chocron, M.; Yizhaq, H. Geodiversity, self-organization, and health of three-phase semi-arid rangeland ecosystems, in the Israeli Negev. Geomorphology 2015, 234, 11–18. [Google Scholar] [CrossRef]
  43. Lemtiri, A.; Degrune, F.; Barbieux, S.; Hiel, M.P.; Chelin, M.; Parvin, N.; Vandenbol, M.; Francis, F.; Colinet, G. Crop residue management in arable cropping systems under temperate climate. Part 1: Soil biological and chemical (phosphorus and nitrogen) properties. A review. Biotechnol. Agron. Soc. Environ. 2016, 20, 236–244. [Google Scholar]
  44. Herrada, M.R.; Fernandez, R.R.G.; Leandro, W.M.; Ferreira, E.P.D.; Ferraresi, T.M.; Perez, J.J.R. Evaluation of biological attributes of soil type latossol under agroecological production. Centro Agric. 2016, 43, 14–20. [Google Scholar]
  45. Ma, Z.M.; Chen, J.; Lyu, X.D.; Liu, L.L.; Siddique, K.H.M. Distribution of soil carbon and grain yield of spring wheat under a permanent raised bed planting system in an arid area of northwest China. Soil Tillage Res. 2016, 163, 274–281. [Google Scholar] [CrossRef]
  46. Raiesi, F.; Kabiri, V. Identification of soil quality indicators for assessing the effect of different tillage practices through a soil quality index in a semi-arid environment. Ecol. Indic. 2016, 71, 198–207. [Google Scholar] [CrossRef]
  47. Franzluebbers, A.J. Soil organic matter stratification ratio as an indicator of soil quality. Soil Tillage Res. 2002, 66, 95–106. [Google Scholar] [CrossRef]
  48. Bashan, Y.; Vazquez, P. Effect of calcium carbonate, sand, and organic matter levels on mortality of five species of Azospirillum in natural and artificial bulk soils. Biol. Fertil. Soils 2000, 30, 450–459. [Google Scholar] [CrossRef]
  49. Bhargavarami Reddy, C.H.; Guldekar, V.D.; Balakrishnan, N. Influence of soil calcium carbonate on yield and quality of Nagpur mandarin. Afr. J. Agric. Res. 2013, 8, 5193–5196. [Google Scholar]
  50. Xiao, X.; Horton, R.; Sauer, T.J.; Heitman, J.; Ren, T. Cumulative soil water evaporation as a function of depth and time. Vadose Zone J. 2011, 10, 1016–1022. [Google Scholar] [CrossRef]
  51. Merrill, S.D.; Huang, C.; Zobeck, T.M.; Tanaka, D.L. Use of the chain set for scale-sensitive and erosion-relevant measurement of soil surface roughness. In Proceedings of the 10th International Soil Conservation Organization Meeting Sustaining the Global Farm, West Lafayette, IN, USA, 24–29 May 1999; Stott, D.E., Mohtar, R.H., Steinhardt, G.C., Eds.; Purdue University: West Lafayette, IN, USA, 2001; pp. 594–600. Available online: http://topsoil.nserl.purdue.edu/nserlweb-old/isco99/pdf/ISCOdisc/SustainingTheGlobalFarm/P064-Merrill.pdf (accessed on 8 June 2018).
  52. Vermang, J.; Norton, L.D.; Huang, C.; Cornelis, W.M.; da Silva, A.M.; Gabriels, D. Characterization of soil surface roughness effects on runoff and soil erosion rates under simulated rainfall. Soil Sci. Soc. Am. J. 2015, 79, 903–916. [Google Scholar] [CrossRef]
  53. Tongway, D.J.; Ludwig, J.A. The conservation of water and nutrients within landcapes. In Landscape Ecology Function and Management; Ludwig, J.A., Tongway, D.J., Freudenberger, D., Noble, J., Hodgkinson, K., Eds.; CSIRO Publishing: Canbbera, Australia, 2003; pp. 13–22. [Google Scholar]
  54. Scopel, E.; da Silva, F.A.M.; Corbeels, M.; Affholder, F.; Maraux, F. Modelling crop residue mulching effects on water use and production of maize under semi-arid and humid tropical conditions. Agronomie 2004, 24, 383–395. [Google Scholar] [CrossRef] [Green Version]
  55. Khan, A.R. Influence of tillage on soil aeration. Agron. Crop Sci. 1996, 177, 253–259. [Google Scholar] [CrossRef]
  56. Campanella, M.V.; Rostagno, C.M.; Videla, L.S.; Bisigato, A.J. Land degradation affects shrub growth responses to precipitation in a semiarid rangeland of north-eastern Patagonia (Argentina). Aust. Ecol. 2018, 43, 280–287. [Google Scholar] [CrossRef]
  57. Zwikel, S. Spatial Patterns of Soil Properties which Affect Water Regime (Rainfall Overland Flow Relationships) in Eco-Geomorphic Systems along a Climatic Transect, from the Negev Highlands to the Galilee Mountains. Ph.D. Thesis, Bar-Ilan University, Ramat Gan, Israel, 2004. (In Hebrew with English Abstract). [Google Scholar]
  58. Prakash, O.; Sharma, R.; Rahi, P.; Karthikeyan, N. Role of microorganisms in plant nutrition and health. In Nutrient Use Efficiency: From Basics to Advances; Rakshit, A., Singh, A., Bahadur, H., Avijit, S., Eds.; Springer: Dordrecht, The Netherlands, 2015; pp. 125–161. [Google Scholar]
  59. Field, J.P.; Breshears, D.D.; Whicker, J.J.; Zou, C.B. Sediment capture by vegetation patches: Implications for desertification and increased resource redistribution. J. Geophys. Res. Biogeosci. 2012, 117, G01033. [Google Scholar] [CrossRef]
  60. Whisenant, S. 50 First steps in erosion control. In Forest Restoration in Landscapes: Beyond Planting Trees; Mansourian, S., Vallauri, D., Dudley, N., Eds.; Springer: New York, NY, USA, 2005; pp. 350–355. [Google Scholar]
  61. Todd, S.D. Solar Energy Facility, Re-Vegetation and Rehabilitation Plan, Appendix C; Solar Direct: Sarasota, FL, USA, 2013; Available online: https://www.erm.com/contentassets/ef51f6123d3d436bb2e3c5207b971595/sub-appendices/appendix-c.pdf (accessed on 8 June 2018).
  62. Xiao, W.F.; Ge, X.G.; Zeng, L.X.; Huang, Z.L.; Lei, J.P.; Zhou, B.Z.; Li, M.H. Rates of litter decomposition and soil respiration in relation to soil temperature and water in different aged Pinus massoniana forests in the Three Gorges Reservoir area, China. PLoS ONE 2014, 9, e101890. [Google Scholar] [CrossRef] [PubMed]
  63. Wang, S.; Fu, B.J.; Gao, G.Y.; Yao, X.L.; Zhou, J. Soil moisture and evapotranspiration of different land cover types in the Loess Plateau, China. Hydrol. Earth Syst. Sci. 2012, 16, 2883–2892. [Google Scholar] [CrossRef] [Green Version]
  64. Chowdhury, S.; Farrell, M.; Butler, G.; Bolan, N. Assessing the effect of crop residue removal on soil organic carbon storage and microbial activity in a no-till cropping system. Soil Use Manag. 2015, 31, 450–460. [Google Scholar] [CrossRef]
  65. Larney, F.J.; Angers, D.A. The role of organic amendments in soil reclamation: A review. Can. J. Soil Sci. 2012, 92, 19–38. [Google Scholar] [CrossRef] [Green Version]
  66. Saxton, K.E.; Rawls, W.J. Soil water characteristic estimates by texture and organic matter for hydrologic solutions. Soil Sci. Soc. Am. J. 2006, 70, 1569–1578. [Google Scholar] [CrossRef]
  67. Chyba, J.; Kroulík, M.; Krištof, K.; Misiewicz, P.A.; Chaney, K. Influence of soil compaction by farm machinery and livestock on water infiltration rate on grassland. Agron. Res. 2014, 12, 59–64. [Google Scholar]
  68. Adekalu, K.O.; Okunade, D.A.; Osunbitan, J.A. Compaction and mulching effects on soil loss and runoff from two southwestern Nigeria agricultural soils. Geoderma 2006, 137, 226–230. [Google Scholar] [CrossRef]
  69. Holl, K.D.; Aide, T.M. When and where to actively restore ecosystems? For. Ecol. Manag. 2011, 261, 1558–1563. [Google Scholar] [CrossRef]
  70. Yannelli, F.A.; Tabeni, S.; Mastrantonio, L.E.; Vezzani, N. Assessing degradation of abandoned farmlands for conservation of the Monte Desert Biome in Argentina. Environ. Manag. 2014, 53, 231–239. [Google Scholar] [CrossRef] [PubMed]
  71. Yirdaw, E.; Tigabu, M.; Monge, A. Rehabilitation of degraded dryland ecosystems—Review. Silva Fenn. 2017, 51, 1673. [Google Scholar] [CrossRef]
Figure 1. Map of Israel, with an indication of the study site (a); Schematic illustration of the study design (b).
Water 10 00755 g001
Figure 2. Treatment effect (according to year) on vegetation parameters, including: annual species cover (a); perennial species cover (b); species richness (c); Shannon’s diversity Index (d); and Fisher’s alpha parameter (e). Notes: Bold P value indicates a significant effect. Means within a year followed by a different letter differ at the 0.05 probability level according to Tukey’s honestly significant difference (HSD). Error bars represent standard error (SE) of the means.
Water 10 00755 g002
Figure 3. Schematic illustration of feedbacks among water-soil-plant-organic matter under deep chiseling (a); shallow chiseling (b); and no-tillage (c) of severely degraded lands. Deep tillage induces aeration at a deep soil layer and forms intense roughness of the ground surface, generating strong-intensity feedbacks among water-soil-plant-organic matter. Shallow tillage induces aeration at a shallow soil layer and forms medium roughness of the ground surface, generating medium-intensity feedbacks among water-soil-plant-organic matter. Strong feedbacks occur also in the no-tilled, severely degraded lands.
Water 10 00755 g003
Table 1. Treatment effect on the soil surface roughness (%), penetration resistance (MPa), bulk density (ρb: Mg m−3), total porosity (St, %), gravimetric moisture content (Өg: %), available water capacity (AWC: mm water per 5-cm soil layer), total organic carbon concentration (SOC: g kg−1), bacterial relative abundance (16S rDNA fragment number g−1), SOC stratification ratio (g kg−1 in the 0–5 cm depth/g kg−1 in the 15–20 cm depth), and calcium carbonate content (CaCO3: %).
P ValueDeep ChiselingShallow ChiselingControl
Surface roughness<0.00016.1 a (0.5)4.6 b (0.5)0.5 c (0.3)
Penetration resistance0.00070.38 b (0.06)0.39 b (0.07)1.62 a (0.19)
ρb0.00091.31 b (0.02)1.36 b (0.02)1.55 a (0.03)
St0.000950.6 a (0.6)48.8 a (0.9)41.1 b (0.9)
Өg0.65935.8 a (0.6)5.3 a (0.5)3.3 a (0.2)
AWC0.50957.2 a (0.5)6.7 a (0.4)5.3 b (0.3)
SOC0.049822.6 ab (1.4)19.7 b (1.2)24.2 a (1.5)
Bacterial relative abundance<0.00016.03 × 107 a (1.24 × 10⁷)3.6 × 10⁷ b (7.03 × 10⁶)1.73 × 10⁷ c (3.08 × 10⁶)
SOC stratification ratio0.38711.01 a (0.08)0.82 a (0.04)0.93 a (0.09)
CaCO30.232227.5 a (0.4)26.8 a (0.5)26.3 a (0.5)
Notes: Bold P value indicates a significant effect. Means within a row followed by a different letter differ at the 0.05 probability level according to Tukey’s honestly significant difference (HSD). Numbers within parentheses are standard error (SE) of the means.
Table 2. Depth effect on the soil penetration resistance (MPa), bulk density (ρb: g cm−3), total porosity (St, %), gravimetric moisture content (Өg: %), available water capacity (AWC: mm water per 5-cm soil layer), total organic carbon concentration (TOC: g kg−1), bacterial relative abundance (16S rDNA fragment number g−1), and calcium carbonate content (CaCO3: %).
P Value0–5 cm15–20 cm
Penetration resistance0.0020.71 b (0.12)0.89 a (0.16)
ρb0.26971.39 a (0.02)1.41 a (0.03)
St0.269747.3 a (0.9)46.6 a (1.1)
Өg0.15873.1 a (0.1)6.5 a (0.5)
AWC0.34075.7 a (0.2)7.0 a (0.5)
SOC0.360321.1 a (1.2)23.3 a (1.0)
Bacterial relative abundance0.00476.58 × 107 a (7.43 × 10⁶)9.75 × 10⁶ b (8.64 × 10⁵)
CaCO30.512127.1 a (0.4)26.6 a (0.3)
Notes: Bold P value indicates a significant effect. Means within a row followed by a different letter differ at the 0.05 probability level according to Tukey’s honestly significant difference (HSD). Numbers within parentheses are standard error (SE) of the means.
Table 3. Effect of the interaction treatment × depth on the gravimetric moisture content (Өg: %), available water capacity (AWC: mm water per 5-cm soil layer), and bacterial relative abundance (16S rDNA fragment number g−1).
P Value Deep Chiseling × 0–5 cmDeep Chiseling × 15–20 cmShallow Chiseling × 0–5 cmShallow Chiseling × 15–20 cmControl × 0–5 cmControl × 15–20 cm
Өg<0.00013.1 b (0.1)8.5 a (0.6)3.3 b (0.2)7.2 a (0.6)2.9 b (0.2)3.6 b (0.3)
AWC0.00566.2 ab (0.4)8.3 a (0.8)5.5 b (0.4)7.9 a (0.6)5.7 b (0.3)4.9 b (0.6)
Bacterial relative abundance0.00161.07 × 108 a (9.94 × 10⁶)1.34 × 10⁷ c (1.42 × 10⁶)6.25 × 10⁷ b (5.27 × 10⁶)8.84 × 10⁶ c (1.53 × 10⁶)2.76 × 10⁷ c (3.67 × 10⁶)6.97 × 10⁶ c (3.90 × 10⁵)
Notes: Bold P value indicates a significant effect. Means within a row followed by a different letter differ at the 0.05 probability level according to Tukey’s honestly significant difference (HSD). Numbers within parentheses are standard error (SE) of the means. Only significant interactions are presented.

