Article

H3PO4-Activated Cattail Carbon Production and Application in Chromium Removal from Aqueous Solution: Process Optimization and Removal Mechanism

1
College of Environmental Science and Engineering, Central South University of Forestry and Technology, Changsha 410004, China
2
College of Life Science and Technology, Central South University of Forestry and Technology, Changsha 410004, China
3
College of Environmental Science and Engineering, Hunan University, Changsha 410084, China
*
Authors to whom correspondence should be addressed.
Water 2018, 10(6), 754; https://doi.org/10.3390/w10060754
Submission received: 22 May 2018 / Revised: 5 June 2018 / Accepted: 6 June 2018 / Published: 9 June 2018
(This article belongs to the Section Wastewater Treatment and Reuse)

Abstract

:
In this study, Box–Behnken design (BBD) was employed to optimize the process for H3PO4-activated Typha angustifolia activated carbon (TAC) production and Cr removal by TAC; the removal mechanisms were discussed based on TAC characterization, and the regeneration evaluation was also conducted. The optimum preparation conditions were activated time of 1.5 h, temperature of 469.02 °C, and incubation ratio of 4, resulting in an experimental carbon yield of 38.23% and Cr removal of 90.01%. The optimum adsorption parameters were found to be 0.02 g/50 mL TAC, 80 mg/L Cr(VI), and 2.21 pH with the observed Cr adsorption capacity of 59.54 mg/g. The removal mechanisms involved coulombic attraction, ionic exchange, surface complexation, and reduction. The process of Cr(VI) adsorption was feasible, spontaneous, and endothermic in nature, and the pseudo-second-order and Langmuir isotherm models were more appropriate for the removal process. After five adsorption/desorption cycles, the Cr adsorption capacity on TAC reduced by only 24.37%. The results showed that BBD could successfully optimize TAC production and Cr removal, and TAC could be developed as a promising, eco-friendly, and effective adsorbent for Cr pollution control.

1. Introduction

Chromium usually exists in hexavalent and trivalent forms in aqueous solution, and its compounds are widely used in industries, including smelting, leather tanning, dyeing, and electroplating [1]. Cr(VI) is highly toxic and more hazardous than Cr(III) due to its mutagenic and carcinogenic properties [2]. Thus, Cr(VI) pollution is posing serious environmental problems as well as great public concern [3,4]. The tolerance limit for Cr(VI) regulated by the World Health Organization is 0.1 mg/L in surface water and 0.05 mg/L in potable water [5]. Therefore, it is especially necessary to develop an effective treatment technology to remove Cr(VI) from wastewater and minimize its harm to the environment.
Recently, a wide range of techniques has been proposed to remove Cr(VI) from wastewater, including chemical precipitation [4], electrochemical treatment, membrane separation [6], reduction [1,7], ion exchange [8], and adsorption [9]. Among them, adsorption is considered as an attractive and favorable method owing to its higher cost-efficient ratio and easier operation. Heretofore, lots of carbon-based materials have been utilized for Cr(VI) adsorption, such as biochar [10,11], graphene [12], and mesoporous carbon [13]. Currently, activated carbon has been practically used in Cr(VI) treatment of wastewater due to technological and economic feasibility [3,4,14,15,16]. However, activated carbon suffered from barriers that limit its further application, including difficult obtainment of raw material, low adsorption capacity, and rare in-depth experimental design for activated carbon preparation and its adsorption processes [17]. Therefore, the search for cost-effective activated carbons has been receiving increasing attention in the field of adsorption.
Activated carbon can be prepared with almost any natural or synthetic carbon-containing material. Among these, agricultural and forestry residues are favorable raw substances due to their economic feasibility, low ash content, being a recycled material, and being environmentally friendly. Examples are peanut sawdust [14,15], shell [16], and Zizania caduciflora [18]. Typha angustifolia L. is a kind of perennial herb with a large biomass, high carbon content, and porous structure related to its vascular property [19]. Furthermore, it is cheap and readily available due to its normal discarding. Therefore, its application for activated carbon production is especially economically feasible and environmentally friendly. T. angustifolia carbon activated by H3PO4 provides good adsorptive capacity for Cd and Pb [20]. Currently, there are rare studies where the optimization of cattail activated carbon production and adsorption conditions for Cr(VI) have been reported.
The production quality of activated carbon involves the characteristics of a high surface area, porous structure, and strong adsorption capacity, as well as a high yield that can be achieved at low operating and energy costs. Compared to physical activation, chemical activation is preferred for biomass carbon production mainly because it realizes not only larger surface area and higher yield of carbon, but also lower operating and energy costs [21]. The adsorption performance and adsorbent cost are the most important indexes to determine the practical application of the adsorption process. In conclusion, the appropriate materials, proper production and adsorption processes, and readily regenerating technology determine the cost-effectiveness of an activated carbon’s application. Therefore, the production and adsorption processes of quality activated carbon need to be balanced to obtain desired characteristics of the output. Many statistical experimental designs have been recognized as useful techniques for process optimization. Response surface methodology (RSM) is used when a few significant factors are involved in process optimization [17]. RSM is a collection of statistical and mathematical methods that employs quantitative data from appropriate experiments to determine a regression equation and operating conditions, among which, Box–Behnken design (BBD) is the most commonly used model based on a rotatable or nearly rotatable second-order design [22].
The aims of this work were to; (1) model and optimize the process of H3PO4-activated T. angustifolia carbon and Cr(VI) adsorption using BBD; (2) investigate the adsorption behaviors of Cr(VI) onto TAC; (3) discuss the removal mechanisms of Cr by TAC based on the characterization analysis of TAC before and after Cr(VI) adsorption; and (4) evaluate the regeneration property of TAC.

2. Materials and Methods

2.1. Materials

The aerial part of narrow-leaf cattail was collected from Yanghu Wetland of Changsha, China. The raw material was cut into small pieces, cleaned up and dried, and subsequently crushed and sifted through 60-mesh. The resultant sample was stored in a jar for activated carbon preparation. H3PO4, K2Cr2O7, HCl, and NaOH were purchased from Beijing Chemical Co. Ltd. The stock solution of Cr(VI) was prepared by dissolving an exact quantity of K2Cr2O7 in deionized water. The solutions containing Cr(VI) for adsorption experiments were obtained by diluting 1000 mg/L of stock solution to desired concentrations. All chemicals and reagents used were of analytical grade and used as received.
The withered aboveground part of T. angustifolia was sampled from Yanghu Wetland in Changsha, China. Cleaned cattail material was dried at 80 °C to a constant weight and ground with a micro-crusher (FZ102, Taisite, Tianjin, China). After screening with a 60-mesh sieve, the biomass was kept in sealed plastic bags for preparing activated carbon.

2.2. Single Factor Affecting Adsorption Experiments

The TAC produced under the optimum preparation parameters obtained according to the following BBD experiments (See Section 3.1.3) was used in adsorption experiments affected by single factors. The influences of initial solution pH, adsorption time, and TAC dosage on the Cr removal were investigated, and the adsorption kinetics, thermodynamics, and equilibrium adsorption were analyzed. Except for the effect factors, the initial Cr(VI) solution, pH, and temperature were 50 mL of 50 mg/L, 3.0, and 25 °C, respectively, and the TAC dosage, sorption time, and oscillation speed (in a thermostat shaker, TS-1112B, Shanghai Danding International Trade Co., Ltd., Shanghai, China) were 0.1000 g, 60 min, and 180 rpm, respectively. The pH of solutions was adjusted by adding 0.1 mol/L of NaOH or HCl. After adsorption, the mixed solutions were immediately filtered through 0.45 µm filter papers, and the Cr concentrations in the supernatant were measured by atomic absorption spectrophotometer (AAS, TAS-990-F, Beijing Purkinje General Instrument Co., Ltd., Beijing, China).

2.3. Box–Behnken Experimental Designs for Typha Angustifolia Activated Carbon Production and Cr(VI) Adsorption

In the present study, a three-factor and three-level BBD was used to model and optimize the process parameters for TAC preparation and Cr(VI) adsorption onto TAC (Tables S1 and S2, see Supplementary materials). A total of 17 experimental runs were carried out, including five central points for replication. Factors of X1, X2, and X3 represented the activation temperature (°C), time (h), and impregnation ratio for TAC preparation, and the initial solution pH, carbon dosage (g), and Cr(VI) concentration (mg/L) for Cr(VI) adsorption, respectively. The factor levels in TAC preparation were chosen based on the study of Tang et al. (2017) [20]. The determination of factors and its levels for Cr(VI) adsorption was based on the single factor affecting adsorption experiments. The responses were Y1 (%) for the Cr(VI) removal, Y2 for the TAC yield (%), and Y3 (mg/g) for the Cr(VI) adsorption capacity. The experimental results based on the BBD can be given by a quadratic Equation (1):
Y = β 0 + i = 1 3 β i X i + i = 1 3 β i i X i 2 + i = 1 2 j = 2 3 β i j X i X j
where β0 is the intercept term; βi, βii, and βij are the first-order main effect, second-order main effect, and interaction effect, respectively; i and j are level numbers of factors.
Based on the BBD for TAC production, the pretreated material was immersed in a H3PO4 solution (solid H3PO4 of 50%) with different desired weight impregnation ratios in a crucible covered with tinfoil. After incubation for 24 h, the resultant precursor was pyrolyzed in a carbonization furnace (SYTH, Zhengzhou Machinery Co., Ltd., Zhengzhou, China) at different activation temperatures for required activation times, and taken out after natural cooling. The activated carbon was rinsed with 1% of NaOH and 10% of HCl solution to get rid of the excess H3PO4 and soluble ash, respectively. It was then washed several times with deionized water until the solution pH was neutral. The product of TAC was dried at 105 °C, ground through 100-mesh size, and stored in a jar for adsorption experiments.
The adsorption experiment in determining the optimum TAC production conditions was performed at following conditions: the volume and concentration of Cr(VI) was 50 mL and 50 mg/L, the initial solution pH and temperature were 3.0 and 25 °C, and the sorption time and oscillation speed were 60 min and 180 r/min, respectively.
The TAC produced under the optimum preparation parameters was used in other adsorption experiments. Based on the BBD for Cr(VI) adsorption, except for the factors in Table S2, the adsorption time, temperature, and oscillation speed were 60 min, 25 °C, and 180 rpm, respectively.
Both TAC production and Cr(VI) adsorption experimental results were analyzed by the RSM with Design-Expert 8.0.6 (Stat-Ease Inc. Minneapolis, MN, USA) using quadratic models.

2.4. Characterization of Typha Angustifolia Activated Carbon

The structure and surface morphology, BET surface area and pore size distribution, zeta potential, and X-ray diffractometer (XRD) pattern of TAC were analyzed by scanning electron microscopy (SEM) (QUANTA 450 FEI, TSS Microscopy, Beaverton, OR, USA), nitrogen physisorption data at 77 K through an automatic surface analyzer (Quadrasorb SI-3MP, Quantachrome, Delray beach, USA), a zeta potential meter (Zetasizer Nano-ZS90, Malvern Panalytical, Malvern, UK), and a power XRD (D8ADVANCE, Bruker, Bremen, Germany) at 30 kV and 15 mA (CuKα radiation), respectively. Fourier transform infrared (FTIR) spectroscopy and X-ray photoelectron spectrometer (XPS) measurements of TAC before and after the adsorption of Cr(VI) were recorded using a Fourier transform infrared spectrometer (SHIMADZU: iraFFINITY-1, Kyoto, Japan) and an ESCALAB 250Xi XPS (Thermo Fisher, Waltham, MA, USA), respectively.

2.5. Sorption-Desorption Experiments

The sorption experiments were conducted using a batch technique by mixing the given quantity of TAC with aqueous solution containing known Cr(VI) concentration in 150 mL conical flasks. The optimum adsorption parameters (0.02 g of TAC, 80 mg/L Cr(VI), and initial solution pH of 2.21) obtained from BBD were used in sorption experiments. First, 0.02 g of TAC was added into a 50 mL of 80 mg/L Cr(VI) solution at pH of 2.21 and shaken at 180 rpm and 25 °C for 24 h. Thereafter, the TAC containing Cr was separated from aqueous solution by centrifugation.
During desorption or regeneration experiments, the obtained TAC with Cr after centrifugation was added into 100 mL of 1 mol/L NaOH solution and shaken at 180 rpm and 25 °C for 24 h. Then, the mixture was centrifuged again, the TAC was separated and washed by deionized water to neutralize and followed by the oven drying, and the regenerated TAC was obtained.
The regenerated TAC was used in the next adsorption-desorption cycle according to the steps mentioned above, and the adsorption-desorption step was repeated for 5 consecutive cycles. All the obtained centrifuged solutions after each adsorption and desorption were used to assay the concentrations of Cr by AAS (TAS-990-F, Beijing Purkinje General Instrument Co., Ltd., Beijing, China).

3. Results and Discussion

3.1. Process Optimization of Typha Angustifolia Activated Carbon Production

3.1.1. Statistical Analysis and Model Validation for Activated Carbon Preparation

For both carbon yield and Cr removal efficiency, among linear, 2F, and quadratic models, the quadratic models offered p-values more than 0.0001, lack-of-fit p-values less than 0.05, and maximum predicted and adjusted R2 values. Therefore, the quadratic models excellently explained the correlation between the responses and factors and were used in this work.
Based on the regression analysis on the experimental data in Table S1, the fitted quadratic polynomial models were expressed as Equations (2) and (3), respectively:
Y1 = 89.62 + 1.21X1 + 1.52X2 + 2.64X3 − 0.02X1X2− 0.04X1X3 − 0.26X2X3− 2.71X12 − 0.50X22 − 0.63X32
Y2 = 32.52 − 4.43X1 − 2.00X2 + 0.30X3 + 0.83X1X2 + 0.89X1X3 + 0.20X2X3 − 0.15X12 + 1.28X22 − 0.74X32
where X1, X2, and X3 stand for the coded values of activation temperature, activation time, and impregnation ratio, and Y1 and Y2 represent the predicted responses of Cr removal efficiency and carbon yield, respectively.
The analysis of variance (ANOVA) can test the significance for the fitted second-order polynomial equation based on relevant fitted parameters. (Tables S3 and S4 See Supplementary materials) indicated that both regression models were highly statistically significant at F-values of 432.28 for Cr removal and 205.55 for TAC yield and at values of prob > F (<0.0001). The lack-of-fit F-value (2.30 for Cr removal, 2.57 for carbon yield) was insignificant relative to the pure error (p = 0.2191 > 0.05), confirming that both models were valid well for the experimental data. The low value of the variation coefficient (0.20% for Cr removal and 1.97% for TAC yield) and standard variation (0.18 for Cr removal and 0.66 for TAC yield) indicated a high precision and reliability of the conducted experiments [23]. Furthermore, the correlation coefficient (R) and determination coefficient (R2) can also judge the fit quality of the model [5]. The R values (0.999 for Cr removal and 0.993 for TAC yield) revealed a reasonable agreement of predicted values with experimental results. The high R2 (0.9982 for Cr removal and 0.9855 for TAC yield) suggested that only 0.18% and 1.45% of the total variations in Cr removal efficiency and carbon yield were not explained by the regression models, respectively. The high values of adjusted determination coefficient for the Cr removal (0.9959) and TAC yield (0.9668) also showed a high significance of the used quadratic models. Table S1 also showed that the predicted response values from the regression models was consistent with the experimental data within the range of the independent variables studied.
According to the p-values, X1, X2, X3, X2X3, X12, X22, and X32 were significantly correlative to the Cr removal, and X1, X2, X1X2, X1X3, and X22 were significant for the TAC yield. While considering the regression equations, the positive and negative signs before the terms indicate synergistic and antagonistic effects, respectively [5]. Hence, X1, X2, and X3 were significantly favorable but X2X3, X12, X22, and X32 were significantly unfavorable for Cr removal; the TAC yield was significantly positively correlated to X1X2, X1X3, and X22 but significantly negatively correlated to X1 and X2. Furthermore, the sum of squares (SS) and F-value of each factor quantifies its importance in the process. When the values of the SS and F-value increase, the significance of the corresponding factor in the undergoing process also increases [9]. Therefore, based on the first-order main effect of each factor, the influence of production parameters followed the order: impregnation ratio (X3) > activation time (X2) > activation temperature (X1) for Cr removal, and in the order of activation temperature (X1) > activation time (X2) > impregnation ratio (X3) for the TAC yield. In conclusion, within the studied factor range, the higher the impregnation ratio and the lower the activated time and temperature were, the higher both Cr removal and TAC yield were.

3.1.2. Activated Carbon Yield and Cr Removal Responses

To best investigate the interactive influences of three factors on Cr removal and TAC yield, three-dimensional surface response plots were drawn by varying two variables within the experimental data at its “0” level (Figure S1a–f) (Supplementary materials). The removal efficiency of Cr increased with the activation time and impregnation ratio, while it increased at first and then decreased gradually over the activated temperature. This was similar to the results obtained by Prahas et al. [24]. The reasons were that sufficient activation time and impregnation ratio could eliminate most of the moisture and volatile components in the precursor for the generation of fine pores, but the higher temperature produced carbon with large pores [15]. The carbon yield significantly decreased with the activation temperature and time (p < 0.05), the reason for which was probably that the aromatic condensation reactions occurred among the adjacent molecules, causing the production of gaseous products from the hydroaromatic structure during carbonization; thus more moisture and volatile components in the precursor were eliminated [15,24].
The contour plot of the response surface plot can also reflect the degree of combined effect. A contour plot indicates a significant interactive effect, but a circular one means an insignificant combined impact [25]. The interactive influences between activated time and temperature (Figure S1g,h), activated temperature and impregnation (Figure S1i,j) were insignificant (p > 0.05) on the Cr removal but significant on TAC yield (p < 0.05), but the activated time and impregnation had a significant interacting influence on the Cr removal and an insignificant one on TAC yield (Figure S1k,l). These results are in accordance with the analysis of variance (ANOAV) results based on Equations (2) and (3).

3.1.3. Optimum Parameters of Activated Carbon Preparation

One of the principal objectives of this study was to find the optimum process parameters for TAC production which would provide both high Cr removal and TAC yield. After compromising between the Cr removal efficiency and carbon yield, the optimum production conditions for TAC were activation temperature of 469.02 °C, time of 1.5 h, and impregnation ratio of 4, which was consistent with the conclusion discussed above. However, the optimum production conditions for coconut shell carbon activated by H3PO4 were impregnation ratio of 1.725, activation time of 19.5 min, and activation temperature of 416 °C [17]. The optimum factor difference in both studies was possibly caused by different response variables and raw materials. Under the optimum production conditions, the predicted Cr removal efficiency was 89.23%, and carbon yield was 37.99%.
The confirmatory experiments showed that the experimental values (90.1% of Cr removal and 38.23% of TAC yield) were in good agreement with the predicted values. The carbon yield was in agreement with the 43.73% component of carbon obtained in our previous work [20]. The range of TAC yield (27.73–40.62%) was similar to the yield of H3PO4-activated carbon from chestnut wood (37.2–42.3%) and fruit stones (31.9–48.5%), but lower than coconut shell (40–55%) and jackfruit peel (42.15–56.25%) due to various raw materials and conditions [17,24].

3.2. Cr(VI) Adsorption on Typha Angustifolia Activated Carbon Affected by Single Factors

3.2.1. Effect of Initial Solution pH

The solution pH had great effects on Cr removal by changing the surface charge, electricity, and dissociation intensity of functional groups on the active sites of TAC and the Cr species in the solution. The adsorption capacity and removal efficiency of Cr sharply decreased with the increase of initial solution pH (Figure 1a). One of the main reasons was probably due to the decrease/increase of protonation/deprotonation extent of TAC surfaces over the increased solution pH [4,18]. Hence, the columbic attraction at low pH and the electrostatic repulsion at high pH between TAC surfaces and Cr(VI) oxyanions would improve or inhibit the Cr(VI) diffusion and thus removal, respectively [1]. The Cr(VI) in the aqueous solution mainly exists in forms of chromate CrO42− (pH > 6.0), HCrO4 (pH < 6.0), dichromate Cr2O72− (pH 4–6), or H2CrO4 (pH < 1.0) [1,4,16]. The HCrO4 oxyanion can dimerize at pH between 2 and 6 [26]. Cr2O72− becomes significant when total Cr(VI) concentrations are greater than 1 mM, or may even dominate when total Cr(VI) concentrations are greater than 30 mM [27]. Therefore, at low solution pH, the high Cr removal was probably mainly due to the electrostatic attraction of HCrO4 by positively charged groups on the TAC surface. Furthermore, due to large quantities of H+ existing in the solution, Cr(VI) could react with electron-donor groups and was reduced to Cr(III) [1,18]. At pH above the pH of the isoelectric point, retention of Cr(VI) occurred mainly by chemical (specific) adsorption through inner-sphere complexation via ligand exchange [28]. At the same time, ionic exchange adsorption might also occur due to the negatively charged TAC surface; however, the HCrO4 oxyanion only requires one exchange site, but Cr2O72− and CrO42− anions need two exchange sites [29]. Therefore, the Cr removal due to ionic exchange decreased with the increased solution pH. Moreover, both the repelling force between Cr(VI) oxyanions and surface negative charges on TAC and the dual competition between Cr(VI) oxyanions and OH also reduce the adsorption of Cr(VI) onto TAC [14,15]. Based on both the sorption capacity and potential practical application of this study, the initial solution pH was chosen as 3.0 for the following experiments.

3.2.2. Effect of Contact Time on Cr Removal and Adsorption Kinetic Analysis

The study of contact time effect on Cr removal by TAC helped determine the equlibrium time and the analysis of adsorption kinetics, which are very important for the practical design of adsorption devices. The adsorption of Cr increased rapidly at first, approached equilibrium after 30 min, and then remained at a stable stage (Figure 1b). The level difference of adsorbate is its main diffusion force. The initial rapid removal of Cr was attributed to the rich vacant activated sites and large adsorption energy of TAC, and thus high content difference of Cr(VI) ion. The later slow removal was contributed to the reduction of available adsorption sites, the transfer of external diffusion to internal diffusion, and repulsive force between Cr(VI) ion adsorbed on the TAC surface and in the solution [30]. To fully reach adsorption equilibrium, an excessive contact time of sixty minutes was selected.
Adsorption kinetics analysis can reflect the diffusion rate of adsorbate in adsorption systems. The adsorption kinetic data of Cr(VI) on TAC at different temperatures were analyzed in terms of the pseudo-first-order, pseudo-second-order, intra-particle diffusion, and classical Elovich models, respectively. The adsorption process basically contains external liquid membrane diffusion, surface adsorption, and particle internal diffusion [11]. The linear fits and parameters of adsorption kinetics are presented in Figure S2a,b and Table 1, respectively. The large variation between the predicted and experimental values of adsorption capacity and low R2 values of the pseudo-first-order model indicated that it could only describe the initial/unsaturated phases of the Cr(VI) adsorption process. The experimental values (qe,exp) were extremely close to the values of equilibrium adsorption capacities (qe,cal) obtained from the pseudo-second-order model at all the initial concentrations and temperatures, indicating that the biosorption systems predominantly follow the pseudo-second order kinetics model. Moreover, compared with the pseudo-first-order and Elovich models (Figure S2c), the higher values of R2, RMSE, and χ2 obtained from the pseudo-second-order model suggested that the rate-limiting step might be the surface chemical reaction (that can involve ion exchange and/or sharing of electrons) between Cr(VI) from the aqueous solution and superficial functional groups of TAC [31]. The larger a value indicates a stronger adsorption ability of adsorbent [32], and greater contribution of surface chemical adsorption in the rate-limiting step [33]. The values of a increased in the order of Cr50 mg/L > Cr100 mg/L > Cr150 mg/L, demonstrating that low solution Cr(VI) concentration was in favor of its adsorption onto TAC.
The intra-particle diffusion model can explain the diffusion mechanism during adsorption. If the fitted curve of the internal diffusion model is only a straight line and passes through the origin, the adsorption process is only controlled by particle internal diffusion; on the other hand, when the fitted curve is a multi-stage line, the adsorption process is complex and controlled by several rate-determining steps [11]. In this study, the simulation curves of intra-particle diffusion (Figure S1d) were straight lines but did not pass through the origin, indicating that intra-diffusion was not the only rate-limiting step, and the adsorption process was also influenced by extra-particle diffusion [34].

3.2.3. Effect of Activated Carbon Dosage on Cr Removal and Adsorption Isotherms Analysis

With the increase of TAC dosage from 0.02 to 0.5 g, the removal efficiency of Cr increased from 36.97 to 90.01%, but the adsorption capacity decreased from 46.21 to 4.50 mg/g, respectively (Figure 1c). The increased removal ratio could be attributed to the increase of active adsorption sites and the surface area of TAC due to the increasing carbon dosage. But, Cr removal did not reach 100%, indicating that saturated adsorption occurred, and adsorption and desorption coexisted in the system. On the other hand, the decreased sorption capacity of Cr was probable due to the reduction in both the effective surface area and adsorbate/adsorbent ratio, caused by the coagulation of TAC particles with the increase of TAC content in a given volume of solution and thus the increase of diffusion distance of adsorbates on the surface or inside adsorbents [35]. Taking account of both adsorption capacity and removal rate of Cr, the amount of adsorbent for further adsorption experiments was 0.1 g (2 g/L).
Adsorption isotherm models are commonly used to describe the maximum adsorption capacity and adsorption mechanisms. The equilibrium adsorption data of Cr on TAC were analyzed by nonlinear Langmuir, Freundlich, Temken, and D–R isotherm models, respectively (Figure S2e–h and Table 2). Langmuir, Freundlich, and Temkin models described the experimental data reasonably, but the Langmuir model fitted the adsorption equilibrium better in the temperature range studied due to better values of R2, RMSE, and χ2, indicating both monolayer chemical adsorption and multilayer physical adsorption occurred during sorption. The maximum adsorption capacity of Cr (Qm) obtained from the Langmuir model was 43.92 mg/g at 288 K, higher than the result in the study [1], but lower than that in the work [10]. The binding energy coefficient of the Langmuir isotherm followed the order of Ka 35 °C > Ka 25 °C > Ka 15 °C, suggesting that the high temperature promoted the affinity of the surface functional groups on TAC for Cr(VI). The adsorption equilibrium constant of the Freundlich model followed the order of KF 35 °C > KF 25 °C > KF 15 °C, also indicating the promotion of Cr(VI) adsorption by increasing temperature. It would be expected that an increased solution temperature would cause the enlargement of pore size due to activated diffusion causing the micropores to widen and deepen (pore burrowing) and create more adsorption surface [36].
The values of RL, n, and E resulted from Langmuir, Freundlich, and D–R models can judge the difficulty and the physiochemical properties of adsorption. Adsorption can be unfavorable (RL > 0), linear (RL = 1), favorable (0 < RL < 1), or irreversible (RL = 0) [37]. The adsorption is mainly physical processes (1/n ˂ 1 or E ˂ 8 kJ/mol), chemical reaction (1/n > 1 or E > 16 kJ/mol), and ion exchange (E between 8–16 kJ/mol) [38]. In this study, the RL values for Cr(VI) adsorption ranged from 0 to 1, and n was higher than 1 and E was lower than 8 kJ/mol at different temperatures (Table 3), so the adsorption of Cr(VI) on TAC was favorable and mainly a physical process due to Van der Waals forces and electrostatic attraction.

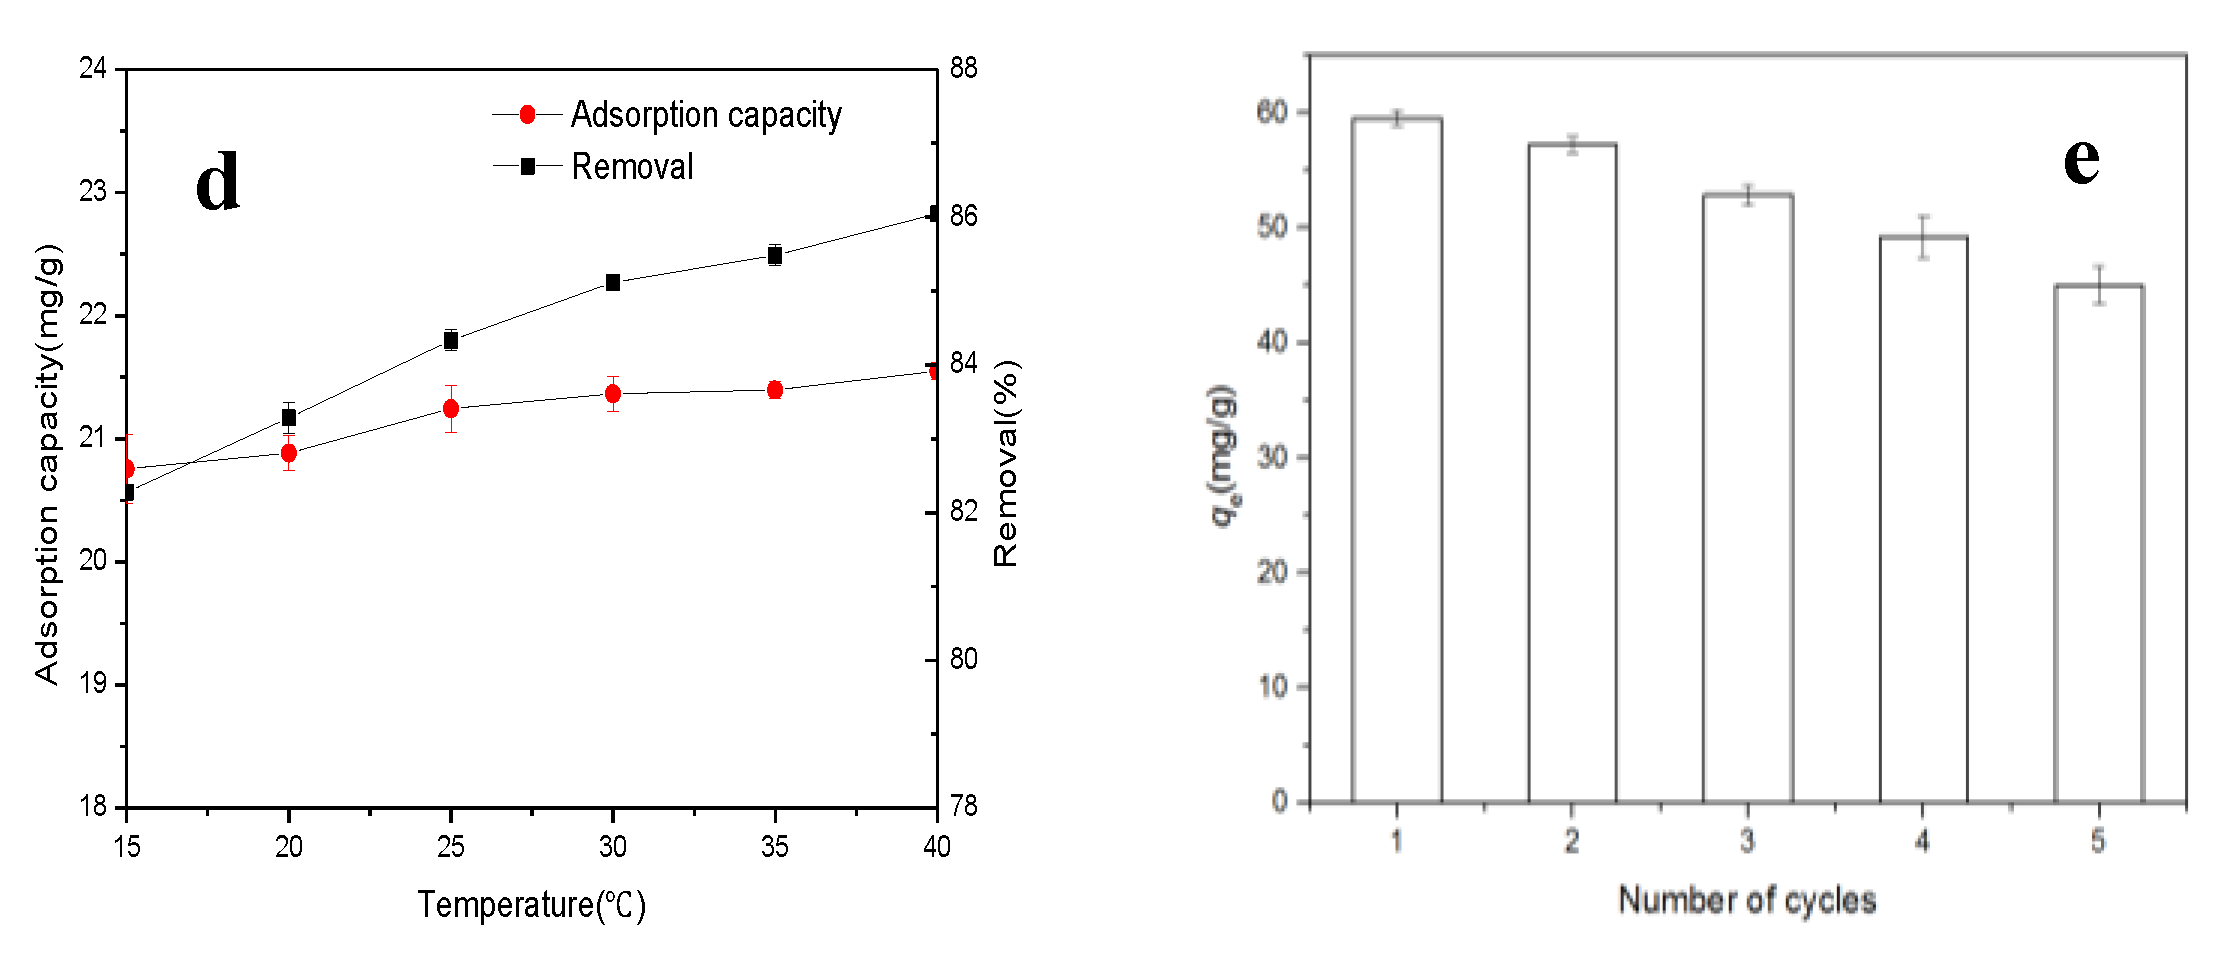
3.2.4. Effect of Temperature on Cr Removal and Adsorption Thermodynamics Analysis

When the initial solution temperature increased from 15 to 40 °C, the adsorption capacity of Cr increased from 20.56 to 21.50 mg/g, and the removal rate increased from 41.11% to 85.99% (Figure 1d). The increasing temperature helped the dehydration of Cr(VI) ions, increased the Brownian motion of Cr(VI) ion and sorption sites on the TAC surface, decreased the thickness of the double electric layer of TAC, and thus enhanced the sorption of Cr(VI) onto TAC [16,20,36].
The thermodynamics analysis can help one understand the change of standard free energy (∆G0), entropy (∆S0), and enthalpy (∆H0) during adsorption. Table 3 also presents relevant parameters values obtained from the fitted lines of the Van Hoff equation. The values of ∆G0 were negative and decreased with the increased temperature, indicating that the spontaneity, which does not require any external source of energy for its occurrence and feasibility of adsorption, increased with the increase in temperature [39]. The ΔH0 can reflect the energy barrier of sorption. The positive ∆H0 value suggested an endothermic adsorption process in nature, which was consistent with the increasing adsorption capacity over the increasing temperature. The ∆S0 value more than zero reflected the increased randomness on the solid–solution interface and the good affinity of TAC for Cr(VI) during adsorption. The reason was probably the structure change of TAC and Cr(VI) and the release of H+ from TAC during adsorption [20]. Other workers have also reported similar results for Cr(VI) adsorption on activated carbon [1,16].

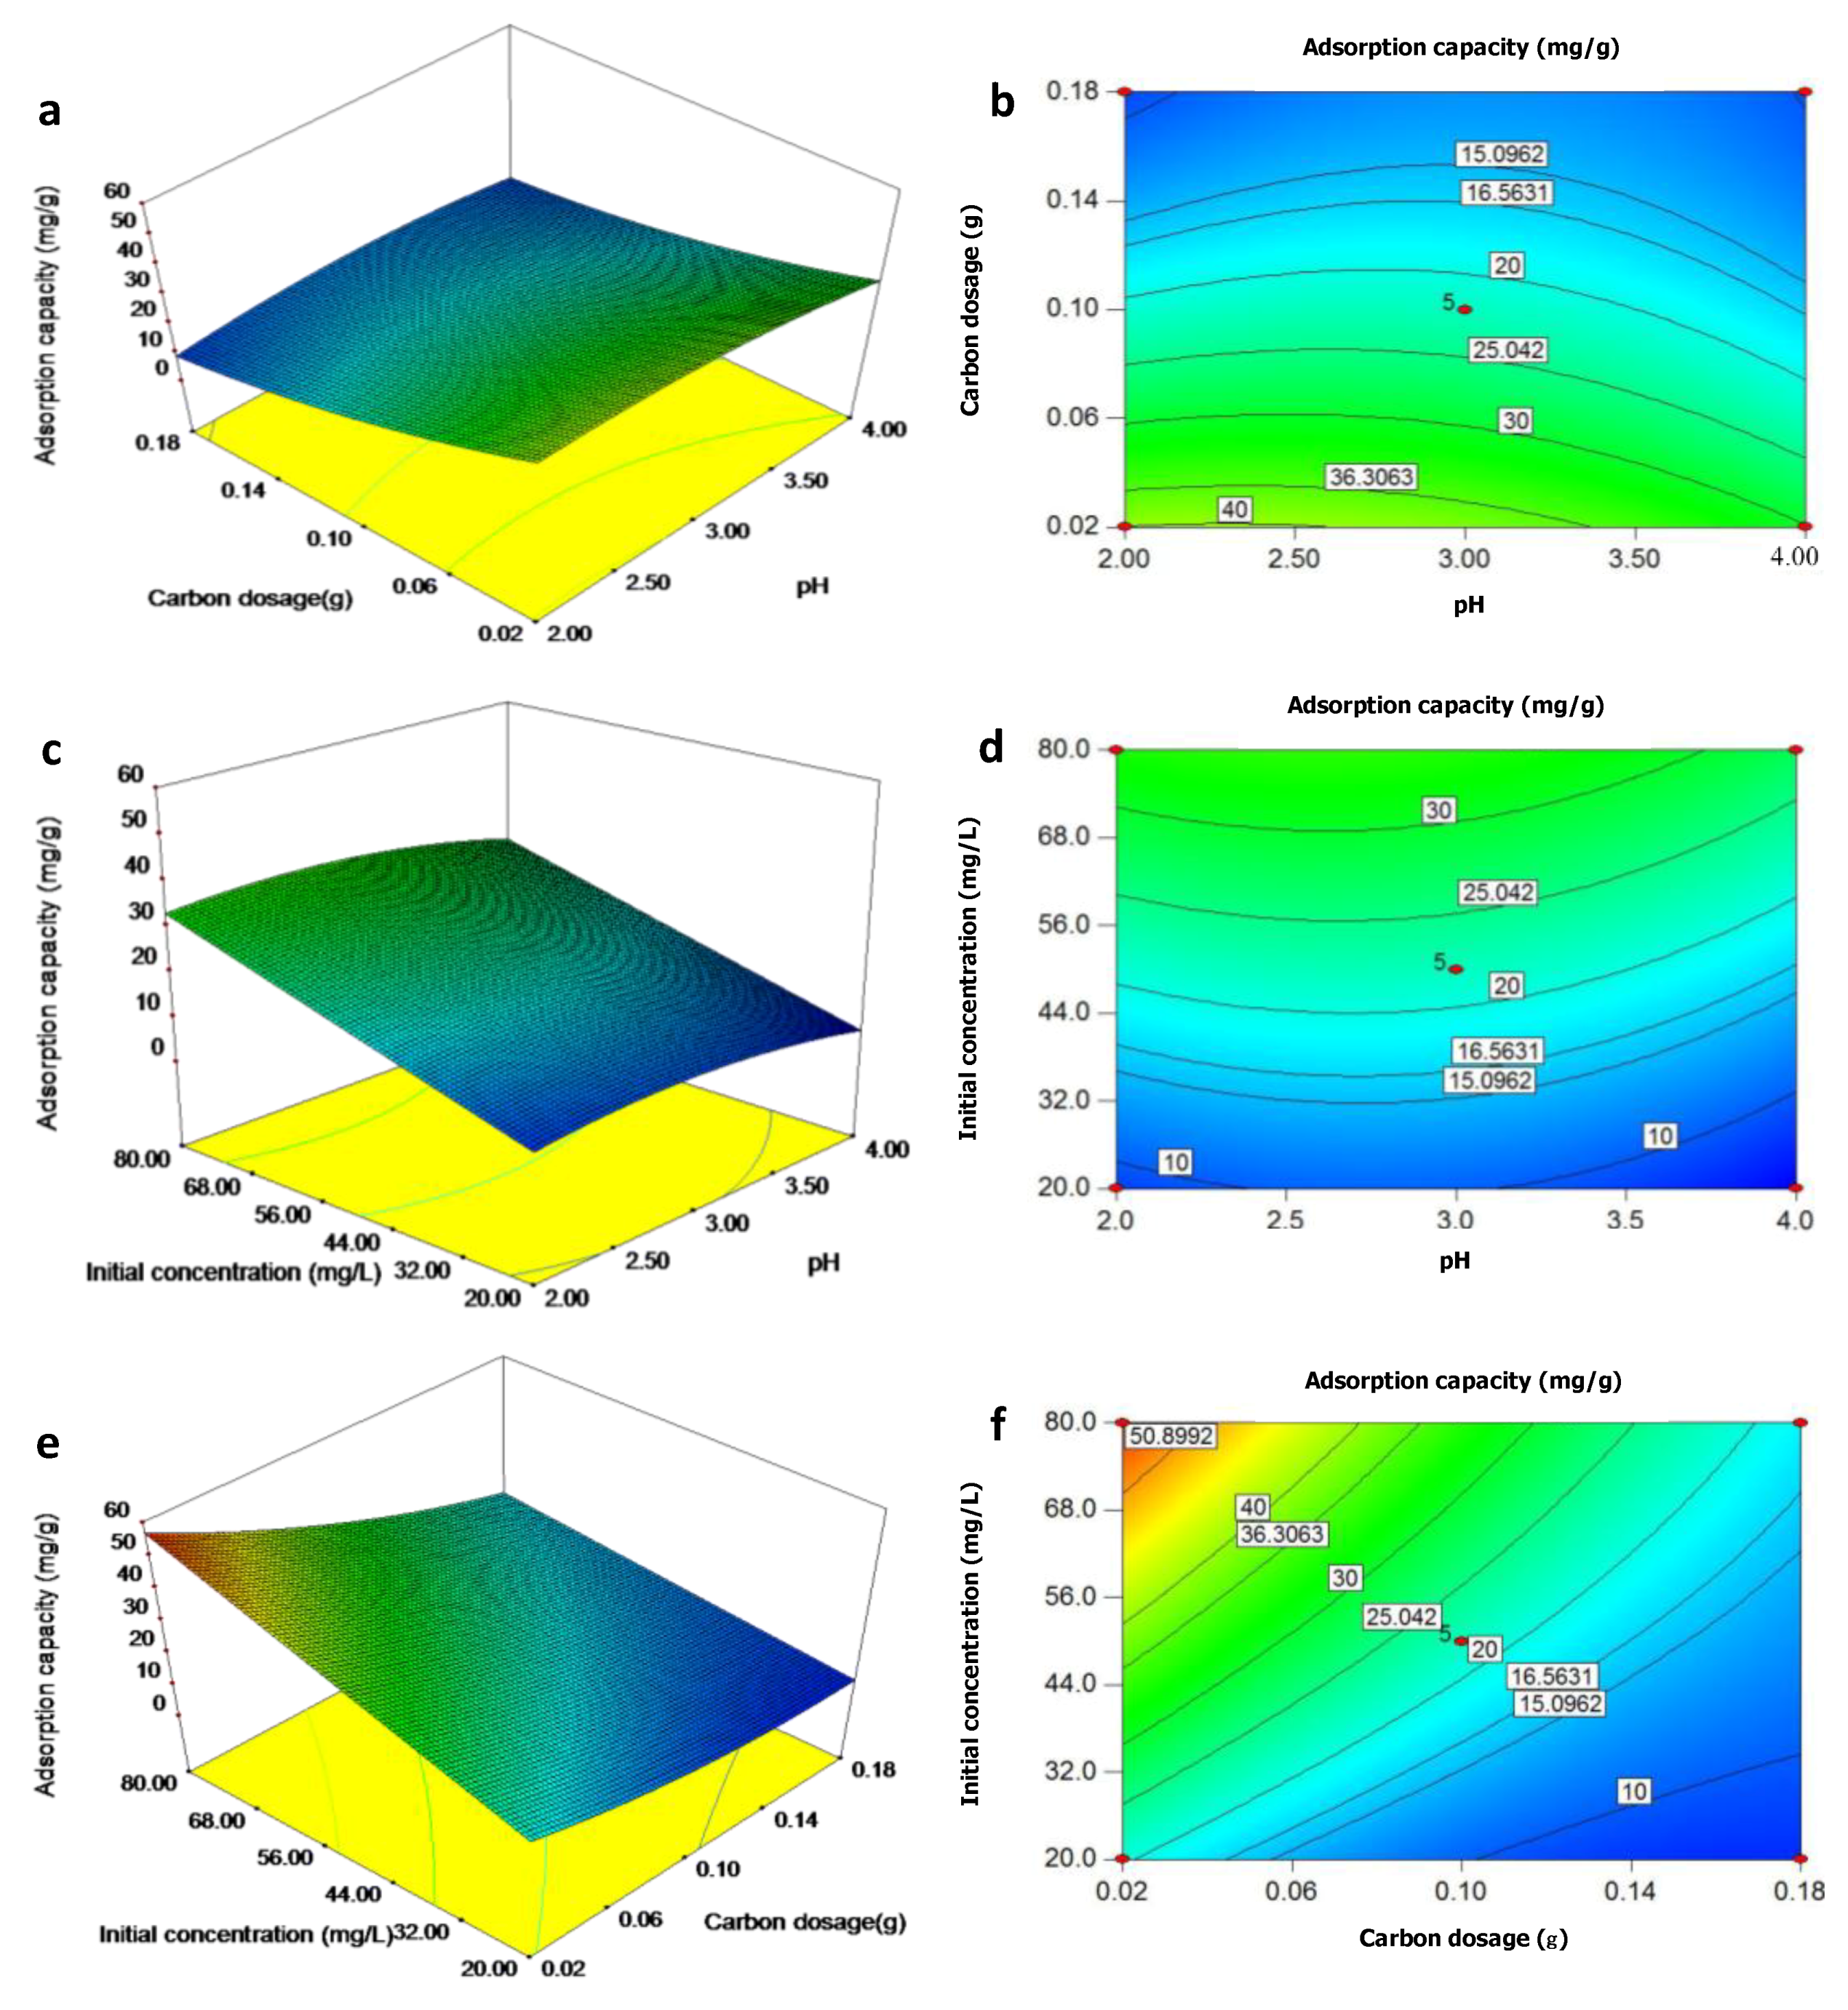
3.3. Process Optimization for Cr Adsorption on Typha Angustifolia Activated Carbon

3.3.1. Statistical Analysis and Model Validation for Cr Sorption

Compared to the linear and 2F models, the quadratic model provided a p value lower than 0.0001 and lack-of-fit p-value less than 0.05, and the maximum predicted and adjusted R2 values. Therefore, it was employed to explain the correlation between the Cr adsorption capacity and independent variables.
Table S2 presents the results for Cr adsorption experiments using TAC deprived of the optimum production conditions. The second-degree polynomial model for Cr adsorption capacity (Y3) and values of coded pH (X1), carbon dosage (X2), and initial concentration of Cr(VI) (X3) were obtained as Equation (4):
Y3 = 22.02 − 2.26X1 − 12.90X2 + 11.82X3 + 2.67X1X2 − 0.55X1X3 − 6.36X2X3 − 3.46X12 + 3.69X22 + 0.049X32
As shown in ANOVA (Table S5, See Supplementary materials), the F-value (49.78) and p-values of prob > F (<0.001) implied that the model was significant. Although the values of the CV (11.25%) and the standard deviation (2.49) were not low, the determination coefficient value of R2 showed that the 98.46% probability in response values changed with the three factors. The high value of R (0.992) and adjusted determination coefficient (0.965) also indicated a high correlation between the experimental and the predicted value. Moreover, the F-value for lack-of-fit (>0.05) was insignificant, confirming the validity of the model. Table S2 also suggested that the Cr adsorption capacity predicted based on Equation (4) was consistent with the experimental value. In conclusion, the Equation (4) was statistically significant for the prediction of Cr adsorption capacity.
The p-values show that X1, X2, X3, X2X3, X12, and X22 were significant model terms. Combined, the positive or negative signs of coefficients in Equation (4), thus X3 and X22, showed significantly favorable effects but X1, X2, X2X3, and X12 presented significant unfavorable effects on the Cr adsorption capacity. The SS values and F-values showed that the first-order main influence of adsorption parameters followed the order: carbon dosage > initial concentration of Cr(VI) > initial solution pH. In conclusion, the higher initial Cr(VI) content of and the lower TAC dosage and initial solution pH helped the adsorption of Cr(VI) onto TAC.

3.3.2. Cr Sorption Capacity Response

Figure 2a,c,e shows the interactive effects among pH, carbon dosage, and initial Cr(VI) concentration on Cr adsorption capacity. Cr adsorption capacity decreased with the increasing carbon dosage and the solution pH, but increased with the increasing initial Cr(VI) concentration. According to the contour plots (Figure 2b,d,f), the interactive effects of initial solution pH and TAC dosage and of initial solution pH and Cr(VI) level were insignificant (p > 0.05), but there was a significant interactive impact between TAC dosage and initial Cr(VI) content (p < 0.05) on the Cr adsorption, which was the same as the analysis based on the Equation (4) and Table S2.

3.3.3. Optimum Parameters of Cr Sorption Capacity

From the regression Equation (4) and Figure 2, the optimum adsorption conditions for maximum Cr sorption capacity of 59.01 mg/g on TAC were an initial solution pH of 2.21, Cr(VI) concentration of 80 mg/L, and 0.4 g/L of TAC dosage, which agreed well with the conclusion mentioned above. Furthermore, under the optimum sorption conditions, the experimental value of 59.54 mg/g was in good accordance with the predicted value. For bael fruit shell carbon activated by H3PO4, the maximum removal (96.34%) was found at pH 6.39, initial Cr(VI) level of 7.51 mg/L, and activated carbon dosage of 2.18 g/L [9]. The difference of sorption conditions, especially the solution pH, was probably due to the different physiochemical characteristics of activated carbon and the sorption mechanism.

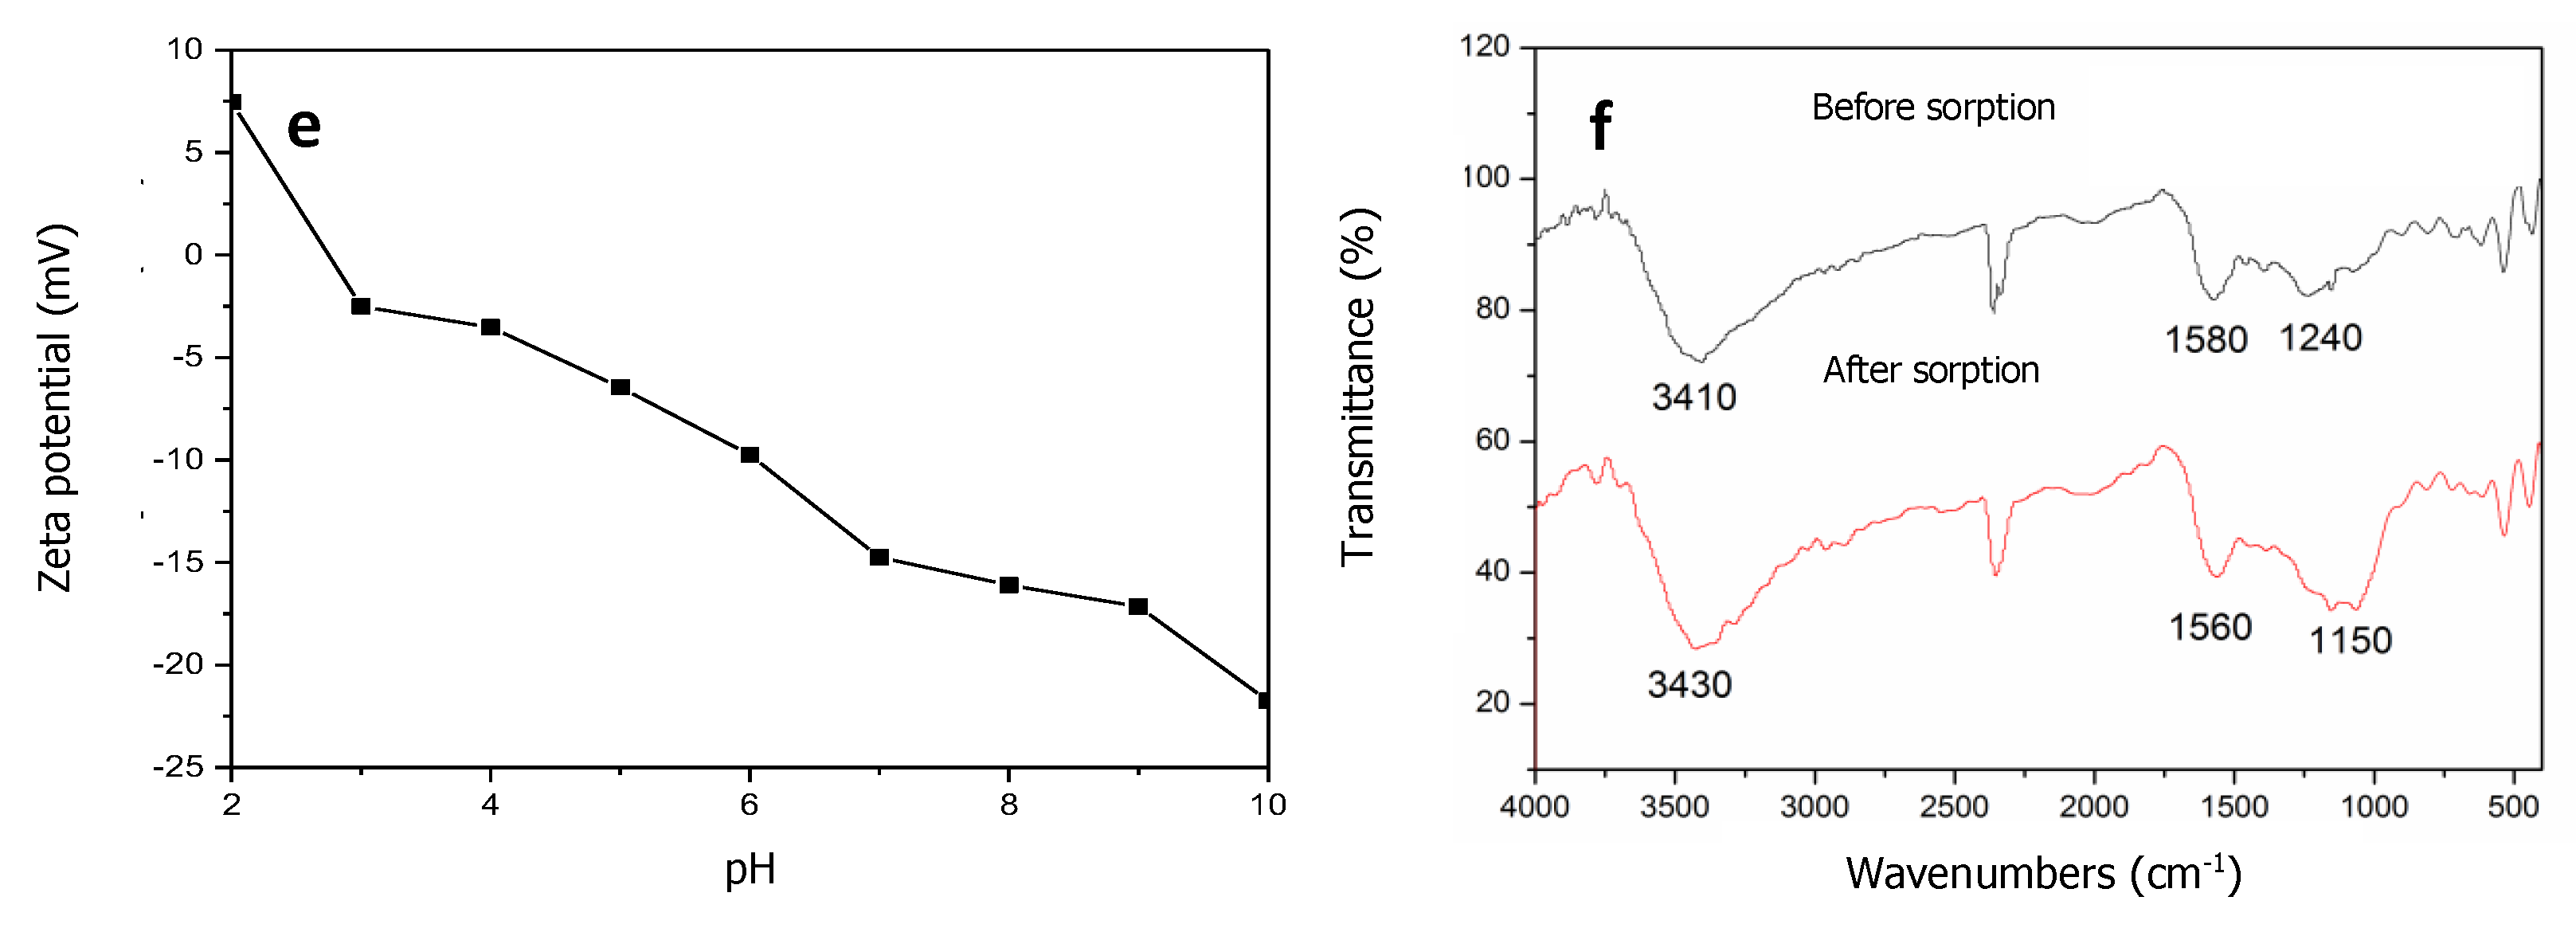
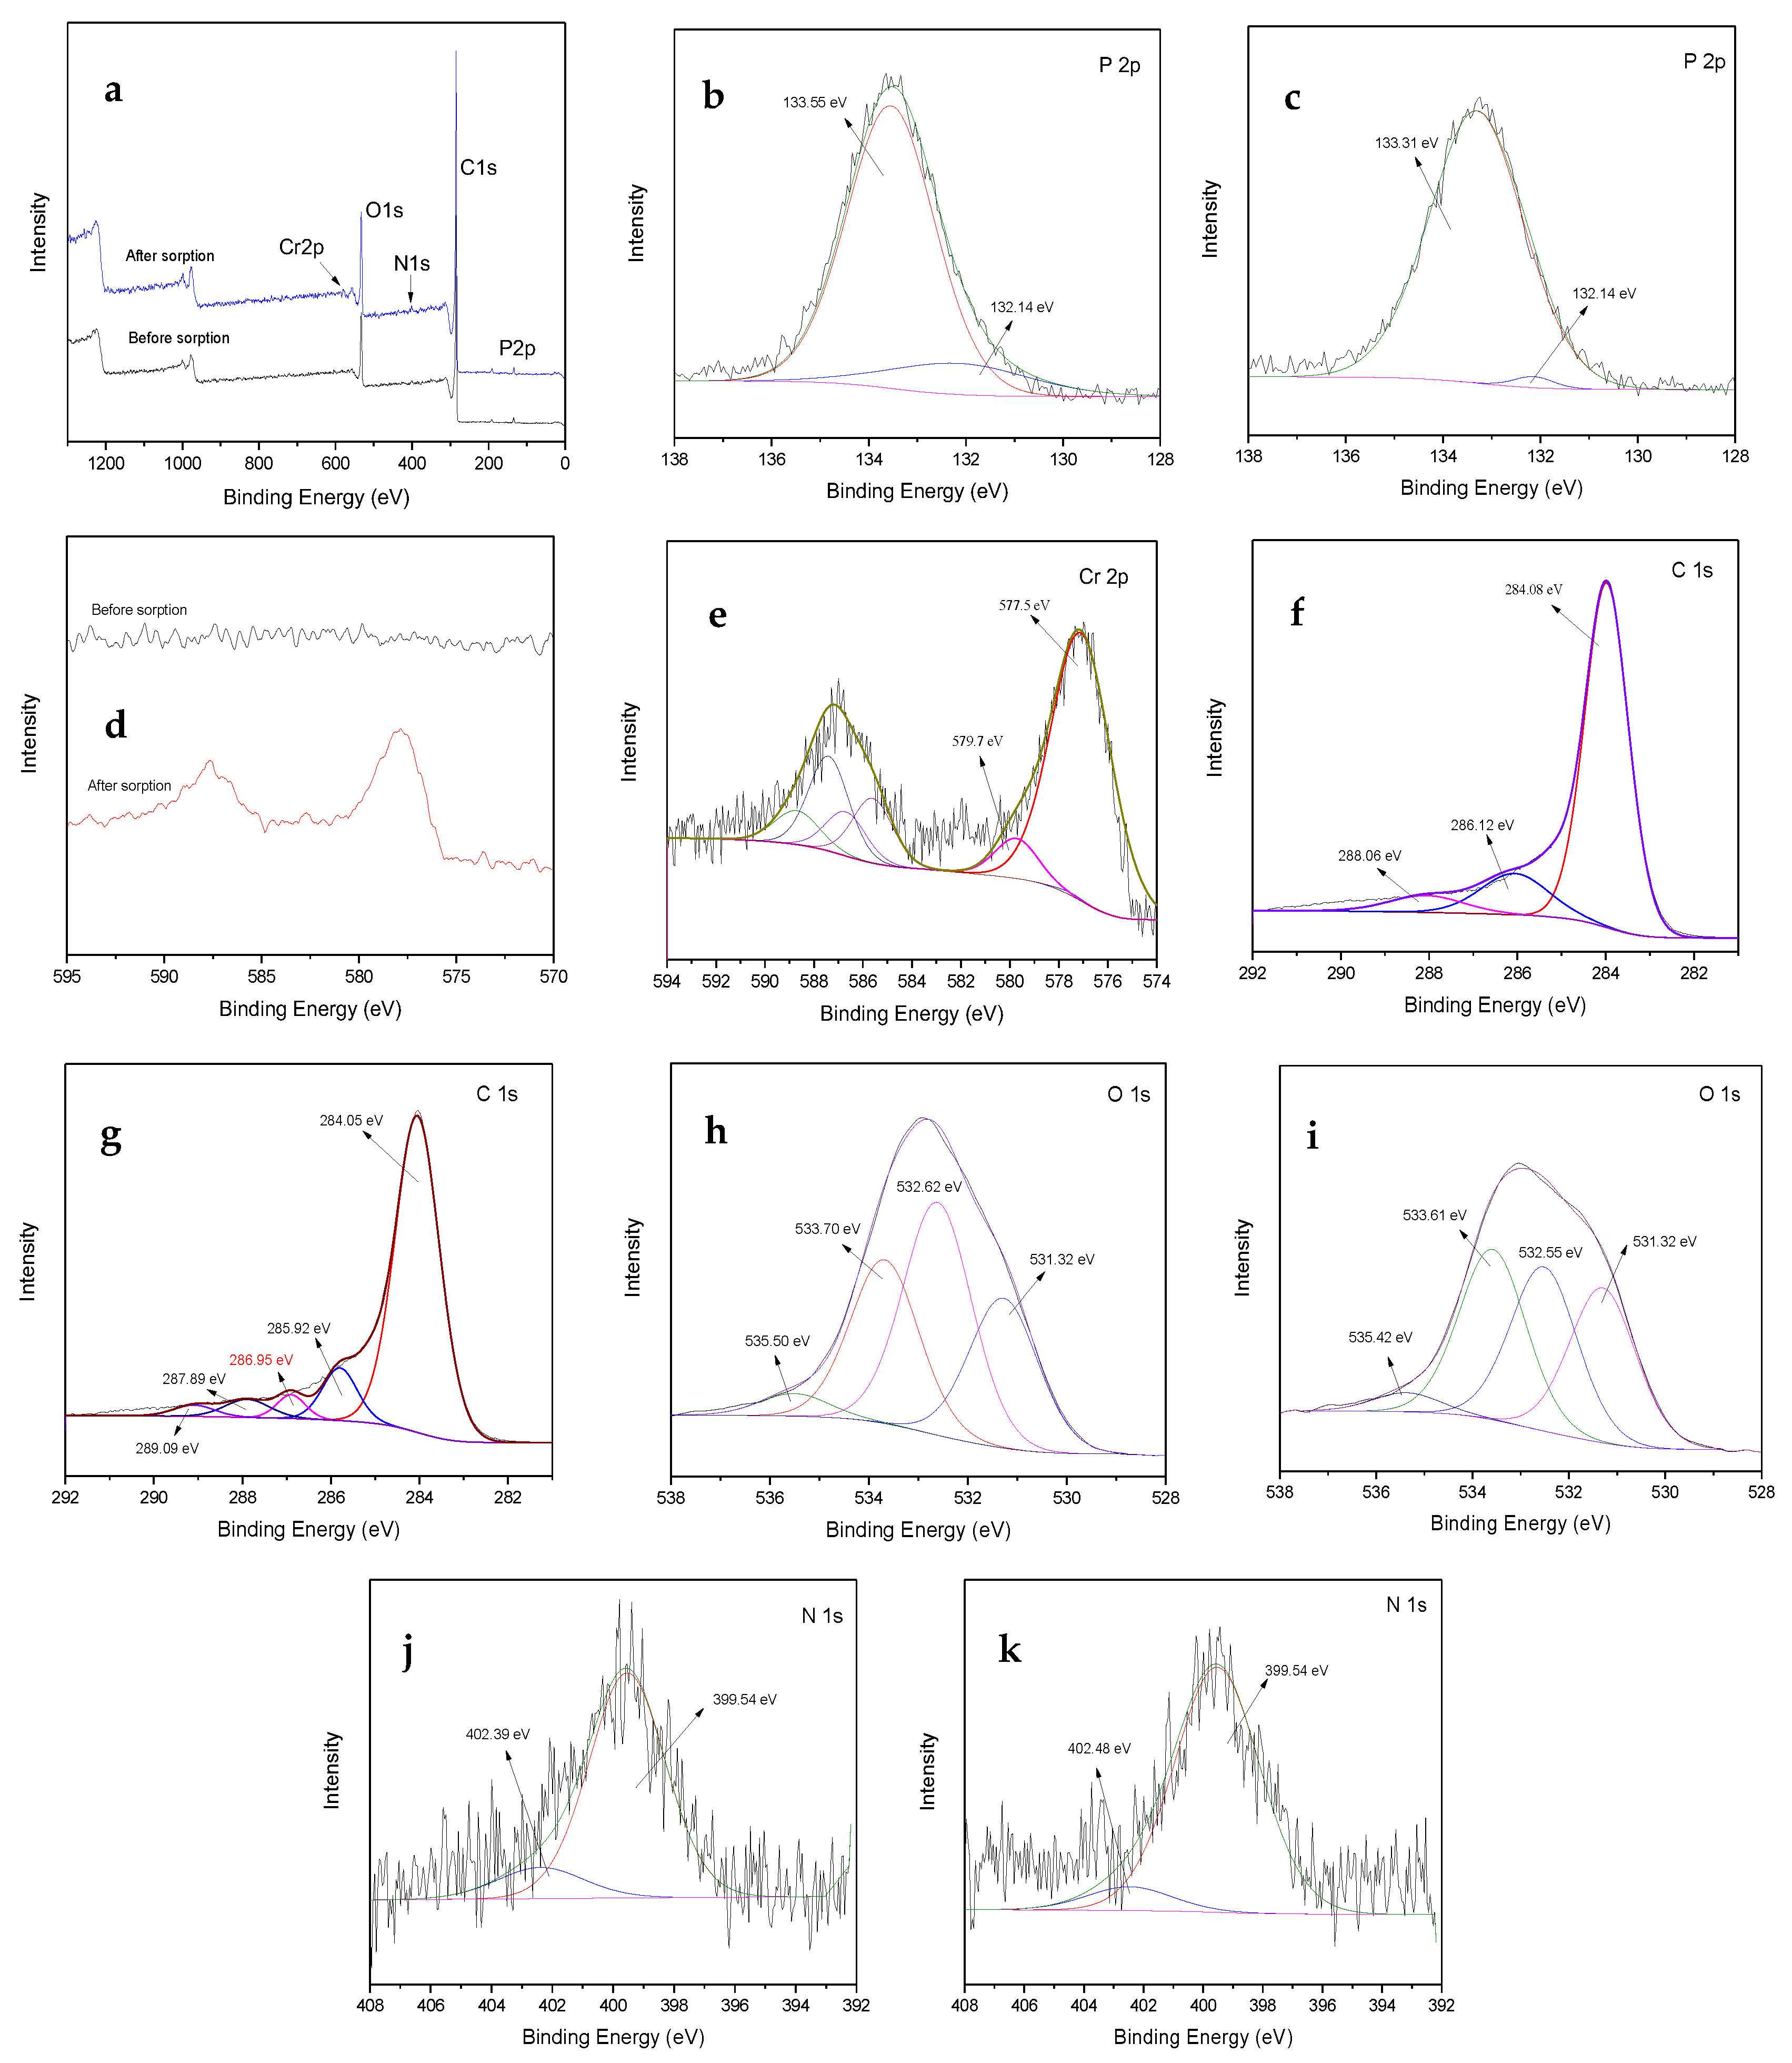
3.4. Characterization of Typha Angustifolia Activated Carbon and Cr Removal Mechanism

3.4.1. Physical Properties of Typha Angustifolia Activated Carbon

The external surface morphology of TAC was full of cavities of different size and shape (Figure 3a). As shown in Figure 3b,c, the N2 adsorption/desorption isotherm curve showed hysteresis loops in the relative pressure (P/P0) range, indicating that the TAC structure was mesoporous. The specific surface area, total volume pore, and average pore diameter was 789.32 m2/g, 0.81 cm3/g, and 4.09 nm, respectively. The internal pore structure of TAC examined by XRD exhibits that two broad peaks were observed near 2θ = 24° and 43°, which correspond to the (002) and (100) reflections, respectively (Figure 3d). The developed pores on the TAC surface could result from the evaporation of H3PO4 activator during carbonization. The occurrence of broad diffraction peaks at 2θ was an indicator of an increasing regularity of crystal structure caused by carbon in TAC and better layer arrangement [40]. The crystallization degree in the TAC depended on the chemical compositions of a high proportion of C in TAC [20]. The mesoporous nature was considered helpful for the accessibility of Cr(VI) to the surface of TAC, and the good physical characteristics helped the physical adsorption of Cr(VI) onto TAC, and the subsequent ion exchange, complexation, and reduction for Cr removal [4].

3.4.2. Chemical Properties of Typha Angustifolia Activated Carbon

The pH of the isoelectric point (pHIEP) is an important chemical characteristic for adsorbents. The zeta potential of the TAC decreased with the solution pH, and the pHIEP of TAC was found to be at pH 2.80 (Figure 3e). When the solution pH was lower than the pHIEP, the surface of TAC was net positively charged and easily electrostatically attracted Cr(VI) oxyanions. Conversely, the negatively charged TAC surface would hinder the adsorption of Cr(VI).
FTIR proved to be an important tool to qualitatively identify the functional groups that influenced chemical adsorption behaviors. The FTIR spectra of TAC before and after Cr(VI) adsorption are collected in Figure 3f. The broad bands at 3410 cm−1 represented vibrations of the hydrogen band (O–H) forming the hydroxyl groups (–OH) in carboxylic acids, alcohol hydroxyl groups, and N–H bonds of amine groups (–NH2). The absorbance at 1580 cm−1 reflected the stretching vibration of ester C=O in ketones, aldehydes, lactones, and carboxyl-stretching groups and the rocking vibration of –NH in primary amide groups [24]. The peak observed at 1240 cm−1 was assigned to the presence of bonds of P=O, O–C in P–O–C linkage, and P=OOH, and the weak peak at 1080–1070 cm−1 was contributed by ionized linkage of P+–O in acid phosphate esters and to symmetrical vibration in a chain of P–O–P [40]. The weak peak at 1370 cm−1 was ascribed to the C–H stretch vibration and also the intra-surface bending vibration of C–O–H [20]. These functional groups were in agreement with the C, O, H, P, and N compositions of TAC [20]. The oxygen-containing functional groups on the surfaces of TAC determined the surface acidity-basicity and the adsorption performance of TAC [40]. The shift in the band positions and change of the peak area of these groups after Cr(VI) adsorption indicated the electrostatic attraction and subsequent complexation and/or ion exchange between the Cr(VI) anion or the Cr(III) cation reduced from Cr(VI) and protonated –OH, –COOH, –CH, –CHO, –NH2, and phosphate (PO43) at low solution pH [3,4]. This helped the subsequent Cr(VI) anion’s reduction to the Cr(III) cation by reductive substances like CxOH (hydroxyl and carbonyl groups) on the TAC surface [4], which was proved by the following XPS results (Figure 4e,g).
Compared with the analysis of FTIR, the XPS can further effectively characterize the surface functional groups of TAC and offer more useful information on the adsorption mechanism. In the whole XPS spectra (Figure 4a), the appearance of P2p peaks indicated the successful incorporation of H3PO4 in TAC. Two main P2p peaks at 132.14 and 133.55 were assigned to P=O, and P–O–C, respectively (Figure 4b). This was consistent with the analysis of FTIR, where P mainly existed by bonding to O on the surface of TAC. The slight change of peak area at 132.14 cm−1 and shift of 133.55 cm−1 (Figure 4c) suggested the participation of groups containing P in Cr(VI) adsorption. The notable peaks assigned to Cr2p that emerged after adsorption indicated the successful adsorption of Cr(VI) on TAC (Figure 4d). A high-resolution Cr2p spectrum was obtained to further investigate the Cr(VI) adsorption mechanism onto TAC. The Cr2p spectrum was deconvoluted into peaks of Cr(III) (577.5 eV) and Cr(VI) (579.7 eV) (Figure 4e), indicating that both Cr(VI) and Cr(III) species existed on the TAC surface. Hence, it was reasonable to infer that part of the adsorbed Cr(VI) was reduced to Cr(III) by the oxidation of the functional groups of TAC, like C=O and C–O. Carbon, oxygen, and nitrogen-containing groups showed a crucial role during Cr(VI) adsorption. Before Cr(VI) adsorption, C1s spectra were deconvoluted into three peaks at 284.08, 286.12, and 288.06 eV, corresponding to the groups of C–C/C=C/C–H (aromatic), C–O (alcoholic)/C–OH/C–N, and C=O (carbonyl), respectively (Figure 4f) [20,24]. After Cr(VI) adsorption, new peaks at the bending energy of C–Cr (286.95 eV) and COO– (carboxyl and ester, 289.09 eV) emerged (Figure 4g). This indicated again that the Cr(VI) was reduced to Cr(III) by reductive substances contained in TAC at low solution pH. O1s spectra of TAC before sorption consisted of three peaks at 531.32, 532.62, and 533.70 and 536.50 eV, which were attributed to groups of C–OH/O–H, C–O–C, and –COOH, respectively (Figure 4h) [20,24]. After sorption, the location shift and area change of peaks (Figure 4i) suggested the occurrence of the chemical reaction between groups containing O with Cr(VI) or Cr(III) reduced from Cr(VI). The N1s region position with the maximum peak at 399.54 eV indicates that N mainly existed as primary or secondary amine groups, including C–NH or C–NH2, and the weak peak at 402.39 eV was contributed by the presence of N+/C–NH3+ (Figure 4j) [24]. The slight change of frequency and area of peaks containing N after Cr(VI) adsorption (Figure 4k) suggested that the amino groups should be responsible for the ion exchange between the exchangeable proton from amino groups and Cr(VI) [41].

3.5. Regeneration Evaluation of Typha Angustifolia Activated Carbon

As presented in Figure 1e, after five adsorption/desorption cycles, the adsorption capacity of Cr on recycled TAC under the optimum adsorption conditions remained at 45.03 mg/g and reduced by 24.37% compared to that of the first cycle (59.54 mg/g). The results indicated that TAC could be a potential cost-effective adsorbent for Cr removal due to its excellent regeneration performance.

4. Conclusions

H3PO4 activating Typha angustifolia L. optimized by Box–Behnken design was very efficient and cost-effective for preparation of activated carbon and for removal of Cr from aqueous solution. The optimum production conditions of TAC were 1.5 h, 469.02 °C, and impregnation ratio of 4 with an actual Cr removal ratio of 90.01% and 38.23% carbon yield. The optimum adsorption parameters were pH 2.21, 0.02 g TAC, and 80 mg/L Cr(VI) with an observed Cr adsorption capacity of 59.54 mg/g. The removal mechanism of Cr by TAC involved electrostatic attraction, ionic exchange, surface complexation, and oxidation-reduction. However, the adsorption experiments of Cr(VI) with raw cattail biomass and further optimization study should be performed to obtain TAC with better physio-chemical properties and Cr(VI) removal capacity.

Supplementary Materials

The models of adsorption thermodynamics, kinetics, and isotherms, Tables S1–S5, and Figures S1 and S2 are available online at https://www.mdpi.com/2073-4441/10/6/754/s1.

Author Contributions

Y.S. performed the experiments and wrote the draft, C.T. designed the study and revised the manuscript, X.H. provided fund, analyzed most of the data and drawn the Figures; L.J. analyzed some data; X.H. gave comments to the manuscript, and Y.Z. supervised the research.

Acknowledgments

This work was financially supported by the Research foundation of Education Department of Hunan Province of China (Grant No. 16A221), the Science and Technology Planning Foundation of China Hunan Province (Grant No. 2017SK2361), the National Natural Science Foundation of China (Grant No. 51608208), and the Project funded by China Postdoctoral Science Foundation (Grant No. 2017M610513). We appreciate the Editors and Reviewers for their precious comments on our manuscript.

Conflicts of Interest

There are no conflicts of interest to declare.

References

  1. Demiral, H.; Demiral, İ.; Tümsek, F.; Karabacakoğlu, B. Adsorption of chromium(VI) from aqueous solution by activated carbon derived from olive bagasse and applicability of different adsorption models. Chem. Eng. J. 2008, 144, 188–196. [Google Scholar] [CrossRef]
  2. Wise, J.P., Jr.; Wise, J.T.F.; Wise, C.F.; Wise, S.S.; Gianios, C., Jr.; Xie, H.; Thompson, W.D.; Perkins, C.; Falank, C.; Wise, J.P., Sr. Concentrations of the genotoxic metals, chromium and nickel, in whales, tar balls, oil slicks, and released oil from the Gulf of Mexico in the immediate aftermath of the deepwater horizon oil crisis: Is genotoxic metal exposure part of the deepwater horizon legacy. Environ. Sci. Technol. 2014, 48, 2997–3006. [Google Scholar] [PubMed]
  3. Li, W.; Gong, X.; Xin, L.; Zhang, D.; Gong, H. Removal of Cr(VI) from low-temperature micro-polluted surface water by tannic acid immobilized powdered activated carbon. Bioresour. Technol. 2012, 113, 106–113. [Google Scholar] [CrossRef] [PubMed]
  4. Zhang, J.; Chen, S.; Zhang, H.; Wang, X. Removal behaviors and mechanisms of hexavalent chromium from aqueous solution by cephalosporin residue and derived chars. Bioresour. Technol. 2017, 238, 484–491. [Google Scholar] [CrossRef] [PubMed]
  5. Sahu, J.N.; Acharya, J.; Meikap, B.C. Response surface modeling and optimization of chromium(VI) removal from aqueous solution using Tamarind wood activated carbon in batch process. J. Hazard. Mater. 2009, 172, 818–825. [Google Scholar] [CrossRef] [PubMed]
  6. Sadyrbaeva, T.Z. Removal of chromium(VI) from aqueous solutions using a novel hybrid liquid membrane-electrodialysis process. Chem. Eng. Process. Process Intensif. 2015, 99, 183–191. [Google Scholar] [CrossRef]
  7. Dubey, S.P.; Sillanpaa, M.; Varma, R.S. Reduction of hexavalent chromium using Sorbaria sorbifolia aqueous leaf extract. Appl. Sci. 2018, 7, 715. [Google Scholar] [CrossRef]
  8. Mekatel, H.; Amokrane, S.; Benturki, A.; Nibou, D. Treatment of polluted aqueous solutions by Ni2+, Pb2+, Zn2+, Cr6+, Cd2+ and Co2+ ions by ion exchange process using faujasite zeolite. Procedia Eng. 2012, 33, 52–57. [Google Scholar] [CrossRef]
  9. Gottipati, R.; Mishra, S. Process optimization of adsorption of Cr(VI) on activated carbons prepared from plant precursors by a two-level full factorial design. Chem. Eng. J. 2010, 160, 99–107. [Google Scholar] [CrossRef]
  10. Han, Y.; Xi, C.; Xin, O.; Sohi, S.P.; Chen, J. Adsorption kinetics of magnetic biochar derived from peanut hull on removal of Cr(VI) from aqueous solution: Effects of production conditions and particle size. Chemosphere 2016, 145, 336–341. [Google Scholar] [CrossRef] [PubMed]
  11. Jiang, L.; Liu, S.; Liu, Y.; Zeng, G.; Guo, Y.; Yin, Y.; Huang, X. Enhanced adsorption of hexavalent chromium by a biochar derived from ramie biomass (Boehmeria nivea (L.) Gaud.) modified with β-cyclodextrin/poly (L-glutamic acid). Environ. Sci. Pollut. Res. 2017, 24, 23528–23537. [Google Scholar]
  12. Zhao, D.; Gao, X.; Wu, C.; Xie, R.; Feng, S.; Chen, C. Facile preparation of amino functionalized graphene oxide decorated with Fe3O4 nanoparticles for the adsorption of Cr(VI). Appl. Surf. Sci. 2016, 384, 1–9. [Google Scholar] [CrossRef]
  13. Chen, H.; Yan, T.; Jiang, F. Adsorption of Cr(VI) from aqueous solution on mesoporous carbon nitride. J. Taiwan Inst. Chem. Eng. 2014, 45, 1842–1849. [Google Scholar] [CrossRef]
  14. Hamadi, N.K.; Chen, X.D.; Farid, M.M.; Lu, M.G. Adsorption kinetics for the removal chromium(VI) aqueous solution by adsorbents derived from used tyres sawdust. Chem. Eng. J. 2001, 84, 95–105. [Google Scholar] [CrossRef]
  15. Karthikeyan, T.; Rajgopal, S.; Miranda, L.R. Chromium(VI) adsorption from aqueous solution by Hevea brasilinesis sawdust activated carbon. J. Hazard. Mater. 2005, 124, 192–199. [Google Scholar] [CrossRef] [PubMed]
  16. Al-Othman, Z.A.; Ali, R.; Naushad, M. Hexavalent chromium removal from aqueous medium by activated carbon prepared from peanut shell: Adsorption kinetics, equilibrium and thermodynamic studies. Chem. Eng. J. 2012, 184, 238–247. [Google Scholar] [CrossRef]
  17. Gratuito, M.K.B.; Panyathanmaporn, T.; Chumnanklang, R.A.; Sirinuntawittaya, N.; Dutta, A. Production of activated carbon from coconut shell: Optimization using response surface methodology. Bioresour. Technol. 2008, 99, 4887–4895. [Google Scholar] [CrossRef] [PubMed]
  18. Liu, H.; Liang, S.; Gao, J.; Ngo, H.H.; Guo, W.; Guo, Z. Enhancement of Cr(VI) removal by modifying activated carbon developed from Zizania caduciflora with tartaric acid during phosphoric acid activation. Chem. Eng. J. 2014, 246, 168–174. [Google Scholar] [CrossRef]
  19. Tang, C.; Song, J.; Hu, X.; Hu, X.; Zhao, Y.; Li, B.; Ou, D.; Peng, L. Exogenous spermidine enhanced Pb tolerance in Salix matsudana by promoting Pb accumulation in roots and spermidine, nitric oxide, and antioxidant system levels in leaves. Ecol. Eng. 2017, 107, 41–48. [Google Scholar] [CrossRef]
  20. Tang, C.; Shu, Y.; Zhang, R.; Li, X.; Song, J.; Li, B.; Zhang, Y.; Ou, D. Comparison removal and adsorption mechanism of cadmium and lead from aqueous solution by activated carbons prepared from Typha angustifolia and Salix matsudana. RSC Adv. 2017, 7, 16092–16103. [Google Scholar] [CrossRef]
  21. Toles, C.A.; Marshall, W.E.; Johns, M.M.; Wartelle, L.H.; Mcaloon, A. Acid-activated carbons from almond shells: physical, chemical and adsorptive properties and estimated cost of production. Bioresour. Technol. 2000, 71, 87–92. [Google Scholar] [CrossRef]
  22. Box, G.E.P.; Behnken, D.W. Simplex-sum designs: a class of second order rotatable designs derivable from those of first order. Ann. Math. Stat. 1960, 31, 838–864. [Google Scholar] [CrossRef]
  23. Sen, R.; Swaminathan, T. Response surface modeling and optimization to elucidate and analyze the effects of inoculum age and size on surfactin production. Biochem. Eng. J. 2004, 21, 141–148. [Google Scholar] [CrossRef]
  24. Prahas, D.; Kartika, Y.; Indraswati, N.; Ismadji, S. Studies of cadmium(II), lead(II), nickel(II), cobalt(II) and chromium(VI) sorption on extracellular polymeric substances produced by Rhodococcus opacus and Rhodococcus rhodochrous. Chem. Eng. J. 2008, 140, 32–42. [Google Scholar] [CrossRef]
  25. Li, W.; Zhang, L.B.; Peng, J.H.; Li, N.; Zhu, X.Y. Preparation of high surface area activated carbons from tobacco stems with K2CO3 activation using microwave radiation. Ind. Crop Prod. 2008, 27, 341–347. [Google Scholar] [CrossRef]
  26. Cotton, A.F.; Wilkinson, G.; Bochmann, M.; Murillo, C.A. Advanced Inorganic Chemistry; Wiley: New Delhi, India, 1999. [Google Scholar]
  27. Palmer, C.D.; Puls, R.W. Natural Attenuation of Hexavalent Chromium in Groundwater and Soils; American Environmental Protection Agency: Washington, DC, USA, 1994. [Google Scholar]
  28. Stumm, W. The Inner-Sphere Surface Complex: A Key to Understanding Surface Reactivity; American Chemical Society: Washington, DC, USA, 1995. [Google Scholar]
  29. Yusof, A.M.; Malek, N.A.N.N. Removal of Cr(VI) and As(V) from aqueous solutions by HDTMA-modified zeolite Y. J. Hazard. Mater. 2009, 162, 1019–1024. [Google Scholar] [CrossRef] [PubMed]
  30. Kampalanonwat, P.; Supaphol, P. The study of competitive adsorption of heavy metal ions from aqueous solution by aminated polyacrylonitrile nanofiber mats. Energy Procedia 2014, 56, 142–151. [Google Scholar] [CrossRef]
  31. Nemeş, L.; Bulgariu, L. Optimization of process parameters for heavy metals biosorption onto mustard waste biomass. Open Chem. 2016, 14, 175–187. [Google Scholar] [CrossRef]
  32. Liu, Z.R.; Zhou, L.M.; Wei, P.; Zeng, K.; Wen, C.X.; Lan, H.H. Competitive adsorption of heavy metal ions on peat. J. China Univ. Min. Technol. 2008, 18, 255–260. [Google Scholar] [CrossRef]
  33. Bayo, J. Kinetic studies for Cd(II) biosorption from treated urban effluents by native grapefruit biomass (Citrus paradisi L.): The competitive effect of Pb(II), Cu(II) and Ni(II). Chem. Eng. J. 2012, 191, 278–287. [Google Scholar]
  34. De Lemos, M.J.S.; Silva, R.A. Turbulent flow over a layer of a highly permeable medium simulated with a diffusion-jump model for the interface. Int. J. Heat Mass Transf. 2006, 49, 546–556. [Google Scholar] [CrossRef]
  35. Örnek, A.; Özacar, M.; Şengil, İ.A. Adsorption of lead onto formaldehyde or sulphuric acid treated acorn waste: equilibrium and kinetic studies. Biochem. Eng. J. 2007, 37, 192–200. [Google Scholar] [CrossRef]
  36. Mohan, D.; Singh, K.P.; Singh, V.K. Trivalent chromium removal from wastewater using low cost activated carbon derived from agricultural waste material and activated carbon fabric cloth. J. Hazard. Mater. 2006, 135, 280–295. [Google Scholar] [CrossRef] [PubMed]
  37. Depci, T.; Kul, A.R.; Önal, Y. Competitive adsorption of lead and zinc from aqueous solution on activated carbon prepared from Van apple pulp: Study in single- and multi-solute systems. Chem. Eng. J. 2012, 200–202, 224–236. [Google Scholar]
  38. Chen, H.; Dai, G.; Zhao, J.; Zhong, A.; Wu, J.; Yan, H. Removal of copper(II) ions by a biosorbent-Cinnamomum camphora leaves powder. J. Hazard. Mater. 2010, 177, 228–236. [Google Scholar] [CrossRef] [PubMed]
  39. Futalan, C.M.; Kan, C.C.; Dalida, M.L.; Hsien, K.J.; Pascua, C.; Wan, M.W. Comparative and competitive adsorption of copper, lead, and nickel using chitosan immobilized on bentonite. Carbohydr. Polym. 2011, 83, 528–536. [Google Scholar] [CrossRef]
  40. Dobrowolski, R.; Szcześ, A.; Czemierska, M.; Jarosz-Wikołazka, A. Activated carbon from jackfruit peel waste by H3PO4 chemical activation: Pore structure and surface chemistry characterization. Bioresour. Technol. 2017, 225, 113–120. [Google Scholar] [CrossRef] [PubMed]
  41. Igberase, E.; Osifo, P.; Ofomaja, A. Chromium(VI) ion adsorption by grafted cross-linked chitosan beads in aqueous solution-a mathematical and statistical modeling study. Environ. Technol. 2017, 38, 3156–3166. [Google Scholar] [CrossRef] [PubMed]
Figure 1. Plots of (a) initial solution pH effect (T = 25 °C, m/V = 2 g/L, t = 60 min, and C0 = 50 mg/L); (b) contact time (T = 25 °C, pH = 3.0, m/V = 2 g/L, and C0 = 50 mg/L), (c) adsorbent dosage (T = 25 °C, pH = 3.0, t = 60 min, and C0 = 50 mg/L); (d) temperature (pH = 3.0, m/V = 2 g/L, t = 60 min, and C0 = 50 mg/L); and (e) regenerated Typha angustifolia activated carbon on Cr adsorption capacity and/or removal efficiency on Typha angustifolia activated carbon, respectively.
Water 10 00754 g001aWater 10 00754 g001b
Figure 2. 3D surface mapping and contour plots for combined effects of (a,b) pH and carbon dosage (C0 = 50 mg/L, t = 120 min, T = 25 °C); (c,d) pH and initial concentration (m/V = 2.0 g/L, t = 120 min, T = 25 °C); and (e,f) carbon dosage and initial concentration (pH = 3.0, t = 120 min, T = 25 °C) on Cr adsorption capacity on Typha angustifolia activated carbon.
Water 10 00754 g002
Figure 3. Characterizations of (a) SEM micrographs; (b) pore size distribution; (c) nitrogen adsorption-desorption isotherms; (d) X-ray diffraction result; (e) Zeta potential; and (f) FTIR spectra of Typha angustifolia activated carbon.
Water 10 00754 g003aWater 10 00754 g003b
Figure 4. X-ray photoelectron spectroscopy of Typha angustifolia activated carbon: (a) whole; (b) and (c) high resolution P2p; (d,e) Cr2p; (f,g) C1s; (h,i) O1s; and (j,k) N1s spectra before and after adsorption, respectively.
Water 10 00754 g004
Table 1. Constants of four kinetic models for Cr adsorption onto Typha angustifolia activated carbon.
ModelsParametersCr
50 mg/L100 mg/L150 mg/L
Pseudo-first-order modelqe,exp (mg/g)21.1932.4938.86
qe,cal (mg/g)8.6613.8413.03
k1 (1/min)0.0650.0710.083
R20.9110.9070.948
χ20.3470.4390.312
RMSE0.5890.6620.559
Pseudo-second-order modelqe,cal (mg/g)22.0833.7839.68
k2 (g/mg·min)0.0120.0080.012
R20.9980.9980.998
χ20.0050.0023.5 × 10−4
RMSE0.0720.0420.019
Elovich modela22.0913.188.44
b4.0924.6173.039
R20.7720.8290.807
χ24.5749.96310.499
RMSE2.1393.1573.240
Intra-particle diffusion modelkid (mg/g·min−1/2)1.2281.5380.951
R20.5570.6450.634
Table 2. Isotherm parameters for Cr adsorption on Typha angustifolia activated carbon at different temperatures.
ModelsParametersCr
15 °C25 °C35 °C
LangmuirQm (mg/g)43.9243.2643.01
Ka (L/mg)0.0900.1090.132
R20.9850.9870.984
χ22.9362.5863.362
RMSE1.7131.6081.833
FreundlichKF [(mg/g)/(mg/L)n]8.9419.77310.692
1/n2.9563.1123.269
R20.9220.9230.923
χ215.38715.31615.807
RMSE3.9233.9143.976
D–RB (mol2/J2)1.1 × 10−57.2 × 10−65.5 × 10⁻⁶
Qm (mg/g)37.0636.9237.53
R20.88740.87970.8750
χ219.40020.95222.393
RMSE4.4044.5774.732
TemkinKTE1.2121.5401.959
b282.04302.97321.73
R20.97750.97970.9816
χ23.9363.5453.290
RMSE1.9841.8831.814
Table 3. Parameters for nature judgment and thermodynamics of Cr adsorption on Typha angustifolia activated carbon.
MetalT (°C)nKaRLmaxRLminB (mol2/J2)E (kJ/mol)
2882.9560.0900.3570.0531.1 × 10−50.302
Cr2983.1120.1090.3140.0467.2 × 10−60.373
3083.2690.1320.2750.0365.5 × 10−60.426
lnKcΔG0 (kJ/mol)ΔH0 (kJ/mol)ΔS0 (J/mol·K)
2881.534−11.08 8.4942.33
2931.595−12.01
Cr2981.691−13.44
3031.740−14.35
3081.765−14.96
3131.815−15.98

