Water Resources Sustainability of Ulaanbaatar City, Mongolia


1
Department of Earth System Sciences, Yonsei University, Seoul 03722, Korea
2
School of Geology and Mining Engineering, Mongolian University of Science and Technology, Ulaanbaatar 216046, Mongolia
3
Institute of Natural Sciences, Yonsei University, Seoul 03722, Korea
*
Author to whom correspondence should be addressed.
Water 2018, 10(6), 750; https://doi.org/10.3390/w10060750
Submission received: 17 May 2018
/
Revised: 31 May 2018
/
Accepted: 5 June 2018
/
Published: 8 June 2018
(This article belongs to the Section Hydrology)
Abstract
:Ulaanbaatar (UB), the capital of Mongolia, is one of the fastest-growing cities in the developing world. Due to increasing demand driven by rapid population and industrial growth, sustainable water resource management is required. Therefore, we investigated sustainability in UB from the perspective of water quality. During five sampling campaigns, we collected 135 water samples (58 from bedrock wells, 44 from shallow wells tapped into the alluvial aquifer, 24 from rivers, and 9 from springs). The hydrochemistry of the water samples was controlled by two major processes: NO3 contamination, and silicate and carbonate mineral weathering. The groundwater samples could be classified into three groups based on their NO3 levels and spatial distribution. Group 1 had natural background NO3 levels (median: 1.7 mg/L) and silicate weathering–dominant water–rock interactions and was distributed in the alluvial aquifer along the floodplain. Group 2 was dominated by carbonate weathering processes, had a maximum NO3 concentration of 47.4 mg/L, and was distributed between the riverbank and upslope area; overall, it reflected ongoing contamination. Group 3 was distributed in the upslope Ger districts and showed significant NO3 contamination (range: 64.0–305.4 mg/L) due to dense and poor living conditions. The stable isotope signatures indicated that the city’s major water supply from riverbank filtration (i.e., Group 1 wells) mixed dynamically with the river; therefore, it showed no sign of NO3 contamination. However, the isotope values and bedrock groundwater quality of wells in Groups 2 and 3 implied that they were closely connected, with the same water source, and showed a strong potential for expanding NO3 contamination toward Group 1 wells. To support sustainable development in UB, the implementation of appropriate institutional measures to protect and preserve water resources, with systematic spatio-temporal monitoring and a focus on Ger districts, is crucial.
1. Introduction
Mongolia, a landlocked country in central Asia, has a total area of about 1.5 million km2 and an average altitude of 1580 m. Its climate is semi-arid to arid, with the mean annual precipitation ranging from 400 mm in the north to less than 50 mm in the southern Gobi region [1]. Due to global warming, the temperature in Mongolia has increased at least 2.14 °C since 1940 and is projected to increase by up to 5 °C by the end of the 21st century [2].
As the political, industrial, and economic center of Mongolia, Ulaanbaatar (UB) is one of the fastest-growing cities in the developing world [3]. Rapid industrial development, including that in textiles, tanning, food processing, energy production, communications, and construction, is concentrated primarily in UB and has attracted people from rural areas, resulting in significant growth in the city’s population from about 0.5 million in 1989 to 1.2 million in 2016 [4,5]. The rapid introduction of rural people into the city and the residential areas along the hillslope surrounding it (Ger districts) has caused many issues, including those related to water supply and waste treatment infrastructure.
Urban development in UB during the last several decades has caused a dramatic increase in water demand for drinking, domestic, and industrial use. As the city is located along the Tuul River, the central urban area receives water predominantly from wells tapped into the alluvial aquifer, a system that relies on bank filtration [6]. However, the expansion of the city has outpaced that of its infrastructure. Pipeline water distribution is limited to the urban center, and most residents in the outskirts purchase water for drinking and daily domestic use from kiosks. Most kiosks are associated with wells tapped into the bedrock aquifer, through which groundwater eventually discharges and feeds the river [7]. Consequently, the water level in the source zone, the alluvial aquifer, declined from 1.6 m in 1948 to 3.1 m in 1998 [8]. Seasonal water shortages have become increasingly common, and researchers have warned that the city will face critical water shortages in the near future [9,10].
Industrial activities have become the principal sources of air, water, and soil contamination in and around UB. The quality of its water sources meets the standards for drinking and industrial uses, with concentrations of total dissolved solids (TDS) ranging from 60 to 100 mg/L, remaining unaffected by sources of pollution in the city [10]. However, since the late 1990s, water quality in the downstream area of the Tuul River has deteriorated, due mainly to urban and industrial pollution [11,12,13,14,15]. Moreover, the unplanned expansion of Ger districts around the city has created a high potential for water contamination due to a lack of appropriate sanitation and sewage systems, which are based on pit latrines. By consequence, the area around UB has changed dramatically with the rapid growth of the city, which could have severe environmental consequences [16,17,18].
Water resource security, which is considered to reflect rapid development in developing countries, has worsened in terms of quantity and quality, becoming a critical issue in UB. This issue raises the question of whether development in UB could be sustainable in the face of limited water resources and degrading environmental quality [19,20,21,22]. Studies of water resources in UB have focused mainly on groundwater availability [23,24,25,26,27,28], and limited information is available on water quality in this city. High levels of U in groundwater (mean concentration: 4.6 μg/L) originating from local geogenic sources have been reported [29]. In addition, the influence of land use on groundwater quality in UB was recently assessed [30]. In this study, we evaluated sustainability in UB from the perspective of water quality issues by gaining a scientific understanding of the interactions between the Tuul River and aquifer groundwater and determining the spatio-temporal variation in the concentration of NO3, the most common pollutant in areas without proper waste treatment systems, in the water system.
2. Methods
2.1. Study Area
UB is located in central Mongolia (47°55′12 N, 106°55′12 E), which is a continental country with a cold, semi-arid climate (Figure 1). The mean altitude is about 1350 m a.s.l. [31]. UB relies on groundwater drawn from the alluvial aquifer along the Tuul River, where a bank filtration system is operated [7]. The city pumps groundwater at an average rate of 150,000 m3/day to supply inner-city residences and industries [4]. By contrast, residents living on the outskirts of the city in Ger districts use hand-dug wells as independent sources of water or purchase water at kiosks that function as local distribution centers for water pumped from the alluvial aquifer [7].
The Tuul River originates in the Khentii Mountains and generally flows from north-east to south-west in a variably meandering channel. Its total length is 704 km, with a total catchment area of 49,840 km2. The continental climatic features are characterized by wide variation in annual, monthly, and daily temperatures with cold, long winters and warm summers. About 74% of the annual precipitation falls during summer, from June to August. During winter (November–March), the ground is frozen, and precipitation accumulates as snow. Snow usually falls between mid-October and mid-April. In winter months, thick snow covers the surrounding mountains, which remain covered until early April. The annual average air temperature is −1.2 °C; the temperature reaches the minimum of −39.6 °C in January and the maximum of 34.5 °C during summer [13]. The width of the Tuul River around UB is about 35 m; however, it is reduced to 5−18 m in the dry season. Average depth of the river is about 1.3 m from May to Nov., with the most shallow during March to April (about 0.6 m) and the deepest of 2.1 m in July 1993. The surface water in UB is partially to completely frozen from December to February. The flow begins gradually in spring (March), and discharge increases gradually to a maximum in the rainy season (July–August) [6,7,10,28].
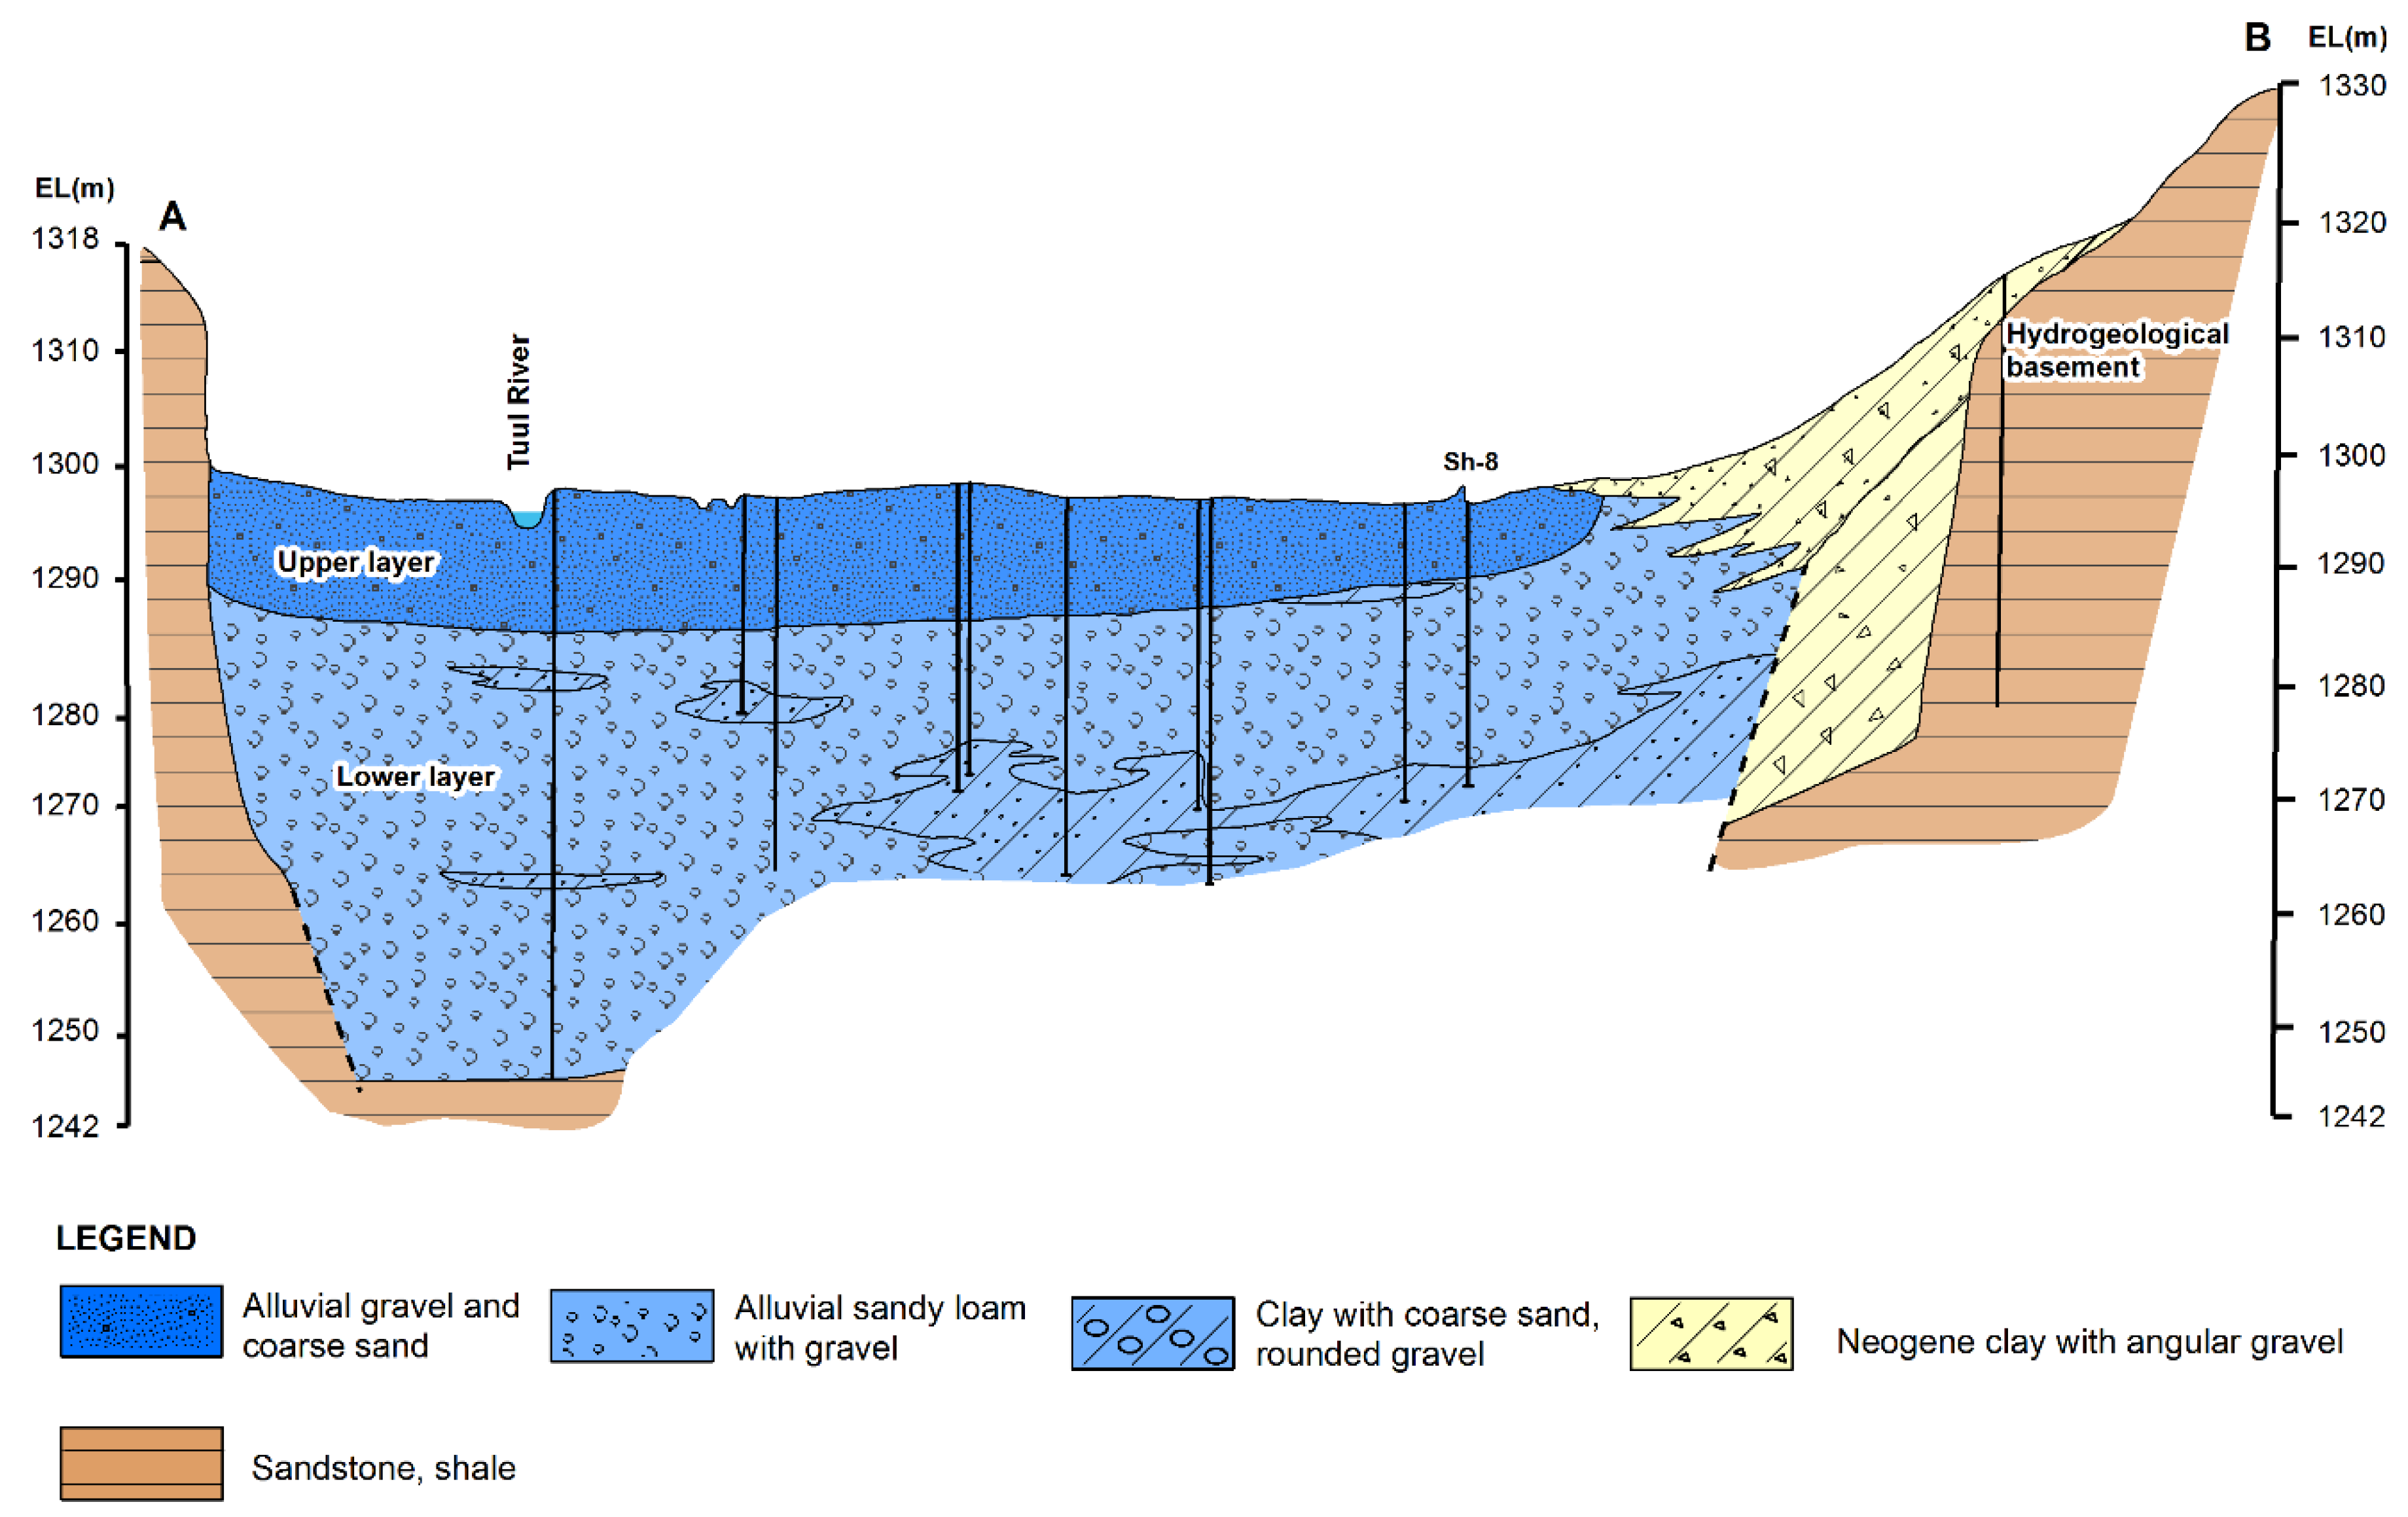
The geological features of the study area consist mainly of Devonian and Carboniferous sedimentary rocks of very low permeability intruded by granite, characterized as the basement rock (Figure 2). This basement rock is overlain by Cretaceous sandstone and mudstone, clay and sand of Neogene deposits, and Quaternary sand and gravel deposits. Quaternary deposits are also distributed widely throughout the Tuul River Basin [6,32].
The alluvial aquifer is composed of sediments forming two unconfined layers, which differ primarily in composition, porosity, and water saturation (Figure 2). The upper layer consists mainly of unconsolidated gravel and boulders, and coarse sand fills the voids, representing 15–30% of the sediment by volume. The thickness ranges from 2 to 30 m (average: 25 m) and generally increases toward the center of the river basin [6,33]. The lower layer extends down to the Neogene and Carboniferous deposits, with a thickness ranging from 3 to 20 m. Its composition is similar to that of the upper layer, with occasional clay-dominant lenses. Fine silty sand and clay fill the voids between gravel and boulder particles and, in some areas, create clay layers ranging from a few centimeters to 5–8 m thick. Although the composition of the alluvial aquifer is generally uniform, the presence of clay-dominant soil with low permeability creates semi-confined conditions locally in some strata, where the lower layer of the aquifer yields less water compared with the overlying layer [32,34].
2.2. Water Sample Collection and Analysis
To gain a scientific understanding of the interaction between the Tuul River and groundwater in the aquifer and to clarify the spatio-temporal variation in NO3 concentrations in water, we used seasonal monitoring of water resources with hydrochemical and isotopic analyses and interpreted the spatio-temporal data using statistical approaches.
We collected 135 water samples from 40 sites to determine the dissolved ion composition and stable isotopic (i.e., O and H) ratios of water. The samples were collected from bedrock wells in the Ger districts (n = 58), shallow wells in the alluvial aquifer (n = 44), the river (n = 24), and springs (n = 9). The groundwater samples were taken from drinking water wells and shallow wells tapped into the alluvial aquifer for the central public water supply in UB. Shallow wells were <20 m deep, and deep bedrock wells were >20 m deep. Five sampling campaigns were conducted during August 2010, February 2011, October 2011, April 2012, and July 2017 to assess seasonal changes. In addition, two snow and two rain samples were collected from September to October 2010 and in July 2017, respectively. Additional precipitation data for UB from 1990 to 2001 were retrieved from the International Atomic Energy Agency database [35].
Water samples were filtered through 0.45-μm membrane filters, sealed in 30-mL polyethylene bottles, stored in an ice box, and transported to the Korean Basic Science Institute (KBSI; Daejeon, Korea) and Yonsei University (Seoul, Korea). They were analyzed for major ions and trace elements, including Na, K, Ca, Mg, Si, Fe, Mn, Zn, Ni, Cd, Co, Cr, Cu, Pb, As, Hg, HCO3, Cl, SO4, and NO3, using Inductively Coupled Plasma Atomic Emission Spectroscopy (ICP-AES, JY Ultima 2; Horiba, Tokyo, Japan) at the KBSI and the Ion Chromatography (IC, model 883 Basic IC plus; Metrohm AG, Herisau, Switzerland) of Yonsei University. Levels of all trace elements were below the detection limits; therefore, they were not considered in the subsequent analyses. Isotopic signatures (δ18O and δ2H) were analyzed using a stable isotope ratio mass spectrometer (IsoPrime; GV Instruments Ltd., Manchester, UK) at the KBSI. All δ18O and δ2H data were reported using the conventional δ notation, according to the Vienna standard mean ocean water (V-SMOW) standard, Equation (1) as follows:
where, Rsample is the isotopic ratio of 18O/16O or D/H of a water sample, and RSMOW is the isotopic ratio of 18O/16O or D/H of the V-SMOW standard. The analytical reproducibility was ±0.1‰ and ±0.5‰ for δ18O and δ2H, respectively.
Using the SPSS software (ver. 16.0; SPSS Inc., Chicago, IL, USA), a multivariate technique was applied to delineate the relationship of the spatial variation in water chemistry to NO3 contamination in the water. Hierarchical cluster analysis (HCA) was applied to identify groups obtaining similarity of water chemistry. Water chemistry of major ions and field parameters was used in the HCA by Wards linkage methods [36,37].
Controlling factors of the hydrogeochemistry and NO3 concentration of the water samples were inferred from the results of a principal component analysis (PCA). PCA has been used widely to analyze and obtain meaningful information about groundwater quality by extracting groups of correlated elements from the initial data set. These groups are included into principle factors, which describe processes occurring in the investigated environment. Identification of the factors allows genetic interpretation of the environment. First factor obtained explains the biggest part of variance. The following factors explain repeatedly smaller parts of variance. In addition, the factor loading shows how the factor characterizes the variables (ion concentration). High factor loadings (close to −1 or 1) indicate strong relationship (positive or negative) between the variable and the factor describing this variable. The factor loadings matrix was rotated to the orthogonal simple structure according to the varimax rotation technique. The result of this operation are high factor loadings obtained for the variable correlated in the factor and low factor loadings obtained for remaining variable [36,38,39]. For the HCA and the PCA analyses, data from the total of 95 groundwater and 20 river water samples obtained from August 2010 to April 2012 were used.
3. Results and Discussion
Various water sources, including shallow groundwater wells tapped into the unconsolidated aquifer along the Tuul River, relatively deep groundwater wells tapped into bedrock aquifers, and hand-dug wells, have been developed to meet the increasing demand in UB. We characterized the chemical compositions of these water sources.
3.1. Hydrochemistry of Water Resources
Table 1 presents basic statistics for the hydrochemical characteristics of the groundwater and surface water. Most hydrochemical parameters varied substantially among the surface water and groundwater samples. For example, in surface water, electrical conductivity (EC) ranged from 43 to 841 μS/cm and increased from the upstream to downstream areas of the city due to the accumulating influences of human activities and effluent discharge from the central wastewater treatment plant (R-7 in Figure 1). In groundwater, the EC values ranged from 65 to 2035 μS/cm.
Groundwater had significantly higher concentrations of most dissolved constituents, indicative of water–rock interactions along the groundwater flow path. Moreover, NO3 levels were significantly higher in groundwater (median: 12 mg/L) than in surface water (median: 1.3 mg/L), suggesting that N sources affected water quality via groundwater flow. The dominant factors controlling the groundwater hydrochemistry were extracted based on a principal component analysis of the major ion concentrations (i.e., HCO3, SO4, Cl, NO3, Ca, Mg, Na, K and SiO2; Table 2).
Principal Component (PC) 1 and 2 explained approximately 77.8% of the total variation in the hydrochemical data. PC 1, explaining about 68% of the variance, included the influences of K, NO3, Cl, and Na. Of these parameters, NO3 and Cl could be explained by groundwater contamination in urban areas without proper sewage systems. The highest factor loading of K might have originated from detergent in wastewater, which is a source of Cl and K [40]. PC 2 accounted for another 10% of the total variance, and predominantly included the influences of SiO2, Ca, and HCO3. These ions reflected natural water–rock interactions, characterized by weathering of silicate and carbonate minerals in the local aquifer system. Consequently, the groundwater chemistry and quality in the study area appeared to be controlled by anthropogenic pollution overlapping natural water–rock interactions.
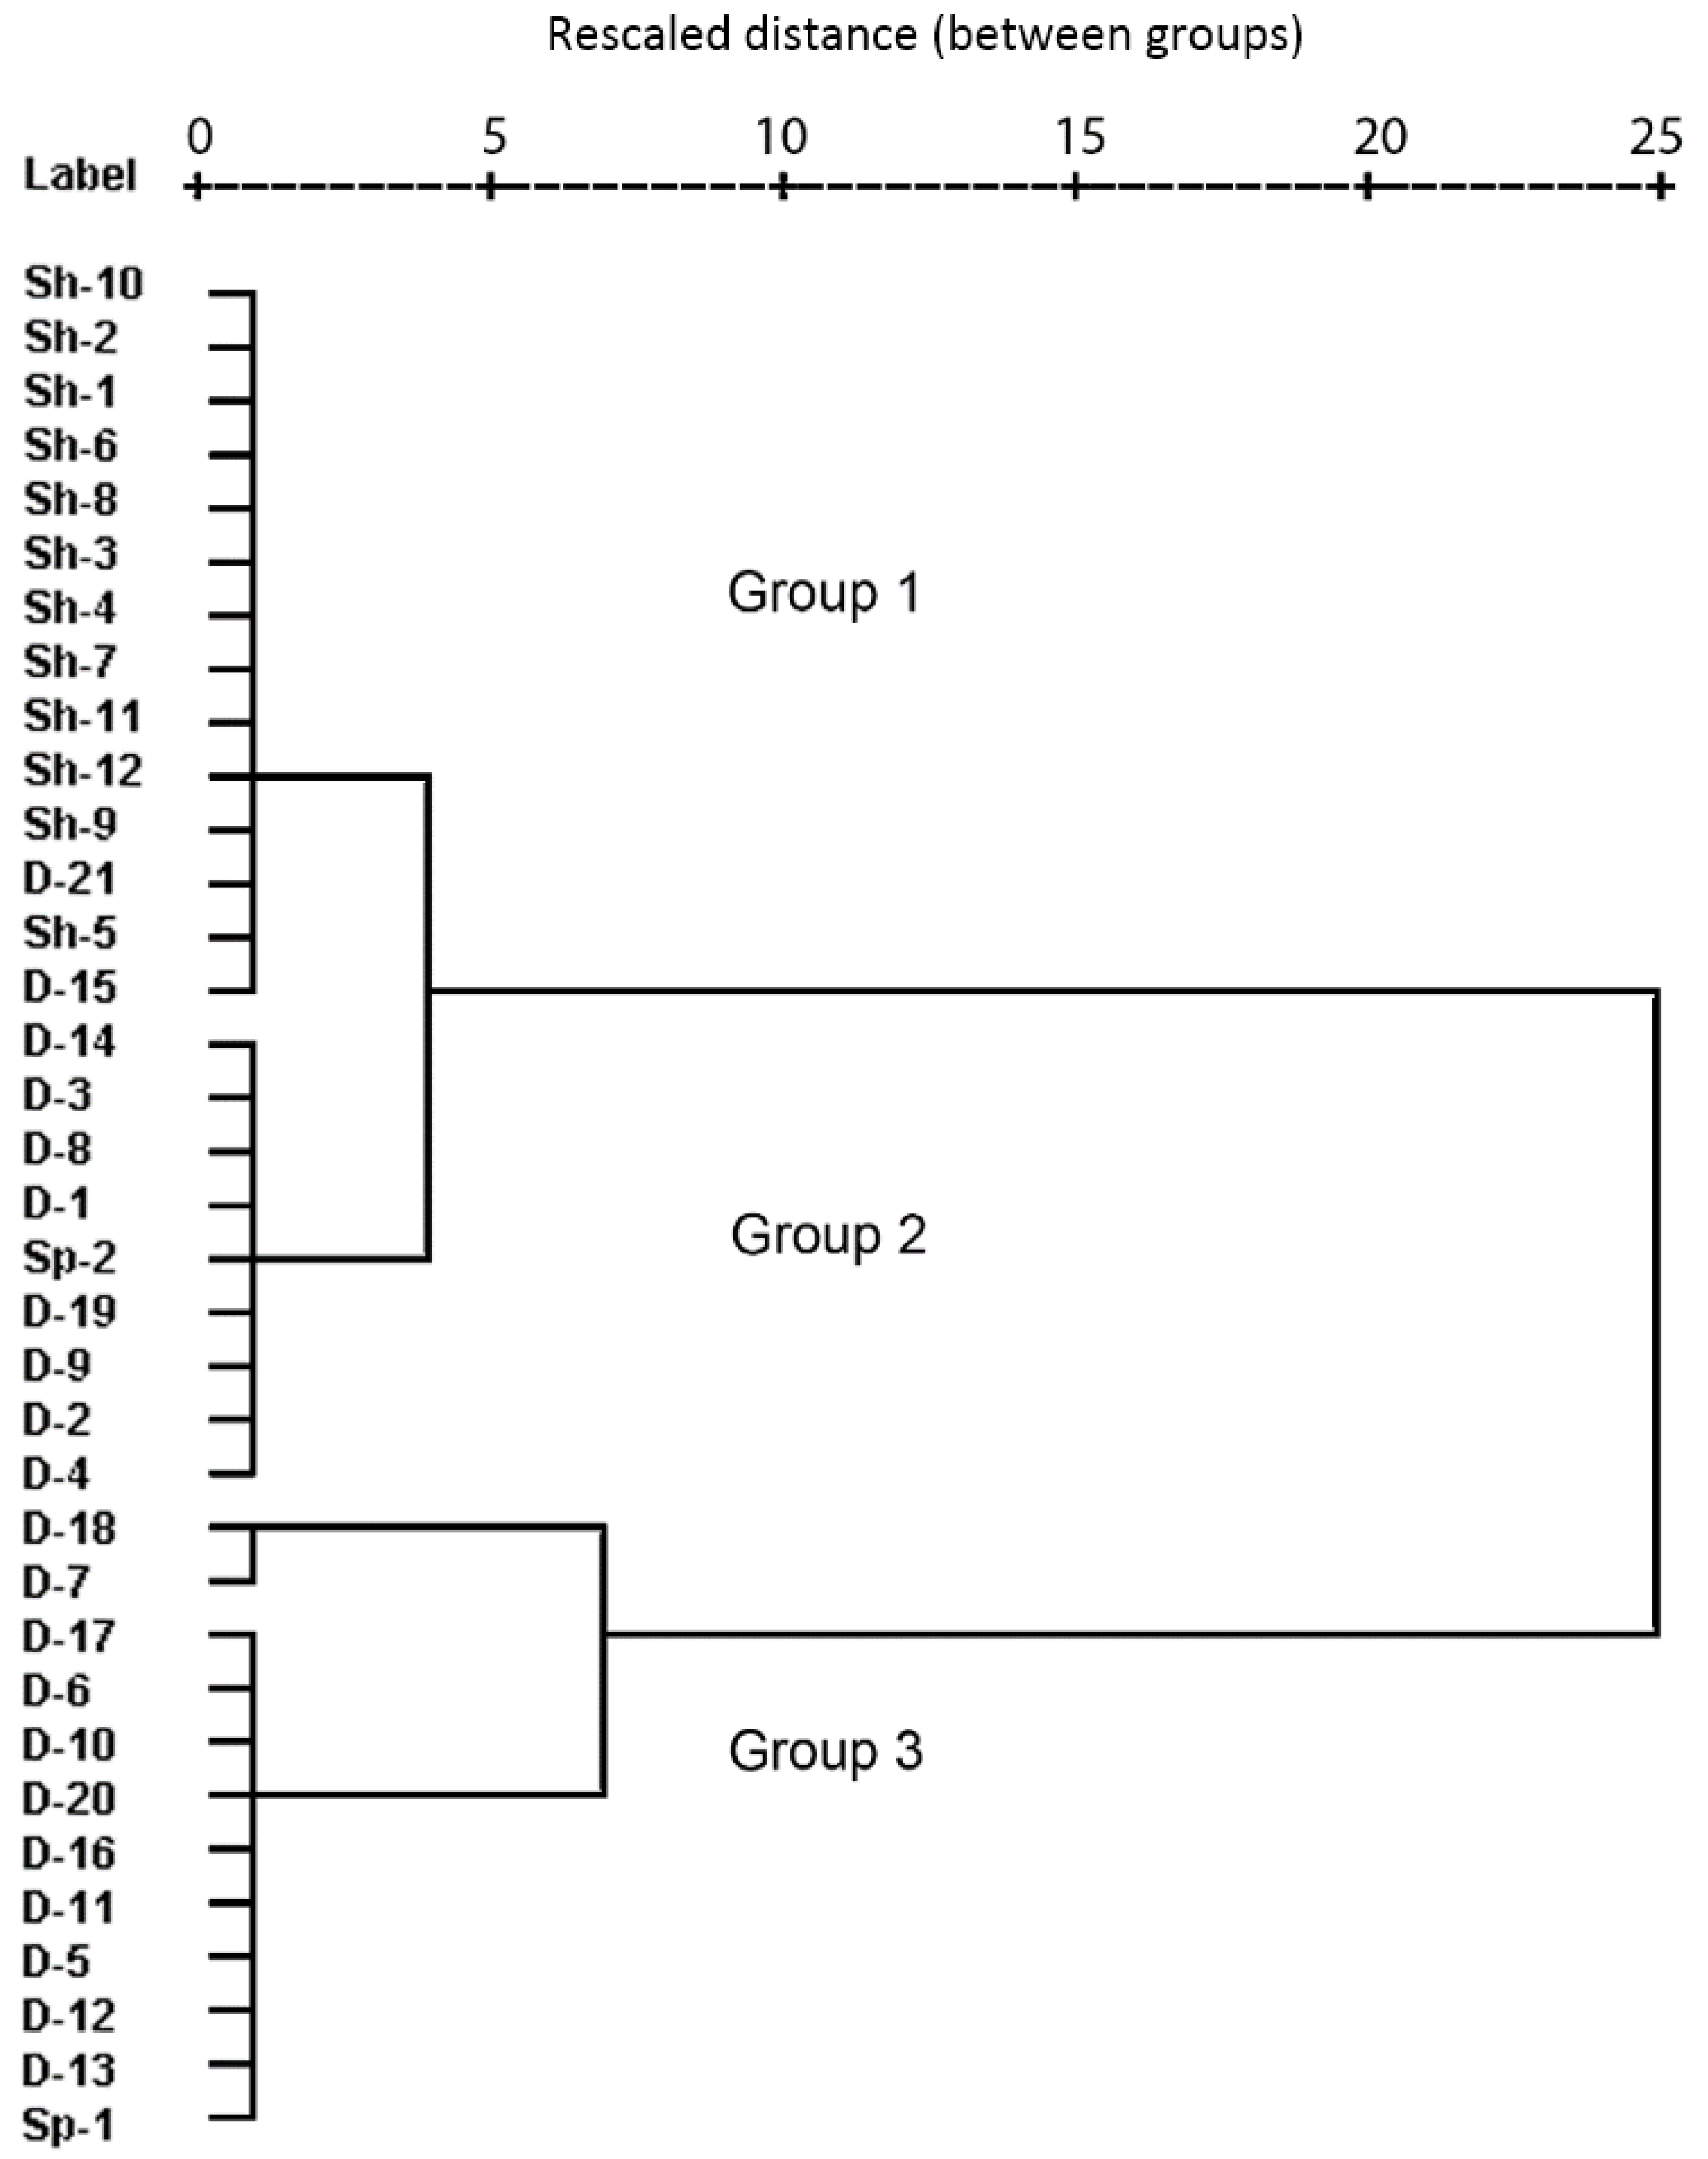
To delineate the spatial distribution of water quality based on the potential for NO3 pollution, we employed a hierarchical cluster analysis (HCA) [36,37] to identify groups with similar major ion compositions and field parameters. Figure 3 presents a tree diagram produced from the HCA, which divides the samples into three groups. Most shallow groundwater samples from the alluvial aquifer were clustered in Group 1 (Sh-1–Sh-12, D-15, and D-21). Group 2 included spring water (Sp-1) and bedrock groundwater (D-1, -2, -3, -4, -8, -9, -14, and -19). Finally, Group 3 accounted for the remaining bedrock groundwater and spring samples (D-6, -7, -10, -11, -16, -17, -18, -20, and Sp-1).
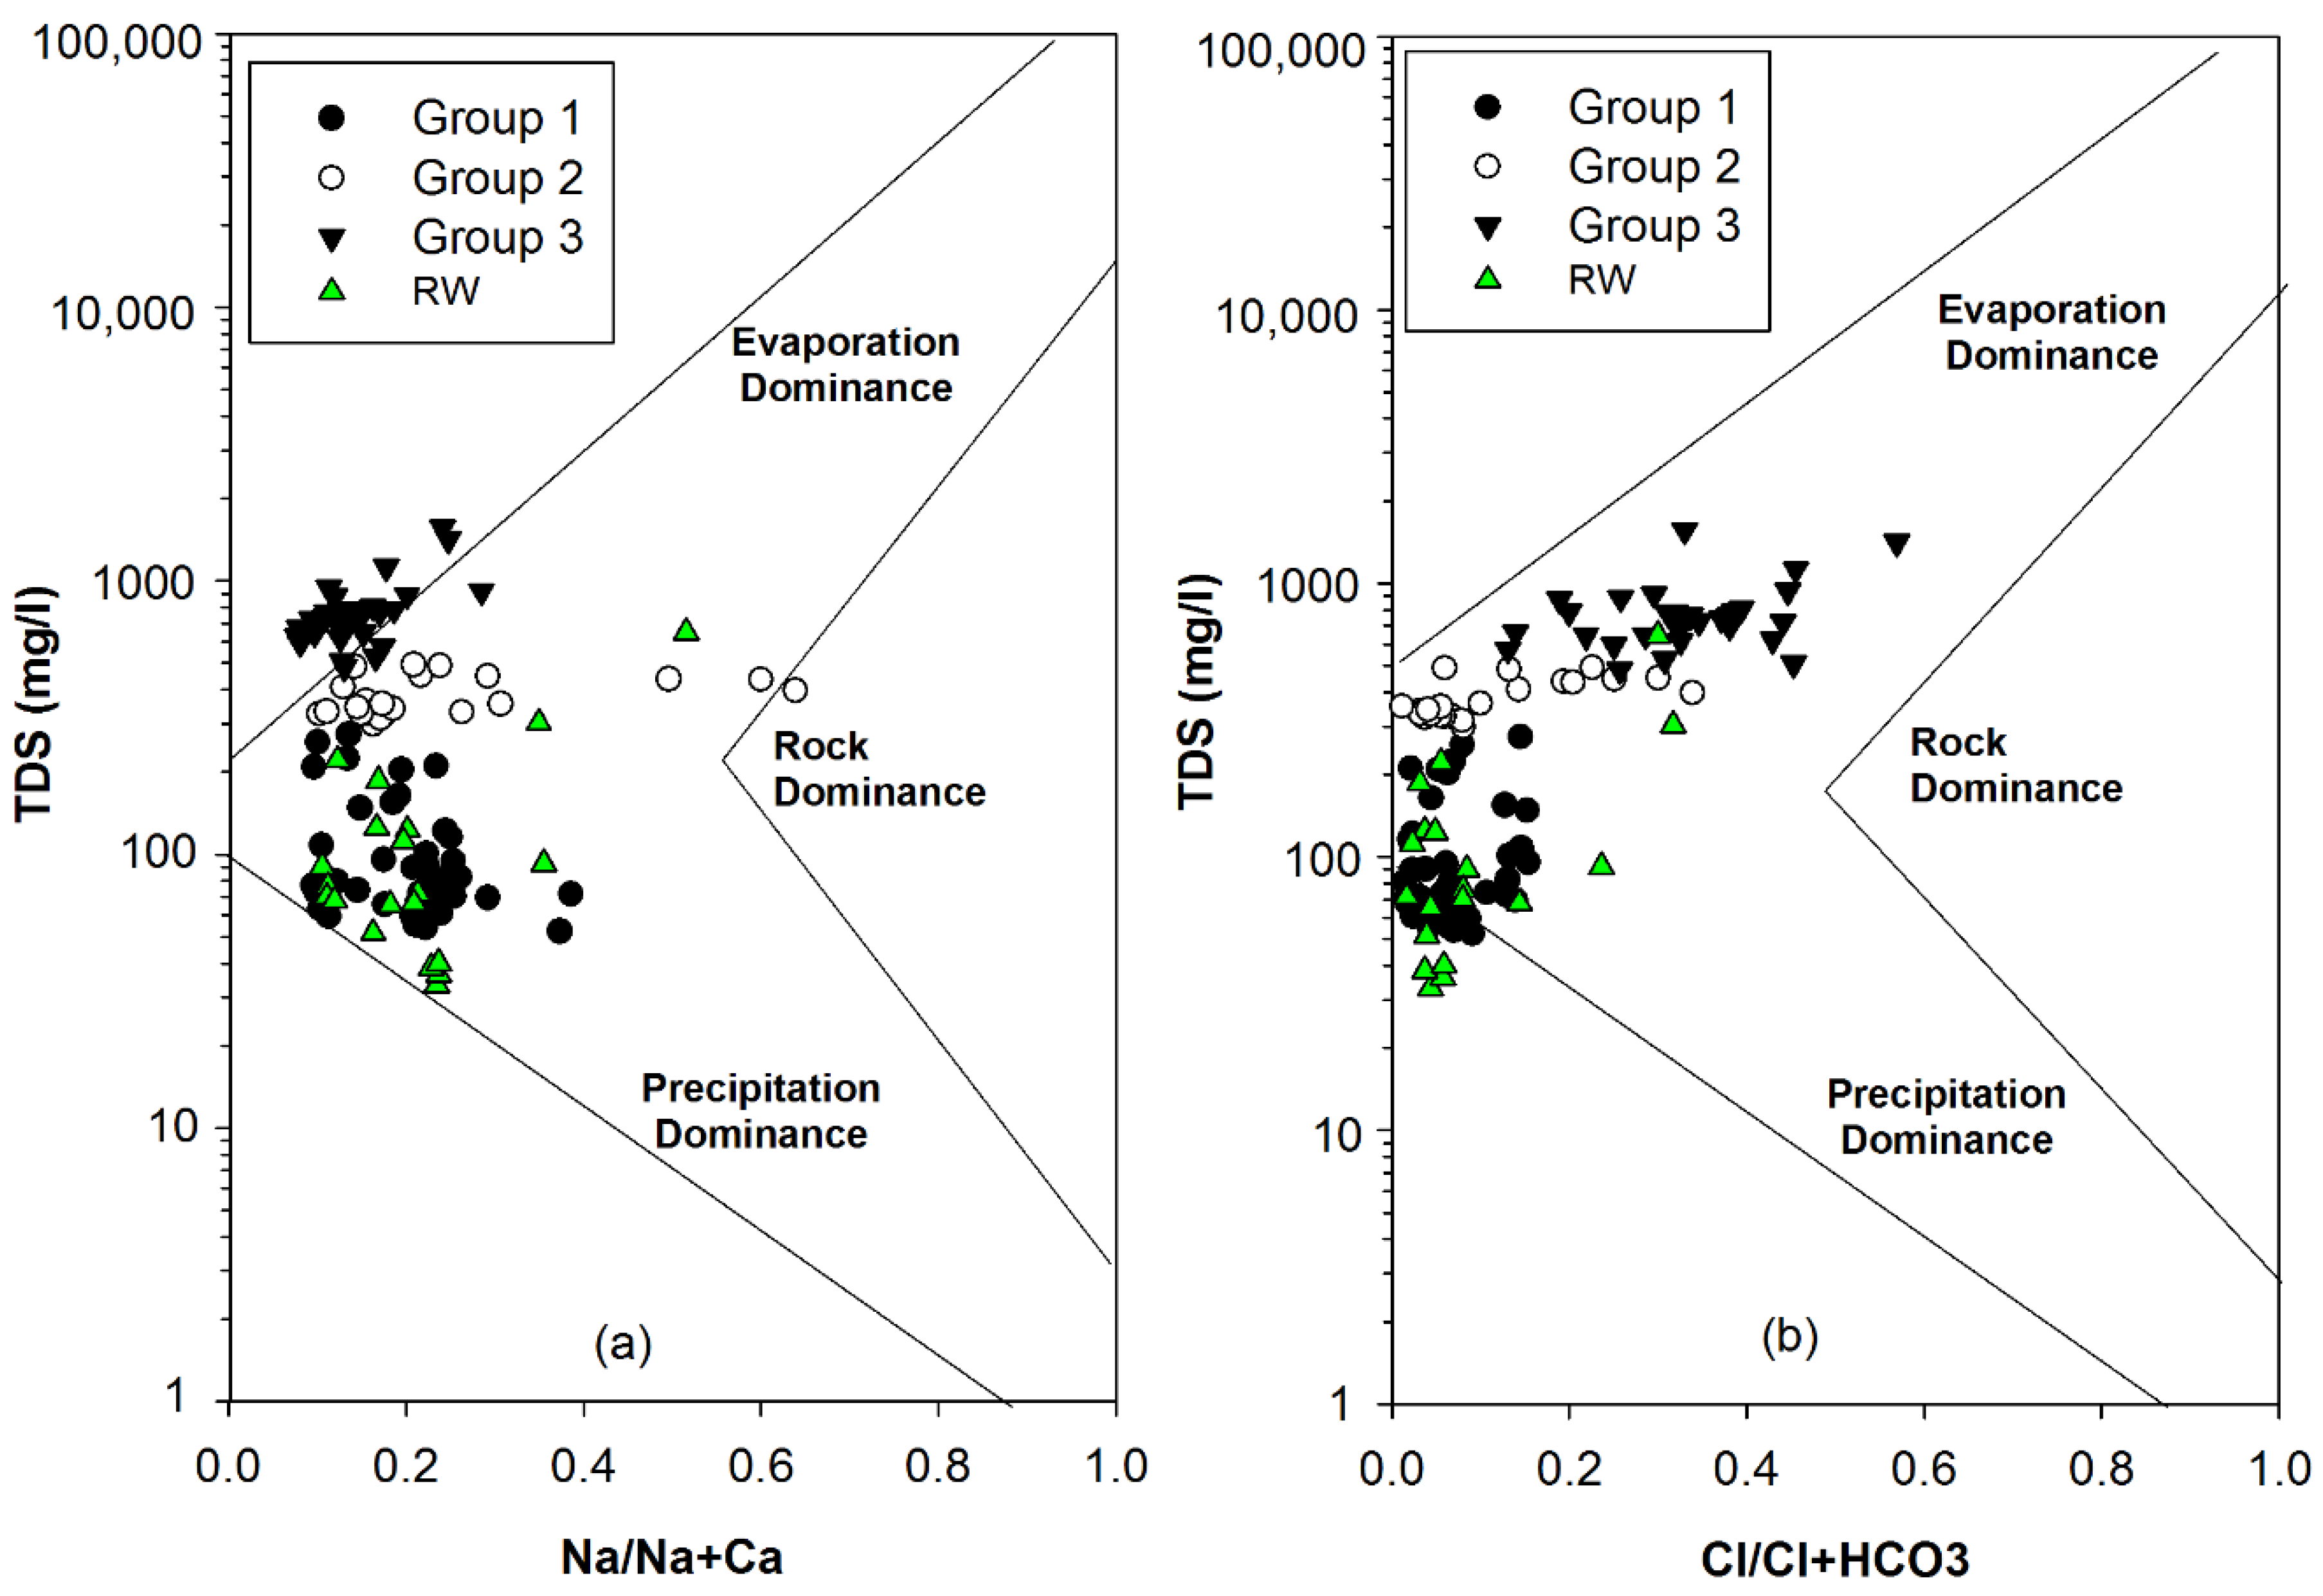
Based on Gibbs’ [41] plots (Figure 4), water–rock interactions appeared to be the major mechanism controlling the hydrochemistry of water in UB for shallow alluvial aquifer and bedrock aquifer groundwater, as well as river water. All resources had similar Na/(Na + Ca) ratios; however, they were clearly differentiated based on the TDS concentrations, which were higher for resources with longer residence times. Group 1 groundwater and river water samples were characterized by similar ranges of TDS, Na/(Na + Ca), and Cl/(Cl + HCO3), implying vigorous interchange. TDS and Cl/(Cl + HCO3) values for groundwater samples showed increasing trends from Group 1 to Groups 2 and 3.
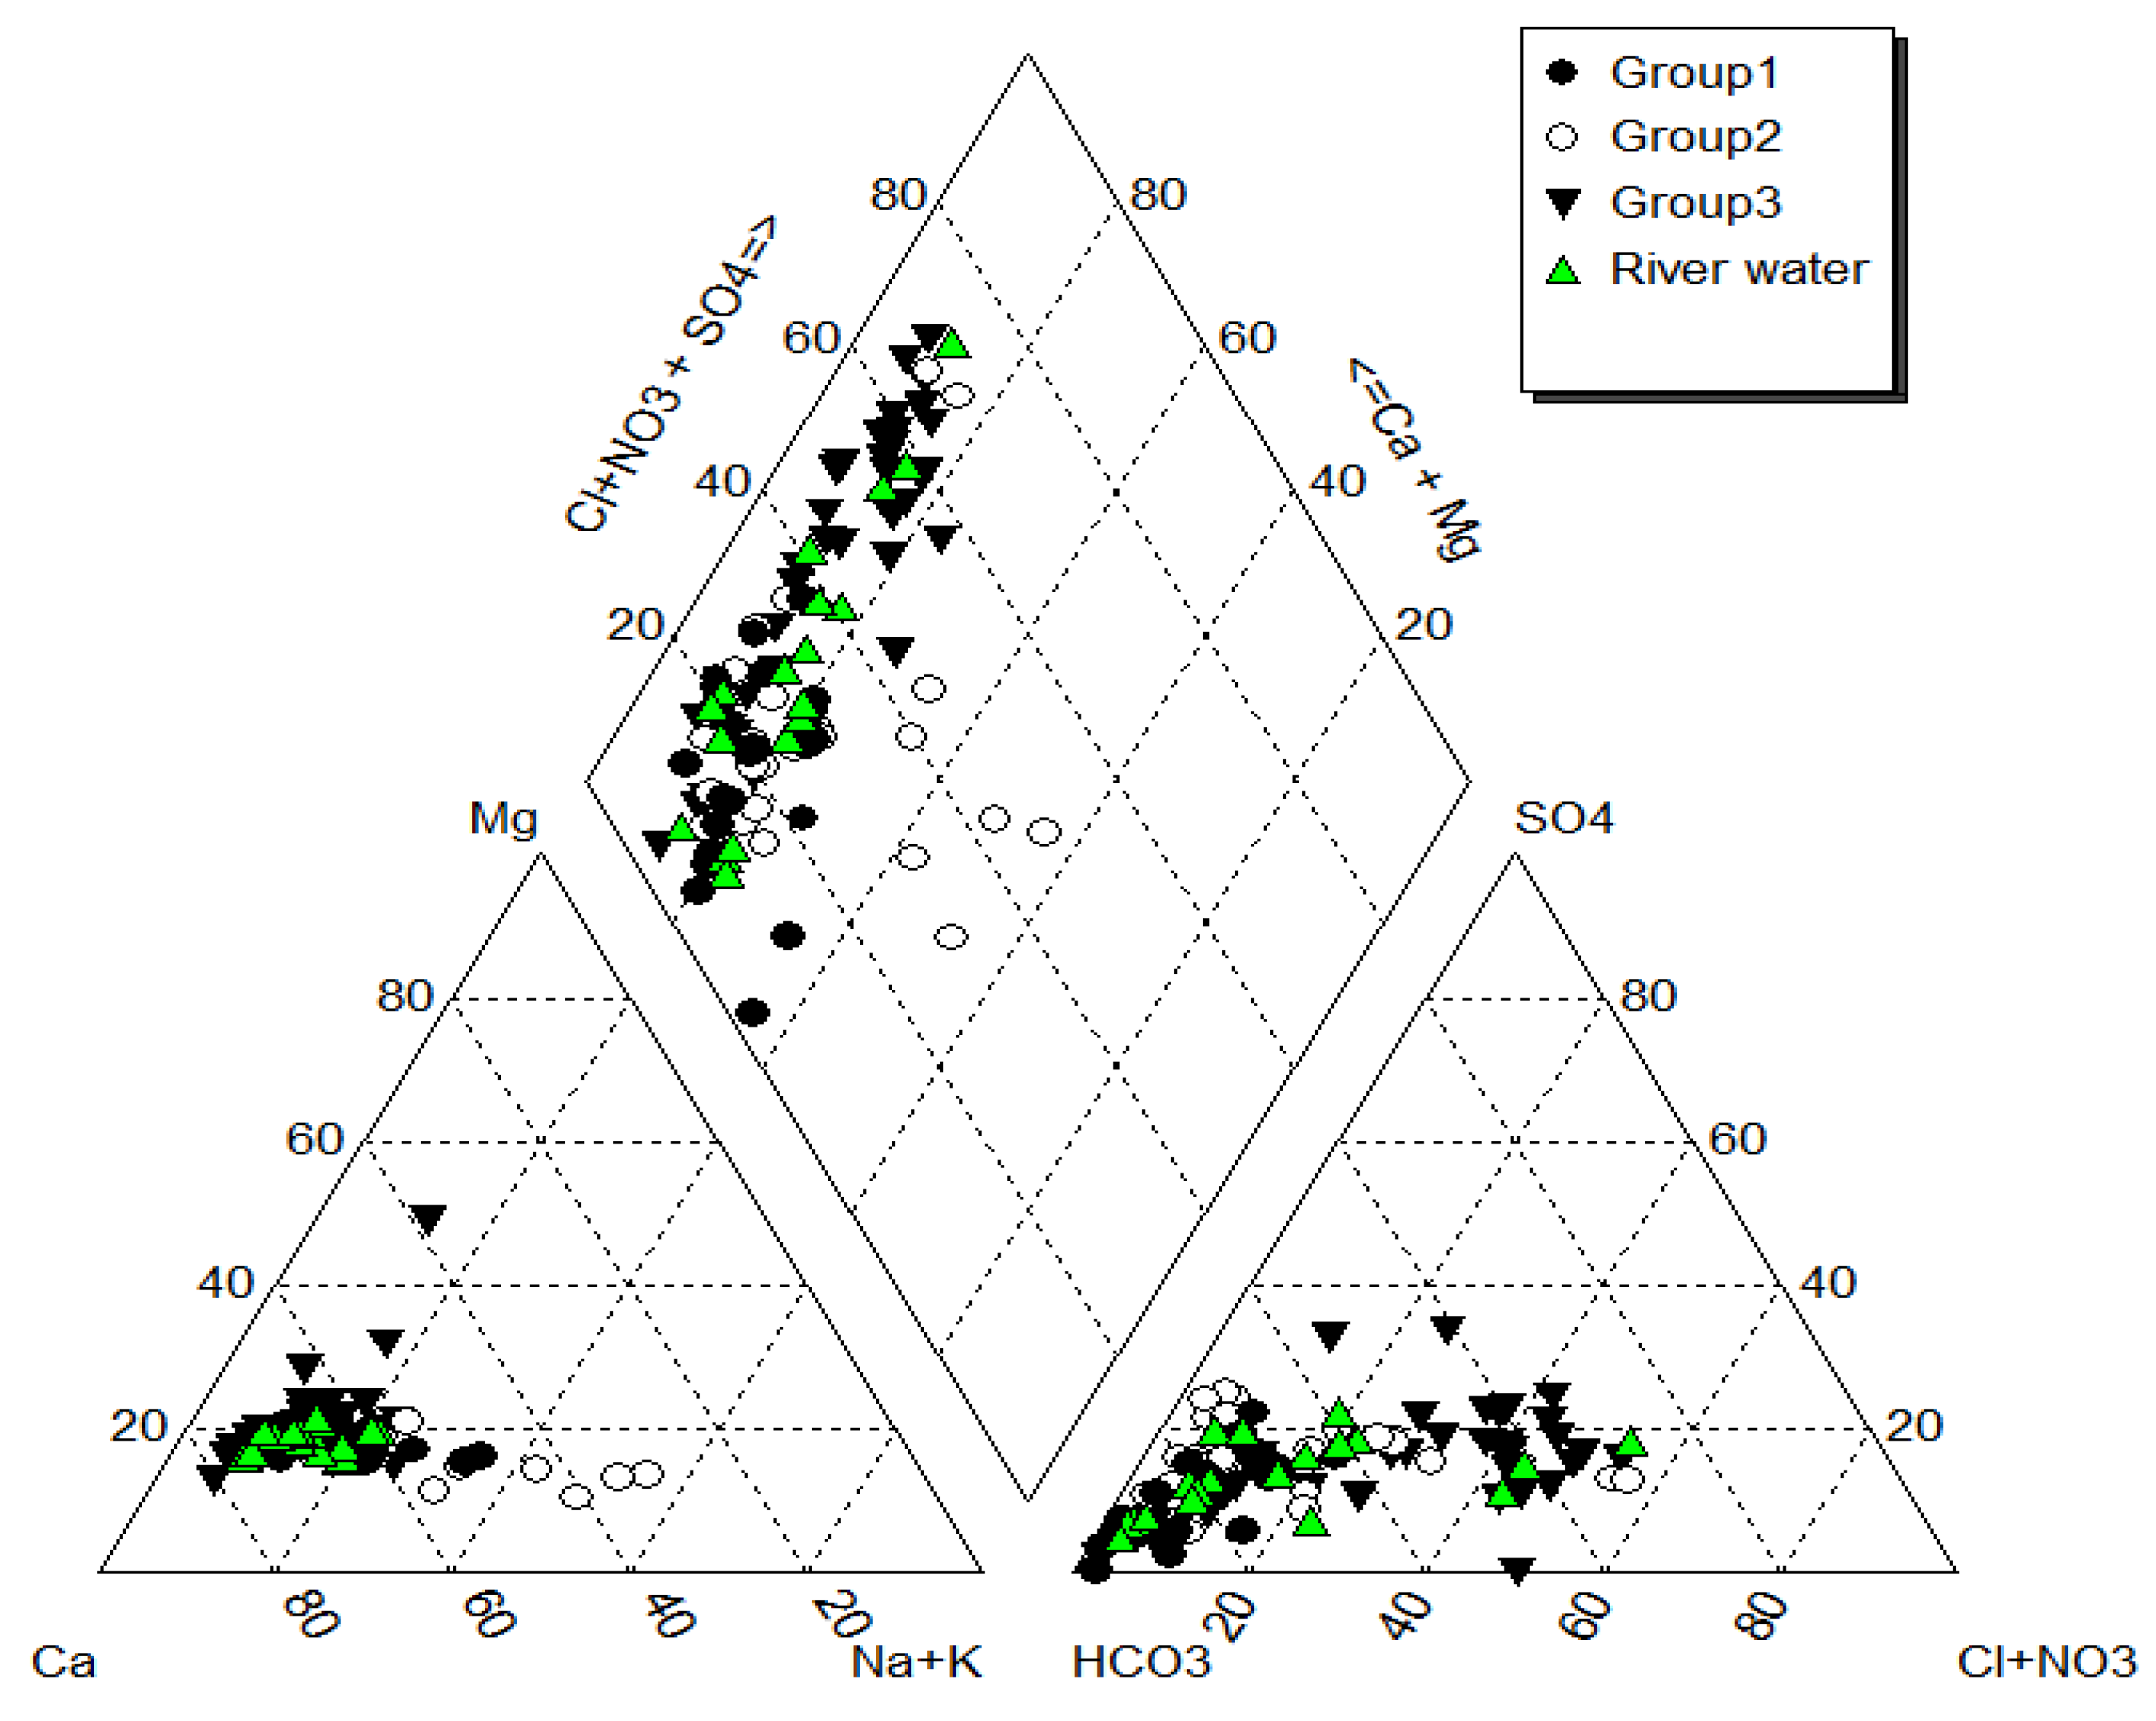
The hydrochemical compositions of the water samples plotted on the modified Piper diagram indicated gradual changes in water chemistry and quality from Ca-HCO3–type to Ca-[HCO3 + Cl + NO3]–type water (Figure 5). Surface waters were predominantly of the [Ca + Na]-HCO3 type, similar to Group 1 groundwater samples from the riverbank area. Group 1 groundwater samples were typically of the Ca-HCO3 type, whereas Group 2 samples were categorized more broadly as being of the [Ca + Na]-[HCO3 + Cl] type. Group 3 samples were typically of the Ca-[Cl + NO3] type, probably reflecting the influence of the anthropogenic input of Cl and NO3.
Figure 6 shows the distribution of the groundwater hydrochemical characteristic groups. Group 1 wells, distributed along the Tuul River, were mostly shallow wells tapped into the alluvial aquifer. Group 2 wells are distributed along the east-western side of the study area between Group 1 and Group 3. Finally, Group 3 wells, on the north-central side of UB, were bedrock wells and springs characterized by water–rock interactions in the bedrock aquifer. In Group 3, the impact of the Ger districts on the slope is probably exemplified, which lack proper sewage disposal systems.
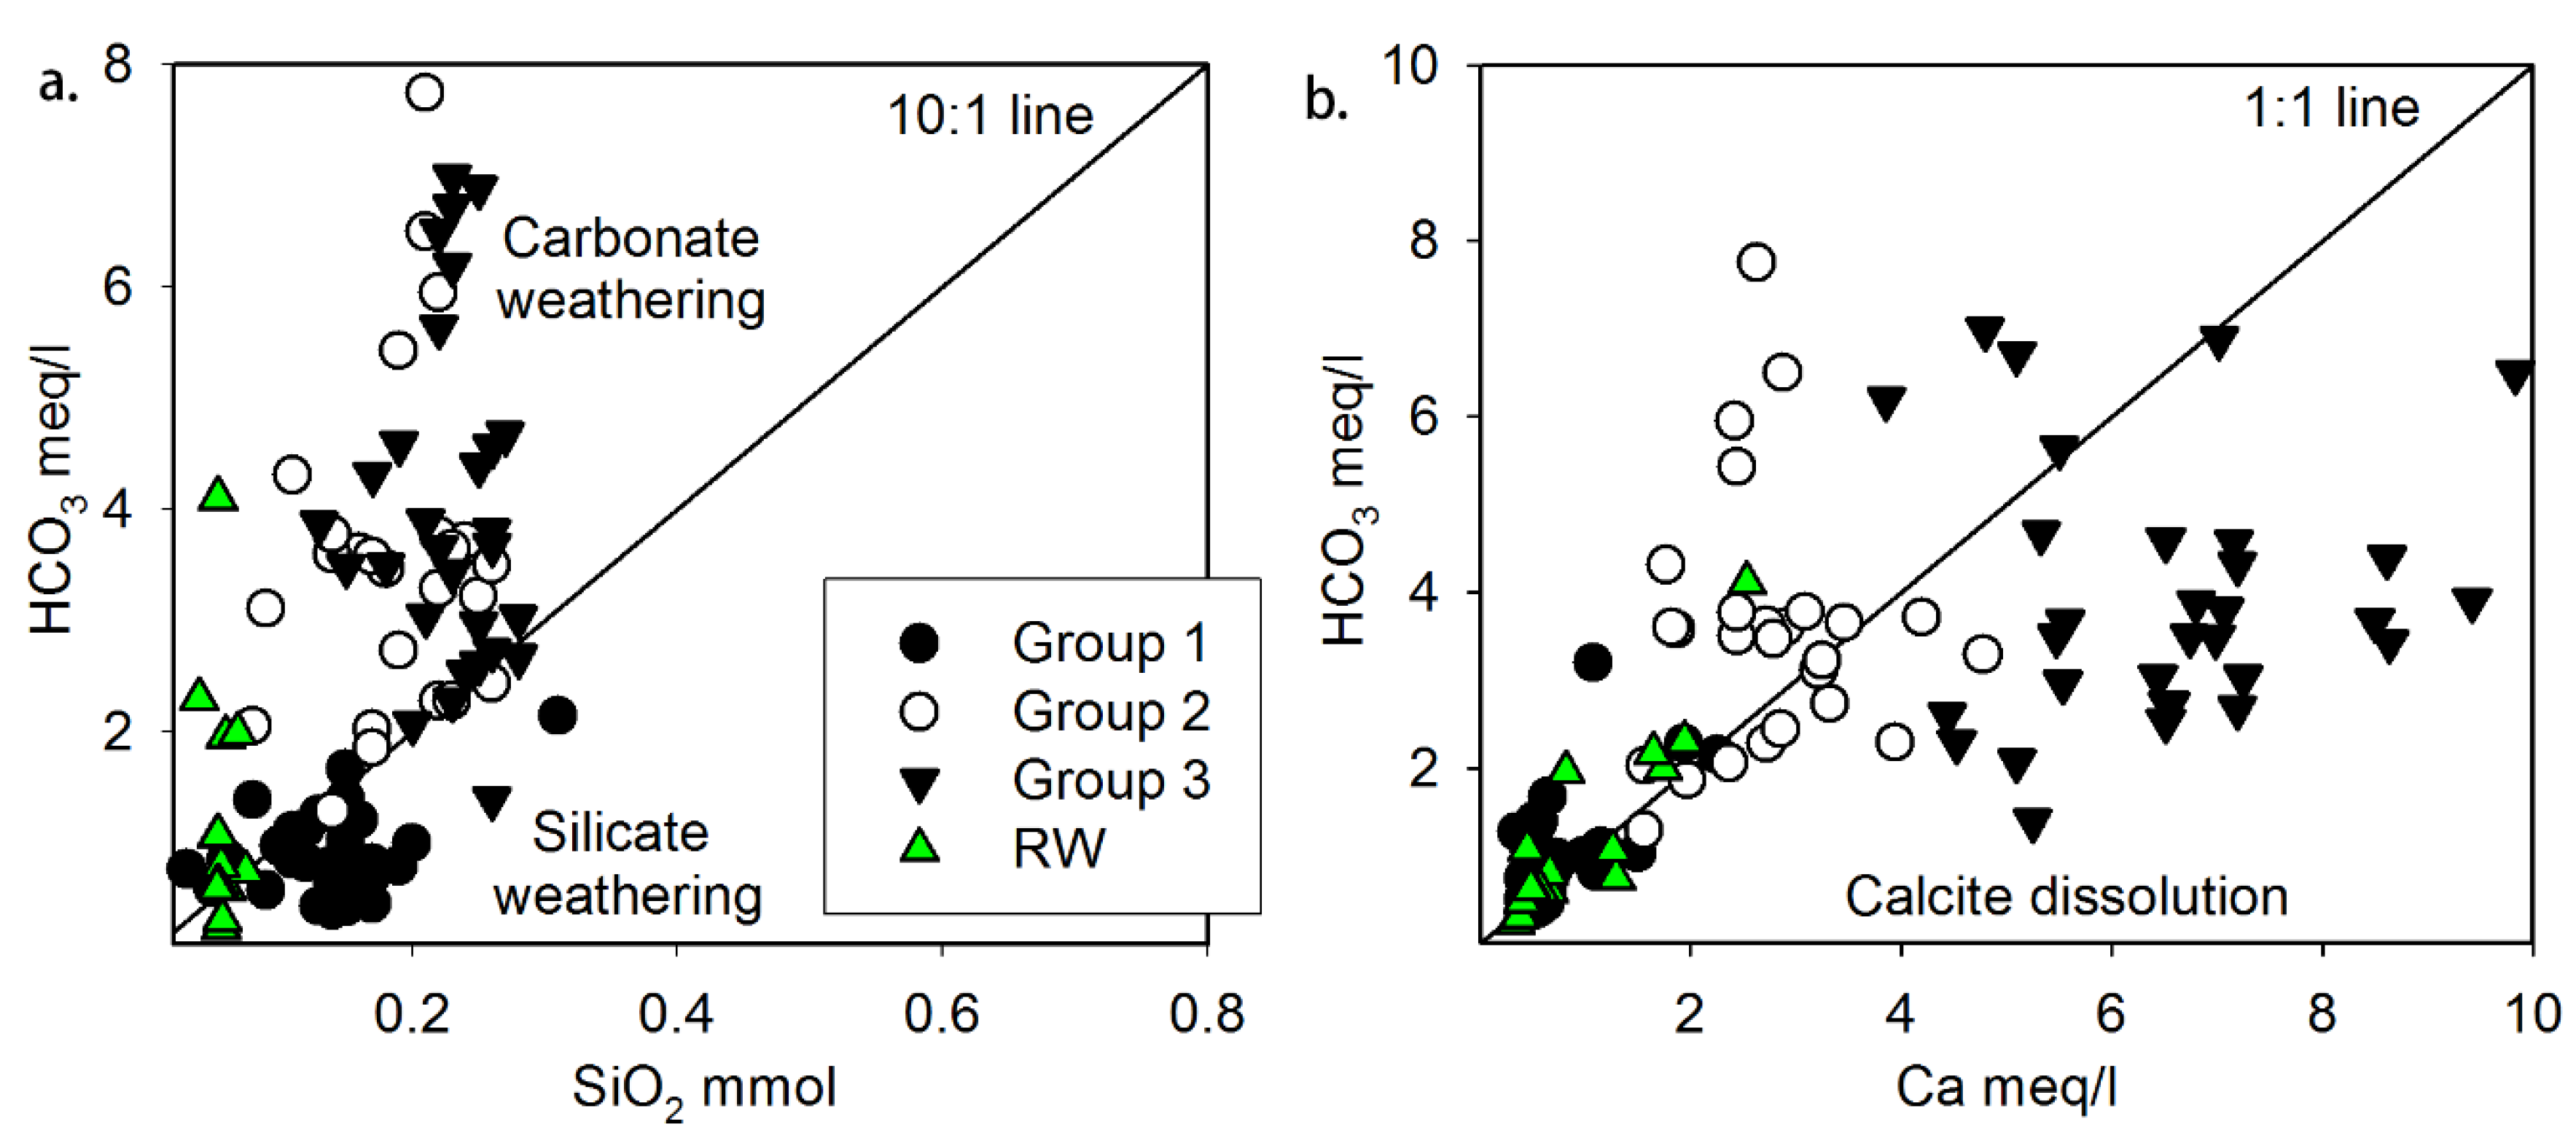
Based on the factor analysis (Table 2), the dominant water–rock interactions were related to silicate and carbonate weathering and dissolution–precipitation processes [42,43]. The Group 1 groundwater samples were plotted below the HCO3 versus SiO2 10:1 slope (Figure 7a), indicating that silicate weathering was the dominant process. As these wells were tapped into the upper layer of alluvium distributed along the Tuul River, silicate weathering could occur in the coarse to fine sands and gravels derived from shale, quartz sandstone, and granite [24]. By contrast, groundwater and even surface water samples from Groups 2 and 3 were plotted above the 10:1 slope, indicating that carbonate weathering was the dominant process. We used the HCO3 versus Ca concentration plot of the samples to assess the dissolution and precipitation of carbonate minerals (Figure 7b). Group 3 wells exhibited stronger CaCO3 dissolution than CaCO3 precipitation, whereas Group 2 wells showed the opposite trend. These results imply that more freshwater recharge occurred in Group 3 wells than in Group 2 wells, suggesting that they are exposed to the risk of pollution from near-surface sources.
In summary, water in UB could be differentiated into three groups based on its hydrochemical characteristics. Group 1 samples were located along the Tuul River, Group 2 samples were from the north-eastern area of UB, and Group 3 samples were from the north-western area. Group 1 included the alluvial aquifer along the river and showed silicate weathering–dominant water–rock interactions. By contrast, samples from Groups 2 and 3 reflected predominantly carbonate weathering. However, Group 3 was under the influence of CaCO3 dissolution conditions, indicative of more freshwater recharge, making it more vulnerable than Group 2 to surface pollution sources.
3.2. Isotopic Signatures of Water Resources
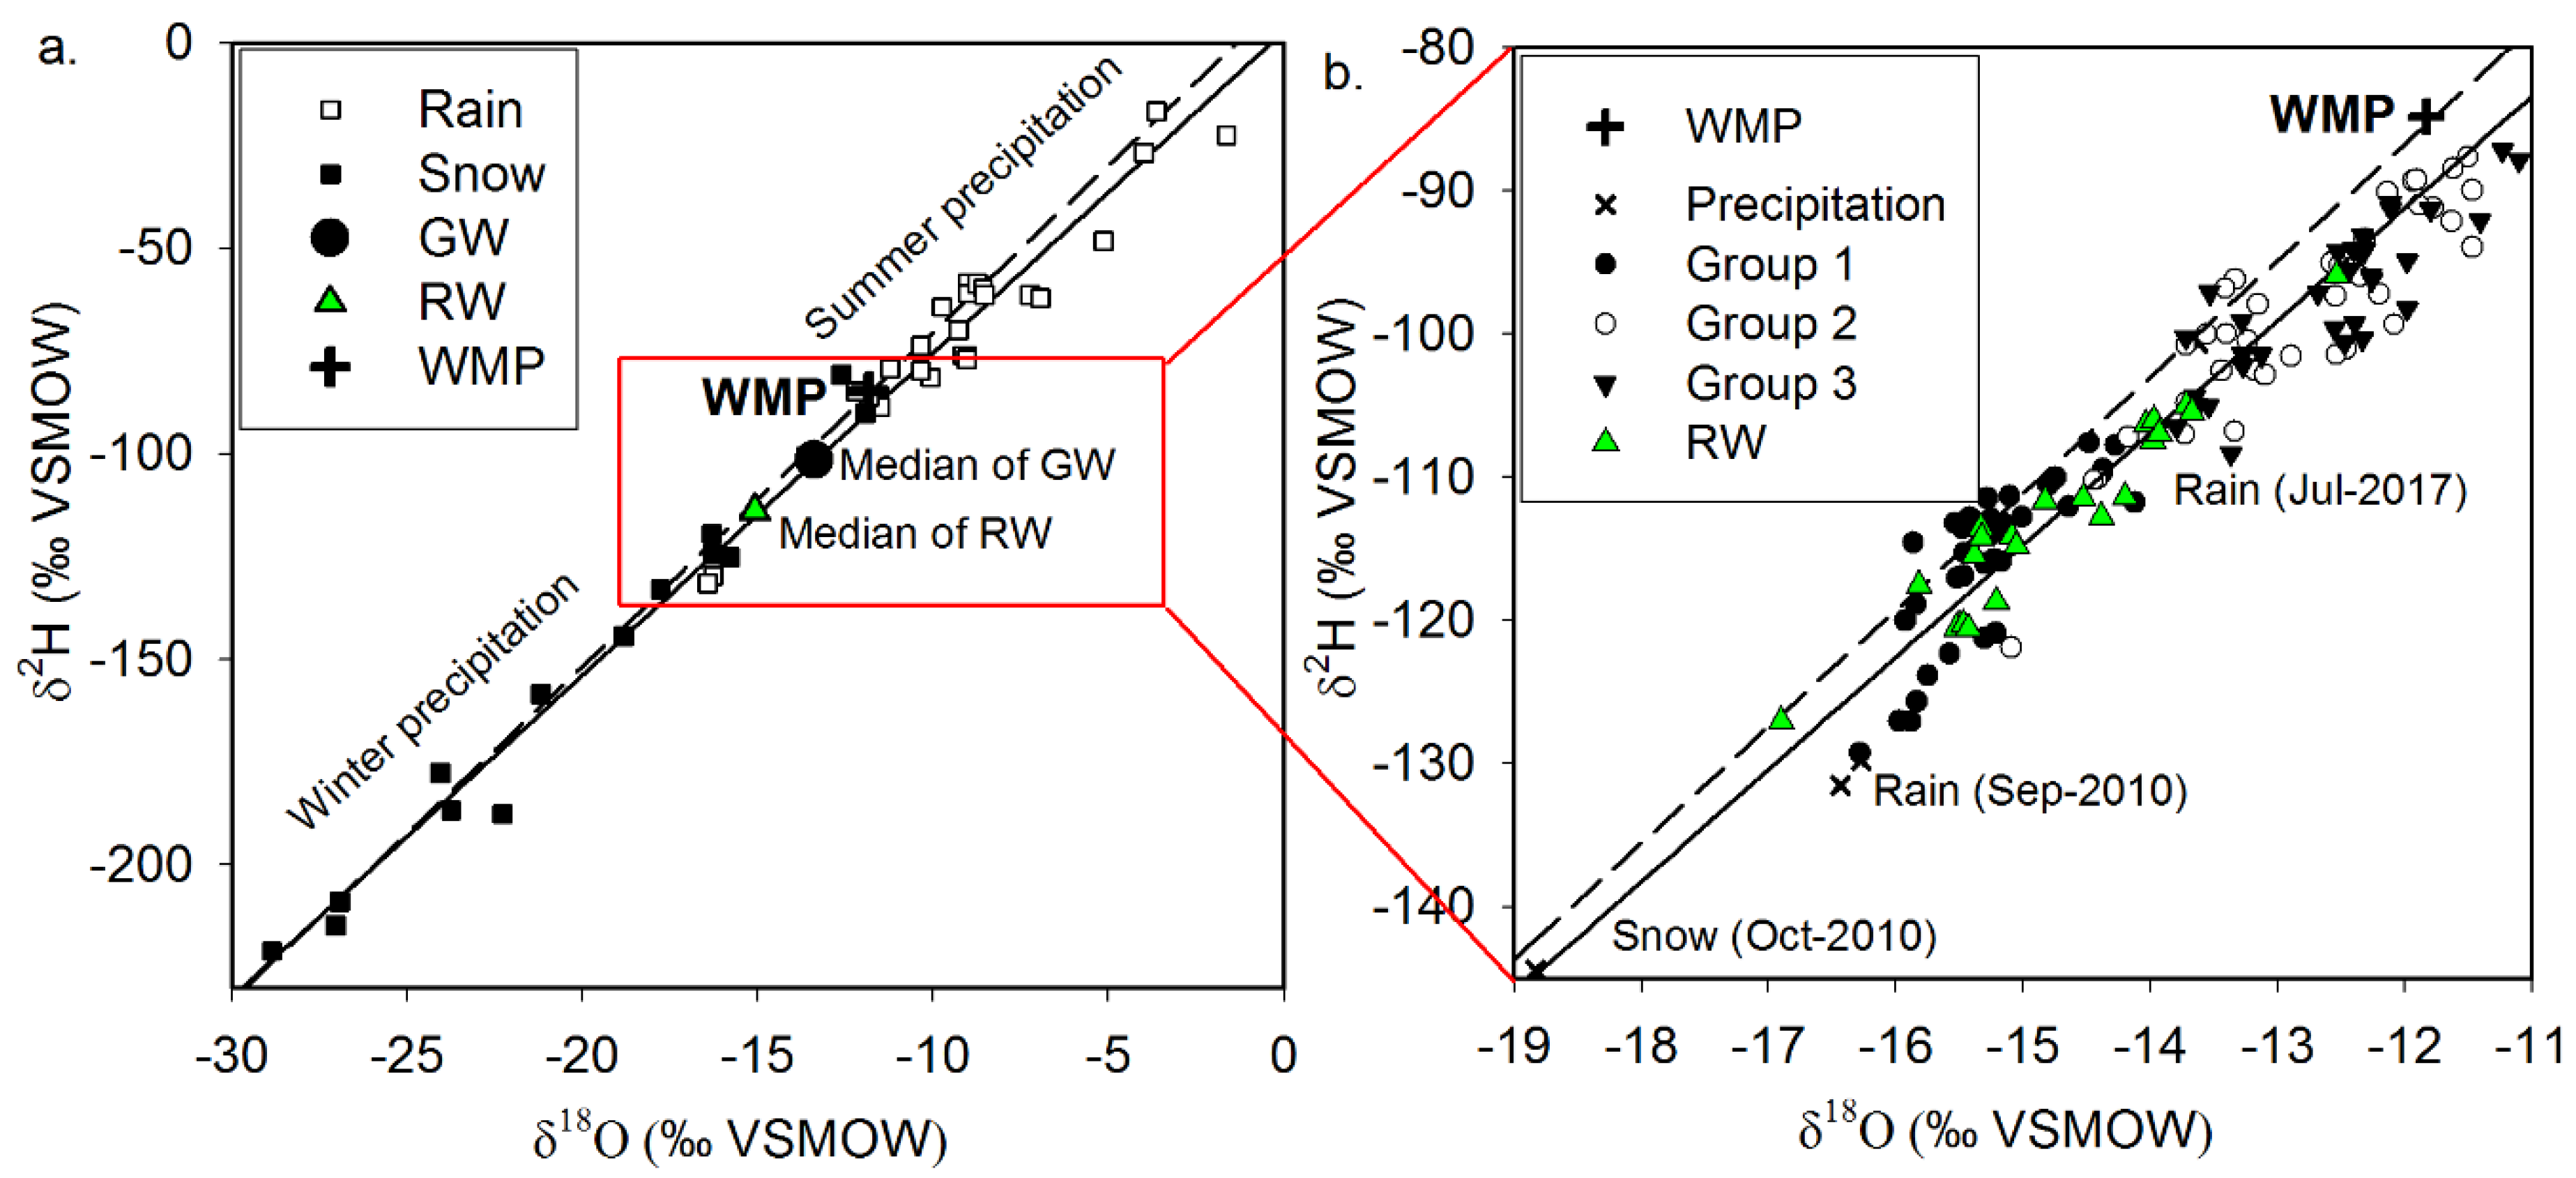
The relationships among various water sources (i.e., precipitation, surface water, and groundwater) were inferred based on isotopic signatures (δ18O and δ2H). Precipitation isotopic data were obtained from 1990 to 2001 [35]. δ18O ranged from −30.4‰ to −1.6‰ (median: −11.5‰), and δ2H ranged from −236.5‰ to −16.6‰ (median: −81.4‰; Figure 8). From these data, the local meteoric water line (LMWL) was defined as Equation (2).
δ2H = 7.8 δ18O + 2.7 (r2 = 0.98)
The slope of the LMWL was 7.8, which was close to the equilibrium value of 8.0 [44]. The intercept of the LMWL was 2.7, much lower than the global meteoric water line value of 10, indicative of lower deuterium excess values in the warm season due to the evaporation effect of summer precipitation [45,46,47,48]. The long-term precipitation data showed seasonal differences in isotopic values, with higher values in summer than in winter (Figure 8a). Such seasonal variation has been reported as an effect of temperature, as precipitation under warmer temperatures condenses with heavier isotopes due to evaporation during rainfall, and consequently has higher isotopic compositions than does precipitation under colder conditions [49,50]. All median isotopic signatures of the groundwater and surface water samples were lower than the weighted median precipitation, indicating that groundwater and surface water, which provide the main water supply for the city, are likely recharged from present-day meteoric water.
The δ18O and δ2H values of the groundwater and surface water samples ranged widely from −16.9‰ to −11.1‰ and −129.3‰ to −87.2‰, respectively (Table 3). The δ18O and δ2H values in river water ranged from −16.9‰ to −12.5‰ and −127.0‰ to −96.0‰, respectively (Figure 8b). The Group 1 groundwater samples from the alluvial aquifer close to the Tuul River had δ18O and δ2H values of −16.3‰ to −13.2‰ and −129.3‰ to −100.0‰, respectively. Meanwhile, the δ18O and δ2H values of the Group 2 samples ranged from −14.4‰ to −11.5‰ and −110.2‰ to −87.7‰, respectively. Finally, those of Group 3 groundwater samples ranged from −13.7‰ to −11.1‰ and −108.4‰ to −87.2‰, respectively. Group 1 shallow groundwater samples were relatively depleted in isotopic ratios compared with the bedrock groundwater in Groups 2 and 3, but their values were similar to those of surface water. These results suggest that bedrock groundwater experienced a relatively longer residence period under the influence of evaporation along the flow paths from the land surface to the local groundwater discharge points [51,52].
As the groundwater discharged into the river through the shallow alluvial aquifer, these two sources mixed dynamically with river water, which has lower isotopic signatures, via pumping effects. River water can become isotopically depleted due to high-intensity rainfall [51], recharge from upstream highland areas due to altitude effects, or snowmelt water inflow [49]. Considering that UB is surrounded by high mountains and has a dry climate, the low isotopic values in the Tuul River could be the result of snowmelt input in upstream areas. Group 2 groundwater was not clearly distinguished from that of Group 3, probably because the wells of these groups were located in geographically similar areas on slopes, resulting in similar groundwater flow paths.
In summary, the stable isotopic signatures of the water sources in UB exhibited various fractionation effects, including seasonal variation in long-term changes and evaporation via altitude effects. The isotopic values of groundwater and surface water indicate that they are of meteoric origin. Due to pumping-induced recharge, the shallow groundwater from the alluvial aquifer along the Tuul River appeared to mix dynamically with river water originating from the upstream area fed by snowmelt water. The bedrock groundwater samples from wells of Groups 2 and 3 showed normal hydrological cycles of precipitation transferring to infiltration, evaporation, recharge, and discharge into the Tuul River.
3.3. Nitrate Contamination of Water Resources
NO3 in water resources can originate from various sources, including atmospheric deposition, chemical and organic fertilizers, industrial waste effluent, and improperly maintained septic systems [53]. Natural NO3 levels in groundwater are generally very low (<10 mg/L NO3), but these levels can increase in association with anthropogenic inputs. In urban areas, NO3 concentrations are often above 50 mg/L, reflecting N loading from high-density housing without sewage sanitation systems [54]. As such, NO3 is the most common water pollutant, and causes significant health issues associated with water resource use. The World Health Organization has established a drinking-water NO3 guideline level of 50 mg/L based on health concerns [55]. However, NO3 concentrations of 10−20 mg/L have been linked to health effects; Ward et al. [56] reported that long-term exposure to such NO3 levels from municipal water supply systems has possible links to bladder and ovarian cancers and non-Hodgkin’s lymphoma in the United States [56,57].
In the water samples from UB, NO3 concentrations ranged from below the detection limit to 305.4 mg/L (Table 4). River water samples showed no indication of NO3 pollution (median: 1.1 mg/L) and the 48 shallow groundwater samples from the alluvial aquifer along the Tuul River in Group 1 also appeared to have background levels with maximum of 5.18 mg/L. Several exceptions were found in shallow dug well Sh-5 and municipal monitoring wells Sh-9 and D-21, showing potential pollution risks indicated by higher ranges from BDL to 27.8 mg/L. Groundwater from Group 2 wells had NO3 concentrations of 8.0–47.4 mg/L (median: 15.8 mg/L), implying that these wells were influenced by NO3 contamination sources, although the NO3 levels were within the drinking-water guideline. By contrast, Group 3 groundwater samples, with NO3 concentrations of 64.0–305.4 mg/L (median: 101.3 mg/L), were highly contaminated. Wells in Groups 2 and 3 comprised 25% and 32% of the sampled wells, respectively, indicating that about 60% of the groundwater in the study area could be under the influence of NO3 contamination sources.
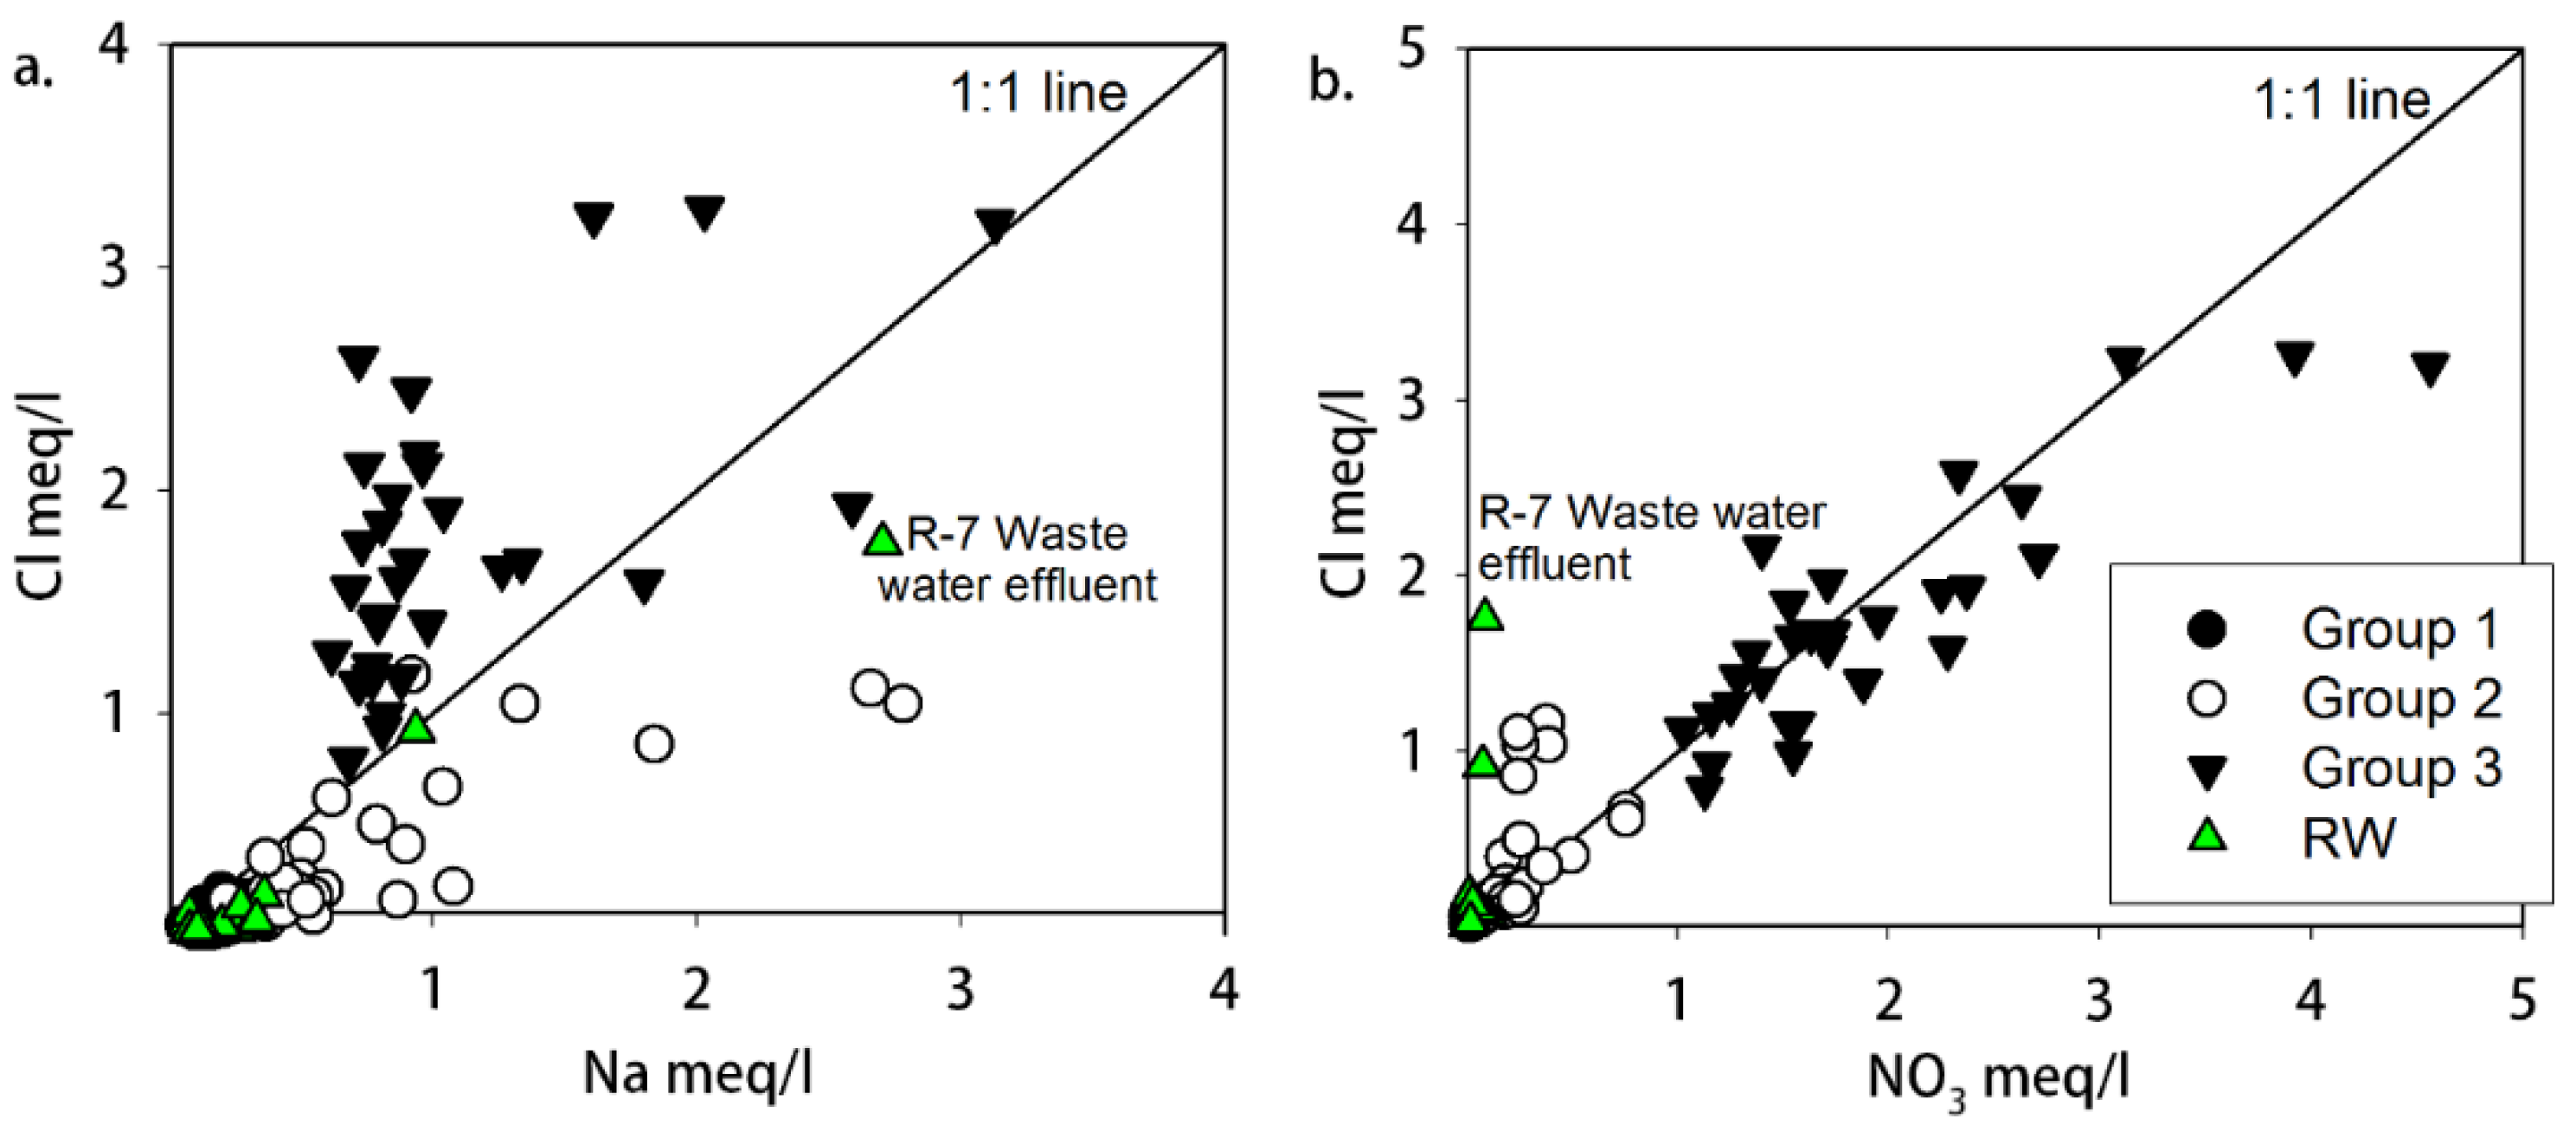
Groundwater NO3 sources were delineated based on the hydrochemistry of the water samples. Figure 9a presents the Na versus Cl concentrations of the water samples, where a slope of 1:1 indicates that Na and Cl originate from meteoric sources [53]. Most surface water samples and Groups 1 and 2 groundwater samples were plotted below the 1:1 slope line, indicative of excess Na ions from the geological matrix. Silicate mineral weathering could account for the additional Na in the surface water and Group 1 groundwater (Figure 7a) [58]. Meanwhile, for Group 2 groundwater, dominated by carbonate weathering, cation exchange processes could account for the additional Na from the geologic matrix via Ca substitution (Figure 7b). By contrast, the excess Cl concentrations in Group 3 groundwater appeared to originate from the same sources as NO3 (Figure 9b).
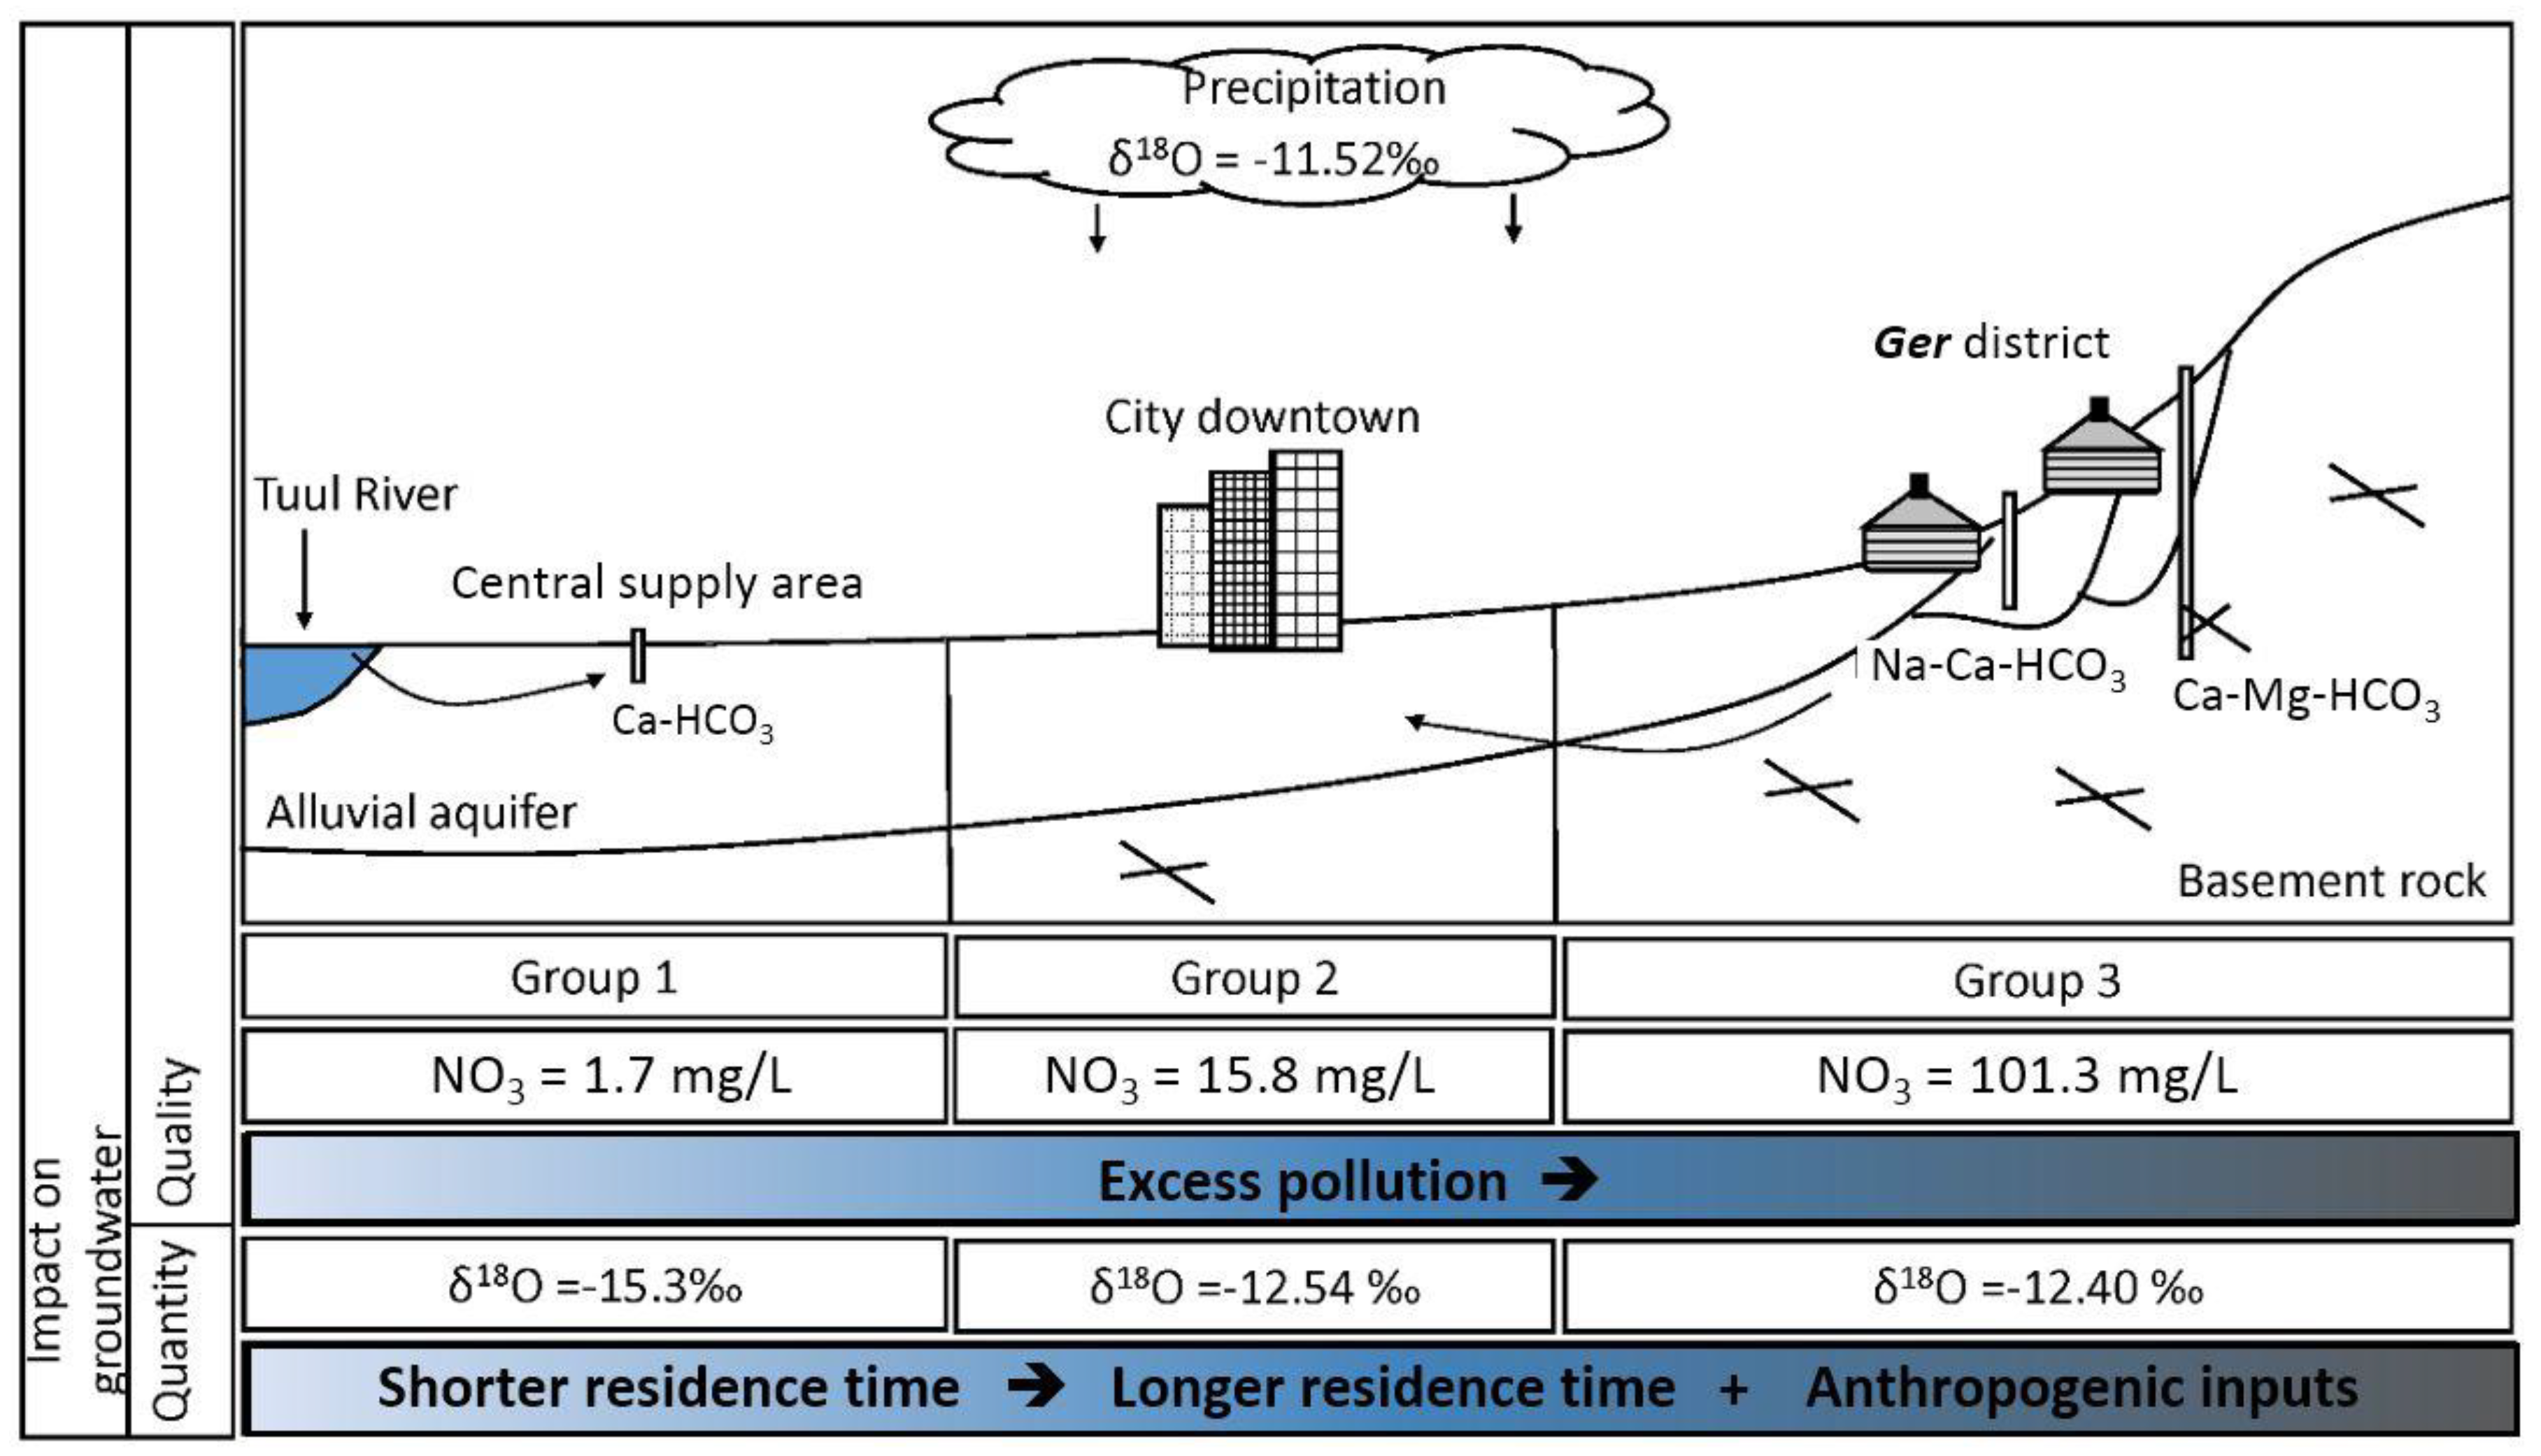
During the rapid development of UB over the last decade, population growth has surpassed that of the city’s infrastructure, and Ger districts have expanded to surround the city center. Given the lack of proper infrastructure (e.g., pipeline water-distribution systems and sewage disposal systems), groundwater wells, such as those in Groups 2 and 3, have become the main sources of water for residents through water kiosks. At the same time, the groundwater developed along the slope areas has become threatened by contamination sources, including unmanaged pit latrines and septic tanks [55]. The correlation between high NO3 concentrations and heavier isotopic values in groundwater (Figure 10) indicates that these sources could become contaminated in the Ger districts. Ultimately, contaminated groundwater from the upslope recharge area flows downward toward the discharge area, the Tuul River, slowly and steadily expanding the region impacted by contamination to the riverbank alluvial aquifer, threatening the shallow groundwater, which is the major water supply for the city center.
Figure 11 presents the results of the seasonal sampling campaigns. In Group 1, the NO3 concentration was stable, with the lowest median value of 1.7 mg/L. This value likely represents the natural NO3 concentration in alluvial aquifer groundwater, which actively interacts and mixes with the Tuul River. By contrast, the median NO3 levels in Group 2 wells ranged from 15.9 to 27.7 mg/L, with no significant temporal variation. The most contaminated groundwater, from the Group 3 wells, showed relatively wide variation among the sampling periods. The highest median value was observed during late summer in October 2011, and the lowest value was observed during winter in February 2011. In river water samples, highest nitrate levels were also recorded in October 2011 with high rainfalls, but low in July 2017 without much rainfall. This implies that nitrate levels in the river water could be affected by introduction of NO3 sources through direct surface runoff from the areas of Group 3 wells that are exposed to the same sources by recharge processes. In summary, the wide variation in NO3 concentrations during each campaign suggest that the degree of contamination varies significantly on a spatial scale, probably due to local sources of contamination. In addition, seasonal changes of nitrate background levels of the River water and the Group 3 seem to be affected by rainfall, more seasonal data should be obtained to identify any significant trends.
4. Conclusions
UB is one of the fastest growing cities worldwide. However, its rapid urbanization has surpassed urban infrastructure development (e.g., sewage disposal systems), posing a significant risk of water pollution. Therefore, we evaluated the sustainability of UB from the perspective of water-resource quality issues. Based on five sampling campaigns and hydrochemical and isotopic analyses of various water samples from the Tuul River, shallow groundwater from the alluvial aquifer, bedrock groundwater, springs, and precipitation, we came to the following conclusions:
- The hydrochemistry of the water samples from various resources is typically dependent on two major factors: NO3 contamination processes and mineral weathering processes according to water–rock interactions of carbonate and silicate minerals in the geologic matrix.
- Based on their chemical composition, the groundwater samples could be classified into three groups. Group 1 included shallow groundwater from the alluvial aquifer distributed along the Tuul River, exhibiting silicate weathering–dominant water–rock interactions with near-natural NO3 concentrations. Group 2 samples, distributed mostly on the north-eastern side of the study area, appeared to reflect carbonate hydrochemical reactions of carbonate weathering, as they had intermediate NO3 levels. Group 3 samples were dominated by CaCO3 dissolution, probably due to freshwater recharge, and had significantly elevated NO3 levels exceeding the World Health Organization drinking water guideline of 50 mg/L.
- The correlation of NO3 with Cl in the groundwater samples and the isotopic signatures implied that NO3 in groundwater resources originated from unsuitable sanitary and sewage disposal practices in the Ger districts, typically located in the upstream area surrounding UB with dense and poor living conditions.
- The stable isotope signatures delineated the typical groundwater flow in UB. Precipitation recharges into bedrock groundwater in the upslope area, flows downward, and eventually discharges to the local base level of the basin, the Tuul River, through the alluvial aquifer. In the alluvial aquifer along the river, active pumping from multiple wells using riverbank filtration drives dynamic mixing of the groundwater and river water.
- The Tuul River and shallow groundwater from the alluvial aquifer had natural background NO3 concentrations. Meanwhile, Group 3 groundwater, accounting for 32% of the total groundwater samples, showed NO3 contamination, with minimum and maximum concentrations of 64.0 and 305.6 mg/L, respectively. Finally, Group 2 groundwater samples had a maximum NO3 concentration of 47.4 mg/L and median of 15.8 mg/L, indicating that this groundwater was influenced by anthropogenic sources.
Figure 12 presents a schematic diagram of the groundwater system and its relation to NO3 contamination of water resources. The hydrochemical characteristics and stable isotope ratios of water samples indicate that groundwater flows from the upslope area to the downslope city center toward the Tuul River through the alluvial aquifer. As the groundwater moves downward, it could carry NO3 from anthropogenic sources, slowly and steadily spreading contamination. Although Group 2 groundwater in the nearby city area has NO3 levels below the guideline of 50 mg/L, its water quality will likely deteriorate in the future and warrants continuous monitoring.
As one of the fastest-growing cities worldwide, UB is facing major water supply issues, including water shortages due to over-exploitation driven by increased demand and water-quality degradation (e.g., NO3 contamination) driven by inadequate infrastructure. As identified in this study, NO3 is the major threat to water quality in UB and appears to be exerting a continuously increasing impact on water resources. In addition, rainy and dry seasonal effects appear on the water quality of river water, probably through the direct runoff from slope areas with potential sources exposed to the land surface. As water resources of adequate quality and quantity must be secured for the sustainable development of UB, appropriate institutional measures should be implemented to protect and preserve the existing water resources with systematic spatio-temporal monitoring.
Author Contributions
N.B. and N.C.W. conceived and designed the research and wrote the paper; N.B. and J.M.L. performed sampling and analysis of the data and proofread a manuscript; and B.N. contributed data collection and discussed about the problems.
Funding
This research was funded by [National Research Foundation of Korea] grant number [NRF-2016K1A3A1A08953551].
Acknowledgments
We extend our deepest appreciation to Enkhbayar Dandar, Batchimeg Gansukh, and Selenge Ganbold for their support and assistance throughout the study. This paper is a part of Naranchimeg Batsaikhan’s Ph.D. thesis at Yonsei University.
Conflicts of Interest
The authors declare no conflict of interest.
References
- Tsogtbaatar, J.; Janchivdorj, L.; Unurjargal, D.; Erdenechimeg, B. The Groundwater Problem in Mongolia. In UNESCO Chair Workshop on International Strategy for Sustainable Groundwater Management: Transboundary Aquifers and Integrated Watershed Management; UNESCO Office: Beijing, China, 2009; p. 25. [Google Scholar]
- Dagvadorj, D.; Natsagadorj, L.; Dorjpurev, J.; Namkhainyam, B. Mongolia Assessment Report on Climate Change; Ministry of Environment, Nature and Tourism of Mongolia: Ulaanbaatar, Mongolia, 2009. [Google Scholar]
- Enkhbaatar, D. Strategies for the Sustainable Redevelopment of Residential Buildings in Ulaanbaatar, Mongolia. Master’s Thesis, Rmit University, Melbourne, Australia, 2010. [Google Scholar]
- National Statistical Office of Mongolia. Bulletin of Statistics, Ulaanbaatar; National Statistical Office of Mongolia: Ulaanbaatar, Mongolia, 2016. [Google Scholar]
- Danzan, N. Migration into Ulaanbaatar City. In Workshop on Migration into Cities; Irmgard Coninx Foundation: Berlin, Germany, 2007. [Google Scholar]
- Buyankhishig, N.; Aley, M.; Enkhbayar, D. Abstraction Influence on Alluvial Aquifer of the Tuul River, Mongolia. In Trends and Sustainability of Groundwater in Highly Stressed Aquifers; IAHS-AISH Press: Hyderabad, India, 2009; pp. 80–88. [Google Scholar]
- Hiller, B.; Jadamba, N. Groundwater use in the Selenge river basin, Mongolia. J. Groundwater Sci. Eng. 2013, 1, 11–32. [Google Scholar]
- Jadambaa, N.; Tserenjav, G.; Unurjargal, D. Groundwater in Ulaanbaatar Area. In Ecology and Sustainable Development; The Institute of Geography and Geoecology: Ulaanbaatar, Mongolia, 2000. [Google Scholar]
- Battumur, R.; Chuluunbaatar, S. Present Situation and Future Prospective of Drinking and Industrial Water Supply of Ulaanbaatar; Urban Planning Designing Institute of Mongolia: Ulaanbaatar, Mongolia, 2000. [Google Scholar]
- Zandaryaa, S.; Borhculuun, U.; Munkhtuya, S. Reserves, consumption and contamination of groundwater in Ulaanbaatar, Mongolia. Atlas Urban Geol. 2003, 14, 445–488. [Google Scholar]
- Kelderman, P.; Batima, P. Water quality assessment of rivers in Mongolia. Water Sci. Technol. 2006, 53, 111–119. [Google Scholar] [CrossRef] [PubMed]
- Itoh, M.; Takemon, Y.; Makabe, A.; Yoshimizu, C.; Kohzu, A.; Ohte, N.; Tumurskh, D.; Tayasu, I.; Yoshida, N.; Nagata, T. Evaluation of wastewater nitrogen transformation in a natural wetland (Ulaanbaatar, Mongolia) using dual-isotope analysis of nitrate. Sci. Total Environ. 2011, 409, 1530–1538. [Google Scholar] [CrossRef] [PubMed] [Green Version]
- Altansukh, O.; Davaa, G. Application of index analysis to evaluate the water quality of the Tuul River in Mongolia. J. Water Res. Prot. 2011, 3, 398–414. [Google Scholar] [CrossRef]
- Dalai, B.; Ishiga, H. Geochemical evaluation of present-day Tuul River sediments, Ulaanbaatar basin, Mongolia. Environ. Monit. Assess. 2013, 185, 2869–2881. [Google Scholar] [CrossRef] [PubMed]
- Senjim, B. Changes in River Bed Morphology and Ecology—Tuul River, Mongolia. Geological Issues in Mongolia. Proc. Mong. Acad. Sci. 2005, 5, 112–121. [Google Scholar]
- Batkhishig, O. Soil pollution of Ulaanbaatar. Proc. Mong. Acad. Sci. 2016, 53, 15–19. [Google Scholar]
- Graham, J.P.; Polizzotto, M.L. Pit latrines and their impacts on groundwater quality: A systematic review. Environ. Health Perspect. 2013, 121, 521–530. [Google Scholar] [CrossRef] [PubMed]
- Batjargal, T.; Otgonjargal, E.; Baek, K.; Yang, J.S. Assessment of metals contamination of soils in Ulaanbaatar, Mongolia. J. Hazard. Mater. 2010, 184, 872–876. [Google Scholar] [CrossRef] [PubMed]
- Foster, S.S.D; Morris, B.L.; Chilton, P.J. Groundwater in urban development—A review of linkages and concerns. Impacts of Urban Growth on Surface Water and Groundwater Quality. In Proceedings of the IUGG 99, Symposium HS5, Birmingham, UK, 19–30 July 1999. [Google Scholar]
- Foster, S.S.D. The interdependence of groundwater and urbanisation in rapidly developing cities. Urban Water J. 2001, 3, 185–192. [Google Scholar] [CrossRef]
- Altai, Z.; Stoeckl, N.; King, D. Impacts of water demand side policies on Mongolian residential users. Water Pract. Technol. 2012, 7. [Google Scholar] [CrossRef]
- Karthe, D.; Chalov, S.; Borchardt, D. Water resources and their management in central Asia in the early twenty first century: Status, challenges and future prospects. Environ. Earth Sci. 2015, 73, 487–499. [Google Scholar] [CrossRef]
- Jadambaa, N. Groundwater Resource Evaluation and Flow System of Artesian Aquifers in Ulaanbaatar Area; Hydrogeology, Moscow University: Moscow, Russia, 1977. [Google Scholar]
- Engineering Geological Scientific-Research and Industrial Institute. Exploration for Evaluation Exploitable Groundwater Resource of an Alluvial Aquifer in the Tuul River Basin (Central Part); Engineering Geological Scientific-research and Industrial Institute: Ulaanbaatar, Mongolia, 1979; pp. 1–983. [Google Scholar]
- Japan International Cooperation Agency. The Study on Water Supply System in Ulaanbaatar and Surroundings; Japan International Cooperation Agency: Ulaanbaatar, Mongolia, 1995; pp. 1–1056. [Google Scholar]
- Buyankhishig, N. Hydrogeological Modeling for the Central Water Supply Source of the Ulaanbaatar City; Hydrogeology, Mongolian University of Science and Technology: Ulaanbaatar, Mongolia, 2008. [Google Scholar]
- Fenske, J.; Stephen, E. Development and Application of a Surface-Groundwater flow. Model, of the Tuul River Basin near Ulaanbaatar, Mongolia; US Army Corps of Engineers: Davis, CA, USA, 2016. [Google Scholar]
- Dandar, E. Water Resources Assessment in Cold Regions: The Upper Tuul River Basin, Mongolia; Technical University of Catalonia; UPC-Barcelona Tech.: Barcelona, Spain, 2017. [Google Scholar]
- Nriagu, J.; Nam, D.; Ayanwola, T.A.; Dinh, H.; Erdenechimeg, E.; Ochir, C.; Bolormaa, T. High levels of uranium in groundwater of Ulaanbaatar, Mongolia. Sci. Total Environ. 2012, 414, 722–726. [Google Scholar] [CrossRef] [PubMed] [Green Version]
- Bayartungalag, B. Evaluation of Urban Groundwater Quality at Ulaanbaatar, Mongolia Using Hydrochemical and Environmental Isotope Data; Korea University: Seoul, Korea, 2016. [Google Scholar]
- Basandorj, D.; Davaa, G. Tuul River Basin of Mongolia—Integrated Water Resource Management; Interpress: Ulaanbaatar, Mongolia, 2006. [Google Scholar]
- Jadambaa, N. Hydrogeology, 8th ed.; Geology and Mineralogy of Mongolia: Ulaanbaatar, Mongolia, 2010. [Google Scholar]
- Unudelger, G.; Banzragch, B. Hydrogeological Investigations in Ulaanbaatar Area; Geo-Information Center of Mongolia: Ulaanbaatar, Mongolia, 1993. [Google Scholar]
- Buyankhishig, N.; Altantuul, K. Groundwater condition in Ulaanbaatar city, Mongolia. In Proceedings of the 3rd International Forum on Strategic Technologies, Novosibirsk-Tomsk, Russia, 23–29 June 2008; pp. 644–647. [Google Scholar]
- IAEA/WISER. Global Networks of Isotopes in Precipitation; IAEA/WISER: Vienna, Austria, 2001. [Google Scholar]
- Mora, A.; Mahlknecht, J.; Rosales-Lagarde, L.; Hernández-Antonio, A. Assessment of major ions and trace elements in groundwater supplied to the Monterrey metropolitan area, Nuevo León, Mexico. Environ. Monit. Assess. 2017, 189, 394. [Google Scholar] [CrossRef] [PubMed]
- Nadiri, A.A.; Moghaddam, A.A.; Tsai, F.T.; Fijani, E. Hydrogeochemical analysis for Tasuj plain aquifer, Iran. J. Earth Syst. Sci. 2013, 122, 1091–1105. [Google Scholar] [CrossRef]
- Gu, H.; Chi, B.; Li, H.; Jiang, J.; Qin, W.; Wang, H. Assessment of groundwater quality and identification of contaminant sources of Liujiang basin in Qinhuangdao, North China. Environ. Earth Sci. 2015, 73, 6477–6493. [Google Scholar] [CrossRef]
- Chae, G.-T.; Yun, S.-T.; Kim, K.; Mayer, B. Hydrogeochemistry of sodium-bicarbonate type bedrock groundwater in the Pocheon spa area, South Korea: Water–rock interaction and hydrologic mixing. J. Hydrol. 2006, 321, 326–343. [Google Scholar] [CrossRef]
- Jiang, Y.; Wu, Y.; Groves, C.; Yuan, D.; Kambesis, P. Natural and anthropogenic factors affecting the groundwater quality in the Nandong karst underground river system in Yunan, China. J. Contam. Hydrol. 2009, 109, 49–61. [Google Scholar] [CrossRef] [PubMed]
- Gibbs, R.J. Mechanisms controlling world water chemistry. Science 1970, 170, 1088–1090. [Google Scholar] [CrossRef] [PubMed]
- Hounslow, W. Water Quality Data: Analysis and Interpretation; CRC Press: Boca Raton, FL, USA, 1995. [Google Scholar]
- Appelo, C.A.J.; Postma, D. Geochemistry, Groundwater and Pollution; CRC Press: Boca Raton, FL, USA, 2004. [Google Scholar]
- Craig, H. Isotopic variations in meteoric waters. Science 1961, 133, 1702–1703. [Google Scholar] [CrossRef] [PubMed]
- Tsujimura, M.; Abe, Y.; Tanaka, T.; Shimada, J.; Higuchi, S.; Yamanaka, T.; Davaa, G.; Oyunbaatar, D. Stable isotopic and geochemical characteristics of groundwater in Kherlen river basin, a semi-arid region in Eastern Mongolia. J. Hydrol. 2007, 333, 47–57. [Google Scholar] [CrossRef] [Green Version]
- Zhang, B.; Song, X.; Zhang, Y.; Han, D.; Tang, C.; Yu, Y.; Ma, Y. Hydrochemical characteristics and water quality assessment of surface water and groundwater in Songnen plain, Northeast China. Water Res. 2012, 46, 2737–2748. [Google Scholar] [CrossRef] [PubMed] [Green Version]
- Harvey, F.E.; Welker, J.M. Stable isotopic composition of precipitation in the semi-arid north-central portion of the US Great Plains. J. Hydrol. 2000, 238, 90–109. [Google Scholar] [CrossRef]
- Dogramaci, S.; Skrzypek, G.; Dodson, W.; Grierson, P.F. Stable isotope and hydrochemical evolution of groundwater in the semi-arid Hamersley basin of subtropical Northwest Australia. J. Hydrol. 2012, 475, 281–293. [Google Scholar] [CrossRef]
- Clark, I.D.; Fritz, P. Environmental Isotopes in Hydrogeology; CRC Press: Boca Raton, FL, USA, 1997. [Google Scholar]
- Jouzel, J.; Froehlich, K.; Schotterer, U. Deuterium and oxygen-18 in present-day precipitation: Data and modelling. Hydrol. Sci. J. 1997, 42, 747–763. [Google Scholar] [CrossRef]
- Kendall, C.; Doctor, D. Stable isotope applications in hydrologic studies. Treatise Geochem. 2003, 5, 319–364. [Google Scholar]
- Terwey, J.L. Isotopes in groundwater hydrology. In Challenges in African Hydrology and Water Resources (Proceedings of the Harare Symposium); International Association of Hydrological Sciences: Wallingford, UK, 1984. [Google Scholar]
- Gomo, M.; van Tonder, G.J.; Steyl, G. Investigation of the hydrogeochemical processes in an alluvial channel aquifer located in a typical Karoo basin of Southern Africa. Environ. Earth Sci. 2013, 70, 227–238. [Google Scholar] [CrossRef]
- Spaliding, R.; Exner, M. Occurrence of nitrate in groundwater. A review: J. Environ. Qual. 1993, 22, 392–402. [Google Scholar]
- World Health Organization. Guidelines for Drinking-Water Quality; First Addendum to the Fourth Edition; World Health Organization: Geneva, Switzerland, 2017; p. 541. [Google Scholar]
- Ward, M.H.; Mark, S.D.; Cantor, K.P.; Weisenburger, D.D.; Correa-Villasenor, A.; Zahm, S.H. Drinking water nitrate and the risk of Non-Hodgkin’s lymphoma. Epidemiology 1996, 7, 465–471. [Google Scholar] [CrossRef] [PubMed]
- Weyer, P.J.; Cerhan, J.R.; Kross, B.C.; Hallberg, G.R.; Kantamneni, J.; Breuer, G.; Jones, M.P.; Zheng, W.; Lynch, C.F. Municipal drinking water nitrate level and cancer risk in older women: The Iowa women’s health study. Epidemiology 2001, 12, 327–338. [Google Scholar] [CrossRef] [PubMed]
- Stallard, R.; Edmond, J. Geochemistry of the amazon: 2. The influence of geology and weathering environment on the dissolved load. J. Geophys. Res.-Oceans 1983, 88, 9671–9688. [Google Scholar] [CrossRef]
Figure 1.
Hydrogeological map of Ulaanbaatar (UB) and the sampling locations (modified from a 1:200,000 hydrogeological map [10]).
Figure 1.
Hydrogeological map of Ulaanbaatar (UB) and the sampling locations (modified from a 1:200,000 hydrogeological map [10]).

Figure 2.
Hydrogeological cross-section of the alluvial aquifer around Ulaanbaatar (modified from [24]).
Figure 2.
Hydrogeological cross-section of the alluvial aquifer around Ulaanbaatar (modified from [24]).

Figure 3.
Dendrogram of the groundwater sample groups based on their hydrochemical properties.

Figure 4.
Variation in the Na/(Na + Ca) and Cl/(Cl + HCO3) ratios (w/w) as a function of the total dissolved solids (TDS) in the water resources (adapted from [41]).
Figure 4.
Variation in the Na/(Na + Ca) and Cl/(Cl + HCO3) ratios (w/w) as a function of the total dissolved solids (TDS) in the water resources (adapted from [41]).

Figure 5.
Piper diagrams of the chemical compositions of groundwater and surface water in UB.

Figure 6.
Spatial distribution of the groundwater well groups with different hydrochemical characteristics in the study area.
Figure 6.
Spatial distribution of the groundwater well groups with different hydrochemical characteristics in the study area.

Figure 7.
Assessment of the dominant water–rock interactions of the water samples plotted based on (a) HCO3 vs. SiO2 and (b) HCO3 vs. Ca2+ concentrations.
Figure 7.
Assessment of the dominant water–rock interactions of the water samples plotted based on (a) HCO3 vs. SiO2 and (b) HCO3 vs. Ca2+ concentrations.

Figure 8.
δ18O and δ2H values of water in the study area: (a) precipitation from 1990 to 2001 (data obtained from [35]) and (b) water sample groups of this study from 2010 to 2017. WMP indicates the weighted median precipitation of UB, and the Global Meteoric Water line (GMWL) and Local Meteoric Water line (LMWL) are presented as solid and dotted lines, respectively. GW and RW denote groundwater and river water, respectively.

Figure 9.
Relationships of (a) Na vs. Cl and (b) NO3 vs. Cl in various water resources.

Figure 10.
Identification of source areas of groundwater contamination based on a plot of NO3 vs. δ18O.
Figure 10.
Identification of source areas of groundwater contamination based on a plot of NO3 vs. δ18O.

Figure 11.
Box plot showing the NO3 (mg/L) concentration (including the standard deviation, minimum, maximum, and median values) during sampling campaigns from 2010 to 2017. NO3 concentrations are presented on a power of the exponent scale (0.5); (a) Group 3, (b) Group 2, (c) Group 1, and (d) River water, respectively. “*”, “o” denotes outliers.

Figure 12.
Schematic diagram of the groundwater flow system in Ulaanbaatar.


Table 1.
Descriptive statistics for the hydrochemical parameters of groundwater and surface water.
| Parameter | Ground Water (N = 95) | River Water (N = 20) | ||||||
|---|---|---|---|---|---|---|---|---|
| Min. | Max. | Median | Std. Dev | Min. | Max. | Median | Std. Dev | |
| EC (µS/cm) | 65.0 | 2035.0 | 426.0 | 424.1 | 43.0 | 841.0 | 96.0 | 182.6 |
| pH | 6.3 | 8.9 | 7.2 | 0.5 | 6.5 | 8.9 | 7.8 | 0.6 |
| Temp. (°C) | 1.2 | 14.9 | 5.9 | 2.5 | 1.9 | 21.4 | 8.0 | 6.0 |
| HCO3 (mg/L) | 24.4 | 473.5 | 154.7 | 111.2 | 14.6 | 250.5 | 38.6 | 59.1 |
| SO4 (mg/L) | BDL | 104.6 | 22.3 | 30.2 | 4.0 | 65.0 | 6.6 | 14.0 |
| Cl (mg/L) | 0.6 | 206.1 | 7.2 | 35.3 | 0.4 | 62.4 | 1.8 | 14.9 |
| NO3 (mg/L) | BDL | 305.4 | 12.0 | 65.7 | 0.1 | 6.5 | 1.3 | 1.9 |
| SiO2 (mg/L) | 0.2 | 18.6 | 10.4 | 4.4 | BDL | 9.6 | 7.0 | 3.1 |
| Ca (mg/L) | 7.0 | 197.1 | 48.9 | 53.2 | 6.8 | 50.9 | 11.5 | 12.8 |
| Mg (mg/L) | 1.4 | 73.6 | 9.9 | 11.8 | 1.0 | 7.9 | 1.6 | 2.0 |
| Na (mg/L) | 1.4 | 72.0 | 12.0 | 15.2 | 1.6 | 62.2 | 2.8 | 13.6 |
| K (mg/L) | BDL | 6.3 | 0.9 | 1.2 | BDL | 14.0 | 0.7 | 3.0 |
BDL: below the detection limit.
Table 2.
Results of the principal component analysis for groundwater parameters after varimax rotation.
Table 2.
Results of the principal component analysis for groundwater parameters after varimax rotation.
| Parameter | PC 1 | PC 2 |
|---|---|---|
| HCO3 | 0.30 | 0.70 |
| SO4 | 0.57 | 0.64 |
| Cl | 0.75 | 0.55 |
| NO3 | 0.76 | 0.56 |
| SiO2 | 0.04 | 0.87 |
| Ca | 0.62 | 0.72 |
| Mg | 0.68 | 0.63 |
| Na | 0.72 | 0.42 |
| K | 0.84 | −0.03 |
| % variance explained by eigenvalues | 67.8 | 10.0 |
| % variance explained by squared sum of loadings | 40.4 | 37.4 |
Principal component loadings > 0.7: bold with underline; Principal Component (PC).
Table 3.
δ2H and δ18O values of the water resources (unit: ‰).
| Water Resource | δ18O | δ2H | |||||||
|---|---|---|---|---|---|---|---|---|---|
| Min. | Max. | Median | Std. Dev. | Min. | Max. | Median | Std. Dev. | ||
| Precipitation | −30.5 | −1.6 | −11.5 | 7.5 | −236.5 | −16.6 | −81.4 | 59 | |
| River water | −16.9 | −12.5 | −15.1 | 0.9 | −127 | −96 | −113.9 | 6.8 | |
| Groundwater | Group 1 | −16.3 | −13.2 | −15.3 | 0.7 | −129.3 | −100 | −113.5 | 6.5 |
| Group 2 | −14.4 | −11.5 | −12.5 | 0.9 | −110.2 | −87.7 | −97.3 | 6.3 | |
| Group 3 | −13.7 | −11.1 | −12.4 | 0.7 | −108.4 | −87.2 | −96.7 | 5.3 | |
Table 4.
Distribution of NO3 concentrations in various water resources in UB (unit: mg/L).
| Water Resource | Number of Samples | Min. | Max. | Median | Std. Dev. | |
|---|---|---|---|---|---|---|
| Groundwater | Group 1 | 48 | BDL | 27.8 | 1.7 | 6 |
| Group 2 | 28 | 8 | 47.4 | 15.8 | 11 | |
| Group 3 | 35 | 64 | 305.4 | 101.3 | 57.8 | |
| River water | 24 | BDL | 6.5 | 1.1 | 1.8 | |
BDL: below the detection limit.
© 2018 by the authors. Licensee MDPI, Basel, Switzerland. This article is an open access article distributed under the terms and conditions of the Creative Commons Attribution (CC BY) license (http://creativecommons.org/licenses/by/4.0/).
Share and Cite
MDPI and ACS Style
Batsaikhan, N.; Lee, J.M.; Nemer, B.; Woo, N.C. Water Resources Sustainability of Ulaanbaatar City, Mongolia. Water 2018, 10, 750. https://doi.org/10.3390/w10060750
AMA Style
Batsaikhan N, Lee JM, Nemer B, Woo NC. Water Resources Sustainability of Ulaanbaatar City, Mongolia. Water. 2018; 10(6):750. https://doi.org/10.3390/w10060750
Chicago/Turabian StyleBatsaikhan, Naranchimeg, Jae Min Lee, Buyankhishig Nemer, and Nam C. Woo. 2018. "Water Resources Sustainability of Ulaanbaatar City, Mongolia" Water 10, no. 6: 750. https://doi.org/10.3390/w10060750
Note that from the first issue of 2016, this journal uses article numbers instead of page numbers. See further details here.