Trends in Precipitation and Temperatures in Eastern Slovakia (1962–2014)
by
 , , and
Martina Zeleňáková
1,* ,
,
Pavol Purcz
2,
Peter Blišťan
3 ,
,
Zuzana Vranayová
4, 
Helena Hlavatá
5,
Daniel Constantin Diaconu
6 and
and
Maria Manuela Portela
7 1
Department of Environmental Engineering, Faculty of Civil Engineering, Technical University of Košice, Košice 042 00, Slovakia
2
Department of Applied Mathematics, Faculty of Civil Engineering, Technical University of Košice, Košice 042 00, Slovakia
3
Cartography and Geographical Information Systems, Institute of Geodesy, Faculty of Civil Engineering, Technical University of Košice, Košice 042 00, Slovakia
4
Department of Architectural Engineering, Faculty of Civil Engineering, Technical University of Košice, Košice 042 00, Slovakia
5
Slovakian Hydrometeorological Institute, Branch Office Košice, Košice 041 17, Slovakia
6
Research Center for Integrated Analysis and Territorial Management, Department of Meteorology and Hydrology, Faculty of Geography, University of Bucharest, Nicolae Balcescu 1, Bucharest 010041, Romania
7
Department of Civil Engineering, Technical University of Lisbon, Lisbon 1049-001, Portugal
*
Author to whom correspondence should be addressed.
Water 2018, 10(6), 727; https://doi.org/10.3390/w10060727
Submission received: 7 April 2018
/
Revised: 30 May 2018
/
Accepted: 1 June 2018
/
Published: 3 June 2018
(This article belongs to the Special Issue Hydrology, Water Resources Management and Protection of the Marine Environment–Selected Papers from the 15th International Conference on Environmental Science And Technology (CEST2017))
Abstract
:In this paper, the results of trend analysis applied to precipitation and temperature monthly data for the period from 1962 to 2014 is presented for the hydrological year (from November to October) in sixteen climatic stations in Eastern Slovakia. The topography of this part of the country is very diverse and it affects the climate. The Mann-Kendall non-parametric test coupled with Sen’s slope was applied to identify the significant long-term climatic trends, as well as the magnitude of those trends. According to the present study, all climatic stations in Eastern Slovakia show a positive trend in temperature during the year and almost all of them show a significant positive annual trend in temperature. Seasonal and monthly trend analyses produced the same results. Trends in temperature are always positive during winter and spring. Trends in precipitation are also mostly positive during winter and spring, although some negative trends were also found during these seasons. The spatial distribution of precipitation and temperature trends was modelled in ArcGIS using geostatistical analysis. Abrupt positive trend shifts in annual precipitation and temperature time series were also investigated. An abrupt shift in precipitation at the highest climatic station, Lomnický peak, began around 1985 (+). Abrupt shifts in temperature began around 1970 (+) at the presented climatic stations. The extremity of the climate is confirmed by an analysis of the trends in wet and dry spells. Trends showed increasing tendencies in medium- and long-term wet spells.
1. Introduction
Spatial and temporal variability in precipitation and temperature time series is important from both scientific, as well as practical, points of view. In the last decades the interest in precipitation, as well as temperature, trends has increased all over the world mainly due to climatic variability. Water management, agriculture, environmental engineering, and economic sectors play an important role in the investigations of precipitation and temperature trends, as these are major factors in these sectors.
The Intergovernmental Panel on Climate Change [1] provides a comprehensive review of the potential impacts on climate. Climatic change is considered likely to increase runoff in the higher latitude regions because of increased precipitation, while on the other hand flood frequencies are also expected to change in some locations and the severity of drought events could increase as a result of those changes in precipitation, temperature and evaporation. In all these considerations ‘the issue’ then becomes the effect of global warming and its impacts on the environment and water resources in particular.
In Slovakia, as in many other European countries (e.g., Romania, Portugal, Greece), fresh water-related risk, and specifically droughts, are expected to become more frequent, intense, and prolonged due to climate change [2,3]. At the same time, most of the studies about this issue are focused on specific regions or aspects rather than aiming at a comprehensive characterization of the phenomenon for the whole country, based on extensive hydrological ground data, e.g., [4,5,6,7,8,9,10,11,12,13,14].
Many researchers are investigating spatial and/or temporal trends in precipitation and temperatures worldwide.
Jiang et al. [15], Yan et al. [16], Xu et al. [17], and Tao et al. [18] investigated the spatial and/or temporal precipitation and/or temperature and/or discharge trends in China. They found an increasing trend over the country especially in the Yangtze River Basin and the Tarim River Basin. Contraily, Liu et al. [19] concluded that a decreasing trend exists in most of the stations in the Yellow River Basin in China.
Singh et al. [20] performed trend and variability analyses of rainfall and relative humidity in the northwest and central river basins of India. The results showed increasing trends in seasonal and annual scales. The temporal variation in monthly, seasonal, and annual rainfall over Kerala, India was studied by Krishnakumar et al. [21]. The analysis confirmed the significant decrease in monsoon rainfall and the increase in the post-monsoon season in this southwestern part of India. However, trend analysis of rainfall data series in India for 1871–2008 examined by Jain et al. [22] did not show any clear trend for the region as a whole, although there are seasonal trends for some seasons and for some hydro-meteorological subdivisions.
Studies from Iran have also examined the changes in meteorological variables [23,24,25]. Their results showed that there was no statistically significant climate variability, or only a slightly decreasing trend, in annual precipitation in Iran. A decrease in annual precipitation was also observed in Western and Southern Turkey [26].
Chingombe et al. [27] applied a trend detection framework to the Upper Mazowe, Zimbabwe catchments. The results indicate that the temporal patterns in the variables have not been uniform and that the hydrologic variables may accentuate trends and patterns that exist in the meteorological variable that act as inputs to the hydrological cycle. Kampata et al. [28] analysed the precipitation trends in the Zambezi River Basin in Zambia. Their results showed a decreasing trend at the analysed stations [29].
In recent years, a number of studies have been published focusing on the evolution of precipitation, drought conditions, and moisture availability in the Mediterranean during the 20th century [30,31,32]. Sousa et al. [32] used a modified version of the Mann-Kendall test that accounts for serial auto-correlation. The results show a clear trend towards drier conditions during the 20th century in most Western and Central Mediterranean regions. El Kenawy et al. [33] investigated the spatial variability of temperature trends over Libya in the second half of the 20th century. Trends in precipitation in Libya were studied by Zelenakova et al. [34].
Ceppi et al. [35] performed a trend analysis of temperatures for 50 years in Switzerland. They confirmed a positive trend with an annual average warming rate of 0.35 °C/decade. Tomozeiu et al. [36] examined the spatial and temporal variability of summer precipitation in Northern Italy. They found an increasing trend with a significant upward shift around 1962 at almost all analysed stations. In contrast Buffoni et al. [37] identified a decreasing trend in annual precipitation series over all Italy, although it was statistically significant only in the central south. Karpouzos et al. [38] investigated the temporal variability of precipitation in the Prieria region, located in Northern Greece. A downward trend, even though not statistically significant, was derived in the study area, mainly in spring. Tişcovschi et al. [39] investigated changes recorded in Romania’s climate. Trends in temperature in Serbia were detected by Gocic and Trajkovic [40]. They indicated increasing trends in both annual and seasonal minimum and maximum air temperature series.
Sayemuzzaman and Jha [41] and Sayemuzzaman et al. [42] investigated climate variability in North Carolina, United States. They found decreasing trends in Tmax and increasing trends in Tmin data series on a sub-seasonal scale. Mixed trends (increasing and decreasing) were detected in annual, spring, and summer precipitation data series. Alexander et al. [43] were able to incorporate studies across different regions to obtain a global picture of trends in extreme precipitation and temperature. Unlike those of extreme temperature, trends in extreme precipitation were commonly found to be spatially incoherent. In this regard, more recent studies have maximized the spatial availability of observations to examine trends in precipitation extremes.
This paper presents temporal, as well as spatial, precipitation and temperature trends using the Mann-Kendall non-parametric test at climatic stations in the eastern part of Slovakia.
2. Materials and Methods
2.1. Study Area
Slovakia is located in the northern moderate climatic zone. There are four seasons during the year—spring, summer, fall and winter. The topography of Slovakia is very diverse, and altitude is an important factor affecting the temperature and precipitation.
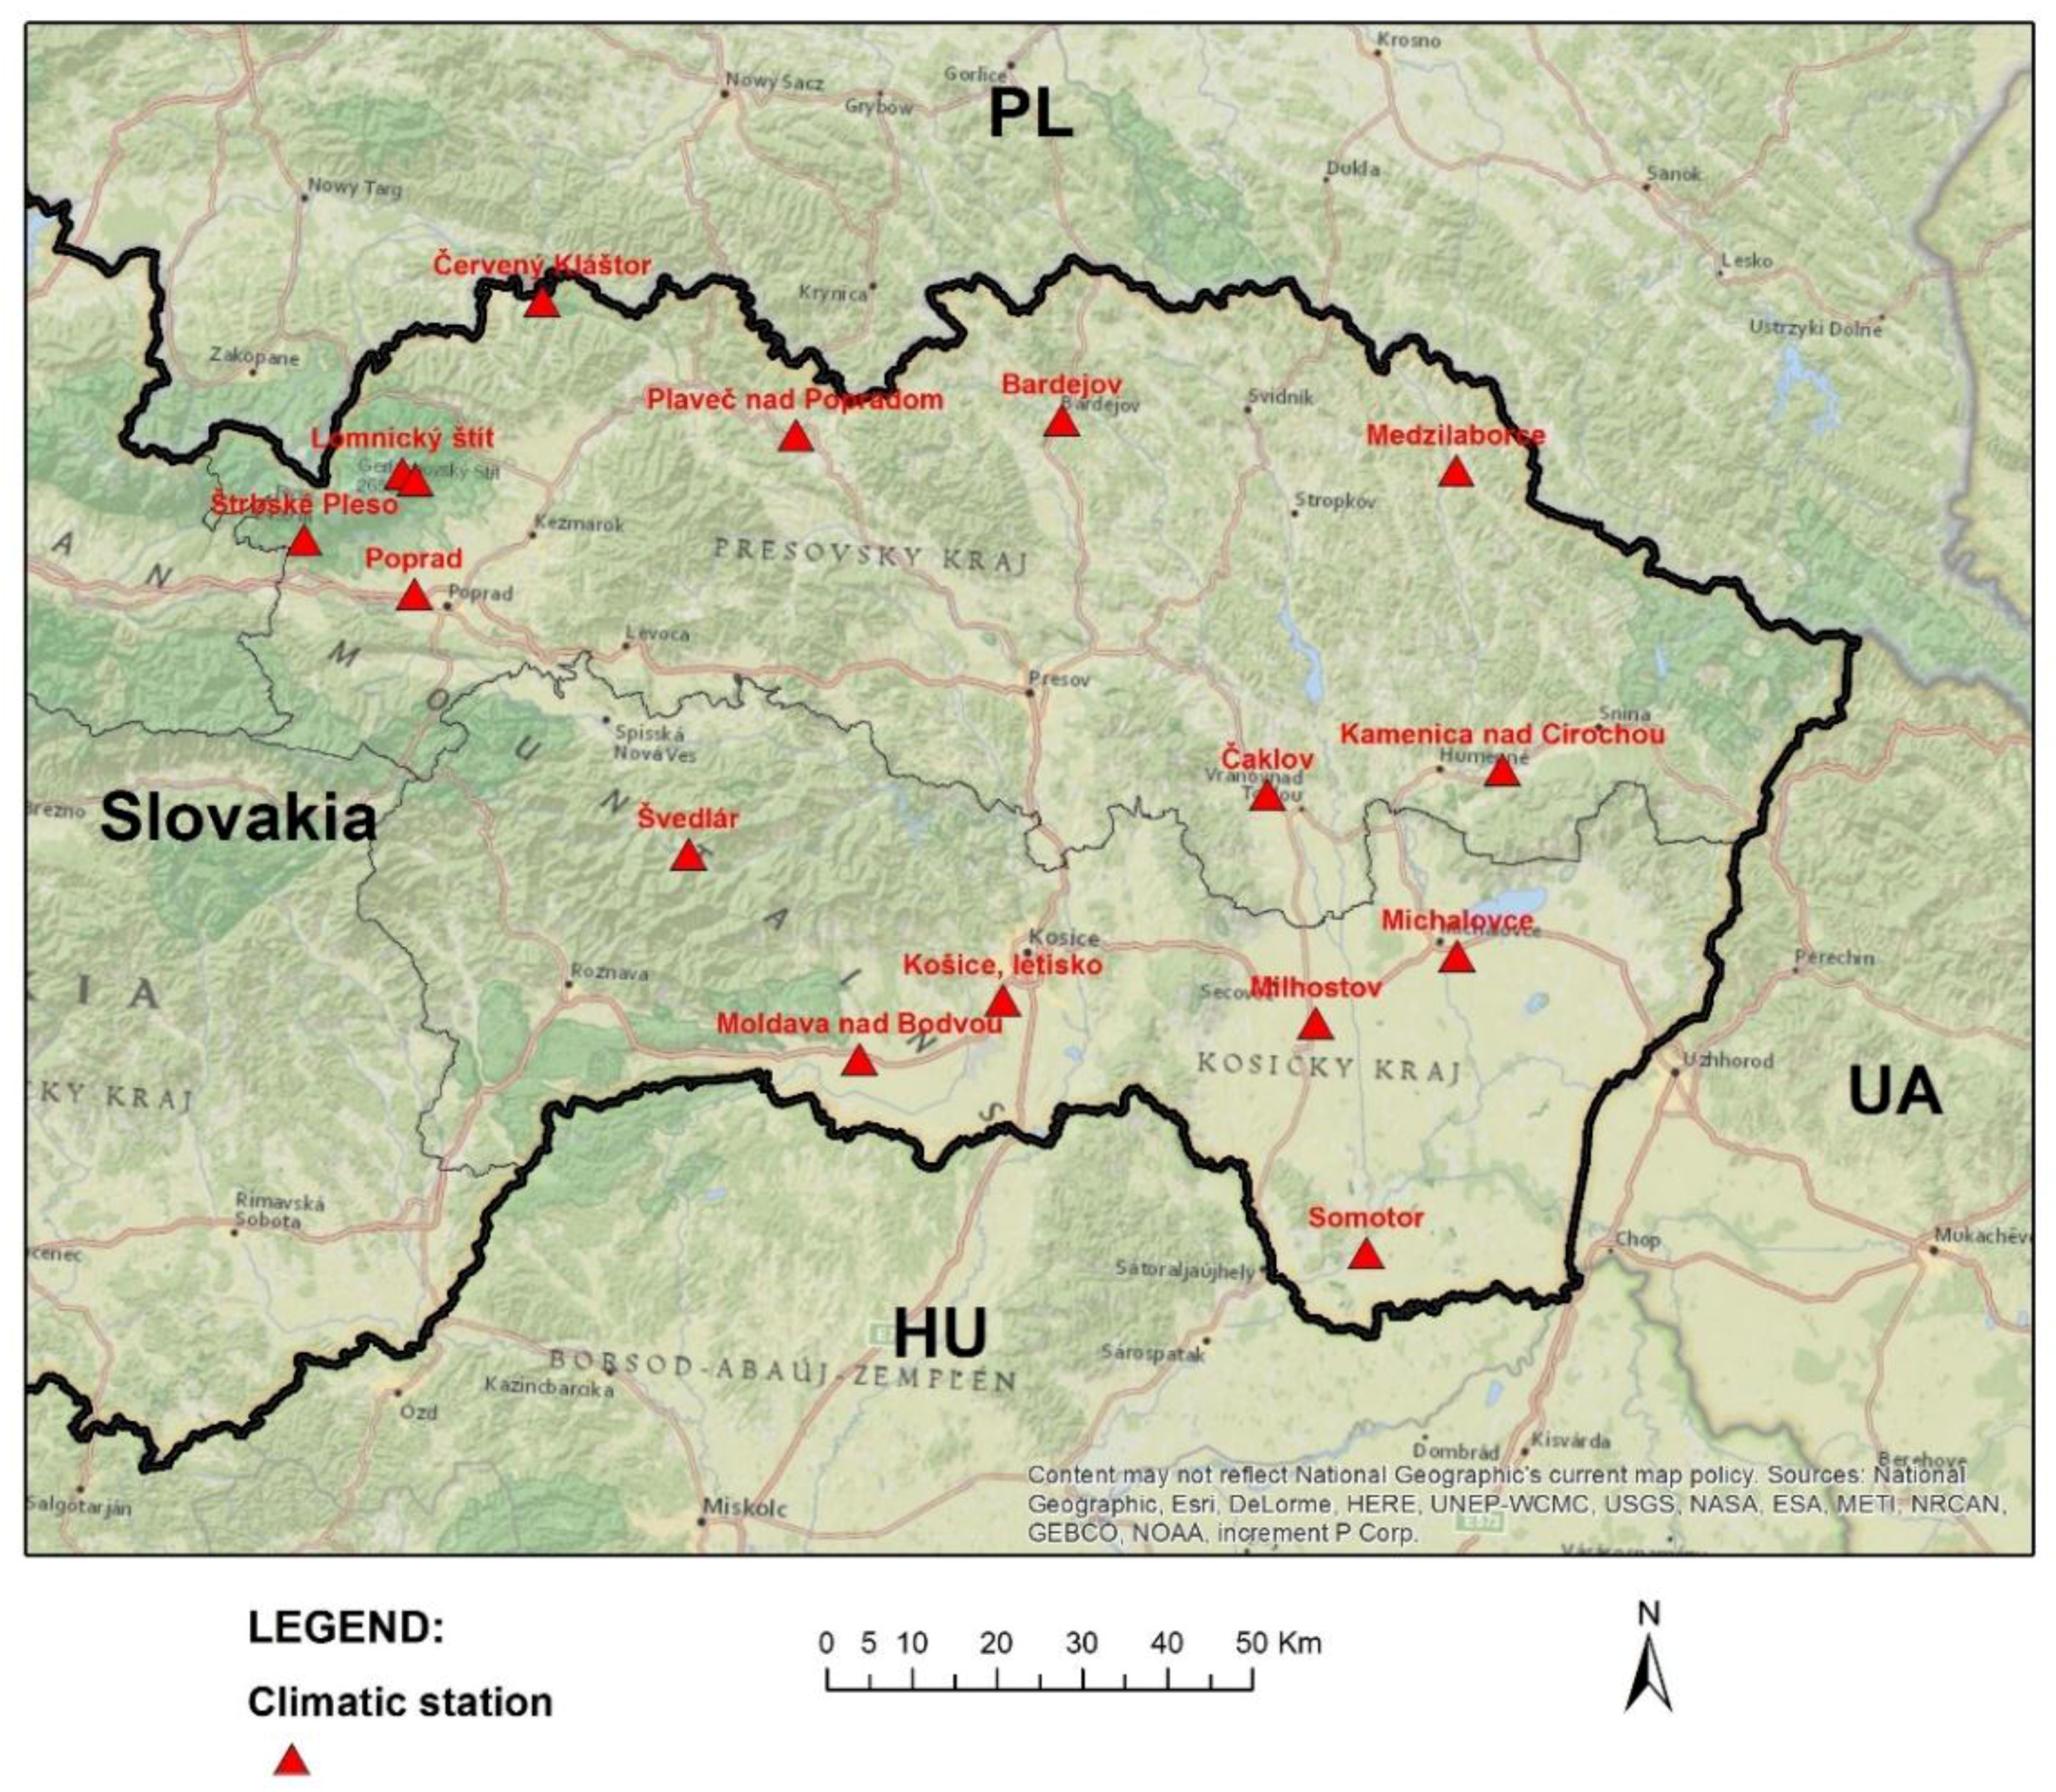
The area under study is depicted in Figure 1. The locations of climatic stations in Eastern Slovakia are listed in Table 1.
The territory under this study in Slovakia lies in the eastern part of the country, particularly in the Bodrog and Hornád river basins. The morphological type of terrain in the Hornád valley is dominated by rolling hills, higher and lower uplands. The southern sub-basin is part of a plain and the Slovakian Karst and is formed by moderately higher uplands [44,45]. The geological structure of the territory determines the hydro-geological conditions of the basin. The sub-basin of the Hornád valley can be assigned to areas with a strong predominance of impervious or poorly permeable rock with moderate to low permeability. Well-drained rock with high permeability exists only in the Spiš and Gemer areas and in the Slovakian Karst near Košice. The Bodrog watershed area, consisting of the Cirocha, Laborec, Latorica, Ondava, Topľa, and Uh river basins, is located in two orographic subassemblies, which are the Carpathian Mountains and the Pannonian Basin. The morphological type of the relief is predominantly flat in the southern part, hilly in the northern part. The Bodrog river valley has varied climatic conditions. Precipitation is highly differentiated. The highest annual totals are mainly in the eastern border mountains and Vihorlat where rainfall totals are about 1000 mm. Decrease in total precipitation is quite marked directly to the south, where annual totals fall to below 800 mm. The Michalovce, Lastomír, and Medzibodrožie lowlands rank among the driest in the eastern region (550 mm rainfall per year).
2.2. Data
Monthly precipitation and temperature data recorded at 16 climatic stations in Eastern Slovakia operated by Slovak Hydrometeorological Institute were collected for this study. In all, a network stations data length from 1962 to 2014, it means 53 years of data for hydrological year in Slovakia (from November to October), were set up to study precipitation and temperature trends in Eastern Slovakia. This length of data set satisfies the minimum required length in searching for evidence of climate change in hydroclimatic time-series as proposed by Burn and Elnur [46].
2.3. Statistical Analysis
Trend analysis for hydrological time series is an important and popular tool for better understanding the effects of climate variation and anthropogenic activities.
In this study the non-parametric Mann-Kendall test is used for the detection of the trend in a time series. This test is widely used in environmental science because it is simple and robust and can cope with missing values and values below a detection limit. The first proposal of the test was by Mann [47] and Kendall [48]. The Mann-Kendall (MK) test is a rank-based nonparametric test for assessing the significance of a trend, and has been widely used in hydro-meteorological trend detection studies [46]. A serious problem in detecting and evaluating trends in hydrologic data is the effect of serial dependence [49]. Inconsistencies in hydroclimatical data recording may occur due to various reasons, such as: instrumentation, changes in observation procedures, or changes in gauge location or surrounding conditions [43]. That is, if an autocorrelation exists in a time series, the MK test tends to reject the null hypothesis of no trend more often than the specified level of significance [50]. Methods that consider autocorrelation in trend detection were reviewed by Khaliq et al. [51]. In this paper we use a trend-free pre-whitening method before applying the MK test to detect significant trends, as the MK test requires the time series to be serially independent. The applications carried out considered the significance level α = 0.05 and, accordingly, MK statistics (Z): Zα/2 = 1.645. Positive values of Z indicate increasing trends, while negative values of Z show decreasing trends.
The trend-free pre-whitening (TFPW) procedure [52] was applied to detect a significant trend in a serially correlated time series, although it shows very high Type I error rates with increasing autocorrelation. The original sample data Xt were unitized by dividing each of their values by the sample mean E(Xt) prior to conducting the trend analysis.
The magnitude of the trend was determined using Sen’s estimator. Sen’s method assumes a linear trend in the time series and has been widely used for determining the magnitude of trend in hydro-meteorological time series [22,26,52,53,54,55,56,57]. In this method, the slopes (β) of all data pairs are first calculated by:
for i = 1, 2, ..., N, where xj and xk are data values at times j and k (j > k) respectively, and N is the number of all pairs xj and xk.
A positive value of β indicates an upward (increasing) trend and a negative value indicates a downward (decreasing) trend in the time series.
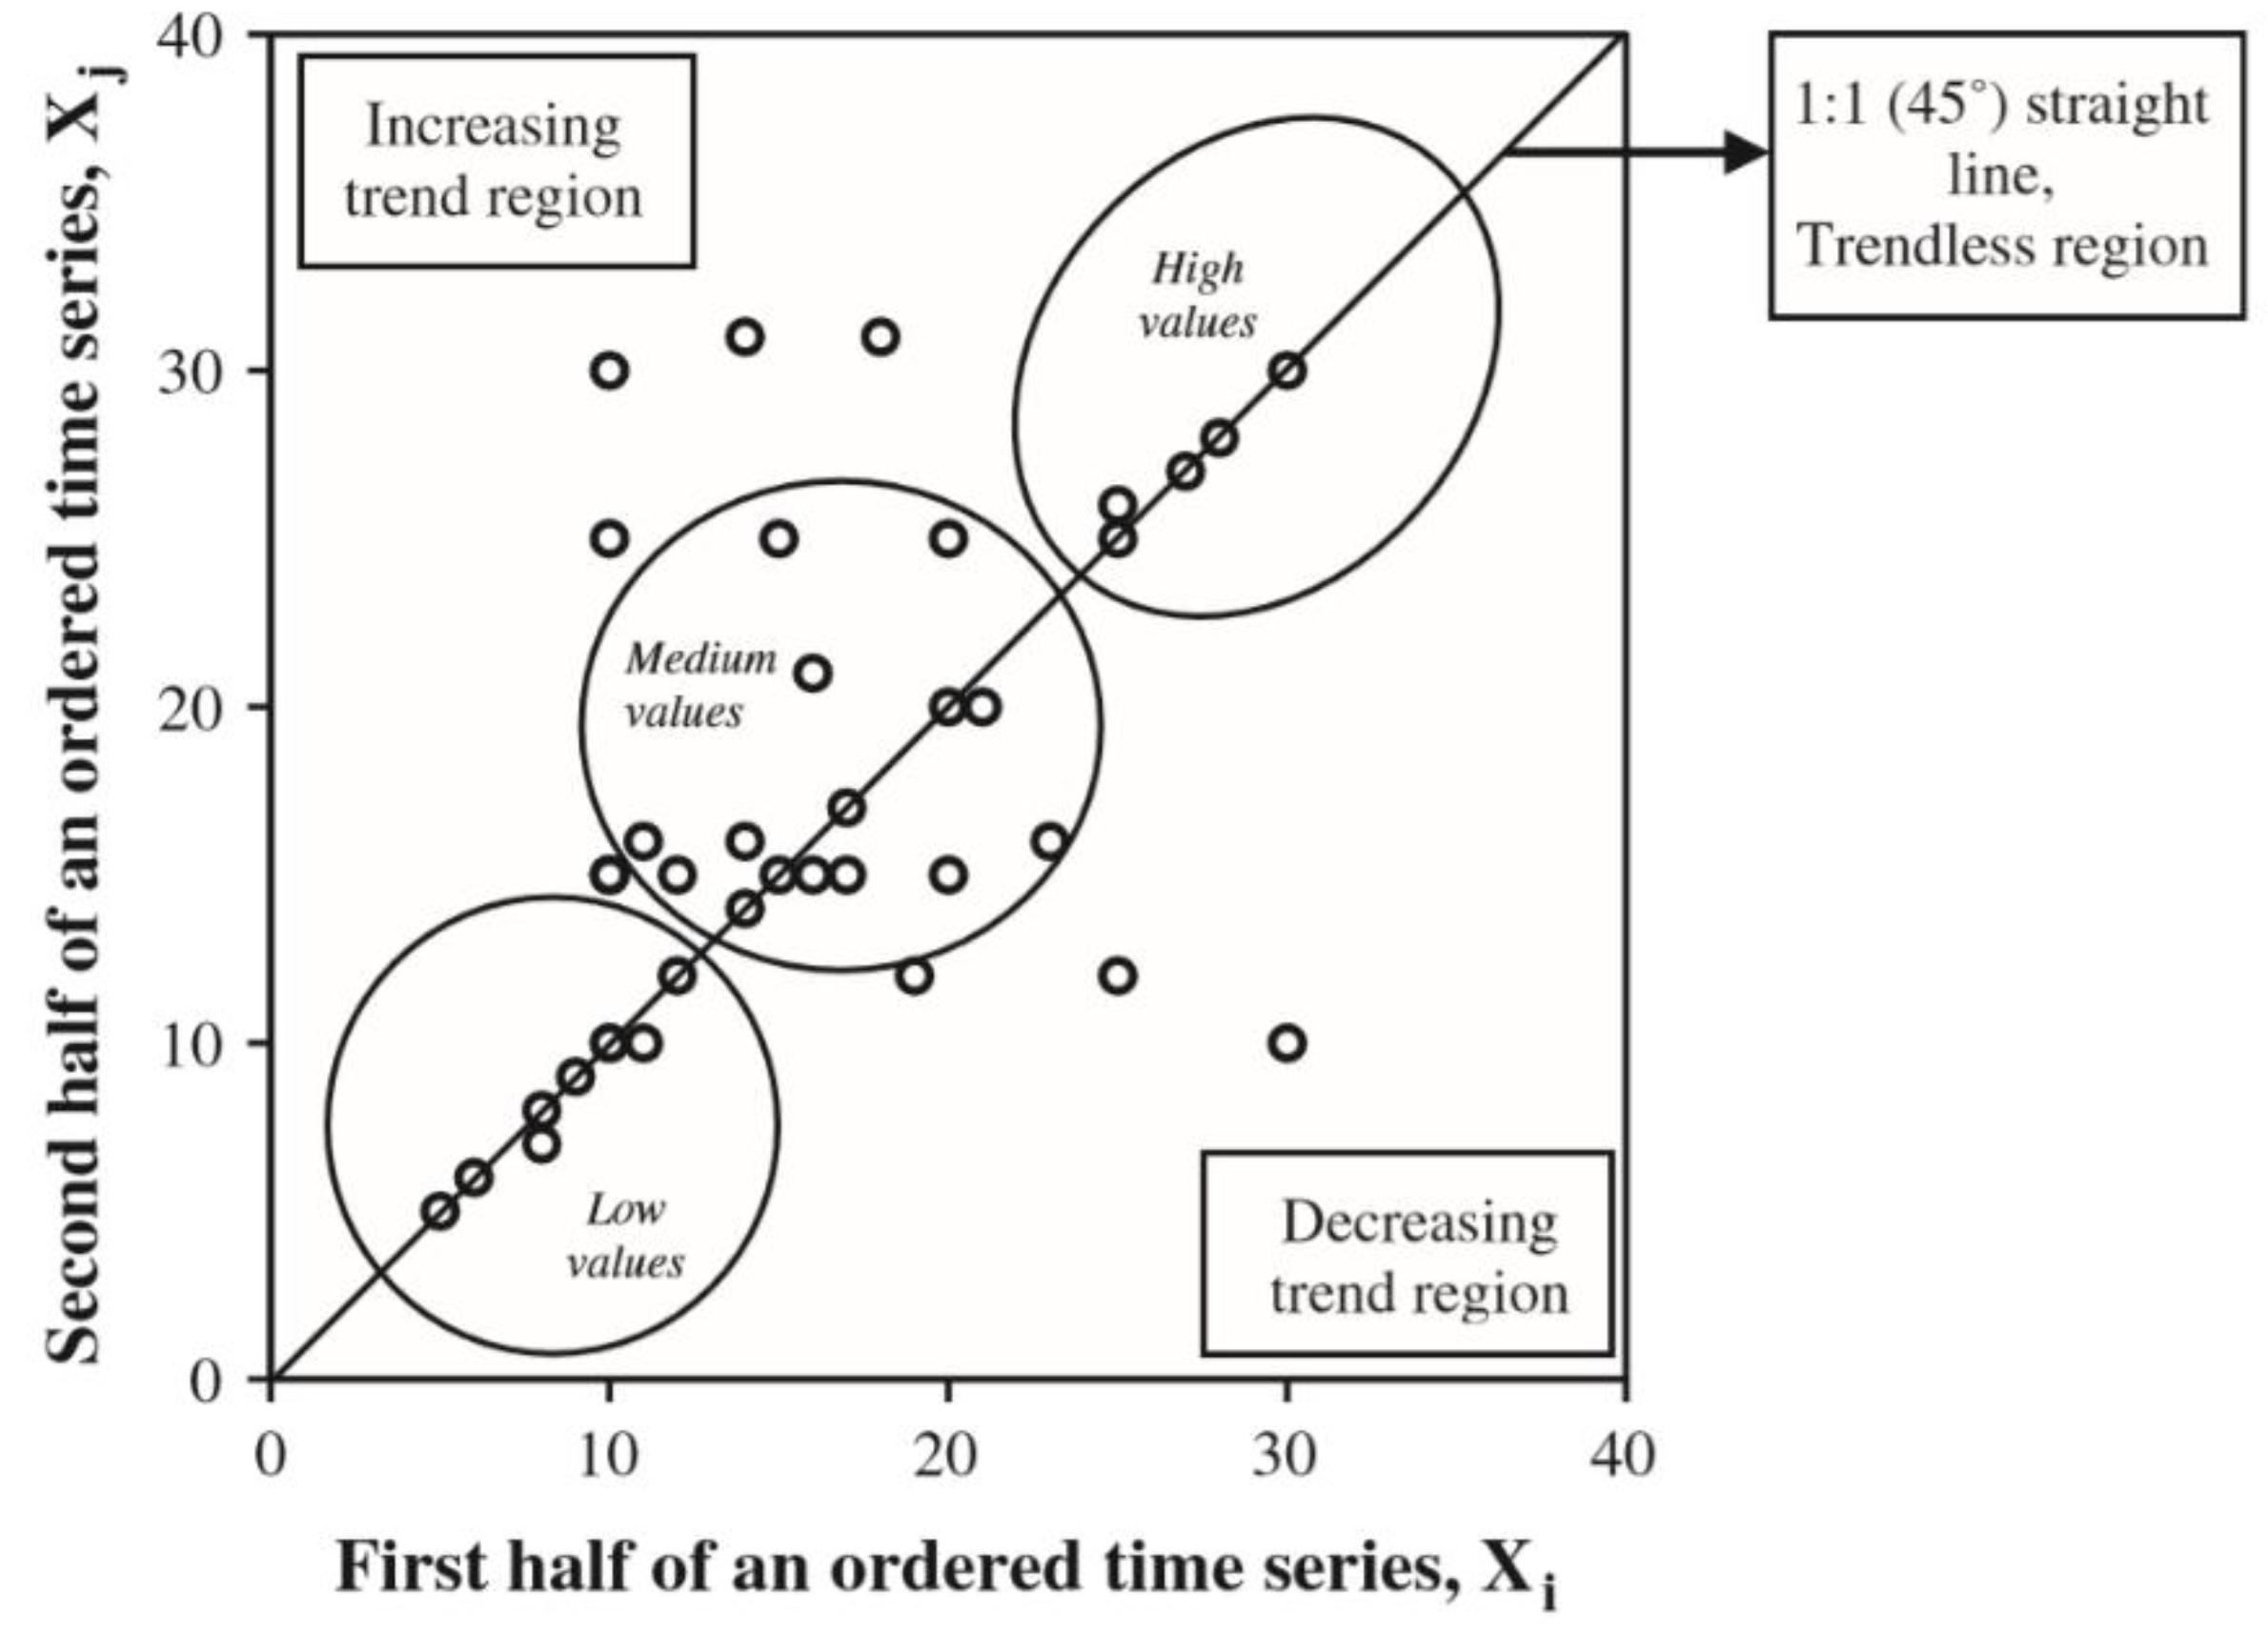
As a novel method we applied the Sen trend detection test [58]. A recorded hydrological time series is divided into two equal halves from the first date to the end date, and both sub-series are separately sorted in ascending manner. The first sub-series (Xi) is then located on the X-axis, and the other sub-series (Xj) is located on the Y-axis (Figure 2) based on the Cartesian coordinate system. If data are collected on the 1:1 (45°) straight line, it can be said that there is no trend (a trendless time series). If data are in the triangular area below the 1:1 straight line, it can be said that there is a decreasing trend in time series. If data are in the triangular area above the 1:1 straight line, it can be said that there is an increasing trend in time series [58,59,60]. Moreover, low, medium, and high values of a parameter can be graphically evaluated with this method. This method was applied by Sen [60] on long-term recorded variables of precipitation, annual flow [58], and temperature [59].
All mathematical relationships were programmed in Visual Basic in Microsoft Excel 2003.
2.4. Spatial Distribution of Trends
We have used the modelling and analysis tools of ArcGIS—Geostatistical Analyst—in modelling the spatial distribution of precipitation and temperature trends. Geostatistics is based on the regionalization of random variables in a given area. A set of random variables generates a random function. The random function model is based on a study of the spatial variability of the studied phenomenon in different directions—an experimental variogram. The result of this study is a mathematical model of the variogram defined by changing the spatial variability in different directions of space through anisotropy and autocorrelation. Calculation of the empirical semivariogram is written in the form given by Clark [61]:
where: γ (h) is estimated semivariation for the distance h; n(h) is the number of pairs of measured points separated by a distance h; z(si) is a measured value in point (si).
The first step is the calculation of the empirical semivariogram, followed by the transfer of the empirical semivariogram into its theoretical model and determining its parameters. The model found for a given set of data depends on the experimental and theoretical assumptions.
The determining of semivariogram parameters is followed by the actual process of estimating the phenomenon of unknown values based on known data—kriging [61].
The results of this modeling are presented in Figures 4 and 6.
The results of trend analysis for the precipitation and temperature time series are discussed in Section 3.
2.5. Shift Analysis
A trend changes over time, beginning with the trend year, and abrupt trend detection analysis is important for understanding the regime shift across the study area over the study period [42]. An extension of the MK test, the Sequential Mann Kendall (SQMK) test, is widely used to detect the time when a trend has a shift. SQMK is a sequential forward and backward analysis of MK test results [41,62,63]. We used the SQMK test in this study to detect change in regime. If the two series cross each other, the year of crossing is the year of the trend change [61]. If the two series cross and diverge for a longer period of time, the beginning divergent year is the year of the trend change [41,62].
2.6. Dry/Wet Spells
Daily precipitations in mm are measured with a standard rain gauge with an opening of 500 cm2, which is elevated one meter above the ground. Climatic stations are part of the national network of the Slovak Hydrometeorological Institute.
For all stations we also analyzed numbers and trends of the dry/wet periods. A dry spell is considered as the number of consecutive days without precipitation. A wet spell is the number of consecutive days with precipitation greater than 0.1 mm. We divided the duration of dry periods into the following categories:
- ST—short-term dry/wet period with a length in the range from 1 to 5 days;
- MT—medium-term dry/wet period with a length of between 6–10 days; and
- LT—long-term dry/wet period with duration of 11 days or more.
For each station we subsequently produced graphs of dry/wet periods which contain the sum of the individual categories ST, MT, or LT, and trends were stated based on the MK test.
3. Results
Data series for the 53-year period from 1962 to 2014 were considered for trend detection. In Sen’s method the slope of all the data points is calculated and their median value is Sen’s estimator of the slope. The evaluation was done for the time period from November to October (XI–X). The seasons during the year are represented by months marked in the Tables—winter (November, December, January) (XI–I), spring (February, March, April) (II–IV), summer (May, June, July) (V–VII), and fall (August, Septebmer, October) (VII–X). We also evaluated the trends in cold period during the year (November–April) (XI–IV) and warm period of the year (May–October) (V–X) in the study area. Bold values indicate statistical significance at 95% confidence level as per the Mann-Kendall test (+ for increasing and − for decreasing).
3.1. Precipitation Trends
Results of precipitation analysis are presented for annual and seasonal data (Table 2), as well as for monthly data (Table 3).
Almost all climatic stations in Eastern Slovakia show positive although not significant trends in annual and seasonal precipitation (Table 2). Climatic stations: Poprad, Plaveč nad Popradom, and Medzilaborce present a significant increasing trend in annual precipitation. These are situated in a mountainous area at altitudes more than 300 m above sea level (Table 1). Seasonal trend analysis produced the same results: most of the climatic stations confirmed increasing trends in precipitation in the study area. Significant positive trends are found at the Lomnický peak station in the High Tatra mountains. Significant positive trends in precipitation are evident during the summer season. No significant trends are found in the fall. Trends in precipitation are also mostly positive during winter and spring, although some negative trends were also found during these seasons.
Regarding trend analysis of monthly precipitation data (Table 3), no clear general increasing trend or decreasing trend in precipitation was found although several significant positive trends in precipitation were detected at specific stations in this area. Clear significant positive trends were identified at the Lomnický peak climatic station, which is the highest station in Slovakia—2635 m asl. (Table 1). The trend slope increase in precipitation was up 2.21 mm/month. Trend analysis in the months January, May, July, and October show all trends as positive. A significant declining trend was demonstrated only in August at two climatic stations.
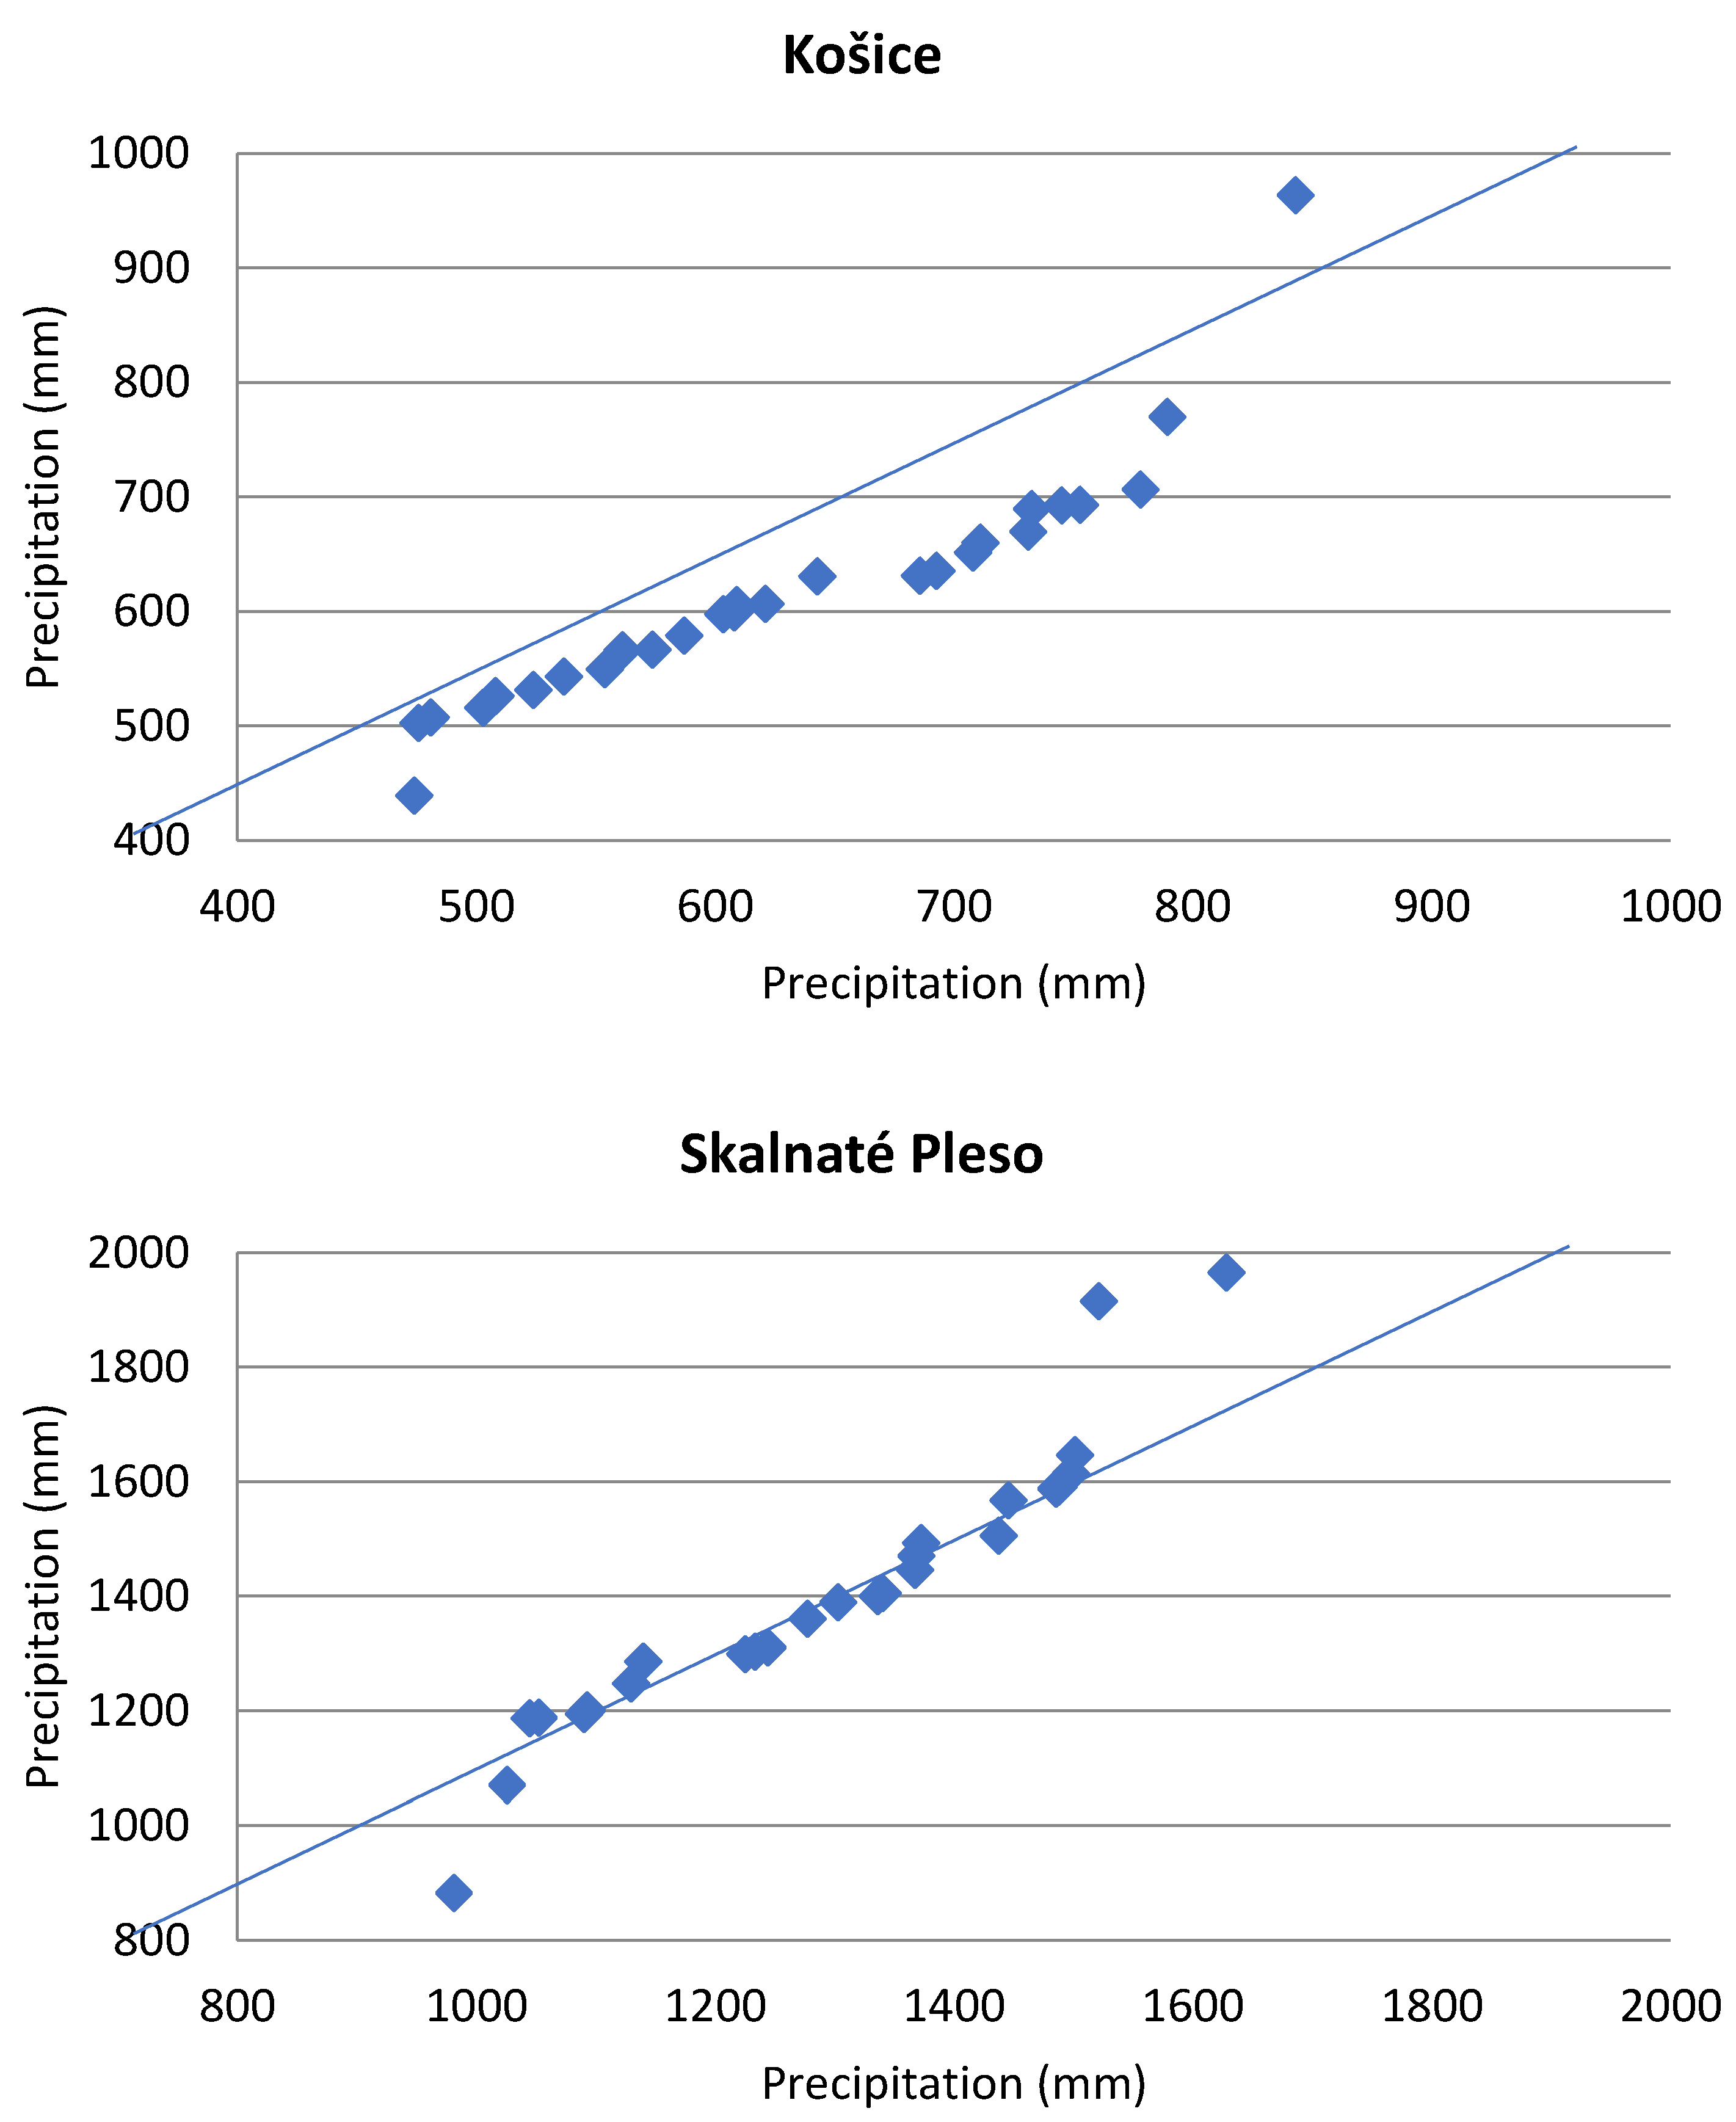
Trends of precipitation with Sen test are illustrated in Figure 3 for Košice and Skalnaté Pleso stations. These figures show variations of precipitation in the stations, and it can be seen as trendless time series of the data at Košice station and increasing time series at Skalnaté Pleso station.
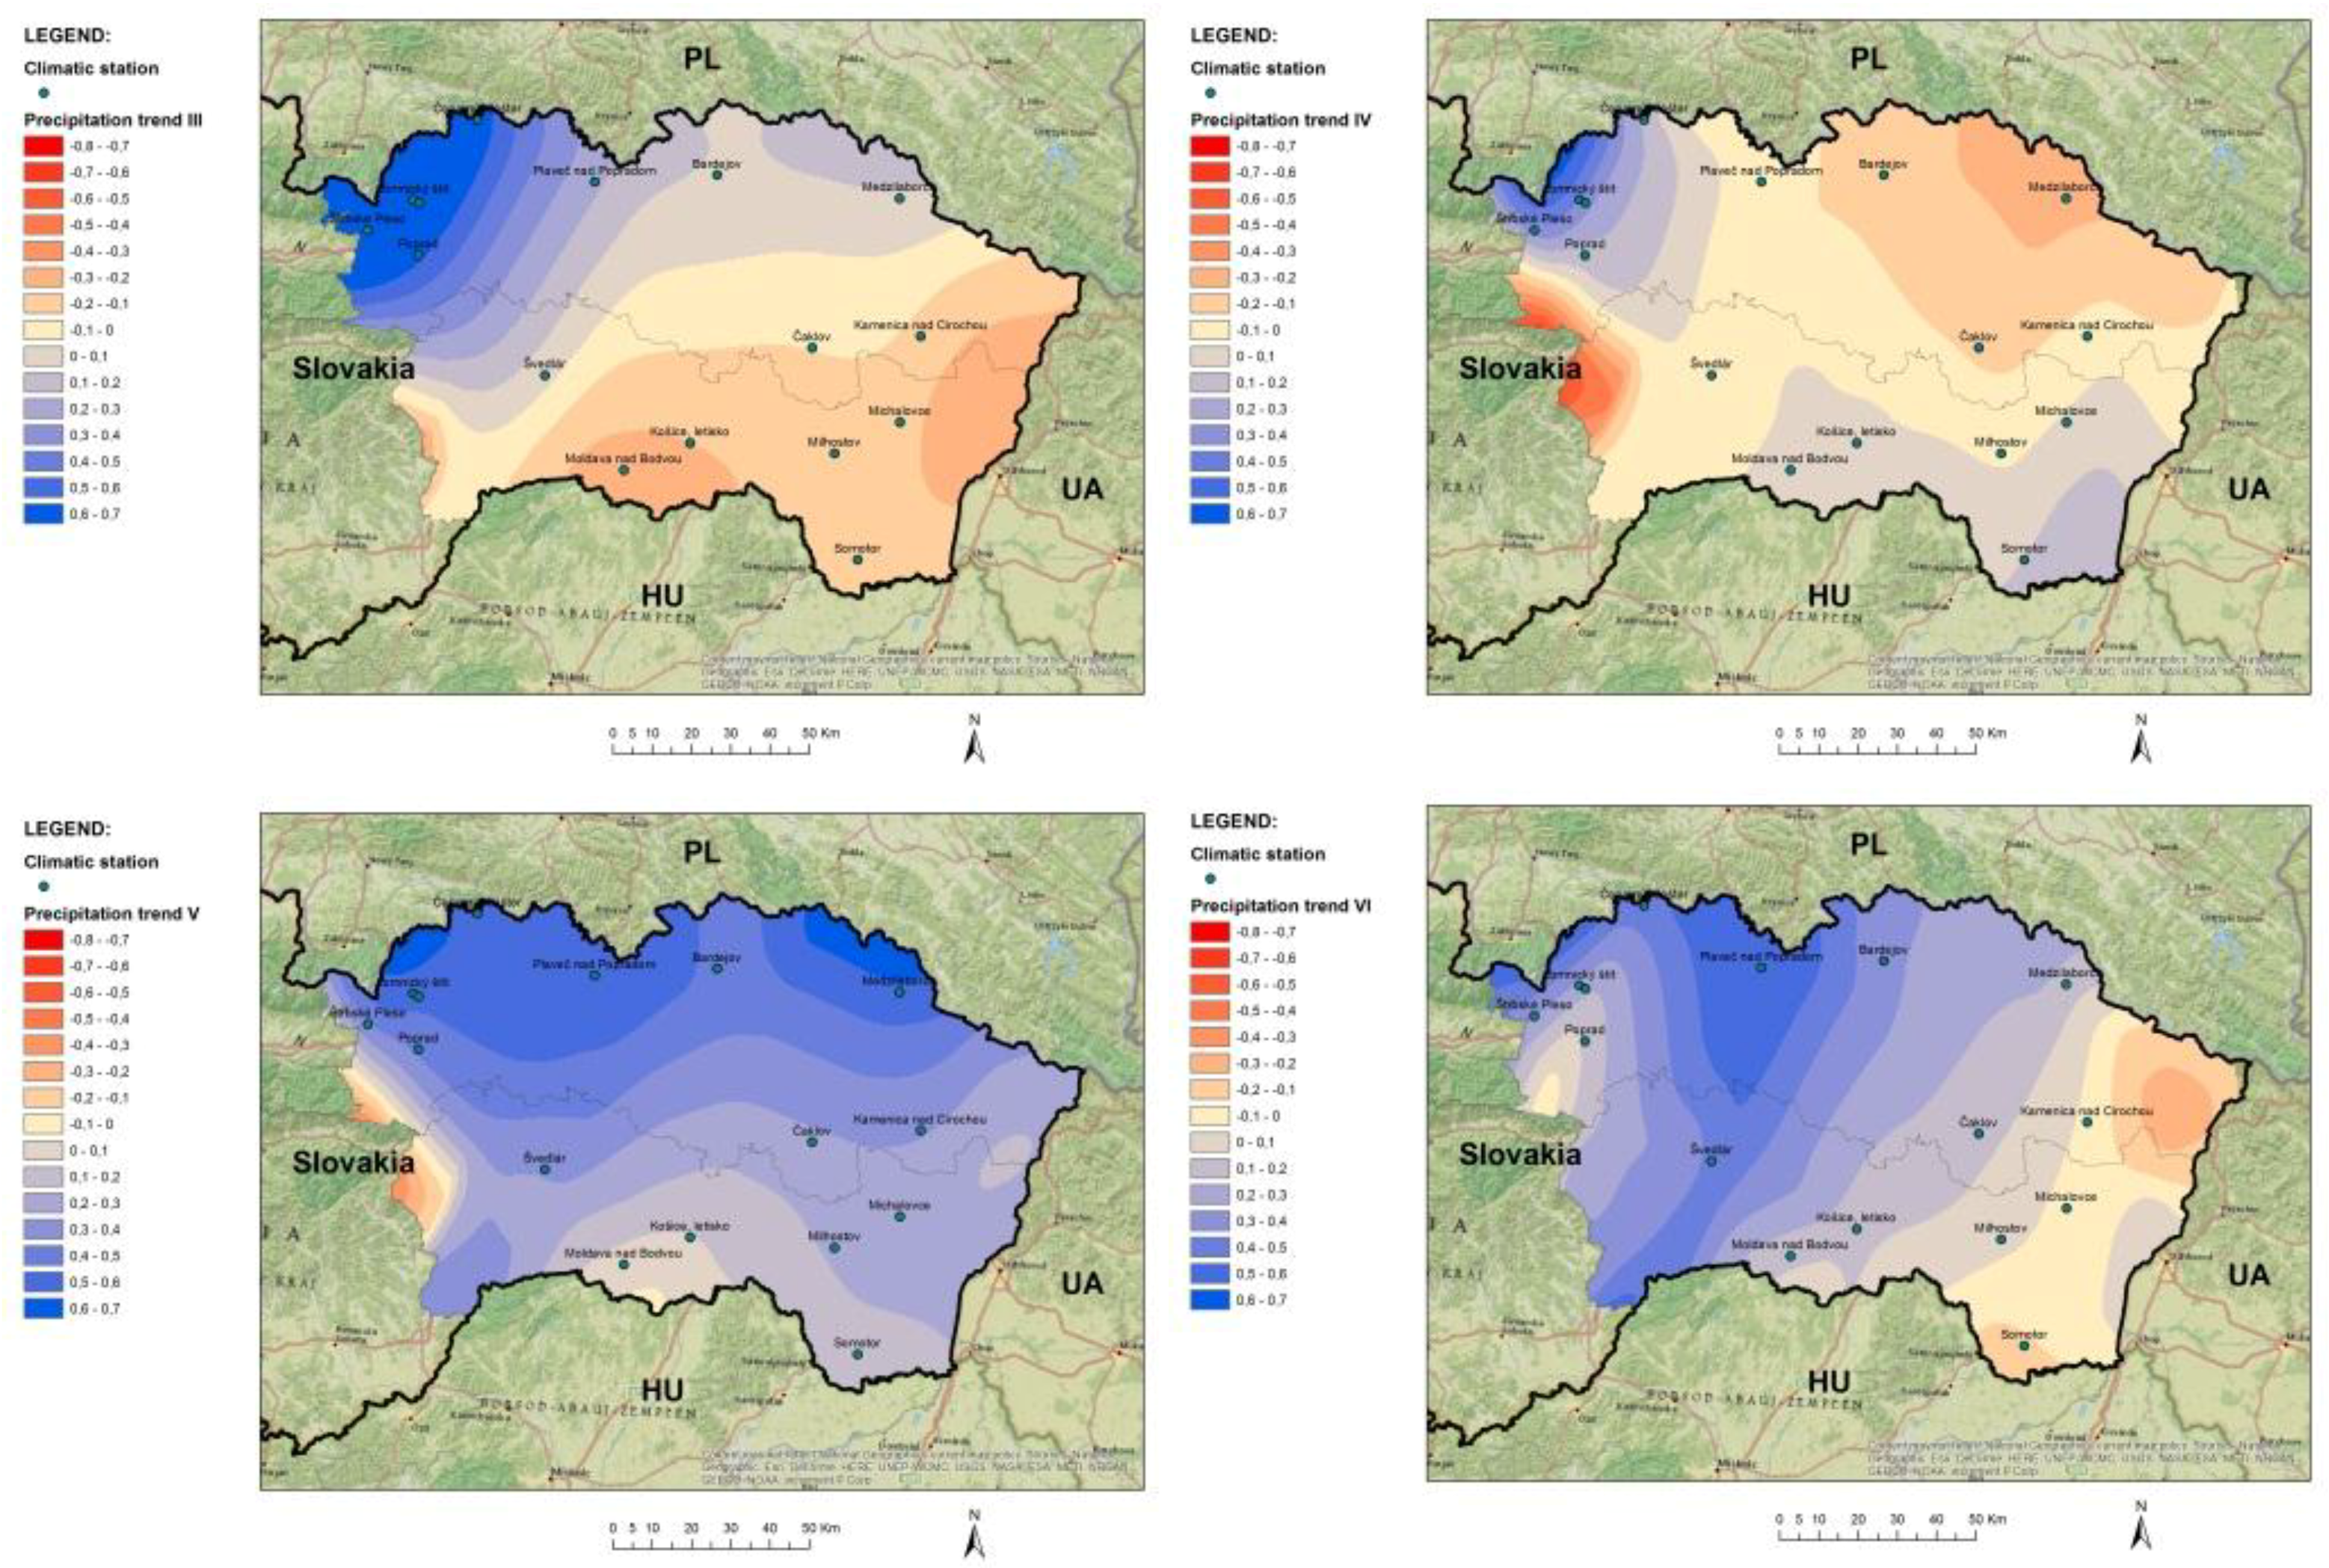
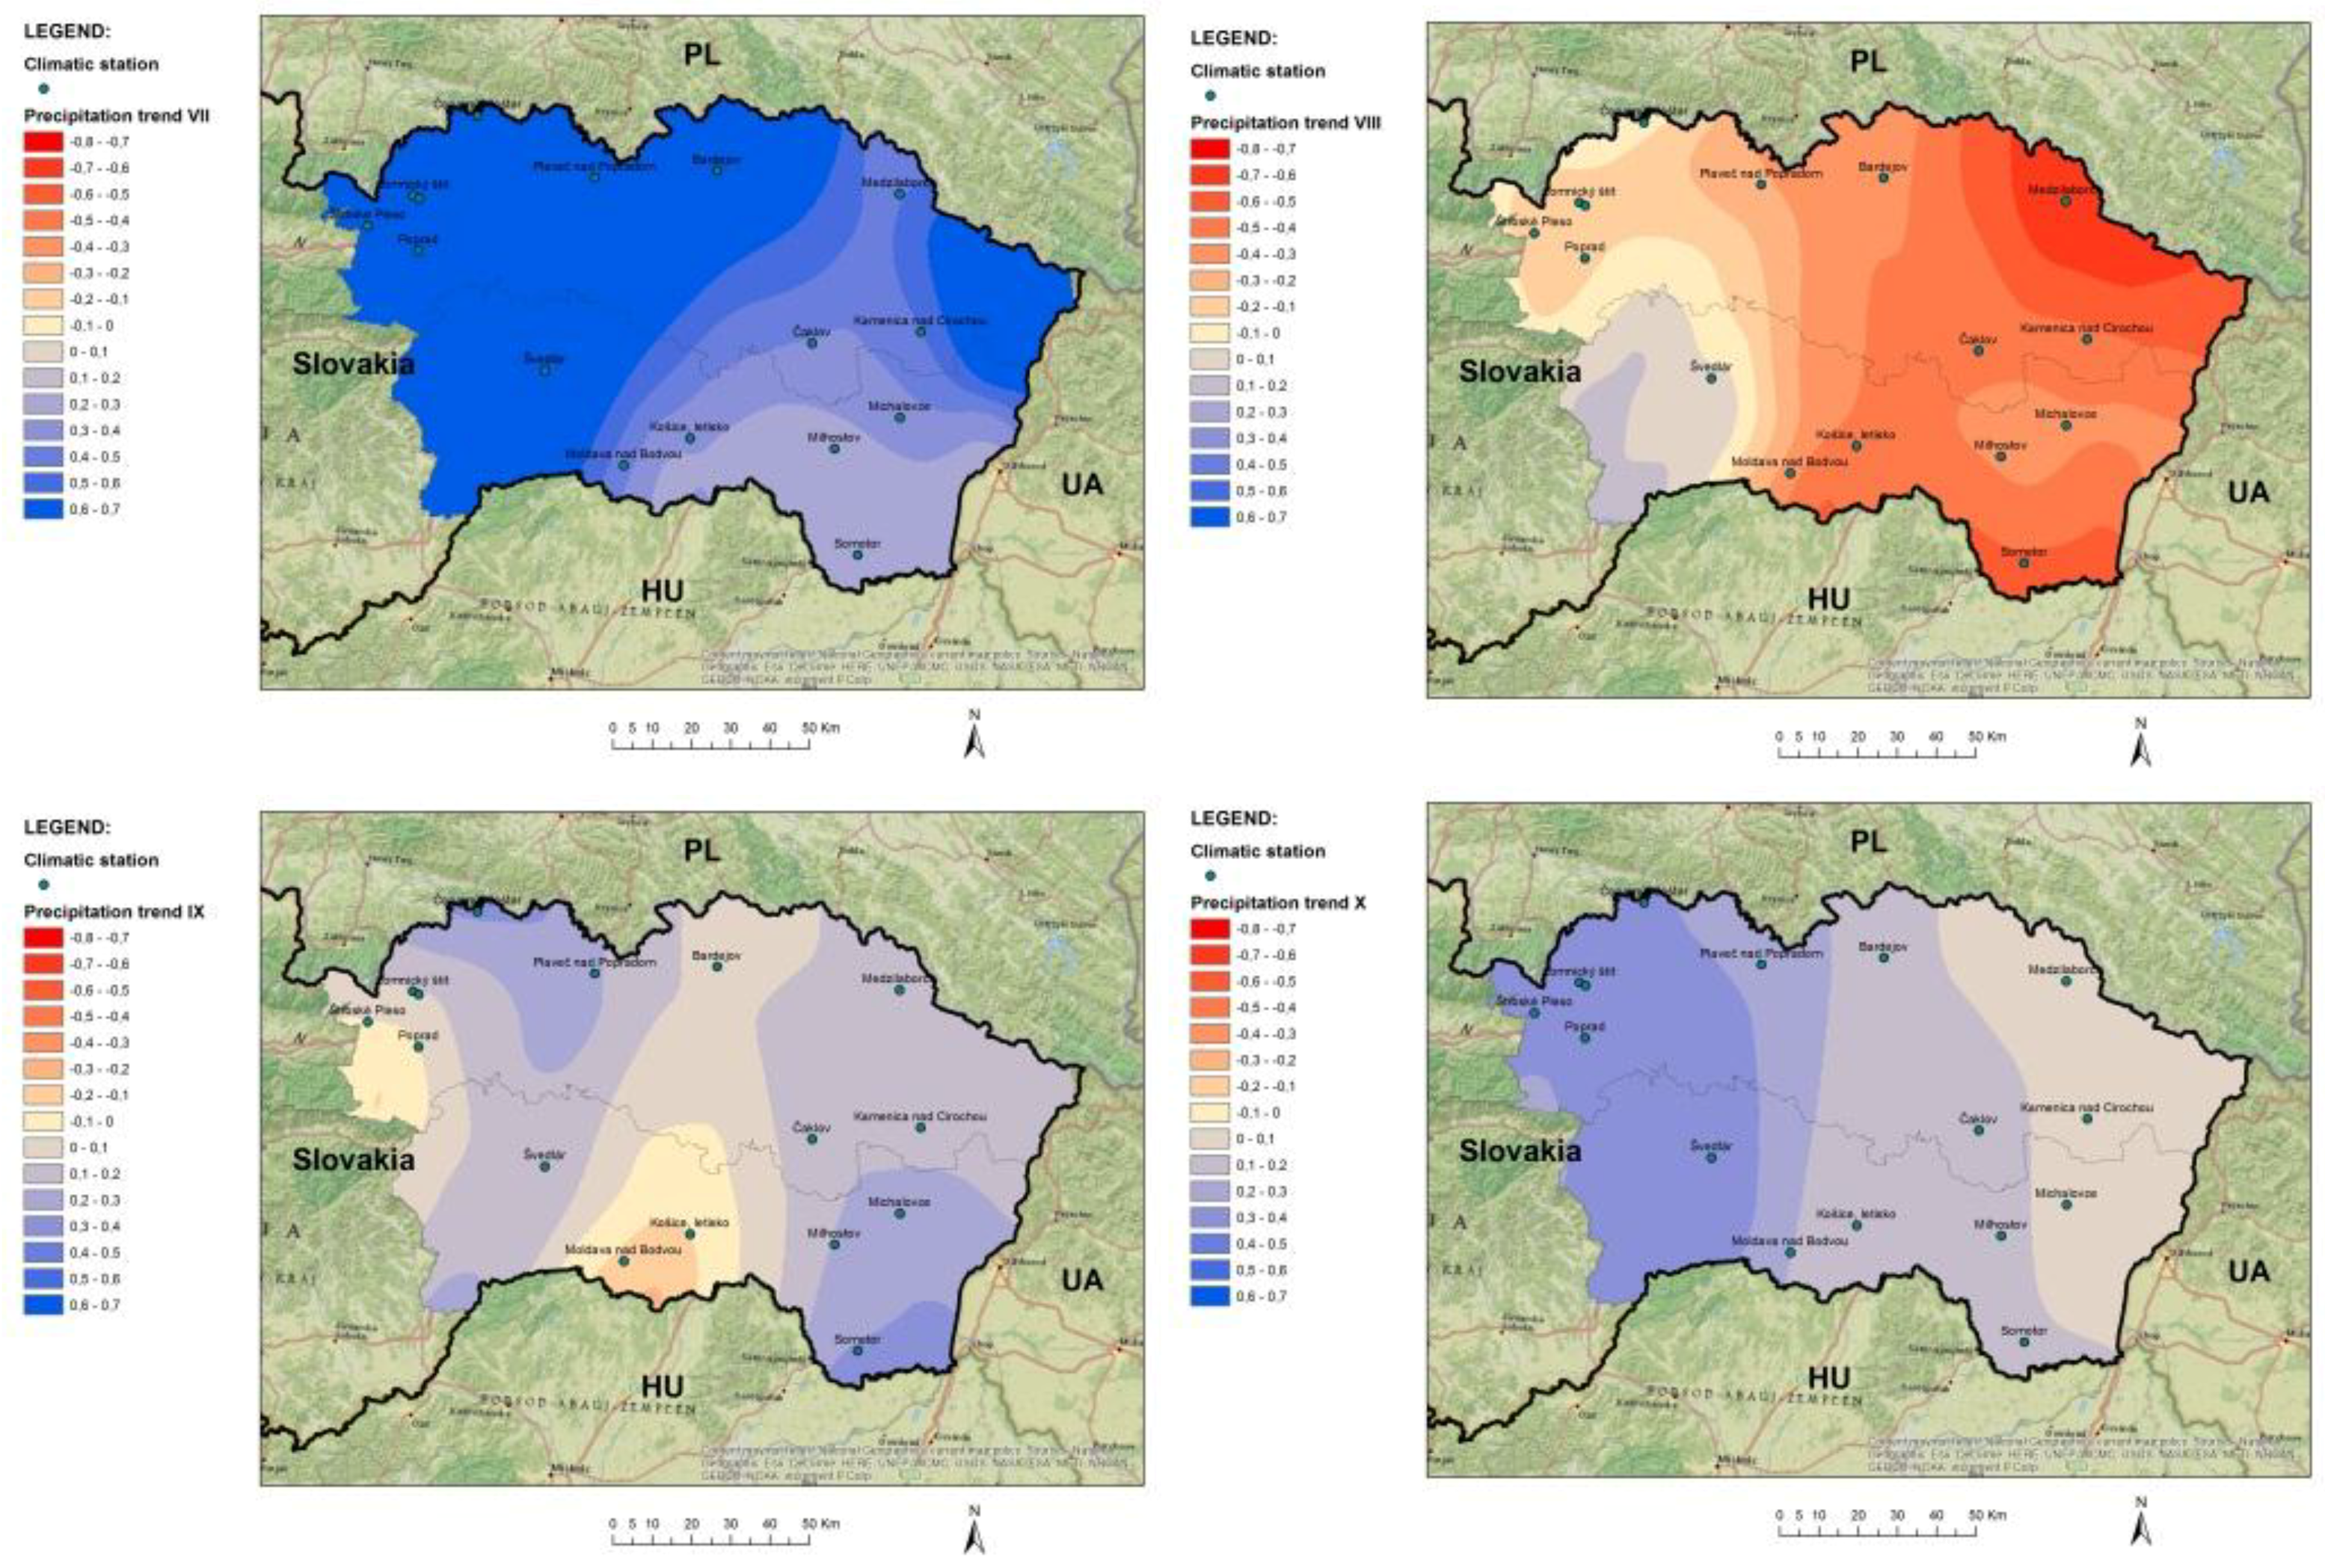
Spatial Distribution of Precipitation Trends
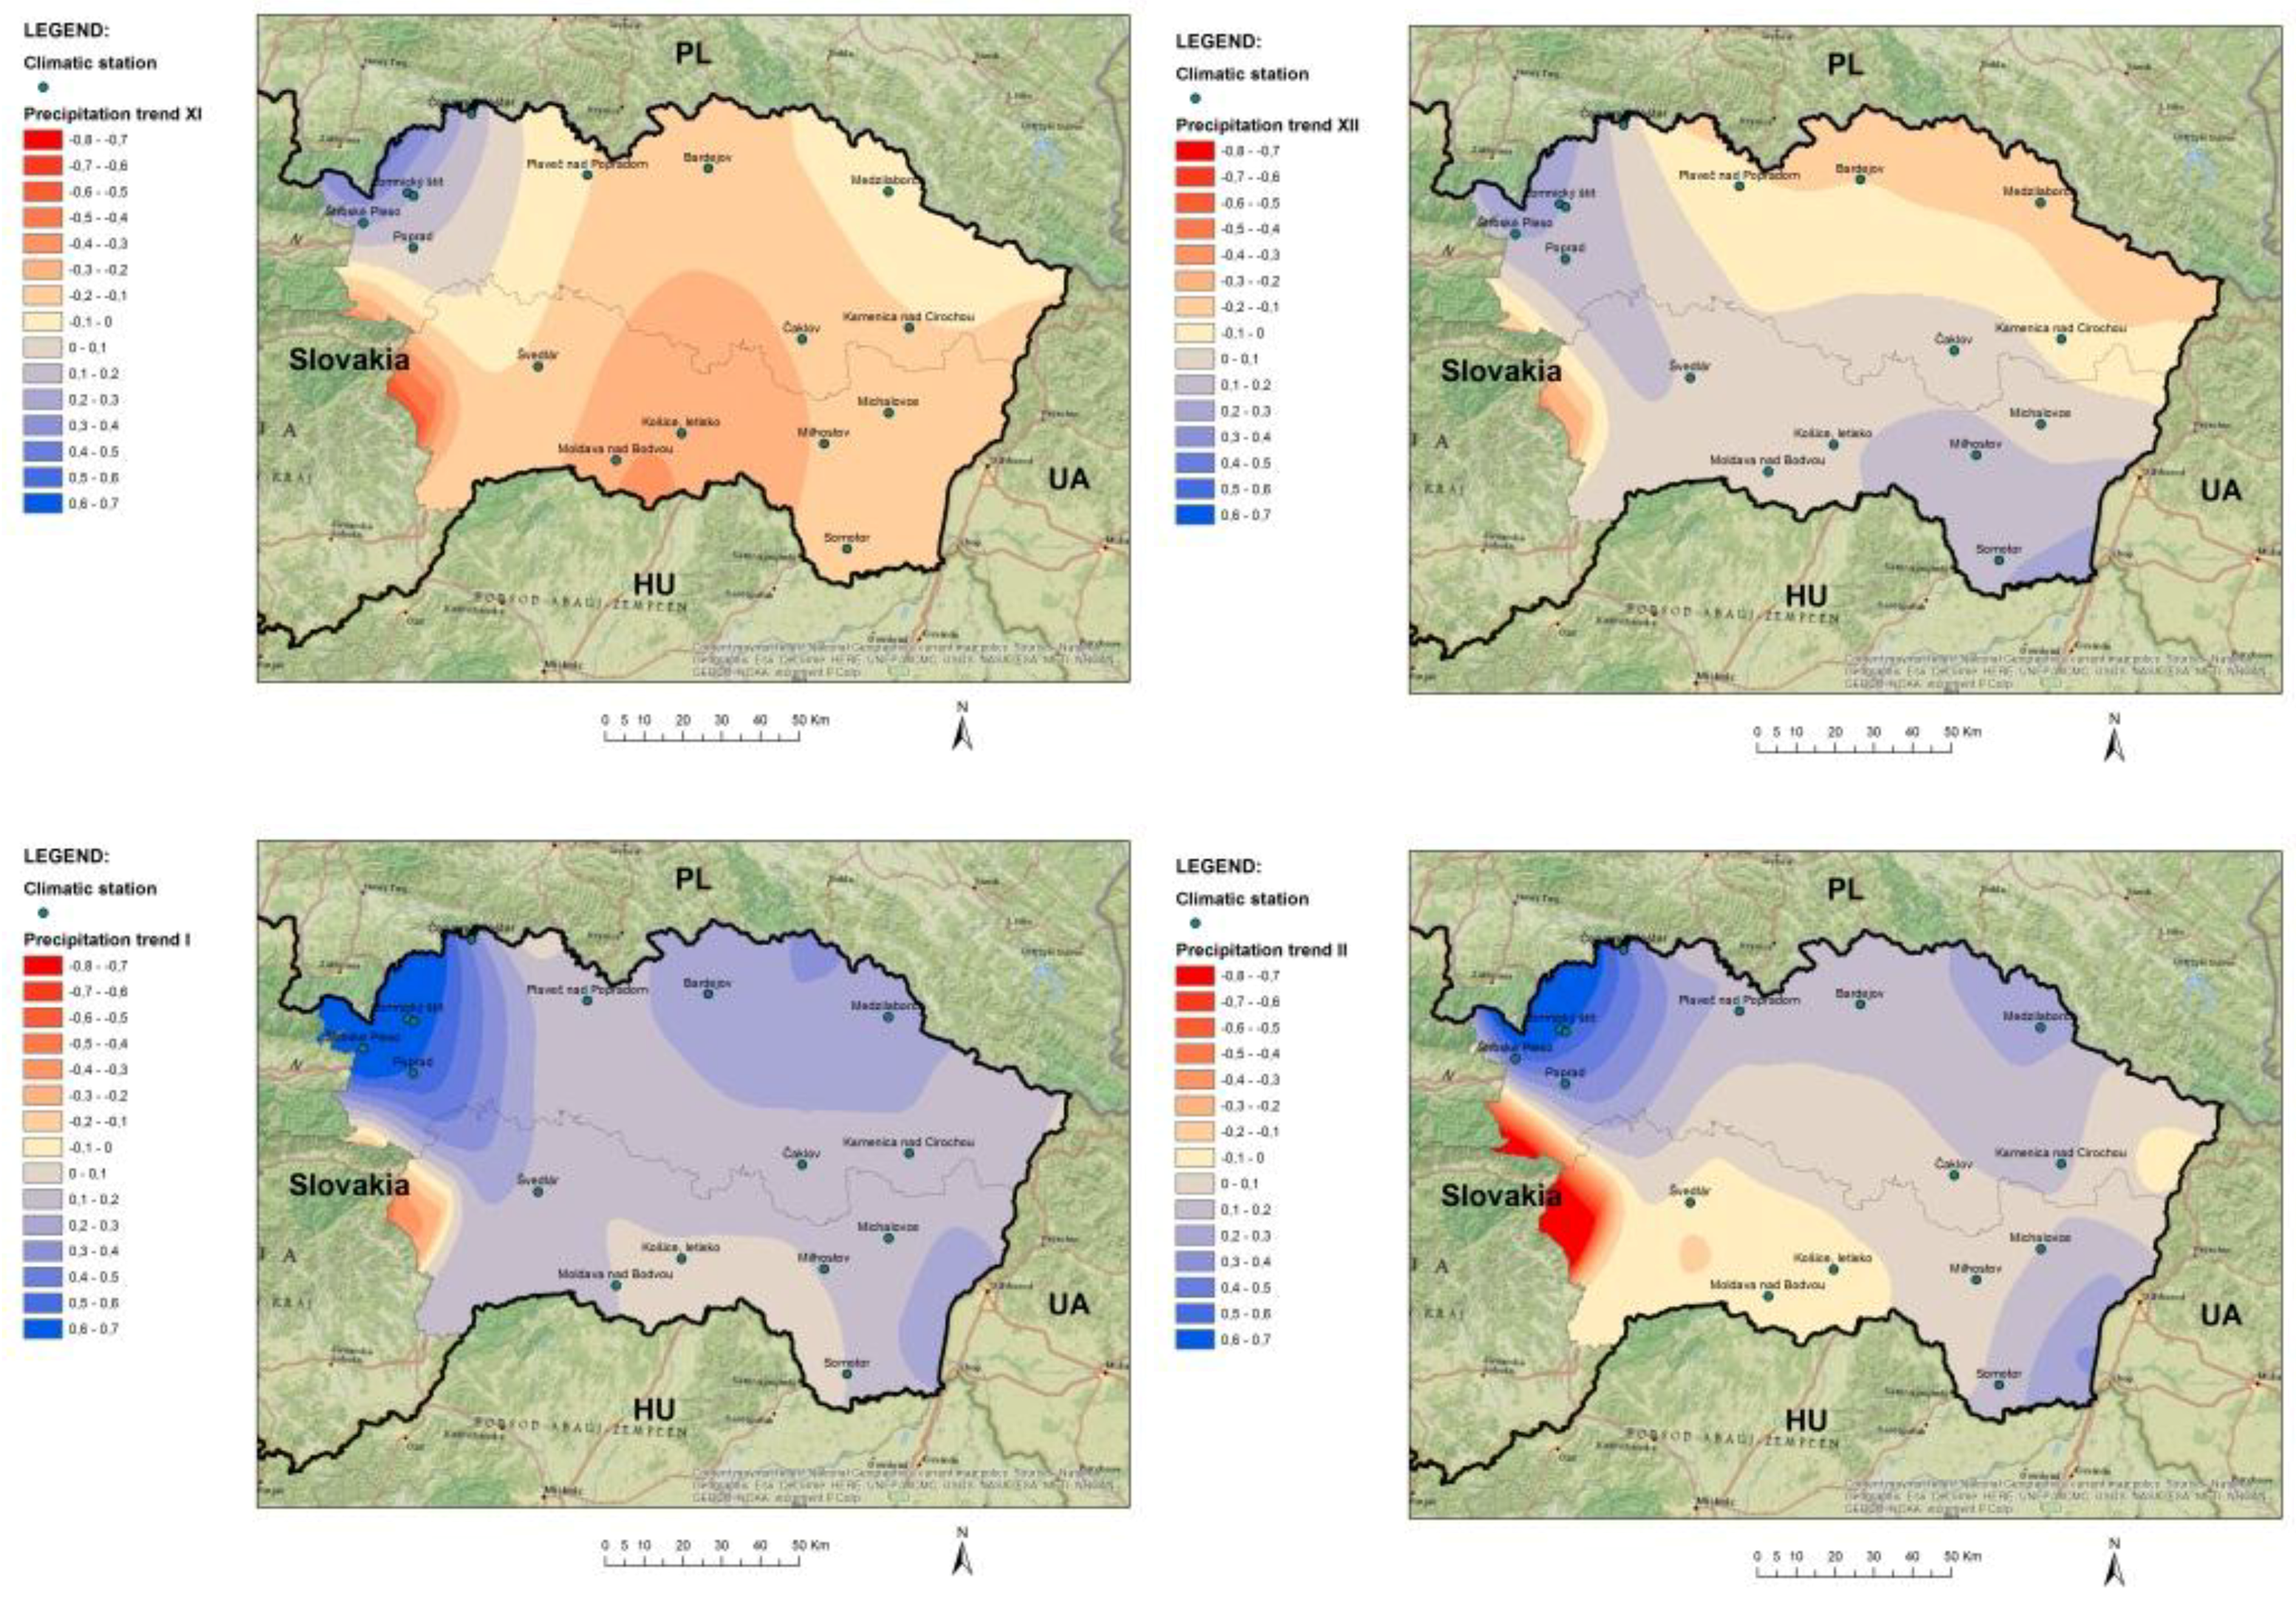
Spatial distribution of climatic stations in eastern Slovakia with magnitude of trend (red colour presents a decreasing trend and blue colour presents an increasing trend) for the monthly data series (XI–X) during the period 1962–2014 is presented in Figure 4.
Positive trends, excluding August, prevail in this area. Significant positive trends were detected in July. Increasing trends in precipitation are evident in the north in the mountain area. This part of the country has proved most vulnerable to flash floods in the last few years.
3.2. Temperature Trends
Results of temperature analysis are presented for annual and seasonal data (Table 4), as well as for monthly data (Table 5).
All climatic stations in eastern Slovakia show positive annual and seasonal trends in temperature during the evaluated period and almost all of them show significant positive annual trend in temperature. Seasonal trend analysis confirmed the same results. Significant positive trends are evident in temperature during the summer season. No significant trends were found in the fall, although all trends in temperature during this season show an increasing trend. Trends in temperature are always positive during winter and spring.
Monthly trends in temperature demonstrate positive trends at almost all climatic stations throughout the year in the study area. In January, and in the period from April to August, the MK test found even significant positive trends at almost all the stations. No significant negative trends were found in temperature data series analysis. Only in 6% of monthly temperature data series was there a negative trend, and mostly in September. The highest trend slope increase in temperature is 0.08 °C/month.
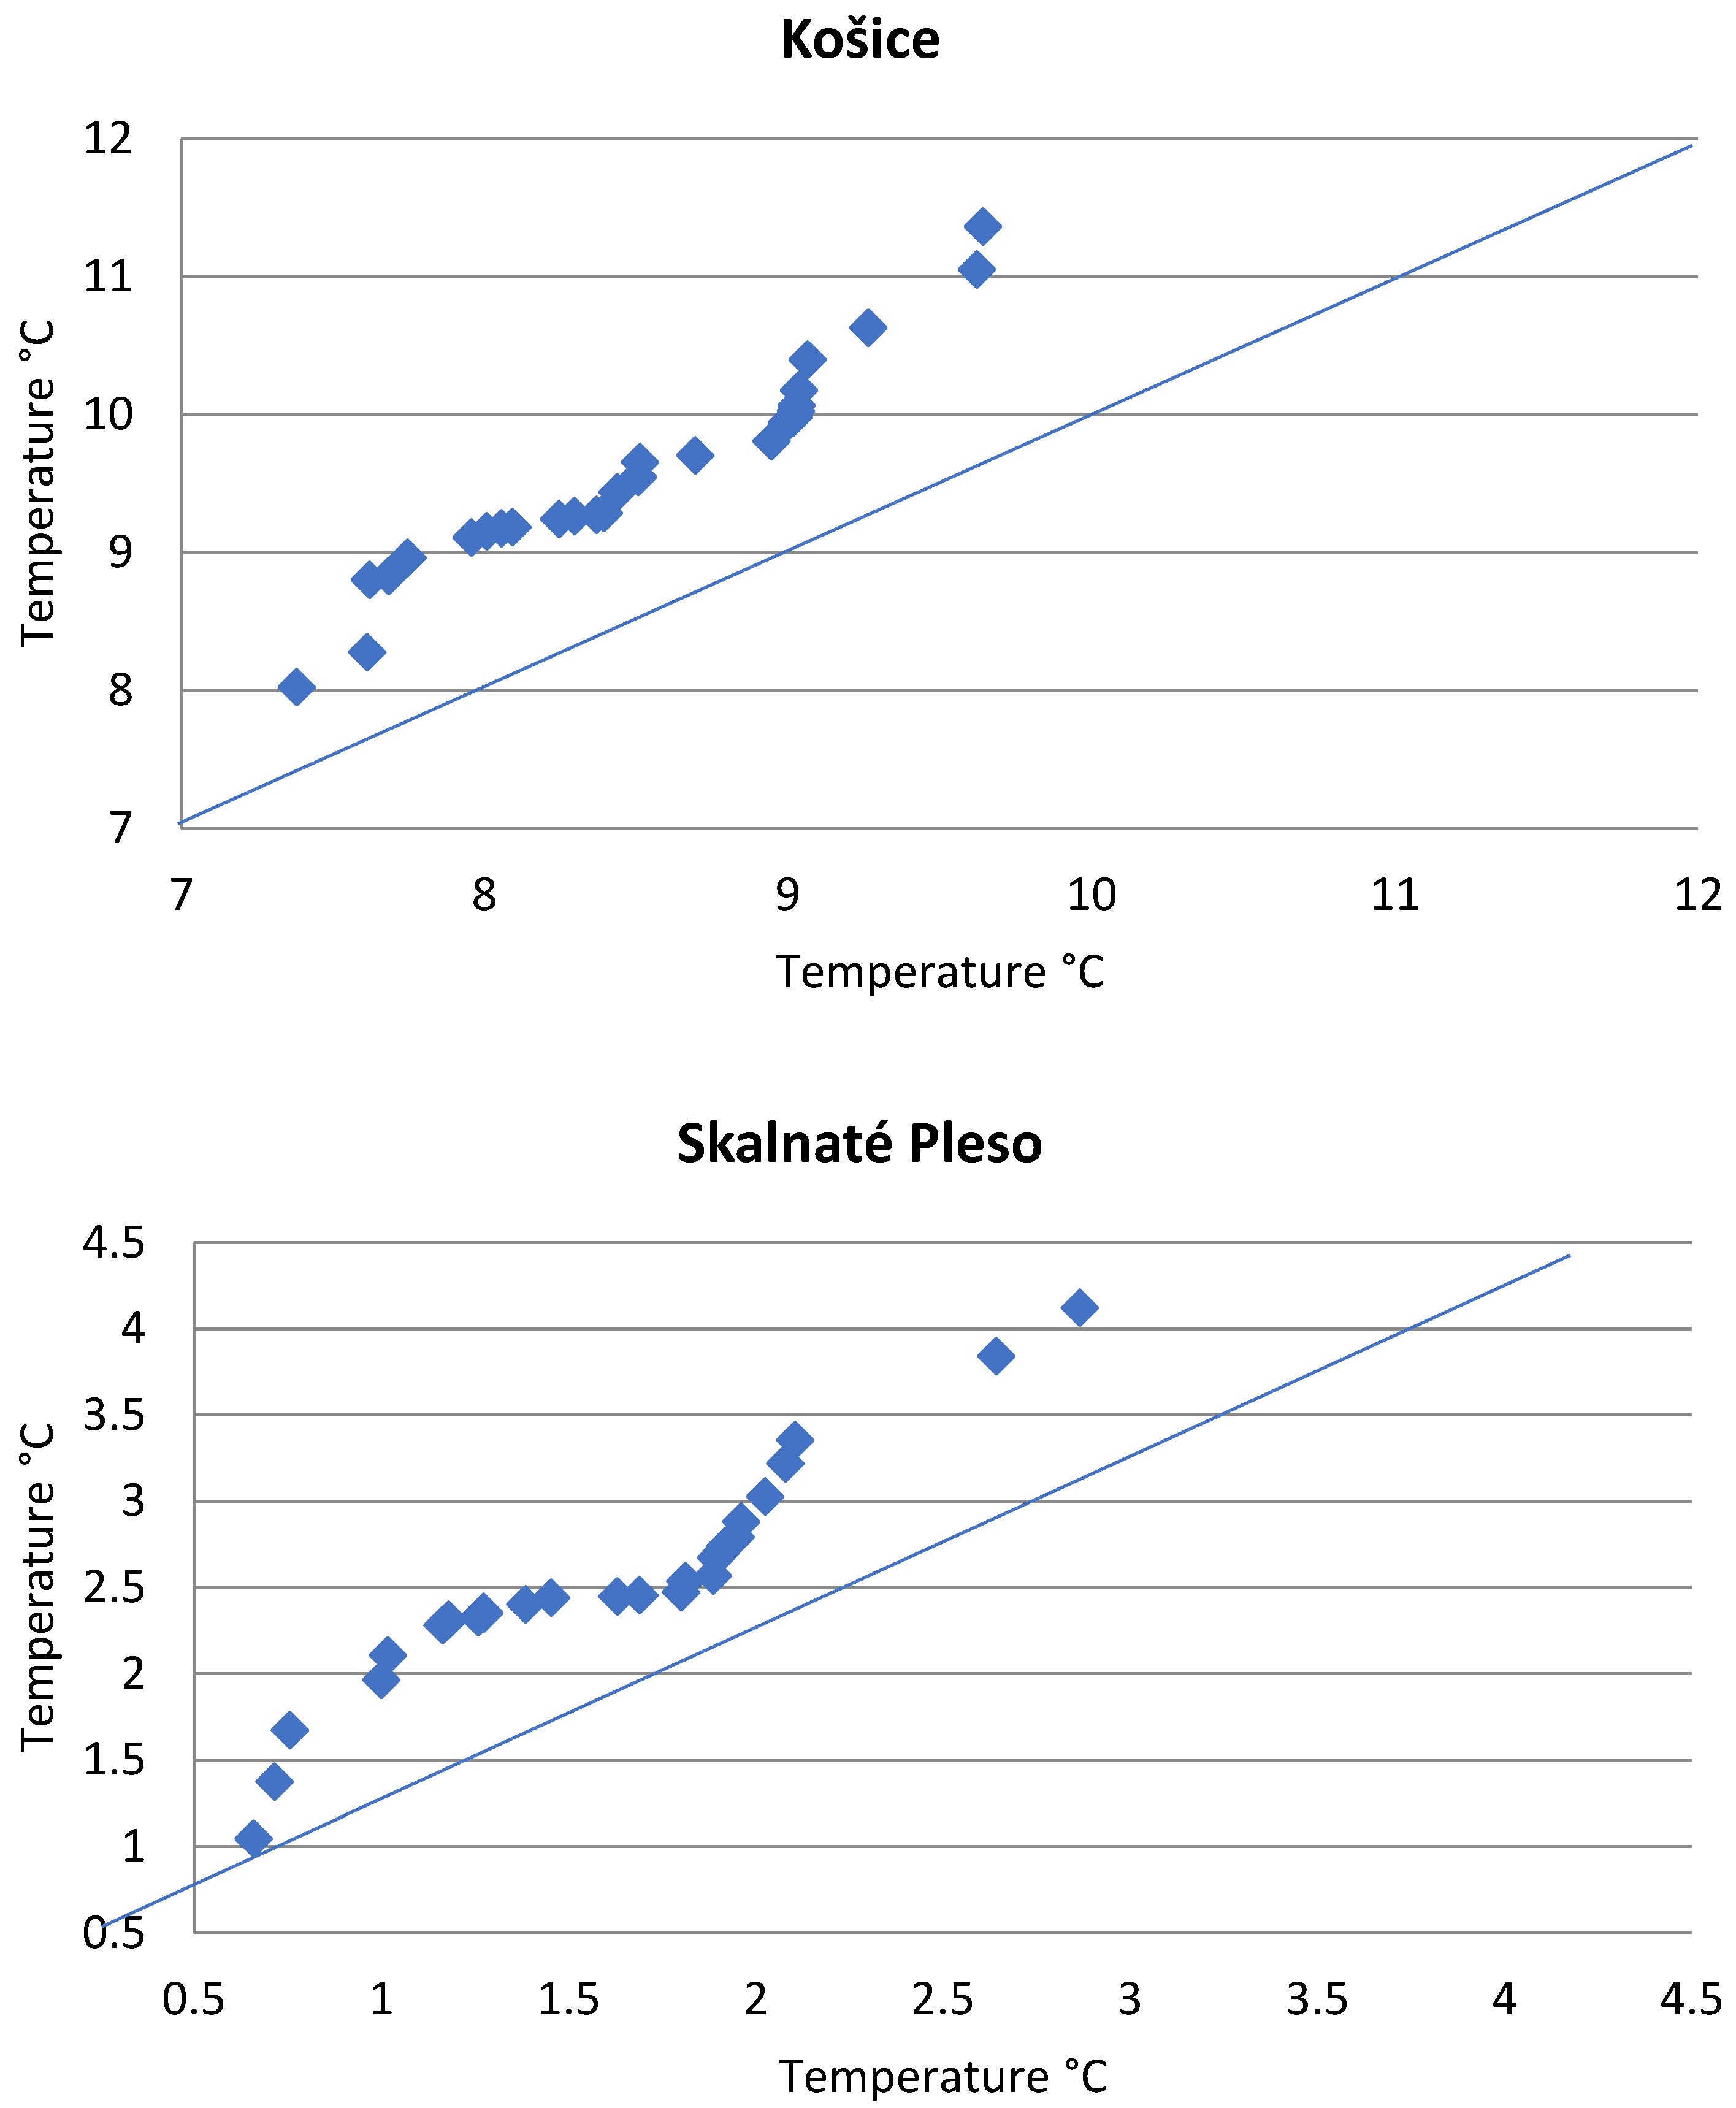
Trends in temperature with the Sen test are illustrated in Figure 5 for Košice and Skalnaté Pleso stations. These figures show clear increasing time series trends of the data from both stations.
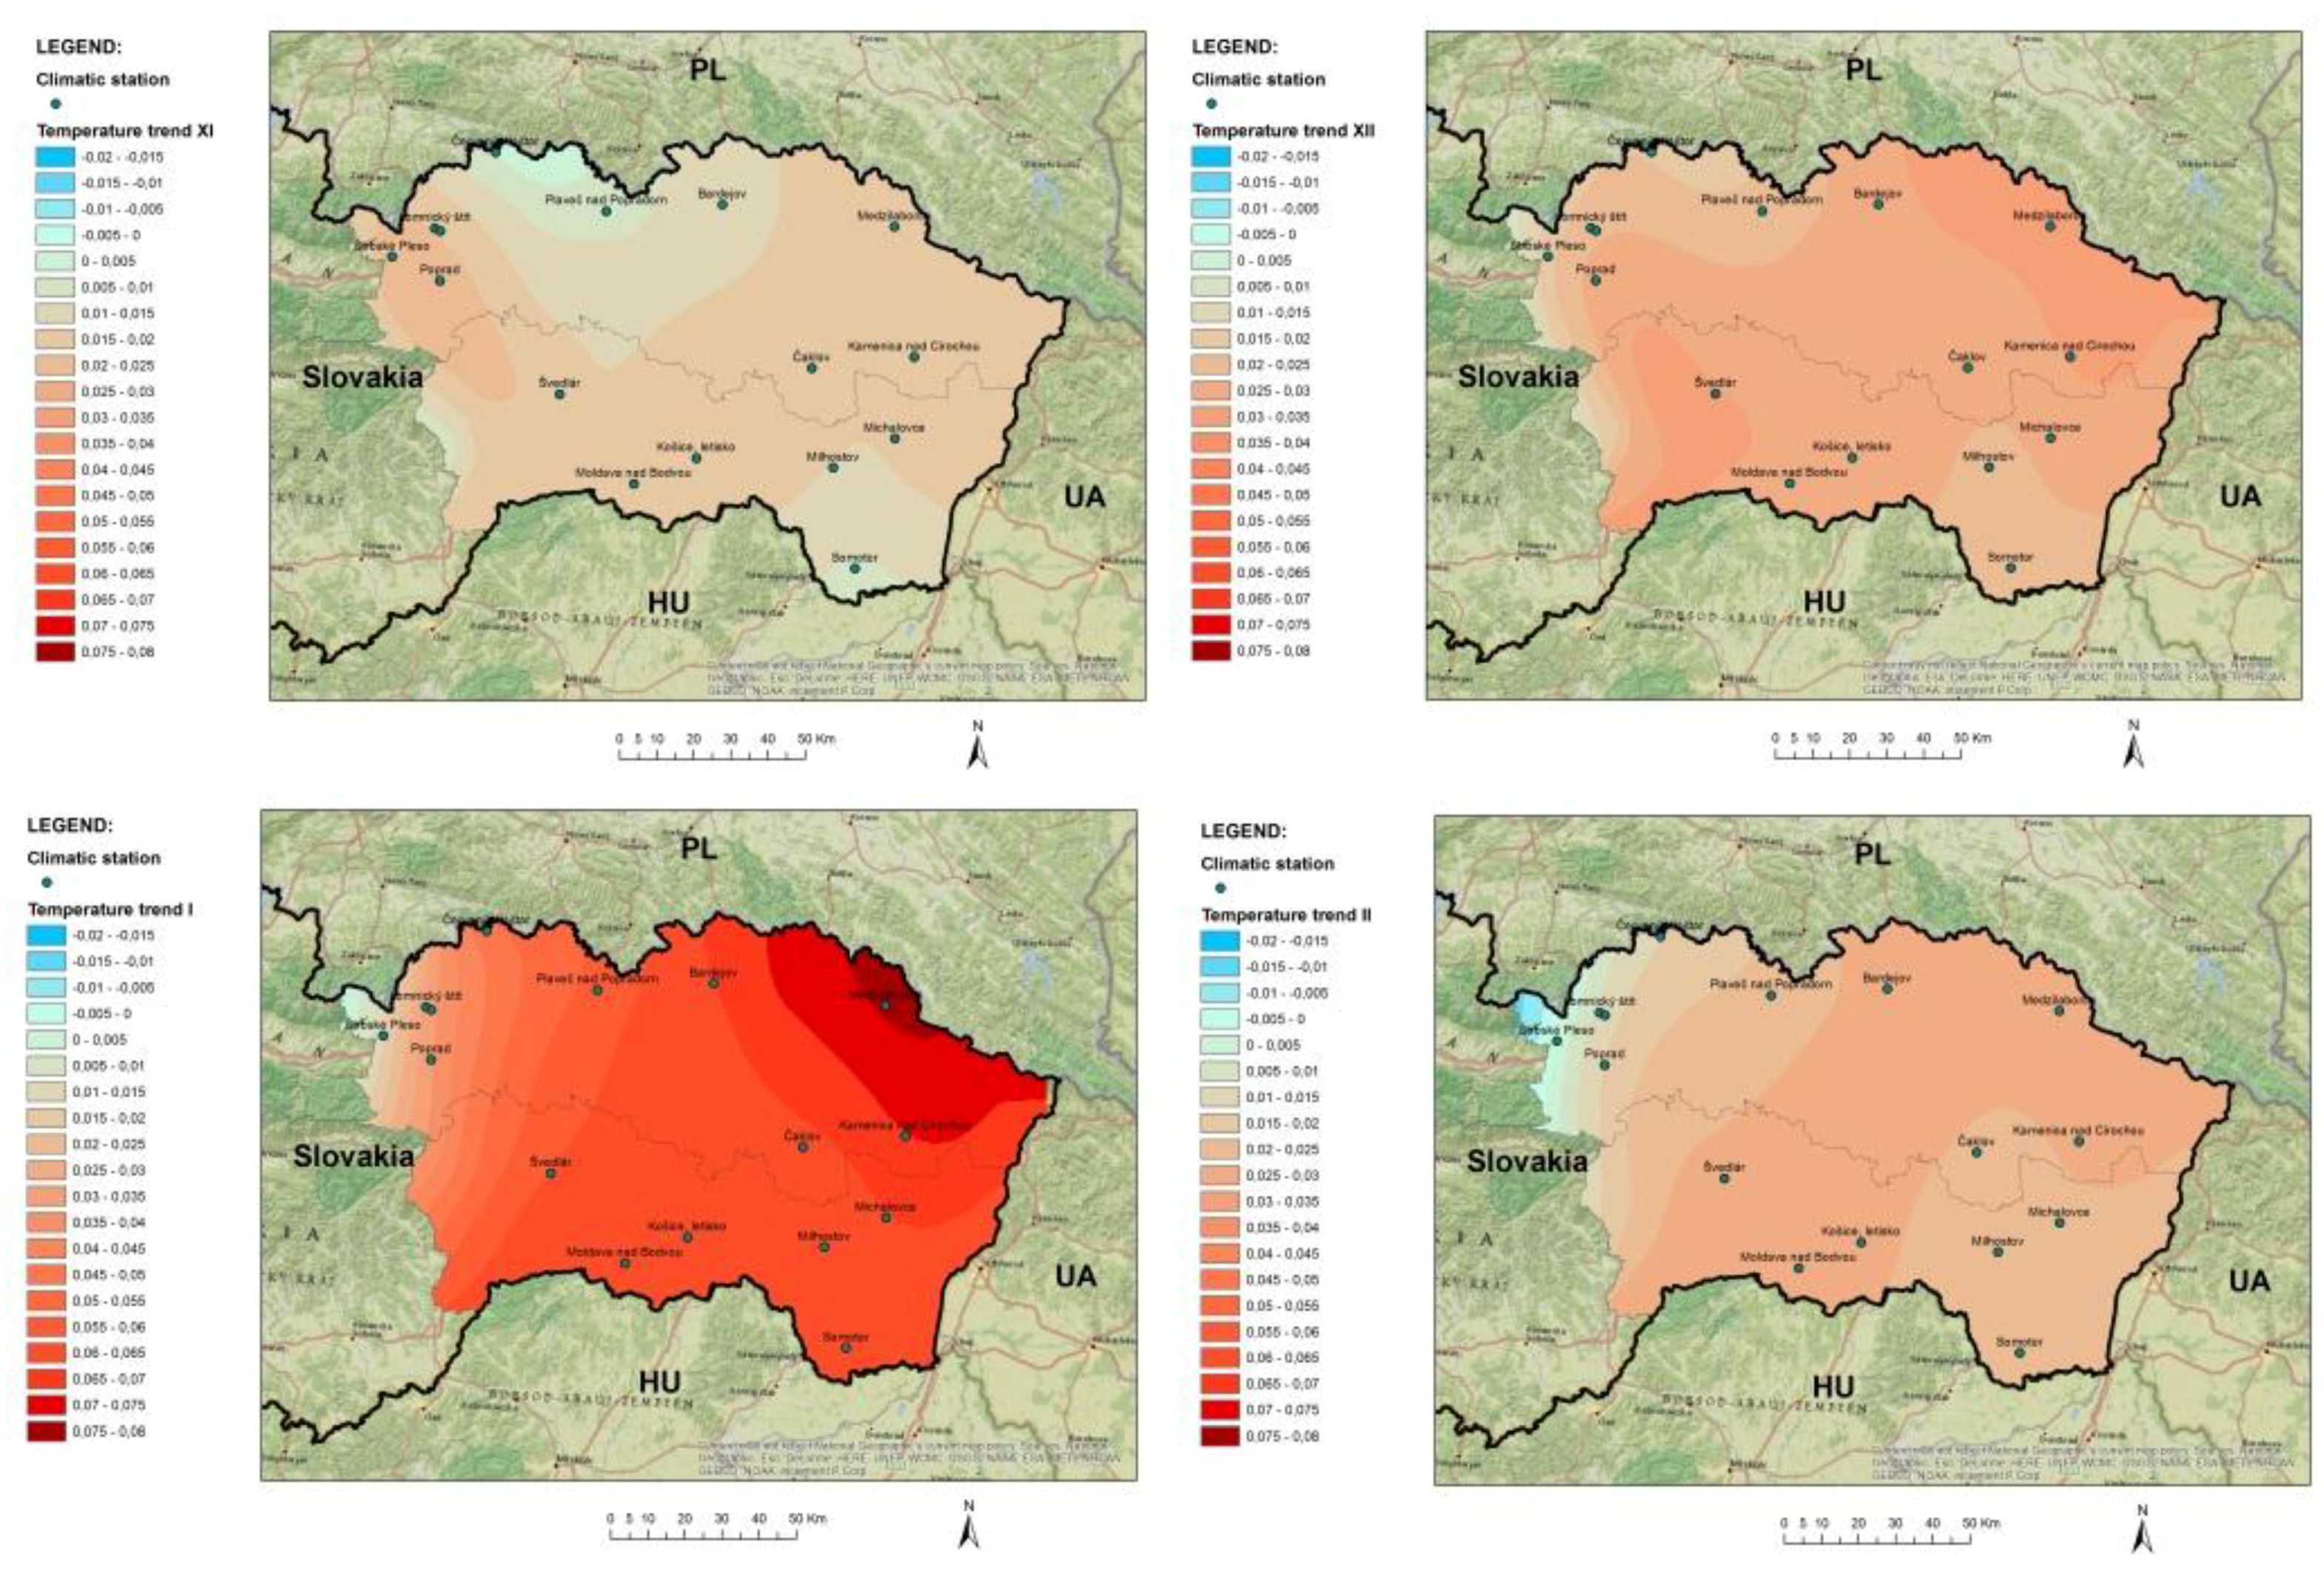
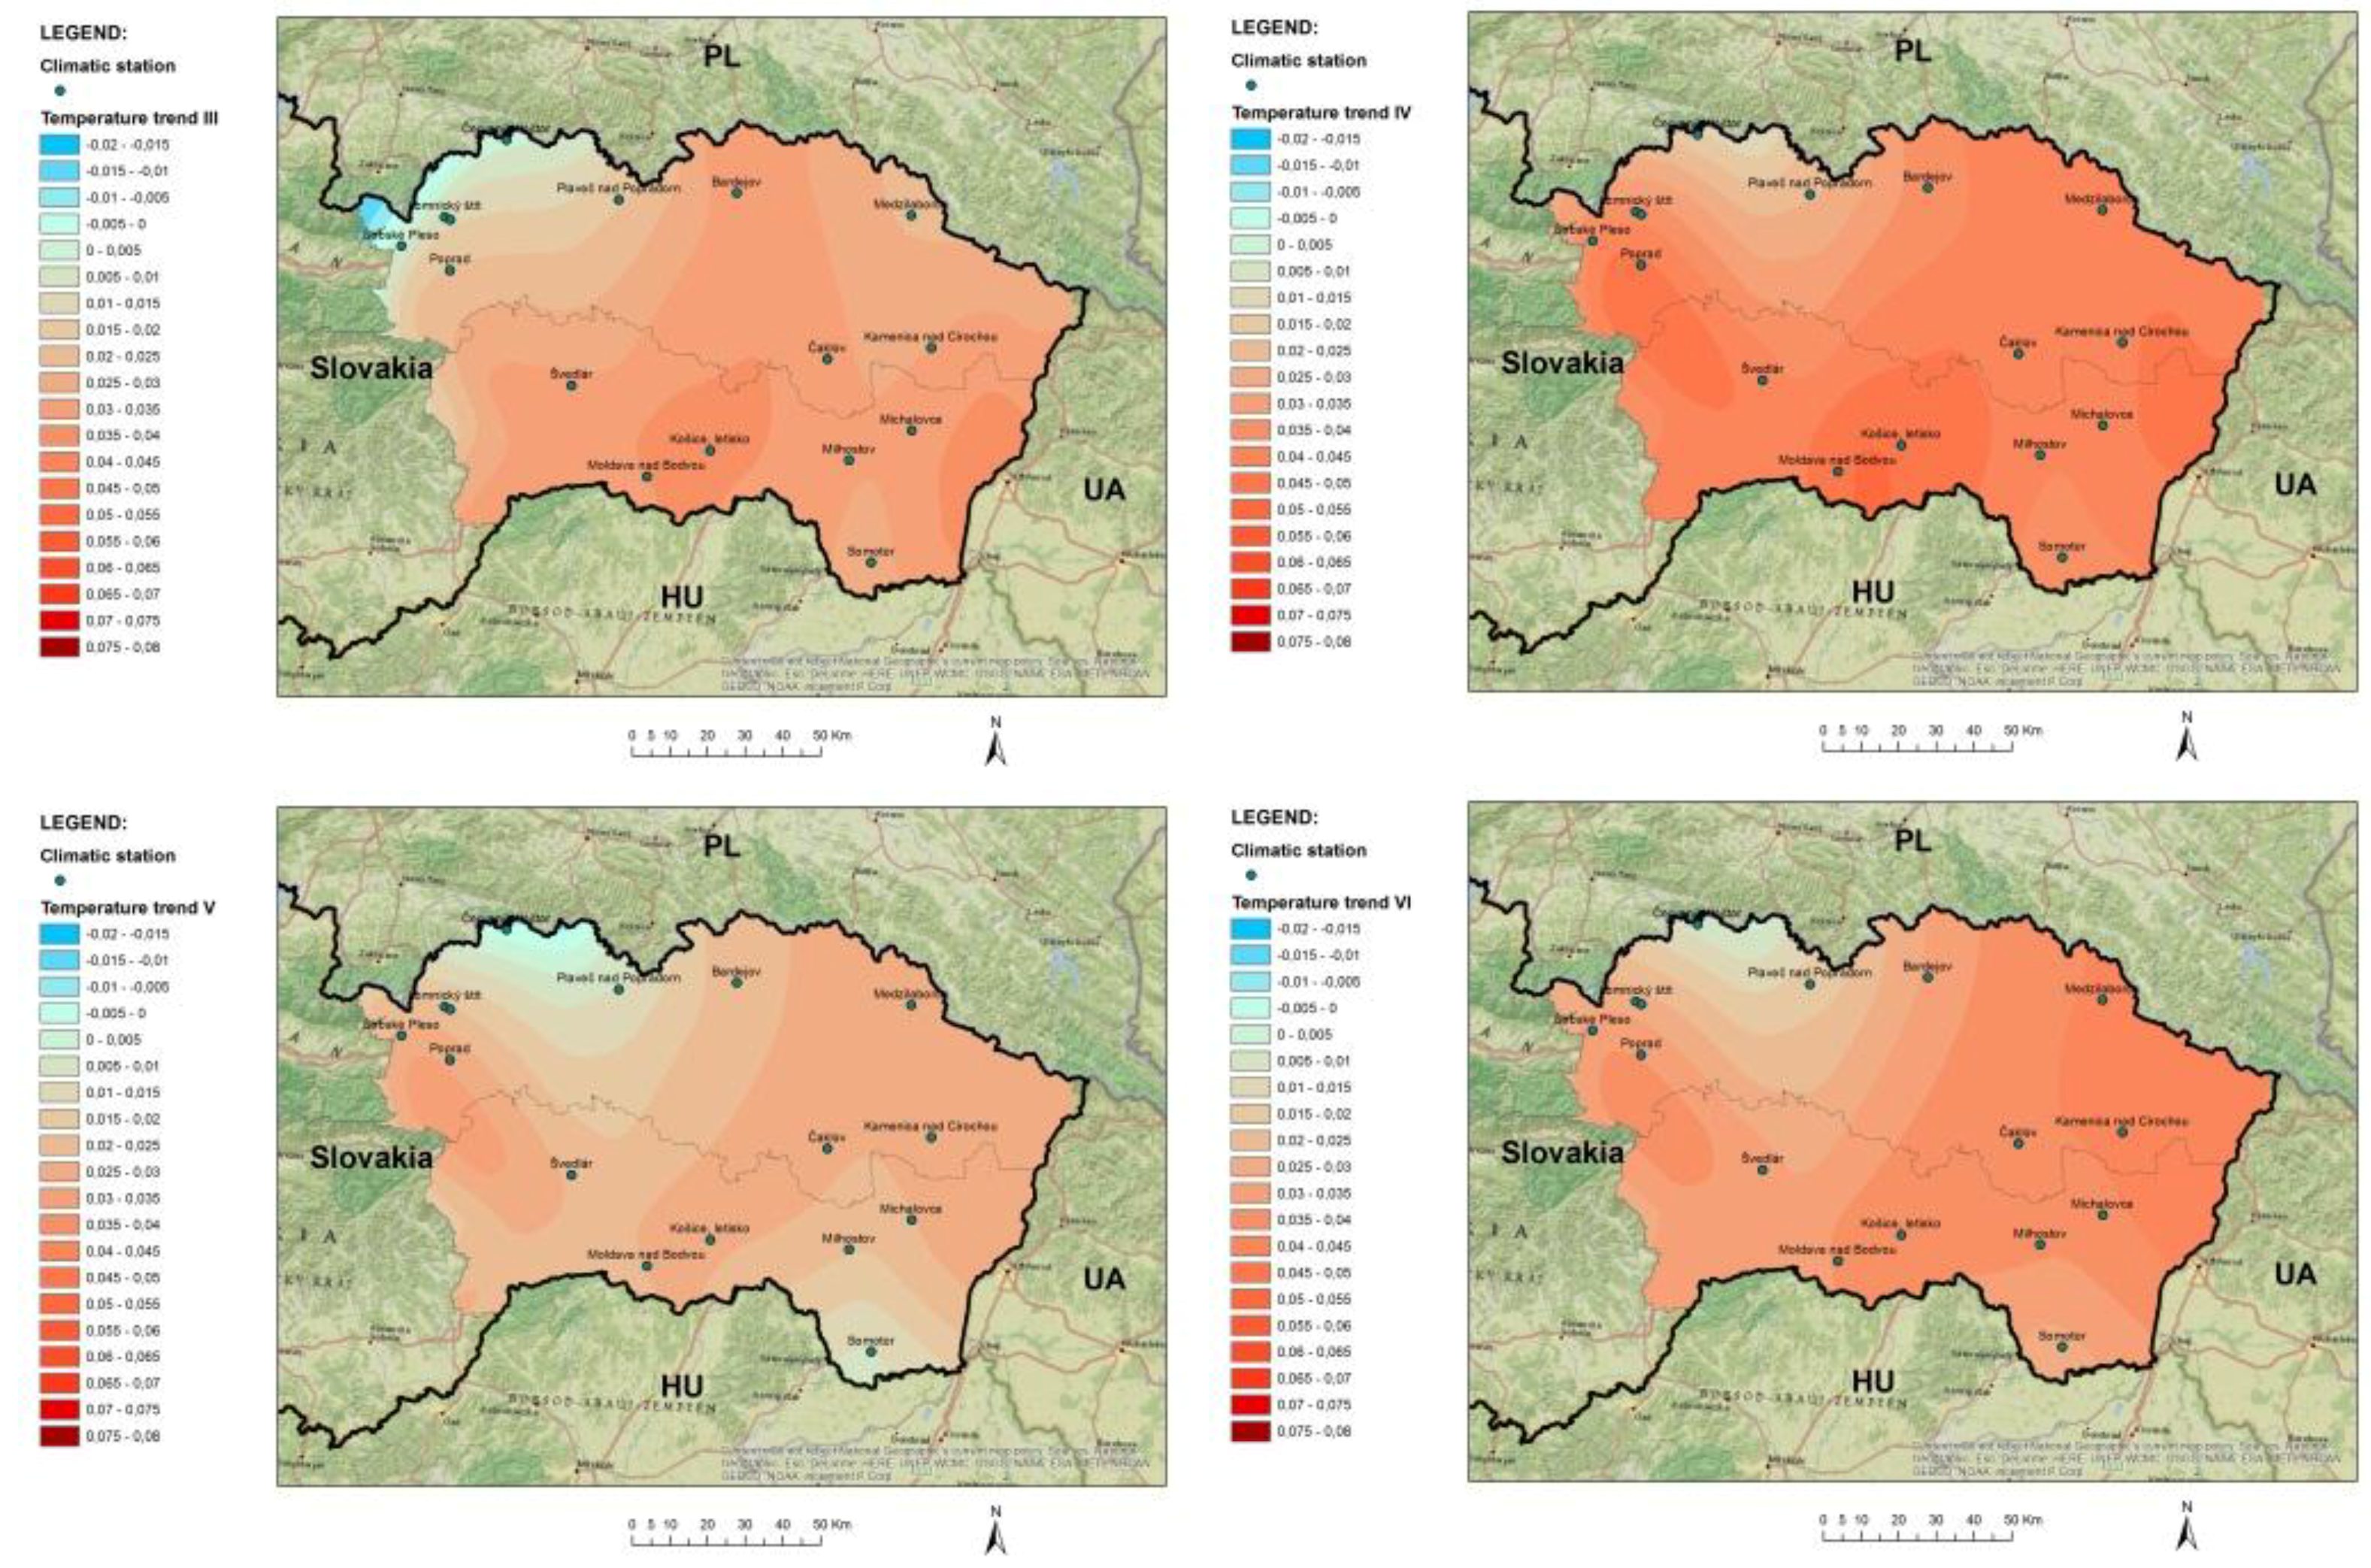
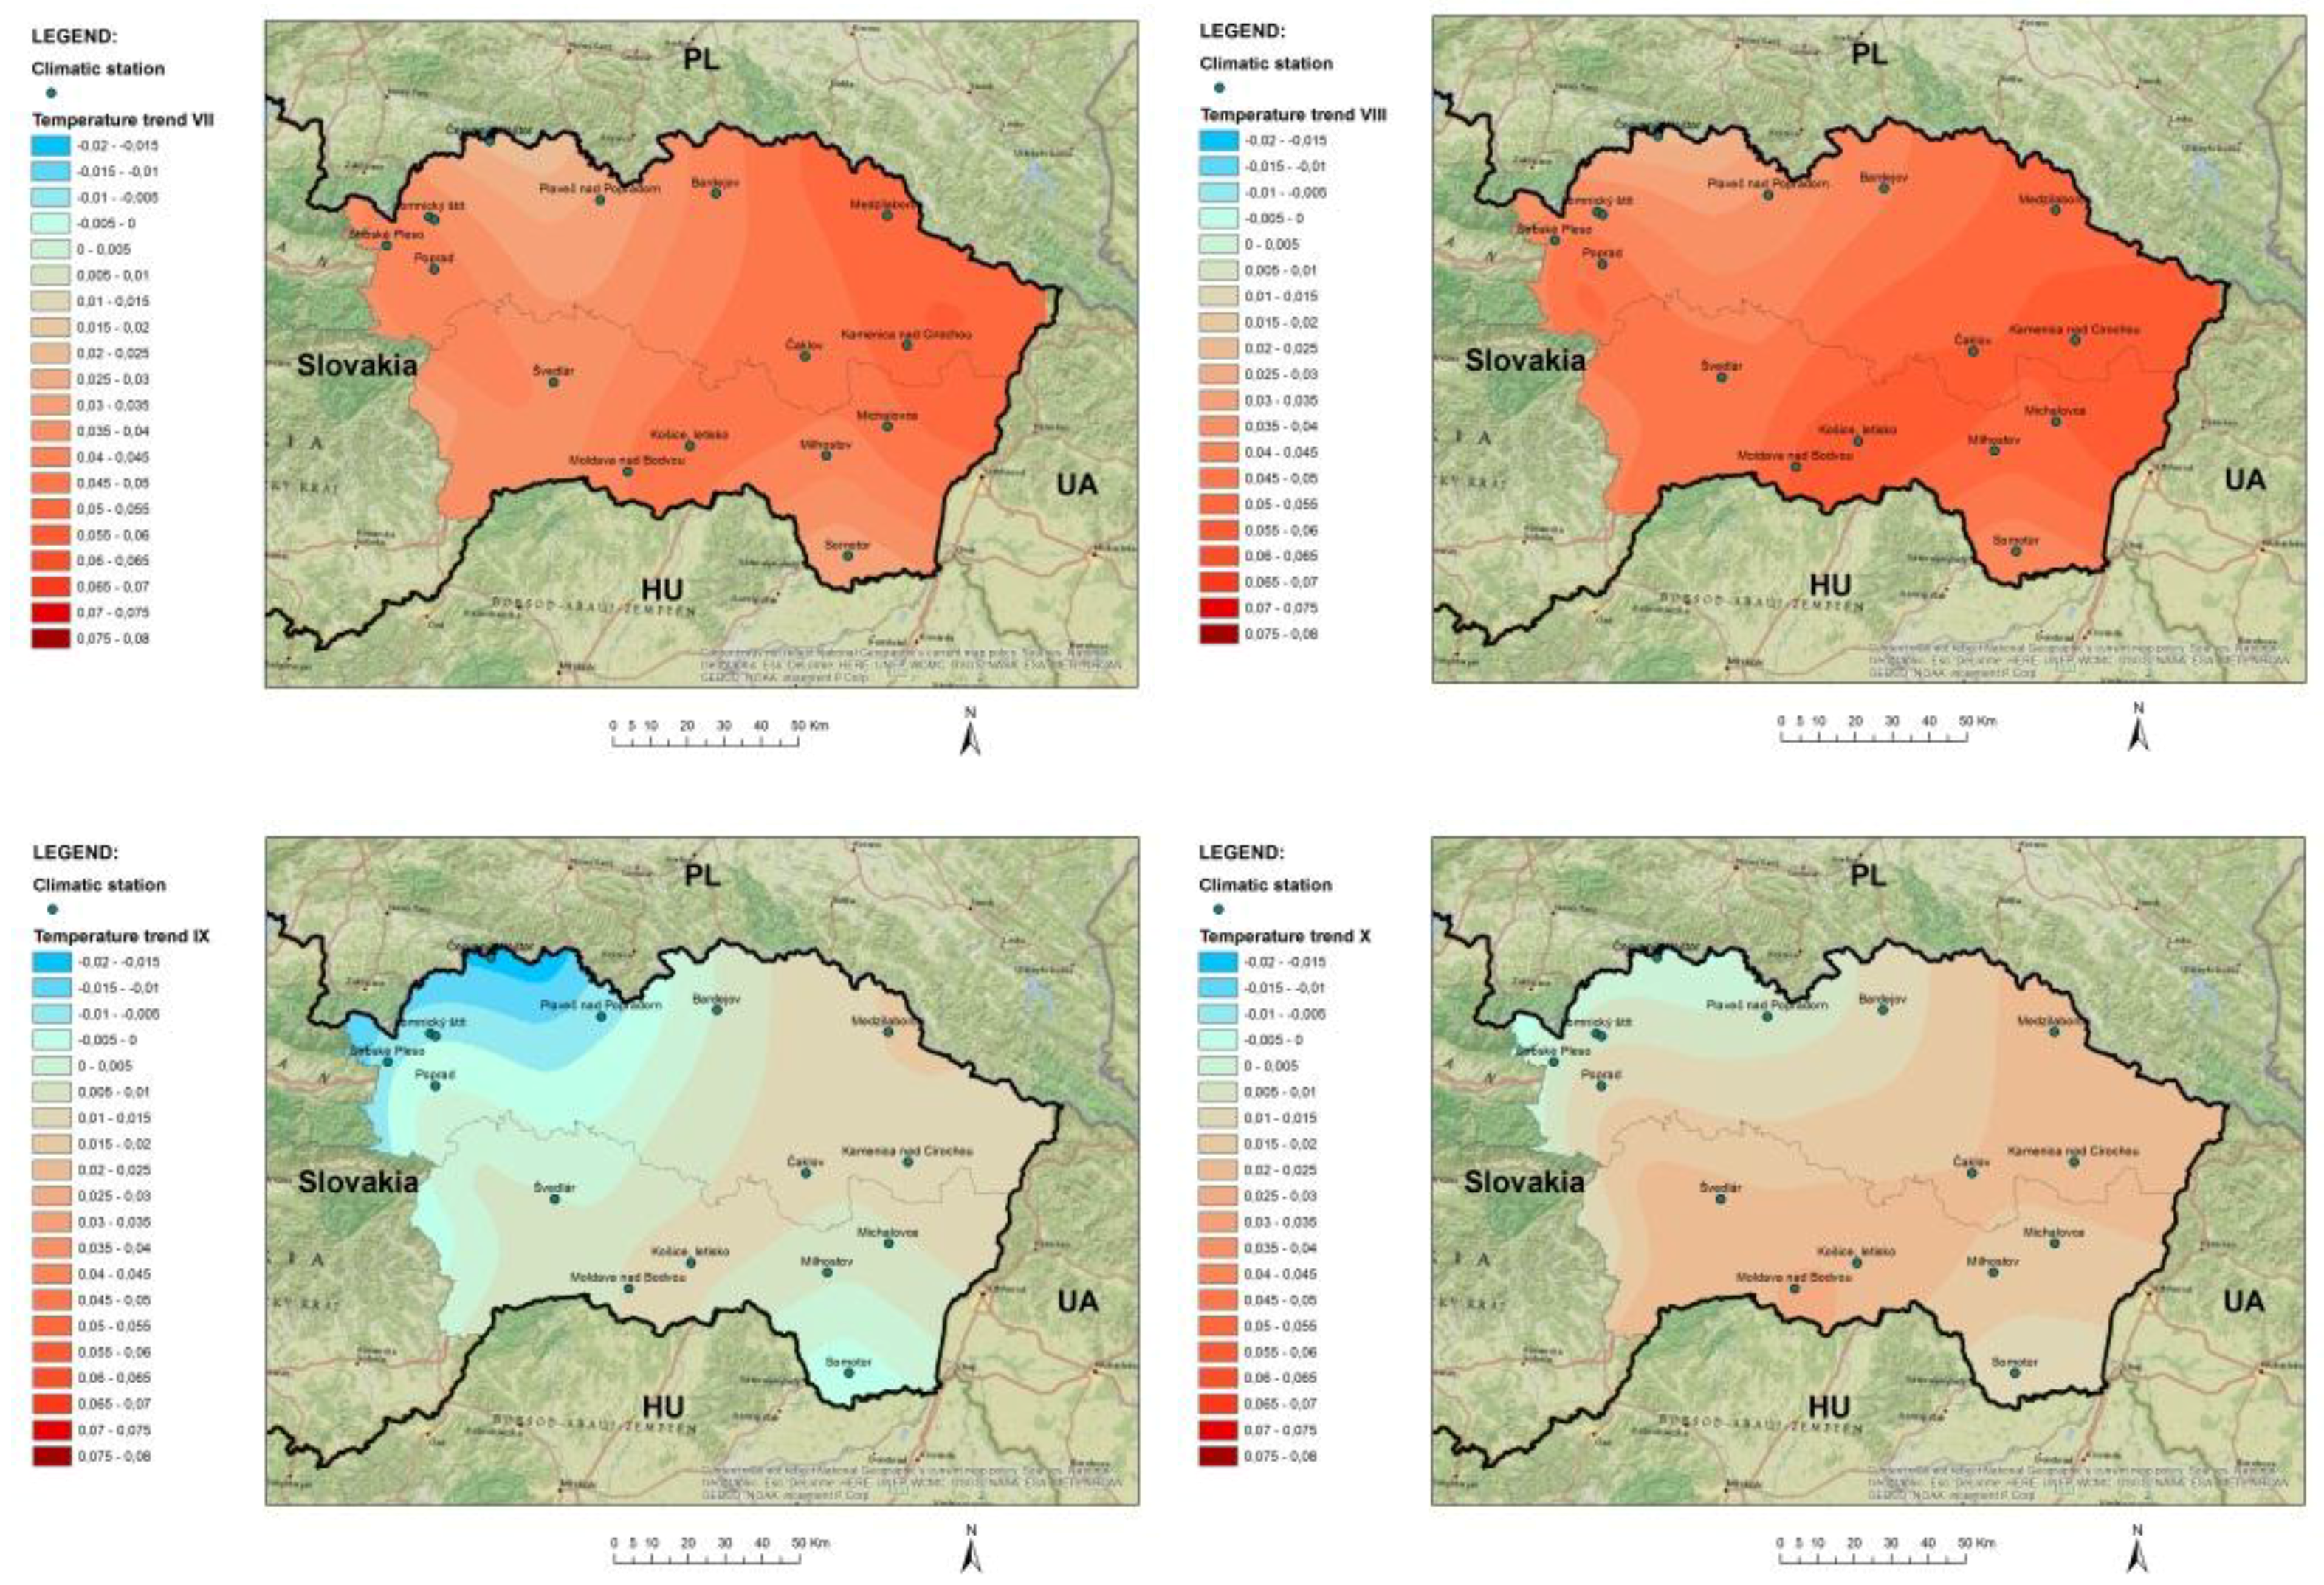
Spatial Distribution of Temperature Trends
The location of climatic stations and the magnitude of temperature trends (blue colour presents a decreasing trend and red colour presents an increasing trend) for the monthly data series (XI–X) during the period 1962–2014 are displayed in Figure 6.
Increasing trends prevail in the study area. Significant positive trends are detected mainly in the southern part of the country and the East Slovakias Lowlands. The largest urban area in Eastern Slovakia is situated there—the city of Košice with the Košice airport climatic station.
3.3. Precipitation and Temperature Shift Analysis
The analysis was conducted only for time series with significant MK trend at the 95% confidence level. Table 6 indicates significant trend (bold values) in annual precipitation and temperature time series.
Figure 7 shows graphical results of the SQMK test which clearly identifies the year when the abrupt shift in the precipitation time series occurred. The identified shift year represents the initiation of a positive trend.
The abrupt positive trend shift of annual precipitation series at Lomnický peak climatic station (where the Z statistic is extremely high as stated in Table 6) began around 1985, and becomes significant from around 1997 until the present time (Figure 7).
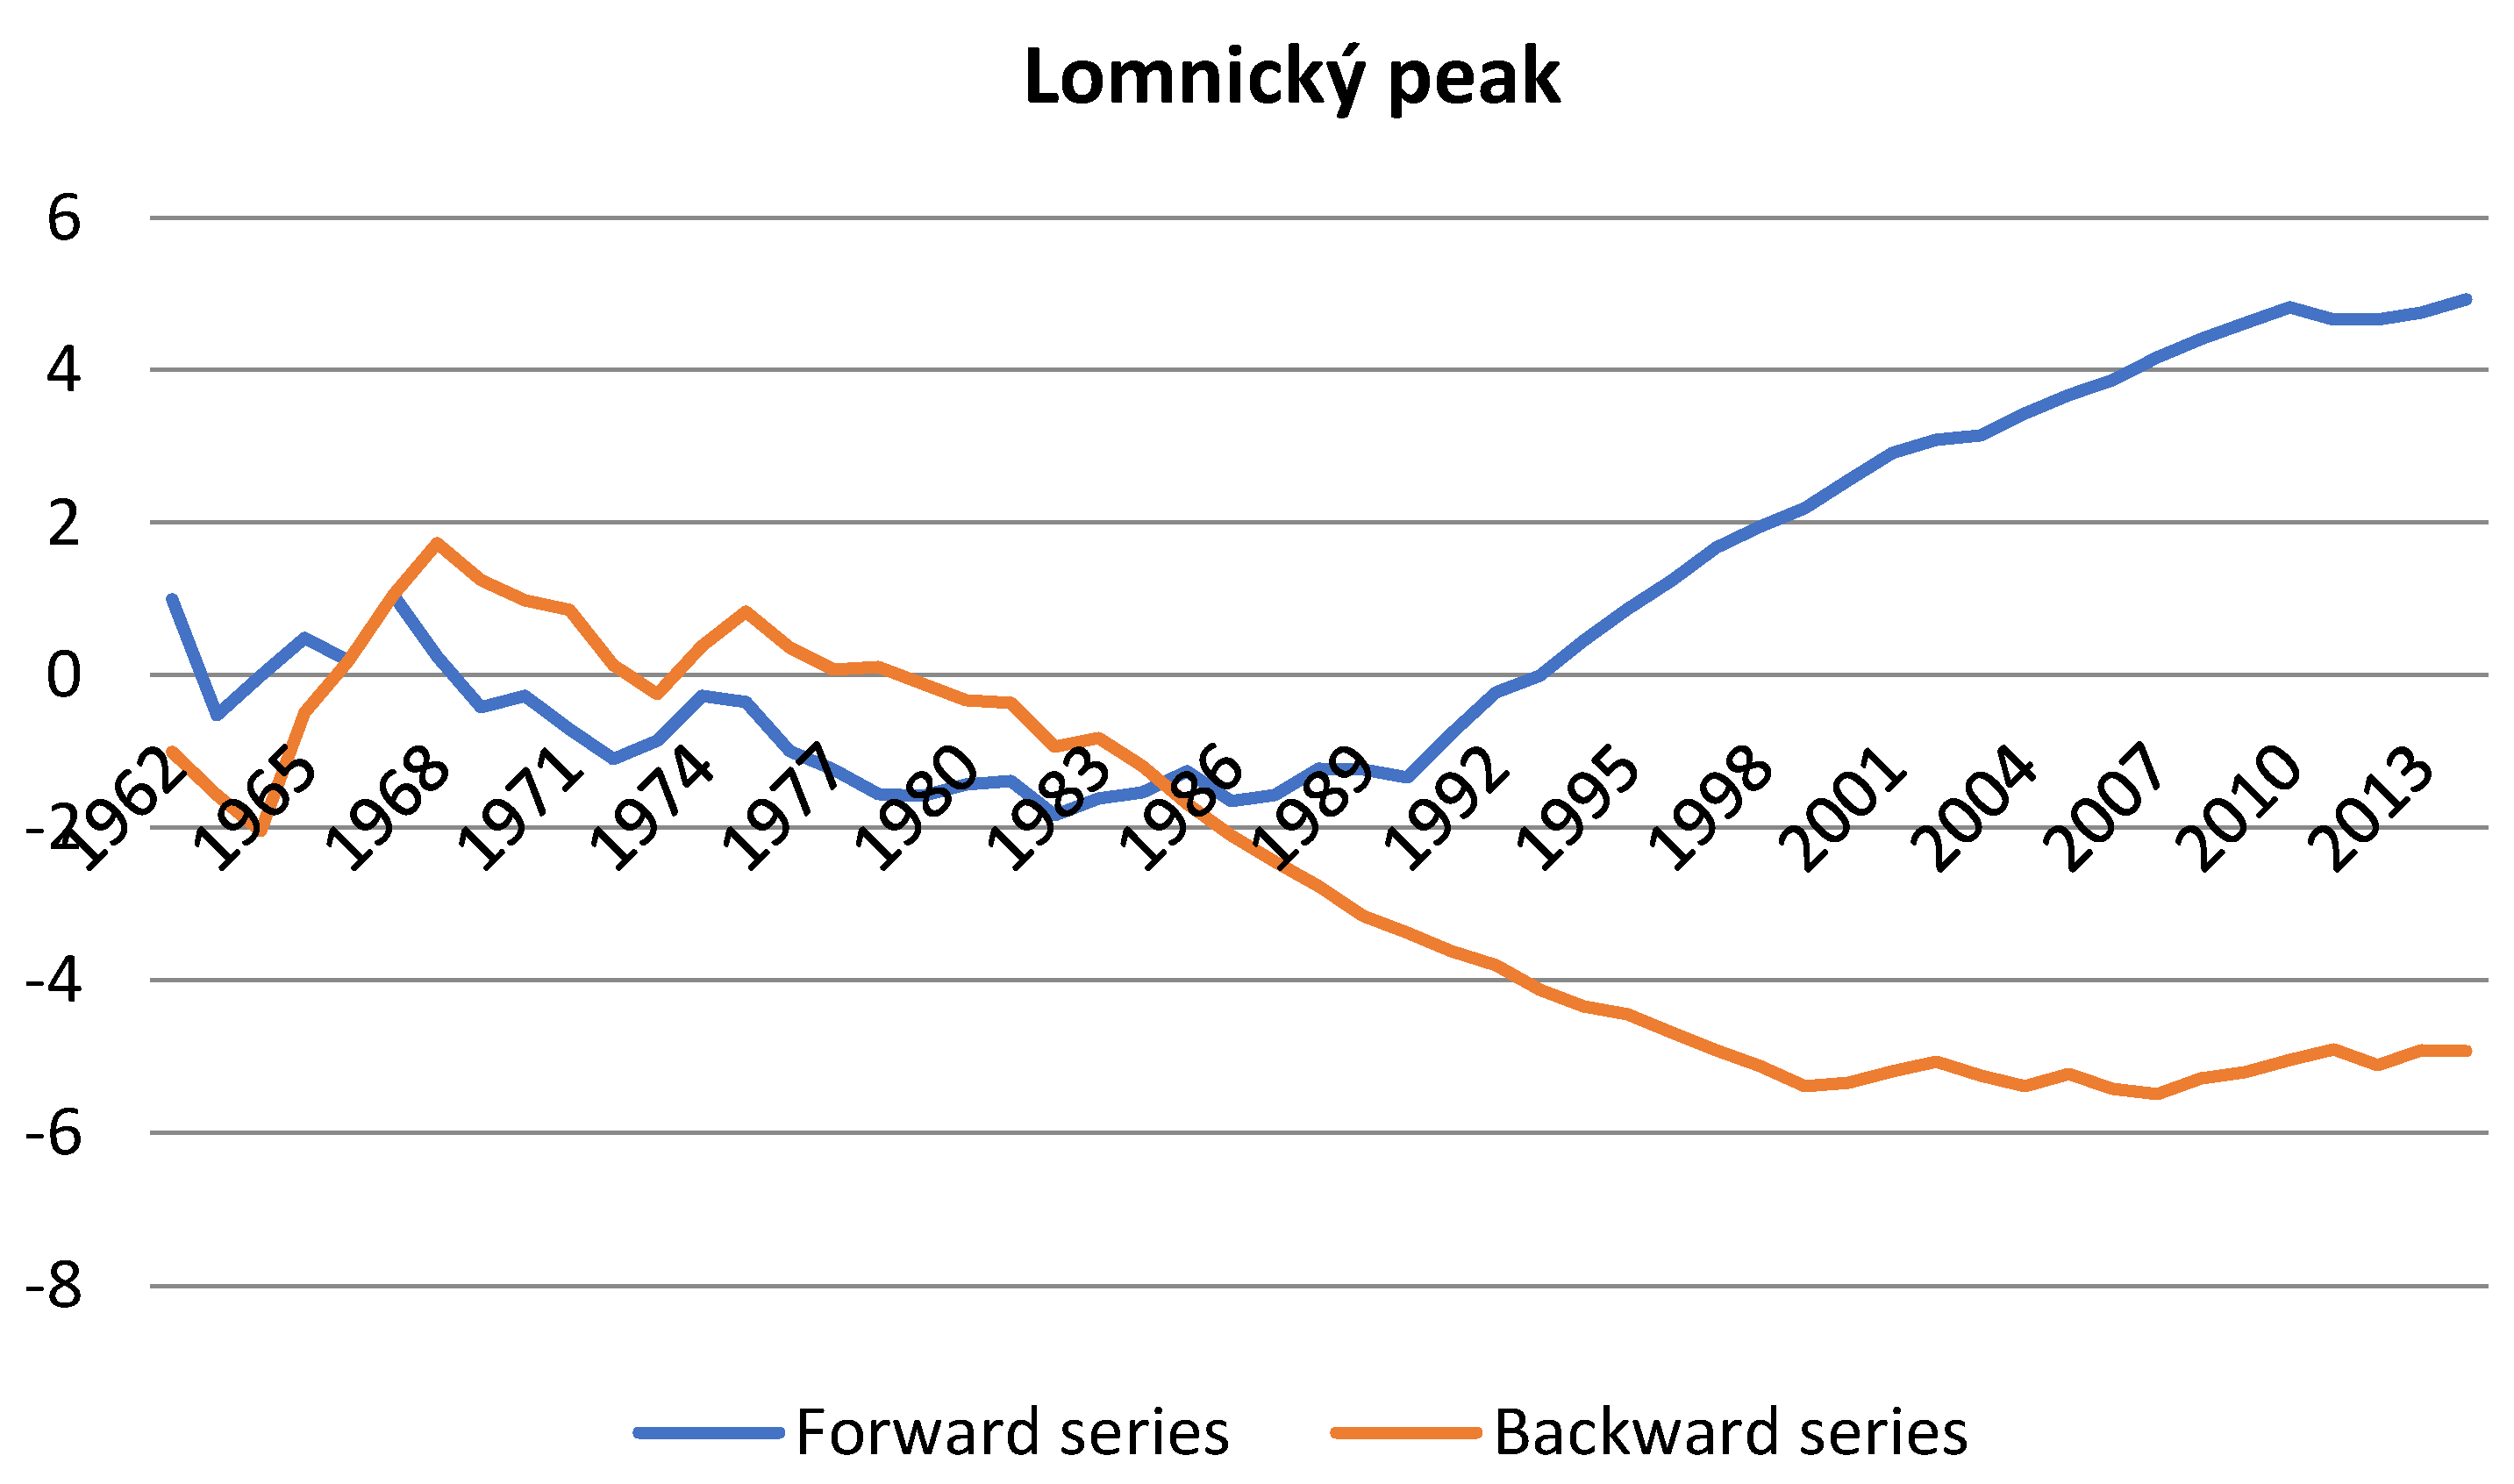
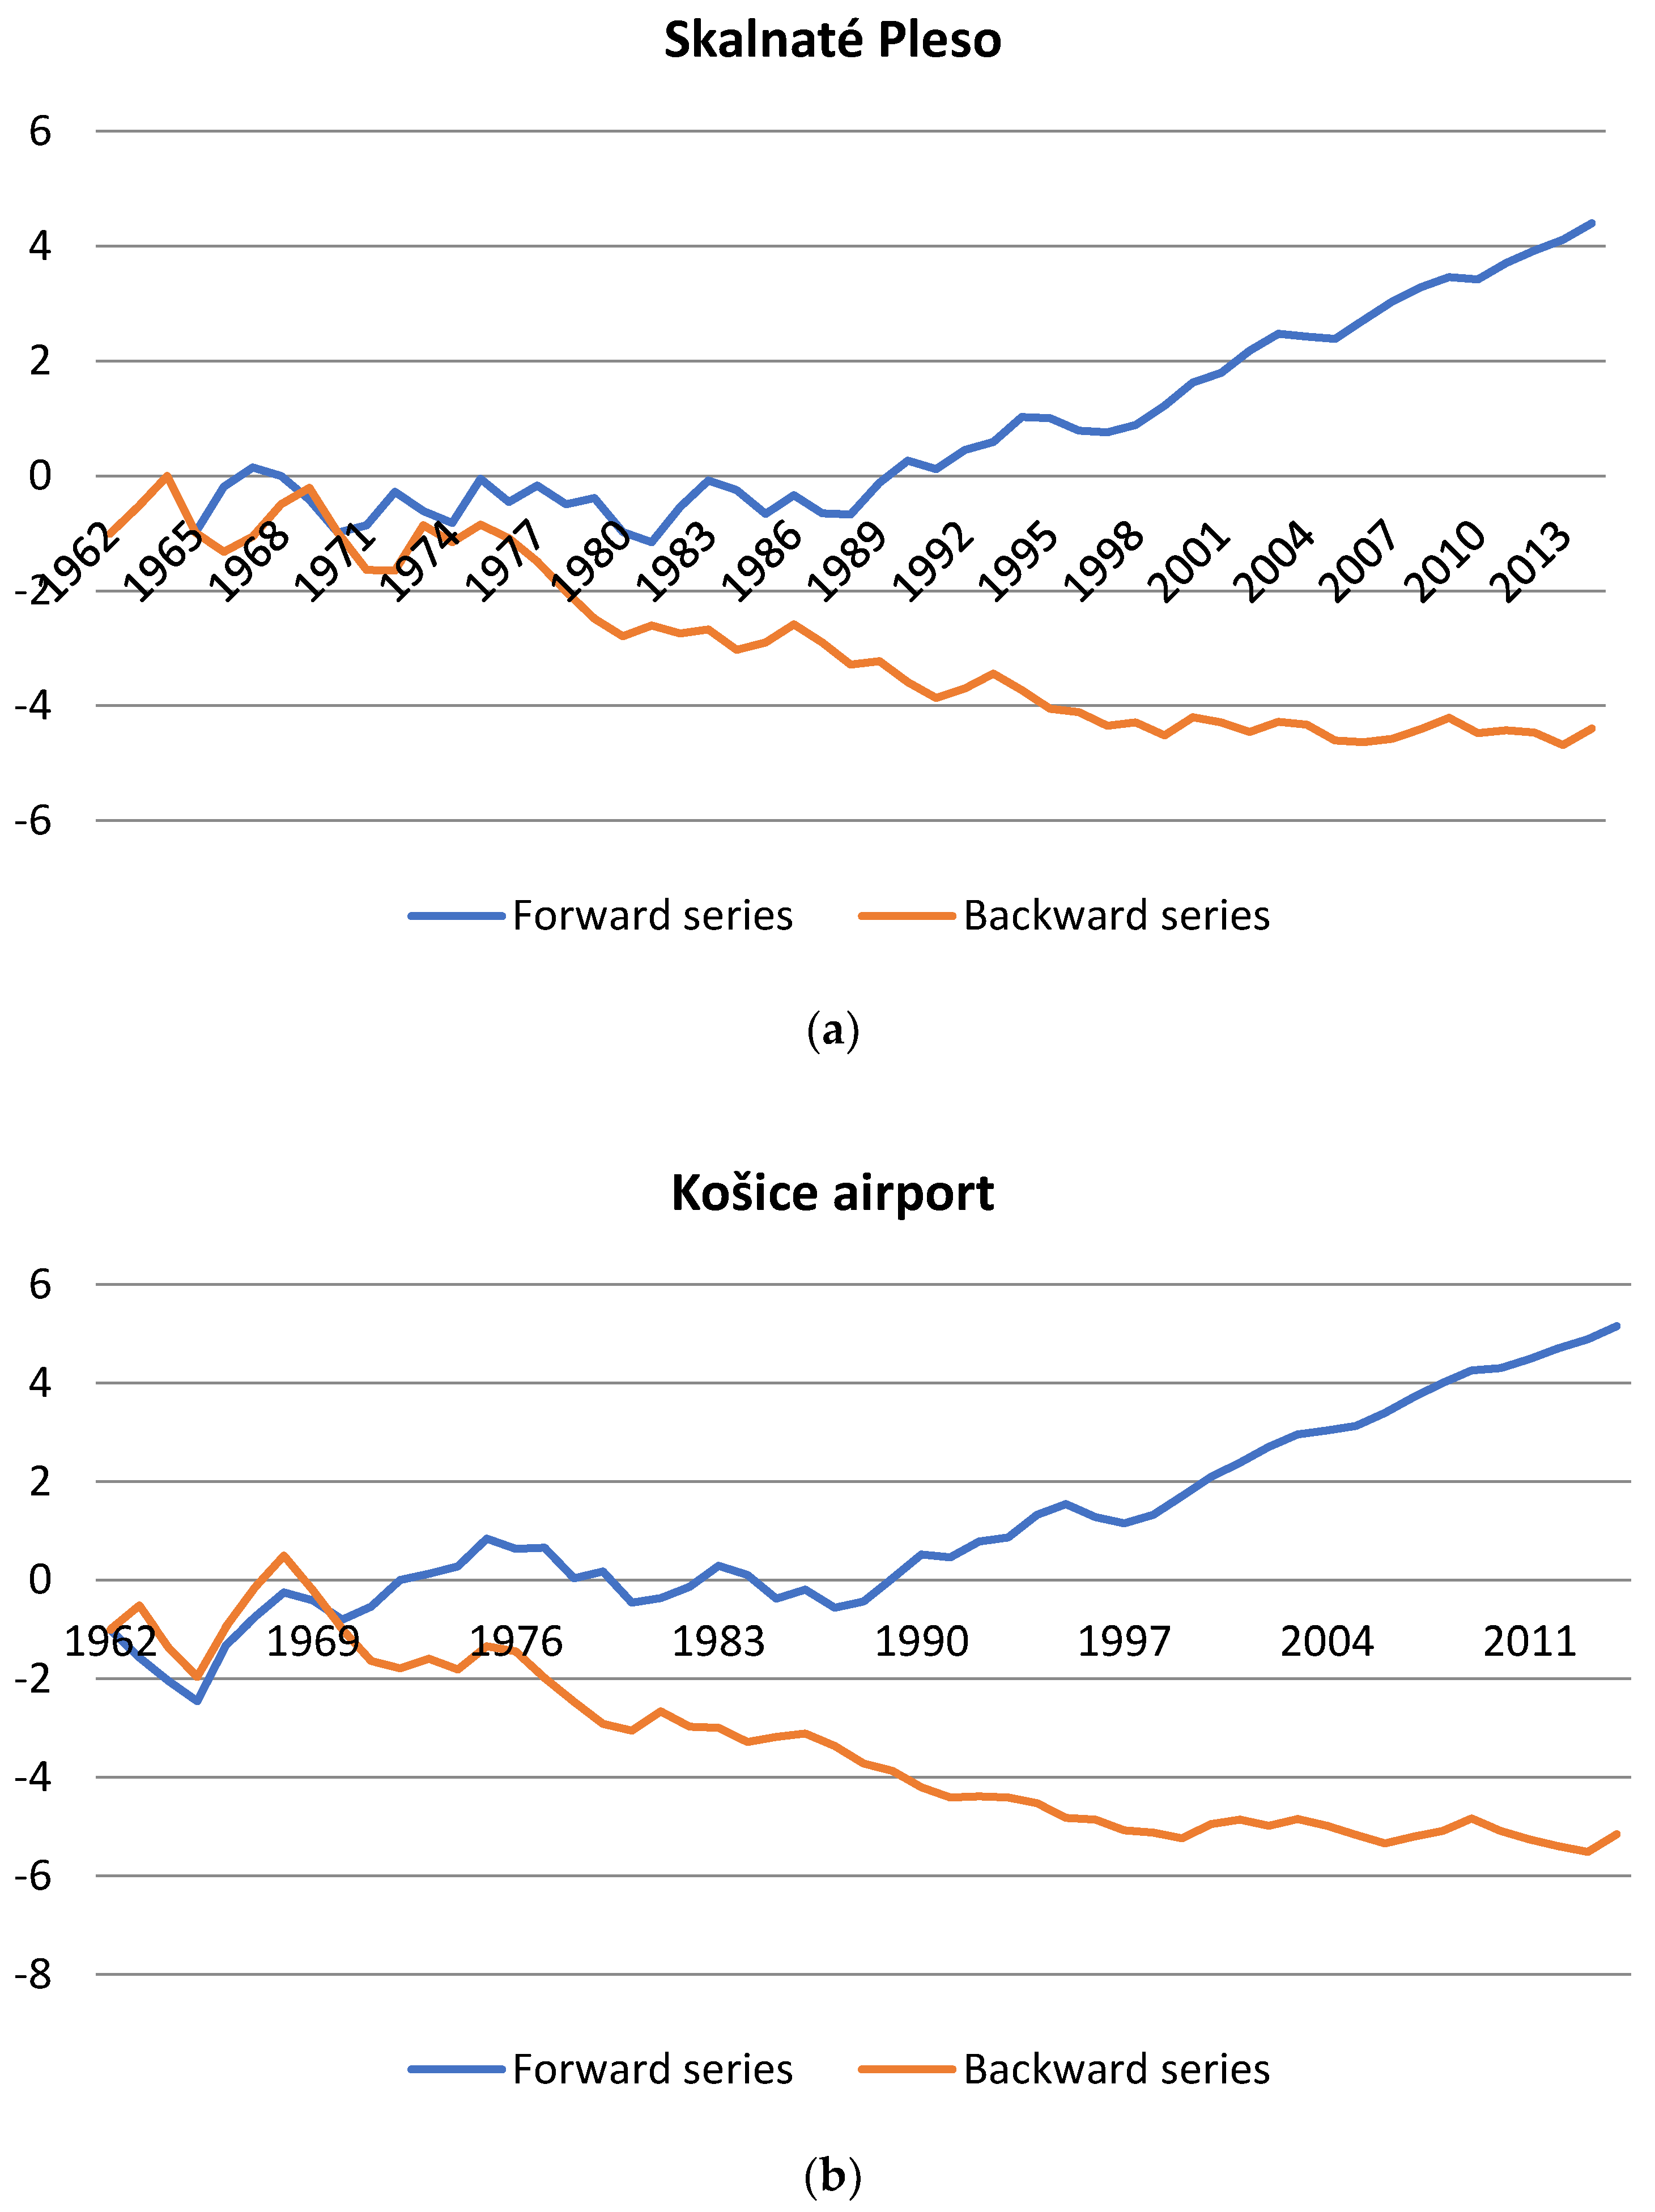
Figure 8 indicates results of the SQMK test in the temperature time series. The identified shift year represents the initiation of a positive trend in temperatures that is most evident at two climatic stations—(a) Skalnaté Pleso (mountain area) and (b) Košice airport (the largest city in the study area).
Figure 8a shows the temperature series at the Skalnaté Pleso climatic station, and the abrupt positive trend shift begins around 1970, becoming significant around 2001. The abrupt positive trend shifts in annual temperature series at the Košice airport climatic station begins around 1970, and becomes significant around 1999 (Figure 8b).
In this paper, the results of trend analysis applied to precipitation and temperature monthly data in Eastern Slovakia are presented for the hydrological year (from November to October). The Mann-Kendall non-parametric test coupled with Sen’s slope analysis was applied to identify the significant long-term climatic trends, as well as the magnitude of those trends. Increasing trends were found in both analysed hydrological variables, mainly in temperature. The abrupt trend analysis shift produces the idea that all abrupt shifts in temperature trend (95% confidence interval) were found around 1970 and became significant around 2000.
3.4. Trends of Dry/Wet Spells
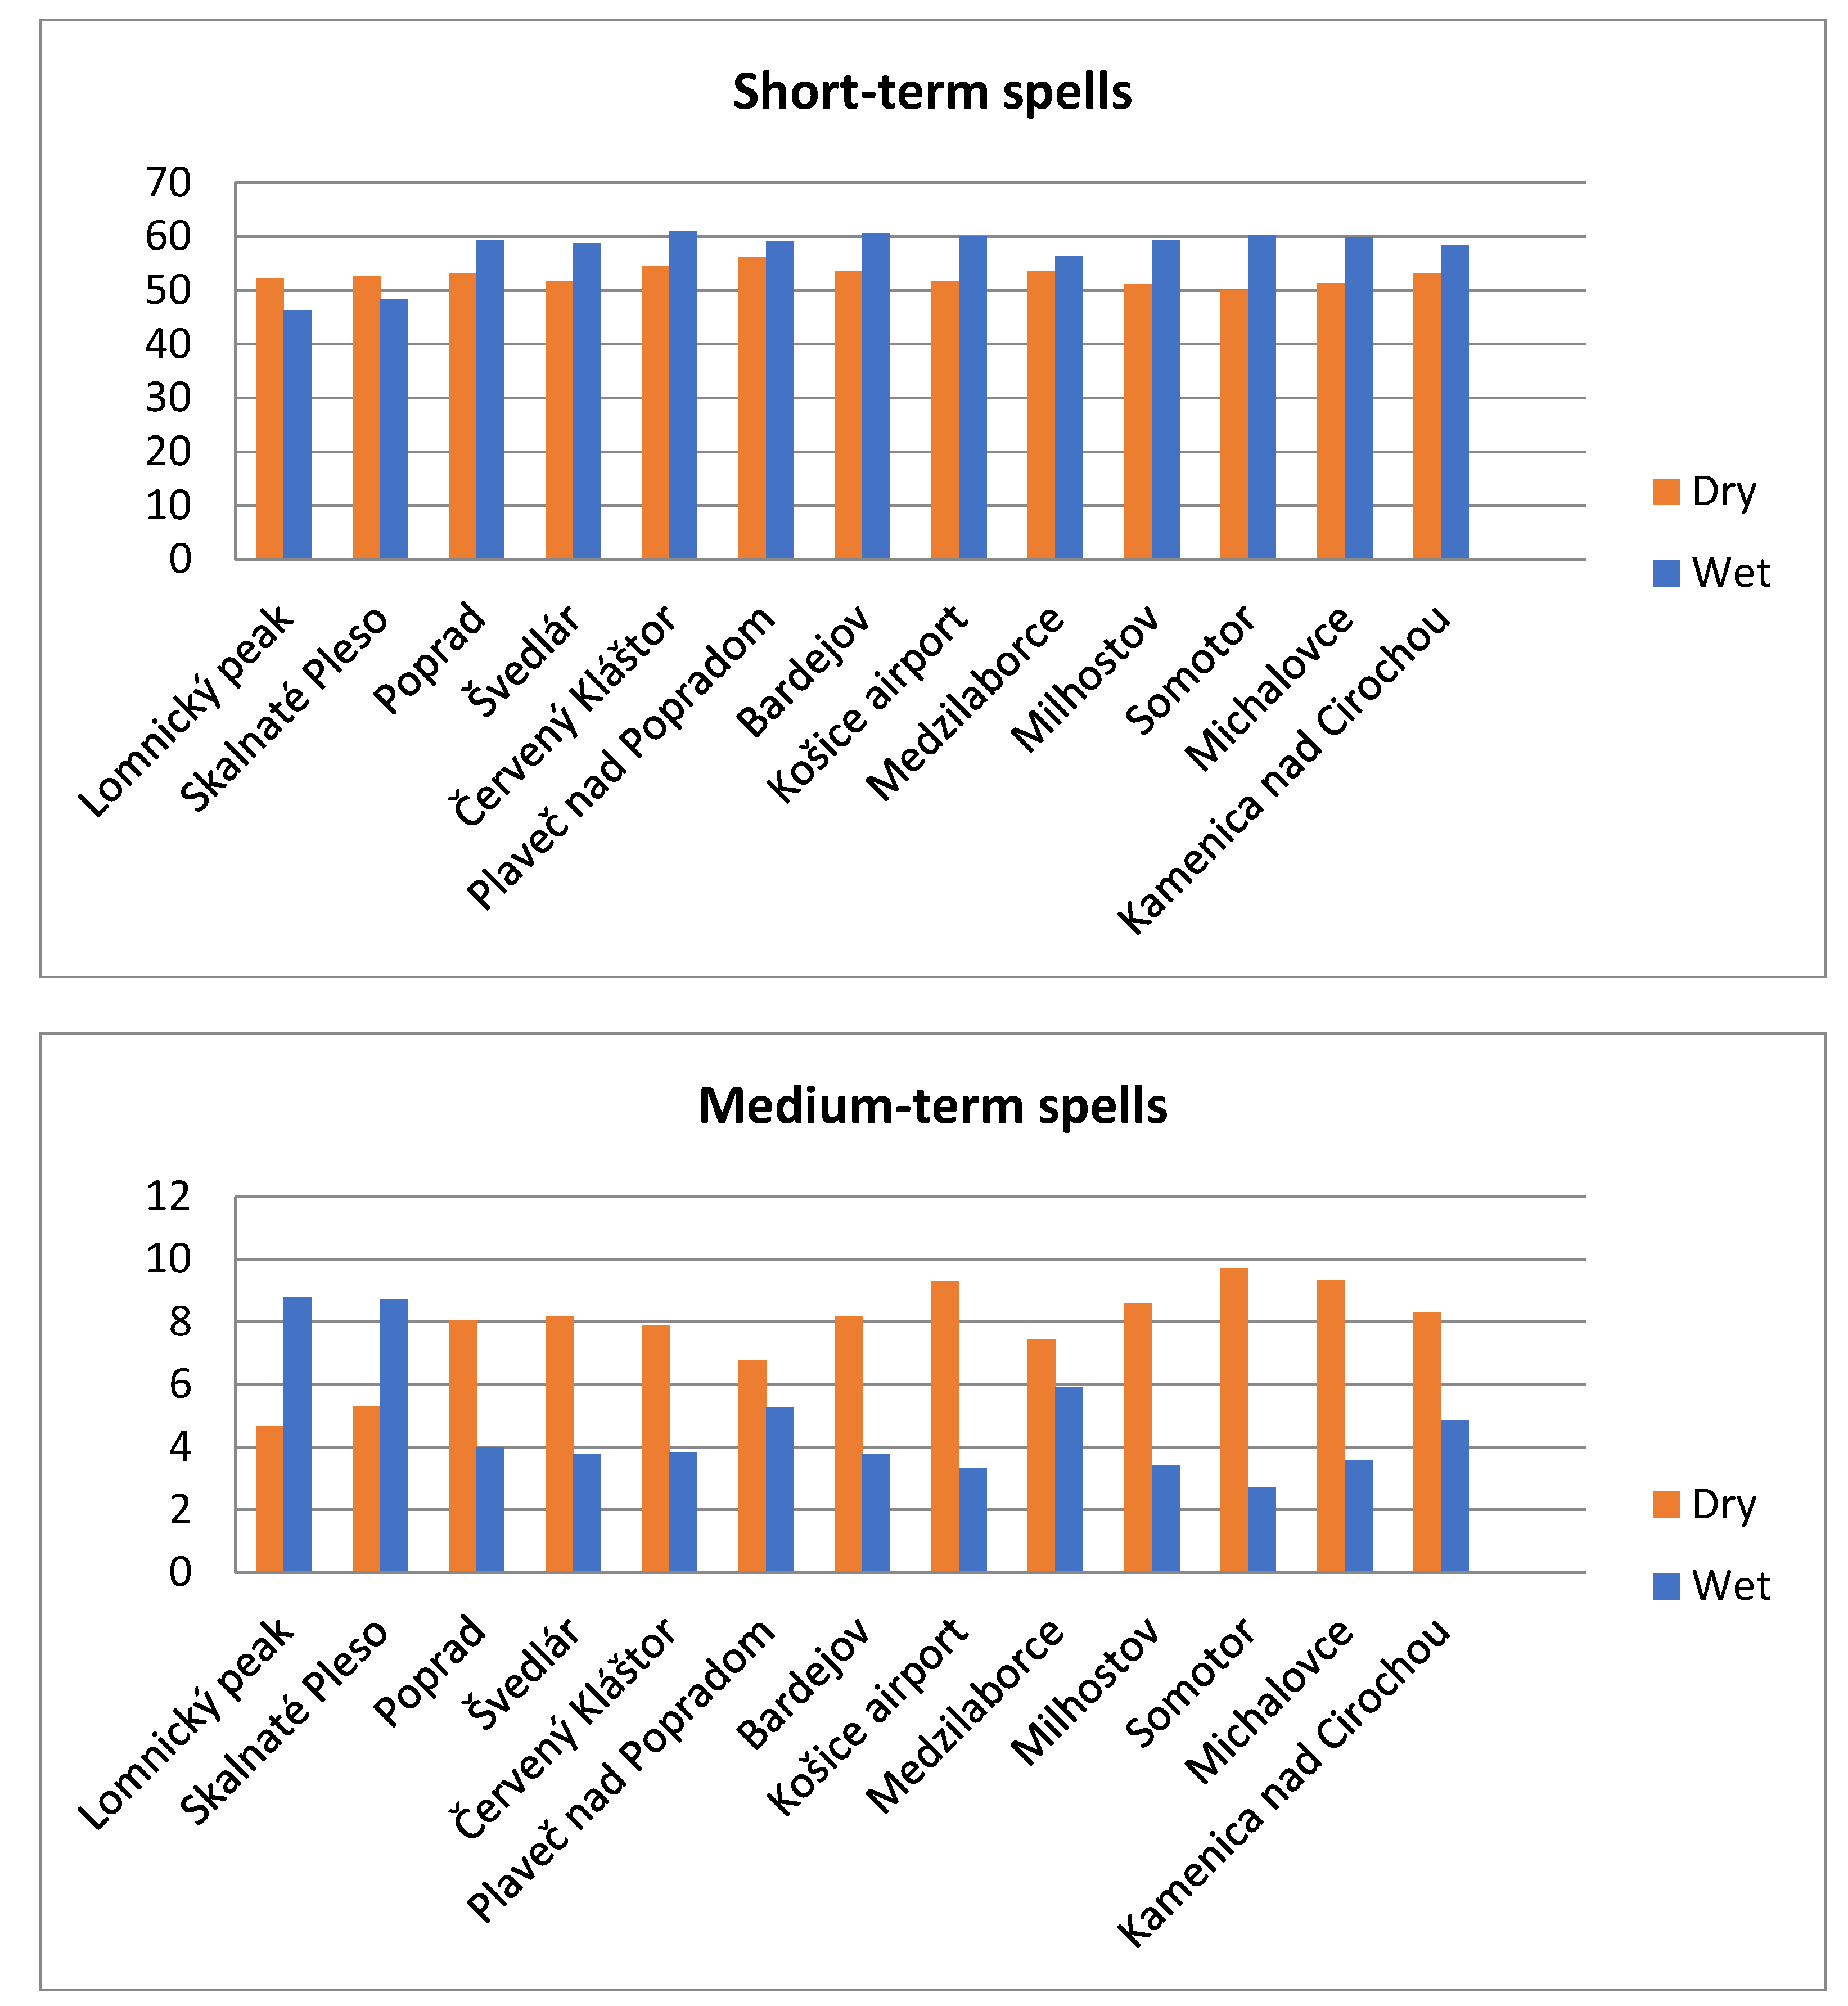
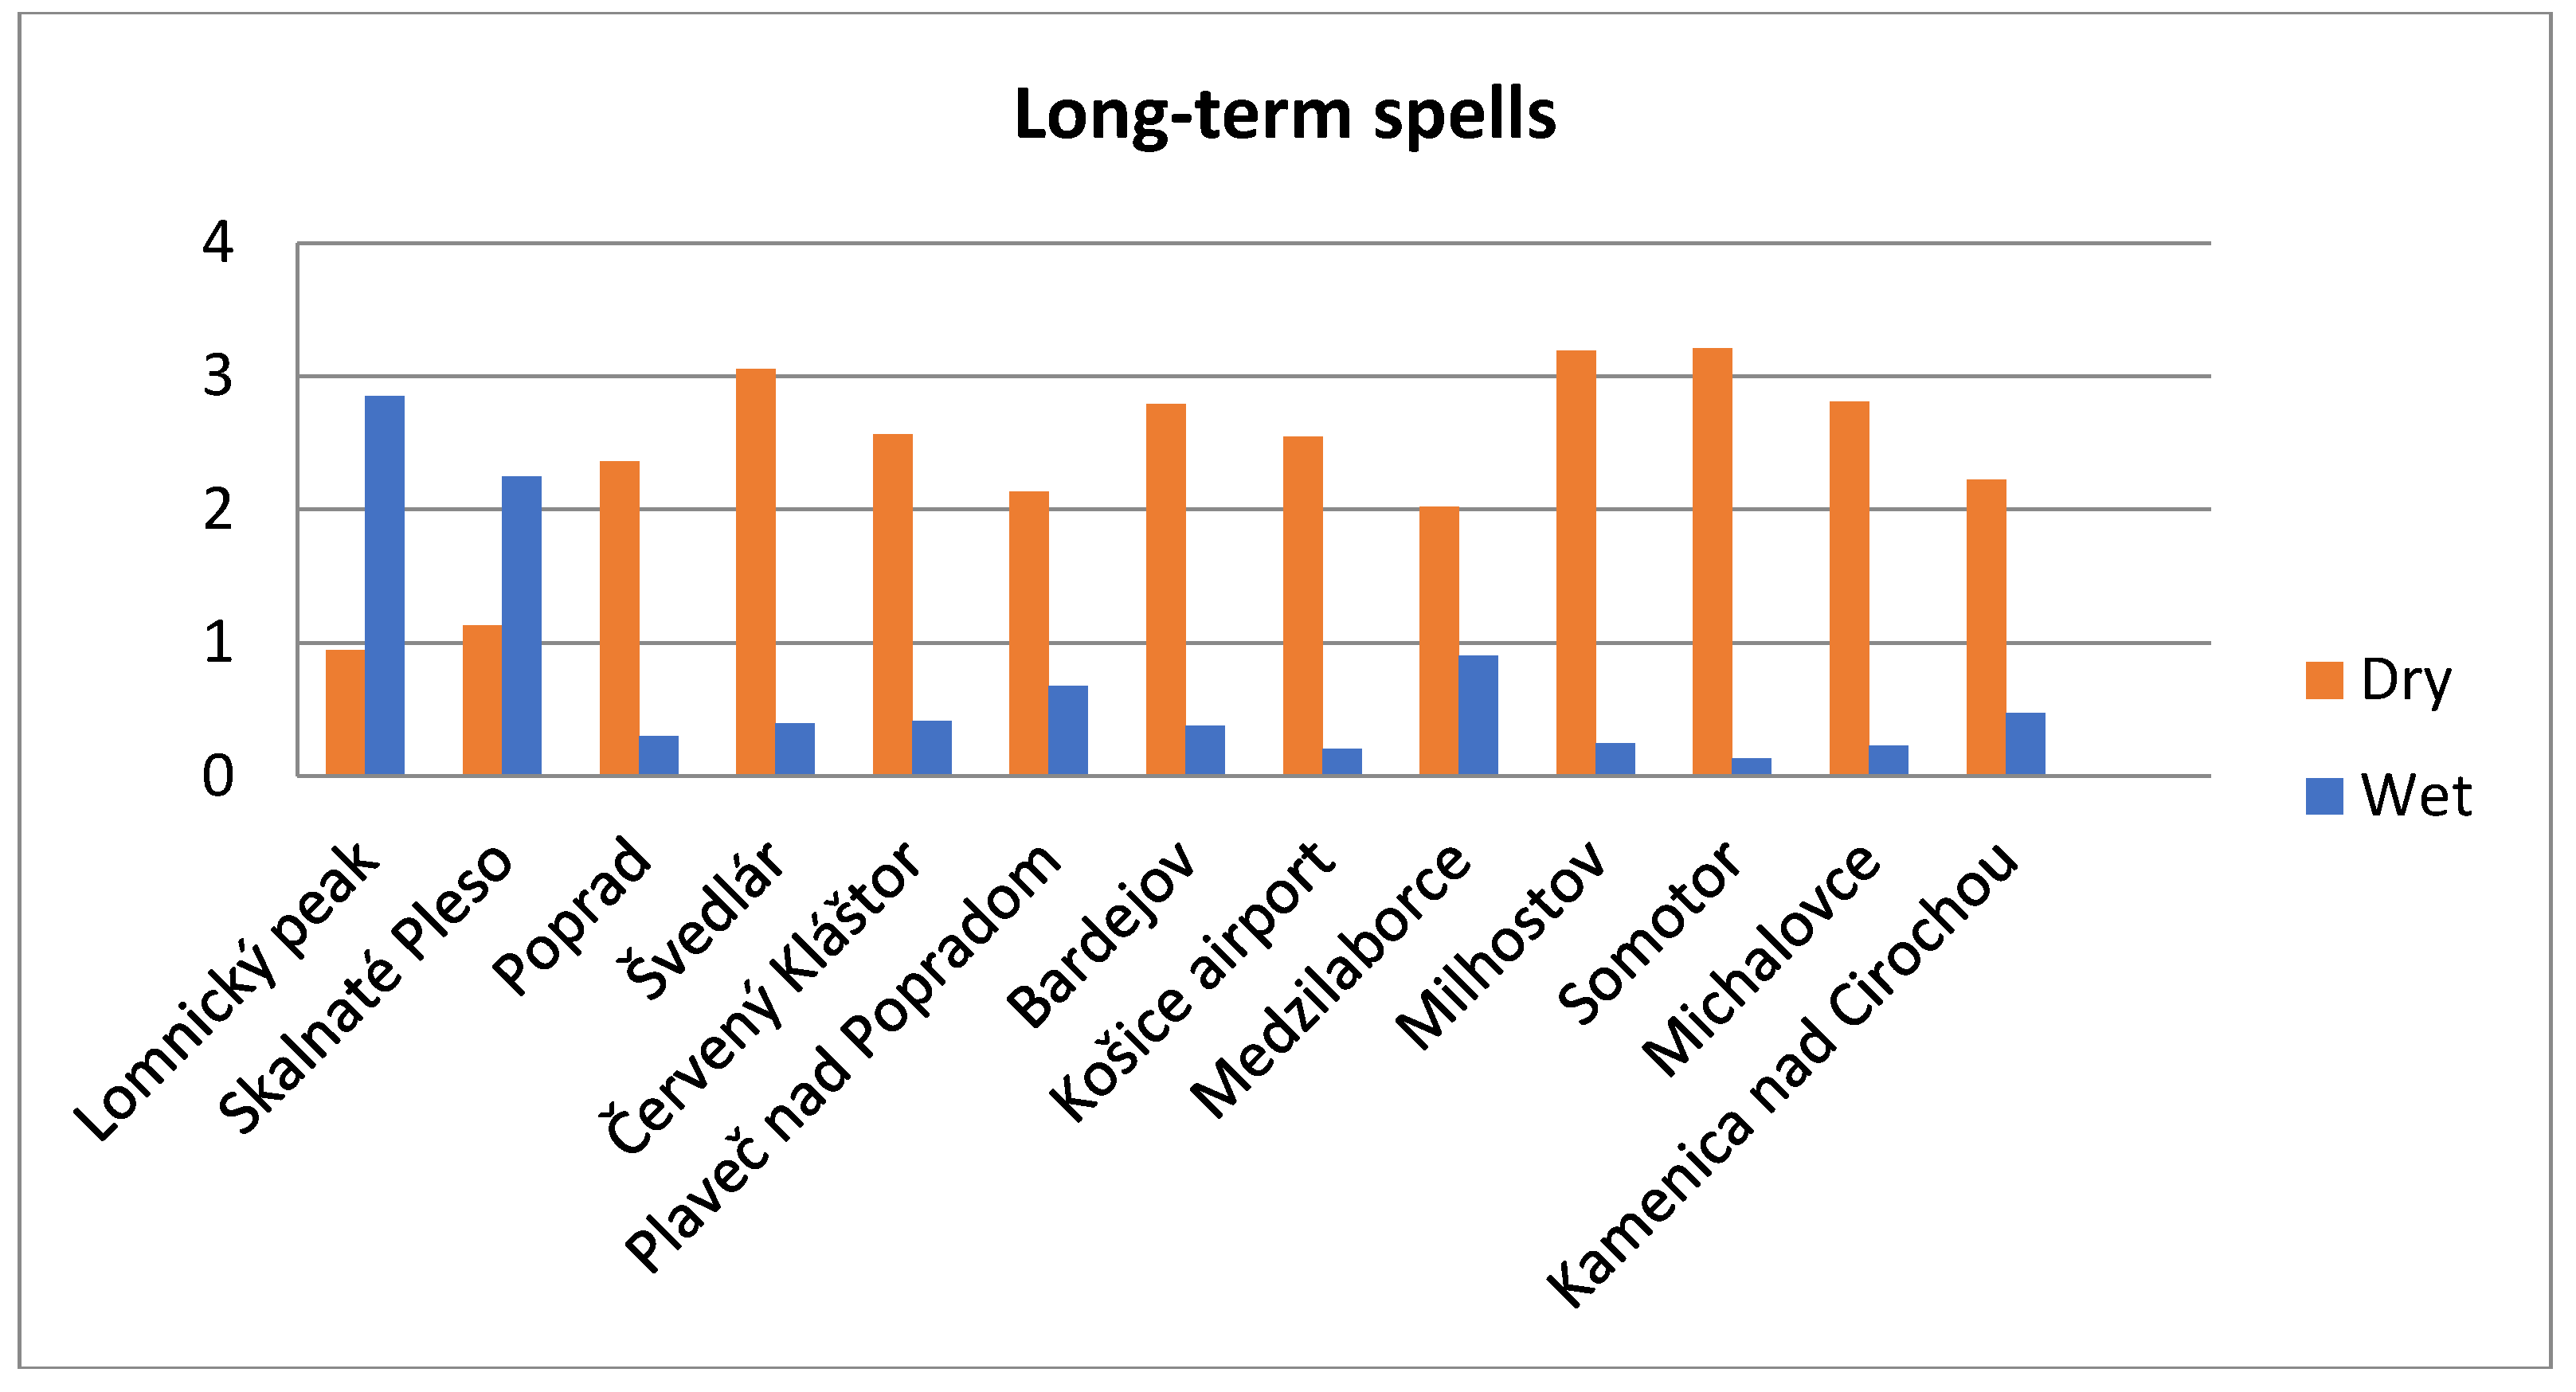
Frequency and trends of short-term, medium-term, and long-term wet/dry spells were also analysed with the non-parametric Mann-Kendall test. Figure 9 presents the number of short-term, medium-term, and long-term dry/wet spells at the analysed climatic stations in Eastern Slovakia.
Table 7 indicates a significant trend at the 95% confidence level (bold values) in wet/dry spells at the climatic stations in Eastern Slovakia. There is an evident significant positive trend in medium-term and long-term wet spells.
The field of the average number of days with precipitation ≥0.1 mm is more differentiated than the field of the average number of days with a higher daily precipitation total. There is a certain risk that such low precipitation totals are sometimes not properly registered by the volunteer observers. In the case of daily precipitation totals ≥1.0 mm such uncertainty does not exist. In the territory of Slovakia, we register great variation in the average annual number of days with precipitation for all of the analysed daily amount intervals. In all of these intervals the lowest values of the average number of days with precipitation were recorded in the area of Southern Slovakia, especially in the East Slovakian Lowlands. There is a relatively large region in the southern part of Slovakia where the average number of days with precipitation ≥0.1 mm per year was just slightly above 100 days. This value represents about half of the number of days with precipitation ≥0.1 mm of the locations exposed to precipitation in the Tatra Mountains (northern part of the country). There is a similar ratio even in the case of the average annual number of days with precipitation ≥1.0 mm and 5.0 mm. It is interesting that the average annual number of days with precipitation ≥10.0 mm has a relatively greater dispersion of values between the lowland and mountainous regions. For example, in the lowlands of Slovakia the number of such days per year on average is around 15, while in the Tatra Mountains it is about 50. This is due to the fact that the yearly course of days with lower precipitation totals is relatively more regular than it is in the case of daily precipitation totals ≥10.0 mm. Such high daily precipitation totals are characteristic of the mountainous regions during all the seasons, however, they are most frequent in the summer months. In the lowlands, there is a relatively high difference in occurrence of such days with higher overall precipitation totals in the summer and winter months [64,65]. This influences the annual course, which becomes more expressive.
4. Discussion and Conclusions
Hydroloclimatic time series in Slovakia, mainly precipitation, have been investigated in various studies [12,65,66,67,68,69,70,71,72,73,74,75,76,77]. Lapin et al. [73] analysed seasonal changes in monthly precipitation for future time horizons on the basis of downscaled outputs from General Circulation Model (GCM) scenarios. In Slovakia seasonality analysis was applied mainly in connection with the regionalisation of floods [74]. Gaál [75] also analysed the maximum n-day precipitation totals in Slovakia and applied seasonality indices of mean monthly and extreme precipitation regionalization over Slovakia. Kriegerová and Kohnová [76] analysed the seasonality of rainfall and snowmelt-induced floods in 142 small and mid-sized catchments in Slovakia and found that convective storms are the main causal factor of annual peak discharges. They concluded that the seasonality indices represent an important indicator of flood processes, and can be used as a pooling characteristic in regional flood frequency analysis. None of the mentioned scientific papers investigated trends in hydroclimatic time series in Slovakia, although Blahušiaková and Matoušková [77] analysed trends and causes of changes of selected hydroclimatic variables influencing the runoff regime in the upper Hron River basin (Slovakia). The Mann-Kendall test shows a significant decrease in runoff in the winter period in that area. One of the causes of runoff decline lies in changes in seasonal distribution of precipitation amounts.
Atmospheric precipitation is usually considered together with the air temperature as the most important meteorological parameter. It also belongs among the most changeable meteorological elements from both spatial and temporal points of view. Atmospheric precipitation is most influenced by geographic location area, altitude, and exposure to the prevailing wind, bringing moist air masses and frontal systems. The Intergovernmental Panel on Climate Change [1] provides a comprehensive review of the potential impacts on the hydrological variables of the human-induced climate changes. It states that such changes will likely increase runoff in the higher latitude regions because of increased precipitation; moreover, the flood frequency is expected to change in some locations and the severity of drought events could also increase as a result of the changes both in precipitation and evaporation. Observations show that changes are occurring in the amount, intensity, frequency, and type of precipitation. The frequency of extreme temperatures during the summer is likely to be higher [1].
This paper describes the application of a procedure that identifies trends in climatic variables, specifically precipitation and temperature in Eastern Slovakia. The East Slovakian Lowlands are the warmest and the driest region of Eastern Slovakia with an annual average temperature around 8 °C and precipitation around 600 mm. The coldest places are the mountainous areas—the High Tatras in the north of Eastern Slovakia with the average temperature of −3 °C and with precipitation over 2000 mm.
The non-parametric Mann-Kendall test was applied to detect trends and to assess the significance of the trends in the time series. This statistical test has been widely applied to assess the significance of trends in climatological time series. The significance of trends in a 53-year climatological time series was assessed with the Mann-Kendall test at the significance level of 0.05. We investigated the precipitation and temperature data in the study area—the eastern part of the Slovak Republic—at 16 climatic stations in which no gaps in the data were presented. The Sequential Mann-Kendall test was used to detect changes in precipitation and temperature trends.
From the spatial point of view, the maximum annual precipitation amounts were recorded in the mountainous areas, and the minimum amounts in the southeastern lowlands of Slovakia (Figure 4). Although the generally driest month is August, the highest decreasing trend in temperature was found in January (Figure 6). During the warm period (from May to October) convection precipitation [12] seems to play the main role. Our opinion is based on the spatial distribution of the highest precipitation amounts falling mainly in the mountainous and highland areas of Slovakia. However, the lowland parts (Southeastern Slovakia) are also relatively well supplied with rain compared to the winter months. In this case, the reason could also be some influence of the European monsoon [78]. The role of the European monsoon as a driver of the precipitation regime in late spring and early summer was historically discussed by Konček [79]. On the basis of these observations, we argue that there is an evident role of the atmospheric circulation in driving precipitation distribution over the studied region.
The application of trend detection in Eastern Slovakia has resulted in the identification of a few increasing significant trends in precipitation, but clearer increasing significant trends in temperature data. Temporal differences were noted in the occurrence and the direction of trends implying that a systematic framework is essential for detecting trends that might arise as a result of climatic variability. Temporal differences in the trends likely reflect non-uniform changes in the meteorological variable. Spatial differences in the trend results can be expected to occur as a result of spatial differences in the changes in precipitation and temperatures over the study area and spatial differences in the country characteristics. A slight decrease in precipitation was confirmed in November and August, while all other months showed an increasing trend in precipitation. Increasing temperatures were found at all the stations over the study area. As expected, trends show large variability in magnitude and direction of the trend from one station to another related to the topography of the country. It is clear that slight climatic changes may have affected the magnitude and timing of the atmospheric variables within the study area.
Low, medium, and high values of precipitation and/or temperatures were examined using the Sen trend test. It was seen that although there was significantly no trend in some of the parameters according to the MK test, increasing, decreasing, or trendless time series were seen for the same parameters with respect to Sen’s method. Sen’s method provided us with more detail about the trends in the parameters (precipitation and/or temperatures) than the MK method in terms of the evaluation of low, medium, and high values.
Shift analysis was done with the Sequential Mann-Kendall test and proved that an abrupt shift in positive trends in temperatures were found in 1970.
Spatial distributions of the average annual number of days with precipitation depends, inter alia, on the value of the daily precipitation total. There is an obvious difference between short-term, medium-term, and long-term wet/dry spells occurrence. The mountainous climatic stations at Lomnický peak and Skalnaté Pleso show evidently higher numbers of medium-term and long-term wet spells occurring and lower numbers of short-term wet spells occurring compared with the other climatic stations, and vice versa. The trend in medium-term and long-term wet spells is increasing and in long-term dry spells is decreasing, mainly at stations with higher altitude, but increasing at lowland stations.
This paper develops, for the first time, a full picture of recent precipitation and temperature trends and wet/dry spells occurrence at climatic stations across the region of Eastern Slovakia, which should be of interest to future agriculture, landscape management, and water resource management decision-makers. The achieved results could be a valuable basis for integrated water resources management in the study area. Public interest in the protection and use of water resources in urban areas requires consistent protection of water and soil and the sustainable management of water and land resources in the individual communities. Constraints in water management are mainly due to the unequal distribution of water in the area. In the course of the year the amount of water in the area is usually significantly changing. The precipitation characteristics, based on the overall daily total, as well as temperature data series, are important with regard to human activities. Even small precipitation totals affect road conditions and, thus, also traffic safety. Data on the number of days with higher precipitation totals can, for example, help in the planning of irrigation systems in agriculture. Temperature influences evaporation and the growing of crops. Excess water causes problems for the population, farmers, industry, and municipalities, particularly during floods. The same problem also causes water shortages mainly during the dry season. The best option is a sufficient amount of water resources throughout the year being present in the whole area, as well as in this period of climate change. Public interest further includes ensuring people’s access to drinking water, provision of wastewater treatment, minimizing flood risks in river basins and in the municipalities, and ensuring appropriate protection systems against floods and droughts. The rational use of water involves adapting to its natural occurrence in the area.
Author Contributions
All authors have equal contribution to the preparation of this scientific paper.
Acknowledgments
This work was supported by project VEGA 1/0202/15 Sustainable and Safe Water Management in Buildings of the 3rd Millennium.
Conflicts of Interest
The authors declare no conflict of interest.
References
- IPCC (Intergovernmental Panel for Climatic Change). Working Group II: Impacts, Adaptation and Vulnerability. Extreme High Temperature and Precipitation Events. 2012. Available online: http://www.ipcc.ch/ipccreports/tar/wg2/index.php?idp=625 (accessed on 15 May 2015).
- OECD (Organisation for Economic Co-Operation and Development). Water and Climate Change Adaptation: Policies to Navigate Uncharted Waters; OECD Studies on Water; OECD Publishing: Paris, France, 2013. [Google Scholar]
- Kovats, R.S.; Valentini, R.; Bouwer, L.M.; Georgopoulou, E.; Jacob, D.; Martin, E.; Rounsevell, M.; Soussana, J.F. Europe. In Climate Change 2014: Impacts, Adaptation, and Vulnerability; Part B: Regional Aspects. Contribution of Working Group II to the Fifth Assessment Report of the Intergovernmental Panel on Climate Change; Barros, V.R., Field, C.B., Dokken, D.J., Mastrandrea, M.D., Mach, K.J., Bilir, T.E., Chatterjee, M., Ebi, K.L., Estrada, Y.O., Genova, R.C., Eds.; Cambridge University Press: Cambridge, UK; New York, NY, USA, 2014; pp. 1267–1326. [Google Scholar]
- Machlica, A.; Stojkovova, M.; Fendekova, M. Assessment of hydrological drought occurrence in Nitra River catchment (Slovakia) in the period 1976–2005. In Proceedings of the EGU General Assembly 2008, Vienna, Austria, 13–18 April 2008. Geophysical Research Abstracts. Vol. 10, EGU2008-A-09329. SRef-ID:1607-7962/gra/EGU2008-A-09329. [Google Scholar]
- Oosterwijk, J.; van Loon, A.F.; Machlica, A.; Horvát, O.; van Lanen, H.A.J.; Fendeková, M. Hydrological Drought Characteristics of the Nedozery Sub Catchment, upper Nitra, Slovakia, Based on HBY Modelling; Technical Report n.º 20. 2009; WATCH—Water and Global Change: Oxfordshire, UK, 2009. [Google Scholar]
- Gaál, L.; Szolgay, J.; Lapin, M.; Faško, P. Hybrid approach to delineation of homogeneous regions for regional precipitation frequency analysis. J. Hydrol. Hydromech. 2009, 57, 226–249. [Google Scholar] [CrossRef]
- Faško, P.; Pecho, J.; Mikulová, K.; Nejedlik, P. Trends of selected characteristics of precipitation in the northern Carpathians in the light of water supply for agriculture. In Impact of Climate Change and Adaptation in Agriculture. Extended Abstracts of the International Symposium. Vienne, Austria, 2009; Eitzinger, J., Kubu, G.H., Eds.; BOKU-Met Report 17; University of Natural Resources and Applied Life Sciences: Vienna, Austria, 2009; pp. 106–109, ISSN 1994-4179 (print), ISSN 1994-4187; Available online: http://www.boku.ac.at/met/report (accessed on 15 November 2017).
- Pekárová, P.; Onderka, M.; Pekár, J.; Rončák, P.; Miklánek, P. Prediction of water quality in the Danube River under extreme hydrological and temperature conditions. J. Hydrol. Hydromech. 2009, 1, 3–15. [Google Scholar] [CrossRef]
- Portela, M.M.; Zeleňáková, M.; Santos, J.F.; Purcz, P.; Silva, A.T.; Hlavatá, H. Drought analysis in Slovakia: regionalization, frequency analysis and precipitation thresholds. In Proceedings of the 8th International Conference on River Basin Management, Coruña, Spain, 17–19 June 2015; Brebbia, C.A., Ed.; Wessex Institute: New Forest, UK, 2015; pp. 3–14. [Google Scholar]
- Bara, M.; Gaál, L.; Kohnová, S.; Szolgay, J.; Hlavčová, K. On the use of the simple scaling of heavy rainfall in a regional estimation of IDF curves in Slovakia. J. Hydrol. Hydromech. 2010, 1, 49–63. [Google Scholar] [CrossRef]
- Büngten, U.; Brázdil, R.; Frank, D.; Esper, J. Three centuries of Slovakia drought dynamics. Clim. Dyn. 2013, 315–329. [Google Scholar] [CrossRef]
- Zeleňáková, M.; Vido, J.; Portela, M.M.; Purcz, P.; Blišťan, P.; Hlavatá, H.; Hluštík, P. Precipitation Trends over Slovakia in the Period 1981–2013. Water 2017, 9, 922. [Google Scholar] [CrossRef]
- Fendeková, M.; Pekárová, P.; Fendek, M.; Pekár, J.; Škoda, P. Global drivers effect in multi-annual variability of runoff. J. Hydrol. Hydromech. 2014, 62, 169–176. [Google Scholar] [CrossRef] [Green Version]
- Vido, J.; Tadesse, T.; Šustek, Z.; Kandrík, R.; Hanzelová, M.; Škvarenina, J.; Hayes, M. Drought occurrence in central european mountainous region (Tatra National Park, Slovakia) within the period 1961–2010. Adv. Meteorol. 2015, 2015, 248728. [Google Scholar] [CrossRef]
- Jiang, T.; Su, B.; Hartmann, H. Temporal and spatial trends of precipitation and river flow in the Yangtze River Basin, 1961–2000. Geomorphology 2007, 85, 143–154. [Google Scholar] [CrossRef]
- Yan, T.; Shen, Z.; Bai, J. Spatial and Temporal Changes in Temperature, Precipitation, and Streamflow in the Miyun Reservoir Basin of China. Water 2017, 9, 78. [Google Scholar] [CrossRef]
- Xu, Z.; Liu, Z.; Fu, G.; Chen, Y. Trends of major hydroclimatic variables in the Tarim River basin during the past 50 years. J. Arid Environ. 2010, 74, 256–267. [Google Scholar] [CrossRef]
- Tao, H.; Gemmer, M.; Bai, Y.; Su, B.; Mao, W. Trends of streamflow in the Tarim River basin during the past 50 years: Human impact or climate change? J. Hydrol. 2011, 400, 1–9. [Google Scholar] [CrossRef]
- Liu, Q.; Yang, Z.; Cui, B. Spatial and temporal variability of annual precipitation during 1961–2006 in Yellow River basin, China. J. Hydrol. 2008, 361, 330–338. [Google Scholar] [CrossRef]
- Singh, P.; Kumar, V.; Thomas, T.; Arora, M. Changes in rainfall and relative humidity in river basins in northwest and central India. Hydrol. Process. 2008, 22, 2982–2992. [Google Scholar] [CrossRef]
- Krishnakumar, K.N.; Rao, G.P.; Gopakumar, C.S. Rainfall trends in twentieth century over Kerala, India. Atmos. Environ. 2009, 43, 1940–1944. [Google Scholar] [CrossRef]
- Jain, S.K.; Kumar, V.; Sahariad, M. Analysis of rainfall and temperature trends in northeast India. Int. J. Climatol. 2012, 33, 968–978. [Google Scholar] [CrossRef] [Green Version]
- Modarres, R.; Silva, V.P.R. Rianfall trends in arid and semi-arid regions of Iran. J. Arid Environ. 2007, 70, 344–355. [Google Scholar] [CrossRef]
- Tabari, H.; Somee, B.S.; Zadeh, M.R. Testing for long-term trends in climatic variables in Iran. Atmos. Res. 2011, 100, 132–140. [Google Scholar] [CrossRef]
- Tabari, H.; Talaee, P.H. Temporal variability of precipitation over Iran: 1966–2005. J. Hydrol. 2011, 396, 313–320. [Google Scholar] [CrossRef]
- Partal, T.; Kahya, E. Trend analysis in Turkish precipitation data. Hydrol. Process. 2006, 20, 2011–2026. [Google Scholar] [CrossRef]
- Chingombe, W.; Gutierrez, J.E.; Pedzisai, E.; Siziba, E. A Study of Hydrological Trends and Variability of upper Mazowe Catchment—Zimbabwe. 2005. Available online: https://www.researchgate.net/profile/Wisemen_Chingombe/publication/228849728_A_study_of_hydrological_trends_and_variability_of_Upper_Mazowe_catchment-Zimbabwe/links/0deec52690bdff229f000000/A-study-of-hydrological-trends-and-variability-of-Upper-Mazowe-catchment-Zimbabwe.pdf?origin=publication_detail (accessed on 12 March 2016).
- Kampata, J.M.; Parida, B.P.; Moalafhi, D.B. Trend analysis of rainfall in the headstreams of the Zambezi River basin in Zambia. Phys. Chem. Earth 2008, 33, 621–625. [Google Scholar] [CrossRef]
- Mosase, E.; Ahiablame, L. Rainfall and Temperature in the Limpopo River Basin, Southern Africa: Means, Variations, and Trends from 1979 to 2013. Water 2018, 10, 364. [Google Scholar] [CrossRef]
- Pauling, A.; Paeth, H. On the variability of return periods of European winter precipitation extremes over the last five centuries. Clim. Past Discuss. 2006, 2, 157–189. [Google Scholar] [CrossRef]
- Lopez-Moreno, J.; Vicente-Serrano, S.; Gimeno, L.; Nieto, R. Stability of the seasonal distribution of precipitation in the Mediterranean region: Observations since 1950 and projections for the 21st century. Geophys. Res. Lett. 2009, 36, 10703. [Google Scholar] [CrossRef]
- Sousa, P.M.; Trigo, R.M.; Aizpurua, P.; Nieto, R.; Gimeno, L.; Garcia-Herrera, R. Trends and extremes of drought indices throughout the 20th century in the Mediterranean. Nat. Hazards Earth Syst. Sci. 2011, 11, 33–51. [Google Scholar] [CrossRef] [Green Version]
- El Kenawy, A.M.; López-Moreno, J.I.; Vincente-Serrano, S.M.; Mekld, M.S. Temperature trends in Lybia over the second half of the 20th century. Theor. Appl. Climatol. 2009, 98, 1–8. [Google Scholar] [CrossRef]
- Zeleňáková, M.; Purcz, P.; Gargar, I.A.K. Evaluation of hydrological series in Libya. In Proceedings of the 13th International Multidisciplinary Scientific Geoconference: Water Resources, Forest, Marine and Ocean Ecosystems, Albena, Bulgaria, 16–22 June 2013; STEF92 Technology: Albena, Bulgaria, 2013; pp. 125–132. [Google Scholar]
- Ceppi, P.; Scherrer, S.C.; Fischer, A.M.; Appenzeller, C. Revisiting Swiss temperature trends 1959–2008. Int. J. Climatol. 2012, 32, 203–213. [Google Scholar] [CrossRef]
- Tomozeiu, R.; Busuioc, A.; Marletto, V.; Zinoni, F.; Cacciamani, C. Detection of changes in the summer precipitation time series of the region Emilia-Romagna, Italy. Theor. Appl. Climatol. 2000, 67, 193–200. [Google Scholar] [CrossRef]
- Buffoni, L.; Maugeri, M.; Nanni, T. Precipitation in Italy from 1833 to 1996. Theor. Appl. Climatol. 1999, 33–40. [Google Scholar] [CrossRef]
- Karpouzos, D.K.; Kavalieratou, S.; Babajimopoulos, C. Trend analysis of precipitation data in Pieria region (Greece). Eur. Water 2010, 30, 31–40. [Google Scholar]
- Tişcovschi, A.; Diaconu, D.C.; Tudose, C. Changes Recorded in Romania’s climate. In Proceedings of the 11-th International Multidisciplinary Scientific Geoconferance SGEM 2011, Albena, Bulgaria, 19–25 June 2011; STEF92 Technology: Albena, Bulgaria; Volume 2, pp. 1179–2704. [Google Scholar]
- Gocic, M.; Trajkovic, S. Analysis of changes in meteorological variables using Mann-Kendall and Sen’s slope estimator statistical tests in Serbia. Global Planet. Chang. 2013, 172–182. [Google Scholar] [CrossRef]
- Sayemuzzaman, M.; Jha, M.K. Seasonal and annual precipitation time series trend analysis in North Carolina, United States. Atmos. Res. 2014, 137, 183–194. [Google Scholar] [CrossRef]
- Sayemuzzaman, M.; Jha, M.K.; Mekonnen, A.; Schimmel, K.A. Subseasonal climate variability for North Carolina, United States. Atmos. Res. 2014, 145–146, 69–79. [Google Scholar] [CrossRef]
- Alexander, L.V.; Zhang, X.; Peterson, T.C.; Caesar, J.; Gleason, B. Global observed changes in daily climate extremes of temperature and precipitation. J. Geophys. Res. 2006, 111, D05109. [Google Scholar] [CrossRef] [Green Version]
- Zeleňáková, M. Preliminary flood risk assessment in the Hornád watershed. In River Basin Management 5; Wessex Institute of Technology: Southampton, UK, 2009; pp. 15–24. [Google Scholar]
- Zeleňáková, M.; Gaňová, L. Integrating multicriteria analysis with geographical information system for evaluation flood vulnerable areas. In Proceedings of the 11-th International Multidisciplinary Scientific Geoconferance SGEM 2011, Albena, Bulgaria, 19–25 June 2011; STEF92 Technology: Albena, Bulgaria, 2011; pp. 433–440. [Google Scholar]
- Burn, D.H.; Hag Elnur, M.A. Detection of hydrologic trends and variability. J. Hydrol. 2002, 255, 107–122. [Google Scholar] [CrossRef]
- Mann, H.B. Non-parametric tests against trend. Econometrica 1945, 13, 245–259. [Google Scholar] [CrossRef]
- Kendall, M.G. Rank Correlation Measures; Charles Griffin: London, UK, 1975. [Google Scholar]
- Cunderlik, J.M.; Burn, D.H. Local and regional trends in monthly maximum flows in Southern British Columbia. Can. Water Resour. J. 2002, 27, 191–212. [Google Scholar] [CrossRef]
- von Storch, H. Misuses of statistical analysis in climate research. In Analysis of Climate Variability Applications of Statistical Techniques; von Storch, H., Navarra, A., Eds.; Springer: Berlin/Heidelberg, Germany, 1995; pp. 11–26. [Google Scholar]
- Khaliq, M.N.; Ouarda, T.B.M.J.; Gachon, P.; Sushama, L.; St-Hilaire, A. Identification of hydrological trends in the presence of serial and cross correlations: A review of selected methods and their application to annual flow regimes of Canadian rivers. J. Hydrol. 2009, 368, 117–130. [Google Scholar] [CrossRef]
- Yue, S.; Wang, C.Y. Applicability of prewhitening to eliminate the influence of serial correlation on the Mann–Kendall test. Water Resour. Res. 2002, 38, 41–47. [Google Scholar] [CrossRef]
- Sen, P.K. Estimates of the regression coefficient based on Kendall’s tau. J. Am. Stat. Assoc. 1968, 63, 1379–1389. [Google Scholar] [CrossRef]
- Theil, H. A rank-invariant method of linear and polynomial regression analysis. In Henri Theil’s Contributions to Economics and Econometrics; I, II, III; Springer: Dordrecht, The Netherlands, 1992; pp. 345–381. [Google Scholar]
- Lettenmaier, D.P.; Wood, E.F.; Wallis, J.R. Hydro-climato-logical trends in the continental United States, 1948–88. J. Clim. 1994, 7, 586–607. [Google Scholar] [CrossRef]
- Bayazit, M.; Önöz, B. To prewhiten or not to prewhiten in trend analysis? Hydrol. Sci. J. 2007, 52, 611–624. [Google Scholar] [CrossRef] [Green Version]
- Haktanir, T.; Citakoglu, H. Closure to “Trend, Independence, Stationarity, and Homogeneity Tests on Maximum Rainfall Series of Standard Durations Recorded in Turkey”. J. Hydrol. Eng. 2015, 20, 07015017. [Google Scholar] [CrossRef]
- Sen, Z. Innovative trend analysis methodology. J. Hydrol. Eng. 2012, 17, 1042–1046. [Google Scholar] [CrossRef]
- Sen, Z. Trend identification simulation and application. J. Hydrol. Eng. 2013. [Google Scholar] [CrossRef]
- Sen, Z. Square diagonal trend test procedure. In Proceedings of the 6th International Perspective on Water Resources & The Environment (IPWE), Izmir, Turkey, 7–9 January 2013. [Google Scholar]
- Clark, I. Practical Geostatistics; Applied Science Publishers: London, UK, 1979. [Google Scholar]
- Modarres, R.; Sarhadi, A. Rainfall trends analysis of Iran in the last half of the twentieth century. J. Geophys. Res. 2009, 114. [Google Scholar] [CrossRef] [Green Version]
- Sonali, P.; Nagesh, K.D. Review of trend detection methods and their application to detect temperature changes in India. J. Hydrol. 2013, 476, 212–227. [Google Scholar] [CrossRef]
- SHMI (Slovak Hydrometeorologic Institute). Climate Atlas of Slovakia; Slovak Hydrometeorologic Institute: Banská Bystrica, Slovakia, 2015; 228p. [Google Scholar]
- Halmová, D.; Pekárová, P.; Olbrimek, J.; Miklánek, P.; Pekár, J. Precipitation regime and temporal changes in the Central Danubian lowland region. Adv. Meteorol. 2015, 2015, 1–12. [Google Scholar] [CrossRef]
- Kohnová, S.; Lapin, M.; Szolgay, J.; Gaál, L. Methodology for the selection of 10-day maximum precipitation totals and their statistical analysis in the upper Hron region. Contrib. Geophys. Geod. 2005, 35, 281–298. [Google Scholar]
- Gaál, L.; Kyselý, J.; Szolgay, J. Region-of-influence approach to a frequency analysis of heavy precipitation in Slovakia. Hydrol. Earth Syst. Sci. 2008, 12, 825–839. [Google Scholar] [CrossRef]
- Szolgay, J.; Parajka, J.; Kohnová, S.; Hlavčová, K. Comparison of mapping approaches of design annual maximum daily precipitation. Atmos. Res. 2009, 92, 289–307. [Google Scholar] [CrossRef]
- Zeleňáková, M.; Portela, M.M.; Purcz, P.; Blišťan, P.; Silva, A.T.; Hlavatá, H.; Santos, J.F. Seasonal and spatial investigation of trends in precipitation in Slovakia. Eur. Water 2015, 52, 35–42. [Google Scholar]
- Lapin, M.; Faško, P. Precipitation and changes of the atmospheric circulation in the period 1874–1993 in Slovakia. Meteorologické Zprávy 1996, 49, 1–11. [Google Scholar]
- Labudová, L.; Šťastný, P.; Trizna, M. The north atlantic oscillation and winter precipitation totals in Slovakia. Morav. Geogr. Rep. 2013, 21, 38–49. [Google Scholar] [Green Version]
- Labudová, L.; Faško, P.; Ivaňáková, G. Changes in climate and changing climate regions in Slovakia. Morav. Geogr. Rep. 2015, 23, 71–82. [Google Scholar] [CrossRef] [Green Version]
- Lapin, M.; Damborská, I.; Melo, M. Downscaling of GCM outputs for precipitation time series in Slovakia. Met. J. 2001, 4, 29–40. [Google Scholar]
- Parajka, J.; Kohnová, S.; Merz, R.; Szolgay, J.; Hlavčová, K.; Blöschl, G. Comparative analysis of the seasonality of hydrological characteristics in Slovakia and Austria. Hydrolog. Sci. J. 2009, 54, 456–473. [Google Scholar] [CrossRef]
- Gaál, L. Introduction of Lapin’s indices into the cluster analysis of maximum k-day precipitation totals in Slovakia. Met. J. 2005, 8, 85–94. [Google Scholar]
- Kriegerová, I.; Kohnová, S. Seasonality analysis of flood occurrence in mid-sized catchments in Slovakia. J. Hydrol. Hydromech. 2005, 53, 154–163. [Google Scholar]
- Blahušiaková, A.; Matoušková, M. Rainfall and runoff regime trends in mountain catchments. Case study area: The upper Hron River basin, Slovakia. J. Hydrol. Hydromech. 2015, 63, 183–192. [Google Scholar] [CrossRef]
- Radinović, D.; Ćurić, M. Some evidence on European monsoon existence. Theor. Appl. Climatol. 2012, 110, 11–15. [Google Scholar] [CrossRef]
- Konček, M. Klima Tatier (Climate of Tatry Mountains); Vydavateľstvo Slovenskej Akadémie Vied: Bratislava, Slovakia, 1974. (In Slovak) [Google Scholar]
Figure 1.
Study area.

Figure 2.
Illustration of decreasing, increasing and trendless regions [58].
Figure 2.
Illustration of decreasing, increasing and trendless regions [58].

Figure 3.
Precipitation of Košice and Skalnaté Pleso stations by the Sen trend test.

Figure 4.
Spatial distribution of precipitation trends.


Figure 5.
Temperature at Košice and Skalnaté Pleso stations by the Sen trend test.

Figure 6.
Spatial distribution of temperature trends.


Figure 7.
Forward and backward series of the SQMK test on the precipitation data series.

Figure 8.
Forward and backward series of the SQMK test on the temperature data series.

Figure 9.
Number of wet/dry spells in climatic stations.


Table 1.
Geographical location of climatic stations.
| Name | Latitude | Longitude | Altitude m asl. | ||||
|---|---|---|---|---|---|---|---|
| Lomnický štít | 49° | 11′ | 43′′ | 20 | 12′ | 54′′ | 2635 |
| Skalnaté Pleso | 49° | 11′ | 22′′ | 20 | 14′ | 09′′ | 1778 |
| Štrbské Pleso | 49° | 07′ | 10′′ | 20 | 03′ | 48′′ | 1322 |
| Poprad | 49° | 04′ | 08′′ | 20 | 14′ | 44′′ | 694 |
| Švedlár | 48° | 48′ | 38′′ | 20 | 42′ | 32′′ | 477 |
| Moldava nad Bodvou | 48° | 36′ | 10′′ | 20 | 59′ | 56′′ | 204 |
| Červený Kláštor | 49° | 23′ | 14′′ | 20 | 25′ | 27′′ | 469 |
| Plaveč nad Popradom | 49° | 15′ | 35′′ | 20 | 50′ | 45′′ | 485 |
| Bardejov | 49° | 17′ | 22′′ | 21 | 16′ | 26′′ | 312 |
| Čaklov | 48° | 54′ | 09′′ | 21 | 37′ | 52′′ | 138 |
| Košice, letisko | 48° | 40′ | 20′′ | 21 | 13′ | 21′′ | 230 |
| Medzilaborce | 49° | 15′ | 12′′ | 21 | 54′ | 50′′ | 305 |
| Milhostov | 48° | 39′ | 47′′ | 21 | 43′ | 26′′ | 105 |
| Somotor | 48° | 25′ | 17′′ | 21 | 49′ | 06′′ | 100 |
| Michalovce | 48° | 44′ | 24′′ | 21 | 56′ | 43′′ | 110 |
| Kamenica nad Cirochou | 48° | 56′ | 20′′ | 22 | 00′ | 22′′ | 176 |
Table 2.
Annual and seasonal precipitation trends in climatic stations.
| Climatic Station | Annual | Period | Season | ||||
|---|---|---|---|---|---|---|---|
| XI–X | XI–IV | V–X | XI–I | II–IV | V–VII | VIII–X | |
| Lomnický peak | 0.0127 | 0.2745 | 0.1284 | 0.4871 | 0.6000 | 0.3678 | 0.1188 |
| Skalnaté Pleso | −0.0050 | 0.0470 | 0.0161 | 0.0500 | 0.1333 | 0.0965 | −0.0400 |
| Štrbské Pleso | −0.0022 | 0.0314 | 0.0349 | 0.0512 | 0.0729 | 0.1526 | 0.0135 |
| Poprad | 0.1009 | −0.0015 | 0.0325 | −0.0227 | 0.0159 | 0.1464 | 0.0178 |
| Švedlár | 0.0079 | 0.0000 | 0.0662 | 0.0149 | −0.0176 | 0.2100 | 0.0878 |
| Moldava nad Bodvou | 0.0000 | −0.0077 | −0.0064 | −0.0144 | −0.0258 | 0.0637 | −0.0560 |
| Červený Kláštor | −0.0028 | 0.0038 | 0.0683 | −0.0284 | 0.0479 | 0.2063 | 0.0524 |
| Plaveč nad Popradom | 0.0133 | 0.0056 | 0.0619 | −0.0146 | 0.0412 | 0.2667 | 0.0333 |
| Bardejov | 0.0067 | 0.0017 | 0.0214 | 0.0011 | 0.0060 | 0.1462 | −0.0226 |
| Čaklov | 0.0205 | 0.0047 | 0.0196 | 0.0264 | −0.0036 | 0.0821 | 0.0000 |
| Košice. airport | 0.0049 | −0.0065 | −0.0050 | 0.0023 | −0.0290 | 0.0702 | −0.0635 |
| Medzilaborce | 0.0167 | 0.0131 | 0.0185 | 0.0185 | 0.0386 | 0.1380 | −0.0432 |
| Milhostov | 0.0039 | −0.0088 | 0.0126 | −0.0102 | −0.0222 | 0.0483 | 0.0139 |
| Somotor | 0.0069 | 0.0073 | 0.0071 | 0.0165 | 0.0185 | 0.0333 | 0.0077 |
| Michalovce | 0.0139 | 0.0135 | 0.0144 | 0.0408 | 0.0154 | 0.0500 | 0.0186 |
| Kamenica nad Cirochou | 0.0057 | −0.0119 | −0.0050 | −0.0102 | −0.0362 | 0.0286 | −0.0148 |
Table 3.
Monthly precipitation trends in climatic stations.
| Climatic Station | Month | |||||||||||
|---|---|---|---|---|---|---|---|---|---|---|---|---|
| XI | XII | I | II | III | IV | V | VI | VII | VIII | IX | X | |
| Lomnický peak | 1.20 | 1.15 | 2.21 | 2.01 | 2.15 | 1.45 | 1.31 | 0.62 | 1.43 | 0.13 | 0.25 | 0.49 |
| Skalnaté Pleso | 0.01 | −0.08 | 0.61 | 0.46 | 0.62 | 0.09 | 0.43 | −0.15 | 0.60 | −0.60 | −0.09 | 0.27 |
| Štrbské Pleso | −0.02 | −0.06 | 0.51 | 0.05 | 0.53 | 0.11 | 0.15 | 0.29 | 1.11 | −0.10 | 0.00 | 0.33 |
| Poprad | −0.27 | −0.04 | 0.08 | 0.05 | 0.14 | −0.08 | 0.24 | 0.01 | 1.09 | −0.14 | −0.05 | 0.29 |
| Švedlár | −0.08 | 0.09 | 0.11 | −0.10 | −0.10 | −0.10 | 0.40 | 0.53 | 0.94 | 0.28 | 0.27 | 0.42 |
| Moldava nad Bodvou | −0.30 | 0.02 | 0.11 | −0.07 | −0.25 | 0.06 | −0.02 | 0.08 | 0.42 | −0.47 | −0.23 | 0.21 |
| Červený Kláštor | −0.04 | −0.13 | 0.03 | 0.17 | 0.30 | 0.00 | 0.39 | 0.42 | 1.16 | 0.03 | 0.35 | 0.30 |
| Plaveč nad Popradom | −0.10 | −0.09 | 0.11 | 0.20 | 0.22 | −0.03 | 0.68 | 0.67 | 1.13 | −0.40 | 0.22 | 0.29 |
| Bardejov | −0.18 | −0.13 | 0.28 | 0.11 | 0.03 | −0.17 | 0.46 | 0.32 | 0.80 | −0.36 | 0.05 | 0.13 |
| Čaklov | −0.19 | 0.15 | 0.18 | 0.12 | −0.07 | −0.15 | 0.25 | 0.16 | 0.37 | −0.43 | 0.21 | 0.18 |
| Košice. airport | −0.34 | 0.15 | 0.06 | −0.03 | −0.25 | 0.08 | 0.11 | 0.18 | 0.24 | −0.49 | −0.13 | 0.07 |
| Medzilaborce | −0.03 | −0.13 | 0.29 | 0.26 | 0.16 | −0.23 | 0.60 | 0.17 | 0.46 | −0.69 | 0.17 | 0.02 |
| Milhostov | −0.18 | 0.04 | 0.00 | −0.04 | −0.15 | −0.06 | 0.23 | −0.02 | 0.25 | −0.23 | 0.18 | 0.11 |
| Somotor | −0.14 | 0.20 | 0.12 | 0.16 | −0.10 | 0.11 | 0.16 | −0.12 | 0.26 | −0.60 | 0.32 | 0.15 |
| Michalovce | −0.19 | 0.19 | 0.26 | 0.18 | −0.16 | 0.06 | 0.28 | 0.15 | 0.13 | −0.19 | 0.22 | 0.01 |
| Kamenica nad Cirochou | −0.11 | −0.11 | 0.09 | 0.00 | −0.27 | −0.10 | 0.21 | −0.17 | 0.71 | −0.55 | 0.18 | 0.10 |
Table 4.
Annual and seasonal temperature trends in climatic stations.
| Climatic Station | Annual | Period | Season | ||||
|---|---|---|---|---|---|---|---|
| XI–X | XI–IV | V–X | XI–I | II–IV | V–VII | VIII–X | |
| Lomnický peak | 0.0009 | 0.0041 | 0.0054 | 0.0084 | 0.0084 | 0.0138 | 0.0075 |
| Skalnaté Pleso | 0.0034 | 0.0051 | 0.0055 | 0.0104 | 0.0104 | 0.0139 | 0.0077 |
| Štrbské Pleso | 0.0039 | 0.0009 | 0.0021 | 0.0016 | 0.0021 | 0.0075 | 0.0002 |
| Poprad | 0.0029 | 0.0055 | 0.0053 | 0.0086 | 0.0140 | 0.0128 | 0.0079 |
| Švedlár | 0.0036 | 0.0061 | 0.0044 | 0.0119 | 0.0129 | 0.0109 | 0.0067 |
| Moldava nad Bodvou | 0.0031 | 0.0056 | 0.0052 | 0.0100 | 0.0132 | 0.0118 | 0.0077 |
| Červený Kláštor | 0.0032 | 0.0027 | −0.0002 | 0.0051 | 0.0042 | 0.0008 | −0.0011 |
| Plaveč nad Popradom | 0.0020 | 0.0041 | 0.0022 | 0.0077 | 0.0081 | 0.0060 | 0.0019 |
| Bardejov | 0.0032 | 0.0063 | 0.0051 | 0.0111 | 0.0137 | 0.0130 | 0.0062 |
| Čaklov | 0.0031 | 0.0056 | 0.0058 | 0.0099 | 0.0130 | 0.0136 | 0.0087 |
| Košice. airport | 0.0026 | 0.0068 | 0.0067 | 0.0117 | 0.0169 | 0.0152 | 0.0106 |
| Medzilaborce | 0.0013 | 0.0061 | 0.0060 | 0.0121 | 0.0121 | 0.0144 | 0.0094 |
| Milhostov | 0.0033 | 0.0055 | 0.0047 | 0.0103 | 0.0121 | 0.0109 | 0.0072 |
| Somotor | 0.0036 | 0.0053 | 0.0034 | 0.0092 | 0.0119 | 0.0087 | 0.0041 |
| Michalovce | 0.0031 | 0.0062 | 0.0060 | 0.0108 | 0.0142 | 0.0141 | 0.0094 |
| Kamenica nad Cirochou | 0.0034 | 0.0059 | 0.0056 | 0.0111 | 0.0128 | 0.0129 | 0.0087 |
Table 5.
Monthly temperature trends in climatic stations.
| Climatic Station | Month | |||||||||||
|---|---|---|---|---|---|---|---|---|---|---|---|---|
| XI | XII | I | II | III | IV | V | VI | VII | VIII | IX | X | |
| Lomnický peak | 0.03 | 0.03 | 0.03 | 0.02 | 0.01 | 0.05 | 0.03 | 0.04 | 0.05 | 0.05 | 0.00 | 0.02 |
| Skalnaté Pleso | 0.04 | 0.04 | 0.03 | 0.02 | 0.02 | 0.05 | 0.03 | 0.04 | 0.05 | 0.05 | 0.00 | 0.02 |
| Štrbské Pleso | 0.01 | 0.01 | 0.01 | −0.01 | 0.00 | 0.02 | 0.02 | 0.02 | 0.03 | 0.03 | −0.02 | −0.01 |
| Poprad | 0.02 | 0.03 | 0.04 | 0.03 | 0.03 | 0.05 | 0.03 | 0.04 | 0.04 | 0.05 | 0.00 | 0.02 |
| Švedlár | 0.02 | 0.03 | 0.07 | 0.03 | 0.03 | 0.04 | 0.02 | 0.03 | 0.04 | 0.04 | 0.00 | 0.02 |
| Moldava nad Bodvou | 0.02 | 0.02 | 0.06 | 0.02 | 0.03 | 0.05 | 0.02 | 0.03 | 0.04 | 0.06 | 0.01 | 0.03 |
| Červený Kláštor | −0.01 | 0.02 | 0.05 | 0.02 | 0.00 | 0.01 | −0.01 | 0.00 | 0.02 | 0.02 | −0.02 | 0.00 |
| Plaveč nad Popradom | 0.01 | 0.02 | 0.05 | 0.02 | 0.02 | 0.02 | 0.01 | 0.01 | 0.03 | 0.04 | −0.01 | 0.00 |
| Bardejov | 0.01 | 0.03 | 0.07 | 0.03 | 0.04 | 0.04 | 0.02 | 0.03 | 0.04 | 0.04 | 0.01 | 0.01 |
| Čaklov | 0.02 | 0.02 | 0.06 | 0.02 | 0.03 | 0.04 | 0.03 | 0.04 | 0.04 | 0.06 | 0.01 | 0.02 |
| Košice. airport | 0.02 | 0.03 | 0.06 | 0.03 | 0.04 | 0.06 | 0.03 | 0.04 | 0.05 | 0.06 | 0.02 | 0.03 |
| Medzilaborce | 0.02 | 0.03 | 0.08 | 0.03 | 0.02 | 0.04 | 0.03 | 0.04 | 0.05 | 0.05 | 0.02 | 0.02 |
| Milhostov | 0.01 | 0.02 | 0.06 | 0.02 | 0.03 | 0.04 | 0.02 | 0.03 | 0.04 | 0.05 | 0.00 | 0.02 |
| Somotor | 0.01 | 0.02 | 0.06 | 0.02 | 0.03 | 0.04 | 0.01 | 0.03 | 0.03 | 0.04 | 0.00 | 0.01 |
| Michalovce | 0.02 | 0.03 | 0.06 | 0.02 | 0.03 | 0.05 | 0.03 | 0.04 | 0.05 | 0.06 | 0.01 | 0.02 |
| Kamenica nad Cirochou | 0.01 | 0.03 | 0.07 | 0.03 | 0.03 | 0.04 | 0.03 | 0.04 | 0.05 | 0.05 | 0.01 | 0.02 |
Table 6.
Values of Z statistics of the MK test at 95% confidence level.
| Climatic Station | Precipitation | Temperatures |
|---|---|---|
| Z | Z | |
| Lomnický peak | 7.4528 | 2.1659 |
| Skalnaté Pleso | 1.4373 | 2.3483 |
| Štrbské Pleso | 1.6709 | 0.9096 |
| Poprad | 0.9808 | 2.0323 |
| Švedlár | 1.5292 | 1.9150 |
| Moldava nad Bodvou | −0.4058 | 1.8985 |
| Červený Kláštor | 1.5584 | 0.6053 |
| Plaveč nad Popradom | 1.7510 | 1.2286 |
| Bardejov | 0.6059 | 2.0373 |
| Čaklov | 0.7755 | 2.0267 |
| Košice, airport | −0.3156 | 2.3020 |
| Medzilaborce | 0.9998 | 2.1684 |
| Milhostov | −0.0342 | 1.8264 |
| Somotor | 0.7630 | 1.5701 |
| Michalovce | 1.0146 | 2.0997 |
| Kamenica nad Cirochou | −0.6484 | 2.0359 |
Table 7.
Values of Z statistics of the MK test at 95% confidence level for wet/dry spells.
| Climatic station | Wet Spell | Dry Spell | ||||
|---|---|---|---|---|---|---|
| ST | MT | LT | ST | MT | LT | |
| Lomnický peak | −1.40616 | 1.439961 | 3.861514 | 0.212801 | −0.63437 | −2.17443 |
| Skalnaté Pleso | −0.85377 | −0.58881 | 3.815625 | −0.08512 | −0.19148 | −2.51697 |
| Poprad | 0.492099 | 0.49676 | −0.89292 | 1.058699 | 1.460532 | −2.64276 |
| Švedlár | 0.885253 | −1.9031 | 1.660476 | −0.6261 | 0.479035 | 2.422128 |
| Červený Kláštor | −1.43642 | 5.37533 | 2.75 | 0.992001 | −2.07582 | −3.89798 |
| Plaveč nad Popradom | −2.21013 | 3.623996 | 6.317575 | 2.114101 | −3.64105 | −4.93915 |
| Bardejov | −0.86544 | 3.038411 | 3.453035 | −0.19097 | −0.16457 | −0.96217 |
| Košice airport | −1.28556 | −0.95732 | −0.75476 | −1.84577 | 2.702026 | −0.67993 |
| Medzilaborce | −3.63367 | 2.406793 | 2.98559 | −2.54505 | 1.429676 | −2.05879 |
| Milhostov | −0.51718 | 0.064145 | 0.679286 | −0.27924 | 0.757591 | 0.602961 |
| Somotor | −2.1426 | 2.886514 | 2.339761 | −1.07939 | 1.347286 | 0.351367 |
| Michalovce | −2.08379 | 1.70625 | 0.603809 | −1.78058 | −1.0594 | 1.860198 |
| Kamenica nad Cirochou | −1.29761 | −0.5773 | −0.75877 | −0.86544 | −0.4937 | 2.127417 |
© 2018 by the authors. Licensee MDPI, Basel, Switzerland. This article is an open access article distributed under the terms and conditions of the Creative Commons Attribution (CC BY) license (http://creativecommons.org/licenses/by/4.0/).
Share and Cite
MDPI and ACS Style
Zeleňáková, M.; Purcz, P.; Blišťan, P.; Vranayová, Z.; Hlavatá, H.; Diaconu, D.C.; Portela, M.M. Trends in Precipitation and Temperatures in Eastern Slovakia (1962–2014). Water 2018, 10, 727. https://doi.org/10.3390/w10060727
AMA Style
Zeleňáková M, Purcz P, Blišťan P, Vranayová Z, Hlavatá H, Diaconu DC, Portela MM. Trends in Precipitation and Temperatures in Eastern Slovakia (1962–2014). Water. 2018; 10(6):727. https://doi.org/10.3390/w10060727
Chicago/Turabian StyleZeleňáková, Martina, Pavol Purcz, Peter Blišťan, Zuzana Vranayová, Helena Hlavatá, Daniel Constantin Diaconu, and Maria Manuela Portela. 2018. "Trends in Precipitation and Temperatures in Eastern Slovakia (1962–2014)" Water 10, no. 6: 727. https://doi.org/10.3390/w10060727
Note that from the first issue of 2016, this journal uses article numbers instead of page numbers. See further details here.