Evaluation of the Climate Forecast System Reanalysis Weather Data for Watershed Modeling in Upper Awash Basin, Ethiopia


1
Smart City & Construction Engineering Department, University of Science and Technology (UST), Daejeon 34113, Korea
2
Department of Land, Water and Environment Research, Korea Institute of Civil Engineering and Building Technology (KICT), Goyang 10223, Korea
*
Author to whom correspondence should be addressed.
Water 2018, 10(6), 725; https://doi.org/10.3390/w10060725
Submission received: 19 March 2018
/
Revised: 31 May 2018
/
Accepted: 31 May 2018
/
Published: 3 June 2018
(This article belongs to the Special Issue Hydrological Modelling and Remote Sensing: Selected Papers from the 2017 and 2018 SWAT International Conferences)
Abstract
:Availability of reliable meteorological data for watershed modeling is one of the considerable challenges in the Awash River Basin in Ethiopia. To overcome this challenge, the Climate Forecast System Reanalysis (CFSR) global weather data was evaluated and compared with the limited conventional weather data available in the Upper Awash Basin. The main objective of this study was to search for an optional data source for hydrological modeling, instead of using the limited available data, and for data-scarce areas of the basin. The Soil and Water Assessment Tool model was used to compare the performance of the two weather datasets at simulating monthly streamflow. For calibration, validation, and uncertainty analysis, the sequential uncertainty fitting algorithm was used. The model evaluation statistics showed that the CFSR global weather data performed similarly to the conventional weather data for simulating the observed streamflow at Melka Kunture. At Keleta, where the conventional data is scarce, the CFSR performed better. The CFSR performance at the two sub-basins indicated that it performed better for the large sub-basin, Melka Kunture. Generally, the CFSR weather data are a good addition to the dataset for areas where no reliable weather data exists for hydrological modeling in the basin. The precipitation data of the CFSR are slightly higher than that of the conventional data, which also resulted in a relatively higher water balance components.
1. Introduction
The water resource supplied by the Awash River basin has significant economic, social, and ecological importance for Ethiopia. In the basin, surface and groundwater resources are used more than from other basins due to its natural location, high population density in the basin, and availability of suitable land for irrigation [1]. To sustainably use the basin’s water resources, understanding the hydrological processes in the basin and changes due to the variability in climatic and geophysical features is crucial, including topographic characteristics, soil, and land uses in the watershed. Water balance components of the watershed are affected by climate and the change in geophysical appearances due to human impact [2,3,4,5,6,7]. To examine the complex processes and the relationship between the hydrological processes and physical parameters, hydrological models help estimate the consequences of environmental and management changes on the water resources [8,9,10].
Reliable hydrological simulations are possible if the hydrological model is thoroughly calibrated and tested for the watershed under consideration [11,12,13]. These procedures strongly depend on the availability and quality of hydro-climatic data, which is the main challenge for most Ethiopian basins including the Awash River basin. Ethiopia is a large country that has few well-documented extended series of weather observations [8,14]. Although the availability of consistent climate data is vital for hydrological modeling, weather records are rarely complete. This has forced researchers to improve the available data using different statistical methods, including estimation to fill the missed data gaps, and/or to use radar data to obtain rainfall input data [15,16]. In addition, due to the distribution and distances of the meteorological gauging stations with respect to the watershed to be modeled, the existing data may not expressively represent the complexity of local climatic variability in the area [4].
As an additional option to address the gap in weather input data for hydrological modeling, testing of the Climate Forecast System Reanalysis (CFSR) [17] global high resolution freely available weather data set for a specific Ethiopian watershed is vital. Few studies on the Abay Basin in the Ethiopian context have examined or compared the correlation of CFSR data with the ground measured weather data, or evaluated the effect of precipitation data on river flow modeling. A study used the global CFSR weather dataset as an input for Soil and Water Assessment Tool (SWAT) model in a 1200 km2 watershed and suggested the CFSR data performed equivalently or even better than the conventional weather data [18]. Worqlul et al. [19] also evaluated the correlation of measured rainfall data from 38 meteorological stations in Lake Tana Basin with that of the CFSR dataset and found that the CFSR data performed better in elucidating the rainfall volume and pattern in the area. Another study by Dile and Srinivasan [20] assessed the applicability of CFSR data in the Lake Tana basin for hydrological simulation using SWAT and achieved satisfactory results in its simulation. They concluded that the CFSR could be a valuable option in data-scarce regions. A study of three small watersheds in the Blue Nile Basin by Roth and Lemann [21] assessed the use of CFSR global weather data to simulate discharge and soil loss using the SWAT model. They found very good streamflow simulation with the conventional weather data and unsatisfactory simulation with the CFSR weather data for all three watersheds. Generally, these previous studies supported the applicability of the CFSR global data for hydrological modeling in data-scare areas like the Abay Basin.
In the Upper Awash Basin, the availability of high-quality weather data is a considerable challenge for hydrological modeling. In most parts of the basin, the distribution of the available weather stations and the quality of the data are unreliable for simulation of the hydrological models [22]. The main objective of this study was to determine alternatives to the available limited data, or for hydrological modeling in data scarce areas of the basin. As an alternative solution to the ground-based conventional weather data, in this study, the CFSR global weather data was chosen and used as input data for the SWAT model to evaluate its applicability and performance in simulating the streamflow for two sub-basins in large- and medium-scale areas, Melka Kunture and Keleta, respectively, in the Upper Awash Basin. The two sub-basins were deliberately selected to represent areas having relatively high data distribution (the Melka Kunture sub-basin) and a data-scarce area (Keleta sub-basin), and also to represent different sized areas. The simulations results were compared with the results obtained using the limited available conventional meteorological data in and around the areas to simulate the observed streamflow at the Melka Kunture and Keleta rivers gauging stations. The water balance components at the two sub-basins were estimated and the calibrated model for the two datasets was also used for comparison.
2. Materials and Methods
2.1. Study Area
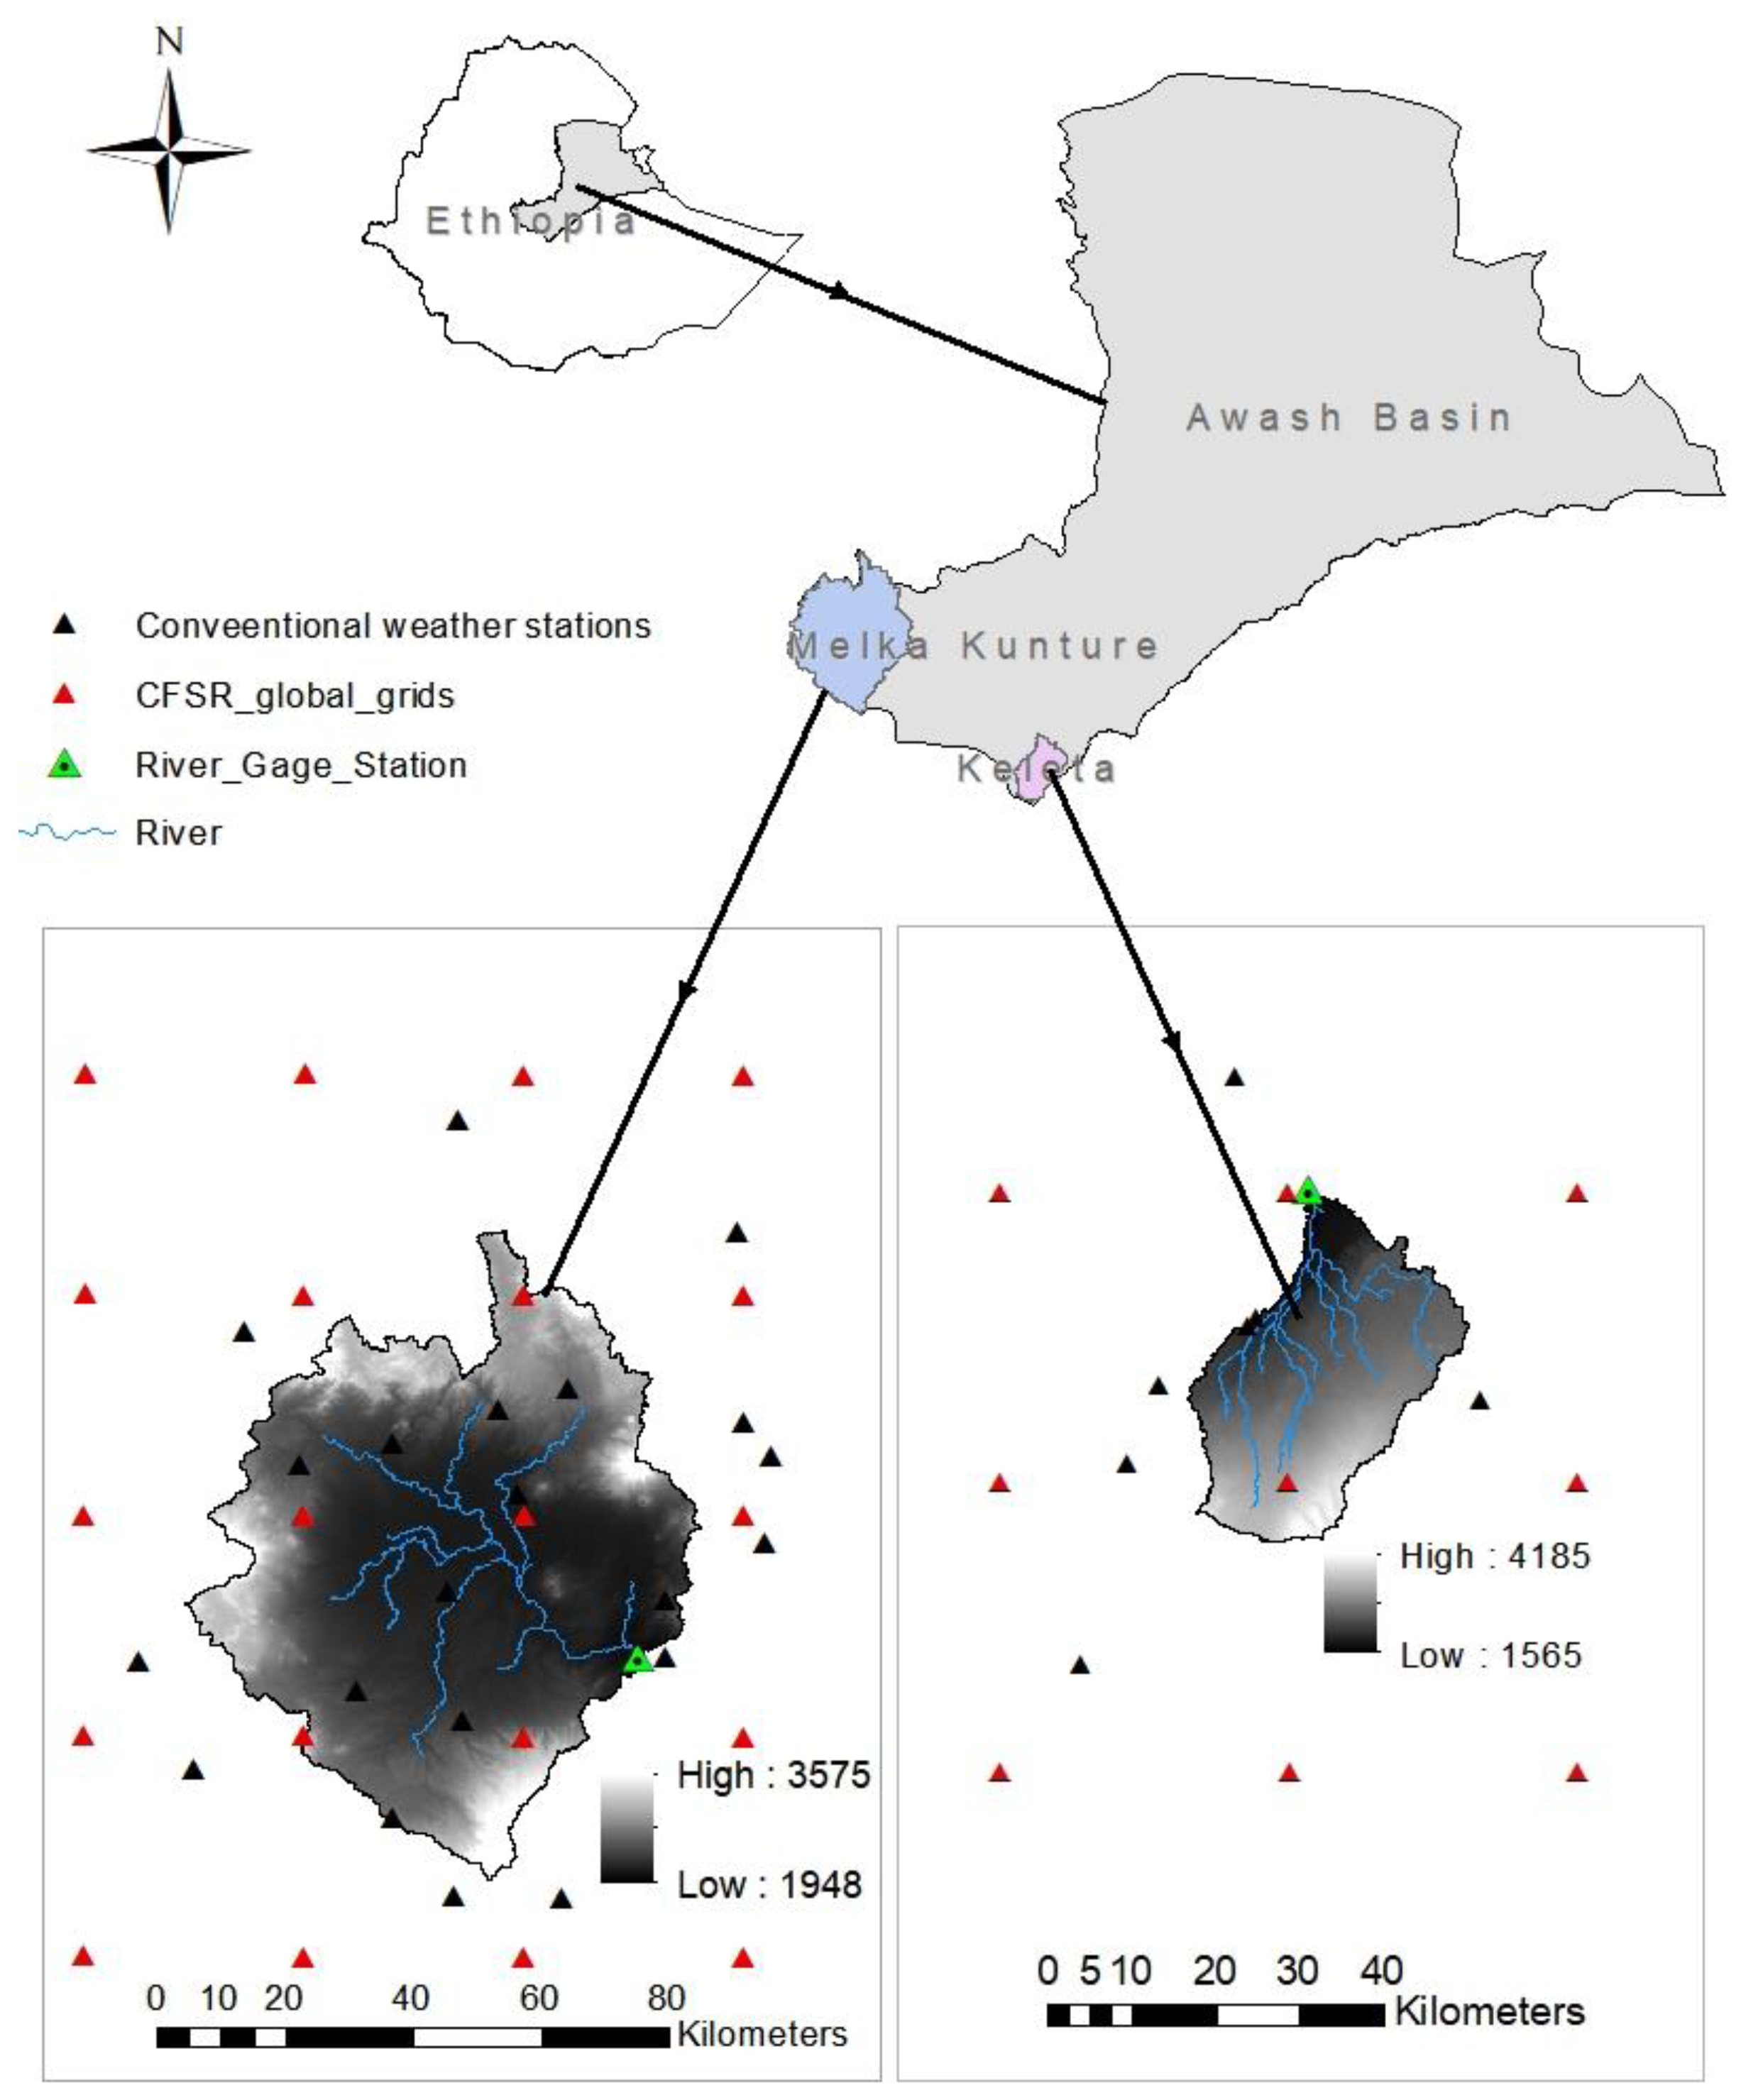
The two sub-basins considered for this study are located in Central Ethiopia at the upper Awash Basin between 8°23′09″ and 9°18′14″ latitude and 37°57′15″ and 38°41′08″ longitude (Figure 1).
The two study areas, Melka Kunture and Keleta, are sub-basins of the Awash Basin, which flows toward the east within the country. The Melka Kunture sub-basin is located in the part of the basin with relatively sufficient weather data, whereas the Keleta sub-basin is one of the data scarce areas. The Keleta catchment drains from the highlands of Arsi into the Awash main river. The uppermost part of the Awash Basin, above the Melka Kunture gauging station, hereafter called the “Melka Kunture sub-basin”, includes most of the western highlands of the basin including Ginchi and Holeta, where the Awash River originates. The catchment sizes above the Keleta and Melka Kunture river gauging stations are 765.3 and 4540.8 km2, respectively, which means the Melka Kunture sub-basin is about six times larger than the Keleta subbasin. Based on watershed classification for hydrological modeling [23], the Melka Kunture sub-basin can be classified as a large-scale watershed (>1000 km2), and the Keleta sub-basin is classified as a medium-scale watershed (100–1000 km2).
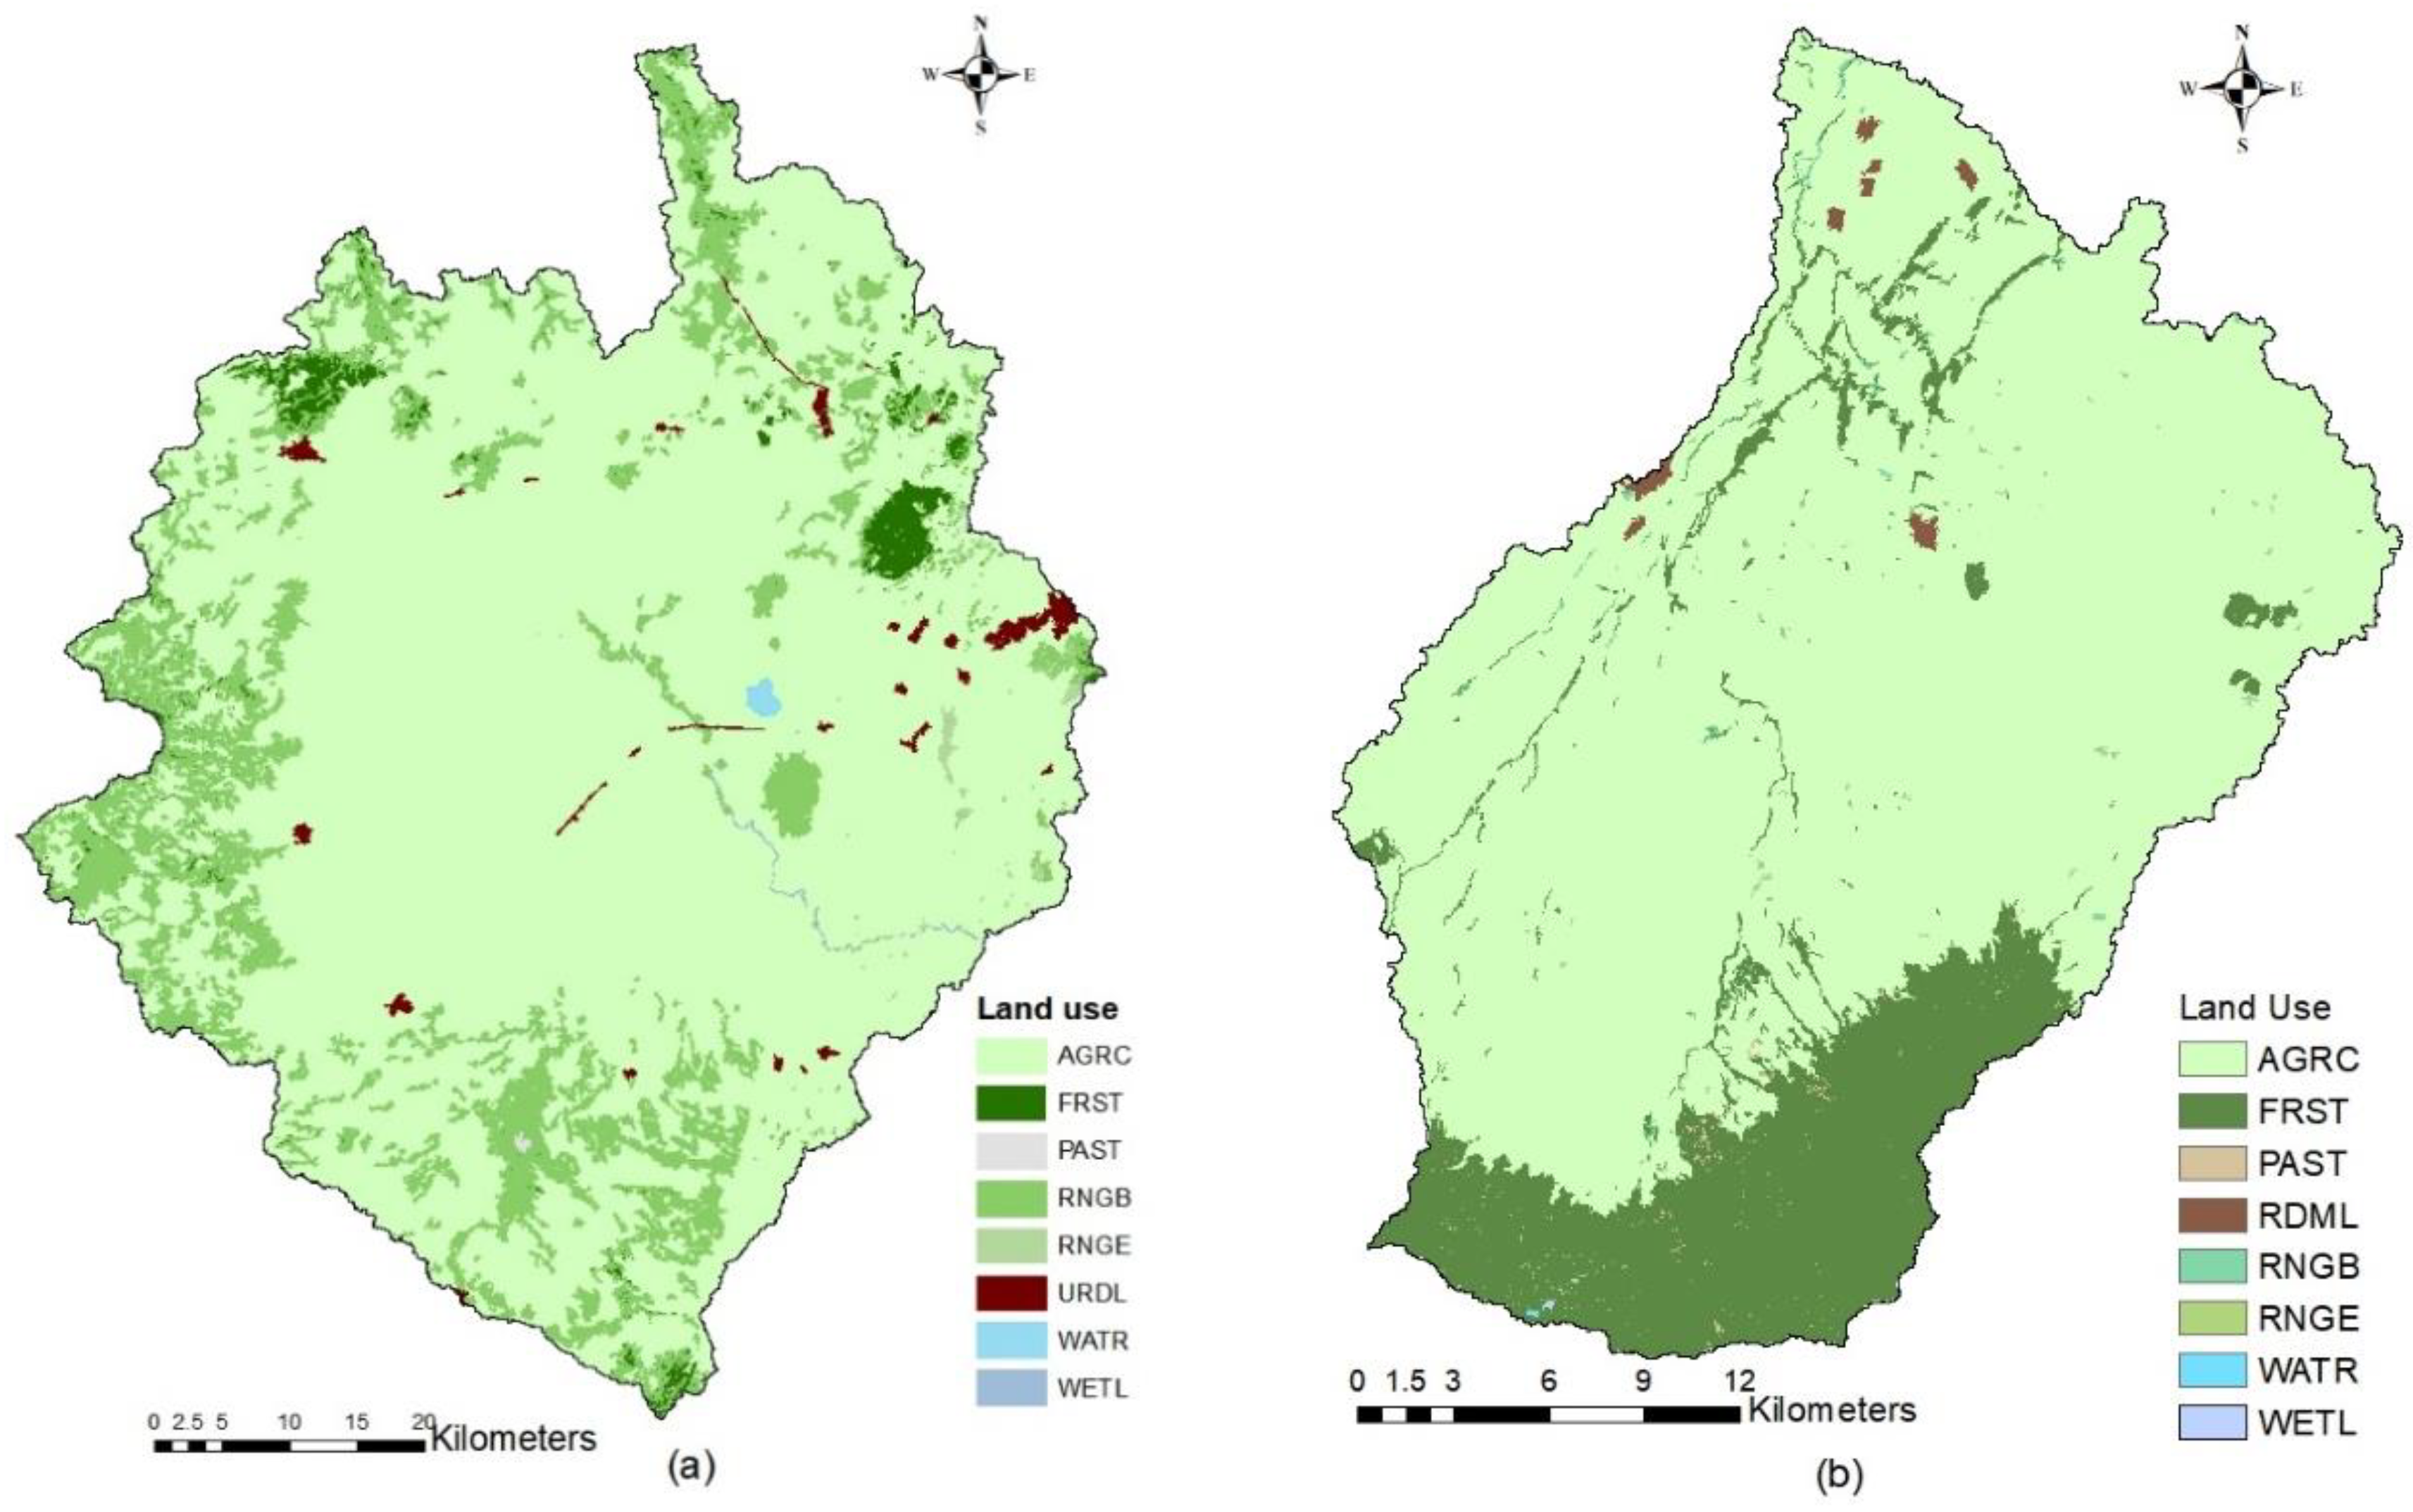
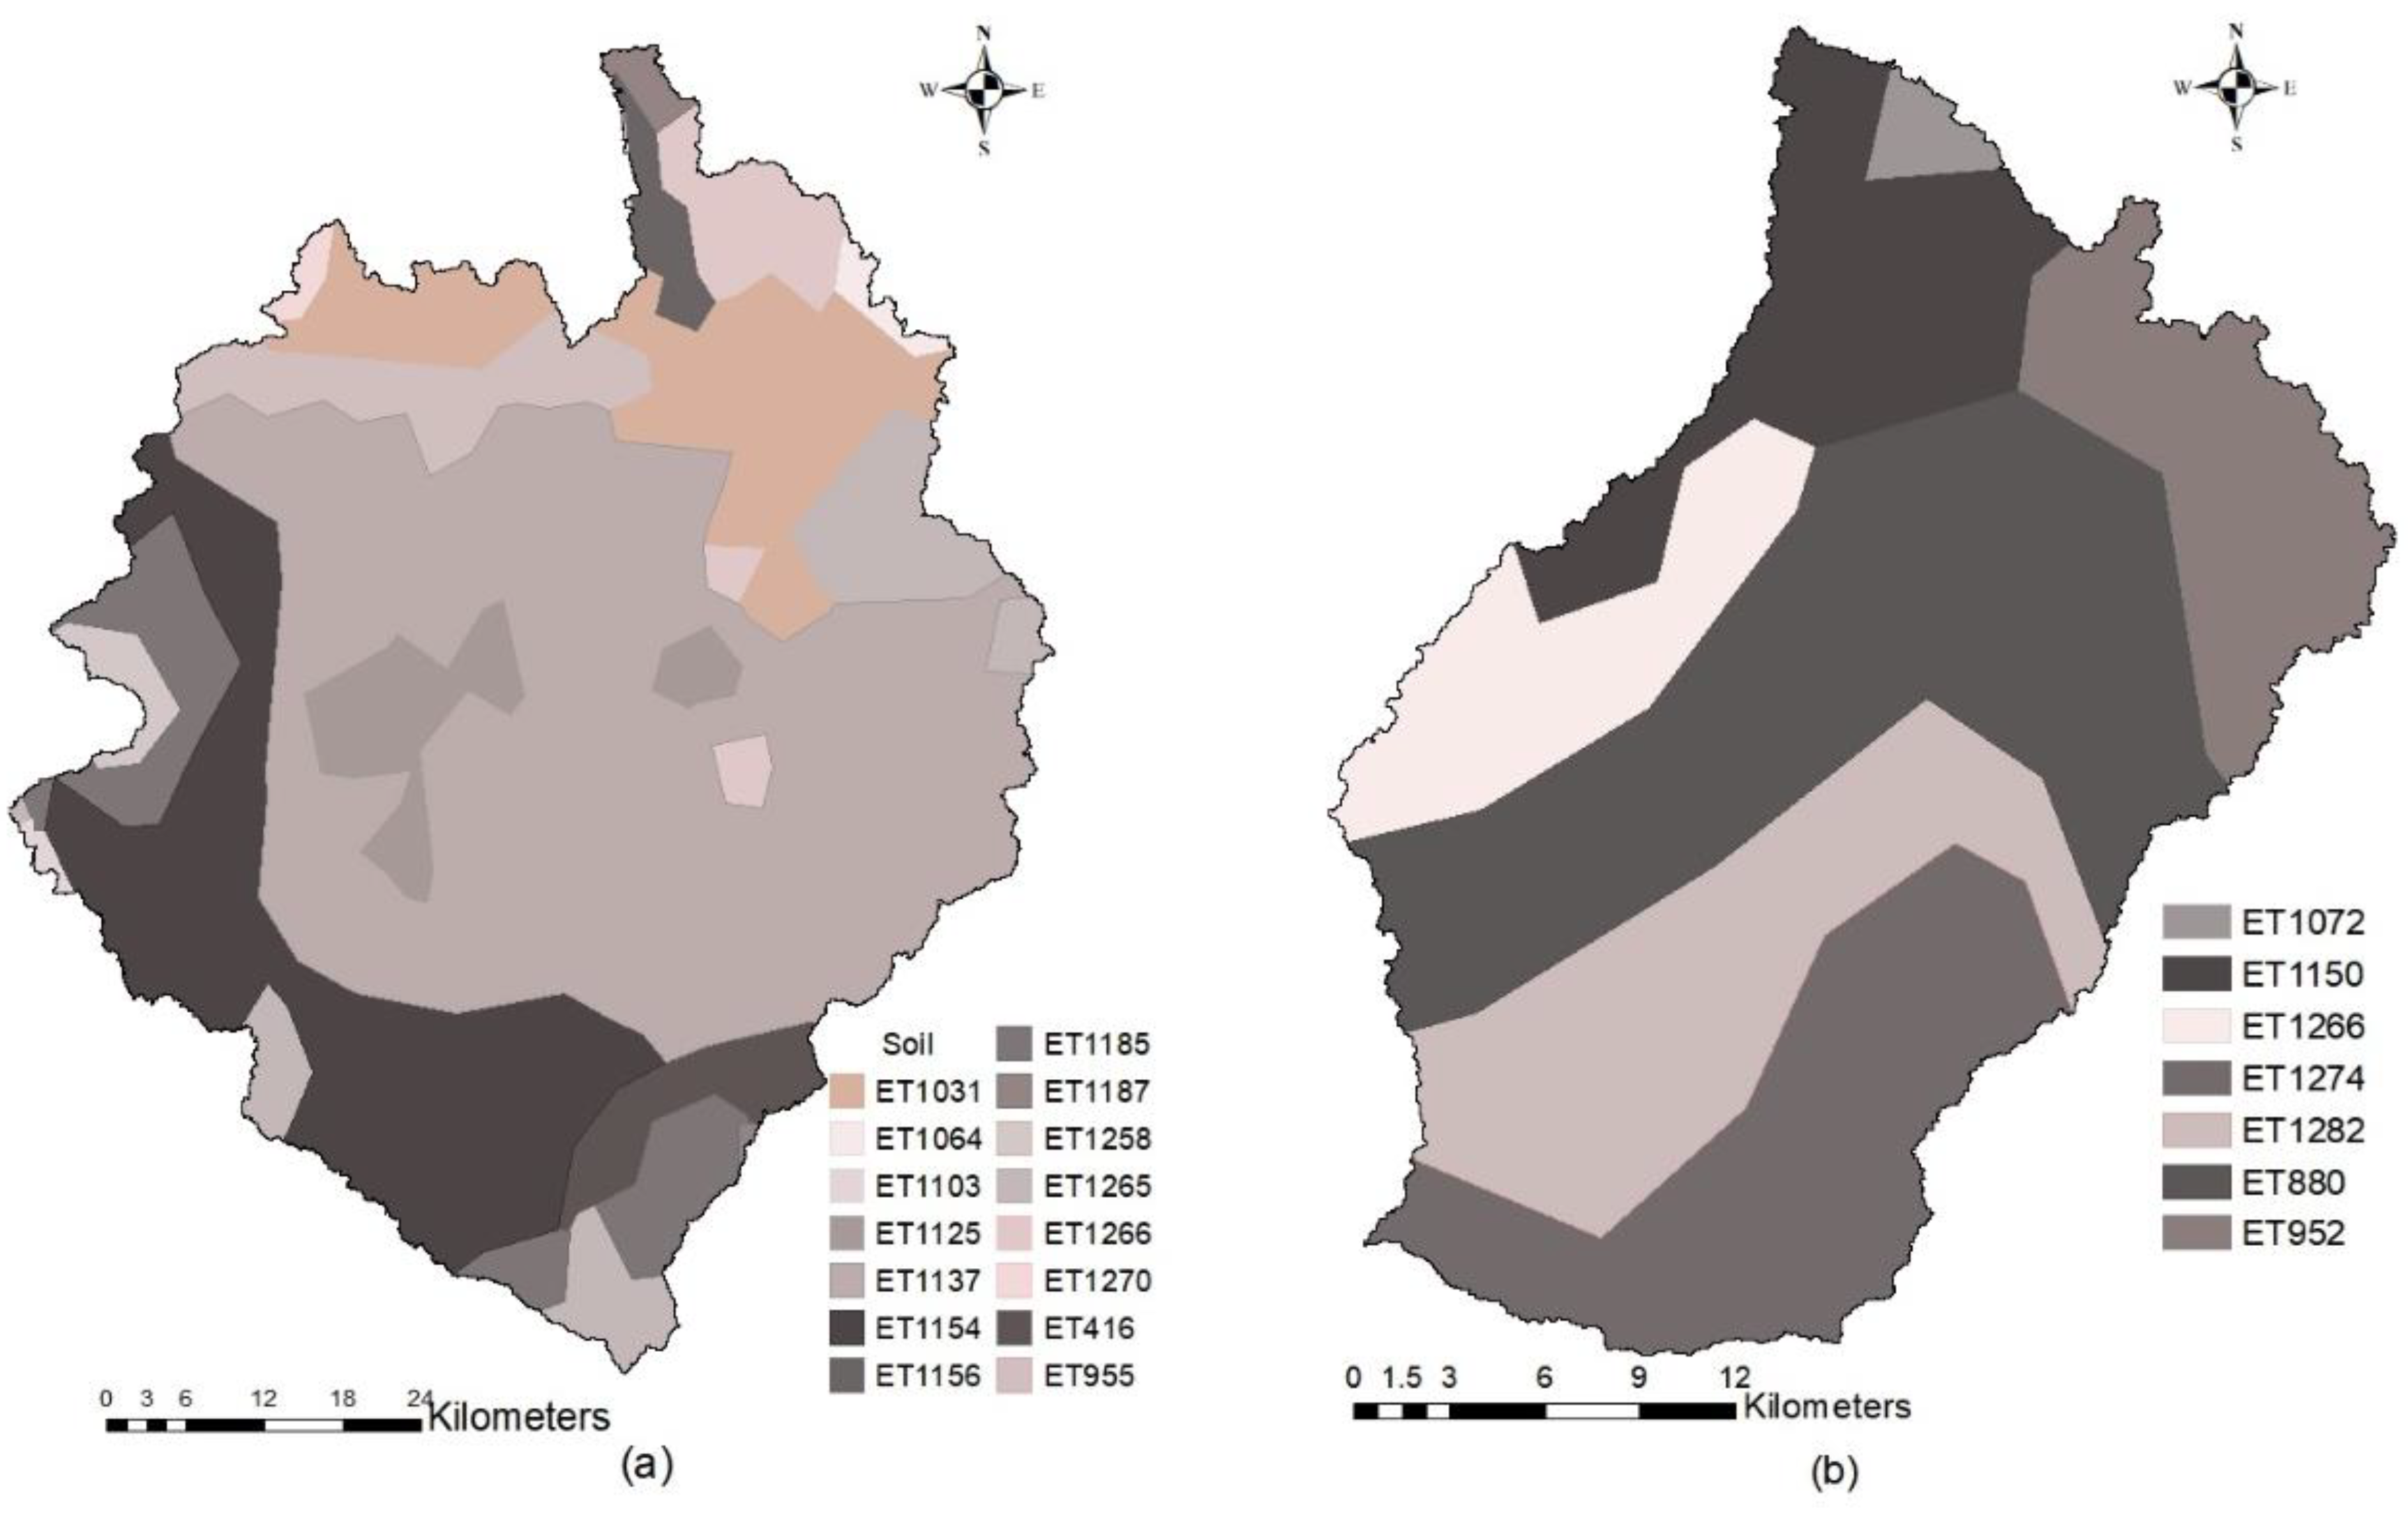
The Keleta sub-basin elevation above sea level varies from 1565 m at the outlet of the sub-basin to 4185 m at Chilalo Mountain. In the sub-basin, the slope classes of 0–10%, 10–20%, and >20% cover an area of 34.7, 37.9, and 27.4% of the total area, respectively. In the Melka Kunture sub-basin, the elevation variation is from 1948 m at the Melka Kunture gauging station to 3575 m at the highlands around Holota. The slope classes in the Melka Kunture sub-basin are 0–10%, 10–20%, and >20%, representing 27.5, 38.3, and 34.2% of the total are, respectively. The land use in the Melka Kunture sub-basin is dominated by agriculture (86.25%), followed by rangeland (9%) and mixed forest (4%) (Figure 2). In Keleta, 80.2% of the land use is agricultural and 18.5% is mixed forest. The main soil types in Keleta are 29.9% ET880 (soil dominated by clay loam), 17.77% ET1274 (soil dominated by clay), 17.41% ET1282 (mainly of clay dominated), and 12.81% ET1150 (sand clay loam dominated soil). The main soil types in the Melka Kunture area are 43.82% ET1137 and 17.06% ET1154, mainly dominated by sandy clay loam, and 10.07% ET1031 (mainly clay loam dominated), as shown in Figure 3.
The climate of the highlands of the upper Awash basin is categorized as humid to sub-humid with an annual mean temperature in the range of 15–20 °C. The mean annual precipitation in the sub-basins varies from 800 to 1400 mm based on the variation in elevation. The major rainfall season, which is called Kiremt in Ethiopia, is normally between June and September.
2.2. SWAT Model
The SWAT model is a physically based, basin-scale, spatially distributed, continuous daily time step and computationally efficient hydrological model [24]. It was developed to simulate the impact of land-use and management practices on the quantity and quality of water and to quantify sediment and agricultural chemical yields in large and complex watersheds with changing soils, land use, and management conditions over long time periods [25]. ArcSWAT, the interface of the geographical information system (GIS), divides the watershed into hydrological response units (HRUs) that share similar land use, soil, slope, and management characteristics. HRU is used to describe the spatial heterogeneity within a watershed [20,25]. The SWAT hydrological cycle simulation is based on the water balance equation, shown in Equation (1).
in which SWt is the final soil water content (mm), SW0 is the initial soil water content on day i (mm), t is the time (days), Rday is the amount of precipitation on day i (mm), Qsurf is the amount of surface runoff in day i (mm), Ea is the amount of evapotranspiration in day i (mm), Wseep is the amount of water entering the vadose zone from the soil profile on day i (mm), and Qqw is the amount of return flow on day i (mm) [25]. The model estimates the surface runoff amount based on the Soil Conservation Service (SCS) curve number method using daily rainfall data.
The SWAT model has become one of the most internationally accepted strong multidisciplinary watershed models, considered a useful and multipurpose model that can be used to assimilate complex ecological processes [24]. The application of the SWAT model to Ethiopian conditions in Abay Basin watersheds [26,27] and the Awash Basin [28,29] showed that the model is capable of achieving reasonable accuracy when simulating hydrological processes of different basins and sub-basins considered.
2.3. Model Input Requirements
The input data required for the GIS interface of ArcSWAT to simulate the stream flow include Digital Elevation Model (DEM), soil and land use spatial data reclassified as per the SWAT format, and daily weather data from the representative stations.
2.3.1. Digital Elevation Model (DEM)
A 30 × 30 m resolution ASTER global DEM (ASTER GDEM) version 2.0 [30] downloaded from the United States Geological Survey (USGS) Global Data Explorer (GDEx) website (https://gdex.cr.usgs.gov/gdex/) was used (Figure 1). Watershed topography was defined based on the DEM to demarcate the watershed boundary, define the stream network, and create sub-basins. The important parameters of the sub-basin, like terrain slope length, slope gradient, stream network, slope classes, and the channel lengths, were all acquired from the DEM.
2.3.2. Land Use and Land Cover
The open-access, global land-cover map datasets released by the government of China [31] were used (http://www.globallandcover.com/GLC30Download/download.aspx). The high-resolution (30 × 30 m) global land cover map is known as GlobeLand30. The GlobeLand30 datasets are freely available and include 10 categories of land cover for the years 2000 and 2010. The land cover data for the year 2000 were reclassified to represent the specific SWAT land use land cover types as per the SWAT land use code for the different land cover groups available in the sub-basins (Figure 2).
2.3.3. Soil Map
2.3.4. Hydro-Meteorological Data
To simulate the SWAT model, one crucial input requirement was reliable and representative weather data for the watershed, which is one of the main challenges for hydrological modeling, and the focus of this study. To find alternative data sources that could be used in the Upper Awash Basin to address the reliable weather data availability for hydrological modeling challenge, the CFSR global weather data were used for further evaluation. The input hydro-meteorological data used to run the SWAT model consist of two datasets: the limitedly available data measured from conventional meteorological stations and the CFSR global weather data. The CFSR by the National Centers for Environmental Prediction (NCEP) is a worldwide, high resolution, coupled atmosphere-ocean-land surface-sea ice system designed to provide the best estimate of weather data. It provides daily data for precipitation, maximum and minimum temperature, wind speed, relative humidity, and solar radiation for the period of 1979–2010 [17]. The conventional weather data were obtained from the National Meteorological Agency (NMA) of Ethiopia in the year 2014. A detailed description of the stations is presented in Table 1. From a conventional data point of view, the stations considered for the Melka Kunture sub-basin have relatively high weather data distribution compared with the Keleta subbasin. The distribution of weather stations in both sub-basins is far smaller than the 24 gauge station per 1000 km2 recommended by Lopez et al. [32]. In addition, for the Keleta sub-basin, even the available rainfall data were mostly from outside the sub-basin. The conventionally measured weather data had missing data. The SWAT weather generator was used to fill the data gaps [25] in the Melka Kunture sub-basin. For the Keleta sub-basin, as the number of missing data were relatively high, a statistical method based on the spatial correlation between the target station and nearby stations, called the modified coefficient of correlation weighting method [33], was used. The CFSR global weather does not have any missing data. The conventional measured data includes daily rainfall from all stations considered, maximum and minimum temperature (from AA observatory, Wolliso, and Holota stations), solar radiation, relative humidity, and wind speed (from Addis Ababa Observatory) for the Melka Kunture sub-basin. For the Keleta sub-basin, the solar radiation, relative humidity, wind speed simulation data were obtained from the Addis Ababa Observatory station. All except two weather stations used were near the sub-basin boundary (Figure 1), and in the Keleta sub-basin, the weather stations were from outside the sub-basin boundary. To run the SWAT, daily climatic data from 1987 to 2004, with a three-year warmup period, were used. The CFSR global gridded data [17] were downloaded for the specific study areas from the website (https://globalweather.tamu.edu/) for the Upper Awash Basin. The data included daily precipitation, minimum and maximum temperature, solar radiation, relative humidity, and wind speed from all the grid locations (Figure 1).
2.3.5. Comparison of the Rainfall from CFSR and Conventional Datasets
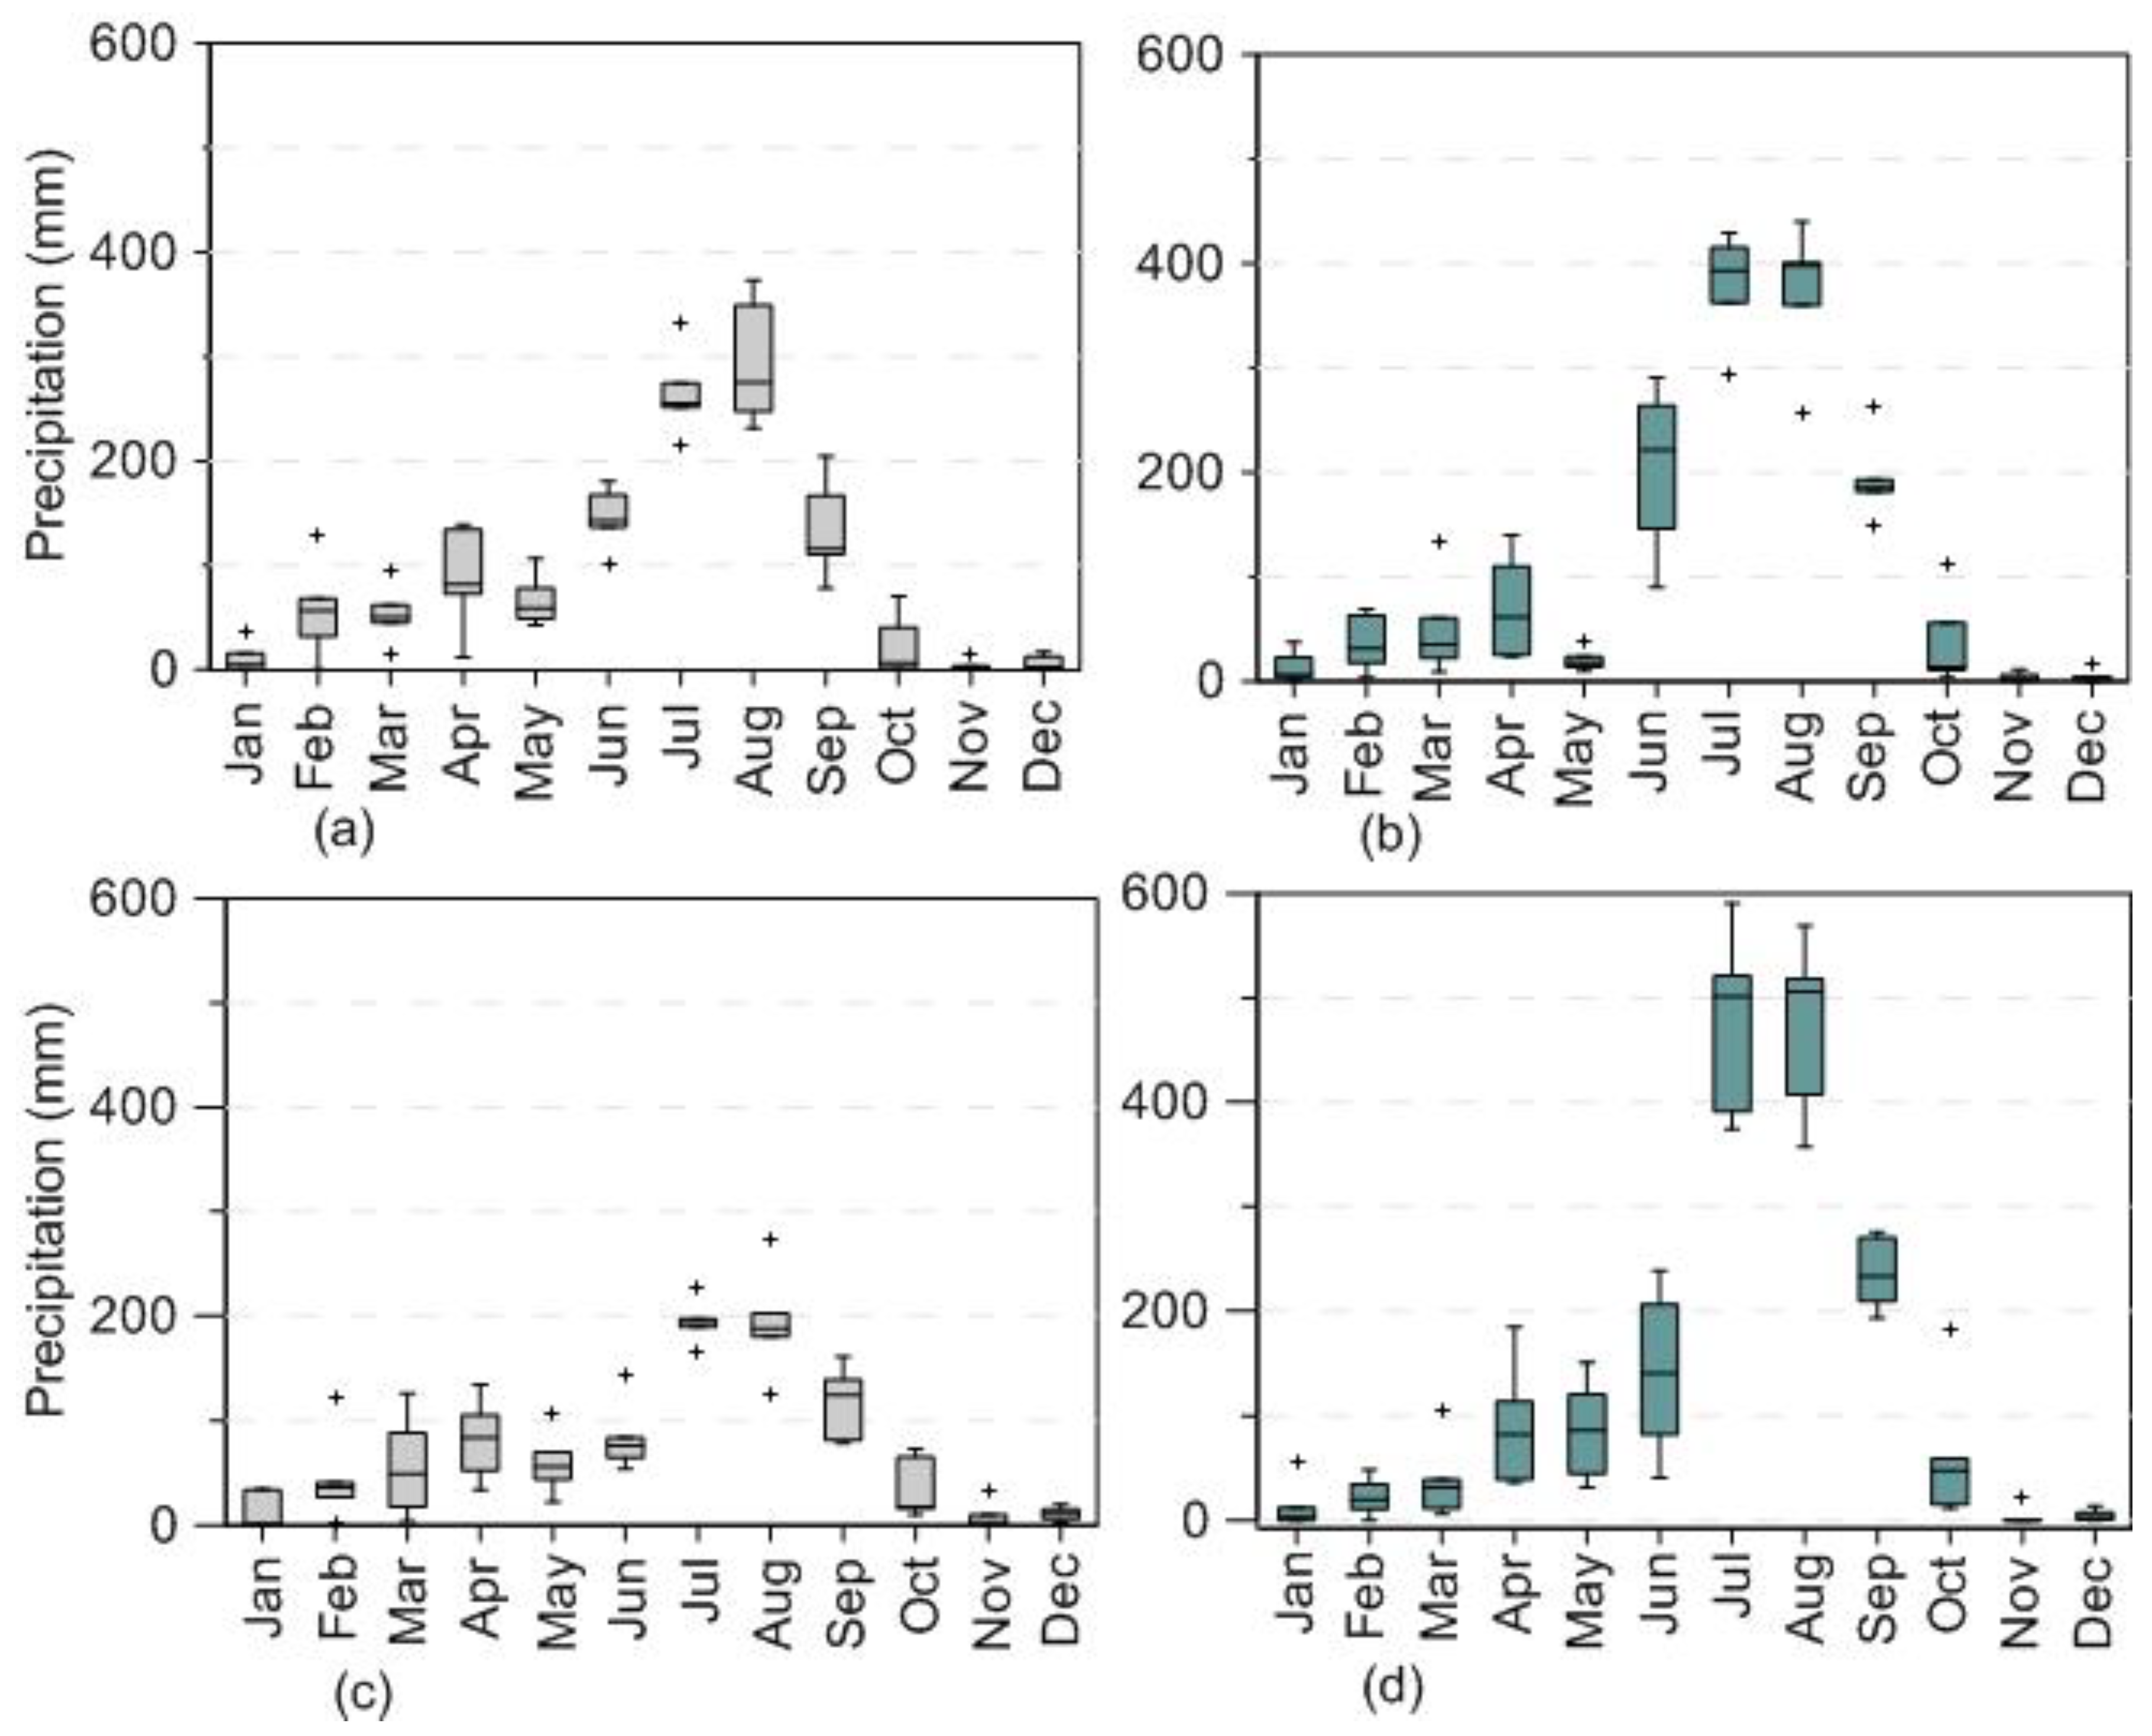
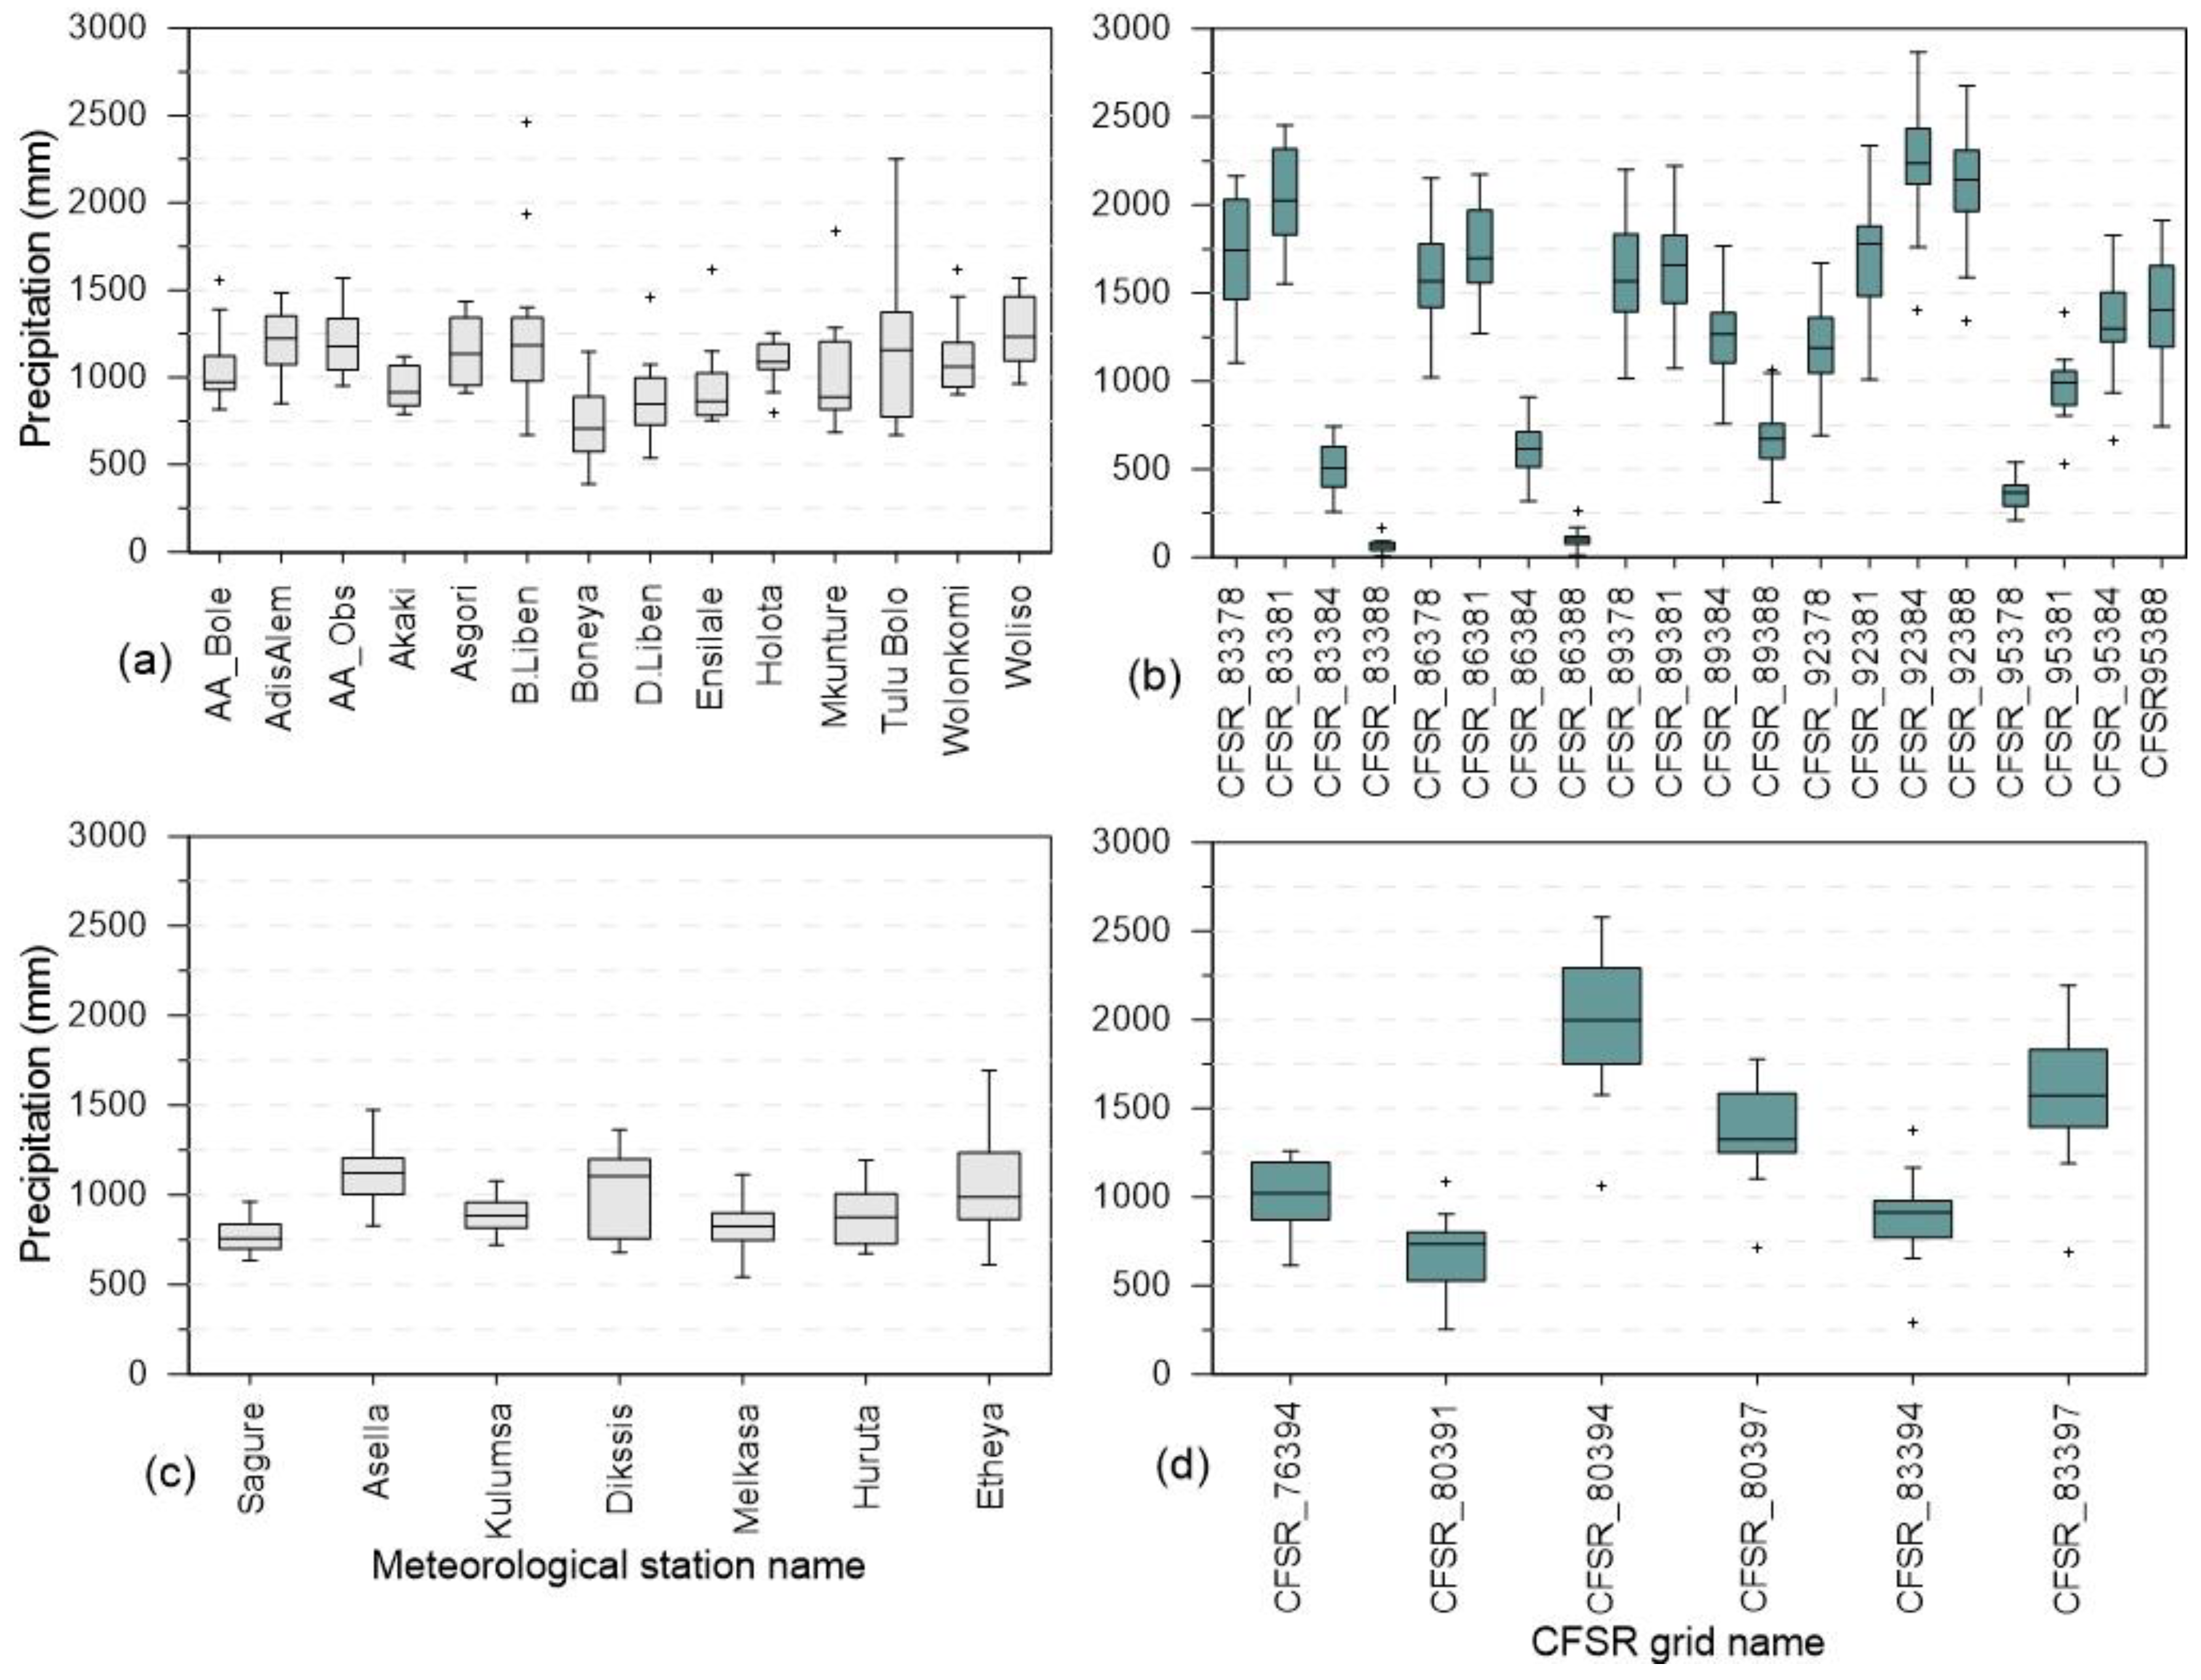
Long-term average monthly rainfall data for 1990–2004 for both the conventional and CFSR datasets are plotted as box plots in Figure 4 for the Keleta and Melka Kunture sub-basins to compare their monthly trend. The CFSR rainfall data better captures the trend in conventional rainfall in Melka Kunture compared to the Keleta sub-basin. The average values for July and August clearly show that the CFSR data contain higher rainfall values when compared with the conventional rainfall trend. The difference was considerable in the Keleta sub-basin (Figure 4c,d). Average annual precipitation comparison of the two datasets at all meteorological stations and global grids (Figure 5) shows that rainfall from the CFSR weather data is more variable than from the conventional data. At grids CFSR-83388, CFSR-86388, and CFSR-95378 (Figure 5b) in the Melka Kunture sub-basin, and at CFSR-80391 (Figure 5d) in the Keleta sub-basin, extremely low annual rainfall was observed in the CFSR weather data. Generally, in both sub-basins, the CFSR global weather overestimates the rainfall during the high rainfall period of July and August in the country, as indicated in Figure 4.
2.3.6. Streamflow Data
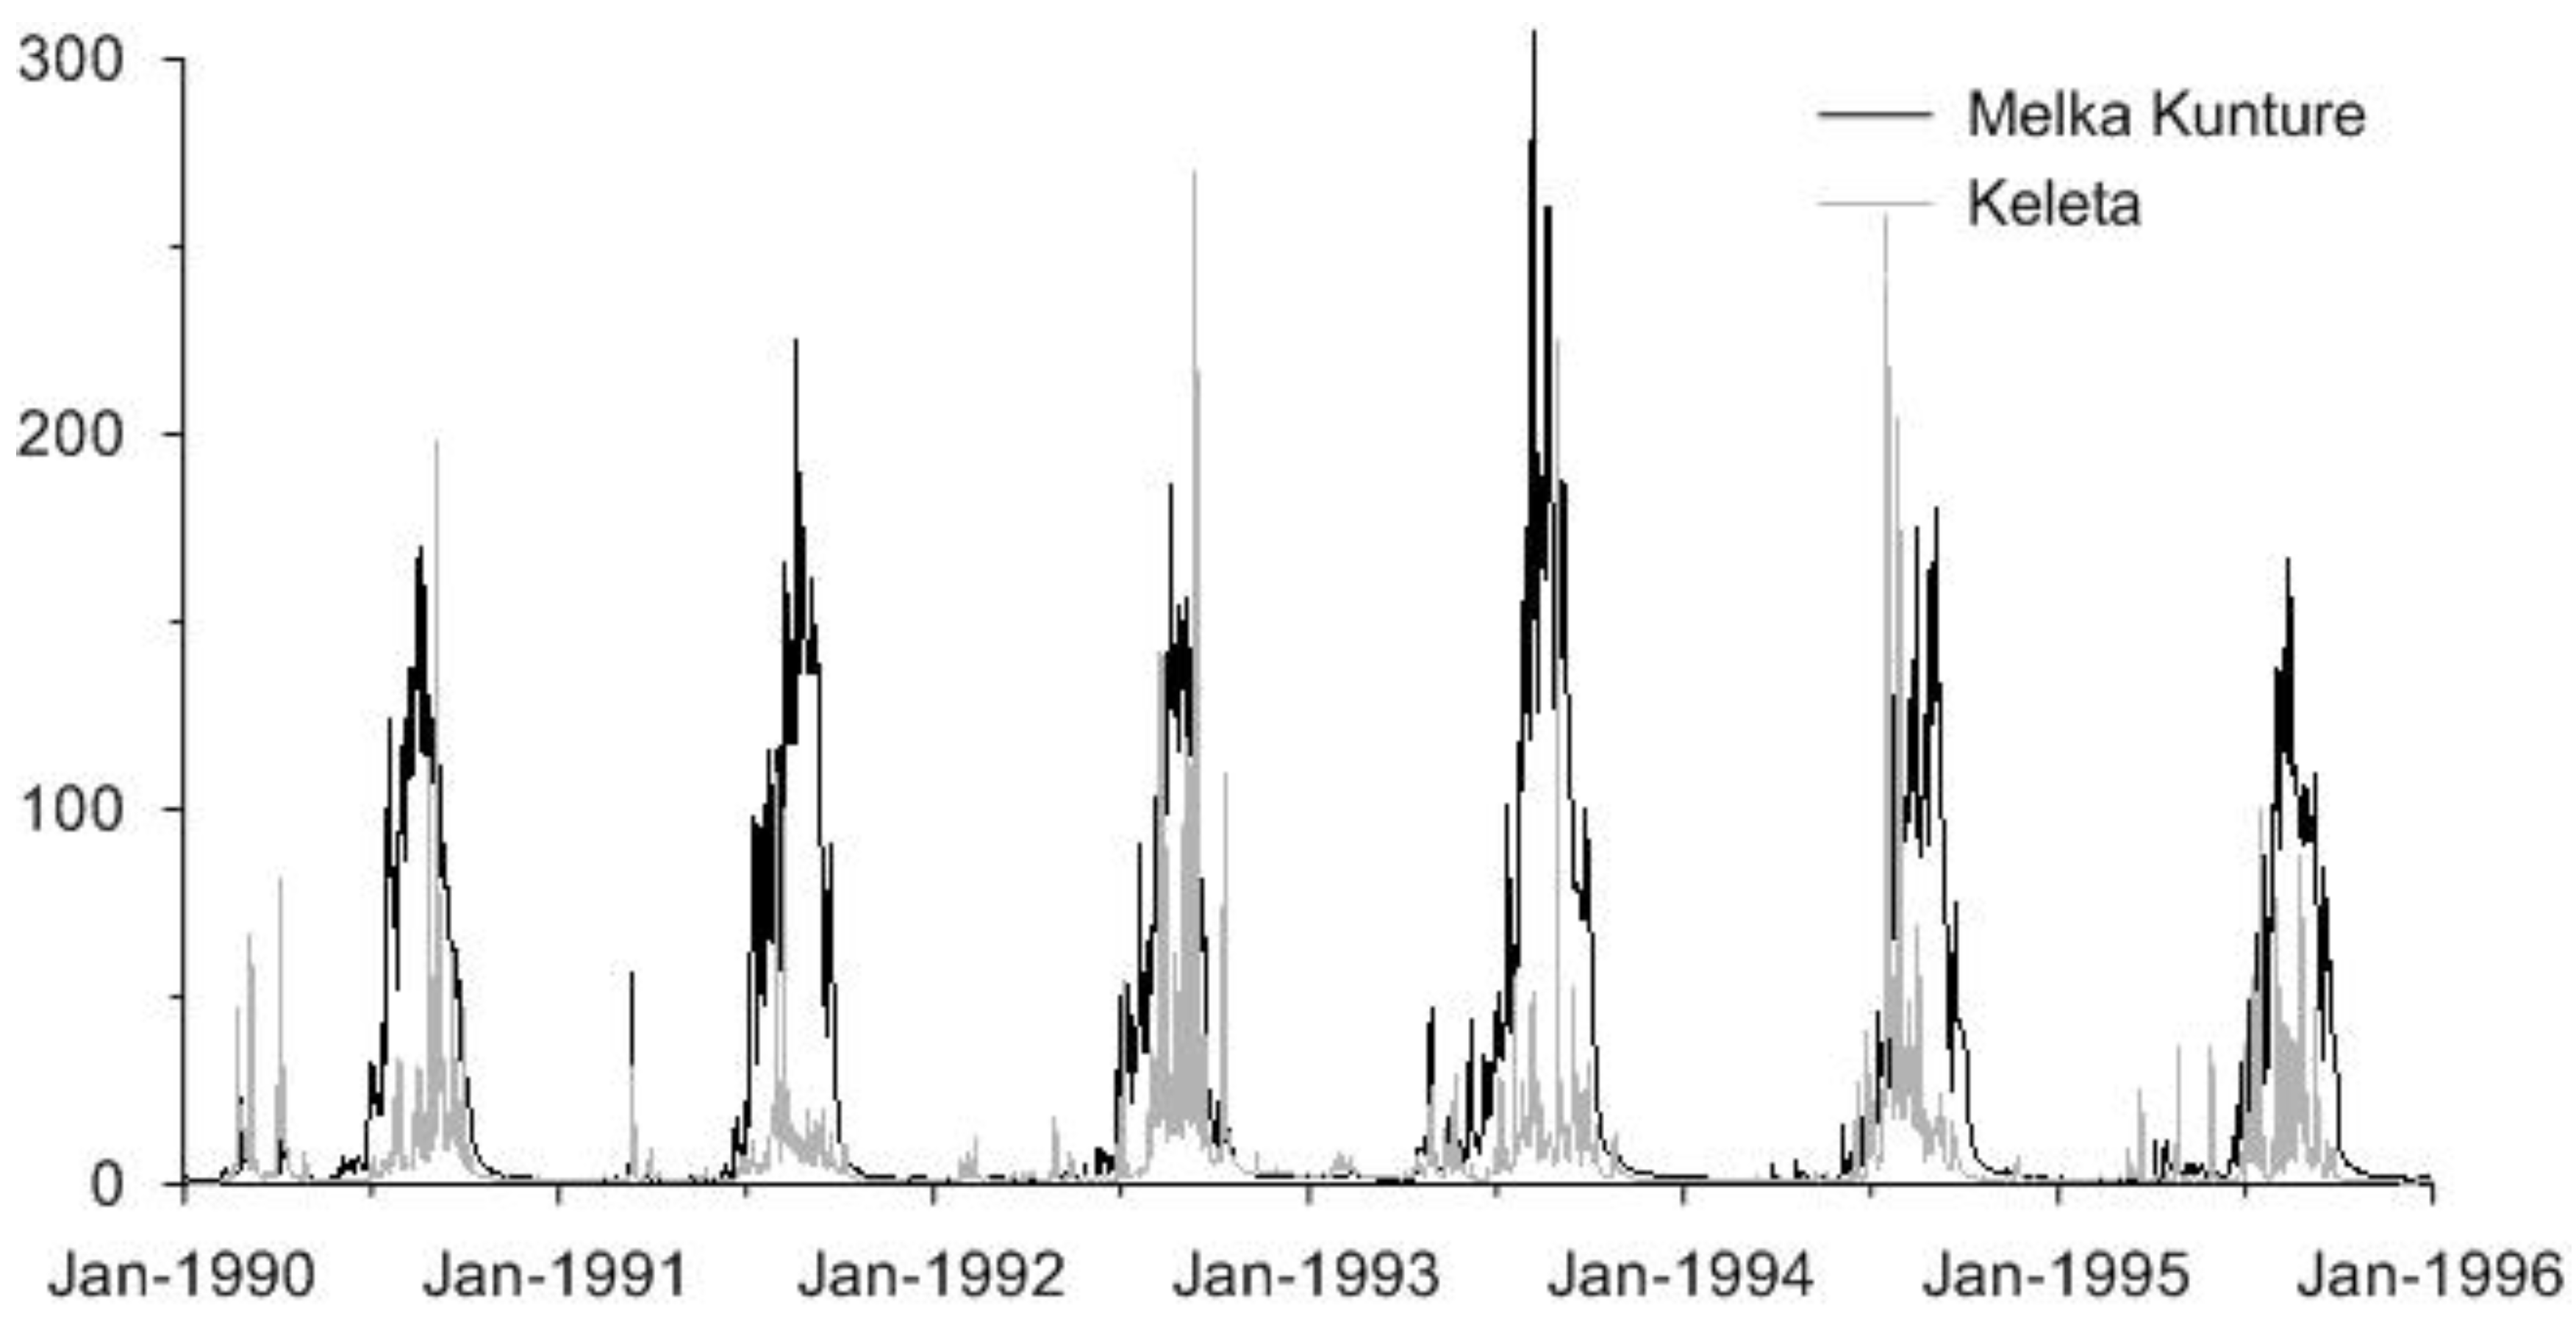
The daily river flow data recorded at Melka Kunture and Keleta gauging stations were obtained from the Ethiopia Ministry of Water, Irrigation, and Electricity Department of Hydrology. The monthly river flow was used for calibration and validation of the SWAT model. Figure 4 shows the daily observed streamflow versus the precipitation for both conventional and CFSR data in the two sub-basins, and Figure 5 compares the observed monthly streamflow with the simulated streamflow in the two sub-basins. The streamflow used for calibration and validation was limited to 1990 to 1995, because the availability of quality streamflow data was limited to these years for the Keleta subbasin. The observed streamflow hydrographs (Figure 6) show a large flow volume at Melka Kunture compared to the Keleta gauge stations because of the large sub-basin area (area of concentration) in Melka Kunture.
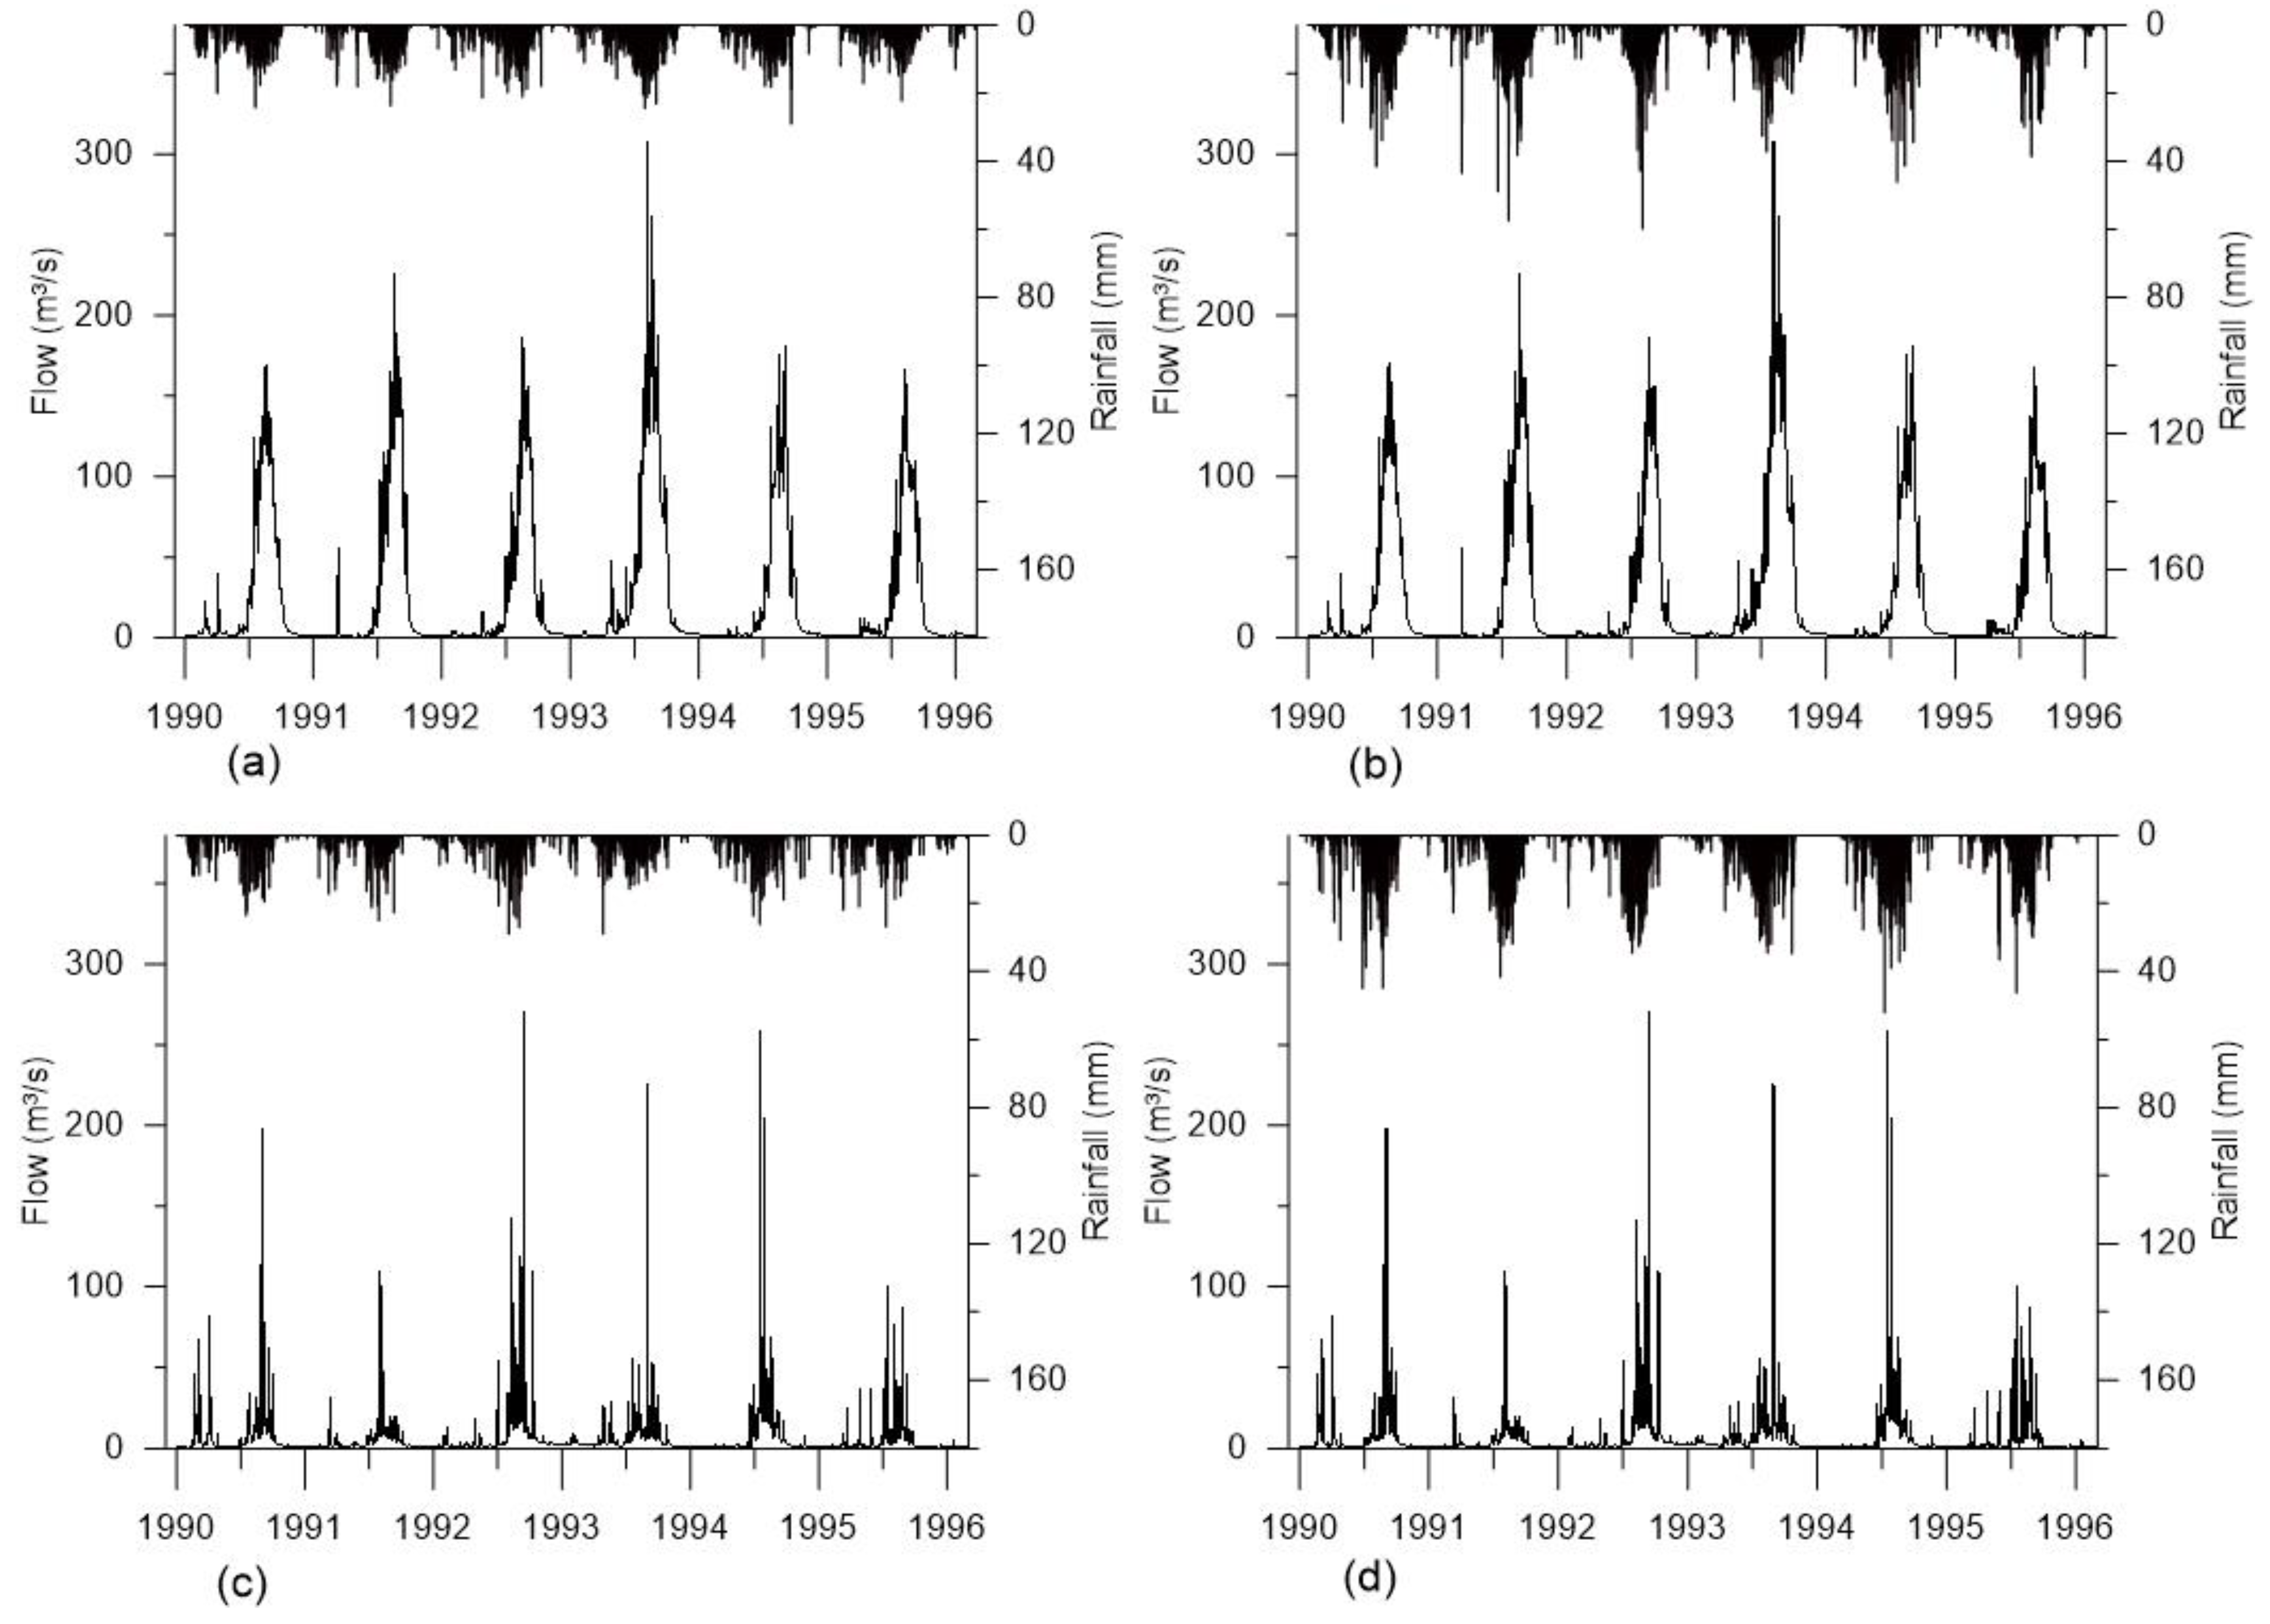
The daily observed streamflow hydrographs for 1990–1995 were plotted on the same plot as a bar graph with average daily areal rainfall from the two datasets, conventional and CFSR (Figure 7), to compare the streamflow pattern with the rainfall trends. The graphs indicate that the precipitation from the conventional weather captured both the high and low flows at Melka Kunture (Figure 7a,c). The rainfall from the CFSR weather also captured most of the high and low flows except in some years. In Melka Kunture, the peak streamflow observed in 1993 (Figure 7 b) was not indicated by the rainfall records, and in the Keleta sub-basin, the high rainfall record in 1991 (Figure 7d) did not coincide with high streamflow.
2.4. Model Setup
Watershed delineation from a DEM was the first step in the setup of the SWAT model. The major steps to process watershed delineation in SWAT are DEM setup, stream definition, outlet and inlet definition, watershed outlet selection and definition, and calculation of sub-basin parameters [25]. To include the smallest sub-basin for the stream definition, the threshold-based option was used. To consider all the available classes of soil, land use, and slope in the sub-basins during HRU definition, multiple HRUs were created with zero percent threshold area [20,21,34,35]. All the SWAT model input data entered were prearranged to use the spatial features required by the model, which were 100% overlapped with the delineated watershed by Arc-SWAT. A multiple slope classification option of five slope class (0–5%, 5–10%, 10–20%, 20–30%, and >30%) was used for the HRU definition.
2.5. Calibration, Validation, Sensitivity Analysis, and Model Performance Evaluation
The calibration and validation analysis, the sensitivity, and uncertainty were used in the SUFI-2 algorithm in the SWAT-CUP [36]. The SWAT model simulation output was imported to SWAT-CUP for analysis. The SUFI-2 algorithm computes the 95% prediction uncertainty (95PPU) range through an iterative procedure and attempts to capture the observed streamflow data within the band [37]. As a measure of the goodness of fit, the algorithm uses two key indicators: p-factor and r-factor. The p-factor measures the fraction of observed data contained in the 95PPU with a value ranging from 0 to 1, in which 1 denotes a perfect simulation of the observed data. The r-factor indicates the ratio of the average width of the 95PPU band and the standard deviation of the observed variable. The p-factor values above 0.7 and r-factor value less than 1.5 suggest accurate discharge simulation [37]. When adequate r- and p-factors were achieved, then statistical parameters selected for time series analysis were compared. Finally, the SWAT parameter ranges in the last iteration that resulted in satisfactory r-factor and p-factor values were considered as the calibrated parameters. For model performance evaluation, SUFI-2 permits the use of multiple objective functions including Nash-Sutcliff (NSE), percent bias (PBIAS), correlation coefficient (R2), and root mean square error divided by the standard deviation (RSR). The model performance evaluation guideline [38] was used for rating, as shown in Table 2.
2.6. Evaluation of Water Balance Constituents
The annual average water balance components simulated using the conventional and CFSR weather data for the two study areas were analyzed. The primary water balance constituents estimated for the two sub-basins included the total areal rainfall (PCP), surface runoff (SURQ), groundwater contribution to streamflow (GWQ), actual evapotranspiration (ET), soil water (SW), groundwater recharge amount (PERCO), and water yield (YIELD). The YIELD component is the summation of the contributions to streamflow from surface runoff, lateral flow, and groundwater, minus the transmission losses. Accordingly, the water balance components simulated in each sub-basin using the two weather datasets were compared.
3. Results and Discussion
3.1. Evaluation of Model Performance Using Conventional Weather Data
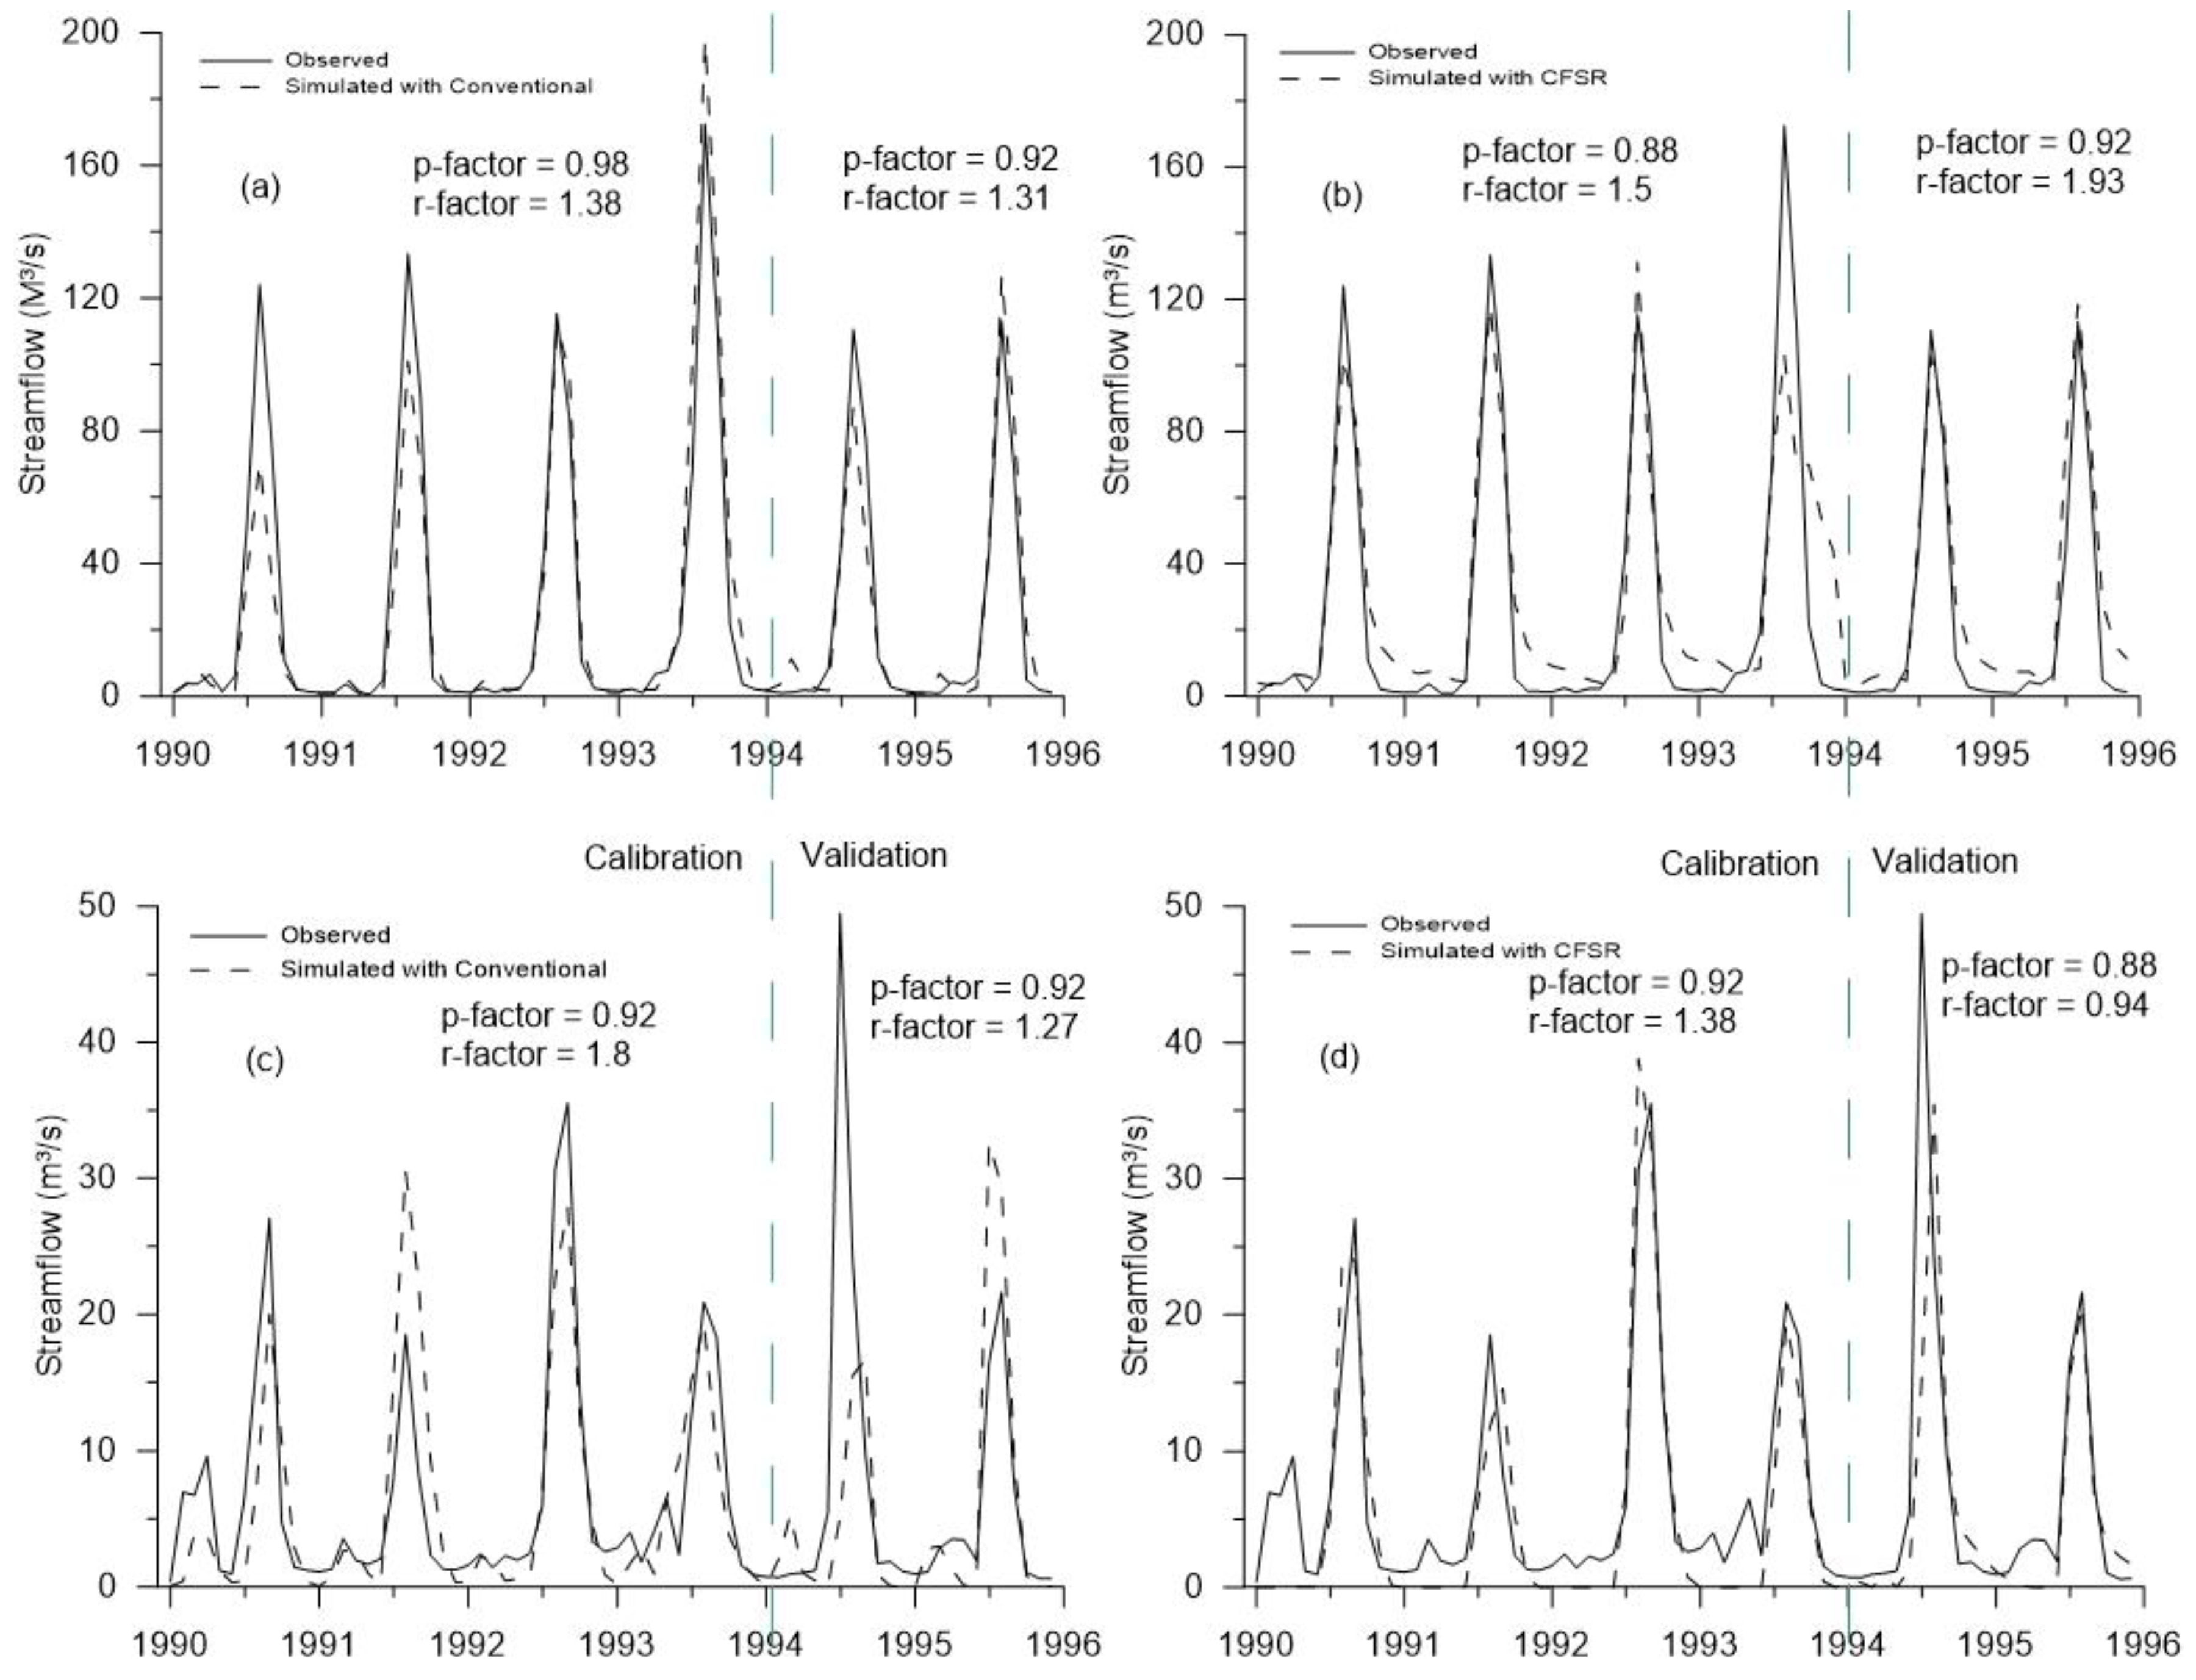
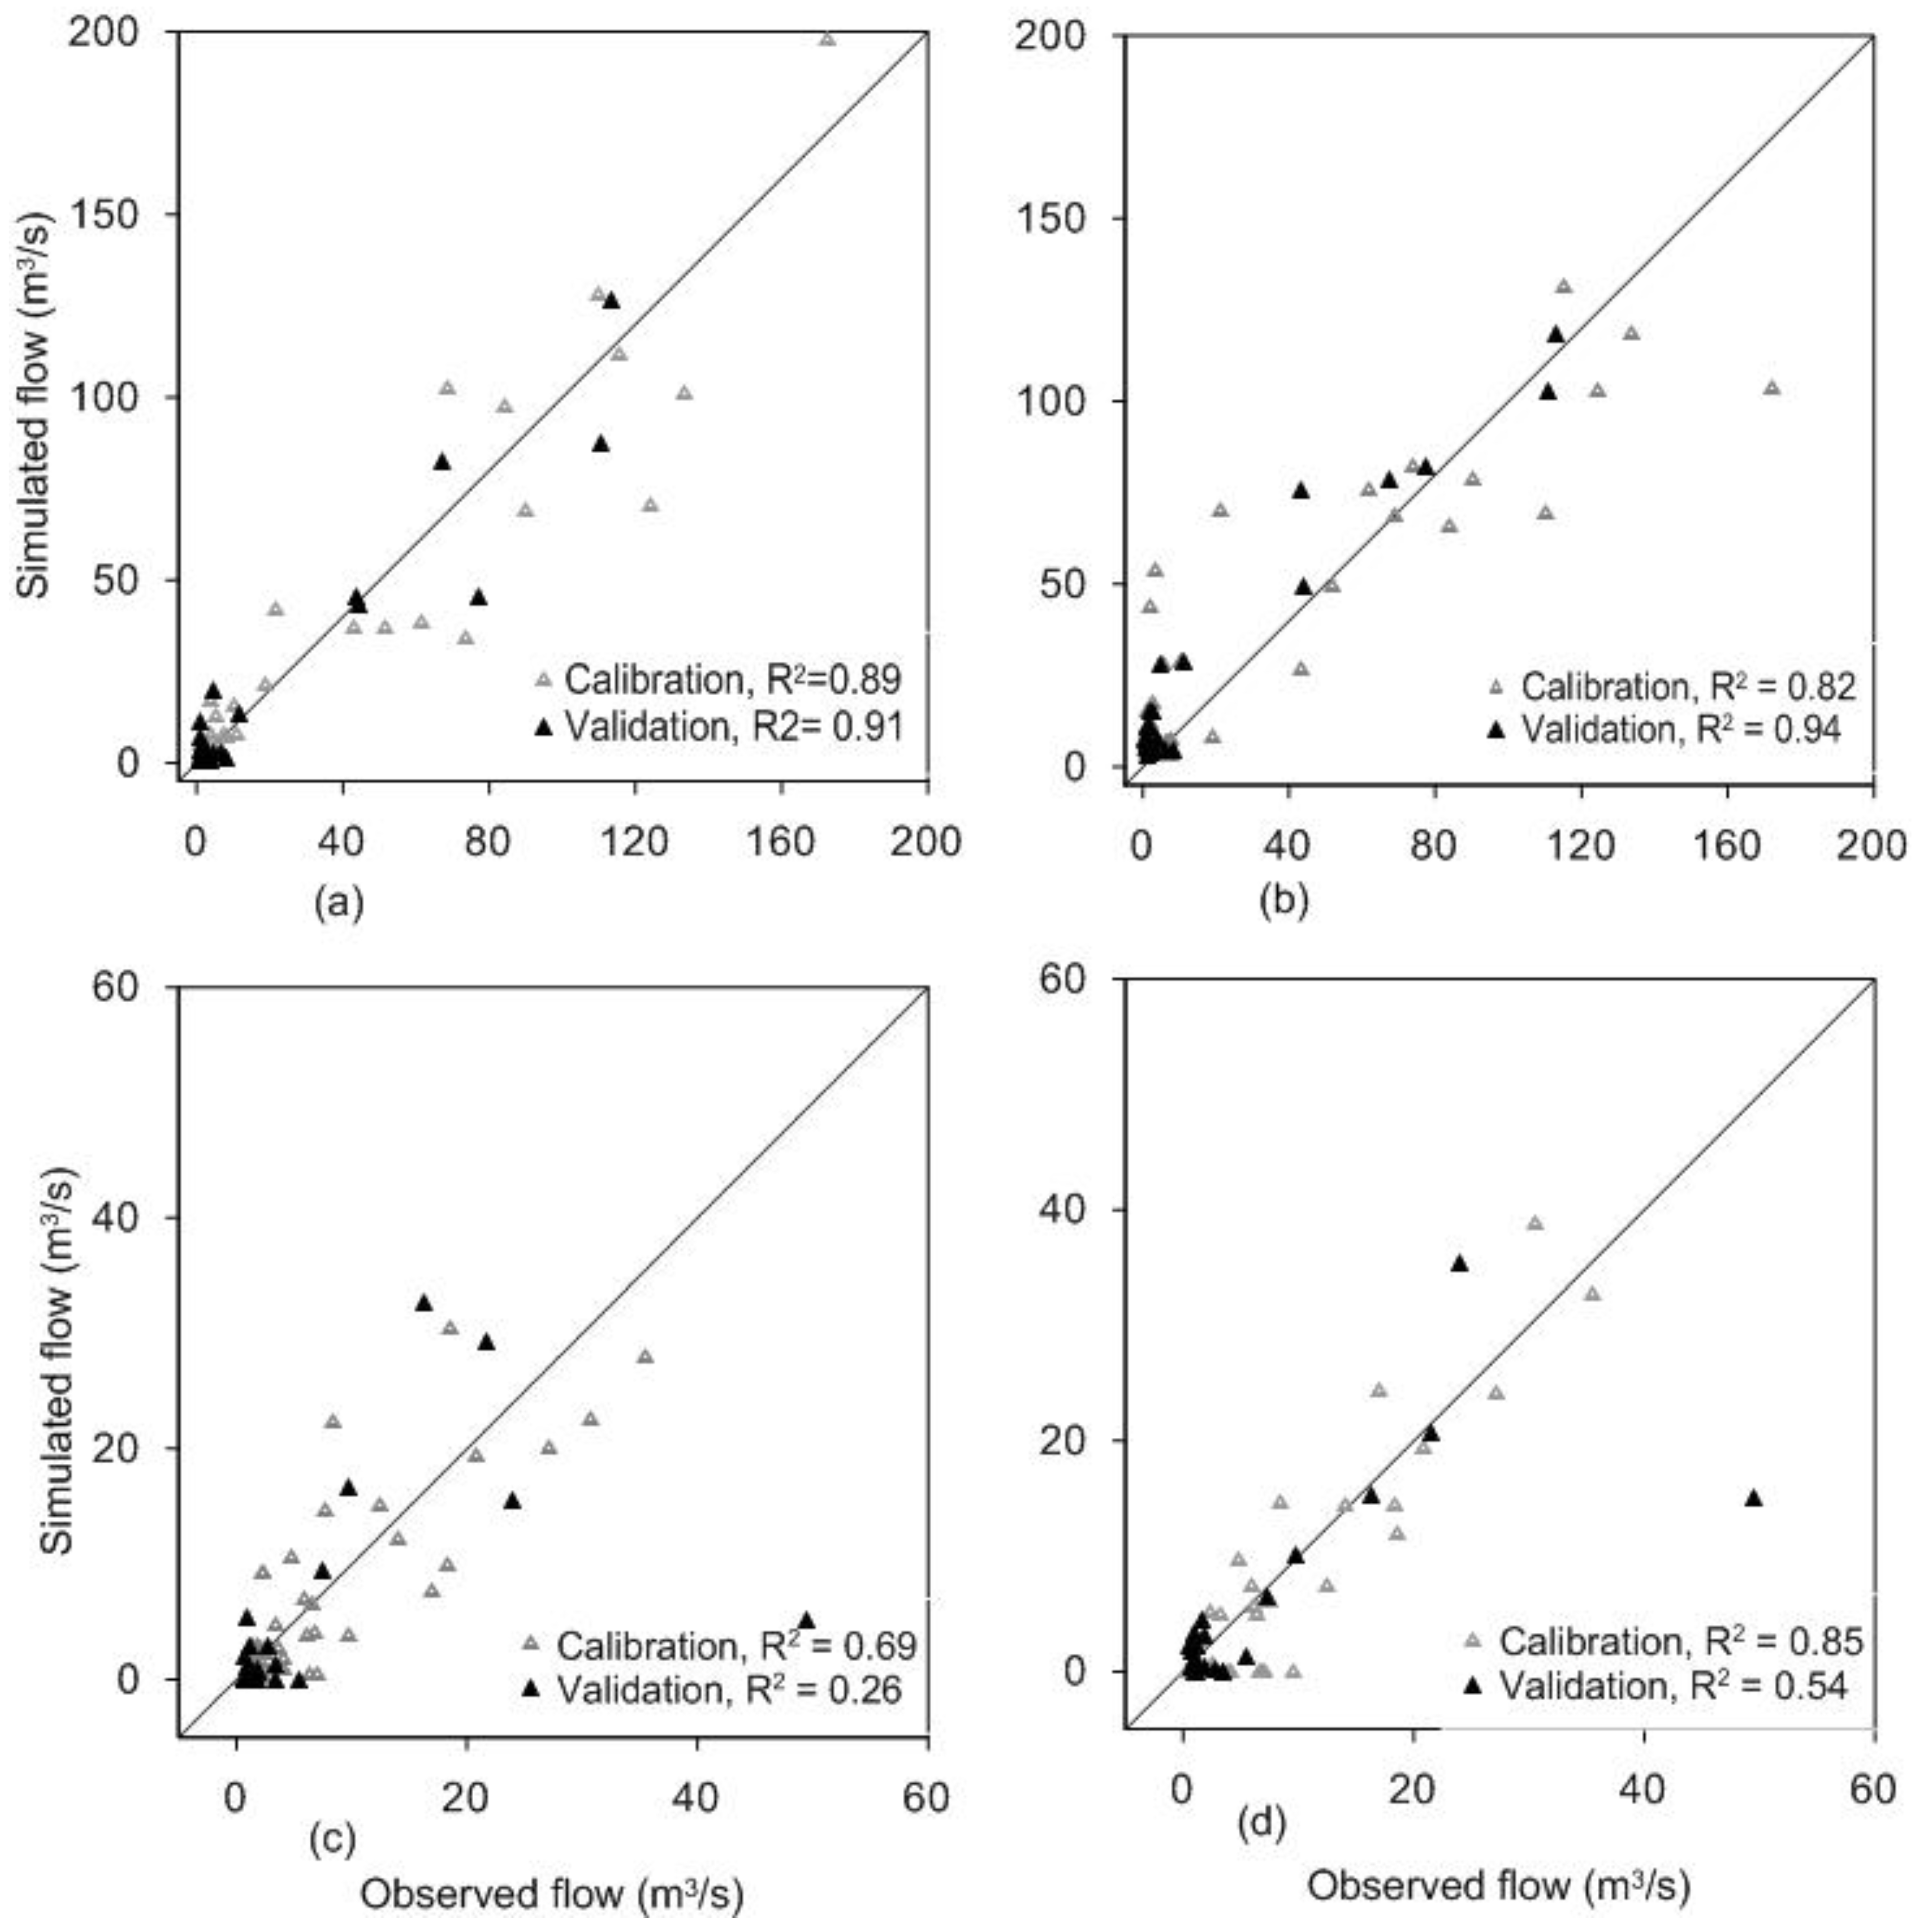
The SWAT model monthly streamflow simulation performance using the conventional weather data before calibration indicated a more accurate result in the Melka Kunture sub-basin than in the Keleta sub-basin. The model performance evaluation statistics used were RSR, R2, NSE, and PBIAS [38], and the results are summarized in Table 3. The calibrated model performance evaluation in simulating streamflow at the Melka Kunture gauging stations reasonably agrees with the observed streamflow. The observed versus simulated streamflow hydrograph analysis (Figure 8a) reveals a good agreement between the two and statistically achieved a very good performance range for all the evaluation statistics considered (Table 3). The scatter plot (Figure 9a) used to compare the simulated and observed streamflow indicates a substantial agreement between the simulated and observed flows, except for a few overestimations observed during low flows, mostly during the validation period.
However, at the Keleta gauging station, the model performance evaluation statistics and the hydrograph demonstrated that the model did not satisfactorily simulate the streamflow. This could be due to the distribution and representativeness of the metrological stations, as almost all stations were outside of the subbasin, and a considerable amount of missing data. The monthly streamflow hydrograph analysis with the conventional weather data at Keleta gauging station showed that the simulated flow captures the timing, but could not match the high and low flows (Figure 7c). The statistical analysis criteria used (Table 3) categorize the simulation as “unsatisfactory”. The scatter plot (Figure 9c) of the observed versus simulated flow with the conventional weather data at the Keleta sub-basin indicates a poor fit between the two flow records.
3.2. Evaluation of Model Performance with CFSR Weather
SWAT simulation of the monthly streamflow using CFSR global weather before calibration was more acceptable at the Melka Kunture gauging station than at the Keleta sub-basin gauging station. The chosen calibrated model performance evaluation statistical indicators used (Table 3) highlighted the very good performance of the simulation, based on NSE, R2, and RSR statistics; good performance (±10–15%) during the calibration period; and satisfactory performance (±15–25%) during the validation period, based on the PBIAS evaluation statistics, in the Melka Kunture sub-basin using the CFSR weather data. The observed versus simulated scatter plot (Figure 9b) and the negative values of the PBIAS (Table 3) show that the model overestimated the low flow at the Melka Kunture gauging station when using the CFSR global weather data. The streamflow simulation perfromance with the CFSR weather data at the Keleta sub-basin was also statistically satisfactory (Table 3) during the validation period for most of the criteria. The hydrograph (Figure 8d) and the scatter plot (Figure 9d) analysis showed that most of the low flows were underestimated in the simulation with the CFSR at the Keleta sub-basin.
3.3. Simulation Performance Comparison of Conventional and CFSR Weather
The model performance evaluation statistics (Table 3) demonstrate that CFSR and conventional weather performed almost equally for the Melka Kunture sub-basin when simulating monthly streamflow. However, the simulation at the Keleta gauging station showed that the CFSR weather data performed better than the conventional weather data to simulate a monthly flow. Using the CFSR weather, the model achieved very good performance for the Melka Kunture gauging station even though the PBIAS was slightly higher than the range limit, and had satisfactory performance for the Keleta gauging station. Using the weather data, the achieved model performance evaluation was very good performance at Melka Kunture and unsatisfactory at the Keleta gauging station. The unsatisfactory performance using the conventional weather data at Keleta could be due to the representativeness of the weather station distribution and quality of the available data, as described earlier.
Overall, SWAT model simulation of the streamflow with CFSR weather data performed better when simulating the Melka Kunture sub-basin, which is the larger sub-basin compared with the Keleta sub-basin which is one-sixth of the size of the Melka Kunture sub-basin.
3.4. Evaluation of Water Balance Components
The major water balance components, such as SURQ, GWQ, SW, PERCO, and ET, (Table 4) that were simulated using the two weather datasets were analyzed at both Melka Kunture and Keleta gauging stations.
The average annual water balance analysis showed that higher values of the water balance components were obtained using the CFSR global weather data in Melka Kunture sub-basin (Table 4). This could be due to the relatively high total PCP in the CFSR weather dataset in the sub-basin. In the Keleta sub-basin, simulation with the conventional data resulted in higher values for GWQ, SW, and PERCO compared with the CFSR weather data. In both sub-basins, the simulated ET values indicated that an average value of 52–62% of the total rainfall lost from the basin was in the form of evapotranspiration. The YIELD component is the summation of SURQ, LATQ, and GWQ minus the total losses (TLoss). The YIELD component breakdown evaluation showed that baseflow to the streamflow (GWQ) is a significant component of the streamflow in both study areas.
4. Conclusions
In this study, we evaluated the global CFSR weather data applicability as input data for the SWAT model to simulate streamflow in the upper region of Awash Basin. The results were compared between the simulations with the limited available conventional weather data in the two sub-basins to find an alternative reliable weather data source for hydrological modeling. The two sub-basins considered were Melka Kunture, a large-scale sub-basin, and Keleta, which is a medium-scale watershed. The major conclusions from the analysis are as follows. (1) By comparing the input rainfall data of the CFSR and conventional weather data on a monthly and annual basis, the rainfall data from the CFSR weather data were more variable between grids, and estimated total precipitation was high from the CFSR data compared with the conventional data; (2) Based on the performance evaluation statistics used (R2, NSE, and RSR), the CFSR weather data simulated the monthly streamflow equivalently to the conventional weather data at the Melka Kunture sub-basin. At Keleta, CFSR better simulated the streamflow. Therefore, the use of CFSR weather data is the better alternative with which to simulate stream flow given the limitations of conventional weather data in the Keleta sub-basin. The calibrated model can be used for further analysis of the streamflow responses to land use and climate changes and different management scenarios using the SWAT model; (3) The comparison of monthly streamflow simulation with the CFSR weather data at the two sub-basins demonstrated that CFSR weather data better simulates the larger sub-basin, Melka Kunture, than the medium sub-basin, Keleta; (4) The evaluation of the water balance components also indicated that the SURQ, GWQ, and LATQ values were higher when using the CFSR global weather data, which could be due to the higher rainfall data in the CFSR dataset.
In general, using the CFSR global weather data for watershed modeling could be a good alternative for areas in the basin where reliable weather data is lacking. In addition, evaluation of the applicability of other global weather information, like that from the National Center for Atmospheric Research (NCAR), U.K. met office, and others for hydrological modeling at a specific watershed or basin may provide alternative options for data scarce areas.
Author Contributions
All authors contributed in conceiving and designing of the approach and realizing this manuscript. Mesfin Benti Tolera prepared the input data and implemented the SWAT model. Mesfin Benti Tolera and Il-Moon Chung worked on the analysis of the results. Sun Woo Chang contributed the presentation of the results. All three authors jointly wrote the paper and have approved the final manuscript.
Acknowledgments
This work was supported by a grant (18RDRP-B076272-05) from Infrastructure and transportation technology promotion research program funded by the Ministry of Land, Infrastructure, and Transport of Korean government.
Conflicts of Interest
The authors declare no conflict of interest.
References
- Setegn, S.G.; Rayner, D.; Melesse, A.M.; Dargahi, B.; Srinivasan, R.; Wörman, A. Climate Change Impact on Agricultural Water Resources Variability in the Northern Highlands of Ethiopia. In Nile River Basin; Melesse, A.M., Ed.; Springer: Dordrecht, The Netherlands, 2011; pp. 241–265. ISBN 978-94-007-0688-0. [Google Scholar]
- Wagner, P.D.; Bhallamudi, S.M.; Narasimhan, B.; Kumar, S.; Fohrer, N.; Fiener, P. Comparing the effects of dynamic versus static representations of land use change in hydrologic impact assessments. Environ. Model. Softw. 2017. [Google Scholar] [CrossRef]
- Wagner, P.D.; Bhallamudi, S.M.; Narasimhan, B.; Kantakumar, L.N.; Sudheer, K.P.; Kumar, S.; Schneider, K.; Fiener, P. Dynamic integration of land use changes in a hydrologic assessment of a rapidly developing Indian catchment. Sci. Total Environ. 2016, 539, 153–164. [Google Scholar] [CrossRef] [PubMed]
- Zhang, L.; Nan, Z.; Xu, Y.; Li, S. Hydrological Impacts of Land Use Change and Climate Variability in the Headwater Region of the Heihe River Basin, Northwest China. PLoS ONE 2016, 11, e0158394. [Google Scholar] [CrossRef] [PubMed]
- Napoli, M.; Massetti, L.; Orlandini, S. Hydrological response to land use and climate changes in a rural hilly basin in Italy. Catena 2017, 157, 1–11. [Google Scholar] [CrossRef]
- Zhu, D.; Das, S.; Ren, Q. Hydrological Appraisal of Climate Change Impacts on the Water Resources of the Xijiang Basin, South China. Water 2017, 9, 793. [Google Scholar] [CrossRef]
- Daggupati, P.; Shukla, R.; Mekonnen, B.; Rudra, R.; Biswas, A.; Goel, P.K.; Prasher, S.; Yang, W. Hydrological Responses to Various Land Use, Soil and Weather Inputs in Northern Lake Erie Basin in Canada. Water 2018, 10, 222. [Google Scholar] [CrossRef]
- Mekonnen, M.A.; Wörman, A.; Dargahi, B.; Gebeyehu, A. Hydrological modelling of Ethiopian catchments using limited data. Hydrol. Process. 2009, 23, 3401–3408. [Google Scholar] [CrossRef]
- Noori, N.; Kalin, L. Coupling SWAT and ANN models for enhanced daily streamflow prediction. J. Hydrol. 2016, 533, 141–151. [Google Scholar] [CrossRef]
- Borah, D.K.; Bera, M. Watershed−Scale Hydrologic and Nonpoint-source Pollution Models: Review of Applications.pdf. Am. Soc. Agric. Eng. 2004, 47, 789–803. [Google Scholar] [CrossRef]
- Bannwarth, M.A.; Hugenschmidt, C.; Sangchan, W.; Lamers, M.; Ingwersen, J.; Ziegler, A.D.; Streck, T. Simulation of stream flow components in a mountainous catchment in northern Thailand with SWAT, using the ANSELM calibration approach. Hydrol. Process. 2015, 29, 1340–1352. [Google Scholar] [CrossRef]
- Pfannerstill, M.; Bieger, K.; Guse, B.; Bosch, D.D.; Fohrer, N.; Arnold, J.G. How to Constrain Multi-Objective Calibrations of the SWAT Model Using Water Balance Components. JAWRA J. Am. Water Resour. Assoc. 2017, 53, 532–546. [Google Scholar] [CrossRef] [Green Version]
- Abbaspour, K.; Vaghefi, S.; Srinivasan, R. A Guideline for Successful Calibration and Uncertainty Analysis for Soil and Water Assessment: A Review of Papers from the 2016 International SWAT Conference. Water 2017, 10, 6. [Google Scholar] [CrossRef]
- Conway, D.; Mould, C.; Bewket, W. Over one century of rainfall and temperature observations in Addis Ababa, Ethiopia. Int. J. Climatol. 2004, 24, 77–91. [Google Scholar] [CrossRef] [Green Version]
- Habib, E.; Aduvala, A.V.; Meselhe, E.A. Analysis of radar-rainfall error characteristics and implications for streamflow simulation uncertainty. Hydrol. Sci. J. 2008, 53, 568–587. [Google Scholar] [CrossRef] [Green Version]
- Mzirai, O.B.; Tumbo, S.D.; Bwana, T.; Hatibu, N.; Rwehumbiza, F.B.; Gowing, J.W. Evaluation of simulator of missing weather data (SMWD) required in simulation of agro hydrological modelling in the catchment and basin level: Case of the Parched-Thirst and Marksim Model. In Proceedings of the International Water Management Institute Conference Papers, Santiago, Chile, 15–17 March 2005. [Google Scholar]
- Saha, S.; Moorthi, S.; Pan, H.-L.; Wu, X.; Wang, J.; Nadiga, S.; Tripp, P.; Kistler, R.; Woollen, J.; Behringer, D.; et al. The NCEP Climate Forecast System Reanalysis. Bull. Am. Meteorol. Soc. 2010, 91, 1015–1058. [Google Scholar] [CrossRef]
- Fuka, D.R.; Walter, M.T.; MacAlister, C.; Degatetono, A.T.; Steenhuis, T.S.; Easton, Z.M. Using the Climate Forecast System Reanalysis as weater input data for watershed models. Hydrol. Process. 2013. [Google Scholar] [CrossRef]
- Worqlul, A.W.; Maathuis, B.; Adem, A.A.; Demissie, S.S.; Langan, S.; Steenhuis, T.S. Comparison of rainfall estimations by TRMM 3B42, MPEG and CFSR with ground-observed data for the Lake Tana basin in Ethiopia. Hydrol. Earth Syst. Sci. 2014, 18, 4871–4881. [Google Scholar] [CrossRef] [Green Version]
- Dile, Y.T.; Srinivasan, R. Evaluation of CFSR climate data for hydrologic prediction in data-scarce watersheds: An application in the Blue Nile River Basin. JAWRA J. Am. Water Resour. Assoc. 2014, 50, 1226–1241. [Google Scholar] [CrossRef]
- Roth, V.; Lemann, T. Comparing CFSR and conventional weather data for discharge and soil loss modelling with SWAT in small catchments in the Ethiopian Highlands. Hydrol. Earth Syst. Sci. 2016, 20, 921–934. [Google Scholar] [CrossRef] [Green Version]
- Girons lopez, M.; Wennerström, H.; Nordén, L.; Seibert, J. Location and density of rain gauges for the estimation of spatial varying precipitation. Geogr. Ann. Ser. Phys. Geogr. 2015, 97, 167–179. [Google Scholar] [CrossRef] [Green Version]
- Water Resources Publications. Computer Models of Watershed Hydrology; Singh, V.P., Ed.; Second Printing; Water Resources Publications, LLC: Denver, CO, USA, 2012; ISBN-13 978-1-887201-74-2. [Google Scholar]
- Gassman, P.W.; Reyes, M.R.; Green, C.H.; Arnold, J.G. The soil and water assessment tool: Historical development, applications, and future research directions. Trans. ASABE 2007, 50, 1211–1250. [Google Scholar] [CrossRef]
- Neitsch, S.L.; Arnold, J.G.; Kiniry, J.R.; Williams, J.R. Soil and Water Asassiment Tool Theoretical Documentation Version 2009; Texas Water Resources Institute: College Station, TX, USA, 2011. [Google Scholar]
- Setegn, S.G.; Srinivasan, R.; Melesse, A.M.; Dargahi, B. SWAT model application and prediction uncertainty analysis in the Lake Tana Basin, Ethiopia. Hydrol. Process. 2009. [Google Scholar] [CrossRef]
- Setegn, S.G.; Srinivasan, R.; Dargahi, B. Hydrological modelling in the Lake Tana Basin, Ethiopia using SWAT model. Open Hydrol. J. 2008, 2, 49–62. [Google Scholar] [CrossRef]
- Tessema, S.M.; Setegn, S.G.; Mörtberg, U. Watershed Modeling as a Tool for Sustainable Water Resources Management: SWAT Model Application in the Awash River Basin, Ethiopia. In Sustainability of Integrated Water Resources Management; Setegn, S.G., Donoso, M.C., Eds.; Springer International Publishing: Cham, Switzerland, 2015; pp. 579–606. ISBN 978-3-319-12193-2. [Google Scholar]
- Tibebe, D.; Bewket, W. Surface runoff and soil erosion estimation using the SWAT model in the Keleta Watershed, Ethiopia. Land Degrad. Dev. 2011, 22, 551–564. [Google Scholar] [CrossRef]
- Tachikawa, T.; Kaku, M.; Iwasaki, A.; Gesch, D.B.; Oimoen, M.J.; Zhang, Z.; Danielson, J.J.; Krieger, T.; Curtis, B.; Haase, J. ASTER Global Digital Elevation Model Version 2-Summary of Validation Results; NASA: Washington, DC, USA, 2011. [Google Scholar]
- Jun, C.; Ban, Y.; Li, S. China: Open access to Earth land-cover map. Nature 2014, 514, 434. [Google Scholar] [CrossRef] [PubMed]
- Nachtergaele, F.O.; van Velthuizen, H.; Verelst, L.; Batjes, N.H.; Dijkshoorn, J.A.; van Engelen, V.W.P.; Fischer, G.; Jones, A.; Montanarella, L.; Petri, M. Harmonized World Soil Database (Version 1.0); Food and Agric Organization of the UN (FAO): Rome, Italy; International Inst. for Applied Systems Analysis (IIASA): Laxenburg, Austria; ISRIC-World Soil Information: Wageningen, The Netherlands; Inst. of Soil Science-Chinese Acad. of Sciences (ISS-CAS): Nanjing, China; EC-Joint Research Centre (JRC): Brussels, Belgium, 2008. [Google Scholar]
- Suhaila, J.; Sayang, M.D.; Jemain, A.A. Revised Spatial Weighting Methods for Estimation of Missing Rainfall Data. Asia-Pac. J. Atmos. Sci. 2008, 44, 93–104. [Google Scholar]
- Pignotti, G.; Rathjens, H.; Cibin, R.; Chaubey, I.; Crawford, M. Comparative Analysis of HRU and Grid-Based SWAT Models. Water 2017, 9, 272. [Google Scholar] [CrossRef]
- Arabi, M.; Govindaraju, R.S.; Hantush, M.M.; Engel, B.A. Role of Watershed Subdivision on Modeling the Effectiveness of Best Management Practices with Swat. J. Am. Water Resour. Assoc. 2006, 42, 513–528. [Google Scholar] [CrossRef]
- Abbaspour, K.C.; Yang, J.; Maximov, I.; Siber, R.; Bogner, K.; Mieleitner, J.; Zobrist, J.; Srinivasan, R. Modelling hydrology and water quality in the pre-alpine/alpine Thur watershed using SWAT. J. Hydrol. 2007, 333, 413–430. [Google Scholar] [CrossRef]
- Abbaspour, K.C.; Rouholahnejad, E.; Vaghefi, S.; Srinivasan, R.; Yang, H.; Kløve, B. A continental-scale hydrology and water quality model for Europe: Calibration and uncertainty of a high-resolution large-scale SWAT model. J. Hydrol. 2015, 524, 733–752. [Google Scholar] [CrossRef]
- Moriasi, D.N.; Arnold, J.G.; Van Liew, M.W.; Bingner, R.L.; Harmel, R.D.; Veith, T.L. Model evaluation guidelines for systematic quantification of accuracy in watershed simulations. Trans. ASABE 2007, 50, 885–900. [Google Scholar] [CrossRef]
Figure 1.
Map of Melka Kunture (left) and Keleta (right) sub-basins with conventional weather stations, Climate Forecast System Reanalysis (CFSR) grids, river gauge stations, digital elevation maps (DEM), and river networks.
Figure 1.
Map of Melka Kunture (left) and Keleta (right) sub-basins with conventional weather stations, Climate Forecast System Reanalysis (CFSR) grids, river gauge stations, digital elevation maps (DEM), and river networks.

Figure 2.
Land use map used at the (a) Melka Kunture and (b) Keleta sub-basins.

Figure 3.
Soil map used at the (a) Melka Kunture and (b) Keleta sub-basins.

Figure 4.
Average monthly areal rainfall distribution as box plots from the weather data (1990–2004). (a) Conventional meteorological weather station at Melka Kunture, (b) CFSR at Melka Kunture, (c) conventional at Keleta, and (d) CFSR at Keleta.
Figure 4.
Average monthly areal rainfall distribution as box plots from the weather data (1990–2004). (a) Conventional meteorological weather station at Melka Kunture, (b) CFSR at Melka Kunture, (c) conventional at Keleta, and (d) CFSR at Keleta.

Figure 5.
Average annual rainfall distribution of each station and grid (1990–2004) from (a) the conventional weather station data and (b) the CFSR weather for the Melka Kunture sub-basin; and (c) the conventional weather station data and (d) the CFSR weather for the Keleta sub-basin.
Figure 5.
Average annual rainfall distribution of each station and grid (1990–2004) from (a) the conventional weather station data and (b) the CFSR weather for the Melka Kunture sub-basin; and (c) the conventional weather station data and (d) the CFSR weather for the Keleta sub-basin.

Figure 6.
Observed streamflow (m3/s) at Melka Kunture and Keleta gauging stations (1990–1995).

Figure 7.
Time series of daily observed flow and areal rainfall. (a) Observed flow vs. rainfall from conventional weather at Melka Kunture, (b) observed flow vs. rainfall from CFSR weather at Melka Kunture, (c) observed flow vs. rainfall from conventional weather at Keleta, and (d) observed flow vs. rainfall from CFSR weather at Keleta.

Figure 8.
Observed and simulated streamflow at sub-basin outlets (a) using conventional weather data and (b) CFSR global weather data at Melka Kunture, and (c) sing conventional weather data and (d) CFSR global weather data at Keleta.
Figure 8.
Observed and simulated streamflow at sub-basin outlets (a) using conventional weather data and (b) CFSR global weather data at Melka Kunture, and (c) sing conventional weather data and (d) CFSR global weather data at Keleta.

Figure 9.
Observed vs. simulated streamflow scatter plots. To simulate the patterns, the weather data used were (a) conventional at Melka Kunture, (b) CFSR at Melka Kunture, (c) conventional at Keleta, and (d) CFSR at Keleta.
Figure 9.
Observed vs. simulated streamflow scatter plots. To simulate the patterns, the weather data used were (a) conventional at Melka Kunture, (b) CFSR at Melka Kunture, (c) conventional at Keleta, and (d) CFSR at Keleta.


Table 1.
Description of conventional weather data meteorological stations used.
| Watershed | Station | Lat. | Long. | Elevation (m) | Average Annual Precipitation (mm) |
|---|---|---|---|---|---|
| Melka Kunture | A.A. Bole | 8.79 | 38.33 | 2130 | 1040 |
| AdisAlem | 8.61 | 38.35 | 1310 | 1140 | |
| A.A. Observatory | 8.78 | 38.64 | 2250 | 1216 | |
| Akaki | 8.97 | 38.12 | 1310 | 980 | |
| Asgori | 8.65 | 38.2 | 2330 | 1116 | |
| Bantu Liben | 9 | 38.25 | 2160 | 1207 | |
| Boneya | 8.86 | 38.78 | 2100 | 813 | |
| Dertu Liben | 8.7 | 38.64 | 2000 | 883 | |
| Ensilale | 8.54 | 37.97 | 2580 | 921 | |
| Holota | 9.05 | 38.4 | 2034 | 1090 | |
| Mkunture | 9.08 | 38.5 | 2393 | 975 | |
| Tulu Bolo | 9.03 | 38.75 | 2408 | 1152 | |
| Wolonkomi | 8.93 | 38.43 | 2200 | 1143 | |
| Woliso | 8.982 | 38.79 | 2329 | 1270 | |
| Keleta | Sagure | 7.7667 | 39.15 | 2460 | 772 |
| Asella | 7.9833 | 39.2 | 2370 | 1101 | |
| Kulumsa | 8.0667 | 39.2333 | 2200 | 885 | |
| Dikssis | 8.05 | 39.5833 | 2680 | 993 | |
| Melkasa | 8.4 | 39.3167 | 1540 | 805 | |
| Huruta | 8.14 | 39.34 | 2044 | 921 | |
| Etheya | 8.13 | 39.33 | 2129 | 1043 |
Table 2.
Performance ratings for recommended statistics for monthly flow [38].
Table 2.
Performance ratings for recommended statistics for monthly flow [38].
| Performance Rating | RSR | NSE | PBIAS (%) |
|---|---|---|---|
| Very Good | 0.00 ≤ RSR ≤ 0.50 | 0.75 < NSE ≤ 1.00 | PBIAS < ±10 |
| Good | 0.50 < RSR ≤ 0.60 | 0.65 < NSE ≤ 0.75 | ±10 ≤ PBIAS < ±15 |
| Satisfactory | 0.60 < RSR ≤ 0.70 | 0.50 < NSE ≤ 0.65 | ±15 ≤ PBIAS < ±25 |
| Unsatisfactory | RSR > 0.70 | NSE ≤ 0.50 | PBIAS ≥ ±25 |
Table 3.
Model performance evaluation statistics for the two sub-basins using the two weather datasets.
Table 3.
Model performance evaluation statistics for the two sub-basins using the two weather datasets.
| Evaluation Period | Evaluation Statistics | Melka Kunture Sub-Basin | Keleta Sub-Basin | ||
|---|---|---|---|---|---|
| Conventional Weather | CFSR Weather | Conventional Weather | CFSR Weather | ||
| Calibration | RSR | 0.33 | 0.45 | 0.57 | 0.45 |
| R2 | 0.89 | 0.82 | 0.69 | 0.86 | |
| NSE | 0.89 | 0.8 | 0.67 | 0.8 | |
| PBIAS | 4.8 | −14.2 | 8.9 | 21.8 | |
| Validation | RSR | 0.29 | 0.32 | 0.92 | 0.69 |
| R2 | 0.92 | 0.94 | 0.26 | 0.54 | |
| NSE | 0.92 | 0.9 | 0.15 | 0.52 | |
| PBIAS | 0.2 | −23 | 20.1 | 21.4 | |
| Performance Rating | Very good | Very Good * | Unsatisfactory | Satisfactory | |
* Based on PBIAS, the rating is outside of the very good range.
Table 4.
Water balance component simulated using the two weather datasets.
| Sub-Basin | Weather Dataset | PCP | SURQ | LATQ | GWQ | PERCO | SW | ET | YIELD | |
|---|---|---|---|---|---|---|---|---|---|---|
| Melka Kunture | conventional | (mm) | 1092 | 142 | 75.6 | 153.9 | 214 | 124 | 642.9 | 358.5 |
| (%) | 100 | 13.0 | 6.9 | 14.1 | 19.6 | 11.4 | 58.9 | 32.8 | ||
| CFSR | (mm) | 1274 | 198 | 102.8 | 203 | 278.4 | 228.4 | 785.2 | 492.8 | |
| (%) | 100 | 15.5 | 8.1 | 15.9 | 21.9 | 17.9 | 61.6 | 38.7 | ||
| Keleta | conventional | (mm) | 795 | 117.6 | 81.7 | 113 | 186.9 | 185 | 418.5 | 302.9 |
| (%) | 100 | 14.8 | 10.3 | 14.2 | 23.5 | 23.3 | 52.6 | 38.1 | ||
| CFSR | (mm) | 875 | 103 | 73.3 | 88 | 221.8 | 164 | 486.3 | 256.2 | |
| (%) | 100.0 | 11.8 | 8.4 | 10.1 | 25.3 | 18.7 | 55.6 | 29.3 | ||
© 2018 by the authors. Licensee MDPI, Basel, Switzerland. This article is an open access article distributed under the terms and conditions of the Creative Commons Attribution (CC BY) license (http://creativecommons.org/licenses/by/4.0/).
Share and Cite
MDPI and ACS Style
Tolera, M.B.; Chung, I.-M.; Chang, S.W. Evaluation of the Climate Forecast System Reanalysis Weather Data for Watershed Modeling in Upper Awash Basin, Ethiopia. Water 2018, 10, 725. https://doi.org/10.3390/w10060725
AMA Style
Tolera MB, Chung I-M, Chang SW. Evaluation of the Climate Forecast System Reanalysis Weather Data for Watershed Modeling in Upper Awash Basin, Ethiopia. Water. 2018; 10(6):725. https://doi.org/10.3390/w10060725
Chicago/Turabian StyleTolera, Mesfin Benti, Il-Moon Chung, and Sun Woo Chang. 2018. "Evaluation of the Climate Forecast System Reanalysis Weather Data for Watershed Modeling in Upper Awash Basin, Ethiopia" Water 10, no. 6: 725. https://doi.org/10.3390/w10060725
Note that from the first issue of 2016, this journal uses article numbers instead of page numbers. See further details here.