Oxygen and Hydrogen Isotopes of Precipitation in a Rocky Mountainous Area of Beijing to Distinguish and Estimate Spring Recharge

Key Laboratory of State Forestry Administration on Soil and Water Conservation, Beijing Forestry University, Beijing 100083, China
*
Author to whom correspondence should be addressed.
Water 2018, 10(6), 705; https://doi.org/10.3390/w10060705
Submission received: 3 April 2018
/
Revised: 23 May 2018
/
Accepted: 24 May 2018
/
Published: 30 May 2018
(This article belongs to the Section Hydrology)
Abstract
:Stable isotopes of oxygen and hydrogen were used to estimate seasonal contributions of precipitation to natural spring recharge in Beijing’s mountainous area. Isotopic compositions were shown to be more positive in the dry season and more negative in the wet season, due to the seasonal patterns in the amount of precipitation. The local meteoric water line (LMWL) was δ2H = 7.0 δ18O − 2.3 for the dry season and δ2H = 5.9 δ18O − 10.4 for the wet season. LMWL in the two seasons had a lower slope and intercept than the Global Meteoric Water Line (p < 0.01). The slope and intercept of the LMWL in the wet season were lower than that in the dry season because of the effect of precipitation amount during the wet season (p < 0.01). The mean precipitation effects of −15‰ and −2‰ per 100 mm change in the amount of precipitation for δ2H and δ18O, respectively, were obtained from the monthly total precipitation and its average isotopic value. The isotopic composition of precipitation decreased when precipitation duration increased. Little changes in the isotopic composition of the natural spring were found. By employing isotope conservation of mass, it could be derived that, on average, approximately 7.2% of the natural spring came from the dry season precipitation and the rest of 92.8% came from the wet season precipitation.
1. Introduction
Groundwater is an essential water resource for forests. It plays an important role in forest ecosystems for ecological functions [1] by shaping species distribution, supplying irrigation and regulating the water cycle [2]. Global climate change affects groundwater levels [3] and leads to water shortages in forest ecosystems [4]. Investigating the relationship between groundwater limitations and forest ecosystems is becoming increasingly important, especially for areas that are susceptible to seasonal drought with a spatially uneven precipitation distribution [5,6]. Along with the development of environmental isotope hydrology in the 1960s, oxygen and hydrogen isotopes of water have been widely used as tracers for understanding the processes of the hydrological cycle [7,8,9,10,11].
Environmental isotopes, as a notably good indicator, have been widely used for distinguishing pathways of soil water infiltration, observing groundwater–surface water interactions, and identifying groundwater recharge [12,13,14,15]. The isotopic compositions of groundwater can be used as natural tracers [16]. It relates not only to the accumulated meteoric water with little evaporation isotope fractionation, but it also reflects the differences in isotopic compositions of groundwater along the flow path [17]. The process of groundwater recharge by soil water infiltration from precipitation is complex. The process is affected by many factors including climate conditions, texture structure of soil, soil moisture and vegetation coverage [18], which brings seasonal variations in the isotopic compositions of water bodies. This allows us to determine the relations among different water bodies based on their respective isotopic compositions. Many studies at present mainly focus on the characteristics of water isotopes in the context of changes in the hydrological cycle [19], such as changes of atmospheric precipitation [20], hydrogen and oxygen isotopes in the processes of soil water infiltration [17], and identities of stream and spring origins [21,22,23]. However, there were not enough studies estimating groundwater derived from seasonal precipitation (dry and wet) based on oxygen and hydrogen isotopic compositions, especially in rocky mountainous areas [24].
Due to the complexity and difficulty of using the traditional way, oxygen and hydrogen isotopes were used as natural tracers in this study: (1) To document the temporal variability of isotopic compositions in precipitation and factors of influence; and (2) to determine the varied characteristics of isotopic values in the precipitation process and to distinguish groundwater recharge by the seasonal precipitation in the rocky mountainous area of Northern China. This study’s prospect is to provide useful information on forest hydrological processes, to help the management of the sustainable utilization of groundwater resources, and to provide an important reference for the region’s water cycle management.
2. Materials and Methods
2.1. Study Sites and Experimental Design
This study was conducted at the National Forest Ecosystem Research Station (NFERS) (40°03′ N, 116°05′ E), which is in the north of the North China Plain and adjacent to the northern end of the Taihang Mountain and Yanshan Mountain (Figure 1a). The study area has been set at a hilly area within the mountain-to-plain transition 30 km away from Beijing, nearer to the plains with the lowest elevation in the western region. The special geographical location of the study area forms a unique system of water circulation. The altitude of the study site is between 60 m and 510 m, with a warm temperate and a semi-humid, semi-arid continental monsoonal climate. The annual mean temperature was 11.6 °C, with an absolute min/max December 2011/July 2011 temperatures of −19.6 °C/41.6 °C. The annual mean precipitation was 660 mm in the study area over the last 20 years; approximately 70–80% of the precipitation occurred in the wet season, mostly in July and August. The mean annual potential evapotranspiration was approximately 1100 mm. The study site is predominated by Platycladus orientalis, Pinus tabuliformis, Quercus variabilis and Robinia pseudoacacia, which were planted by the local government in the 1960s. The soil on the ground was sandy clay loam with a depth of 80–100 cm. There was little litter in the surface layer, with low stone-gravel content in the soil profile. Below the soil layer, there was loose tuff from weathered and calcareous rock and fissures between bedrock beds. They were covered by loose sediments of the Quaternary, which made natural springs form easily. The spring water collection points (the elevation is 110 m) were located at Jinshan temple, which is 1 km from the sample site (Figure 1b). The spring water flows continuously all year round.
2.2. Sample Collection
To better demonstrate the process of precipitation and distinguish recharge of spring water by the seasonal precipitation in the rocky mountainous area of Northern China, the samples of each stage, from precipitation to spring water, were collected including the precipitation, stream runoff, throughfall, surface runoff, water extracted from soil, and springs. All samples were collected from January 2011 to December 2012.
In two plots, three soil sampling points were selected on the upper slope, mid-slope and lower slope, 1 m away from the dominant trees. Soil samples were collected from various layers: depths of 0–10, 10–20, 20–30, 30–40, 40–60, 60–80 and 80–100 cm with a soil auger. Three replicates were obtained from each layer one day after the precipitation. Once the samples were collected, they were placed into a 50 mL centrifuge tube, sealed with Parafilm® (Bemis, Neenah, WI, USA), and stored in a freezer until isotope analysis.
Precipitation data was collected by a weather station, which was 1 km away from the soil sampling sites (The elevation is 110 m). To collect precipitation samples at the end of each >2 mm precipitation event, three iron collecting buckets (inner diameter of 15 cm) were placed near the weather station with no surrounding barriers. The collection bucket for throughfall samples was positioned in the forest under the trees. A funnel with a table tennis ball was placed on the top of the collection bucket to avoid isotope evaporative fractionation. Precipitation samples were collected at the end of each precipitation event. The collected samples were quickly transferred into clean polyethylene bottles (50 mL), sealed with Parafilm®, numbered, and stored in a freezer. This was the same method used in the given literature [25,26,27,28].
For light to moderate precipitation events, precipitation samples were collected once the precipitation ceased. For heavy or long–duration precipitation, samples were collected hourly until it ended. The collected samples were quickly transferred into 50 mL plastic test tubes, sealed with Parafilm®, numbered and then put into a freezer. In the wet season, heavy precipitation results in surface runoffs, which easily accumulates in a flow-gaging weir. Samples of runoff were collected when the runoff was stable at three sampling points on the upper, mid and lower slopes. A centrifuge tube was filled with water to avoid the exchange of water vapor when collecting the samples. The collected samples were sealed with Parafilm® and stored in a freezer.
The sampling time of spring water corresponded with the soil sampling. Three spring samples were collected each time. The collected spring samples were sealed with Parafilm® and stored in a freezer (−4 °C) to prevent isotope fractionation.
There were 168 precipitation samples, 180 soil samples and 36 nature spring samples in total. For soil samples, the extraction of soil water was initially performed by low temperature vacuum condensation. The soil samples were incubated under 0.02 hPa at 95 °C for 2 h. The extracting percent of water from samples was >99.0%, which would be sufficient to obtain un-fractionated water samples [29]. The determination of analytical water samples requires at least 0.5 mL of water, so more soil samples were needed to extract enough water from the dry soil with less moisture.
2.3. Determination of Hydrogen and Oxygen Isotopic Compositions of Water Samples
The hydrogen and oxygen isotopic compositions were determined at the Ecological Hydrological Process and Mechanism Laboratory of Beijing Forestry University. The thawing process of the water samples was conducted in a sealed sampling bottle. The weight difference between before and after the thawing process of each sample was measured. A sample was considered to have no isotope fractionation during thawing if the weight difference was less than 0.001 g. The isotopic compositions of all samples were measured by a liquid-water isotope analyzer (Los Gatos Research DLT-100, ABB, New York, NY, USA) with isotopic ratio precisions of ±0.3‰ and ±0.1‰ for δ2H and δ18O, respectively. Each sample was measured 6 times, and the injection amount was about 3.5 × 10¹⁶ N·cm−3 [30]. The δ2H and δ18O values are expressed as the 2H/H and 18O/16O relative to Vienna Standard Mean Ocean Water (VSMOW) in ‰. The water standard used in this study for water sample measurement was 3C (δ2H: −97.3 ± 0.5‰; δ18O: −13.39 ± 0.15‰), 4C (δ2H: −51.6 ± 0.5‰; δ18O: −7.94 ± 0.15‰) and 5C (δ2H: 9.2 ± 0.5‰; δ18O: −2.69 ± 0.15‰). The isotopic ratio was expressed as:
where, the X was the measured value of hydrogen and oxygen; Rsample and Rstandard were the isotopic ratio of the samples and the VSMOW, respectively [31].
δX = (Rsample − Rstandard)/Rstandard × 1000‰,
Monthly weighted means of δ2H and δ18O for precipitation (δp, mean) were calculated as:
where δpi is the δ2H and δ18O of the precipitation, Pi is the amount of the precipitation.
2.4. Data Analysis
Statistical analyses were performed using SPSS 16.0 (IBM, New York, NY, USA) program. The relationship between the δ2H and δ18O values were analyzed by the ordinary least-squares linear regression model. Then, one-way analysis of variances (ANOVAs) was implemented to analyze the differences of the slopes and the intercepts among individual lines. The multiple linear regression method was employed to analyze the effect of precipitation and temperature on isotope values.
3. Results and Discussion
3.1. Distribution and Isotopic Compositions of Precipitation
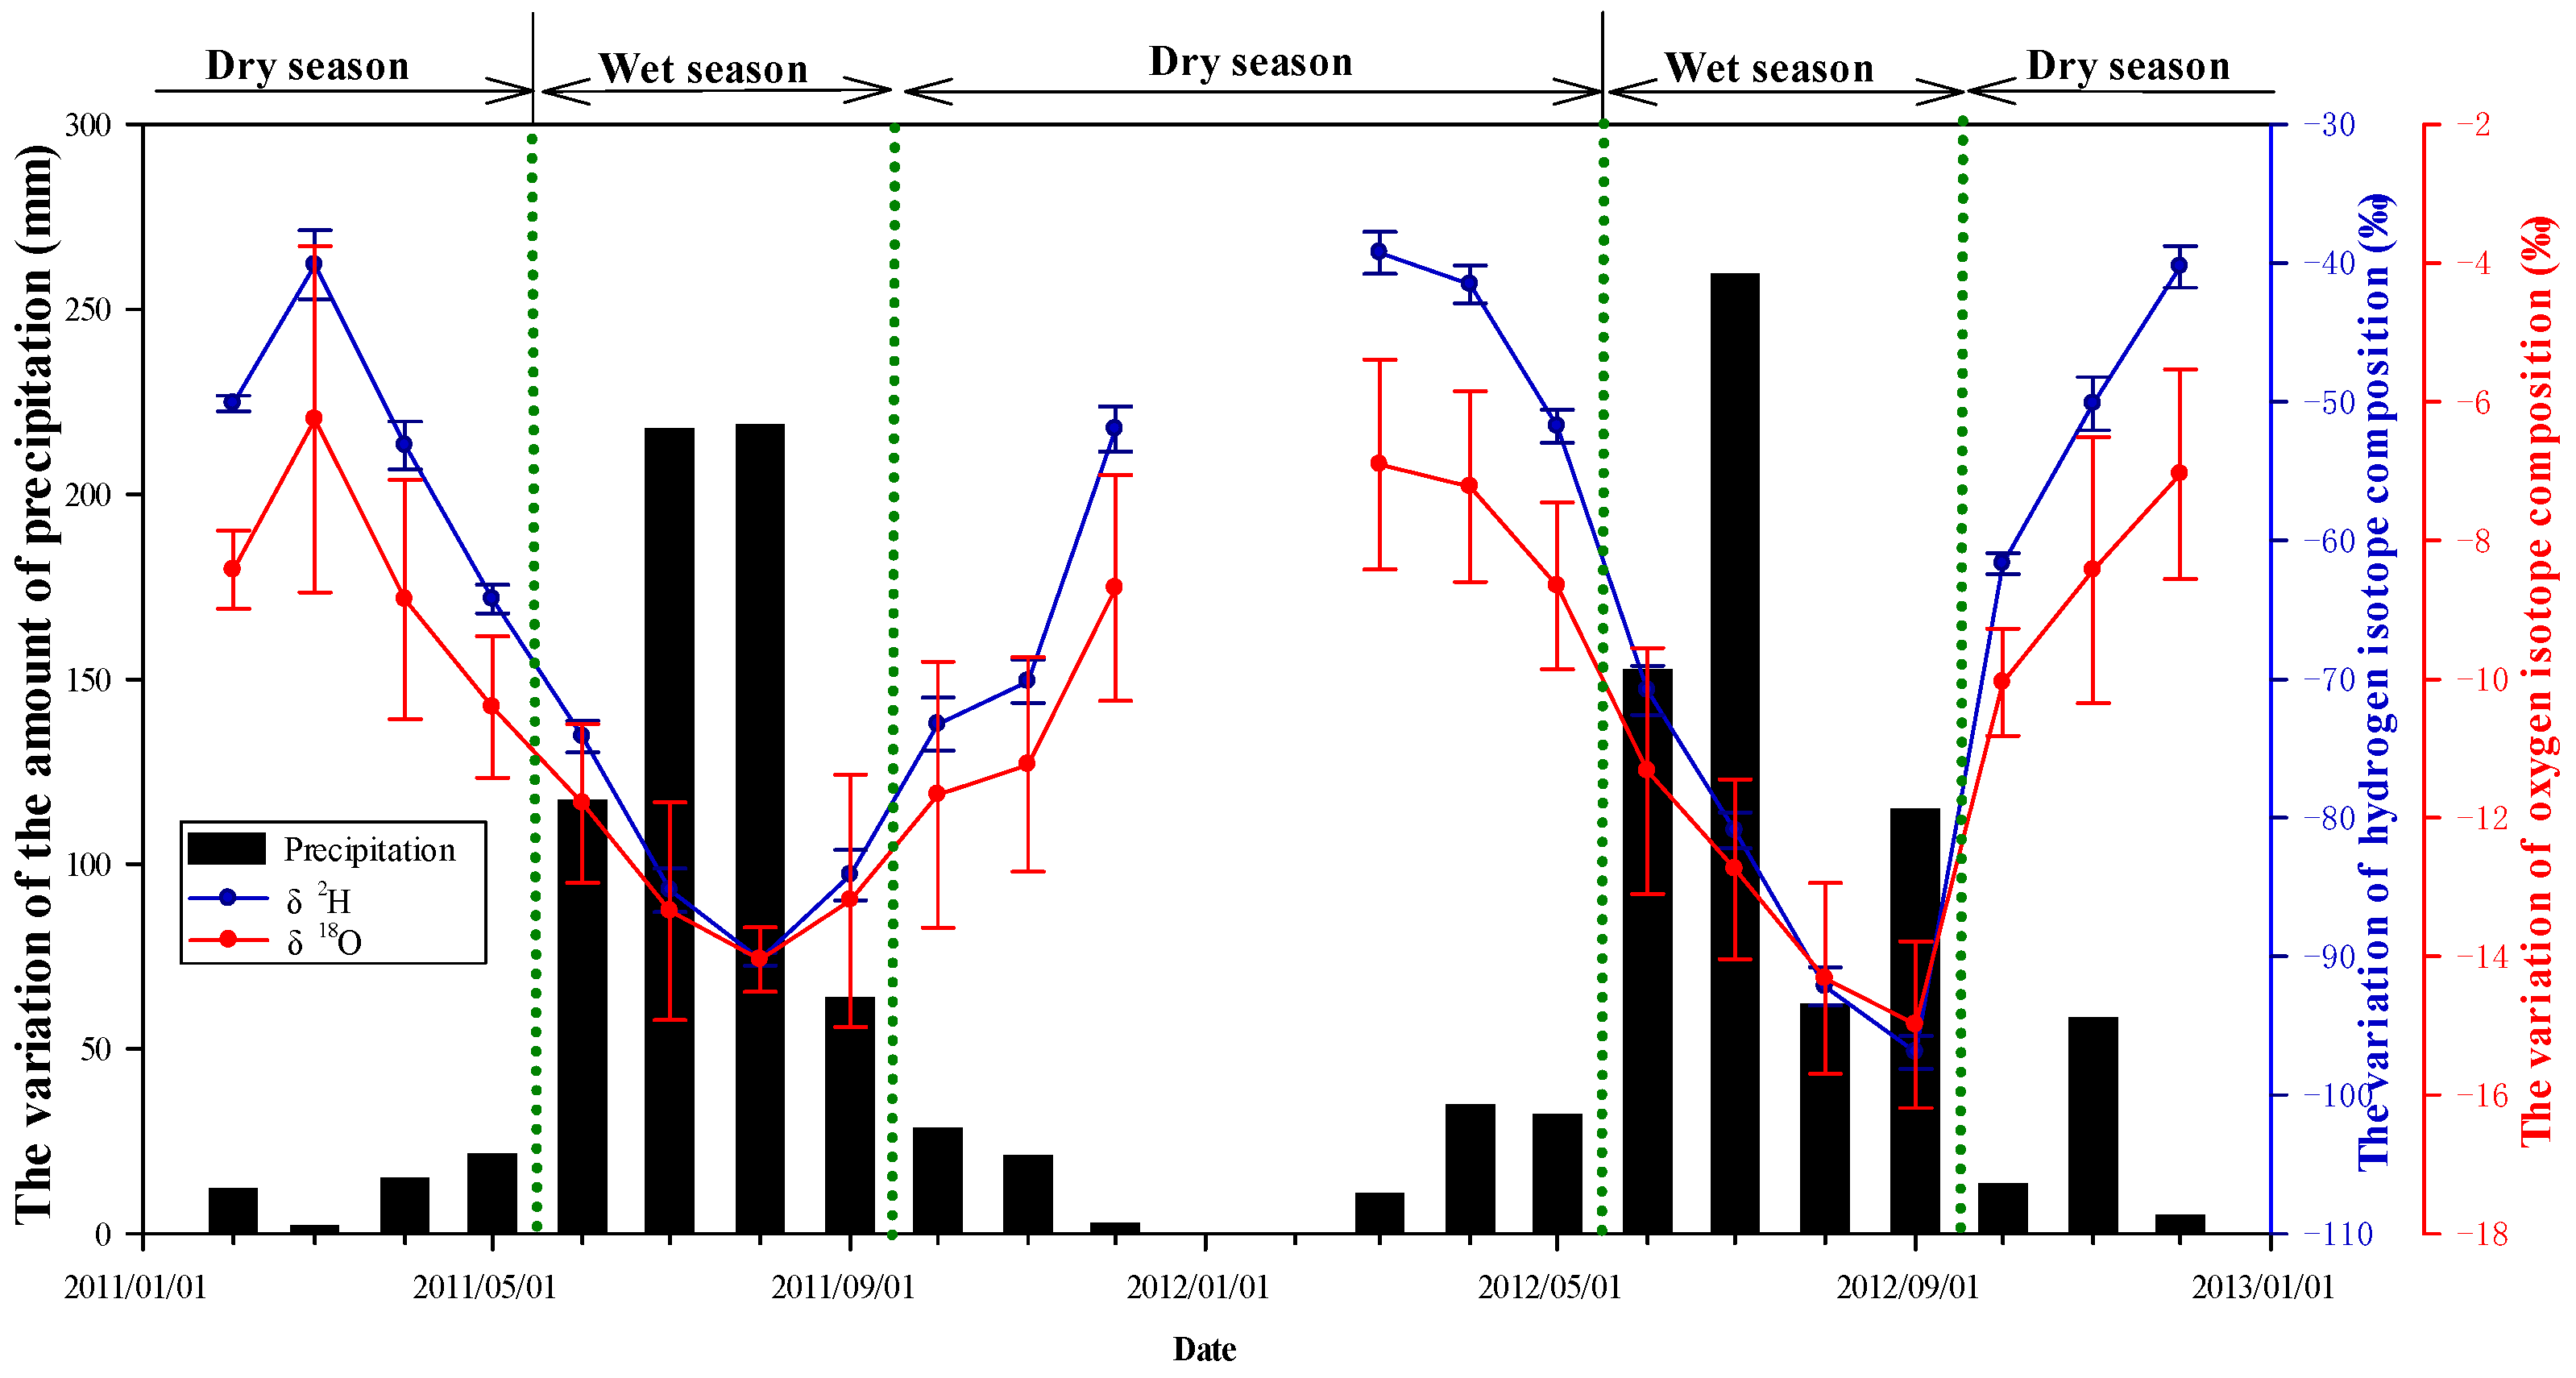
Precipitation is an important input factor of the water cycle in forest ecosystems. Precipitation in the mountainous area of Northern China could be distinguished by the dry season (from October to following May) and the wet season (from June to September). Over the past two years of this study, the annual precipitation was 720.6 mm in 2011 and 745.2 mm in 2012, respectively; it was evident that there was more precipitation in the wet season than in the dry season (Figure 2). The monthly average precipitation in the dry season was lower and it gradually increased as the wet season arrived. Similarly, the amount of precipitation gradually decreased towards the end of the wet season. The total precipitation in the wet season was 436.8 mm in 2011 and 501.0 mm in 2012, respectively, which accounted for 58.6% and 69.5% of the total precipitation, respectively. On 21 July 2012, one precipitation event lasted for 16 h and the amount of precipitation reached 146.0 mm alone.
The isotopic compositions of precipitation were quite variable with an obvious seasonal variation during the study period, and it showed a significant negative relationship with the amount of precipitation (p < 0.0001) (Figure 2). Generally, the δ2H and δ18O values of precipitation in the dry season (mean values of −52.88‰ and −8.75‰, respectively) were more positive than those in the wet season (mean values of the −84.31‰ and −13.21‰, respectively) (p < 0.0001). The hydrogen and oxygen of precipitation gradually increased since the beginning of the dry season. The δ2H ranged from −73.25‰ to −39.25‰ with the weighted means of −40.09‰ and δ18O ranged from −11.66‰ to −6.25‰ with the weighted means of −5.84‰. When transitioning into the wet season, the δ2H and δ18O values of precipitation decreased moderately. δ2H ranged from −96.91‰ to −70.79‰ with the weighted means of 37.48‰ and δ18O ranged from −14.98‰ to −11.32‰ with the weighted means of −5.47‰.
Since Northern China is monsoonal, the seasonal variations of precipitation isotopes may not be only related to the different monsoons, but also to the local water circulation [24,32]. In the study area, the water vapor formed during the dry season was set in a relatively dry and cold condition, which caused the isotopic compositions of precipitation to be heavier than those formed in the wet season. In addition, warm and humid air with significant water vapor associated with the southeast monsoon was delivered from the North Pacific Ocean and the Indian Ocean during the wet season. In contrast, the largely cold and dry air with less water vapor during the dry season was carried by the northwest originating from Siberia. Liu et al. and Wen et al. also found that the isotopic values of seasonal effect were strongly affected by the water vapor source and transport patterns [33,34]. Yamanaka et al. demonstrated that the southeast monsoon results in the lighter isotopic compositions of precipitation with a wider range of values in the wet season [35].
3.2. Local Meteoric Water Lines and Soil Water Characteristic Lines
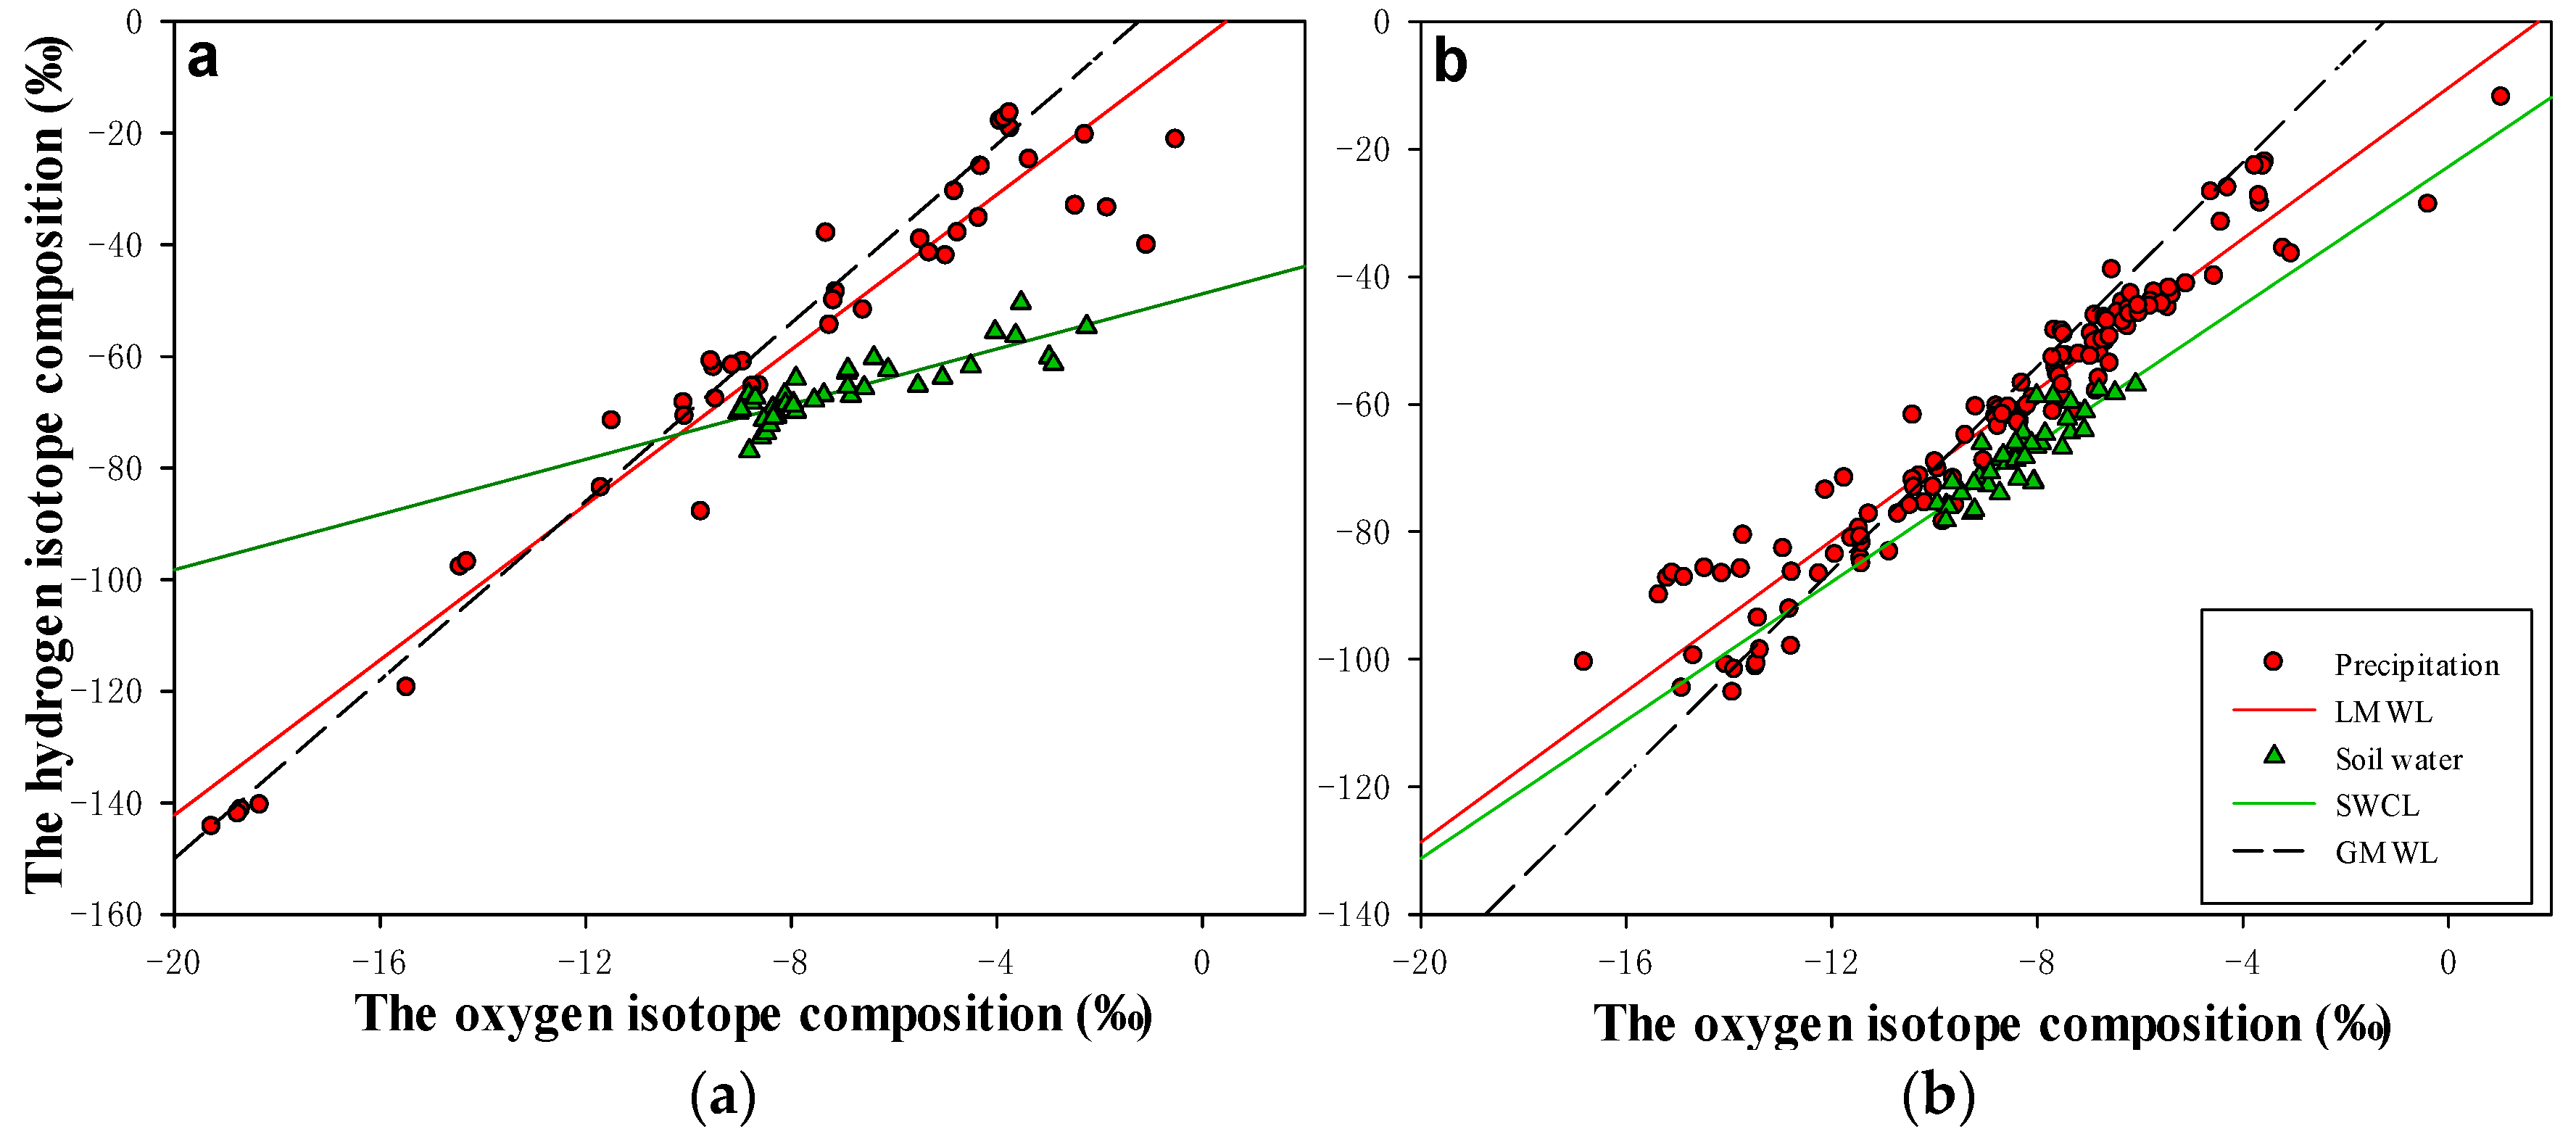
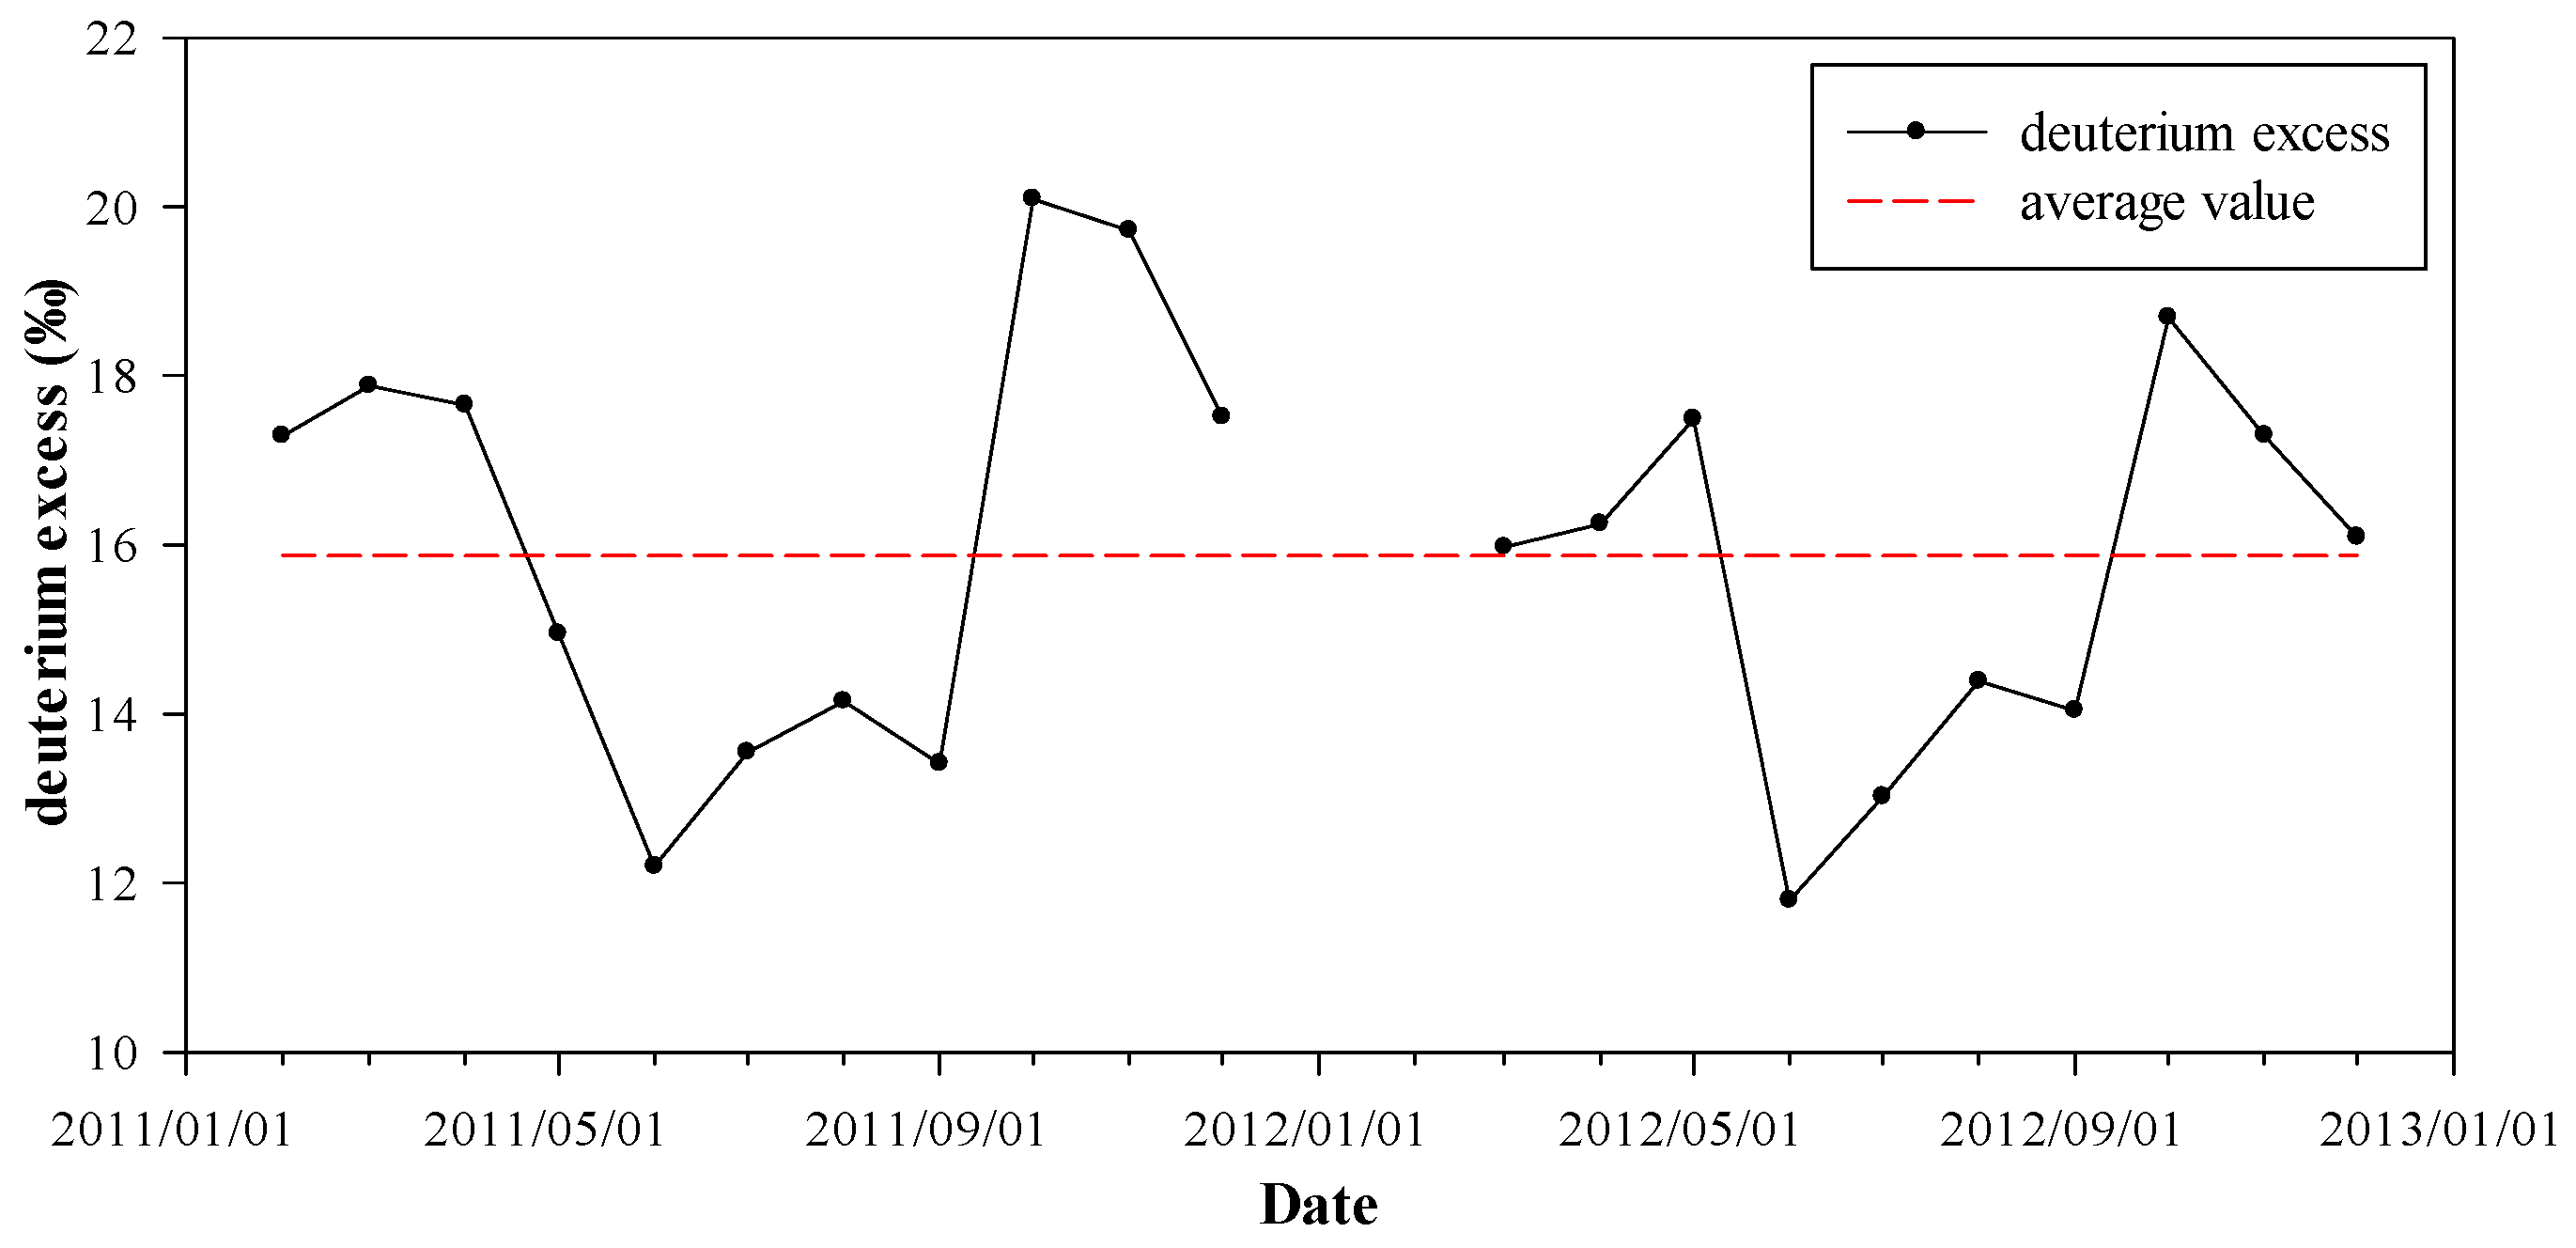
The relationship between δ2H and δ18O in precipitation provided significant information concerning the hydro-geological processes and the atmospheric circulation [36]. During the dry and wet seasons, the precipitation samples were collected from each precipitation event. Local meteoric water line (LMWL) (Table 1) for each season was collected: δ2H = 7.0 δ18O − 2.3 (R2 = 0.94, N = 42, F = 563.5, p < 0.0001) for the dry season and δ2H = 5.9 δ18O − 10.4 (R2 = 0.92, N = 126, F = 1502.5, p < 0.0001) for the wet season (Figure 3). The slopes and intercepts of the LMWL of the two seasons were less than the Global Meteoric Water Line (GMWL), δ2H = 8 δ18O + 10 [37], which indicated that the precipitation was subjected to a certain degree of isotope fractionation in the study region. This was mainly controlled by the isotope fractionation that occurred during evaporation and condensation in the water cycle and the initial state of the water vapor from the source region [34,38]. The monthly amount weighted d–excess values varied from 12‰ to 20‰, with an average of 15.8‰ (Figure 4). The d–excess was higher in the dry season and lower in the wet season. The seasonal variation of d–excess indicated that there were at least two different sources of precipitation. The average d–excess value was 13‰ during the wet season, which can be explained as the LMWL in the wet season did not follow the GMWL. As the study area was governed by a typical monsoonal climate, a substantial amount of water vapor was brought by the prevailing southerly winds from the Pacific Ocean during summer. The strong summer evaporation from the ocean, together with the long fetch, causes the strong isotope fractionation of the water vapor, and enrichment of 2H and 18O [39,40]. The slope and intercept of the LMWL in the dry season were greater than that in the wet season (p < 0.001), which showed that the precipitation in the wet season exhibited more significant isotope fractionation than in the dry season. The heavy precipitation in the wet season represented not only a large amount of precipitation over long periods of time, but also a higher relative humidity, which reduced the lighter isotopes. Hughes et al. also found that high δ2H and δ18O values could be the result of lower relative humidity, while lighter isotopic values could be the result of higher relative humidity [41]. Other influential factors on the δ2H and δ18O in precipitation could be the different sources of seasonal precipitation of the water vapor in Beijing owing to different monsoonal effects [42,43].
In addition, we collected soil water samples in the two seasons and obtained the soil water characteristic line (SWCL) for each season: δ2H = 2.8 δ18O − 45.8 (R2 = 0.63, N = 80, F = 99.8, p < 0.0001) for the dry season and δ2H = 5.4 δ18O − 28.8 (R2 = 0.93, N = 100, F = 127.4, p < 0.0001) for the wet season (Figure 3). The slopes and intercepts of the SWCL for the two seasons were not only less than the GMWL, but also less than the LMWL both in the dry and wet seasons (p < 0.01), which showed that precipitation was subjected to a certain degree of isotope fractionation during the infiltration process in the soil. In addition, the slope and intercept of the SWCL in the dry season were less than that in the wet season (p < 0.01). It indicated that evaporative isotope fractionation was more evident in the wet season than in the dry season, due to higher soil moisture and relative humidity. In the dry season, the surface soil water was not only supplemented by precipitation with heavier isotopes, but was also affected by strong evaporation under both the lower relative humidity and the reduced soil moisture [44]. Therefore, the hydrogen and oxygen isotopic ratios of the soil water in the dry season were more positive than that in the wet season (p < 0.05).
3.3. The Relationship of the Isotopic Composition of Precipitation with the Amount of Precipitation and Temperature
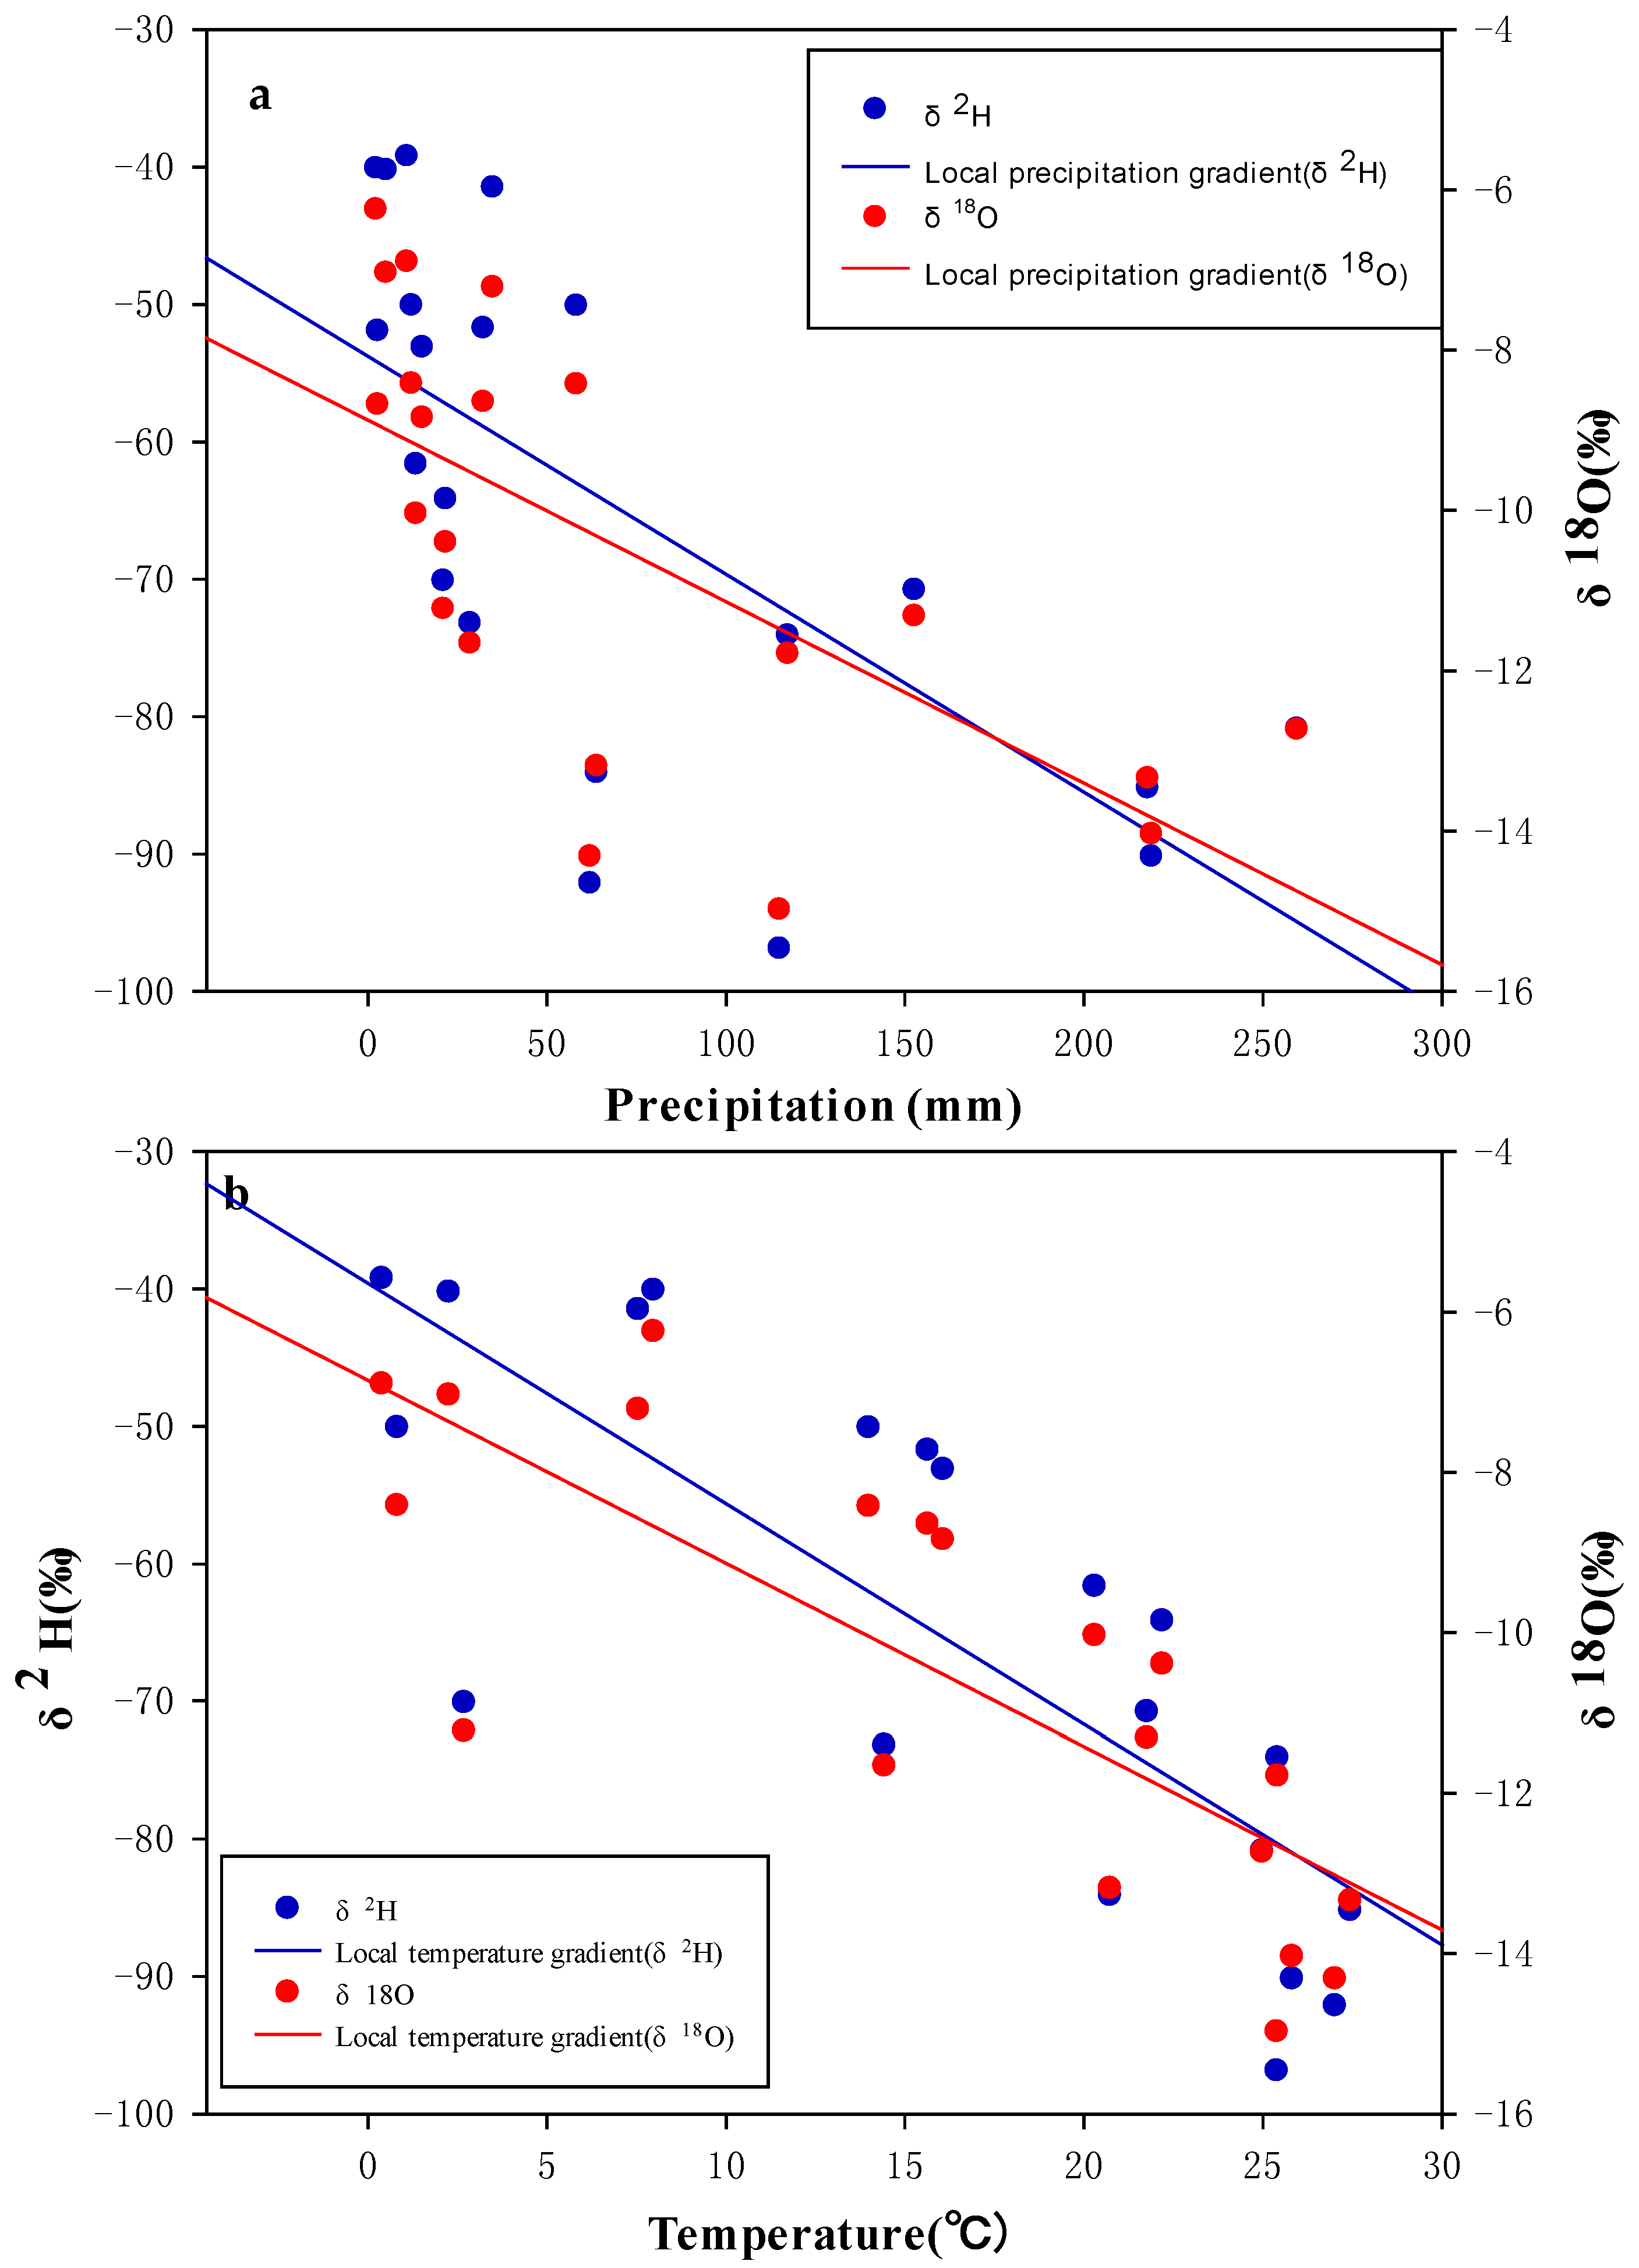
The regression results for the monthly total amount (hereafter as A) of precipitation, with respect to its monthly mean isotopic value, were represented by δ2H = −0.16 A − 53.76 (R2 = 0.67, F = 15.8, p = 0.0008) and δ18O = −0.02 A − 8.87 (R2 = 0.67, F = 15.6, p = 0.0008) (Figure 5a). The values of δ2H and δ18O became lighter with increasing amounts of precipitation. Reduced rates of −15‰ in δ2H and −2‰ in δ18O per 100 mm of precipitation were obtained from the slope of the regression equations. The linear regressions for the monthly mean temperature (hereafter as T), with respect to the monthly mean isotopic value, were represented by δ2H = −1.60 T − 39.61 (R2 = 0.64, F = 31.9, p < 0.0001) and δ18O = −0.20 T − 6.82 (R2 = 0.64, F = 30.9, p < 0.0001) (Figure 5b), which indicated that the values of δ2H and δ18O decreased with increasing temperature. The multiple linear regression results of isotopic values, amount of precipitation and temperature (δ2H = −0.05 A − 1.3 T − 40.64, R2 = 0.67, p < 0.001; A: p = 0.26; T: p = 0.04. δ18O = −0.01 A − 1.8 T − 7.0, R2 = 0.67, p < 0.001; A: p = 0.25; T: p = 0.04), also demonstrated a negative relationship between the isotopic values and the amount of precipitation/temperature. Lee and Kim had a similar finding in their research about the relationship between the isotopic composition and temperature in the upper North Han River basin [16]. Yurtesever and Gat reported clear precipitation dependence in a tropical region [45]. However, the temperature dependence contradicted the finding by Jeelani et al. and Liu et al., who demonstrated an increase in the magnitude of δ2H and δ18O in precipitation with increasing temperature [46,47]. Most studies agreed that the effect of temperature was generally more significant in high-latitude regions [14,16,48]. In the current study, within the same temperature range during the wet season, a lower isotope was found in heavy precipitation instead of light precipitation, which suggested that the effect of the precipitation amount is more obvious. In reference to Figure 5, the values of δ2H and δ18O were negatively related to the precipitation amount and temperature. This was in contrast to the expectation that the effect of temperature should be positively correlated with the stable isotopic compositions, and it indicated that the amount of precipitation was the dominant influential factor over the varying temperature.
3.4. Isotopic Compositions of Precipitation
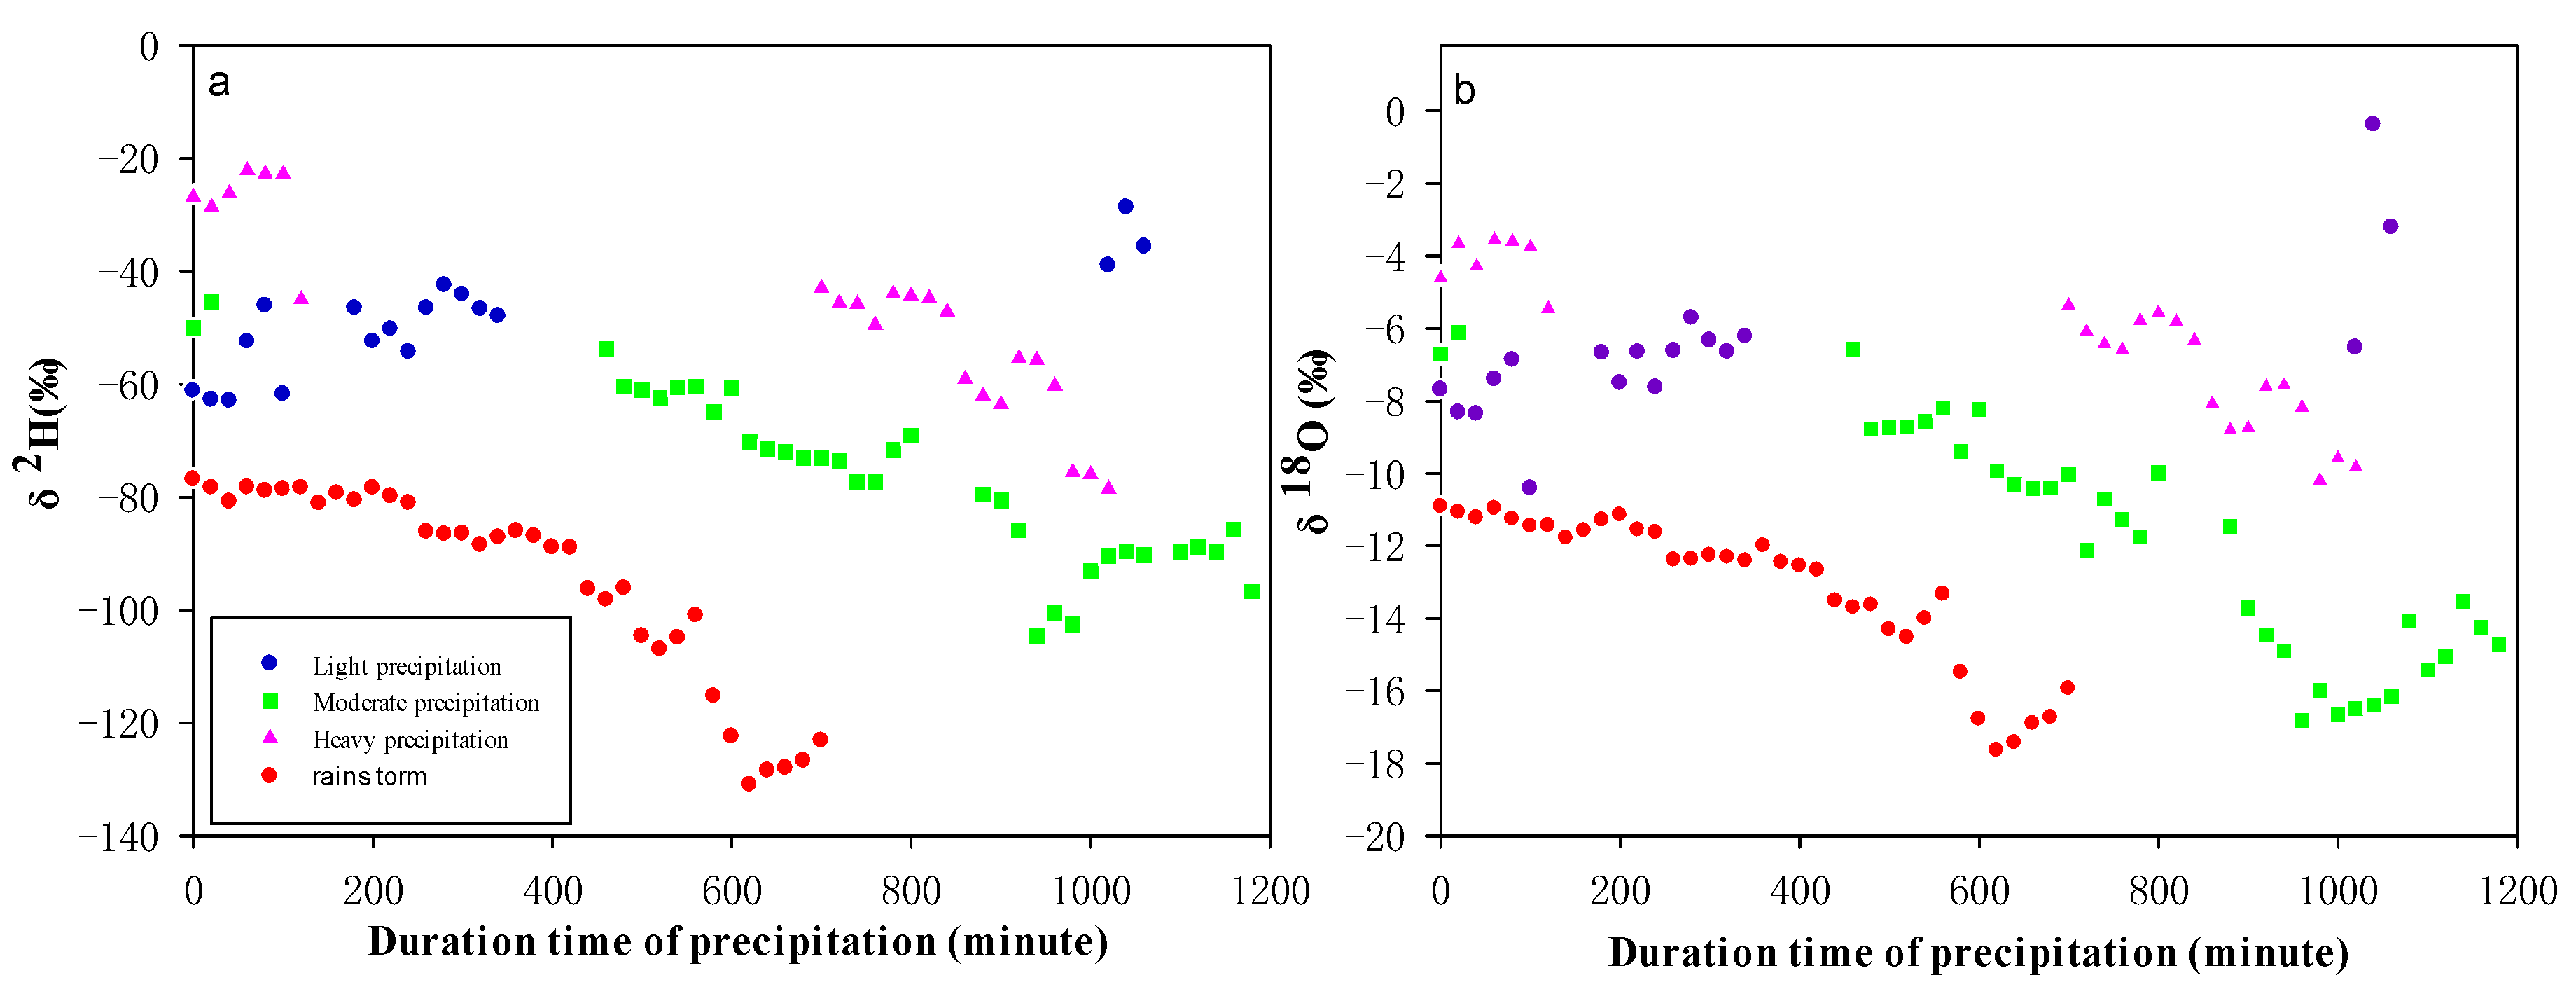
Precipitation was classified into four different grades according to the amount of precipitation: light precipitation (<10 mm), moderate precipitation (10–24.9 mm), heavy precipitation (25–49.9 mm) and rainstorm (>50 mm). Thus, the precipitation of 9.8 mm (6 July), 22.4 mm (12 Aug.), 41.6 mm (2 June) and 146.8 mm (21 July) were selected to sequentially represent the four grades of precipitation, respectively. The duration of these four precipitation events ranged from 160 min to 1060 min (Figure 6). All four precipitation events occurred in the wet season, which implicated that they all had a similar source of water vapor [34]. Overall, the δ2H and δ18O values of precipitation decreased as the precipitation duration prolonged. The longer the precipitation duration extended, the greater the decrease became. For the three precipitation events (light precipitation, moderate precipitation, and heavy precipitation), the values of δ2H and δ18O reduced periodically rather than continuously because of the discontinuous precipitation; the δ2H and δ18O isotopic compositions changed very little. In contrast, at the beginning of the rainstorm, the values of δ2H and δ18O were −76.85‰ and −10.22‰, respectively. With the continuous precipitation, the values of δ2H and δ18O gradually decreased to −123.20‰ and −15.96‰, respectively, by the end of the precipitation. From the beginning of the precipitation to the end, the values of δ2H and δ18O reduced by 60.31‰ and 56.16‰, respectively. This finding was consistent with Celle-Jeanton et al., who demonstrated that the lowest fractionation corresponded to the most abundant precipitation [49]. Midhun et al. also found enrichment of heavier isotopes in rainwater at the start of precipitation, and that the formation of 2H and 18O gradually became negative as the precipitation proceeded [50].
Generally, when water vapor began to form and precipitated, light isotopes of precipitation tended to re–evaporate back into the atmosphere due to lower relative humidity, higher temperature and stronger radiation [34]. Heavier isotopes were more likely to be condensed into precipitation, so that the isotopic compositions of precipitation became heavier in time. As the duration of precipitation increased, the number of light isotopes returning to the atmosphere became less in greater relative humidity and formed the 2H-depleted precipitation [44]. Similarly, the relative humidity was higher during the heavy precipitation than in the light precipitation. Therefore, the values of δ2H and δ18O in precipitation gradually decreased with the increase of the amount of precipitation, or with the prolonged duration of precipitation.
3.5. Recharge of the Springs
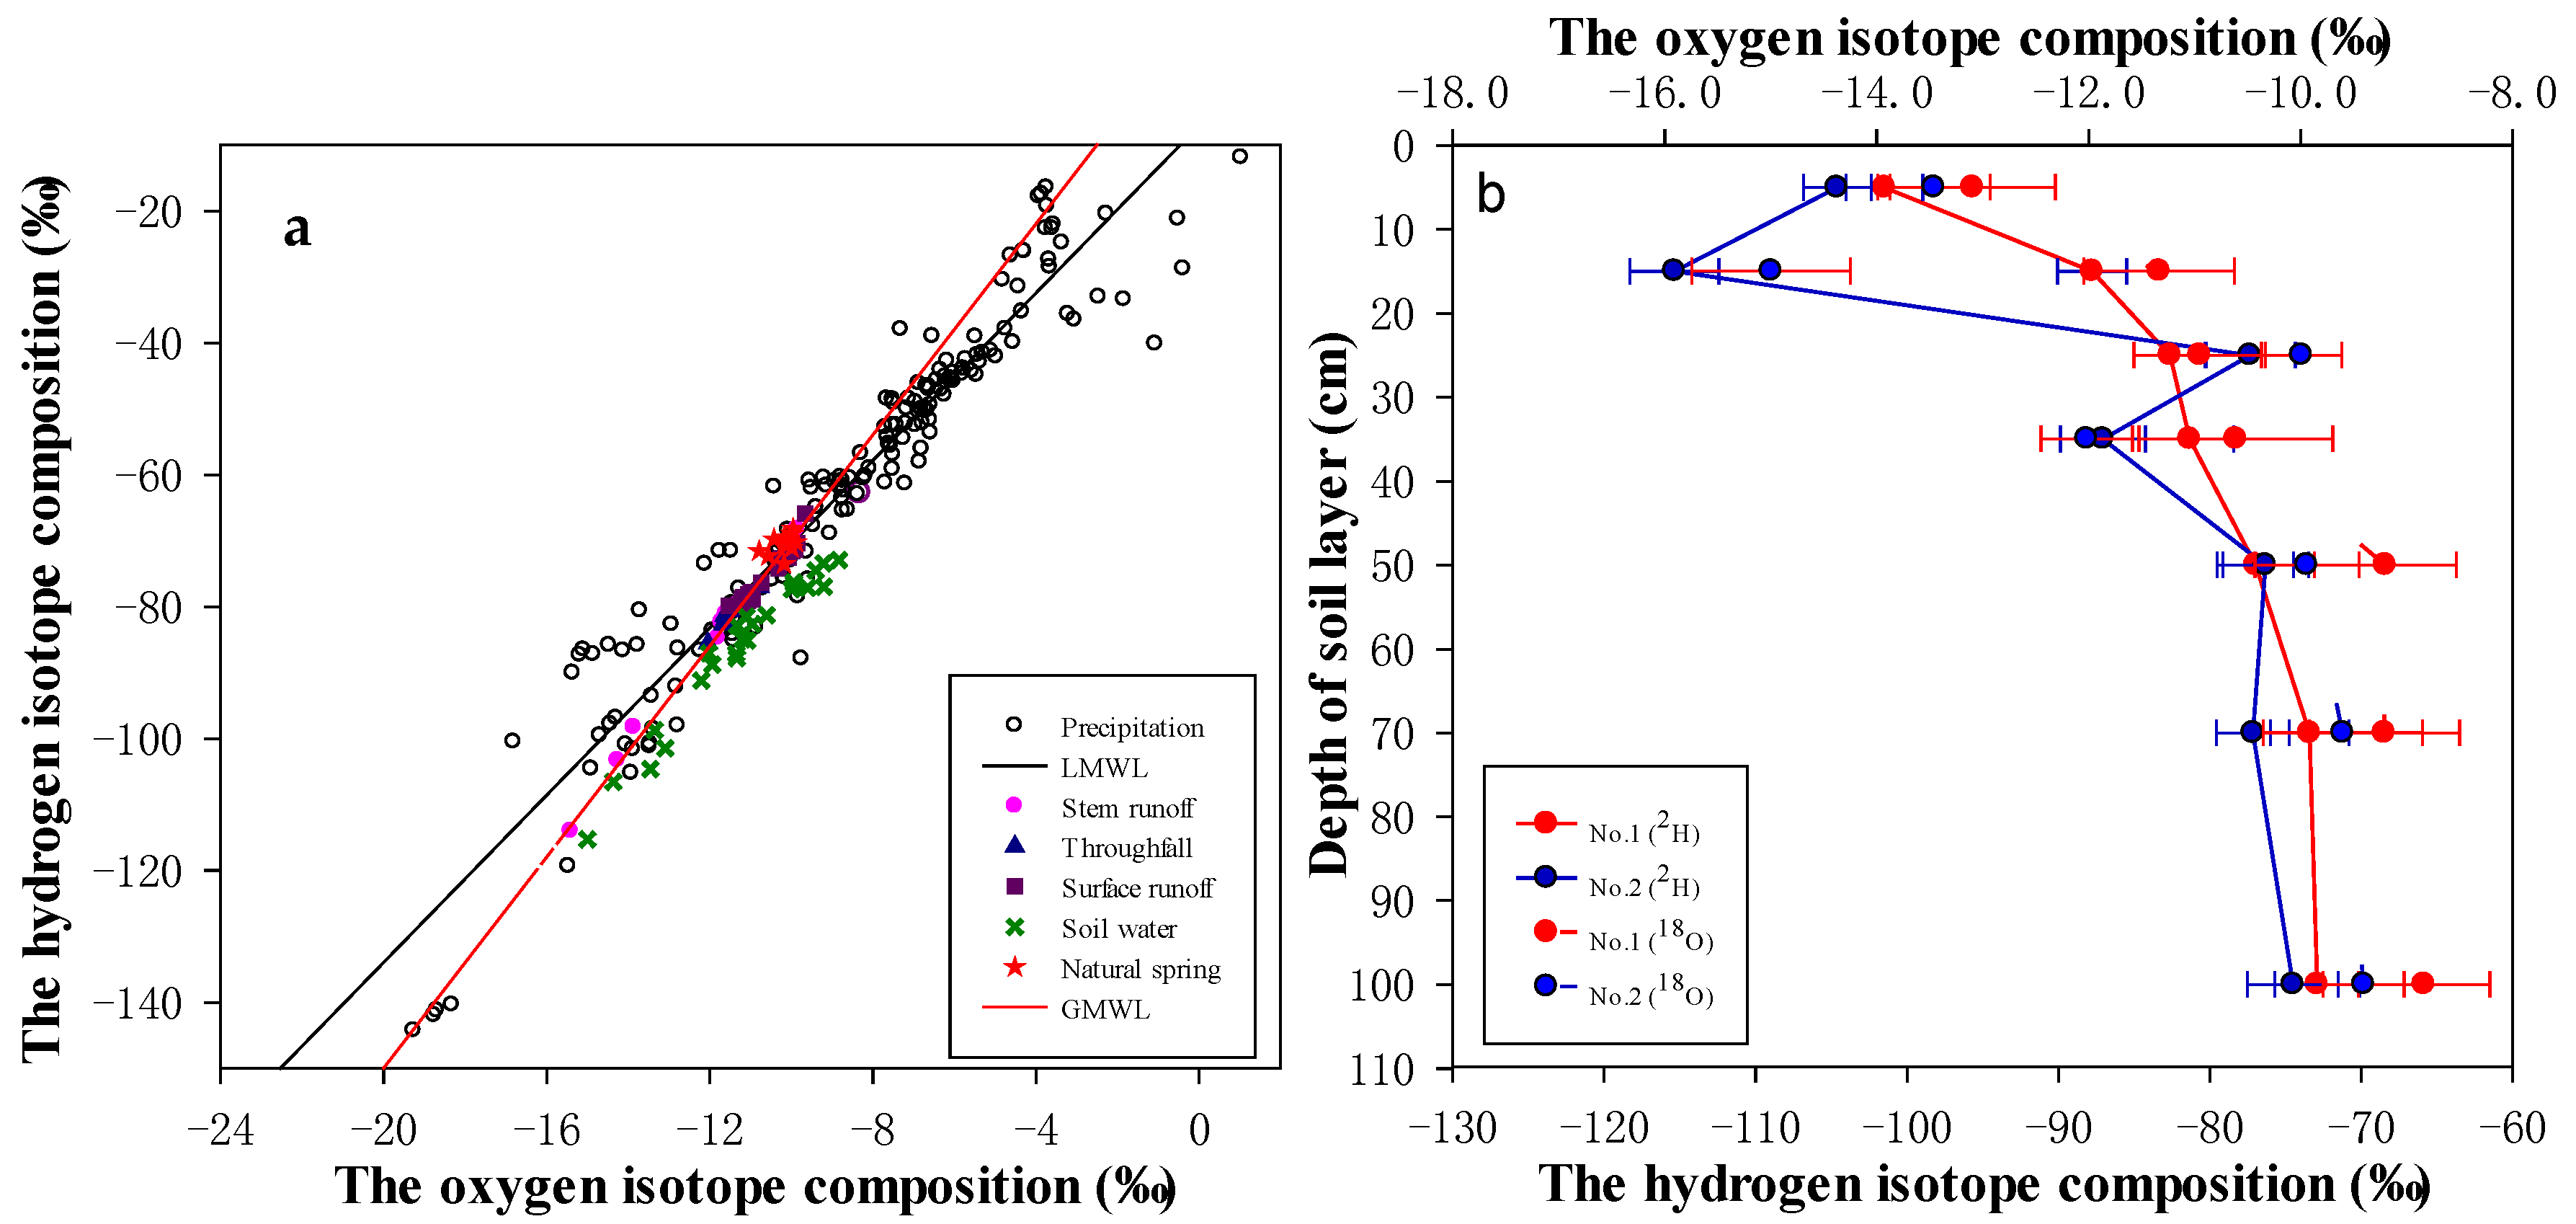
It is difficult to reflect the whole hydrological process of precipitation in groundwater recharge by small precipitation events because this precipitation event may not form surface runoff. A rainstorm event (146.8 mm, 21 July), which produced a stable surface runoff, was analyzed as a representative by the isotope for the transformation of water. We collected the samples directly from the precipitation and obtained the atmospheric precipitation process line (Figure 7) of δ2H = 6.1 δ18O − 7.0 (R2 = 0.98, N = 36, F = 2547.0, p < 0.0001). The slope and intercept were higher than the GMWL (δ2H = 8 δ18O + 10) (p < 0.001), which indicated that the process of formation of precipitation was significantly affected by isotopic dilution. As precipitation reached the tree canopy, the portion of the precipitation was mixed with the tree trunk stream. The distribution of δ2H and δ18O values of stem runoff, throughfall, surface runoff and natural springs near the precipitation line were shown in Figure 7. The relationship between δ2H and δ18O indicated a lack of clear isotope fractionation enrichment [51]. The values of δ2H and δ18O in the soil water were in general higher than the LMWL (p < 0.001), which suggested that the isotope fractionation during the precipitation or runoff infiltration was prominent. The effect of isotope fractionation resulted in higher isotopic values. In contrast, Liu et al. demonstrated that the isotopic compositions of stem runoff, throughfall, and surface runoff generally contained heavier isotopes than precipitation, which indicated evaporation during the precipitation input process [52]. Given the results, it was suggested that the holding capacity of the flowing water and the surface interception had reached a maximum during our sampling period, and resulted in inadequate isotope fractionation conditions. The cluster of natural spring data in the figure showed no significant variation in the isotopic values (Figure 7a).
Although there was a clear isotope fractionation in the soil water samples (Figure 7a), soil water mainly came from atmospheric precipitation through soil infiltration. The degree of precipitation infiltration was not only determined by soil characteristics, such as the texture, thickness, and the antecedent water content, but also related to the effect of evaporation and precipitation characteristics [53,54].
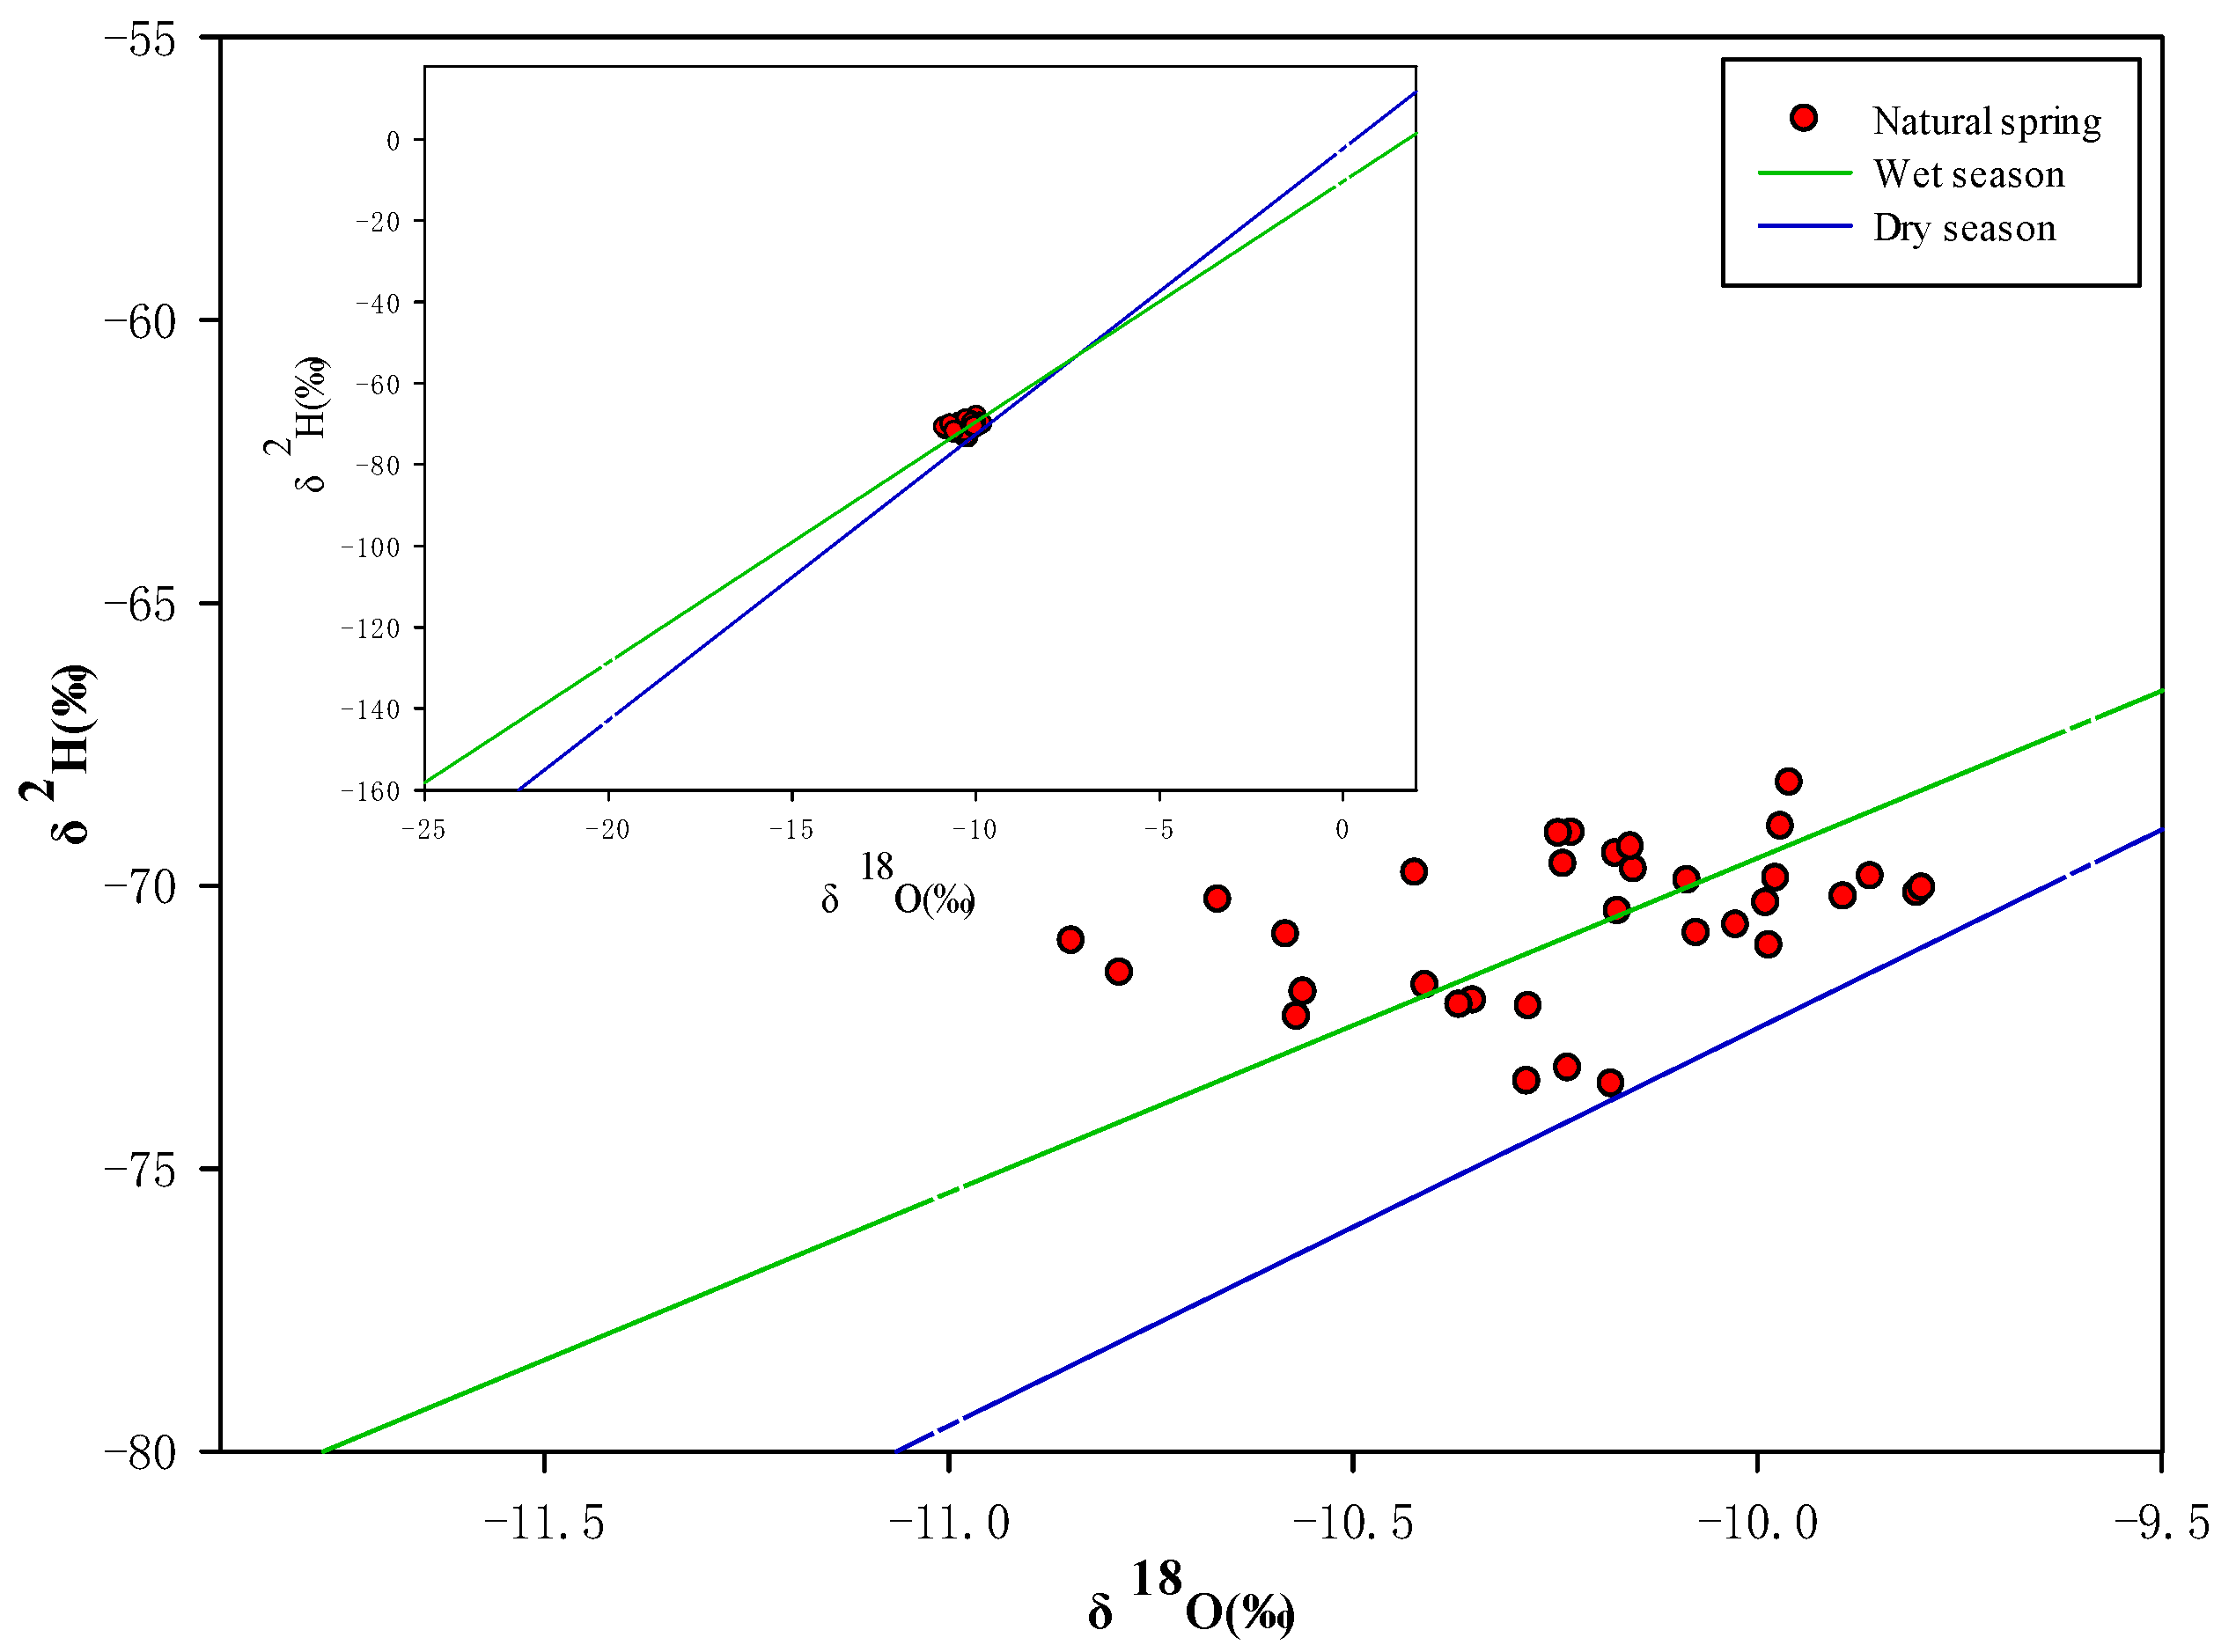
The change of the SWCL and its hydrogen and oxygen isotopes provided water migration information for the soil [55]. The δ2H and δ18O values of the soil water showed a dependence on the soil depth after heavy precipitation (Figure 7b). The δ2H and δ18O values of soil water ranged from −115.34‰ to −72.89‰ and from −13.45‰ to −9.20‰, respectively. After precipitation infiltration into the soil, the isotopic compositions were found to be similar. The δ2H and δ18O values of soil water generally increased with the soil depth but became similar within the range of 80–100 cm depth. In particular, there was a significant change in the δ2H and δ18O values at the 0–60 cm depth in the surface soil layer (p < 0.05), which could have been affected by the precipitation recharge and evaporation. The isotopic compositions did not show notable changes in the 60–100 cm depth, with magnitudes close to that of the natural spring (the δ2H and δ18O values range from −73.51‰ to −68.18‰ and −10.84‰ to −9.79‰, respectively). Consequently, natural springs of the mountainous regions were directly infiltrated by precipitation. The isotopic values of natural springs were closer to the LMWL in the wet season than in the dry season (Figure 8), indicating that natural springs could be directly supplied by precipitation in the wet season. In accordance with the isotopic conservation of mass, by contrasting the amount-weighed means of δ2H and δ18O values between precipitation and the natural spring, the relative contributions of the dry and wet season’s precipitation to the natural spring recharge in the mountainous region were calculated by:
where Y denotes δ2H or δ18O values of the natural spring, and X and 1 − X illustrate the recharge ratios of precipitation in the dry seasons and the wet seasons, respectively [15,46].
δY = X δdry season + (1 − X) δwet season
Results showed that approximately 7.2% of the natural spring was from the dry season precipitation and 92.8% from the wet season precipitation. It indicated that the natural spring recharge originated mostly from the wet season precipitation. This could be attributable to soil saturation or the abundant soil moisture content during the wet season when heavy precipitation reached the deep layer to recharge the natural spring. However, the recharge by the dry season precipitation was insignificant, which might be due to the small amount and the short duration of precipitation, and returned directly to the atmosphere by strong evaporation. Yeh et al. also demonstrated that the recharge of natural springs by the dry season precipitation (24%) was less than the wet season precipitation (76%) [15]. The duration of spring season changed from 6 months to 12.5 months, which was mainly attributed to the area size and the complex geography [21,50]. In the current study region, the spring water was predominantly from precipitation during the wet season and it took 9 months to get into the next wet season from the end of the current one. Accordingly, it was presumable that the duration of the spring season in the study region was 8 to 9 months. Future study should be focused on investigating the mechanism of recharge and the residence time of spring, and provide an important reference to the management of the region’s water cycle.
4. Conclusions
The isotopic compositions of precipitation, soil water and natural springs were used to investigate the seasonal variation of precipitation and quantify the recharge of groundwater by precipitation in the areas of Northern China. Heavier isotopic values were found in the dry season precipitation, while lower isotopic values were found extremely depleted in the wet season. This may be affected by the source of water vapor, its transmission route and the seasonal changes in precipitation amount. A mean precipitation effect of −15‰ and −2‰ per 100 mm change in the amount of precipitation for δ2H and δ18O, respectively, was observed based on the average isotopic values. In addition, more negative δ2H and δ18O were found in precipitation as the precipitation duration prolonged. In contrast, the relative isotopic composition of the natural spring was found during the study period. The comparison of the δ2H and δ18O values between the precipitation and natural spring showed that approximately 7.2% of the natural spring was recharged by the dry season precipitation and 92.8% by the wet season precipitation, indicating a distinct seasonal variation of natural spring recharge in the study area. The results will be used further with the stable isotope method in a future study to determine the area of water sources and provide an important basis for modelling the region’s water cycle. Further studies would prolong investigation for a few years since there was more precipitation during sampling years than normal.
Author Contributions
Z.L. wrote the paper; G.J. conceived and designed the experiments; Z.L. and X.Y. analyzed the data; D.W. performed the experiments and collected the data.
Funding
Please add: This research was funded by [National Natural Science Foundation of China] grant number [No. 41430747 & No. 41401013], [National Science and Technology Support Project] grant number [2015BAD07B0302] and [Beijing Municipal Education Commission] grant number [PXM2018_014207_000024].
Conflicts of Interest
The authors declare no conflict of interest.
References
- Deng, H.; Zheng, P.; Liu, T.; Liu, X. Forest ecosystem services and eco-compensation mechanisms in China. Environ. Manag. 2011, 48, 1079–1085. [Google Scholar] [CrossRef] [PubMed]
- Schultz, R.C.; Lee, K. Book reviews: Forest hydrology: An introduction to water and forests. For. Sci. 2003, 49, 336–337. [Google Scholar]
- Eriksson, M.; Jianchu, X.; Shrestha, A.B.; Vaidya, R.A.; Nepal, S.; Sandstörm, K. The Changing Himalayas: Impact of Climate Change on Water Resources and Livelihoods in the Greater Himalayas; ICIMOD: Kathmandu, Nepal, 2009. [Google Scholar]
- Klein, T.; Rotenberg, E.; Cohen-Hilaleh, E.; Raz-Yaseef, N.; Tatarinov, F.; Preisler, Y.; Ogée, J.; Cohen, S.; Yakir, D. Quantifying transpirable soil water and its relations to tree water use dynamics in a water-limited pine forest. Ecohydrology 2014, 7, 409–419. [Google Scholar] [CrossRef]
- Gammons, C.H.; Poulson, S.R.; Pellicori, D.A.; Reed, P.J.; Roesler, A.J.; Petrescu, E.M. The hydrogen and oxygen isotopic composition of precipitation, evaporated mine water, and river water in Montana, USA. J. Hydrol. 2006, 328, 319–330. [Google Scholar] [CrossRef]
- Watson, F.G.R.; Vertessy, R.A.; Grayson, R.B. Large-scale modelling of forest hydrological processes and their long-term effect on water yield. Hydrol. Process. 1999, 13, 689–700. [Google Scholar] [CrossRef]
- Li, F.; Pan, G.; Tang, C.; Zhang, Q.; Yu, J. Recharge source and hydrogeochemical evolution of shallow groundwater in a complex alluvial fan system, southwest of North China Plain. Environ. Geol. 2008, 55, 1109–1122. [Google Scholar] [CrossRef]
- Kumar, U.S.; Sharma, S.; Navada, S.V. Recent studies on surface water–groundwater relationships at hydro-projects in India using environmental isotopes. Hydrol. Process 2008, 22, 4543–4553. [Google Scholar] [CrossRef]
- Blasch, K.W.; Bryson, J.R. Distinguishing sources of groundwater recharge by using d2H and d18O. Ground Water 2007, 45, 294–308. [Google Scholar] [CrossRef] [PubMed]
- Tazioli, A.; Mussi, M.; Nanni, T.; Vivalda, P. The Mt Conero limestone ridge: The contribution of stable isotopes in the identification of the recharge area of aquifers. Ital. J. Geosci. 2017, 136, 186–197. [Google Scholar]
- Cervi, F.; Corsini, A.; Doveri, M.; Mussi, M.; Ronchetti, F.; Tazioli, A. Characterizing the recharge of fractured aquifers: A case study in a flysch rock mass of the Northern Apennines (Italy). IAEG XII Congress Eng. Geol. Soc. Territ. 2015, 3, 563–567. [Google Scholar]
- Cervi, F.; Ronchetti, F.; Doveri, M.; Mussi, M.; Marcaccio, M.; Tazioli, A. The use of stable water isotopes from rain gauges network to define the recharge areas of springs: Problems and possible solutions from case studies in the Northern Apennines. Geoing. Ambient. E Mineraria 2016, 149, 19–26. [Google Scholar]
- Römkens, M.J.M.; Nelson, D.W.; Mannering, J.V. Nitrogen and phosphorus composition of surface runoff as affected by tillage method1. J. Environ. Qual. 1973, 2, 292–295. [Google Scholar] [CrossRef]
- Dansgaard, W. Stable isotopes in precipitation. Tellus 1964, 16, 436–468. [Google Scholar] [CrossRef]
- Yeh, H.-F.; Lee, C.H.; Hsu, K.C. Oxygen and hydrogen isotopes for the characteristics of groundwater recharge: A case study from the Chih-Pen Creek basin, Taiwan. Environ. Earth Sci. 2011, 62, 393–402. [Google Scholar] [CrossRef]
- Lee, K.S.; Kim, Y. Determining the seasonality of groundwater recharge using water isotopes: A case study from the upper North Han River basin, Korea. Environ. Geol. 2007, 52, 853–859. [Google Scholar] [CrossRef]
- Perry, E.C.; Gilkeson, R.J.; Gilkeson, T.J. H, O, and S isotopic study of the groundwater in the Cambrian–Ordovician aquifer system of northern Illinois. In Isotopic Studies of Hydrologic Processes; NIU Press: DeKalb, IL, USA, 1980; pp. 35–43. [Google Scholar]
- Aquilanti, L.; Clementi, F.; Nanni, T.; Palpacelli, S.; Tazioli, A.; Vivalda, P.M. DNA and fluorescein tracer tests to study the recharge, groundwater flowpath and hydraulic contact of aquifers in the Umbria-Marche limestone ridge (central Apennines, Italy). Environ. Earth Sci. 2016, 75, 626. [Google Scholar] [CrossRef]
- Li, G.; Zhang, X.P.; Zhang, L.F.; Wang, Y.F.; Deng, X.J.; Yang, L.; Lei, C.G. Stable isotope characteristics in different water bodies in Changsha and implications for the water cycle. Environ. Sci. 2015, 36, 2094–2101. [Google Scholar]
- Kazemi, G.A.; Ichiyanagi, K.; Shimada, J. Isotopic characteristics, chemical composition and salinization of atmospheric precipitation in Shahrood, Northeastern Iran. Environ. Earth Sci. 2015, 73, 361–374. [Google Scholar] [CrossRef]
- Jeelani, G.; Bhat, N.A.; Shivanna, K. Use of 18O tracer to identify stream and spring origins of a mountainous catchment; a case study from Liddar watershed, Western Himalaya, India. J. Hydrol. 2010, 393, 257–264. [Google Scholar] [CrossRef]
- Neal, C.; Neal, M.; Warrington, A.; Ávila, A.; Piñol, J.; Rodà, F. Stable hydrogen and oxygen isotope studies of rainfall and stream waters for two contrasting holm oak areas of Catalonia, northeastern Spain. J. Hydrol. 1992, 140, 163–178. [Google Scholar] [CrossRef]
- Tan, H.; Zhang, Y.; Zhang, W.; Kong, N.; Zhang, Q.; Huang, J. Understanding the circulation of geothermal waters in the Tibetan plateau using oxygen and hydrogen stable isotopes. Appl. Geochem. 2014, 51, 23–32. [Google Scholar] [CrossRef]
- Song, X.; Wang, P.; Yu, J.; Liu, X.; Liu, J.; Yuan, R. Relationships between precipitation, soil water and groundwater at Chongling Catchment with the typical vegetation cover in the Taihang Mountainous region, China. Environ. Earth Sci. 2011, 62, 787–796. [Google Scholar] [CrossRef]
- Yang, B.; Wen, X.; Sun, X. Seasonal variations in depth of water uptake for a subtropical coniferous plantation subjected to drought in an East Asian monsoon region. Agric. For. Meteorol. 2015, 201, 218–228. [Google Scholar] [CrossRef]
- Liu, J.R.; Song, X.F.; Yuan, G.F.; Sun, X.M.; Liu, X.; Wang, S.Q. Characteristics of δ18O in precipitation over Eastern Monsoon China and the water vapor sources. Chin. Sci. Bull. 2010, 55, 200–211. [Google Scholar] [CrossRef]
- Liu, W.J.; Liu, W.Y.; Li, P.J.; Duan, W.P.; Li, H.M. Dry season water uptake by two dominant canopy tree species in a tropical seasonal rainforest of Xishuangbanna, SW China. Agric. For. Meteorol. 2010, 150, 380–388. [Google Scholar] [CrossRef]
- IAEA/GNIP Precipitation Sampling Guide (V2.02). September 2014. Available online: http://www-naweb.iaea.org/napc/ih/documents/other/gnip_manual_v2.02_en_hq.pdf (accessed on 25 May 2018).
- Meißner, M.; Köhler, M.; Schwendenmann, L.; Hölscher, D.; Dyckmanns, J. Soilwater uptake by trees using water stable isotopes (δ2H and δ18O)—a method test regarding soil moisture, texture and carbonate. Plant Soil 2014, 376, 327–335. [Google Scholar] [CrossRef]
- Wassenaar, L.I.; Coplen, T.B.; Aggarwal, P.K. Approaches for achieving long-term accuracy and precision of δ18O and δ2H for waters analyzed using laser absorption spectrometers. Environ. Sci. Technol. 2014, 48, 1123–1131. [Google Scholar] [CrossRef] [PubMed]
- Stumpp, C.; Hendry, M.J. Spatial and temporal dynamics of water flow and solute transport in a heterogeneous glacial till: The application of high-resolution profiles of δ18O and δ2H in pore waters. J. Hydrol. 2012, 438, 203–214. [Google Scholar] [CrossRef]
- Li, J.; Dodson, J.; Yan, H.; Zhang, D.D.; Zhang, X.; Xu, Q.; Lee, H.F.; Pei, Q.; Cheng, B.; Li, C.; et al. Quantifying climatic variability in monsoonal northern China over the last 2200 years and its role in driving Chinese dynastic changes. Quat. Sci. Rev. 2017, 159, 35–46. [Google Scholar] [CrossRef]
- Liu, Z.; Tian, L.; Chai, X.; Yao, T. A model-based determination of spatial variation of precipitation δ18O over China. Chem. Geol. 2008, 249, 203–212. [Google Scholar] [CrossRef]
- Wen, X.; Zhang, S.; Sun, X.; Yu, G.; Lee, X. Water vapor and precipitation isotope ratios in Beijing. J. Geophys. Res.-Atmos. 2010, 115, 133–134. [Google Scholar] [CrossRef]
- Yamanaka, T.; Shimada, J.; Hamada, Y.; Tanaka, T.; Yang, Y.; Zhang, W.; Hu, C. Hydrogen and oxygen isotopes in precipitation in the northern part of the North China Plain: Climatology and inter-storm variability. Hydrol. Process. 2010, 18. [Google Scholar] [CrossRef]
- Jian, R.; Song, X.F.; Yuan, G.; Sun, X.; Liu, X.; Wang, Z.; Wang, S. Stable isotopes of summer monsoonal precipitation in southern China and the moisture sources evidence from δ18O signature. J. Geogr. Sci. 2008, 18, 155–165. [Google Scholar]
- Craig, H. Isotopic variations in meteoric waters. Science 1961, 133, 1702–1703. [Google Scholar] [CrossRef] [PubMed]
- Fudeyasu, H.; Ichiyanagi, K.; Sugimoto, A.; Yoshimura, K.; Ueta, A.; Yamanaka, M.D.; Ozawa, K. Isotope ratios of precipitation and water vapor observed in Typhoon Shanshan. J. Geophys. Res. Atmos. 2008, 113, 1113–1126. [Google Scholar] [CrossRef]
- Guo, X.; Qi, F.; Wei, Y.; Li, Z.; Liu, W. An overview of precipitation isotopes over the Extensive Hexi Region in NW China. Arab. J. Geosci. 2015, 8, 4001–4007. [Google Scholar] [CrossRef]
- Araguás, L.; Froehlich, K.; Rozanski, K. Stable isotope composition of precipitation over southeast Asia. J. Geophys. Res. Atmos. 1998, 1032, 28721–28742. [Google Scholar] [CrossRef]
- Hughes, C.E.; Crawford, J. Spatial and temporal variation in precipitation isotopes in the Sydney Basin, Australia. J. Hydrol. 2013, 489, 42–55. [Google Scholar] [CrossRef]
- Peng, T.R.; Huang, C.C.; Chen, C.T.; Chen, J.E.; Liang, W.J. Using stable hydrogen and oxygen isotopes to reveal monsoonal and related hydrological effects on meteoric water in the Western Pacific monsoon region: A case study of the Ilan region, northeastern Taiwan. J. Asian Earth Sci. 2016, 128, 105–115. [Google Scholar] [CrossRef]
- Liang, X.; Xie, Z.; Huang, M. A new parameterization for surface and groundwater interactions and its impact on water budgets with the variable infiltration capacity (VIC) land surface model. J. Geophys. Res. Atmos. 2003, 108, 832–833. [Google Scholar] [CrossRef]
- Liu, Z.; Yu, X.; Jia, G.; Jia, J.; Lou, Y.; Lu, W. Contrasting water sources of evergreen and deciduous tree species in rocky mountain area of Beijing, China. Catena 2017, 150, 108–115. [Google Scholar] [CrossRef]
- Yurtesever, Y.; Gat, J.R. Atmospheric waters. In Stable Isotope Hydrology: Deuterium and Oxygen-18 in the Water Cycle; Gat, J.R., Gonfiantini, R., Eds.; IAEA Technical Reports Series; International Atomic Energy Agency: Vienna, Austria, 1981; Volume 210, pp. 103–142. [Google Scholar]
- Jeelani, G.; Kumar, U.S.; Kumar, B. Variation of δ18O and δD in precipitation and stream waters across the Kashmir Himalaya (India) to distinguish and estimate the seasonal sources of stream flow. J. Hydrol. 2013, 481, 157–165. [Google Scholar] [CrossRef]
- Liu, J.; Song, X.; Yuan, G.; Sun, X.; Yang, L. Stable isotopic compositions of precipitation in China. Tellus Ser. B Chem. Phys. Meteorol. 2014, 66, 39–44. [Google Scholar] [CrossRef]
- Yin, L.; Hou, G.; Su, X.S.; Wang, D.; Dong, J.; Hao, Y.; Wang, X. Isótopos (δD and δ18O) nas águas de precipitação, subterrâneas e superficiais do planalto ordos, China: Implicações com respeito à recarga e circulação de água subterrânea. Hydrogeol. J. 2011, 19, 429–443. (In Portuguese) [Google Scholar] [CrossRef]
- Celle-Jeanton, H.; Gonfiantini, R.; Travi, Y.; Sol, B. Oxygen-18 variations of rainwater during precipitation: Application of the Rayleigh model to selected rainfalls in Southern France. J. Hydrol. 2004, 289, 165–177. [Google Scholar] [CrossRef]
- Midhun, M.; Lekshmy, P.R.; Ramesh, R. Hydrogen and oxygen isotopic compositions of water vapor over the Bay of Bengal during monsoon. Geophys. Res. Lett. 2013, 40, 6324–6328. [Google Scholar] [CrossRef]
- Gat, J.R.; Tzur, Y. Modifications of the composition of rainwater by processes which occur before groundwater recharge. FEBS Lett. 1968, 135, 97–102. [Google Scholar]
- Liu, L.; Xu, Z.X. Regionalization of precipitation and the spatiotemporal distribution of extreme precipitation in southwestern China. Nat. Hazards 2016, 80, 1195–1211. [Google Scholar] [CrossRef]
- Huang, Z.; Tian, F.; Wu, G.; Liu, Y.; Dang, Z. Legume grasslands are in favour of promoting precipitation infiltration than Gramineous grasslands in the arid regions. Land Degrad. Dev. 2016, 309–316. [Google Scholar] [CrossRef]
- Vidon, P. Towards a better understanding of riparian zone water table response to precipitation: Surface water infiltration, hillslope contribution or pressure wave processes? Hydrol. Process. 2012, 26, 3207–3215. [Google Scholar] [CrossRef]
- Liu, B.; Phillips, F.; Hoines, S.; Campbell, A.R.; Sharm, P. Water movement in desert soil traced by hydrogen and oxygen isotopes, chloride, and chlorine-36, southern Arizona. J. Hydrol. 1995, 168, 91–110. [Google Scholar] [CrossRef]
Figure 1.
Map of the study region: (a) Location of National Forest Ecosystem Research Station (NFERS) in Beijing, China; (b) Location of the study region within the NFERS; (c) Location of the sampling sites within the study region.
Figure 1.
Map of the study region: (a) Location of National Forest Ecosystem Research Station (NFERS) in Beijing, China; (b) Location of the study region within the NFERS; (c) Location of the sampling sites within the study region.

Figure 2.
The variation of the amount of precipitation and its isotopic compositions in the study area.
Figure 2.
The variation of the amount of precipitation and its isotopic compositions in the study area.

Figure 3.
The relationship between isotopic ratios in precipitation and soil water. (a) the relationship between isotopic ratios in precipitation and soil water in dry season (b) The relationship between isotopic ratios in precipitation and soil water in wet season. The LMWL was δ2H = 7.0 δ18O − 2.3 (R2 = 0.94, N = 42) and δ2H = 5.9 δ18O − 10.4 (R2 = 0.92, N = 126) for the precipitation in the dry and wet seasons, respectively. The SWCL was δ2H = 2.8 δ18O − 45.8 (R2 = 0.63, N = 80) and δ2H = 5.4 δ18O − 28.8 (R2 = 0.93, N = 100) for the soil water in the dry and wet seasons, respectively. The GMWL was δ2H = 8 δ18O + 10 [37].

Figure 4.
Seasonal variation in d–excess.

Figure 5.
(a) The regression line for δ2H and δ18O in precipitation with respect to the amount of precipitation in the study area. The resulting linear regressions for precipitation, δ2H and δ18O were represented by δ2H = −0.16 A − 53.76 (R2 = 0.8) and δ18O = −0.02 A − 8.87 (R2 = 0.67), respectively. (b) The resulting linear regressions for the monthly mean temperature, δ2H and δ18O are represented by δ2H = −1.60 T − 39.61 (R2 = 0.64) and δ18O = −0.20 T − 6.82 (R2 = 0.64), respectively.

Figure 6.
Characteristics of the precipitation events in light, moderate, heavy and rainstorm precipitation. (a) the variation of hydrogen isotope in the precipitation events (b) the variation of oxygen isotope in the precipitation events.
Figure 6.
Characteristics of the precipitation events in light, moderate, heavy and rainstorm precipitation. (a) the variation of hydrogen isotope in the precipitation events (b) the variation of oxygen isotope in the precipitation events.

Figure 7.
(a) Relationship between δ2H and δ18O of precipitation, stem runoff, throughfall, surface runoff, soil water and the natural spring. The black line shows the rainstorm precipitation process line where δ2H = 6.1 δ18O − 7.0 (R2 = 0.98, N = 36); (b) The variations of δ2H and δ18O values of soil water in the study area.

Figure 8.
The relationship between isotopic values of the natural spring and the LMWL (for the dry and wet seasons).
Figure 8.
The relationship between isotopic values of the natural spring and the LMWL (for the dry and wet seasons).


Table 1.
The basic characteristics of each characteristic curve.
| Name | Abbreviation | Expression (y = ax + b) | R2 | T-Test Significance | |
|---|---|---|---|---|---|
| a ± σa | b ± σb | ||||
| Global meteoric water line | GMWL | 8.0 | 10.0 | – | – |
| Local meteoric water line | LMWL | 6.1 ± 0.2 | −7.0 ± 2.2 | 0.98 | <0.0001 |
| Local meteoric water line (dry season) | LMWLdry | 7.0 ± 0.3 | −2.3 ± 2.3 | 0.94 | <0.0001 |
| Local meteoric water line (wet season) | LMWLwet | 5.9 ± 0.2 | −10.4 ± 1.4 | 0.92 | <0.0001 |
| Soil water characteristic line (dry season) | SWCLdry | 2.8 ± 0.2 | −45.8 ± 1.8 | 0.63 | <0.0001 |
| Soil water characteristic line (wet season) | SWCLwet | 5.4 ± 0.4 | −28.8 ± 4.0 | 0.93 | <0.0001 |
© 2018 by the authors. Licensee MDPI, Basel, Switzerland. This article is an open access article distributed under the terms and conditions of the Creative Commons Attribution (CC BY) license (http://creativecommons.org/licenses/by/4.0/).
Share and Cite
MDPI and ACS Style
Liu, Z.; Yu, X.; Jia, G.; Wang, D. Oxygen and Hydrogen Isotopes of Precipitation in a Rocky Mountainous Area of Beijing to Distinguish and Estimate Spring Recharge. Water 2018, 10, 705. https://doi.org/10.3390/w10060705
AMA Style
Liu Z, Yu X, Jia G, Wang D. Oxygen and Hydrogen Isotopes of Precipitation in a Rocky Mountainous Area of Beijing to Distinguish and Estimate Spring Recharge. Water. 2018; 10(6):705. https://doi.org/10.3390/w10060705
Chicago/Turabian StyleLiu, Ziqiang, Xinxiao Yu, Guodong Jia, and Dandan Wang. 2018. "Oxygen and Hydrogen Isotopes of Precipitation in a Rocky Mountainous Area of Beijing to Distinguish and Estimate Spring Recharge" Water 10, no. 6: 705. https://doi.org/10.3390/w10060705
Note that from the first issue of 2016, this journal uses article numbers instead of page numbers. See further details here.