Article

An Integrated Simulation, Inference and Optimization Approach for Groundwater Remediation with Two-Stage Health-Risk Assessment

1
Key Laboratory of Environmental Biotechnology, Xiamen University of Technology, Xiamen 361024, China
2
Huzhou Port and Shipping Authority, Nanhua Road No.106, Huzhou 313000, China
3
Institute for Energy, Environment and Sustainable Communities, University of Regina, Regina, SK S4S 0A2, Canada
4
College of Water Conservancy and Hydropower, Hebei University of Engineering, Handan 056021, China
*
Author to whom correspondence should be addressed.
Water 2018, 10(6), 694; https://doi.org/10.3390/w10060694
Submission received: 24 February 2018 / Revised: 3 May 2018 / Accepted: 20 May 2018 / Published: 26 May 2018
(This article belongs to the Section Water Resources Management, Policy and Governance)

Abstract

:
In this study, an integrated simulation, inference and optimization approach with two-stage health risk assessment (i.e., ISIO-THRA) is developed for supporting groundwater remediation for a petroleum-contaminated site in western Canada. Both environmental standards and health risk are considered as the constraints in the ISIO-THRA model. The health risk includes two parts: (1) the health risk during the remediation process and (2) the health risk in the natural attenuation period after remediation. In the ISIO-THRA framework, the relationship between contaminant concentrations and time is expressed through first-order decay models. The results demonstrate that: (1) stricter environmental standards and health risk would require larger pumping rates for the same remediation duration; (2) higher health risk may happen in the period of the remediation process; (3) for the same environmental standard and acceptable health-risk level, the remediation techniques that take the shortest time would be chosen. ISIO-THRA can help to systematically analyze interaction among contaminant transport, remediation duration, and environmental and health concerns, and further provide useful supportive information for decision makers.

1. Introduction

In many urbanized and industrialized regions, groundwater has been destroyed owing to the leakage from underground storage tanks and pipelines for petroleum products [1,2,3]. Therefore, remediation of contaminated aquifers and development of appropriate management strategies are of great importance and attract considerable attention from academic, governmental, and industrial agencies [4,5].
Pump-and-treat (i.e., PAT) is one of the most widely used technologies for remediating groundwater polluted by petroleum hydrocarbons or chlorinated solvents [6,7,8]. However, many process variables, such as well location, extraction rate, injection rate, and remediation duration have significant impacts on the performance of the PAT system. The deficiency in controlling remediation actions probably leads to a large inflation of expenses [9]. Consequently, the optimal design of PAT strategies is important to improve remediation efficiency and reduce costs [10,11]. Hence, various optimization models have been proposed to improve the performance of PAT systems. For example, Park and Ara (2004) developed a multi-objective optimization approach to determine pumping rates and well locations to prevent saltwater intrusion [12]. Baú and Mayer (2008) applied a stochastic optimal control framework to a PAT system in a contaminated unconfined aquifer [13]. Brusseau (2013) collected groundwater withdrawal and contaminant concentrations data to produce valuable information to support enhanced site characterization and the optimization of remedial system operations [14]. Park (2016) provided a simulation–optimization model to reduce the remediation duration and cost of PAT systems and applied it to a trichloroethylene-contaminated site [15]. The results presented that comprehensive analysis of PAT data was a powerful, cost-effective method for providing higher-resolution, value-added characterization of contaminated sites. Previous studies also applied many approaches such as dynamic programming [16], simulated annealing [17], artificial neural networks [18], genetic algorithms (GA) [19,20,21,22], robust optimization (RO) [23,24], and other techniques to improve remediation strategies. Evaluation of the merits for PAT remediation strategies is usually based on many factors such as contaminant concentration, the cost of PAT construction and operation, remediation duration, and health risk. Among them, the health risk is an important evaluation index to assess the effect of PAT remediation strategies. Health-risk assessment of contaminated sites has been conducted in many studies. For example, Qin (2012) developed a fuzzy parameterized probabilistic analysis (FPPA) method to assess risks associated with environmental pollution-control problems. The results indicated that complex uncertain features had significant impacts on modeling and risk-assessment outputs [25]. Li et al. (2015) presented an integrated optimal groundwater remediation design approach that incorporated numerical simulation, health-risk assessment, uncertainty analysis, and non-linear optimization within a general framework [3]. It found that the impact of confidence level of slope factor on health risk was obvious, meaning that the larger the confidence level, the higher the health risk. Han et al. (2016) discussed the similarities and differences between the risk-based corrective action (RBCA) tool kit and the health and environmental risk assessment (HERA) model by evaluating the health risk of exposure to organic contaminated groundwater [26]. It found that the inhalation of indoor vapors were the most predominant exposure pathway for all volatile organic compounds (VOCs) determined by the RBCA and HERA models.
Previous studies on health-risk assessment of groundwater contamination aimed to reveal the health risk of one contaminated site after remediation. However, in the actual practices, the exposure concentration of pollutants may change with time even during the remediation process. For site remediation, the exposure time in the remediating process cannot be neglected in health-risk assessment, since the remediation duration is not short compared to exposure time. Ideally speaking, the health-risk assessment in the remediation period is desirable and should be integrated at the earliest. Therefore, the quantification of health risk due to continuous exposure to contaminant is based on the principle of superposition. Nevertheless, insufficient studies are available to characterize the health risk accumulated in the period of the remediation process. It thus needs further study to take a full account on health risk in both remediation duration and natural attenuation period after remediation (i.e., two-stage health risk).
In this paper, an integrated simulation, inference and optimization approach with two-stage health-risk assessment (i.e., ISIO-THRA) is developed for supporting decision making in pump and treat remediation strategies for a petroleum contaminated site in western Canada. Both environmental standard and health risk are considered as the constraints in the model. The ISIO-THRA method combines both the ISIO proposed by He et al. [27] and THRA methods into a general framework. In ISIO-THRA, the remediation process simulation and the response relationship between the system outputs (i.e., contaminant concentration) and inputs (i.e., pumping rate) are approximated by the ISIO method. The objective of ISIO-THRA is to explore a novel optimization technique to examine alternative PAT designs under two-stage health risk assessment (i.e., THRA), which may be achieved considering a trade-off between the remediation duration and the corresponding risk reduction for different remediation alternatives. The simulation of the remediation process is not the main objective in this study and, hence, the petroleum contaminated site, well locations as well as pumping rates are mostly referred to He et al. [27] where a trial and correction procedure is used for identifying optimal operating conditions. The entire process of ISIO-THRA consists of five tasks as follows: (1) the simulation and prediction of contaminants distribution after remediation; (2) the calculation of health risk accumulated in the remediation duration and the period after remediation; (3) the relationship analysis between contaminant concentrations and time through the first-order decay model; (4) the statistical analysis between pumping rates and contaminant concentrations using the stepwise regression inference approach; (5) potential optimal strategies for decision makers through systematic analysis of the interaction among contaminant transport, remediation duration, environment and health constraints.

2. Methods and Materials

2.1. Simulation of Contaminant Transport Process

The general mass conservation equation for the subsurface components can be obtained by Delshad [28]:
t ( ϕ C ˜ m ρ m ) + [ l = 1 n p ρ m ( C m l u l ϕ S l D m l C m l ) ] = R m
where m is component index; l is phase index; ϕ is porosity; C ˜ m is overall concentration of component m, μg/L; ρm is density of component m, mg/L; np is number of phases; Cml is concentration of component m in phase l, μg/L; u l is Darcy velocity of phase l, m/s; Sl is saturation of phase l; Rm is total source/sink term for component m, μg/L; and Dml is molecular diffusion coefficient of component m in phase l, m2/s. In the remediation part, pumping/injection can be set as the major source/sink term.
Because remediation duration does not represent a short time (i.e., 5, 10, 15, 20 years or more) compared to health-risk exposure time, the health-risk assessment process should consider the different contaminant exposure concentrations. There is a demand for study of the contaminant concentration at any time to address the associated health risk. Then, the available data could be utilized to estimate the health risk. As the contaminant concentration may decrease by natural attenuation after remediation, the first order decay model proposed by Kao and Prosser [29] would be used to predict the concentrations at any time point. Equation (2) can be applied to fit the contaminant concentrations during the remediation period. Equation (3) can be applied to calculate the contaminant concentration after remediation under natural attenuation.
C k , t = C k , 0 × e a × t
C k , t = C k × e λ × t
where Ck,t is the contaminant concentration of the kth monitoring well with time, μg/L; Ck,0 is contaminant concentration at the kth monitoring well at the initial remediation time; and a and λ are the first-order decay rate of PAT remediation decay rate and the first-order decay rate (i.e., natural attenuation rate) respectively. a can be calculated as follow [29]:
a = ln ( C k / C k , 0 ) / T R
where TR is the PAT remediation duration, in days.

2.2. Statistical Analysis

Due to the difficulties in incorporating the complicated numerical simulation model within an optimization framework, the stepwise regression inference approach proposed by He et al. [27] is used to determine the response relationship between the system outputs (i.e., contaminant concentration ck) and inputs (i.e., pumping rate qk). Statistical samples coming from the numerical simulator are used for generating the following surrogate.
The function of ck = f (q1, q2,…, qn) describes a multi-dimensional hyper-surface in the space of (q1, q2,…, qn). The surrogate can be formulated as:
c k = a 0 , k + i = 1 n a i , k q i + i = 1 n j = 1 n a i j , k q i q j ( i j ) + i = 1 n a i i , k q i 2 + e k
where a 0 , k is an intercept term of surrogate k; i = 1 n a i , k q i are linear terms of surrogate k; i = 1 n j = 1 n a i j , k q i q j ( i j ) are interaction terms of surrogate k; i = 1 n a i i , k q i 2 are quadratic terms of surrogate k; e k is the error of surrogate k; and n is the total number of remediation wells.

2.3. Optimization Model
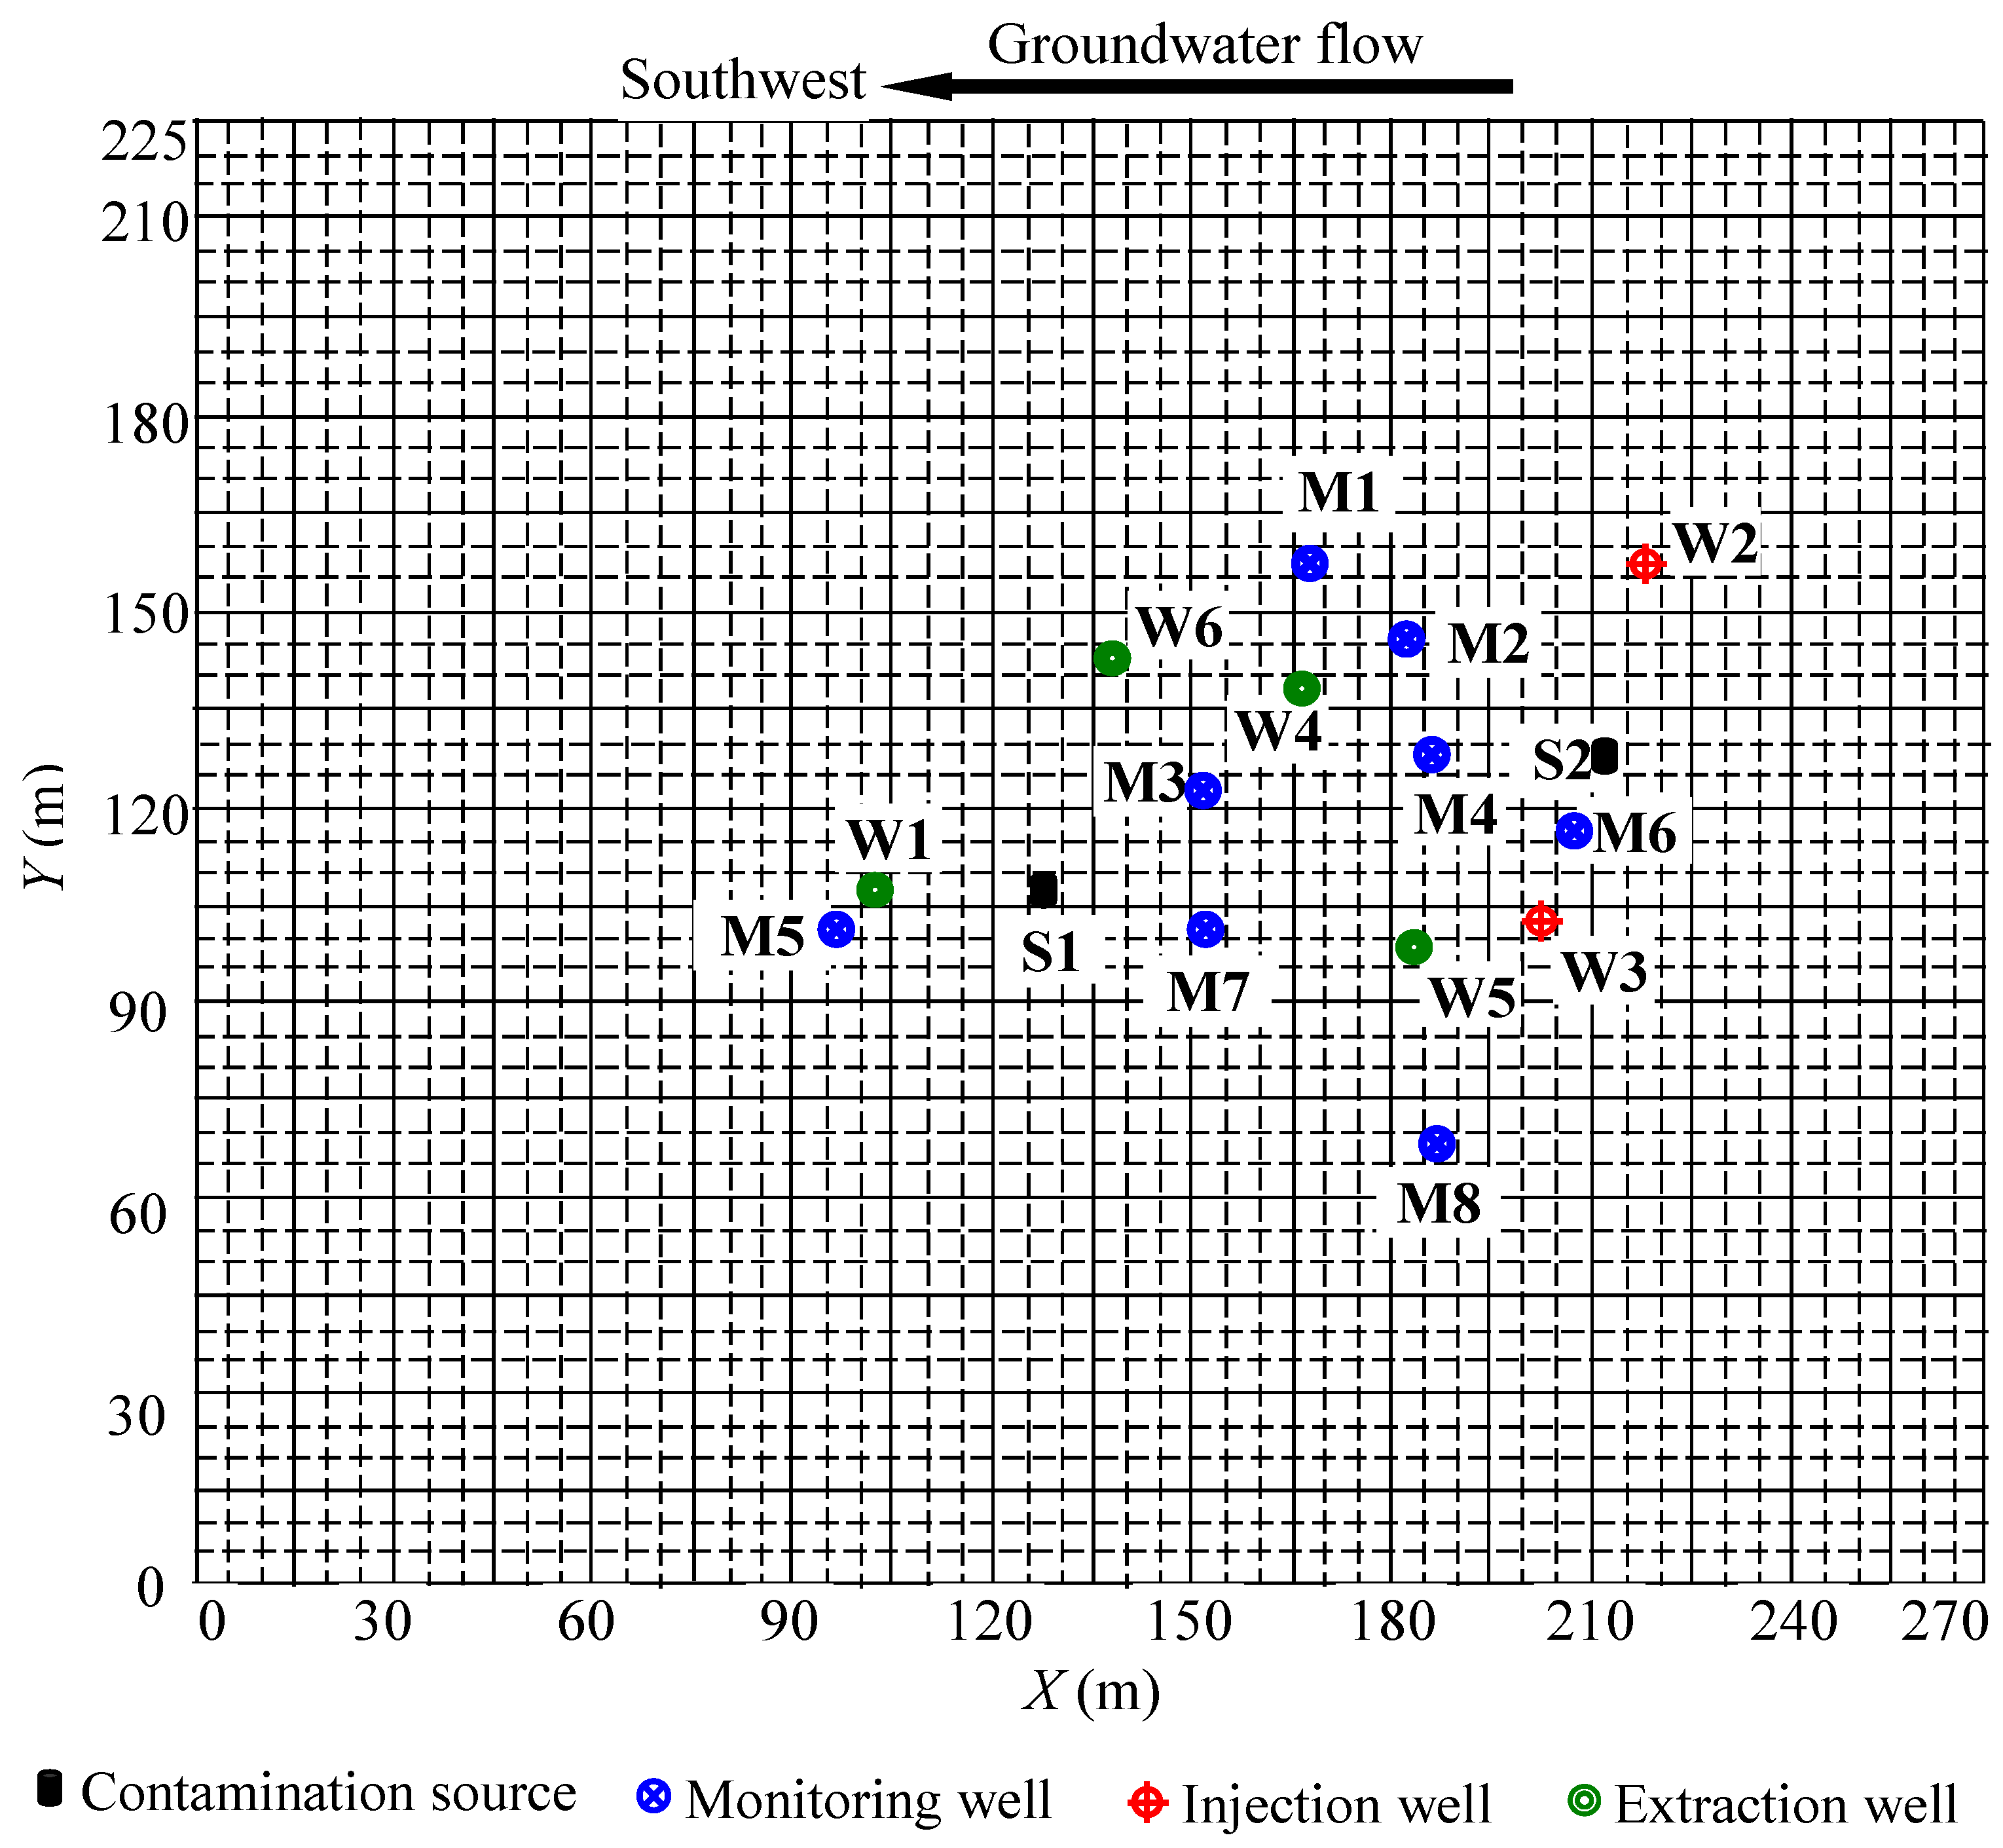
The optimization objective of a PAT system usually includes the system fixed cost, operation cost, contaminant environmental standards, human health risk and so on. Environmental standards of contaminants and the associated health risks can be obtained from government environmental protection agencies. Environmental standards and limits of health risk can be the constraints in a PAT optimization model. For the PAT system, the one-time drilling and installation costs are much lower than the operating costs. Hence, the objective functions can be determined for the total amount of pumping without the loss of generality [30]. The optimization function can be described as follows:
Min   T R = i = 1 I q i I n + j = 1 J q j E x
where TR is total pumping rate at all injection and extraction wells; m3/h; I, J are numbers of injection, extraction wells respectively; q i I n is pumping rate for the ith injection well, m3/h; and q j E x is pumping rate for the jth extraction well, m3/h.
In addition to environmental standards and human health risk described above, the performance of PAT is also impacted by engineering techniques and hydrogeological factors. Firstly, the pumping rates at injection or extraction wells are limited to technical loads, i.e., the pumping rate at all injection and extraction wells must be lower than a maximum pumping rate. Secondly, to maintain the aquifers’ stability and hydraulic direction, the total pumping rate at all injection wells must be equal to the total pumping rate at all extraction wells. Both environmental standards and health risks are considered as the constraints in the model. The health risk is often divided into carcinogenic and non-carcinogenic risks. Hence, the constraints for the PAT optimization model can be described as follows:
0 q i I n q max I n   i = 1 , 2 , I ;
0 q j E x q max E x   j = 1 ,   2 , J ;
i = 1 I q i I n = j = 1 J q j E x   i = 1 , 2 , I ; j = 1 , 2 , J ;
c k ( q i I n , q j E x ) c max k = 1 , 2 , K
E L C R k E L C R max k = 1 , 2 , K
H Q k H Q max k = 1 , 2 , K
where q max I n and q max E x are maximum pumping rates for the ith injection well and the jth extraction well, respectively; m3/h; k is the number of monitoring wells; ck is contaminant concentration of the kth monitoring well after remediation; μg/L. cmax is maximum acceptable contaminant concentration, μg/L; E L C R k is carcinogenic human health risk at kth monitoring well; E L C R max is the maximum acceptable carcinogenic human health risk value; H Q k is non-carcinogenic human health risk at kth monitoring well; and H Q max is the maximum acceptable noncarcinogenic human health-risk value.
In Equations (11) and (12), the carcinogenic and non-carcinogenic health risks E L C R k and H Q k can be obtained as follows:
E L C R k = S F × C D I k
H Q k = C D I k / R f D
C D I k = C W k / 1000 × I R × E F × E D / ( A T × B W )
where IR is rate of ingestion, L/day; SF is a slope factor which is related to carcinogenic health risk, kg day/mg; CDIk is daily intake of given contaminant at exposure location k, mg/kg day; RfD is non-carcinogenic reference dose, indicating acceptable daily intake unlikely to produce health effects, mg/kg·day; CWk is the concentration of exposed contaminant at exposure location k, μg/L; IR is the ingestion rate, L/day; EF is exposure frequency, day/year; ED is exposure duration, year; AT is average time, day; and BW is body weight, Kg.
In Equation (15), the contaminant concentration is not a constant and changes with time. The exposure period can be divided into remediation duration and natural attenuation period. Therefore, a daily intake of given contaminant can be expressed as follows:
C D I k = C D I k , R + C D I k , B
C D I k , R = [ 1 / 1000 × I R / ( A T × B W ) ] × t = 0 T R ( C k , 0 × e a × t ) d t
C D I k , B = [ 1 / 1000 × I R / ( A T × B W ) ] × t = 0 T B ( C k × e λ × t ) d t
A T = T R + T B
where C D I k , R is daily intake of given contaminant at exposure location k during the remediation period through PAT; C D I k , B is daily intake of given contaminant at exposure location k during the natural attenuation period after remediation; and TB is natural attenuation duration, day.
Based on Kao and Prosser [29], the first-order decay rate (i.e., natural attenuation rate) λ is between 0.013 and 0.036. In this study, λ is 0.0171.
Therefore, the ISIO-THRA model based on two-stage health risk assessment can be expressed as follows:
Min   TR = i = 1 I q i I n + j = 1 J q j E x
Subject to:
0 q i I n q max I n    i = 1 , 2 , I ;
0 q j E x q max E x    j = 1 ,   2 , J ;
i = 1 I q i I n = j = 1 J q j E x   i = 1 , 2 , I ; j = 1 , 2 , J ;
c k = f ( q 1 , q 2 , , q n )
c k ( q i I n , q j E x ) c max    k = 1 ,   2 , K
C D I k , R = [ 1 / 1000 × I R / ( A T × B W ) ] × t = 0 T R ( C k , 0 × e ln ( C k / C k , 0 ) / T R × t ) d t
C D I k , B = [ 1 / 1000 × I R / ( A T × B W ) ] × t = 0 T B ( C k × e 0.0171 × t ) d t
E L C R k = S F × ( C D I k , R + C D I k , B )
H Q k = ( C D I k , R + C D I k , B ) / R f D
E L C R k E L C R max    k = 1 ,   2 ,     K
H Q k H Q max   k = 1 ,   2 ,     K

3. Case Study

The ISIO-THRA model is applied to a petroleum-contaminated site in western Canada. Since there is a gas plant on the west side of the site and a disposal pit formerly located in the north-east of the site, amounts of hydrocarbon contaminants are presented in the groundwater near this site. As shown in Figure 1, the flow direction of groundwater is from north-east to south-west. The simulation domain is composed of 9720 finite difference grids (each grid has dimensions of 5, 5, and 2.5 m in x-, y-, and z-direction, respectively), with an area of 270 × 225 m2, and a depth of 10 m. There are 8 monitored wells located in the aquifer. The site has been remediated for many years with the duel-phase vacuum extraction method [27]. Evidence suggests that the most contaminated plume is located around the two contamination sources (i.e., S1 and S2 in Figure 1). To clean up the hydrocarbon contaminants, a PAT system is applied with 2 injection and 4 extraction wells in or around the contaminant plume. The contaminant concentration of these wells after remediation should be less than the environmental standard. The contaminant concentration is not a constant and changes with time. The exposure period can be divided into remediation duration and natural decay attenuation period. Therefore, the PAT optimization model based on two-stage health risk assessment would be used to determine the groundwater remediation strategies to remove the benzene, toluene, ethyl benzene and xylene (i.e., BTEX) as dissolved in the groundwater.
In this study, the injection and extraction pumping rates of two injection wells (i.e., wells 2 and 3) and four extraction wells (i.e., wells 1, 4, 5, and 6) are selected as decision variables. According to site characteristics and technical load, the limits of lower and upper pumping rates are 0 and 100 m3/h, respectively. In the proposed model, the injection and extraction pumping rates are normalized. Moreover, the contaminant concentrations after remediation in all monitored wells are normalized by natural logarithms. In this study, four remediation durations (i.e., 5, 10, 15, and 20 years) are selected and the related proxy models are used, respectively. More data associated with the surrogates can be found in the online version at doi:10.1016/j.watres.2008.01.012.
For this site, if the benzene concentration is lower than environmental standard, other contaminant concentrations would be lower than the respective environmental standard based on the monitored data (i.e., the peak concentration of benzene 1648.9 μg/L, and others contaminant concentrations are lower than 200 μg/L). Also if the health risk of benzene is lower than the acceptable value, other contaminants health risk would be lower than their acceptable values. Hence, only the benzene contaminant is considered in the optimization model. The non-carcinogenic and carcinogenic health risks of benzene must be lower than the acceptable levels. Many groundwater standards have been set in different countries around the world. For instance, the standards for xylenes are 20, 40, 300, 400, 530, 1800, and 10,000 μg/L in Sweden, New Jersey, Canada, Japan, North Carolina, California, and Illinois, respectively [27,31]. Therefore, in this study, the maximum acceptable benzene contaminant concentrations are set as 50, 100, 150, and 200 μg/L. the acceptable carcinogenic health risk of benzene are set as 0.00011, 0.00022, 0.00033, 0.00044 and 0.00055. Other parameters associated with this study are as follows: AT is 10750 days; BW is 70 Kg.

4. Results Analysis

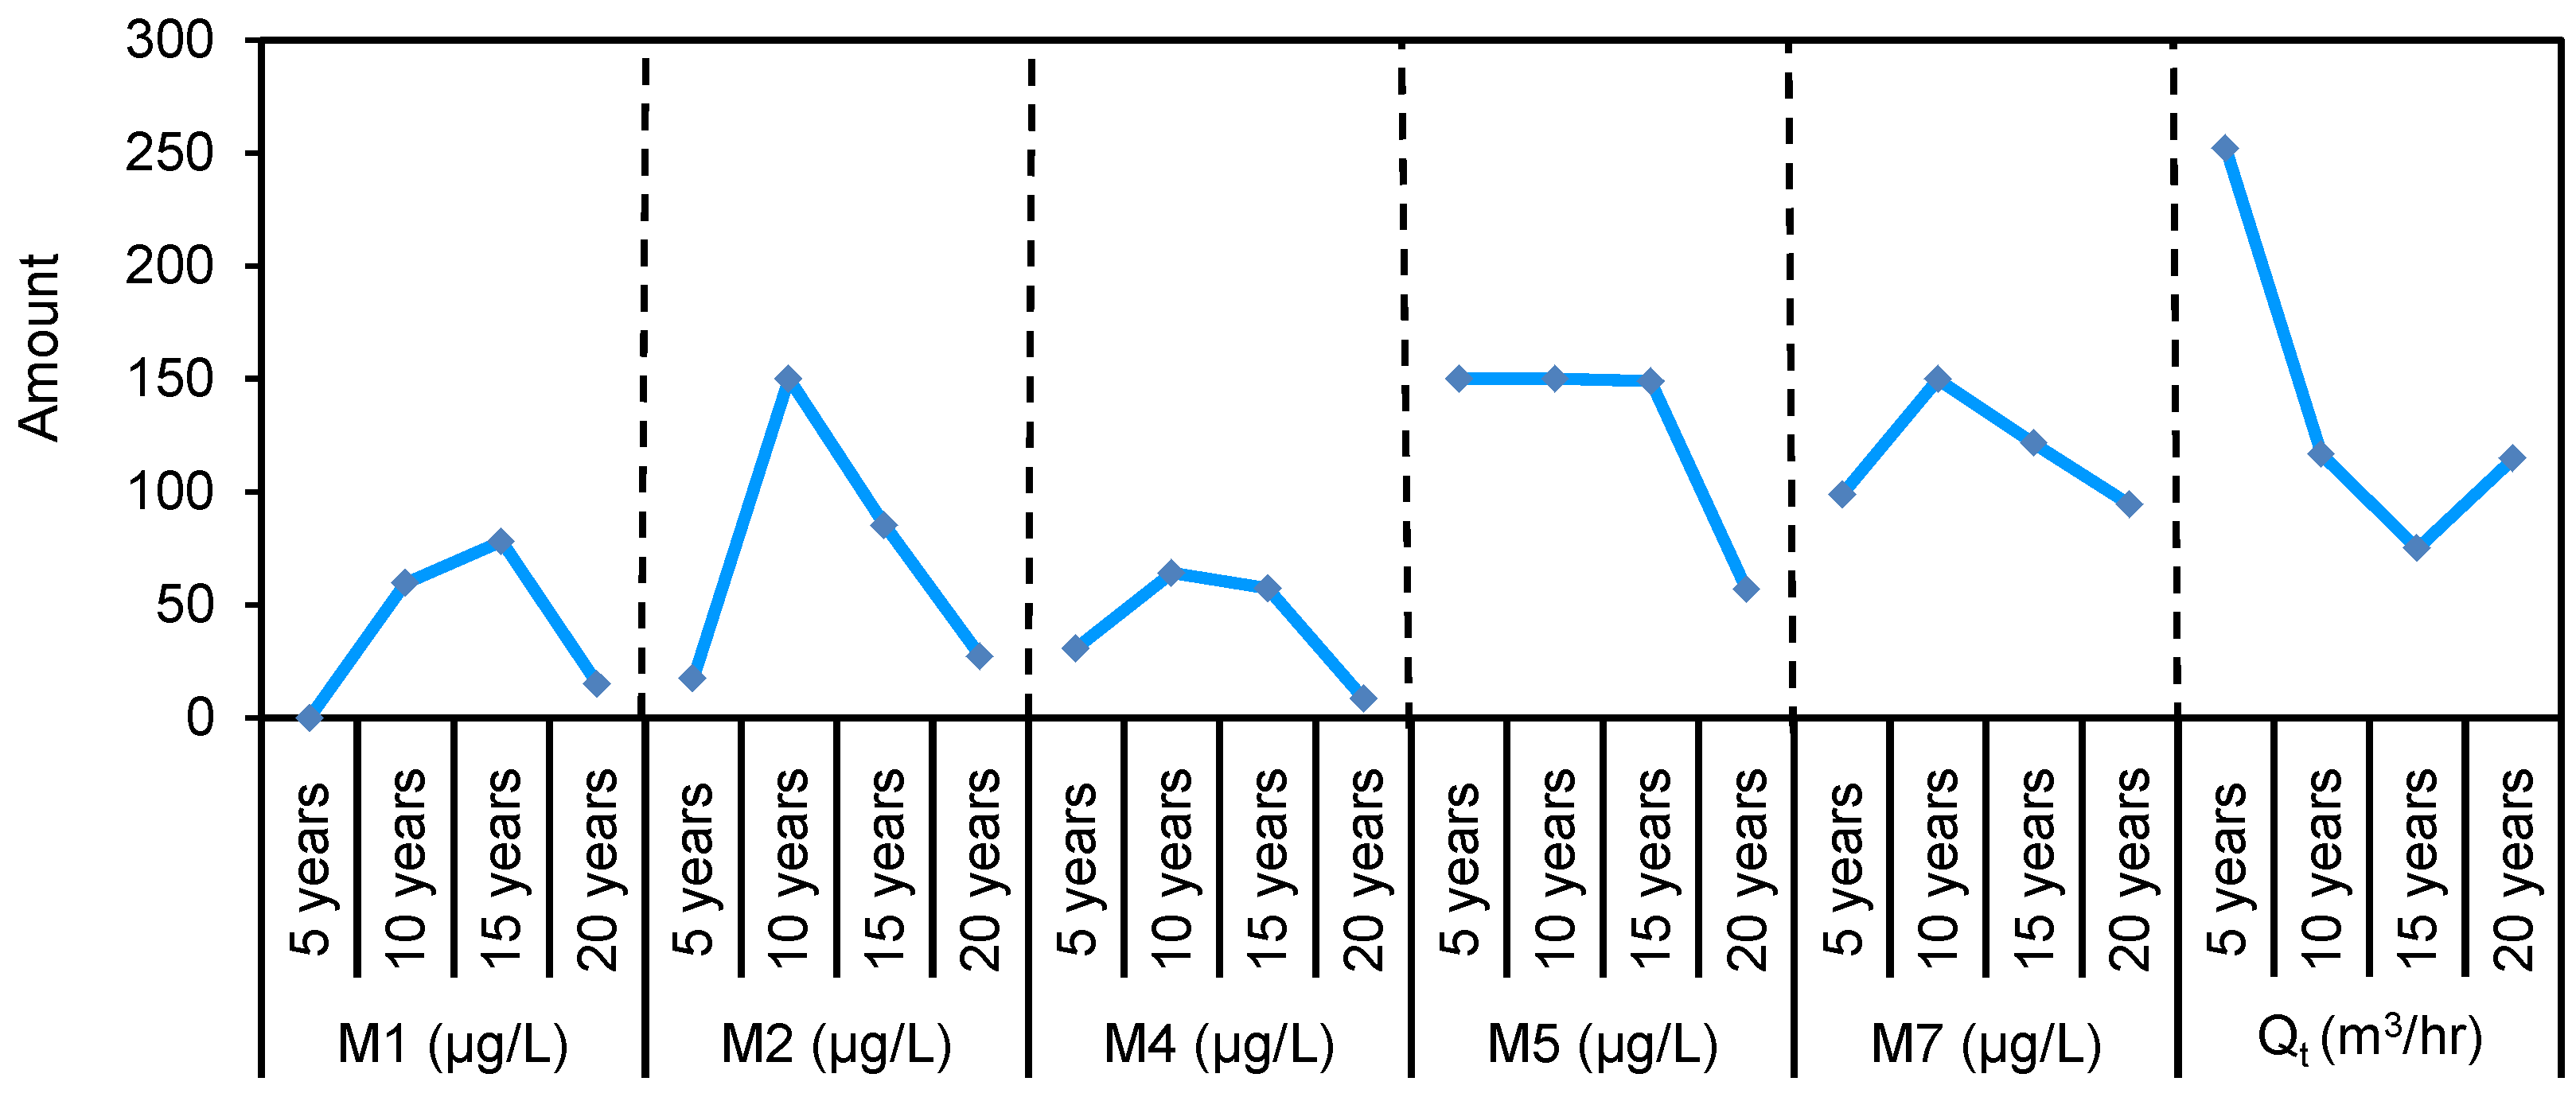
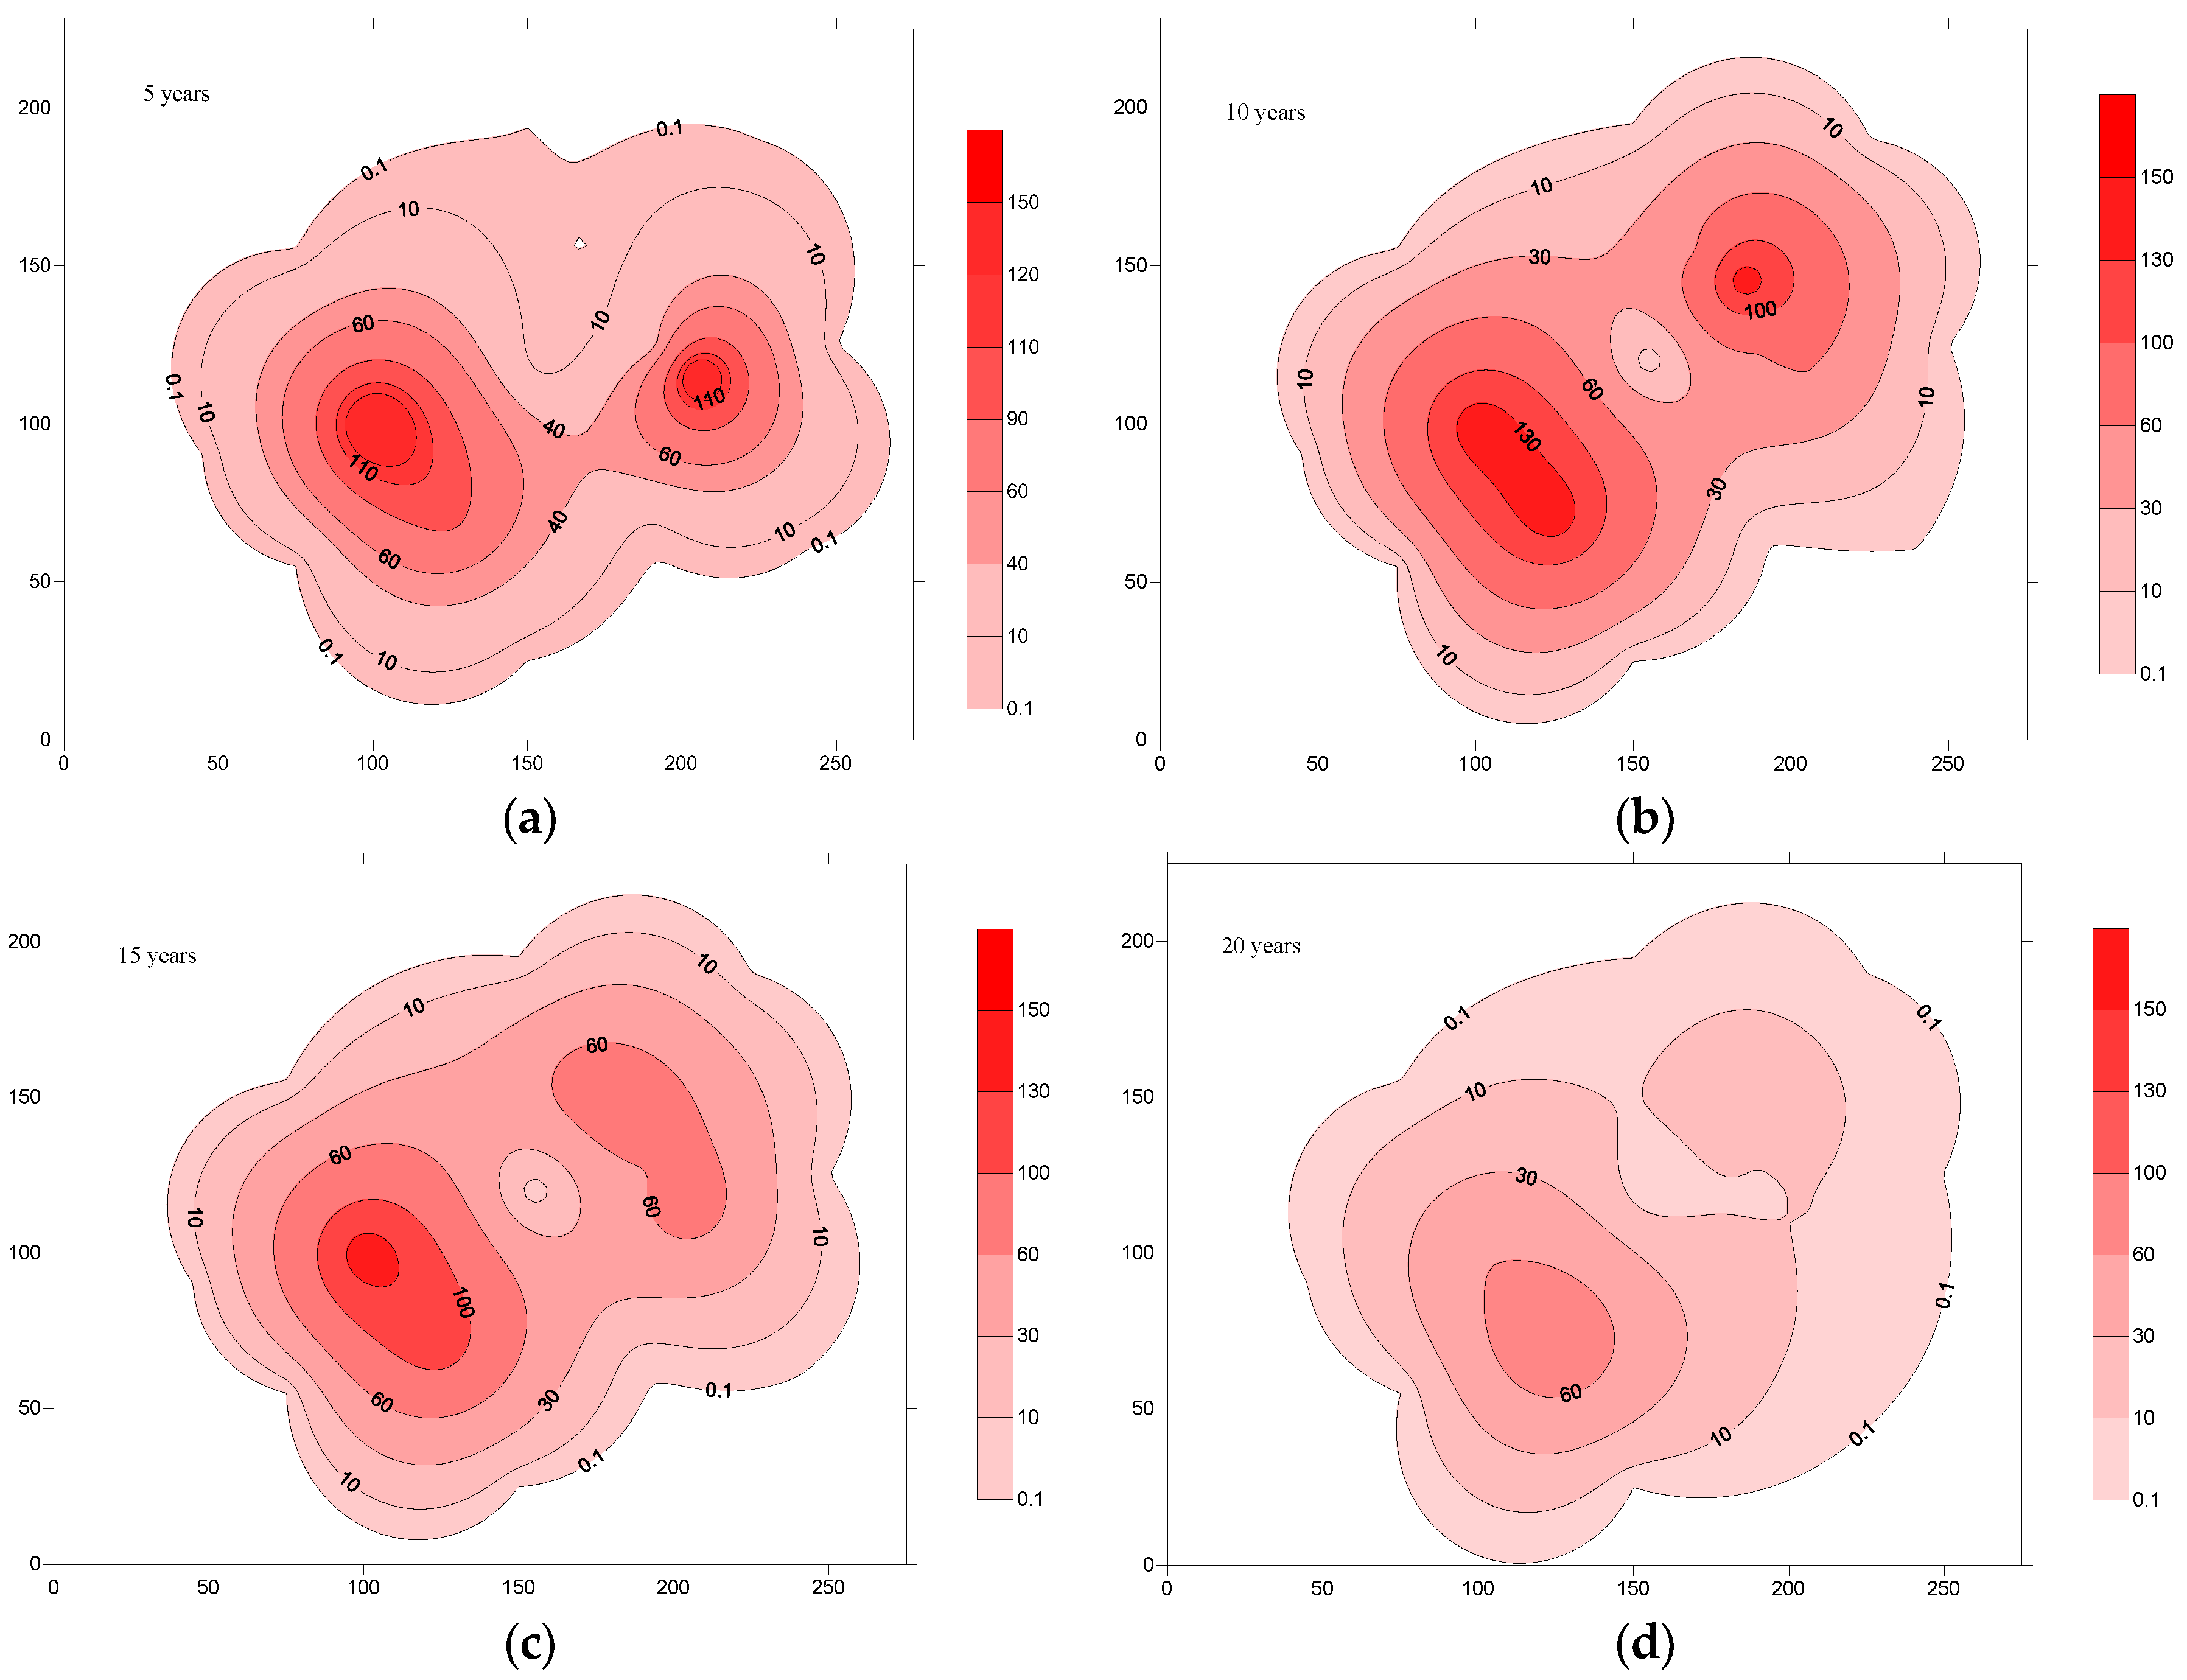
4.1. Optimization Results Analysis

A total of 80 scenarios are considered to assess the affection of the ISIO-THRA approach under four remediation duration times (i.e., 5, 10, 15, and 20 years), four environment standards, and five acceptable health-risk values.
Table 1 shows the remediation strategies of 16 scenarios (i.e., four remediation duration times under four different environmental standards) when the benzene carcinogenic health risk is 0.00044. When the environmental standard is 200 μg/L, the optimal pumping rates at six wells are 46.93, 16.69, 100.0, 0.0, 69.76, and 0.0 m3/h, respectively, under a remediation duration of 5 years. In this scenario, injection well 3 would reach its maximum allowable pumping rate. Extraction wells 1 and 5 would remove most contaminant. When the benzene environmental standard becomes stricter with a limit of 100 μg/L, the optimal pumping rates at six wells are 35.88, 35.14, 100.0, 0.0, 99.27, and 0 m3/h. The total pumping rate may increase from 233.38 to 270 m3/h. It indicates that pumping rates would increase to guarantee environmental standards. Meanwhile the pumping rates would decrease with the increase in remediation duration under the same environmental standard and carcinogenic health risk. However, the total pumping rate under a remediation duration of 20 years is larger than that for the remediation duration of 15 years when the environmental standard is 150 and 200 μg/L. The pumping rate may not change with environmental standard changes from 100 to 200 μg/L for a remediation duration of 20 years. This means that when the acceptable health risk is 0.00044, it would generate the same solution (i.e., the total pumping rate is 114.76 m3/h) with environmental standard higher than 100 μg/L under a remediation duration of 20 years. Hence, the acceptable level for health risk is the only influence factor to limit the pumping rate. When the environmental standard is 50 μg/L, it also shows that the only satisfactory strategy in remediation duration is the 20-year scenario. This means that when the environmental standard is very strict, the remediation duration must be long enough to remove the contaminant in the aquifers.
Table 2 shows the remediation strategies of the other 20 scenarios (i.e., four remediation duration times under five benzene carcinogenic health risks) when the environmental standard is 150 μg/L. It can be found that:
(1) Both Table 1 and Table 2 show that the pumping rates at wells 4 and 6 are zero, which means that 4 wells are enough, and also leads to less cost through this optimization model;
(2) When remediation duration is 10 years and the acceptable carcinogenic health risk for benzene is 0.00033, the optimal pumping rates at six wells are 27.75, 11.35, 46.99, 0.0, 30.58, and 0.0 m3/h, respectively. When the health risk changes to 0.00022, the optimal pumping rates at six wells change to 98.33, 33.85, 76.56, 0.0, 12.08, and 0.0 m3/h, respectively. Also, the total pumping rate increases from 116.67 to 220.82 m3/h. This means that the pumping rate would increase in order to reduce the environmental health risk;
(3) When the acceptable health risk is 0.00011, the satisfactory remediation strategy can be obtained under the remediation duration of 5 years. The health risks are mainly produced in the remediation period. Hence, a short remediation duration would be required in the actual remediation program;
(4) When the remediation duration is 5 years, the remediation strategies would not change when the health risk varies from 0.00055 to 0.00022. This means that when the optimal strategy satisfies the environmental standard of 150 μg/L under a remediation duration of 5 years, the maximum health risk would be lower than 0.00022. Similarly, for the remediation duration of 10 years, the maximum health risk would be lower than 0.00033 when the optimal strategy satisfies the environmental standard of 150 μg/L;
(5) It also can be concluded that the total pumping rate for 20 years (i.e., 114.76 m3/h) is higher than the total pumping rate for 15 years (i.e., 75.08 m3/h), and hence it appears that a longer remediation duration requires increased pumping rates. Also, the residual concentrations in each monitor well present different changes. To illustrate this problem, the optimal solutions are analyzed under an environmental standard of 150 μg/L and an acceptable health risk of 0.00044.
Figure 2 provides an insight into the optimal solutions and the change of contaminant reduction with time. It is clear that, as the remediation duration increases, the total pumping rate decreases at the initial remediation period and then increases at the later period, which has an inflection point. Once the remediation act starts, the hydrological condition of the site is disturbed: the contaminant plume diffuses around the pollution source, which mainly migrates along with the current direction. The residual concentrations of the monitor wells M1, M2, M4 and M7 after 10-year duration remediation (i.e., 59.61, 150.02, 64.06, 149.98 μg/L, respectively.) are larger than the residual concentration after 5-year duration remediation (i.e., 0.05, 17.38, 30.86, 98.87 μg/L, respectively.). When the remediation duration is extended to 15 years, the residual concentrations in each well decrease. This result is consistent with the experience gained by Prasad and Mathur [32]. However, monitor well M5 is located in the most downstream flow, so its pollution concentration basically exhibits no change because of the balance of diffusion inflow and extraction outflow. When the remediation duration is extended to 20 years, the increase for the pumping rate can make the pollutant concentration decrease obviously to ensure the effectiveness of remediation.

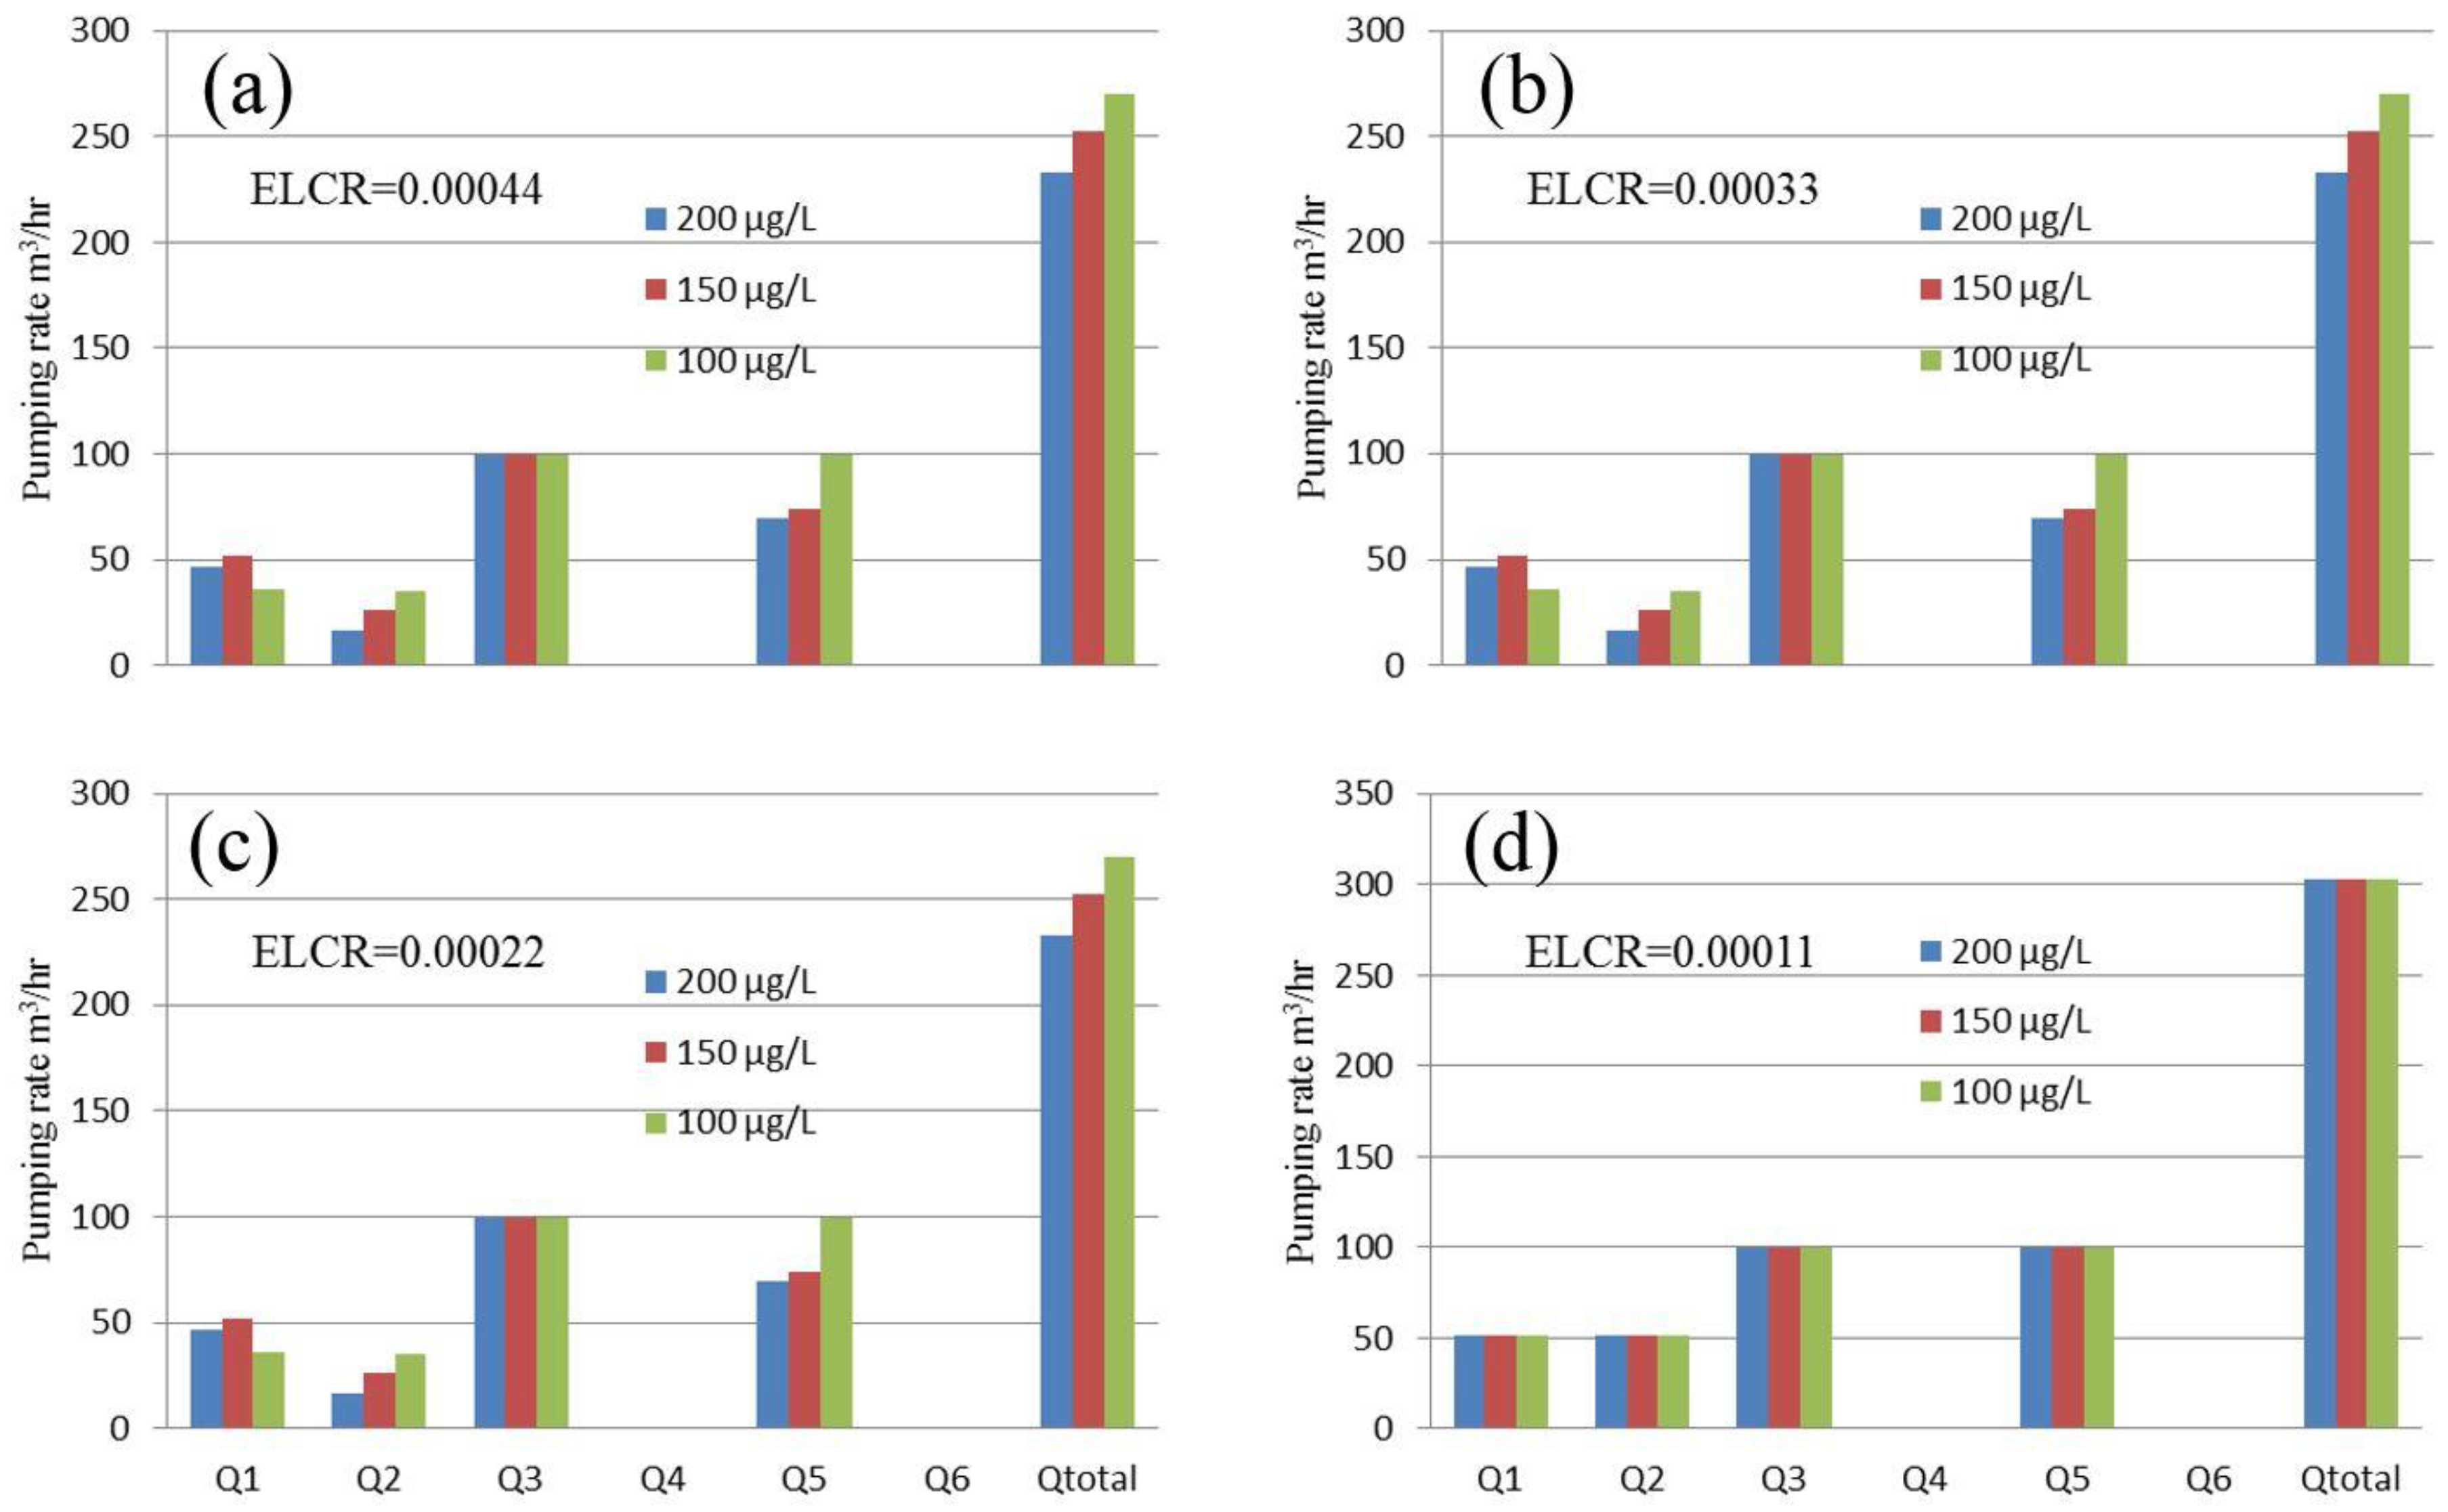
4.2. Environmental Standard and Health Risk

Figure 3 shows the solutions obtained under four benzene carcinogenic health risk levels (i.e., 0.00011, 0.00022, 0.00033, and 0.00044) and 5-year remediation duration. When the environmental standard is 100 μg/L, the optimal pumping rates at the six wells are 35.88, 35.14, 100.0, 0.0, 99.27, and 0.0 m3/h, respectively, under a carcinogenic health risk level of 0.00033. When the environmental standard is 150 μg/L, the pumping rates at six wells may change to 51.7, 26.02, 100, 0, 74.32 and 0 m3/h, respectively. When the environmental standard changes from 100 to 150 μg/L, the pumping rates at wells 2 and 5 decrease while the pumping rate at well 1 increases. Meanwhile, the total pumping rate may reduce from 270.27 to 252.04 m3/h. It means that wells 2 and 5 play important roles in the PAT system. When the environmental standard changes from 150 to 200 μg/L, the total pumping rate would reduce to 233.38 m3/h and the pumping rates at wells 1, 2, and 5 may also reduce. With changes in environmental standard, the pumping rates at wells 3, 4, and 6 are maintained constant. Moreover, the pumping rates at wells 3, 4 and 6 are 100, 0, 0 m3/h, indicating that well 3 plays an important role in the PAT remediation system. When environmental standard is maintained unchanged, the optimal results are also unchanged even though the health risks increases from 0.00022 to 0.00044. This also shows that, when acceptable health risk is 0.00011, the results obtained are unchanged although the environmental standard changes from 100 to 200 μg/L. This means: (i) the health risk would be lower than 0.00022 when the obtained results satisfy the environmental standard; (ii) when the obtained results satisfy health risk (i.e., 0.00011), the benzene concentration would be lower than 100 μg/L.
Figure 4 shows the simulated benzene concentrations under the four remediation durations when the environmental standard is 150 μg/L and the acceptable health risk level is 0.00044. Firstly, it shows that the peak value of residual concentration appears around monitor well M3 for all scenarios. This means that most contaminants move to the location of M3 under the remediation practice. Hence, in the future, we can add extraction well near M3 to improve the PAT system. Secondly, the peak value of residual concentration increases at the initial remediation period and then decreases at the later period. This result is consistent with the experience of Prasad and Mathur [32]. Hence, in order to make the contaminant concentration meet the environmental standard, the contaminants should be removed quickly by increasing the pumping rate in the early remediation period. Thirdly, with the remediation duration prolonged enough (20 years), the contaminant concentration may mitigate far below the environmental standard. This means that most contaminant may be removed by a long pumping duration.
Figure 5 shows the predicted risk levels for four remediation durations when the environmental standard is 150 μg/L and the acceptable health risk level is 0.00044. As shown in Figure 5, the risk level is higher in the center area compared with the boundary area. There are two high health-risk centers where contaminant concentrations are higher than other regions in the simulated area. This is because there are two contamination sources near there. The peak values of health risk are 0.00015, 0.00025, 0.00040 and 0.00043, under remediation durations of 5, 10, 15 and 20 years, respectively. It can be found, obviously, that the health risk increases if the remediation duration is prolonged. Hence, the health risk accumulated in the remediation period cannot be neglected. Therefore, strategies with the short remediation duration should be chosen under the same limits in environmental standard and acceptable health risk.

4.3. Trade-Off Analysis

When decision-making in groundwater remediation problems is characterized by conflicting objectives, optimality of a solution must be guided by the involved trade-offs [33,34,35]. For the same environmental standard and the maximum acceptable health risk, in this study the maximum residual concentration would appear in the strategy with a 5-year remediation duration while the maximum health risk would appear in the strategy with a 20-year remediation duration. This indicates that the residual concentration after remediation would decrease while health risk would increase with a prolonged remediation duration. Figure 6 shows the predicted risk levels under the four environmental standards when the remediation duration is 20 years and the acceptable health risk level is 0.00055. When the environmental standards are 50, 100, 150, 200 μg/L under a remediation duration of 20 years and a health risk level of 0.00055, the pumping rates are 206.8, 51.48, 36.3, 30.12 m3/h, respectively. It is found that the distributions of health risk under three environmental standards (i.e., 100, 150, 200 μg/L) are similar. The reason is that health risk is mainly produced in the initial remediation period. Hence, more contaminant should be removed in the initial remediation period. As shown in Table 1, optimal pumping rates for the 5-year remediation duration range from 233.38 to 270.29 m3/h under the health-risk level of 0.00044, which can meet the environmental standard within 100 and 200 μg/L. As shown in Table 2, the optimal pumping rates for the 20-year remediation duration range from 36.3 to 114.76 m3/h under the environmental standard of 150 μg/L, which can meet the acceptable health risk within 0.00044 and 0.00055. Furthermore, when the environmental standard is 50 μg/L with remediation being 20 years and acceptable health risk level being 0.00055, the predicted health risk obviously decreases under the condition of a high pumping rate. Therefore, a short remediation duration scheme should be selected when the environmental standard is not strict.

5. Conclusions

In this study, a groundwater remediation design model based on an integrated simulation, inference and optimization approach with two-stage health risk assessment (ISIO-THRA) was proposed for mitigating contaminants from a petroleum-contaminated aquifer. There are four advantages in comparison with other models: (1) both environmental standard and health risks were used as the constraints in the model; (2) the two-stage health risk assessments (i.e., health risks in the remediation period and the natural attenuation period after remediation) were conducted to address the problem of variation in the health risk with contaminant concentration; (3) the relationship between contaminant concentration and time were expressed by two first-order decay models; (4) the relationship between contaminant concentrations (i.e., at all monitored wells after remediation) and pumping rates (i.e., at all remediation wells) were obtained through a simulation, inference, and optimization method.
A petroleum-contaminated site in western Canada was chosen as a pilot to test the ISIO-THRA model. The results indicated that the stricter environmental standards and health risks would lead to the larger pumping rate at the same remediation duration. However, the longer remediation duration led to a higher health risk for the same environmental standard. This indicated that remediation duration would play a key role in the PAT system. When carcinogenic risk was the maximum acceptable health risk, the non-carcinogenic factor would satisfy the health risk. Compared with previous studies, health risk is not a linear relationship with contaminant concentration after remediation. The study also showed that the health risk value would depend on the remediation duration and the initial contaminant concentration. The main health risk would be produced in the initial remediation period. Hence, in the actual remediation program, the strategy with a shorter remediation duration under the same environmental standard should be chosen.
In the real world, contaminant concentration is difficult to predict as it changes with time. Moreover, the maximum acceptable health risk value is difficult to determine. In the next study, the contaminant concentration prediction and the maximum acceptable health risk value will need more research.

Author Contributions

A.L.Y. conceived and applied the model; A.L.Y. and Q.Y. calculated the model and analyzed the data; A.L.Y., Q.Y., Y.R.F., M.Q.S., H.Y.F., J.L. and X.J.L. wrote the paper.

Acknowledgments

This research was supported by funding (type A) from Fujian Educational Committee with Grant JA15371, Xiamen Science and Technology, Project 3502Z20179035, Fujian Science and Technology Guiding Project 2018Y0079, Science and Technology Research Project of Hebei University BJ2016011. Our deepest gratitude goes to the editor and anonymous reviewers for their insightful comments and suggestions that have helped improve this paper substantially.

Conflicts of Interest

The authors declare no conflict of interest.

References

  1. Yang, A.L.; Huang, G.H.; Qin, X.S.; Fan, Y.R. Evaluation of remedial options for a benzene-contaminated site through a simulation-based fuzzy-MCDA approach. J. Hazard. Mater. 2012, 213–214, 421–433. [Google Scholar] [CrossRef] [PubMed]
  2. Smargiassi, A.; Goldberg, M.S.; Wheeler, A.J.; Plante, C.; Valois, M.F.; Mallach, G. Associations between personal exposure to air pollutants and lung function tests and cardiovascular indices among children with asthma living near an industrial complex and petroleum refineries. Environ. Res. 2014, 132, 38–45. [Google Scholar] [CrossRef] [PubMed]
  3. Li, J.; He, L.; Lu, H.W.; Fan, X. Control of stochastic carcinogenic and noncarcinogenic risks in groundwater remediation through an integrated optimization design model. Stoch. Environ. Res. Risk Assess. 2015, 29, 2159–2172. [Google Scholar] [CrossRef]
  4. Thangjam, S.S.; Dibakar, C. Multi-objective optimization for optimal groundwater remediation design and management systems. Geosci. J. 2010, 14, 87–97. [Google Scholar]
  5. Yang, Q.; He, L.; Lu, H.W. A multi objective optimisation model for groundwater remediation design at petroleum contaminated sites. Water Resour. Manag. 2013, 27, 2411–2427. [Google Scholar] [CrossRef]
  6. Fan, Y.R.; Huang, G.H.; Baetz, B.W.; Li, Y.P.; Huang, K. Development of a Copula—based Particle Filter (CopPF) Approach for Hydrologic Data Assimilation under Consideration of Parameter Interdependence. Water Resour. Res. 2017, 53, 4850–4875. [Google Scholar] [CrossRef]
  7. Fan, Y.R.; Huang, W.W.; Huang, G.H.; Li, Y.P.; Huang, K.; Li, Z. Hydrologic risk analysis in the Yangtze River basin through coupling Gaussian mixtures into copulas. Adv. Water Resour. 2016, 88, 170–185. [Google Scholar] [CrossRef]
  8. United States Environmental Protection Agency (US EPA). Treatment Technologies for Site Cleanup: Annual Status Report (Twelfth Edition); EPA-542-R07-012 (no. 12); U.S. EPA, Office of Solid Waste and Emergency Response Technology Innovation Office: Washington, DC, USA, 2007. Available online: https://clu-in.org/download/remed/asr/12/asr12_main_body.pdf (accessed on 7 September 2017).
  9. He, L.; Huang, G.H.; Lu, H.W.; Zeng, G.M. Optimization of surfactant-enhanced aquifer remediation for a laboratory BTEX system under parameter uncertainty. Environ. Sci. Technol. 2008, 42, 2009–2014. [Google Scholar] [CrossRef] [PubMed]
  10. Yang, A.L.; Huang, G.H.; Fan, Y.R.; Zhang, X.D. A fuzzy simulation-based optimization approach for groundwater remediation design at contaminated aquifers. Math. Probl. Eng. 2012, 2012, 291–300. [Google Scholar] [CrossRef]
  11. Xie, Y.F.; Li, X.W.; Liu, X.J.; Du, X.M.; Li, F.S.; Cao, Y.Z. Performance evaluation of remediation scenarios for DNAPL contaminated groundwater using analytical models and probabilistic methods. Proc. Environ. Sci. 2016, 31, 264–273. [Google Scholar] [CrossRef]
  12. Park, C.H.; Aral, M.M. Multi-objective optimization of pumping rates and well placement in coastal aquifers. J. Hydrol. 2004, 290, 80–99. [Google Scholar] [CrossRef]
  13. Baú, D.A.; Mayer, A.S. Optimal design of pump-and-treat systems under uncertain hydraulic conductivity and plume distribution. J. Contam. Hydrol. 2008, 100, 30–46. [Google Scholar] [CrossRef] [PubMed]
  14. Brusseau, M.L. Use of historical pump-and-treat data to enhance site characterization and remediation performance assessment. Water Air Soil Pollut. 2013, 224, 1–6. [Google Scholar] [CrossRef] [PubMed]
  15. Park, Y.C. Cost-effective optimal design of a pump-and-treat system for remediating groundwater contaminant at an industrial complex. Geosci. J. 2016, 20, 891–901. [Google Scholar] [CrossRef]
  16. Hsiao, C.T.; Chang, L.C. Dynamic optimal groundwater management with inclusion of fixed costs. J. Water Resour. Plan. Manag. ASCE 2002, 128, 57–65. [Google Scholar] [CrossRef]
  17. Dougherty, D.E.; Marryott, R.A. Optimal groundwater management: 1. Simulated annealing. Water Resour. Res. 1991, 27, 2497–2508. [Google Scholar] [CrossRef]
  18. Johnson, V.M.; Rogers, L.L. Location analysis in groundwater remediation using neural networks. Ground Water 1995, 33, 749–758. [Google Scholar] [CrossRef]
  19. Taheri, M.; Mohebbi, A. Design of artificial neural networks using a geneticalgorithm to predict collection efficiency in venturi scrubbers. J. Hazard. Mater. 2008, 157, 122–129. [Google Scholar] [CrossRef] [PubMed]
  20. Haghighi, A.; Samani, H.M.V.; Samani, Z.M.V. GA-ILP Method for optimization of water distribution networks. Water Resour. Manag. 2011, 25, 1791–1808. [Google Scholar] [CrossRef]
  21. Kaini, P.; Artita, K.; Nicklow, J.W. Optimizing structural best management practices using SWAT and genetic algorithm to improve water quality goals. Water Resour. Manag. 2012, 26, 1827–1845. [Google Scholar] [CrossRef]
  22. Moharram, S.H.; Gad, M.I.; Saafan, T.A.; Allah, S.K. Optimal groundwater management using genetic algorithm in El-Farafra Oasis, western desert, Egypt. Water Resour. Manag. 2012, 26, 927–948. [Google Scholar] [CrossRef]
  23. Ricciardi, K.L.; Pinder, G.F.; Karatzas, G.P. Efficient groundwater remediation system design subject to uncertainty using robust optimization. J. Water Resour. Plan. Manag. ASCE 2007, 133, 253–263. [Google Scholar] [CrossRef]
  24. Ruggieria, F.; Gil, R.A. Multivariate factorial analysis to design a robust batch leaching test to assess the volcanic ash geochemical hazard. J. Hazard. Mater. 2012, 213–214, 273–284. [Google Scholar] [CrossRef] [PubMed] [Green Version]
  25. Qin, X.S. Assessing environmental risks through fuzzy parameterized probabilistic analysis. Stoch. Environ. Res. Risk Assess. 2012, 26, 43–58. [Google Scholar] [CrossRef]
  26. Han, L.; Qian, L.; Yan, J.; Liu, R.; Du, Y.; Chen, M. A comparison of risk modeling tools and a case study for human health risk assessment of volatile organic compounds in contaminated groundwater. Environ. Sci. Pollut. Res. 2016, 23, 1234–1245. [Google Scholar] [CrossRef] [PubMed]
  27. He, L.; Huang, G.H.; Zeng, G.M. An integrated simulation, inference, and optimization method for identifying groundwater remediation strategies at petroleum-contaminated aquifers in western Canada. Water Res. 2008, 42, 2629–2639. [Google Scholar] [CrossRef] [PubMed]
  28. Delshad, M.; Pope, G.A.; Sepehrnoori, K. A compositional simulator for modeling surfactant enhanced aquifer remediation, 1. Formulation. J. Contam. Hydrol. 1996, 23, 303–327. [Google Scholar] [CrossRef]
  29. Kao, C.M.; Prosser, J. Evaluation of natural attenuation rate at a gasoline spill site. J. Hazard. Mater. 2001, 82, 275–289. [Google Scholar] [CrossRef]
  30. Wang, M.; Zheng, C. Optimal remediation policy selection under general conditions. Groundwater 1997, 35, 757–764. [Google Scholar] [CrossRef]
  31. EEP. Numerical Simulation for Contaminant Flow and Transport in Subsurface—A Study of Soil and Groundwater Contamination at the Coleville Site; Process Report; University of Regina: Regina, SK, Canada, 2005. [Google Scholar]
  32. Prasad, R.K.; Mathur, S. Health-Risk-Based remedial alternatives for contaminated aquifer management. Pract. Period. Hazard. Toxic Radioact. Waste Manag. 2010, 14, 61–69. [Google Scholar] [CrossRef]
  33. Kollat, J.B.; Reed, P.M. Comparing state-of-the-art evolutionary multi-objective algorithms for long-term groundwater monitoring design. Adv. Water Resour. 2006, 29, 792–807. [Google Scholar] [CrossRef]
  34. Chen, B.; Li, P.; Wu, H.J.; Husain, T.; Khan, F. MCFP: A Monte Carlo Simulation-based Fuzzy Programming Approach for Optimization under Dual Uncertainties of Possibility and Continuous Probability. J. Environ. Inf. 2017, 29, 88–97. [Google Scholar] [CrossRef]
  35. Li, Y.P.; Nie, S.; Huang, C.Z.; McBean, E.A.; Fan, Y.R.; Huang, G.H. An Integrated Risk Analysis Method for Planning Water Resource Systems to Support Sustainable Development of An Arid Region. J. Environ. Inf. 2017, 29, 1–15. [Google Scholar] [CrossRef]
Figure 1. The simulation domain [27].
Water 10 00694 g001
Figure 2. The optimal solutions when the environmental standard is 150 μg/L and the acceptable health risk is 0.00044. Qt is optimal total pumping rate (m3/h), Mi is residual concentration in the monitor well (μg/L).
Water 10 00694 g002
Figure 3. Optimization pumping rates under different scenarios when the remediation duration is 5 years, where (a), (b), (c), (d) are results under the conditions of the allowable ELCR values being 0.00044, 0.00033, 0.00022 and 0.00011, respectively.
Water 10 00694 g003
Figure 4. Simulated benzene concentrations for four remediation durations when the environmental standard is 150 μg/L and acceptable health risk level is 0.00044, where (a), (b), (c), (d) are results under the conditions of remediation duration values being 5, 10, 15 and 20 years, respectively.
Water 10 00694 g004
Figure 5. Predicted risk levels for four remediation duration when the environmental standard is 150 μg/L and the acceptable health risk level is 0.00044, where (a), (b), (c), (d) are results under the conditions of remediation duration values being 5, 10, 15 and 20 years, respectively.
Water 10 00694 g005
Figure 6. Predicted risk levels for four environmental standards when remediation duration is 20 years and acceptable health risk level is 0.00055, where (a), (b), (c), (d) are results under the conditions of environmental standard values being 50, 100, 150 and 200μg/L, respectively.
Water 10 00694 g006
Table 1. The remediation strategies under different scenarios while ELCRmax at 0.00044.
Remediation DurationCmax (μg/L)Q1 (m3/h)Q2 (m3/h)Q3 (m3/h)Q4 (m3/h)Q5 (m3/h)Q6 (m3/h)Qtotal (m3/h)
5 years20046.9316.69100069.760233.38
15051.726.02100074.320252.04
10035.8835.14100099.270270.29
50-------
10 years20018.659.336.45027.09091.49
15027.7511.3546.99030.580116.67
10081.0521.1478.72018.810199.72
50-------
15 years20037.54037.5400075.08
15037.54037.5400075.08
10082.8732.3650.51000165.74
50-------
20 years20022.93057.38034.450114.76
15022.93057.38034.450114.76
10022.93057.38034.450114.76
5062.9835.0368.37040.420206.8
Table 2. The remediation strategies under different scenarios while the environmental standard is 150 μg/L.
Remediation DurationELCRQ1 (m3/h)Q2 (m3/h)Q3 (m3/h)Q4 (m3/h)Q5 (m3/h)Q6 (m3/h)Qtotal (m3/h)
5 years0.0005551.726.02100074.320252.04
0.0004451.726.02100074.320252.04
0.0003351.726.02100074.320252.04
0.0002251.726.02100074.320252.04
0.0001151.2651.2610001000302.52
10 years0.0005527.7511.3546.99030.580116.67
0.0004427.7511.3546.99030.580116.67
0.0003327.7511.3546.99030.580116.67
0.0002298.3333.8576.56012.080220.82
0.00011-------
15 years0.0005536.77036.7700073.54
0.0004437.54037.5400075.08
0.00033-------
0.00022-------
0.00011-------
20 years0.0005518.15018.1500036.3
0.0004422.93057.38034.450114.76
0.00033-------
0.00022-------
0.00011-------

