Trunk Network Rehabilitation for Resilience Improvement and Energy Recovery in Water Distribution Networks
by
 , , and
Gustavo Meirelles
1,* ,
,
Bruno Brentan
2,
Joaquín Izquierdo
3 ,
,
Helena Ramos
4 and
and
Edevar Luvizotto, Jr.
1 1
Department of Water Resources—DRH, Universidade Estadual de Campinas, Campinas 13083-889, Brazil
2
Centre de Recherche en Controle et Automatique de Nancy—CRAN, Université de Lorraine, 54000 Nancy, France
3
Institute for Multidisciplinary Mathematics, Universitat Politècnica de València, Camino de Vera s/n Edif. 5C, 46022 Valencia, Spain
4
Civil Engineering, Architecture and Georesources Departament—CERIS, Instituto Superior Técnico, Universidade de Lisboa, 1049-001 Lisboa, Portugal
*
Author to whom correspondence should be addressed.
Water 2018, 10(6), 693; https://doi.org/10.3390/w10060693
Submission received: 28 April 2018
/
Revised: 23 May 2018
/
Accepted: 23 May 2018
/
Published: 26 May 2018
(This article belongs to the Special Issue New Challenges in Water Systems)
Abstract
:Water distribution networks (WDNs) are designed to meet water demand with minimum implementation costs. However, this approach leads to poor long-term results, since system resilience is also minimal, and this requires the rehabilitation of the network if the network is expanded or the demand increases. In addition, in emergency situations, such as pipe bursts, large areas will suffer water shortage. However, the use of resilience as a criterion for WDN design is a difficult task, since its economic value is subjective. Thus, in this paper, it is proposed that trunk networks (TNs) are rehabilitated when considering the generation of electrical energy using pumps as turbines (PATs) to compensate for an increase of resilience derived from increasing pipe diameters. During normal operation, these micro-hydros will control pressure and produce electricity. When an emergency occurs, a by-pass can be used to increase network pressure. The results that were obtained for two hypothetical networks show that a small increase in TN pipe diameters is sufficient to significantly improve the resilience of the WDN. In addition, the value of the energy produced surpasses the investment that is made during rehabilitation.
1. Introduction
For efficient operation of Water Distribution Networks (WDNs), suitable designs are necessary, which should consider economic criteria [1,2,3], hydraulic parameters, such as resilience [4] and water quality [5], and management criteria, such as system flexibility [6] and robustness [7]. However, a design is made based on a specific model of the WDN, and uncertainties in roughness [8] and mainly in future demands [9] can affect its real operation conditions. Taking into account all of these variables and uncertainties, multi-objective approaches reveal as an alternative to reach feasible designs [10,11,12]. However, WDN cost and reliability are conflicting parameters, i.e., to improve one of them, the other has to be impaired. The importance of resilience to achieve a reliable system is a well-known fact. However, it is hard to economically quantify the value of its improvement. As a result, even in a multi-objective design, it is up to the decision maker to choose the best possible scenario based on his or her experience.
An alternative to better seize the resilience improvement is the use of Pumps as Turbines (PATs) to generate electrical energy during the periods of normal operation conditions, when those micro-hydros act as both pressure control and energy generation devices simultaneously [13,14,15]. When an emergency occurs, such as a pipe burst, the pressure in the network can be controlled while using a by-pass. In this scenario, the additional investment that is necessary to improve resilience is recovered during normal operation conditions through energy production. Due to the dynamic behavior of a WDN, PATs are not able to perform pressure control as Pressure Reducing Valves (PRVs) [16]. To solve this problem, variable speed drives [17,18] and a combined configuration of PATs and PRVs [19,20] can be used.
The studies presented in [21,22] show the feasibility of increasing network pipes diameters to improve energy production for various topologies. However, these studies are restricted to the design of new WDNs. For existing systems, the costs of replacing pipes are much higher, since pipes are already buried. In addition, technical issues, such as traffic changes and the interruption in water supply can cause troubles for the population. In this case, rehabilitation of the Trunk Network (TN) can be an alternative to improve WDN flow capacity. According to [23,24], WDN sensitivity is strongly related to TN performance due to the high flow transported, highly influencing pressure in the entire network.
Therefore, when considering the difficult to evaluate resilience in WDN design and the high investment that is necessary to improve this parameter in existing systems, in this research, TN rehabilitation is proposed to improve WDN resilience while considering the use of PATs for energy recovery during normal operation to compensate the investment that is made. In this way, it is expected that a technical issue such as resilience can be better exploited as a design parameter, and benefits will derive for the economic side. Thus, the decision maker, even inexperienced in this kind of problem, may have a reference to choose the best alternative. Different sizes of TNs are evaluated to access the solution with minimum interventions and reasonable resilience improvement. The TN is defined using graph theory to achieve the shortest path of flow to supply a given demand node. The flow that is observed in the pipes is used as a weighting coefficient to avoid the inclusion of small pipes in TNs. Then, applying the Particle Swarm Optimization (PSO) technique to obtain the diameters of the TN pipes, allows for minimizing the implantation costs, which are calculated as the sum of pipe and micro-hydro costs, discounting the energy recovery benefits that were obtained during the PAT life span. The proposed methodology is applied in two different case studies: the Fossolo Drinking Network [25] and the Balerma Irrigation Network [26].
2. Materials and Methods
2.1. Trunk Network
A WDN topology can be seen as a graph, with the nodes representing the vertices and the pipes the edges. Several studies show that the algorithms and concepts that were developed within graph theory can be applied to define the best path of a TN [27,28].
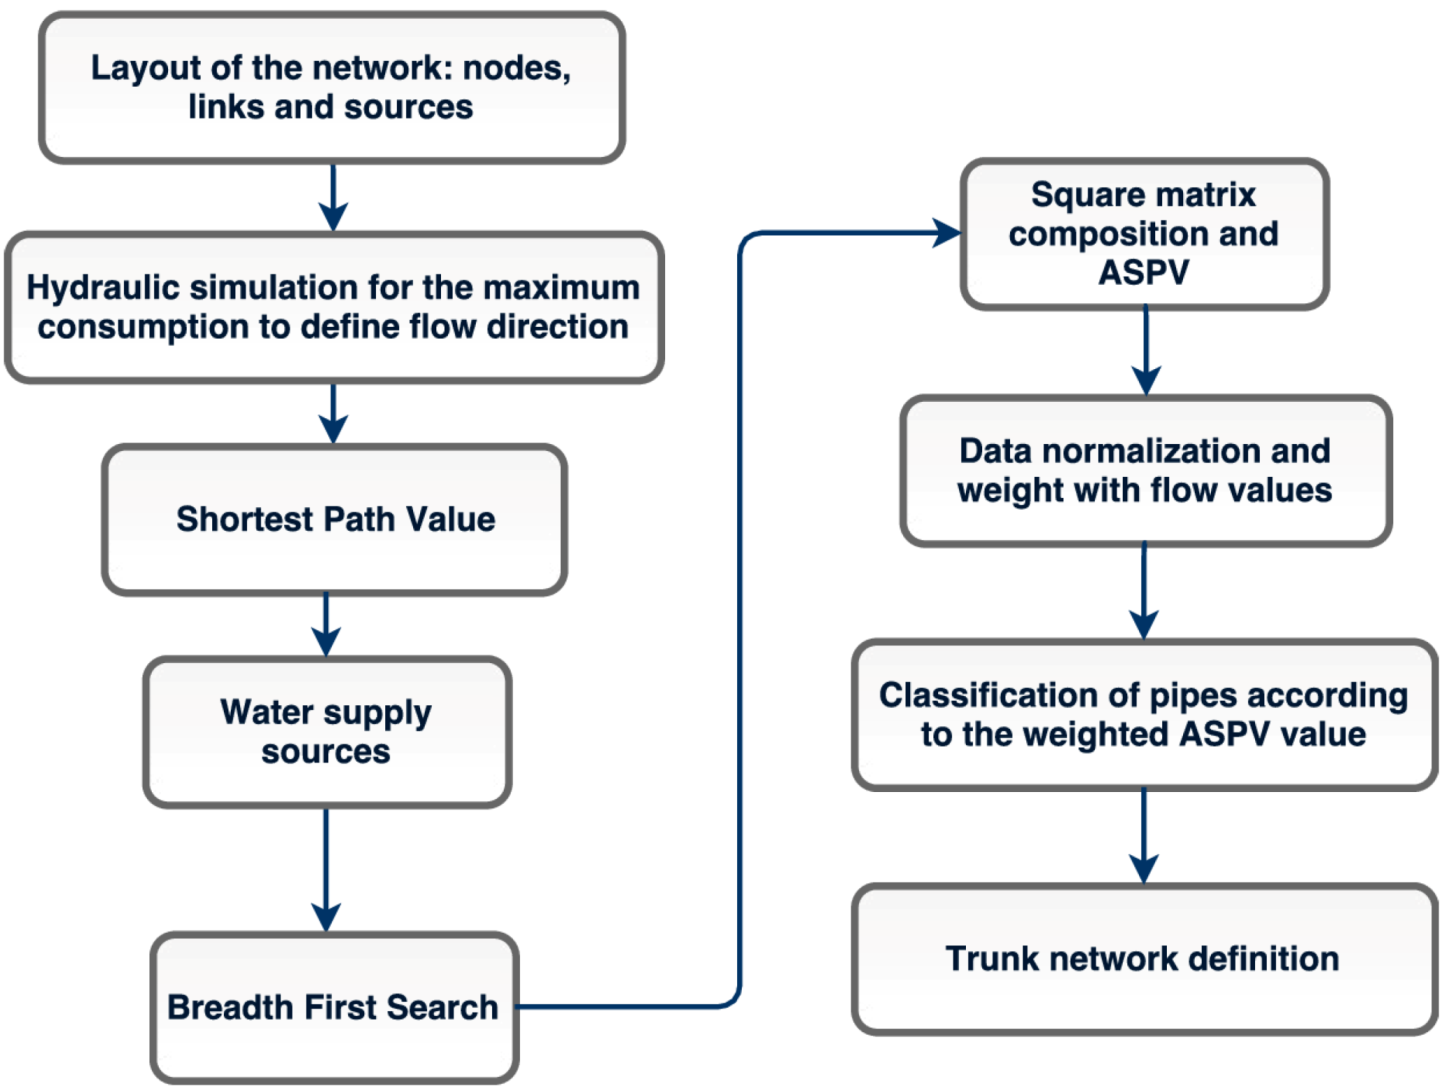
The concept of shortest path can be used for this purpose, since it defines the frequency of all the possible paths in a graph. The flow direction in each pipe is necessary to create a so-called digraph, which is a graph with directions that are previously set. However, in a WDN, the flow behavior can change according to the day time and the settings of valves and pumps. Usually, a hydraulic simulation is made for the maximum consumption period, with the usual setting of pumps and valves to define the flow direction. Taking into account tanks and reservoirs as sources for water supply, the Breadth First Search (BFS) technique [29] can be applied to define the shortest path in terms of nodes between the source and each consumption node. Then, a square matrix is built, with columns representing the start nodes and rows the end nodes. The sum of the values of each row, which are called Accumulated Shortest Path Value (ASPV), will define the most important nodes of the WDN, since this sum indicates their reach, i.e., to meet the demand of some areas the flow has to pass through these most important nodes. The values have to be first normalized to achieve this importance classification.
According to [23], an additional criterion is necessary to avoid the introduction of small pipes that are capable of supplying larger pipes in the TN. Thus, the flow that was observed in the pipe is used as a weighting coefficient for the ASPV, and only really important pipes will present high ASPVs.
Finally, the size of the TN has to be defined. A statistical analysis of the frequencies of ASPVs has to be done to achieve the best value. However, in this work the optimal size of a TN is defined according to the value of an objective function. Thus, to evaluate different scenarios, the TN size is gradually changed, and the results are compared in order to define the best configuration. Figure 1 summarizes the procedure to obtain the TN.
2.2. Resilience Index
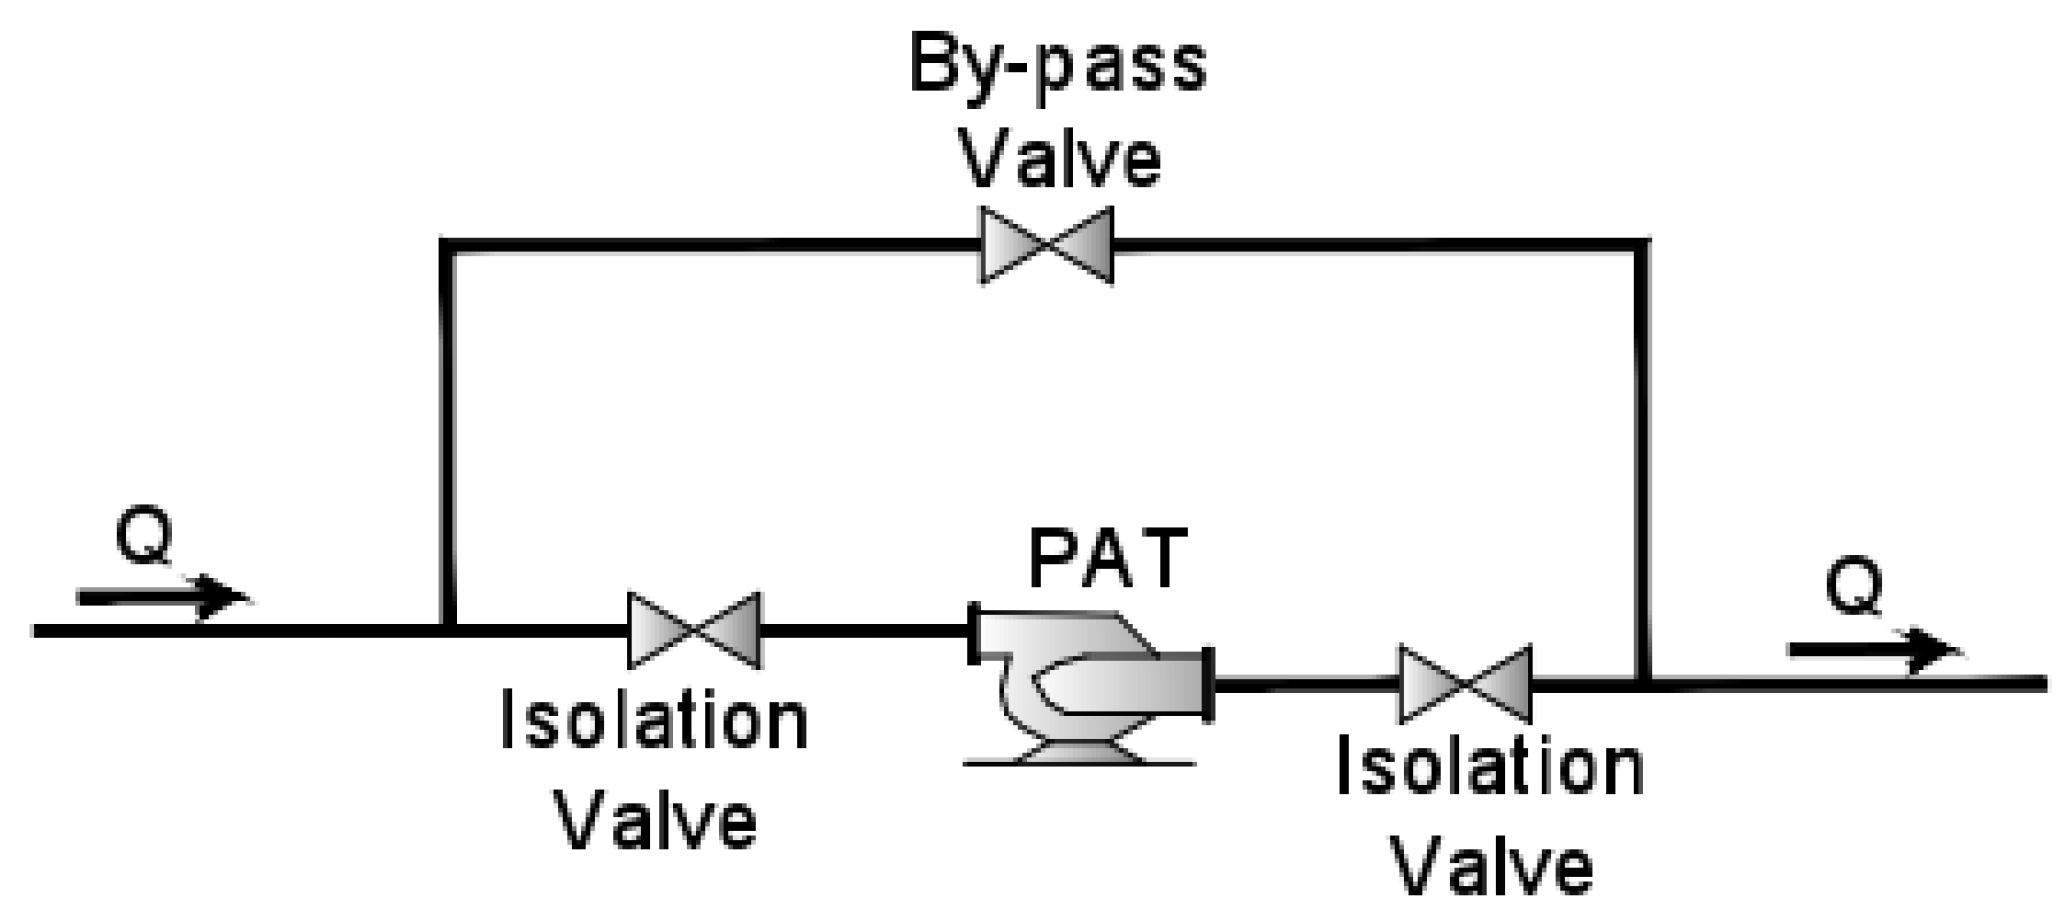
The resilience index that is proposed by [30] expresses the capacity of a WDN to supply the demand in emergency situations, such as pipe bursts, pumping station shutdowns, and even sudden demand increases, as observed in firefighting. In all of these cases, the velocity in certain pipes increases, and the additional headloss produced causes pressure reduction in the consumption nodes. Thus, if some additional pressure is not available, then the minimum conditions for supply are not met, causing water shortage in some network zones. In the proposed scheme, the WDN operates close to these minimum conditions during a normal scenario. However, in emergency cases, the flow can be driven through a by-pass to regulate the pressure in the network, thus reducing the head drop that is caused by the PAT. Two valves are necessary to isolate and regulate the PAT flow and one valve is used in the by-pass, as shown in Figure 2. With this configuration, the flow can be regulated in both branches, and in extreme conditions, only through the by-pass. In addition, the PAT isolation valves allow for its maintenance when necessary. The resilience index will be calculated for the condition where the PAT is not operating, according to Equation (1).
Here is the resilience index, is the number of demand nodes, is the demand of node , is the hydraulic grade available in node , is the hydraulic grade required by node , is the number of reservoirs and tanks, is the flow supplied by the reservoir or tank , is the hydraulic grade of reservoir or tank , is the number of pumps, is the flow that is supplied by pump , and is the head of pump . As the most unfavorable scenario occurs during maximum consumption, resilience has been calculated only for this condition.
2.3. Trunk Network Design and Energy Recovery
The design of the TN can be made through the minimization of the objective function, , defined in Equation (2), which expresses the net cost of the project. The total cost, which is represented by the pipes’ cost, , and the micro-hydro cost, , is discounted by the benefit that is obtained from the energy recovery during the PAT life span, .
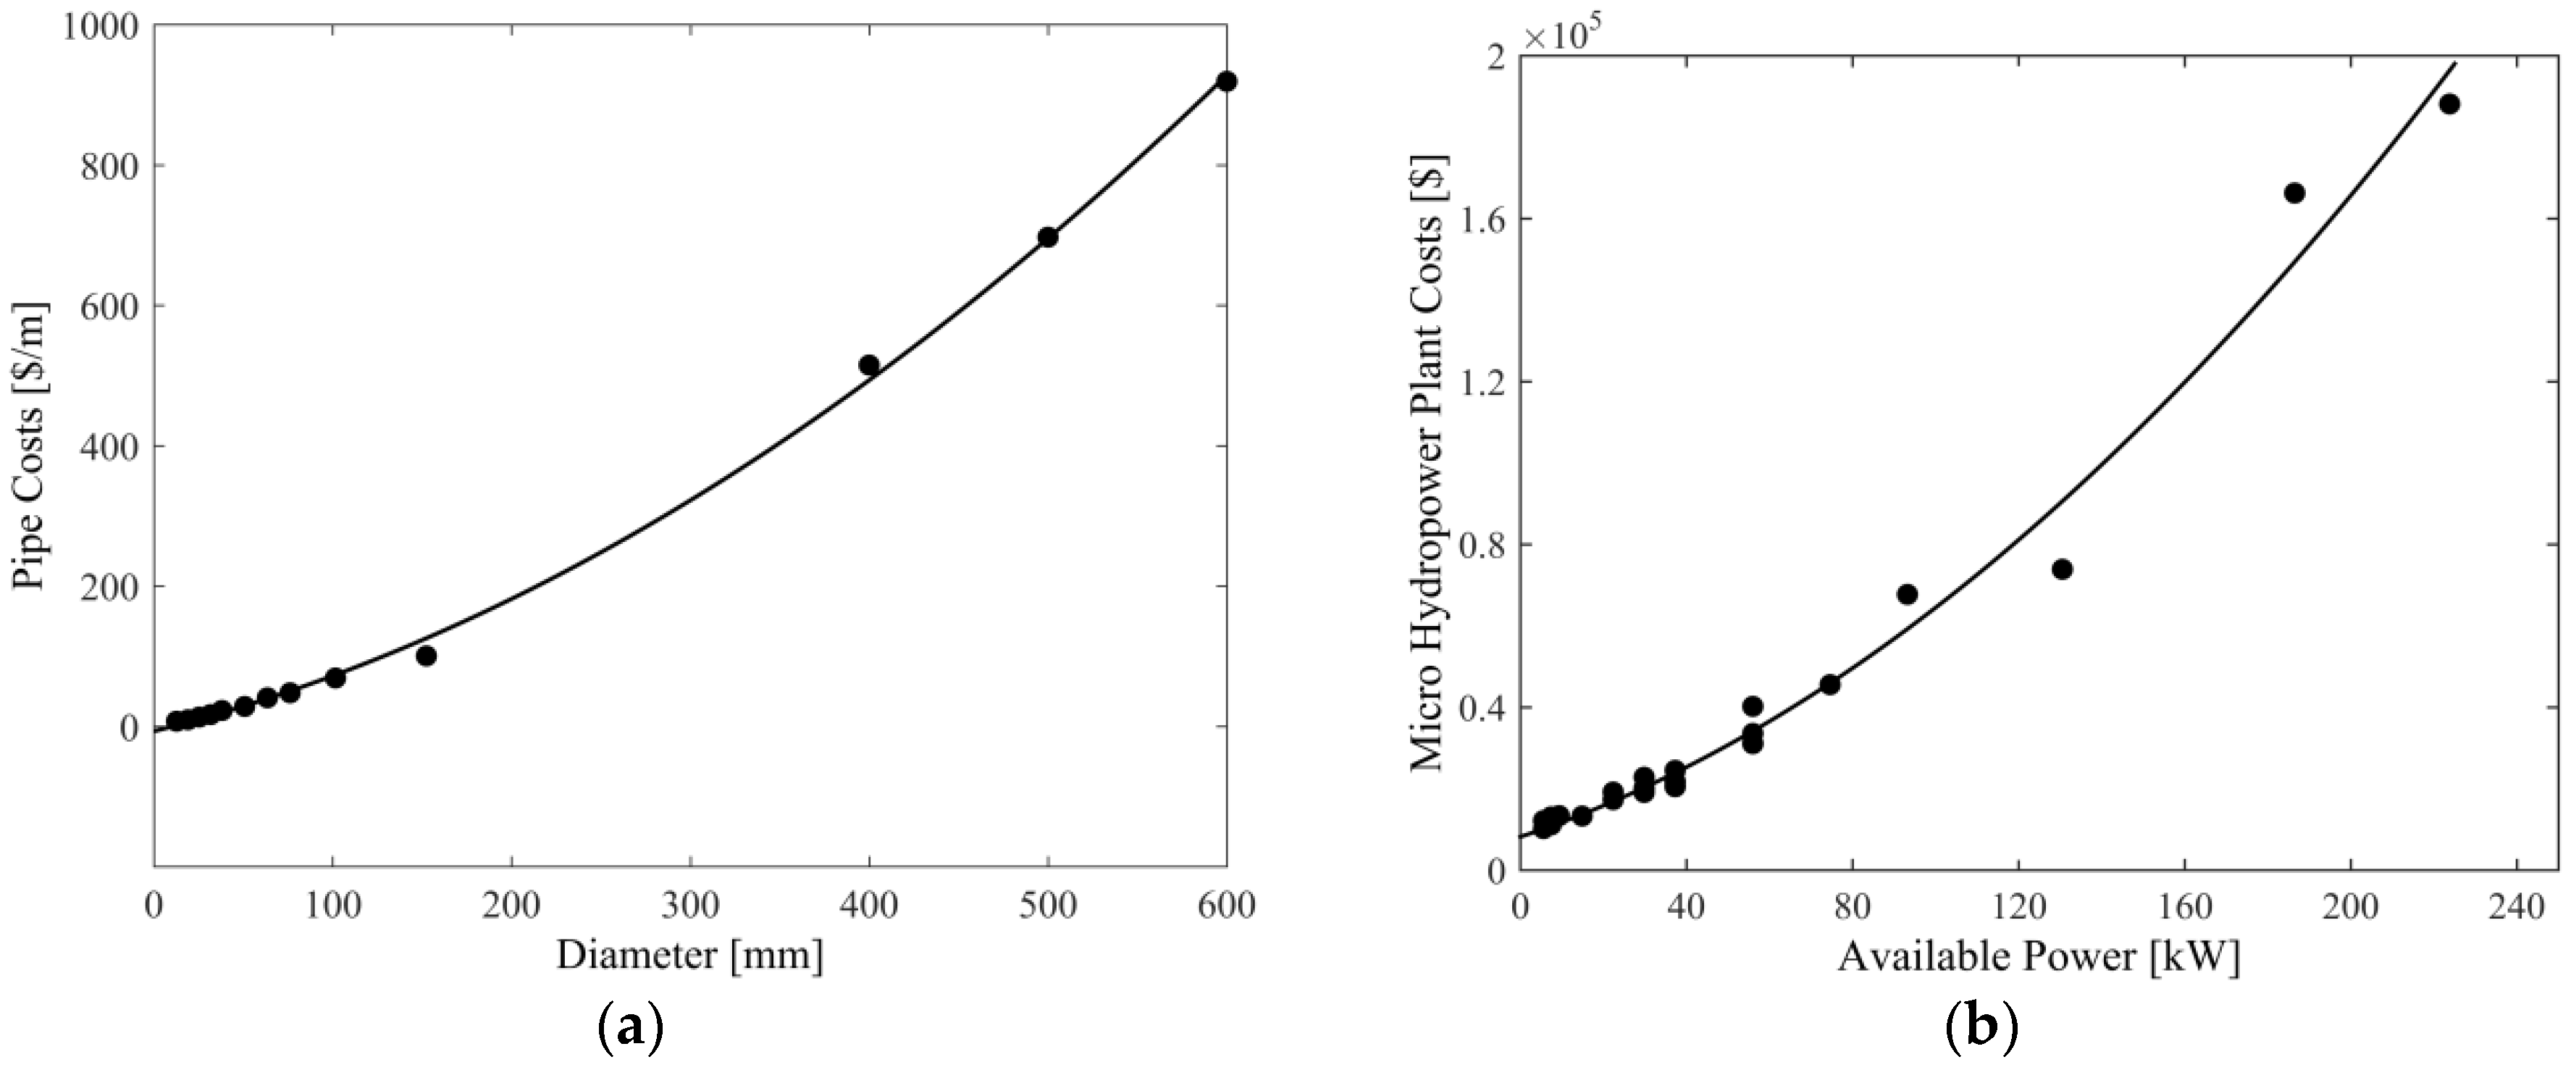
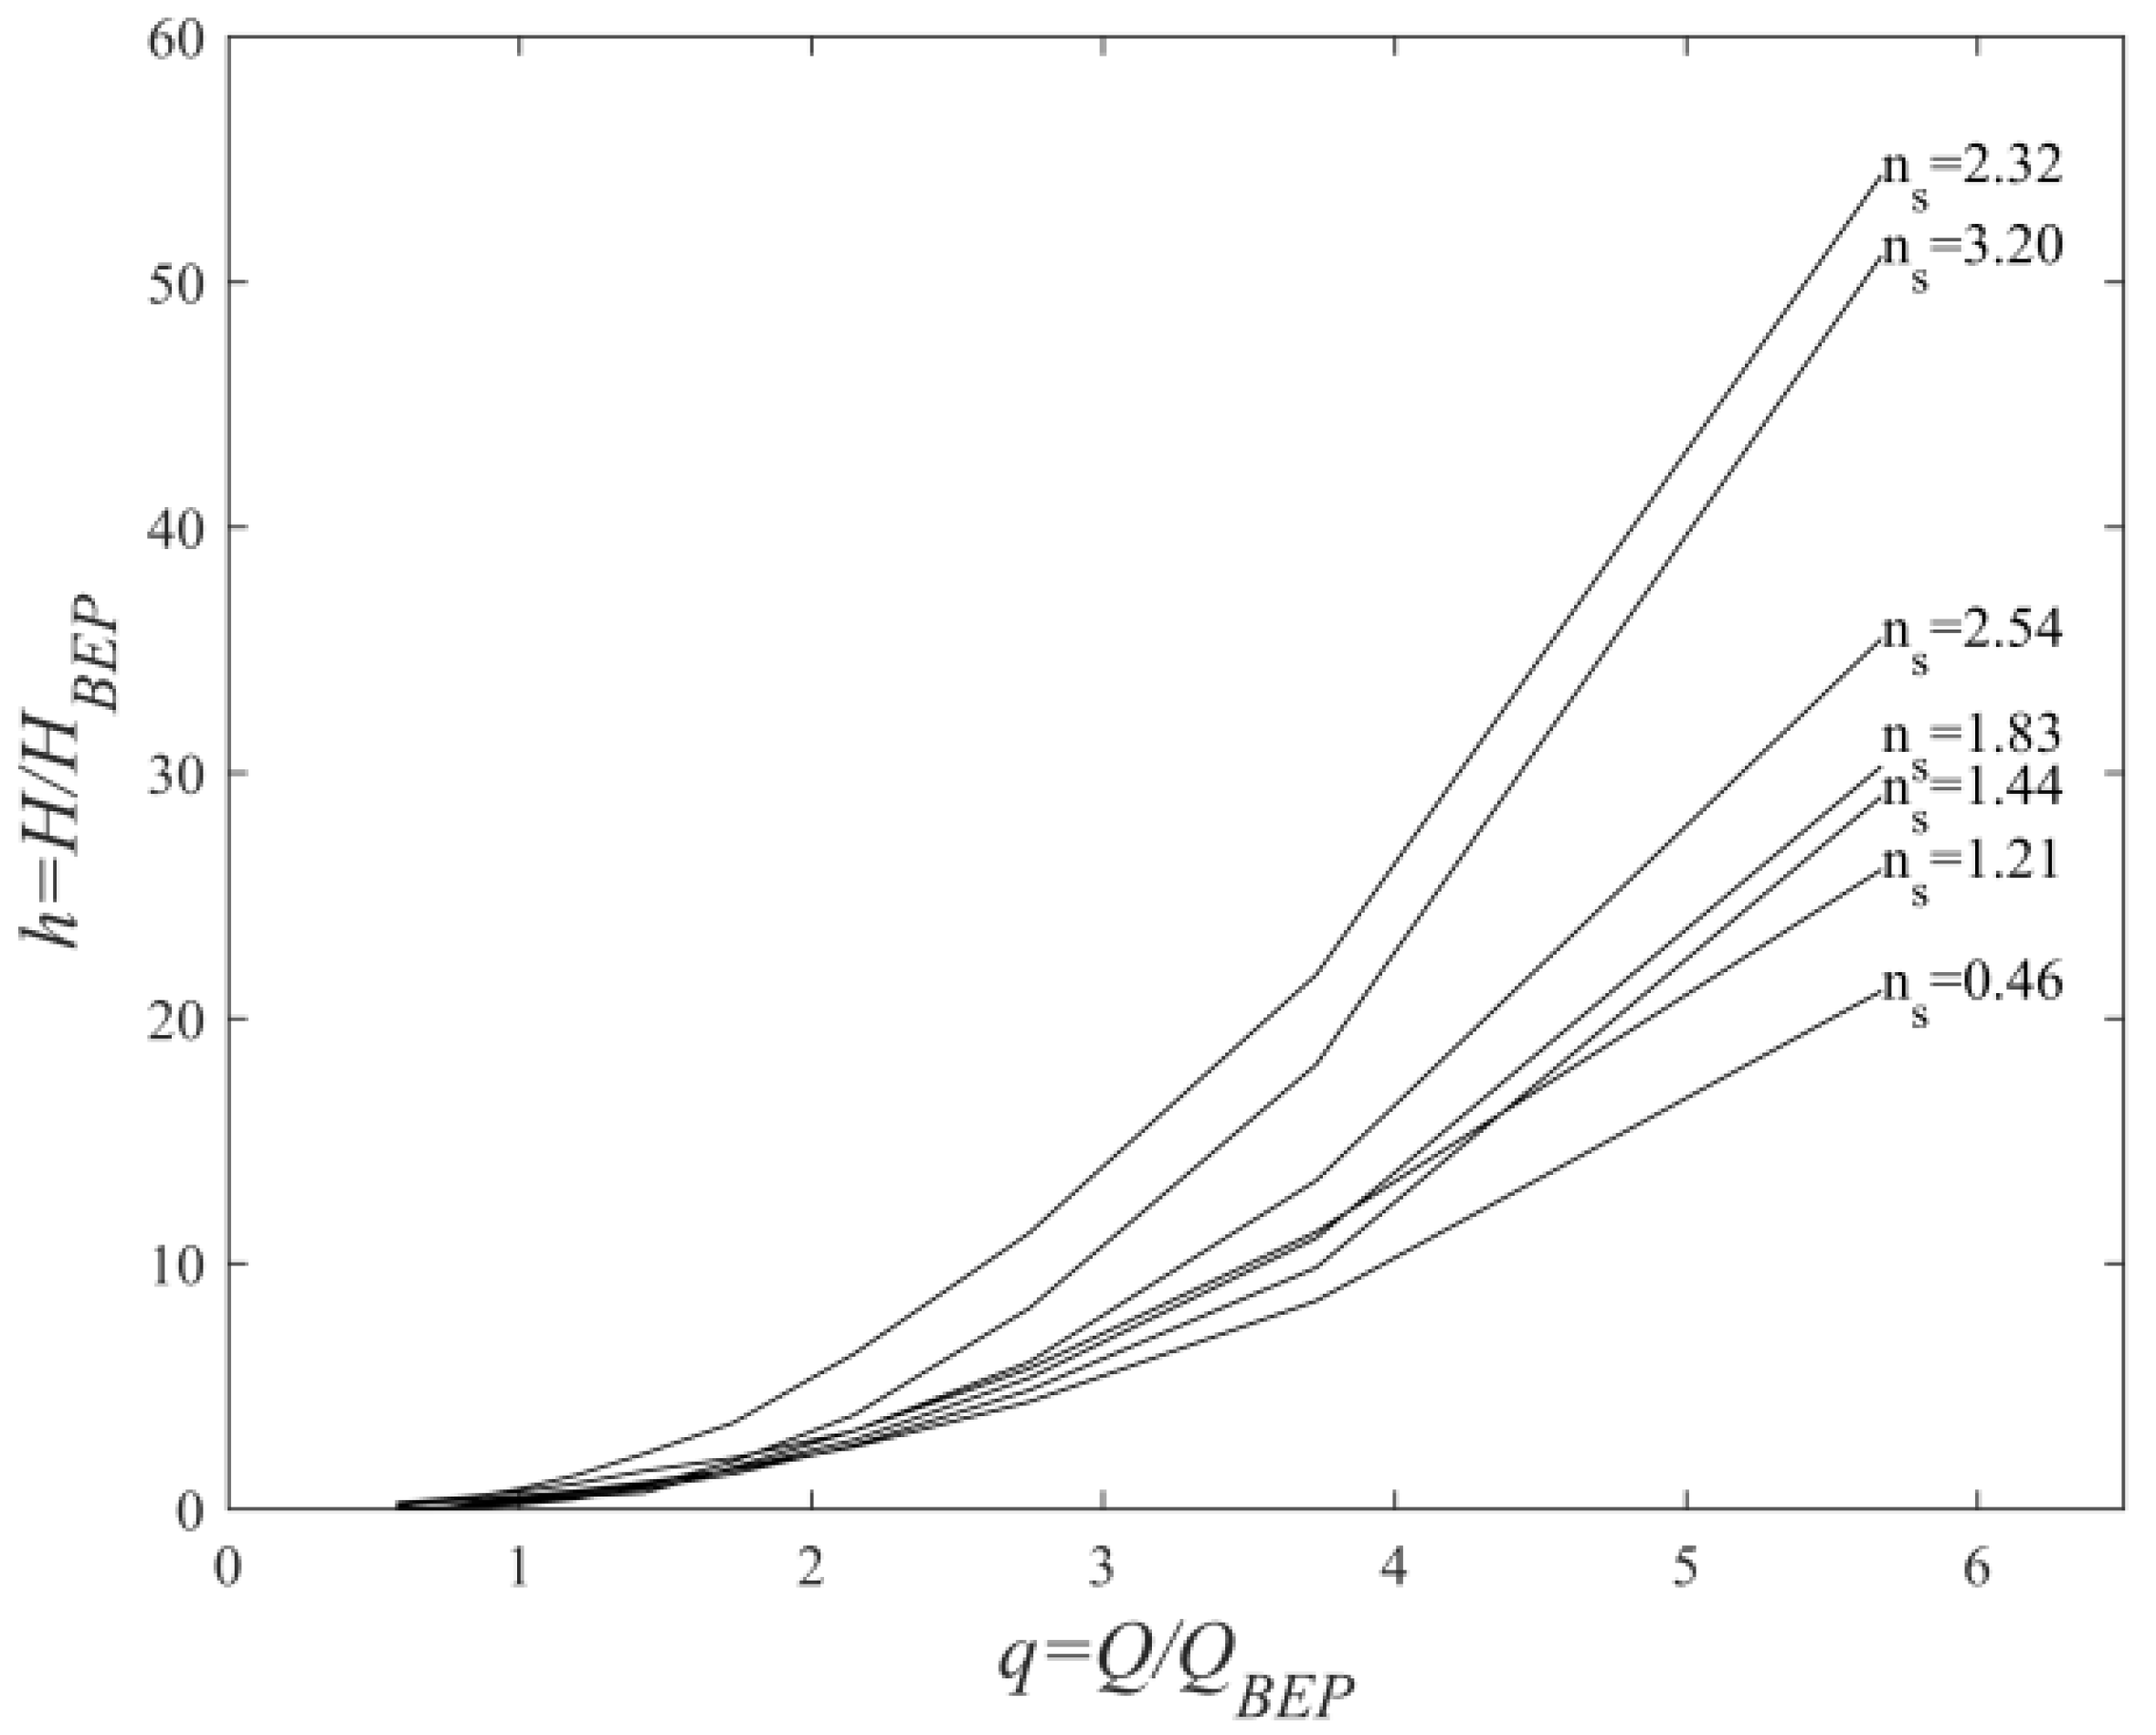
Both costs (of pipes and micro-hydros), which include design, civil works, and electro-mechanical equipment, were obtained from Brazilian companies, for different sizes, as shown in Figure 3. Equations (3) and (4) can be used to calculate pipes and micro-hydro costs, which are valid for 25 to 600 mm and 5 to 224 kW, respectively. Figure 4 shows the dimensionless curves of PATs, where the head, H, and flow, Q, conditions are related to the operation on its Best Efficiency Point (BEP). A set of 14 curves was available inside a specific speed range of 0.46 to 4.94.
Here, is the number of pipes of the TN, is the unitary cost of pipe , the length of pipe , and is the power of the micro hydro.
The benefit that was obtained from the energy recovery during the PAT life span is calculated using the Net Present Value (NPV), as defined in Equation (5).
Here, is the PAT life span, is the water specific mass, is the gravitational acceleration, is the PAT flow during hour of year , is the PAT head during hour of year , the PAT efficiency during hour of year , the energy tariff during hour of year , operation and maintenance costs of year , and is the annual interest rate.
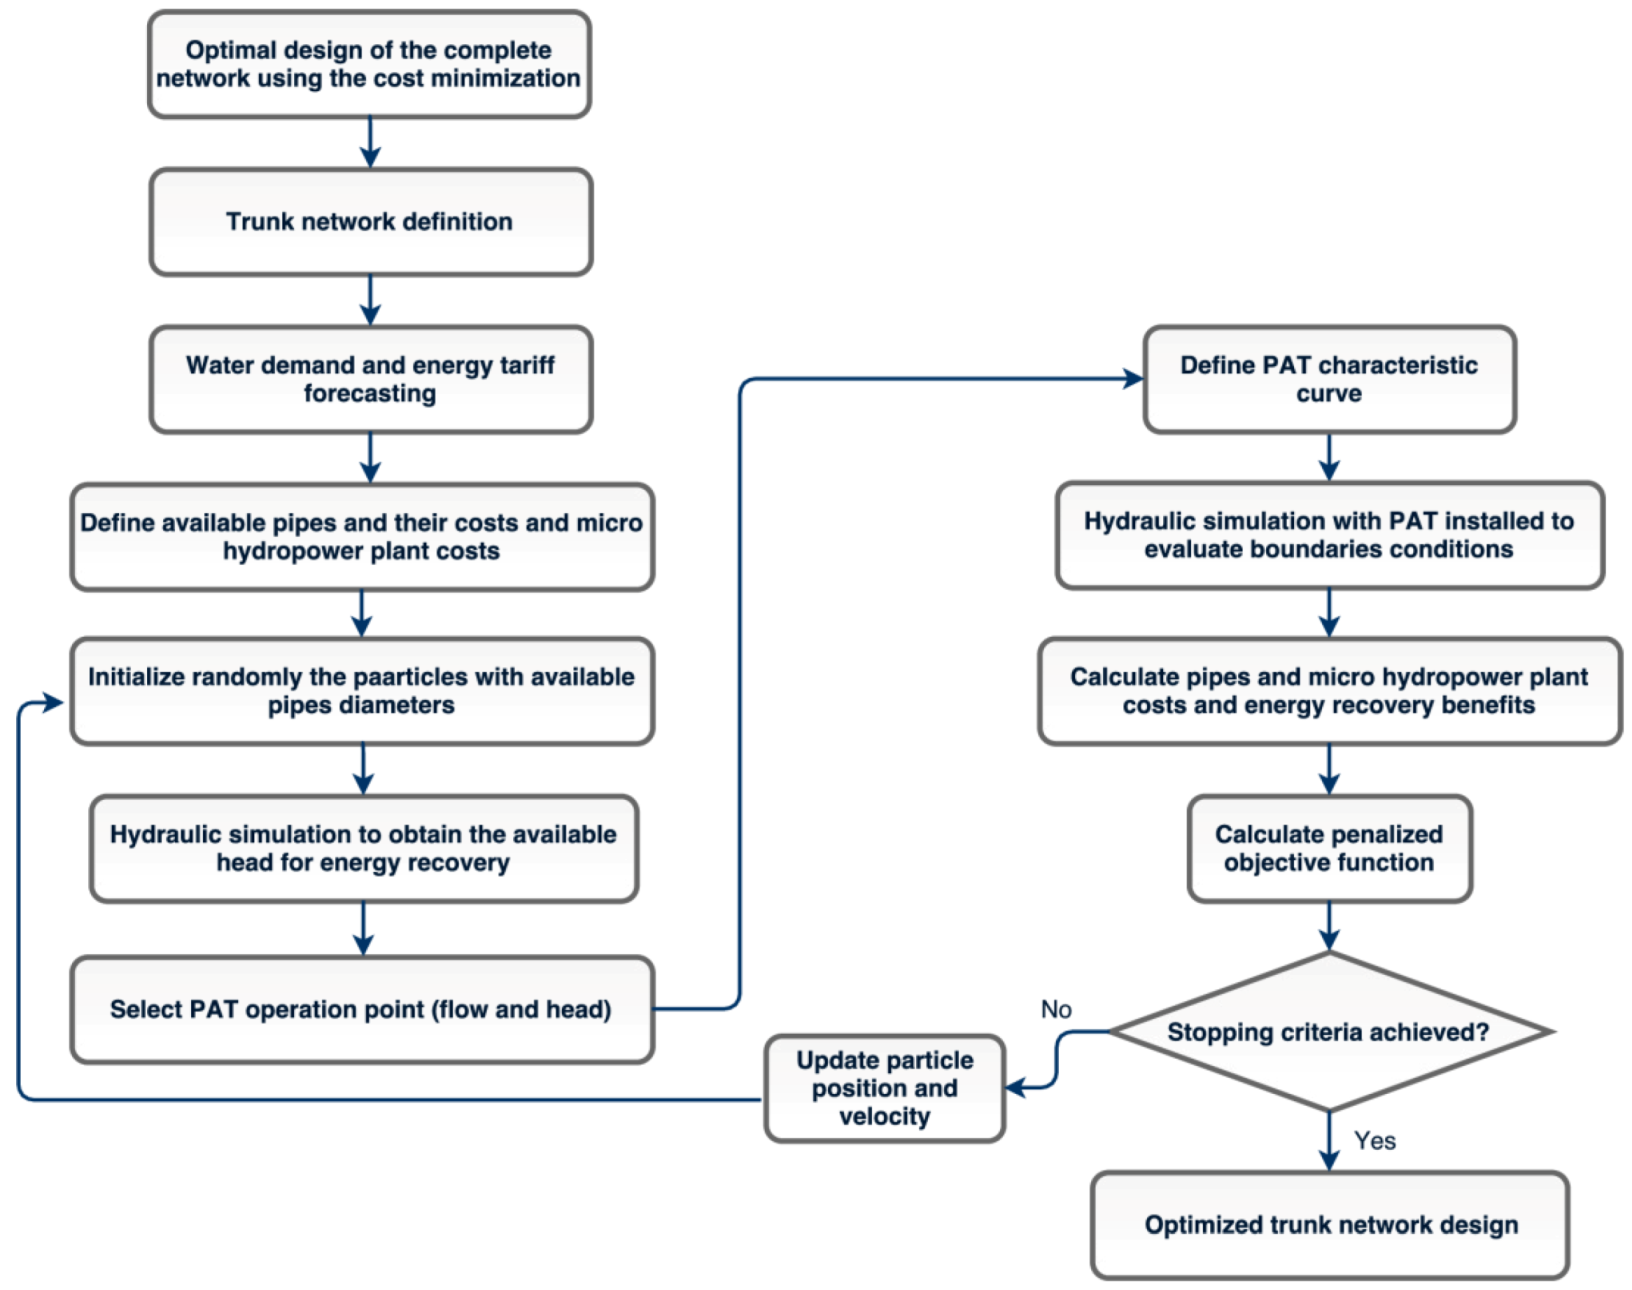
2.4. Optimization and TN Design Procedure
To solve the optimization problem, the PSO technique is used. Developed by [31], it is widely used to solve a variety of problems of water supply systems, such as sectorization [32], PAT selection and location in WDNs [33], and water demand forecasting [34]. Based on group behavior, the technique searches feasible solutions while considering individual and group information. The position of each particle represents a solution. Each particle has a velocity that defines its search direction, and it is calculated through Equation (6), where its best position ever found, , the best position found by the group, , and an inertia factor, , are considered. Two coefficients, and , respectively, defined as cognitive and social coefficients, are dynamically adjusted through iterations to allow for an extensive search in the beginning (higher value of ), and a refined local search at the end (higher value of ). At the end of each iteration, the particle position is updated using Equation (7).
The TN design will follow a three-stage procedure. First, the optimal design of the WDN, when considering the classical approach of minimizing pipes diameters (cost) that guarantee a minimum pressure, will be done. This design will be used as the default operation condition of the network. Then, the TN will be defined using the ASPV weighted by pipes flows. The size of the TN will be defined in a range of 10–100% of the total number of pipes of the network in order to verify the improvement of resilience and energy production with the TN diameter increase. In the last stage, for each scenario, the TN will be designed again as a rehabilitation process, with a pipe cost that is 20% higher to account for replacement difficulty. In this second design stage, in addition to pipe diameters, PAT operation points (head and flow) are also variables to be defined. Variable speed operation is considered with a speed constraint of 60–100% of its nominal value, and a flow constraint up to 50% of its nominal value [18]. As a result, it is expected that the best configuration of pipes and PATs will be found, maximizing the energy production. In all cases, the software EPANET [35] was used to model the network and to simulate the various scenarios to achieve flow and pressure data. Figure 5 summarizes the described TN design procedure, including PAT selection.
3. Results
3.1. Fossolo Network
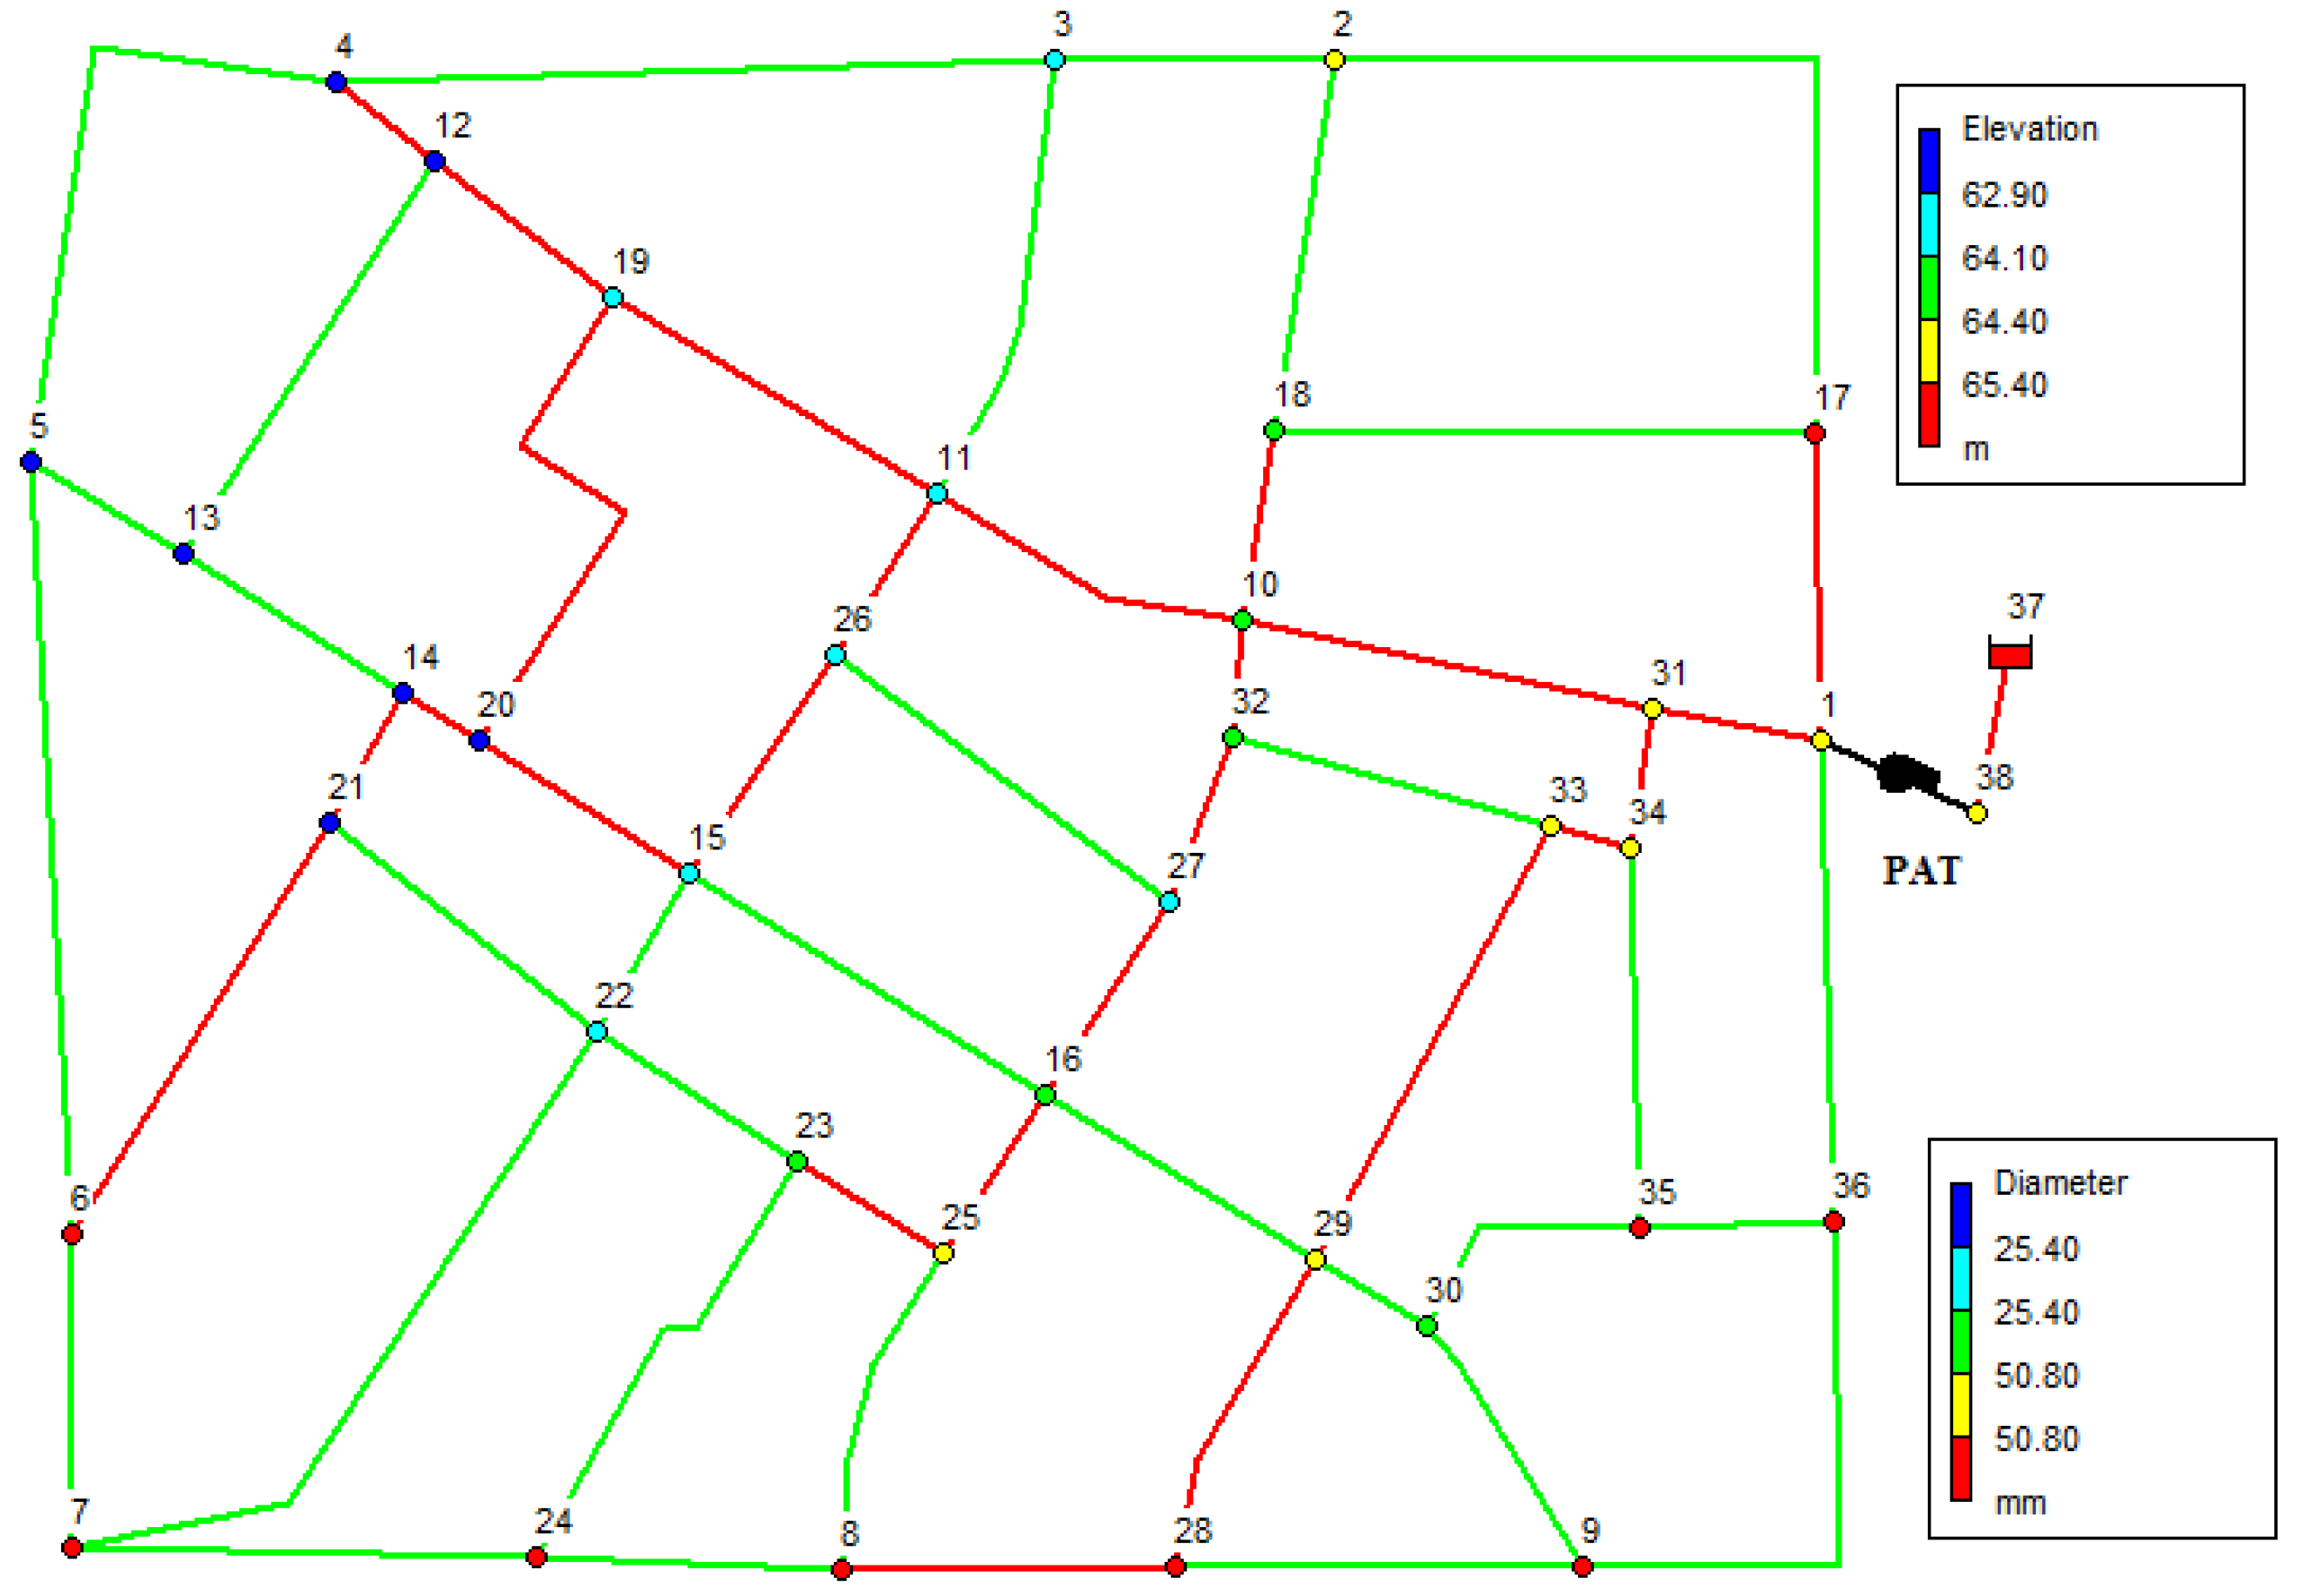
The first case study considers the Fossolo drinking network [25]. It has 58 pipes and 36 consumption nodes with one reservoir for water supply, where a PAT is installed, as shown in Figure 6. A minimum pressure of 10 m is considered for the design, as set by the Brazilian standards [36].
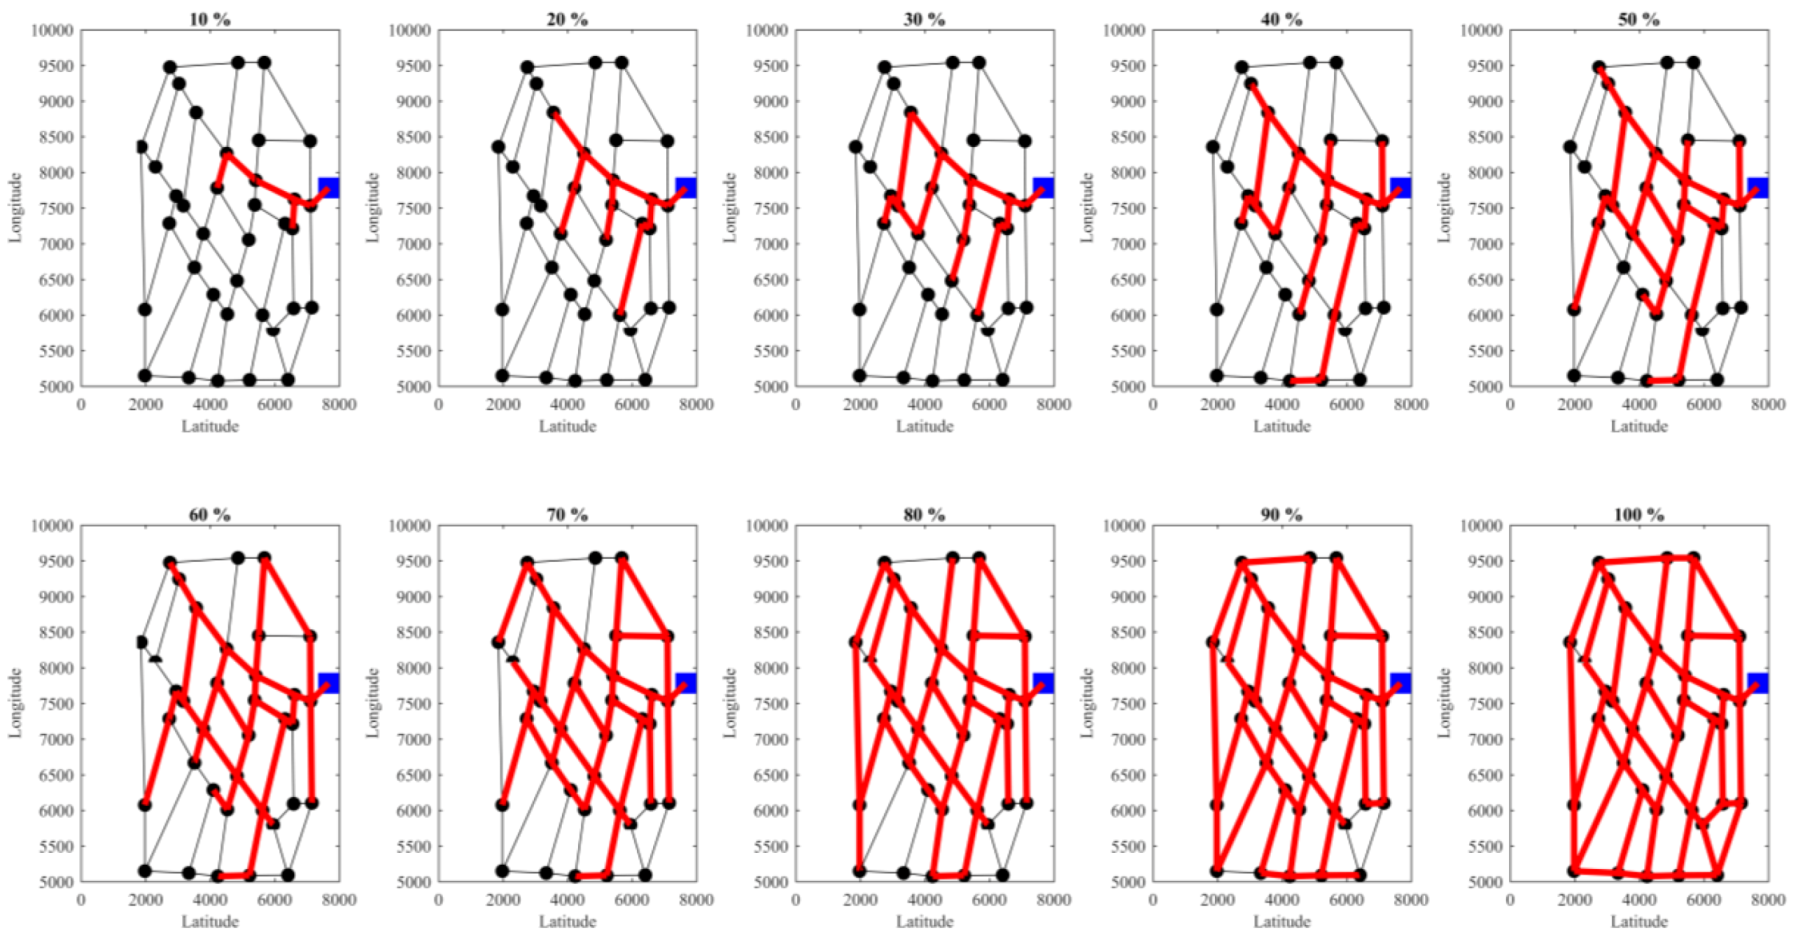
After the initial design, the TN network was obtained, varying its size from 10% to 100% of the pipes of the network. This procedure was adopted to identify the saturation in resilience and the energy recovery improvement, according to the increase of the TN size. Ten scenarios were explored, as shown in Figure 7, where the red lines represent the TN and blue squares the water source.
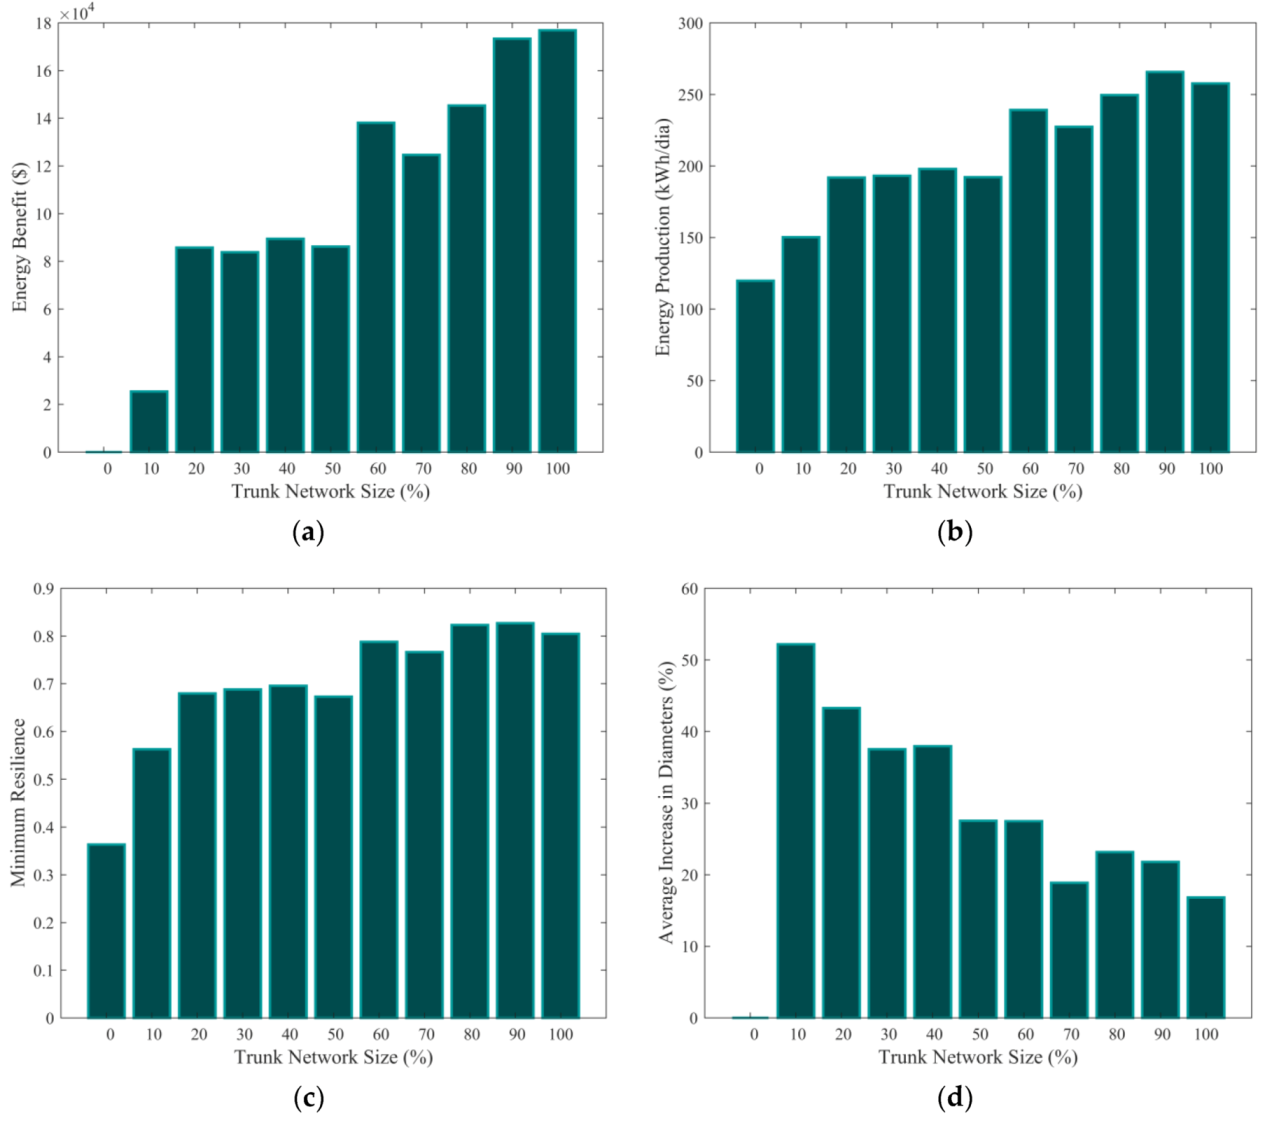
For each scenario, the TN is designed again jointly with the PAT selection. The obtained results are shown in Figure 8. It is noticeable that for a TN with 20% of the pipes, both energy production and resilience significantly increase when compared to the initial scenario. These parameters remain approximately constant up to a TN size of 60%, when benefits that were obtained from energy production rise again. This occurs due to the presence of highly elevated nodes, which are located far from the reservoir, and with significant demands. The TN has to be overlong to reach these points. As an alternative, isolated pipes could be enforced separately from a smaller TN. Figure 8d shows the importance of the TN. With small sizes, the increment in diameter is higher, since only important pipes are considered in the design. When the size of the TN increases, less relevant pipes are considered in the design process, and a change in their diameter is irrelevant for the pressure of the network. The results show that approximately three levels of benefit can be distinguished, where additional increments are not important: low (TN with size below 10%), medium (TN with size from 20% to 50%), and high (TN with size above 50%) levels.
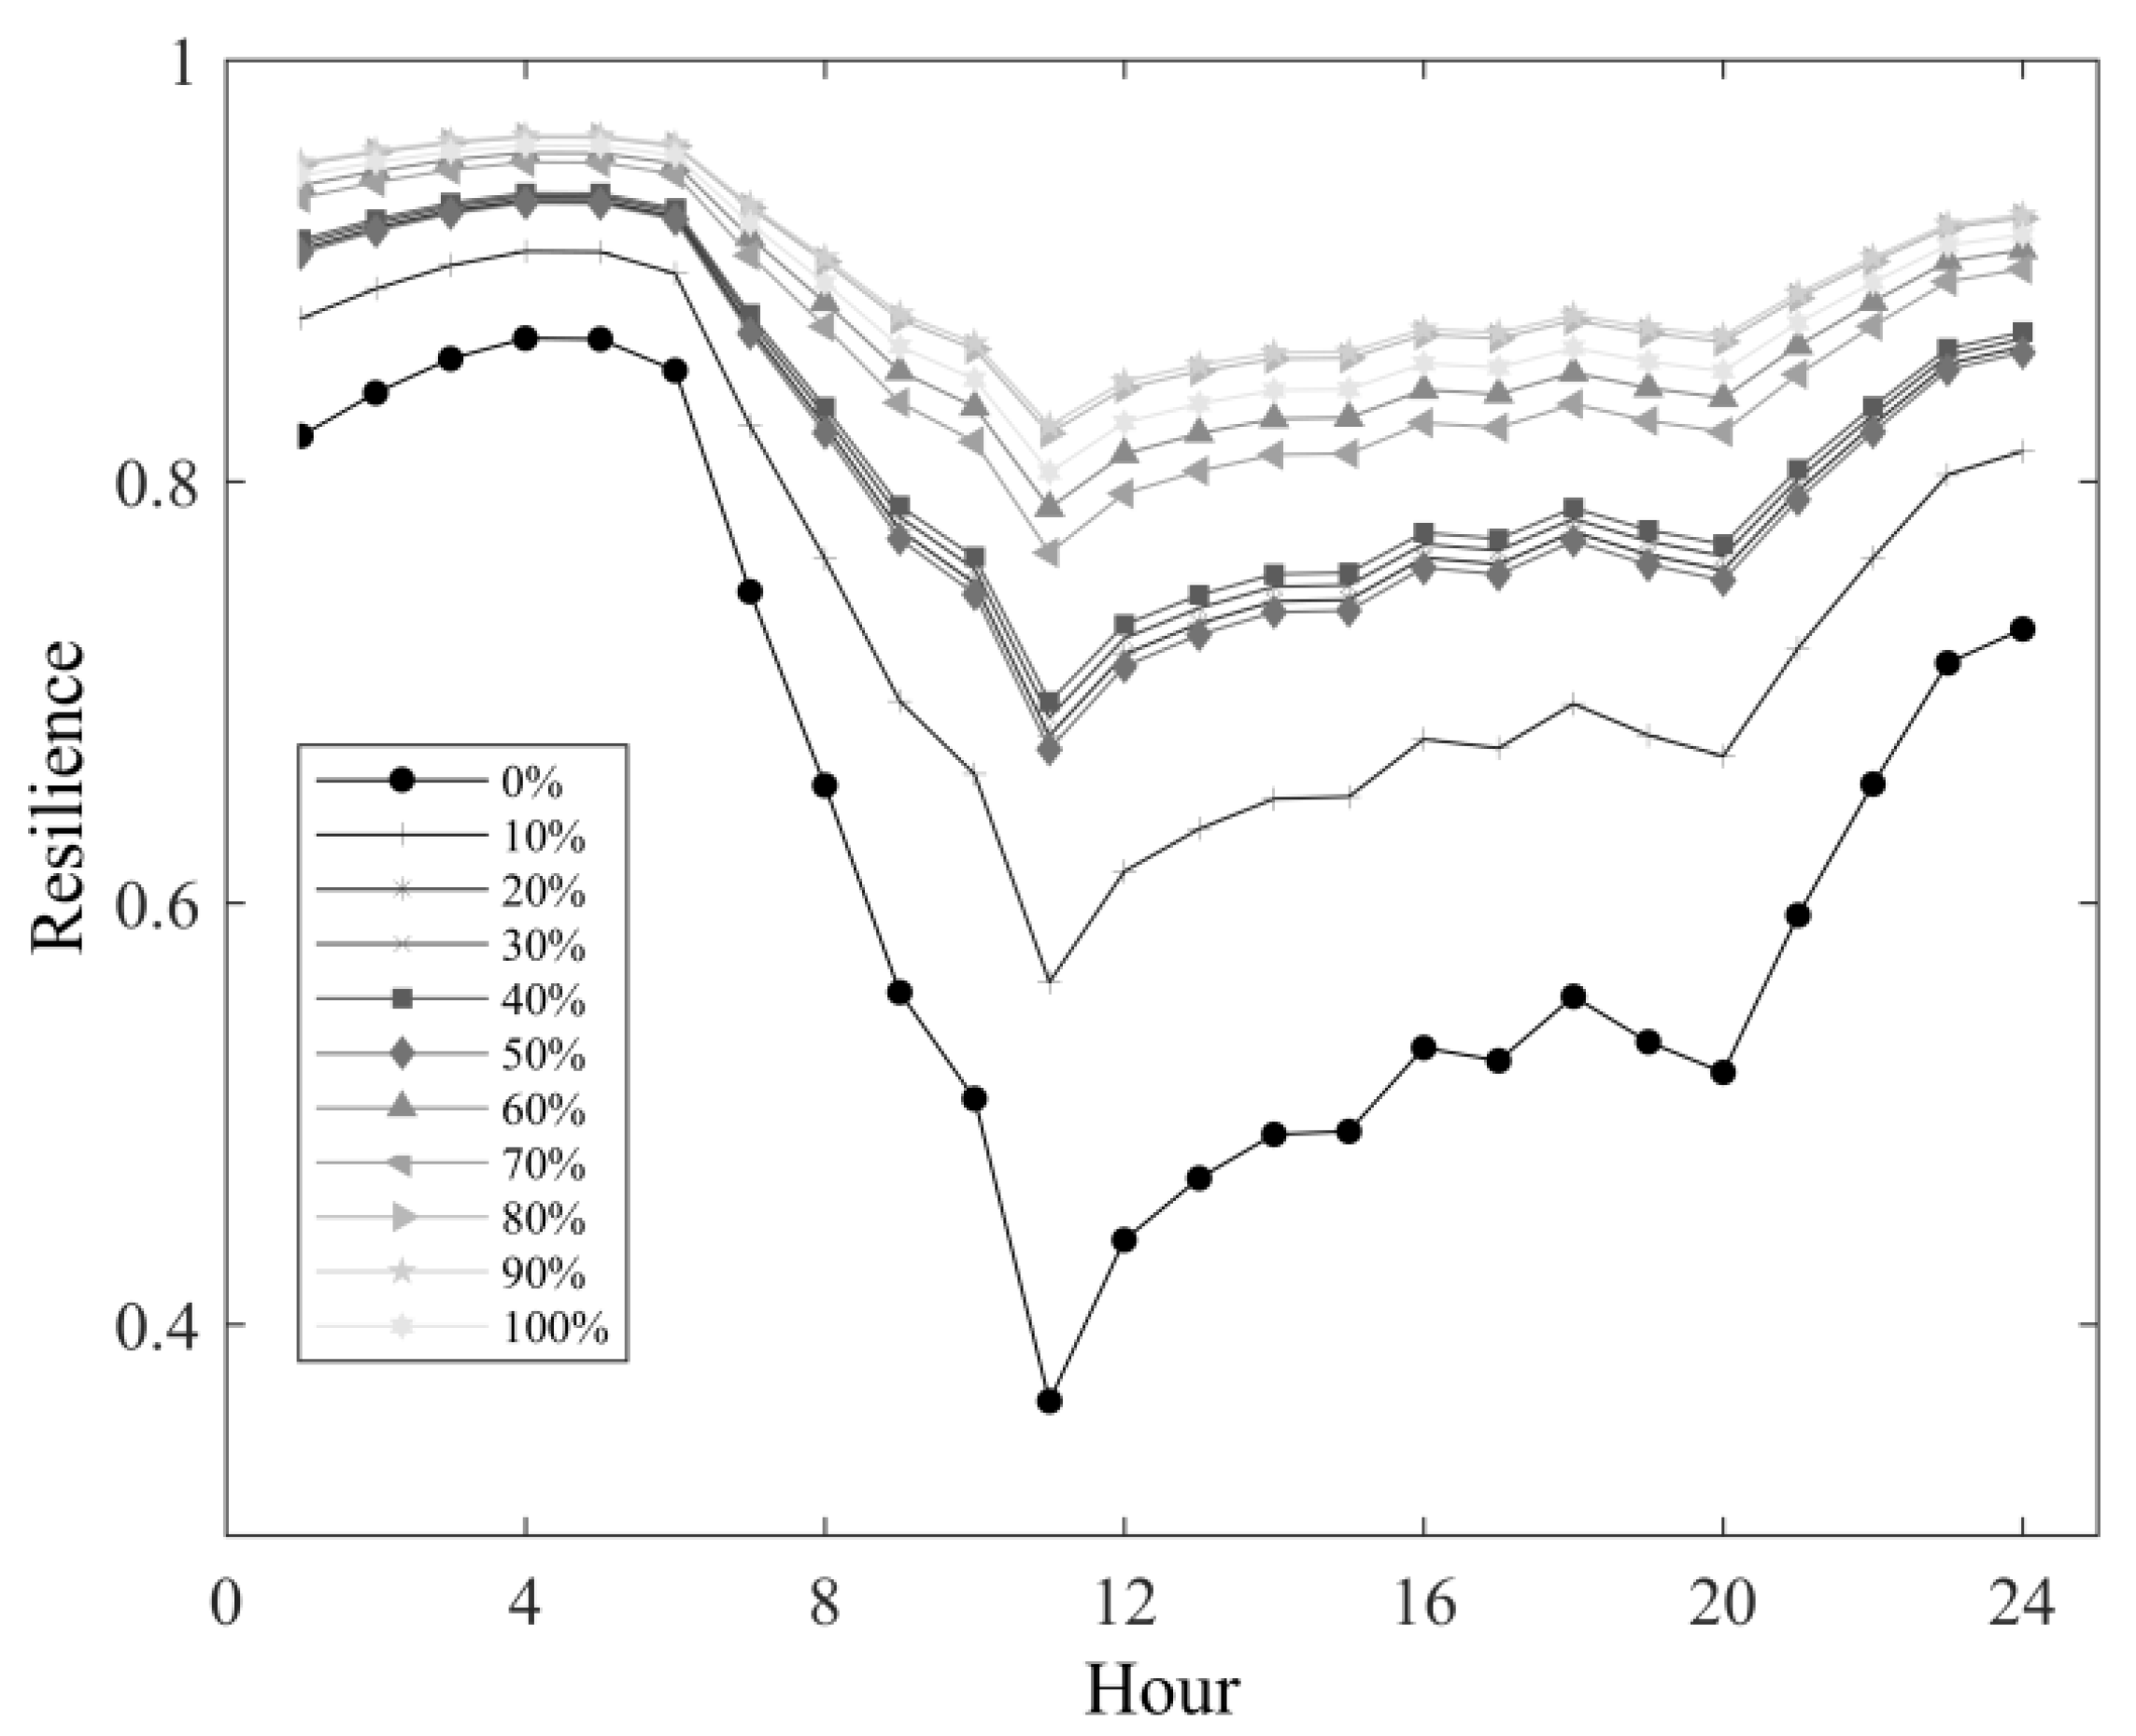
Another interesting feature to be observed is the behavior of resilience during a 24 h period, as shown in Figure 9. It is observed that even with demand variations, the amplitude of resilience is significantly reduced for TNs with sizes over 20%. Therefore, the reliability of the network is greatly improved, and, even in emergency situations, water supply is not harmed.
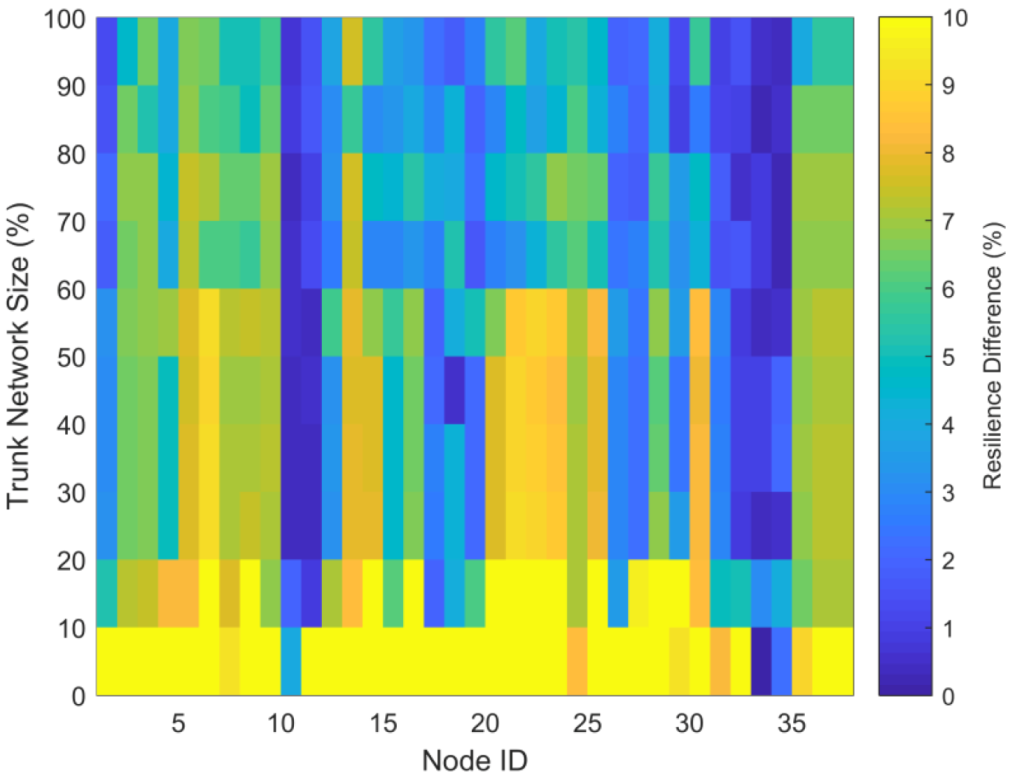
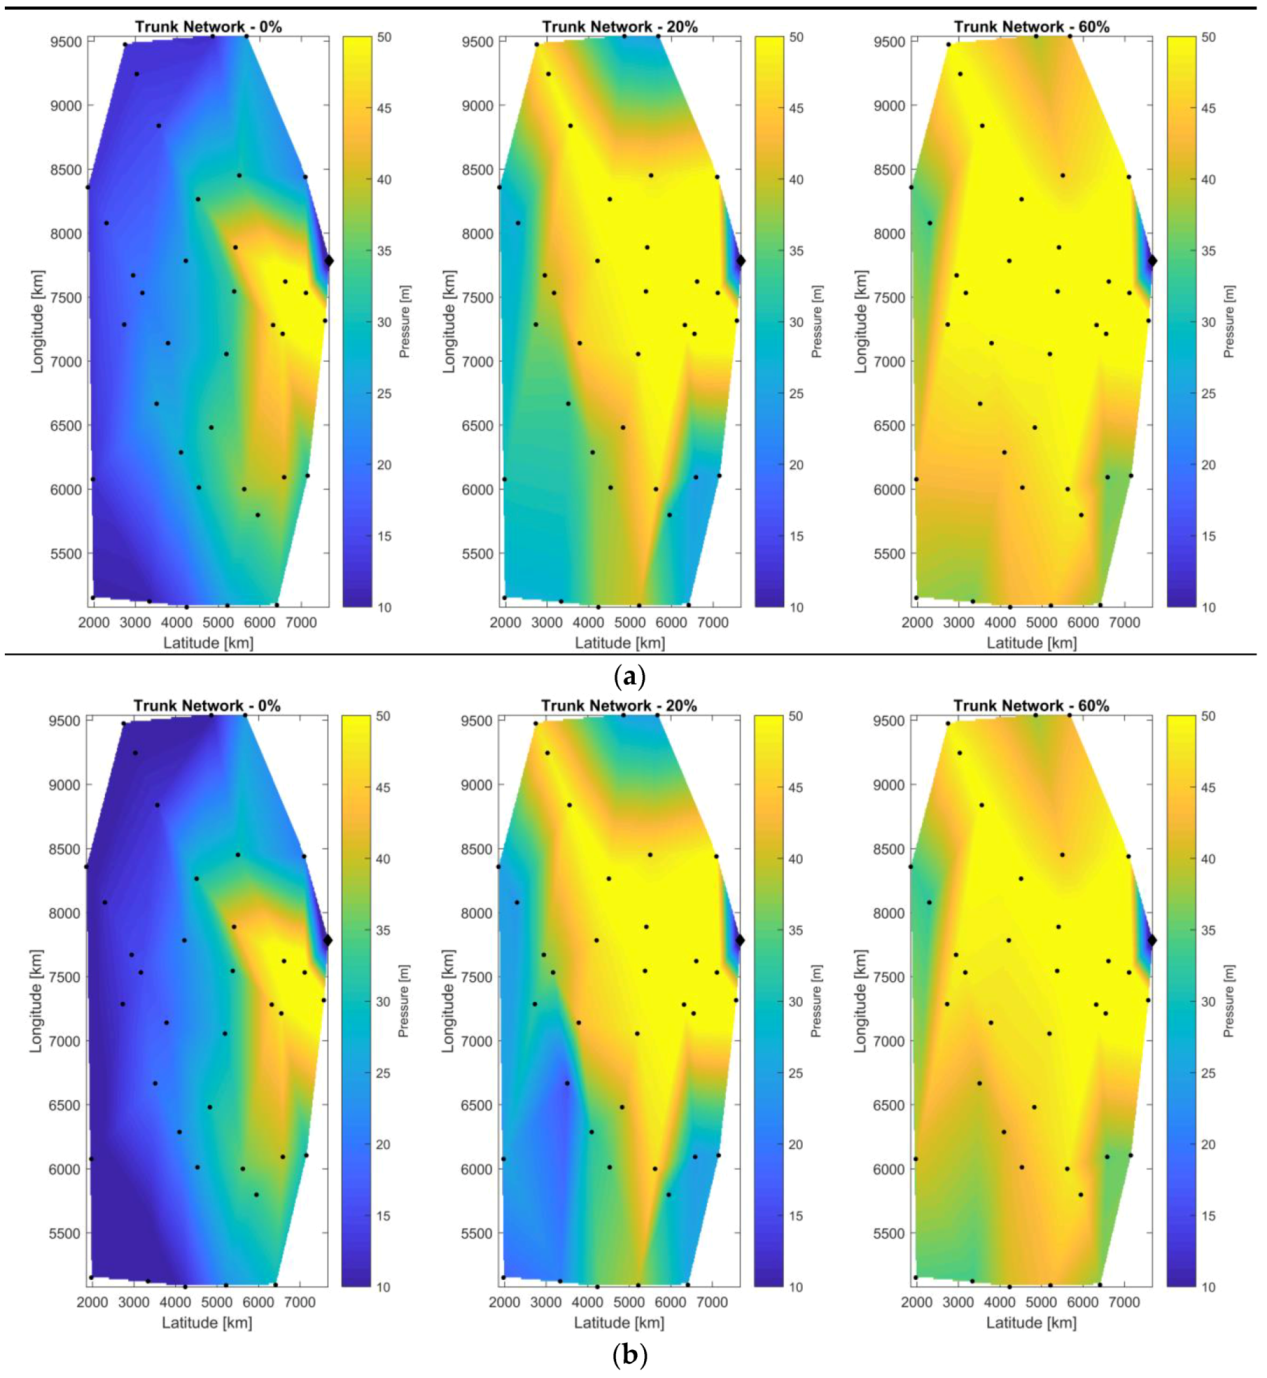
As resilience shows the capacity to meet demands during emergency situations, pipe bursts were simulated. To this end, an emitter coefficient was added to each node to simulate a leak flow that is caused by a pipe burst of 10% of the total inflow. The case of two ruptures occurring at the same time was not simulated. Figure 10 shows the behavior of resilience, according to the size of the TN and the node where the pipe burst occurred. It can be seen that bursts occurring in nodes 20 to 25 are more relevant for system resilience. These nodes are located in a central area of the network, where the TN diameters are gradually reduced, since the flow is also reduced. Thus, an additional flow in this area will significantly increase the headloss of the system. Although pipes that are far from the reservoir have smaller diameters, their flows are very low. So, a demand increase does not increase their headloss too much. On the other hand, pipes close to the reservoir are well sized, and have enough capacity to support an additional demand. Finally, it is noticeable that for TNs above 20% of the pipes, resilience is less affected by a pipe burst. This can be confirmed when comparing Figure 11a, where the pressure zones for the highest consumption period are shown for the initial scenario, and with TNs of 20% and 60% of the pipes with no leakage; and, Figure 11b, where a pipe burst on node 22 occurred. The rehabilitation of the TN significantly increased the pressure in the entire network. In addition, when the pipe burst is simulated, the pressure drop is reduced, and the minimum value of 10 m is maintained, which is not achieved in the standard scenario.
3.2. Balerma Irrigation Network
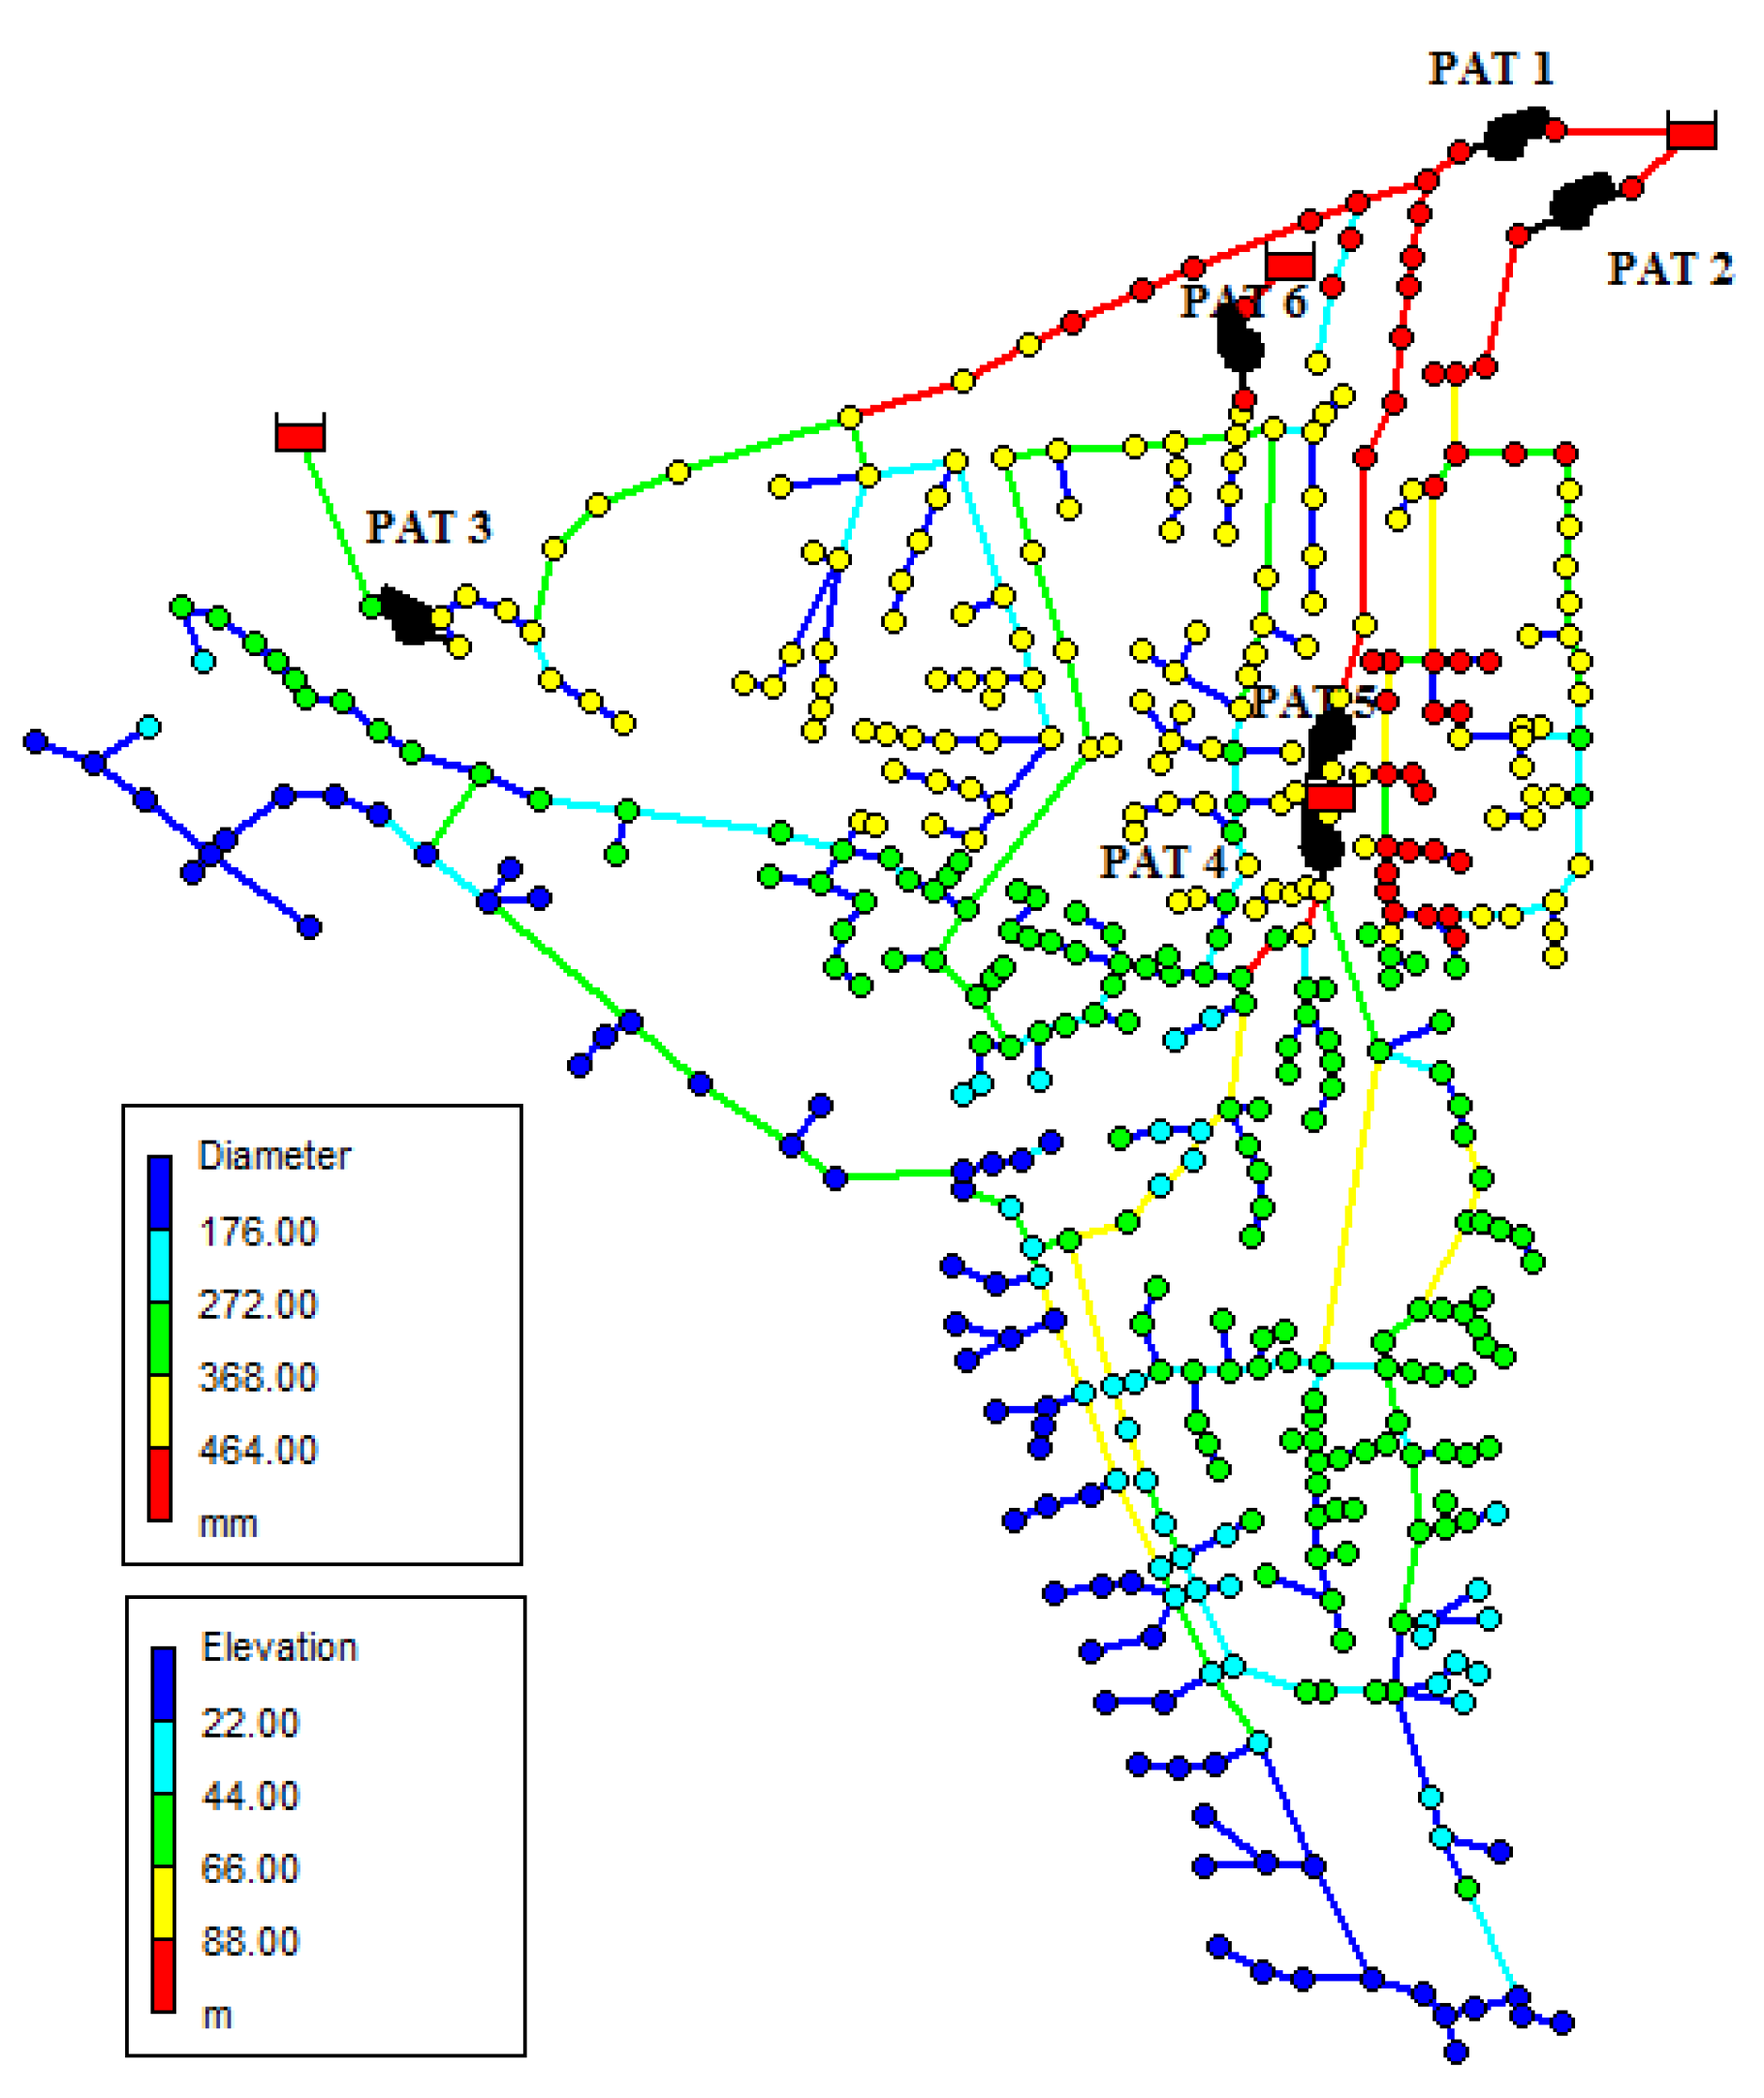
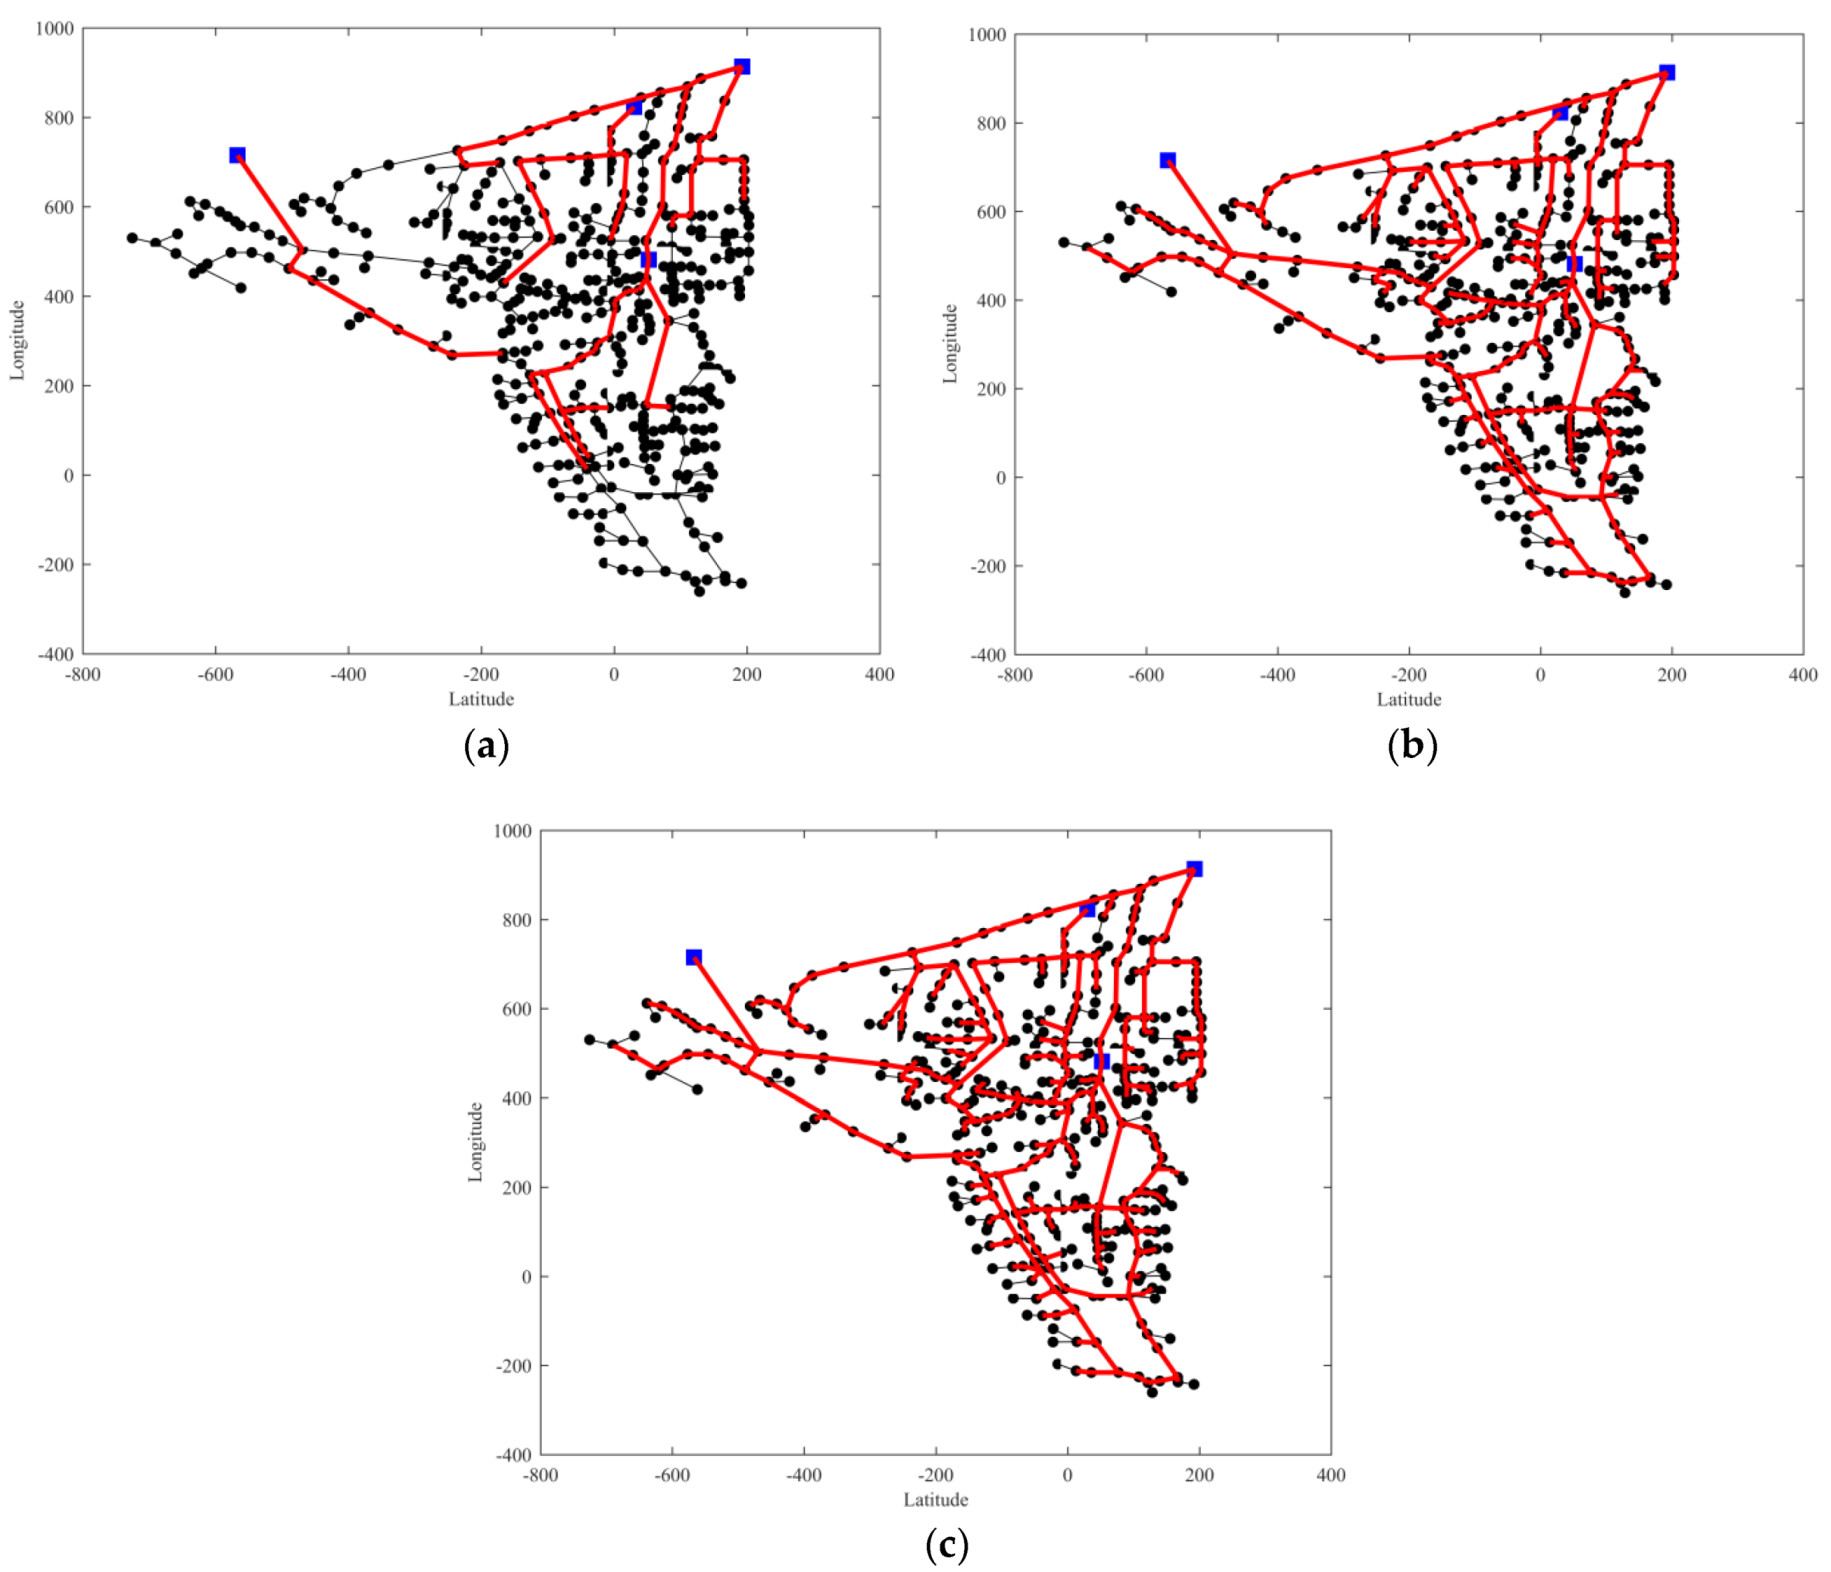
The second case study considers a larger system, the Balerma Irrigation Network [26]. It has 454 pipes and 443 consumption nodes. Four reservoirs supply the system. Therefore, in each of their outlet pipes, a PAT was installed for pressure control and energy recovery, with a total of six machines, as shown in Figure 12. The minimum pressure is also set to 10 m. Based on the results that were obtained in the Fossolo network, three different sizes for the TN were studied: 20%, 60%, and 90% of the total number of pipes, since these were the sizes that exhibited significant parameter improvement. These scenarios are shown in Figure 13, where the red lines represent the TN and the blue squares the water sources.
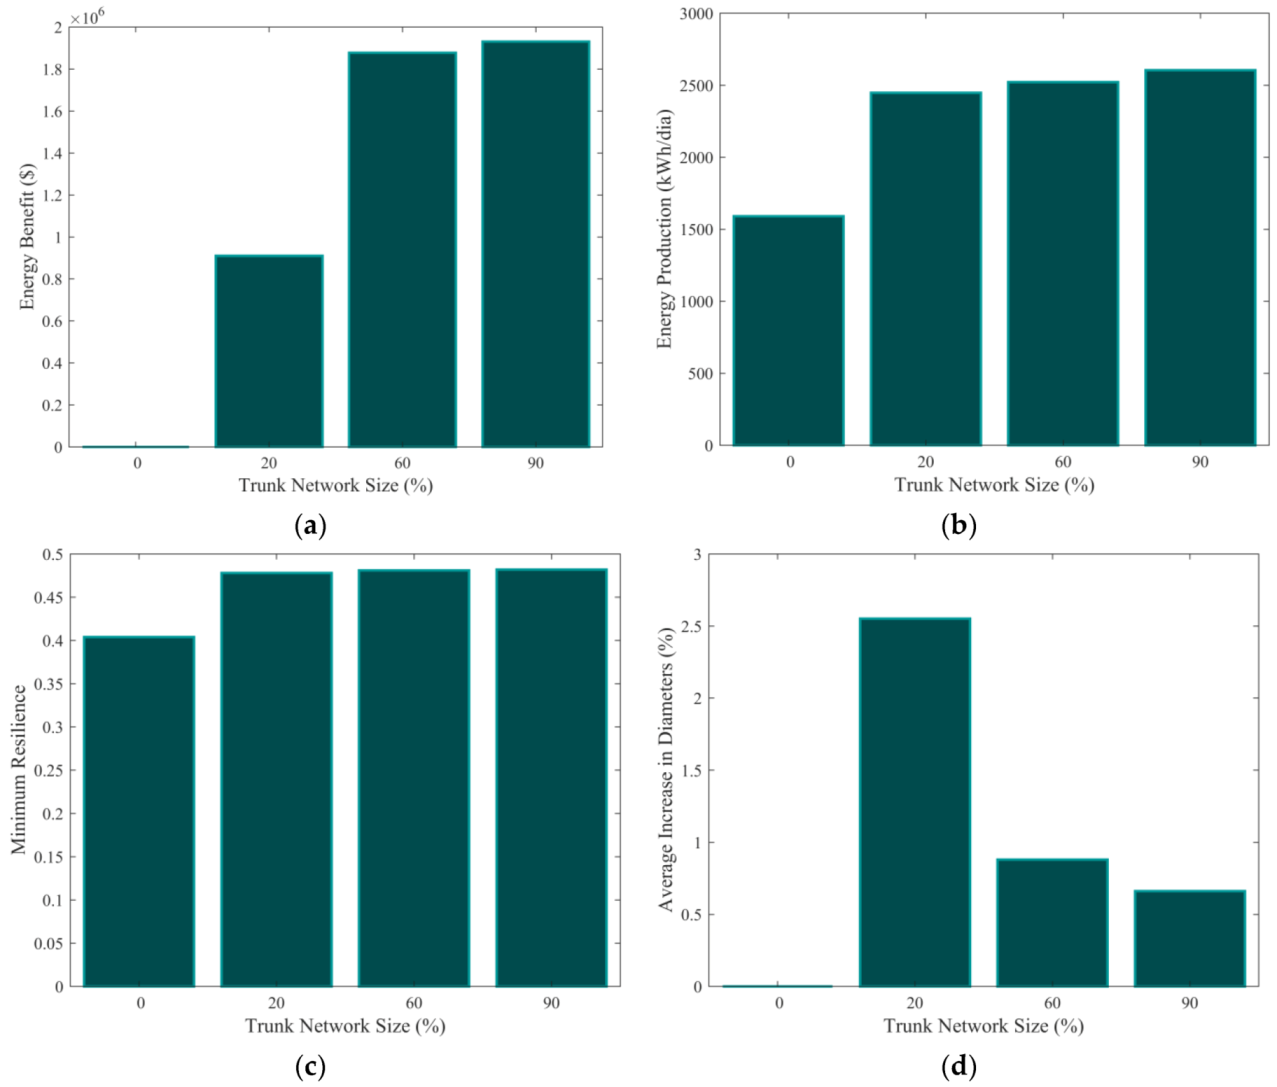
The results that are presented in Figure 14 show that, for the Balerma case, a TN size increase does not significantly improve energy production and resilience. This occurs due to five consumption nodes that are located near PAT #1. Their high elevations limit the head of PATs #1 and #2, which are responsible for the majority of the flow that is supplied. Thus, the energy production is highly affected by this behavior. However, using a TN with a size of 20% of the pipes is economically feasible, and produce a slightly improvement on network resilience (Figure 14c).
4. Conclusions
Pipe cost represents the major component in the design of WDNs. However, for long-term operation, minimum investment in pipes can be economically ineffective, since reinforcements can be necessary to meet growing demands. In addition, a system that is capable of operating only with minimum pressure values is not sufficiently robust to surpass emergency situations, such as pipe bursts or firefighting, causing water shortage in some areas. To avoid this problem, WDN resilience is an important parameter to be considered, since it reflects the network capacity to cope with a variety of events. However, it is hard to quantify its importance, since these emergency situations occur occasionally, and it is up to the managers to choose an adequate solution. The methodology that is proposed in this paper explicitly quantifies the benefit of resilience improvement through an energy recovery possibility, stating its importance as a technical and economical parameter. During normal operation, PATs operate to perform pressure control, while, in emergency scenarios, the flow can be driven through a by-pass to regulate pressure at critical points. For existing networks, rehabilitation only of the TN is an alternative to improve resilience, since TN pipes are the most relevant for the system. The case studies presented show the importance of TNs for resilience. While considering a TN of only 20% of the pipes significantly improved the performance of the system. In addition, the energy recovery produced benefits that surpass the additional investment necessary, thus being an attractive alternative for WDN design. Besides, this procedure can be applied to any WDN operating by gravity, and the benefits obtained will depend on its topography and demand, i.e., the available power for energy recovery. In some cases, this approach can lead to unfeasible conditions due to low power availability, and subjective parameters, such as the supply security, have to be considered to value the resilience.
Author Contributions
Conceptualization, G.M., B.B. and E.L.Jr.; Software, G.M.; Investigation, G.M., B.B., E.L.Jr., H.R., J.I.; Writing-Original Draft Preparation, G.M., B.B., E.L.Jr., H.R., J.I.
Acknowledgments
The authors wish to thank the project REDAWN (Reducing Energy Dependency in Atlantic Area Water Networks) EAPA_198/2016 from INTERREG ATLANTIC AREA PROGRAMME 2014–2020.
Conflicts of Interest
The authors declare no conflict of interest.
References
- Geem, Z.W.; Kim, J.H.; Loganathan, G.V. A New Heuristic Optimization Algorithm: Harmony Search. Simulation 2001, 76, 60–68. [Google Scholar] [CrossRef]
- Maier, H.R.; Simpson, A.R.; Zecchin, A.C.; Foong, W.K.; Phang, K.Y.; Seah, H.Y.; Tan, C.L. Ant colony optimization for design of water distribution systems. J. Water Res. Plan. Manag. 2003, 139, 200–209. [Google Scholar] [CrossRef]
- Suribabu, C.R.; Neelakantan, T.R. Design of water distribution networks using particle swarm optimization. Urban Water J. 2006, 3, 111–120. [Google Scholar] [CrossRef]
- Baños, R.; Reca, J.; Martínez, J.; Gil, C.; Márquez, A.L. Resilience indexes for water distribution network design: A performance analysis under demand uncertainty. Water Res. Manag. 2011, 25, 2351–2366. [Google Scholar] [CrossRef]
- Shokoohi, M.; Tabesh, M.; Nazif, S.; Dini, M. Water quality based multi-objective optimal design of water distribution systems. Water Res. Manag. 2017, 31, 93–108. [Google Scholar] [CrossRef]
- Marques, J.; Cunha, M.; Savić, D. Using real options in the optimal design of water distribution networks. J. Water Res. Plan. Manag. 2014, 141, 1–10. [Google Scholar] [CrossRef]
- Schwartz, R.; Housh, M.; Ostfeld, A. Least-Cost Robust Design Optimization of Water Distribution Systems under Multiple Loading. J. Water Res. Plan. Manag. 2016, 142. [Google Scholar] [CrossRef]
- Giustolisi, O.; Laucelli, D.; Colombo, A.F. Deterministic versus stochastic design of water distribution networks. J. Water Res. Plan. Manag. 2009, 135, 117–127. [Google Scholar] [CrossRef]
- Lansey, K.E.; Duan, N.; Mays, L.W.; Tung, Y.K. Water distribution system design under uncertainties. J. Water Res. Plan. Manag. 1989, 115, 630–645. [Google Scholar] [CrossRef]
- Zheng, F.; Simpson, A.; Zecchin, A. Improving the efficiency of multi-objective evolutionary algorithms through decomposition: An application to water distribution network design. Environ. Model. Softw. 2015, 69, 240–252. [Google Scholar] [CrossRef]
- Geem, Z.W. Multiobjective optimization of water distribution networks using fuzzy theory and harmony search. Water 2015, 7, 3613–3625. [Google Scholar] [CrossRef]
- Prasad, T.D.; Park, N.S. Multiobjective genetic algorithms for design of water distribution networks. J. Water Res. Plan. Manag. 2004, 130, 73–82. [Google Scholar] [CrossRef]
- Ramos, H.M.; Borga, A.; Simão, M. New design solutions for low-power energy production in water pipe systems. Water Sci. Eng. 2009, 2, 69–84. [Google Scholar]
- Carravetta, A.; Houreh, S.D.; Ramos, H.M. Pumps as Turbines: Fundamentals and Applications, 1st ed.; Springer: Cham, Switzerland, 2017. [Google Scholar]
- Pérez-Sánchez, M.; Sánchez-Romero, F.J.; Ramos, H.M.; López-Jiménez, P.A. Energy recovery in existing water networks: Towards greater sustainability. Water 2017, 9, 97. [Google Scholar] [CrossRef]
- De Marchis, M.; Freni, G. Pump as turbine implementation in a dynamic numerical model: cost analysis for energy recovery in water distribution network. J. Hydroinform. 2015, 17, 347–360. [Google Scholar] [CrossRef]
- Carravetta, A.; del Giudice, G.; Fecarotta, O.; Ramos, H.M. PAT design strategy for energy recovery in water distribution networks by electrical regulation. Energies 2013, 6, 411–424. [Google Scholar] [CrossRef]
- Meirelles, G., Jr.; Luvizotto, E.; Brentan, B.M.; Ramos, H.M. Leakage Control and Energy Recovery Using Variable Speed Pumps as Turbines. J. Water Res. Plan. Manag. 2017, 144. [Google Scholar] [CrossRef]
- Carravetta, A.; Del Giudice, G.; Fecarotta, O.; Ramos, H.M. Energy production in water distribution networks: A PAT design strategy. Water Res. Manag. 2012, 26, 3947–3959. [Google Scholar] [CrossRef]
- Lydon, T.; Coughlan, P.; McNabola, A. Pump-as-turbine: Characterization as an energy recovery device for the water distribution network. J. Hydraul. Eng. 2017, 143. [Google Scholar] [CrossRef]
- Afshar, A.; Jemaa, F.B.; Marino, M.A. Optimization of hydropower plant integration in water supply system. J. Water Res. Plan. Manag. 1990, 116, 665–675. [Google Scholar] [CrossRef]
- Meirelles, G.; Brentan, B.M., Jr.; Luvizotto, E. Optimal design of water supply networks using an energy recovery approach. Renew. Energy 2018, 117, 404–413. [Google Scholar] [CrossRef]
- Campbell, E.; Izquierdo, J.; Montalvo, I.; Ilaya-Ayza, A.; Pérez-García, R.; Tavera, M. A flexible methodology to sectorize water supply networks based on social network theory concepts and multi-objective optimization. J. Hydroinform. 2016, 18, 62–76. [Google Scholar] [CrossRef]
- Di Nardo, A.; Di Natale, M.; Giudicianni, C.; Greco, R.; Santonastaso, G.F. Complex network and fractal theory for the assessment of water distribution network resilience to pipe failures. Water Sci. Technol. Water Supply 2018, 18, 767–777. [Google Scholar] [CrossRef]
- Bragalli, C.; D'Ambrosio, C.; Lee, J.; Lodi, A.; Toth, P. On the optimal design of water distribution networks: A practical MINLP approach. Optim. Eng. 2012, 13, 219–246. [Google Scholar] [CrossRef]
- Reca, J.; Martínez, J. Genetic algorithms for the design of looped irrigation water distribution networks. Water Resour. Res. 2006, 42, 1–9. [Google Scholar] [CrossRef]
- Di Nardo, A.; Di Natale, M.; Santonastaso, G.F.; Tzatchkov, V.G.; Alcocer-Yamanaka, V.H. Water network sectorization based on graph theory and energy performance indices. J. Water Resour. Plan. Manag. 2013, 140, 620–629. [Google Scholar] [CrossRef]
- Hajebi, S.; Temate, S.; Barrett, S.; Clarke, A.; Clarke, S. Water distribution network sectorisation using structural graph partitioning and multi-objective optimization. Proc. Eng. 2014, 89, 1144–1151. [Google Scholar] [CrossRef]
- Moore, E.F. The Shortest Path through a Maze; Part II: The Annals of the Computation Laboratory of Harvard University Volume XXX; Harvard University Press: Cambridge, MA, USA, 1959; pp. 285–292. [Google Scholar]
- Todini, E. Looped water distribution networks design using a resilience index based heuristic approach. Urban Water 2000, 2, 115–122. [Google Scholar] [CrossRef]
- Eberhart, R.; Kennedy, J. A New Optimizer Using Particle Swarm Theory. In Proceedings of the Sixth International Symposium on Micro Machine and Human Science, 1995 (MHS ’95), Nagoya, Japan, 4–6 October 1995; pp. 39–43. [Google Scholar]
- Brentan, B.M.; Campbell, E.; Meirelles, G.L.; Luvizotto, E.; Izquierdo, J. Social Network Community Detection for DMA Creation: Criteria Analysis through Multilevel Optimization. Math. Probl. Eng. 2017, 2017. [Google Scholar] [CrossRef]
- Meirelles, G., Jr.; Luvizotto, E.; Brentan, B.M. Selection and location of Pumps as Turbines substituting pressure reducing valves. Renew. Energy 2017, 109, 392–405. [Google Scholar]
- Letting, L.K.; Hamam, Y.; Abu-Mahfouz, A.M. Estimation of Water Demand in Water Distribution Systems Using Particle Swarm Optimization. Water 2017, 9, 593. [Google Scholar] [CrossRef]
- Rossman, A.L. EPANET 2.0 User’s Manual; EPA/600/R-00/057; U.S. Environmental Protection Agency: Cincinnati, OH, USA, 2000.
- ABNT–Brazilian Association of Technical Standards. Project of Water Distribution Network for Public Supply; NBR 12218; ABNT–Brazilian Association of Technical Standards: Rio de Janeiro, Brazil, 1994. (In Portuguese) [Google Scholar]
Figure 1.
Flowchart to obtain the Trunk Network.

Figure 2.
Hydraulic layout of Pumps as Turbines (PAT) and by-pass.

Figure 3.
Design costs: (a) Pipes; and (b) Micro hydro [22].
Figure 3.
Design costs: (a) Pipes; and (b) Micro hydro [22].

Figure 4.
Dimensionless curves of PATs [18].
Figure 4.
Dimensionless curves of PATs [18].

Figure 5.
Flowchart of Trunk Network (TN) design with PAT selection.

Figure 6.
Fossolo network and PAT location.

Figure 7.
Scenarios for the TN size; red lines represent the TN and blue squares the water source.

Figure 8.
Results of TN rehabilitation for the Fossolo network: (a) Energy benefit; (b) Energy produced; (c) Minimum resilience; and, (d) Average increase in pipe diameters.
Figure 8.
Results of TN rehabilitation for the Fossolo network: (a) Energy benefit; (b) Energy produced; (c) Minimum resilience; and, (d) Average increase in pipe diameters.

Figure 9.
Resilience for a 24 h period in the Fossolo network.

Figure 10.
Resilience reduction according to TN size and the location of a pipe burst.

Figure 11.
Pressure zones for the initial scenario and for TNs with 20% and 60% of the pipes: (a) Without leakage; and, (b) Pipe burst on node 22.
Figure 11.
Pressure zones for the initial scenario and for TNs with 20% and 60% of the pipes: (a) Without leakage; and, (b) Pipe burst on node 22.

Figure 12.
Balerma Irrigation network and PATs location.

Figure 13.
Scenarios for the TN size: (a) 20%; (b) 60%; and, (c) 90%; the red lines represent the TN and the blue squares the water sources.
Figure 13.
Scenarios for the TN size: (a) 20%; (b) 60%; and, (c) 90%; the red lines represent the TN and the blue squares the water sources.

Figure 14.
Results of TN rehabilitation for the Balerma irrigation network: (a) Energy benefit; (b) Energy produced; (c) Minimum resilience; and, (d) Average increase in pipes diameters.
Figure 14.
Results of TN rehabilitation for the Balerma irrigation network: (a) Energy benefit; (b) Energy produced; (c) Minimum resilience; and, (d) Average increase in pipes diameters.

© 2018 by the authors. Licensee MDPI, Basel, Switzerland. This article is an open access article distributed under the terms and conditions of the Creative Commons Attribution (CC BY) license (http://creativecommons.org/licenses/by/4.0/).
Share and Cite
MDPI and ACS Style
Meirelles, G.; Brentan, B.; Izquierdo, J.; Ramos, H.; Luvizotto, E., Jr. Trunk Network Rehabilitation for Resilience Improvement and Energy Recovery in Water Distribution Networks. Water 2018, 10, 693. https://doi.org/10.3390/w10060693
AMA Style
Meirelles G, Brentan B, Izquierdo J, Ramos H, Luvizotto E Jr. Trunk Network Rehabilitation for Resilience Improvement and Energy Recovery in Water Distribution Networks. Water. 2018; 10(6):693. https://doi.org/10.3390/w10060693
Chicago/Turabian StyleMeirelles, Gustavo, Bruno Brentan, Joaquín Izquierdo, Helena Ramos, and Edevar Luvizotto, Jr. 2018. "Trunk Network Rehabilitation for Resilience Improvement and Energy Recovery in Water Distribution Networks" Water 10, no. 6: 693. https://doi.org/10.3390/w10060693
Note that from the first issue of 2016, this journal uses article numbers instead of page numbers. See further details here.