An Interval Quadratic Fuzzy Dependent-Chance Programming Model for Optimal Irrigation Water Allocation under Uncertainty

Center for Agricultural Water Research in China, China Agricultural University, Tsinghuadong Street, No. 17, Beijing 100083, China
*
Author to whom correspondence should be addressed.
Water 2018, 10(6), 684; https://doi.org/10.3390/w10060684
Submission received: 21 March 2018
/
Revised: 10 May 2018
/
Accepted: 14 May 2018
/
Published: 25 May 2018
(This article belongs to the Section Water Resources Management, Policy and Governance)
Abstract
:In this study, an interval quadratic fuzzy dependent-chance programming (IQFDCP) model is proposed for irrigation water management under uncertainty. This model can deal with the interval and fuzzy uncertainties encountered in optimal irrigation water resources allocation problems. It takes optimal credibility level of system revenue as the objective function for addressing the conflict between maximum system revenue and the credibility level of the system revenue. By providing three scenarios of precipitation, the optimal solutions are obtained. The developed model is applied to a case study for irrigation water allocation in Minqin Oasis, Wuwei city, northwest China. This study can help determine how much irrigation water should be allocated to different crops under the maximum credibility level of the system revenue. The optimal solutions can provide a certain credibility level of system revenue corresponding to different scenarios and mitigate the system-failure risk level of water shortages in arid areas. Moreover, because the IQFDCP can objectively reflect the interrelationship among crop irrigation water amount, system revenue, and system-failure risk level, the results are able to provide advices to decision makers for efficiently managing water resources in different scenarios.
1. Introduction
Water resources are the basis for food security, and water resource scarcity will lead to the variation of grain production, which is considered as the source of food crisis [1]. Meanwhile, water scarcity is a structural condition in arid regions of the world, which can be further exacerbated by drought events [2]. It has a significant effect on the rapid development of the economy and agricultural production. The increase in the use of domestic water and industrial water has led to the reduction of water in agriculture irrigation [3]. Moreover, there is growing recognition of the need to reduce agricultural groundwater use in response to the rapid aquifer depletion [4]. Many regions reliant on irrigated agriculture have proposed policies to manage groundwater use [5]. In semi-arid and arid areas that rely heavily on irrigated agriculture, the role of agricultural water is even more critical [6]. In addition, the strategic interaction between water allocation and stakeholder preferences is also a continuing problem [7]. Therefore, reasonable allocation of limited irrigation water resources is becoming increasingly critical [8], and efficient water allocation schemes should be used to guarantee water use security and improve the water use efficiency [9]. Generally, maximizing the system revenue considering the cost of consuming excessive irrigation water is a common objective for agricultural water management. However, under these circumstances, the risk level of water shortages has not been fully considered, thereby affecting the results of optimal irrigation water resource allocation. In view of the present situation, how to effectively allocate the limited irrigation water resources to balance the maximum economic benefits and minimize the risk is an urgent problem to be solved.
In order to solve the above problems, Frizzone et al. developed a separable linear programming model for optimizing agricultural water-resources allocation in an irrigation district [10]. Burgschweiger et al. used a nonlinear programming model for planning in water supply systems where it was highly desirable [11]. Keramatzadeh et al. formulated linear programming and multi objective linear programming models for determining solutions that can maximize the net return to farmers [12]. Ahmad and Tang developed a multi-objective linear programming for optimal water allocation based on satisfaction and economics [13]. The above studies indicated that optimizing the irrigation water allocation has substantial potential to increase the net returns from agriculture and reduce irrigation water.
However, many uncertainties caused by various factors in agricultural water management systems should be taken into account [14], and these parameters should not be simply described as deterministic. These uncertainties generate enormous challenges for practical water resources allocation and water quality management [15]. Therefore, introducing uncertain parameters into optimization models can effectively solve such problems. The interval parameter programming (IPP), which is used to deal with the uncertainties expressed as interval in the model, can provide a stable and flexible solution for decision makers without knowing the specific distribution information of parameters [7]. Ishibuchi and Tanaka investigated mathematical programming problems whose objective function has interval coefficients, to maximize the economic benefits of objective function [16]. Guo et al. developed an interval-parameter two-stage stochastic semi-infinite programming (ITSSP) method for water resources management under uncertainty [17]. Many parameters in real life have fuzzy attributes, such as income or credibility level. In 1965, Zadeh put forward the “fuzzy theory”, which was mainly used to study some fuzzy problems [18]. Li et al. developed an interval-fuzzy multistage programming (IFMP) method for water resources management [19]. Maqsood et al. presented an interval-parameter fuzzy two-stage stochastic programming (IFTSP) method for planning water-resources-management systems under uncertainty [20].
Generally, the above optimization models of water resources allocation only considered the economic benefits of irrigation systems, ignoring their credibility level. Fuzzy dependent-chance programming (FDCP) method was considered as a useful tool for dealing with the risk of the objective function [21]. The main principle of FDCP method is that the objective function must be maintained at a given credibility level [22]. FDCP has been improved on the concept of feasible set and different from the other fuzzy mathematical programming methods that need to conform to some pre-determined credibility levels. For example, Liang and Gao used a fuzzy goal dependent-chance programming model for formulating the fuzzy capital budgeting problem [23]. Peng and Zhou developed a fuzzy multi-objective dependent-chance programming model in the field of urban water supply [24]. However, all above uncertainty models belong to the class of linear models which has limitations when the marginal utility nonlinearly affects the revenue and/or the cost coefficients [25,26]. Interval quadratic programming (IQP) is capable of dealing with nonlinearity in the objective function as well as handling uncertainties [27]. Li et al. used an inexact two-stage quadratic programming to show that schemes for allocating irrigation water among different crops monthly under various flow levels are effective for achieving high economic benefits [28]. Therefore, IQP integrated with FDCP method is considered as an effective way to estimate the optimal irrigation water allocation under uncertainty and is especially applicable in agricultural water management to obtain the maximum system revenue and credibility level simultaneously.
In general, the above problems can be addressed by an interval quadratic fuzzy dependent-chance programming (IFDCQP) approach. The basic concept of this model is the use of credibility level theory for balancing the maximum economic benefits and minimum risk level [29]. The developed model is applied to a case study for allocating limited irrigation water in Minqin Oasis, northwest China. The maximum credibility level of system revenue can be obtained. Moreover, the results under different scenarios can reflect the interrelationships among crop irrigation water scheme, system revenue, and system-failure risk level.
2. Methodology
2.1. Interval Quadratic Programming (IQP)
Quadratic programming (QP) is an effective tool to solve practical problems, which can better reflect the nonlinear problem of an objective function. Interval quadratic programming (IQP) is an extension of traditional quadratic programming by incorporating interval parameter programming (IPP) into a QP optimization framework. The general function of nonlinearity and uncertainty with interval variable/parameter are expressed as follows [27]:
subject to
where is the objective function, , , , represent the interval numbers of the model respectively, is the decision variable. “” is the upper and lower bounds on the interval parameters.
It is necessary to consider whether the coefficients of IQP (i.e., and ) have the same sign, which is related to the solution result. For solving the IQP model, we need to discuss it in two aspects.
When the and have the same sign, i.e., when , should also be ≥0, and vice versa. Let the former pairs be positive, i.e., and and the latter pairs be negative, i.e., and , . Under these conditions, the objective function can be converted into [27]:
When the and have the different sign, under this situation, it becomes difficult to determine whether or corresponds to the highest . A mid-value quadratic programming submodel should first be formulated through letting all left- and/or right-hand side coefficients be equal to their mid-values [27,30]. For example, consider an IQP problem as follows.
subject to
The mid-values quadratic programming submodel is
subject to
where , , , are mid-values of , , , (e.g., ), and can be obtained by Equation (1i) to Equation (1k), we have
The upper and lower bound models are shown as
2.2. Fuzzy Dependent-Chance Programming Theory (FDCP)
For two fuzzy events ( and ) satisfying fuzzy membership function , there are three different forms: (1) Possibility measure (Pos): The possibility of a fuzzy event (i.e., ) is defined as ; (2) Necessity measure (Nec): Likewise, the necessary of denotes the impossibility of the opposite event, and it’s defined as ; (3) Credibility measure (Cr): The credibility is shown as for improving their limitations by combining possibility and necessary measures [31].
The event is not necessarily valid when the possibility of a fuzzy event is 1. Similarly, when the necessity of the event is 0, the event may be established. However, the credibility level of the fuzzy event is 1, it is bound to be established. Besides, if the credibility level is 0, it will not be established. Therefore, the decision confusion caused by traditional fuzzy membership calculation can be solved [32].
In uncertainty decision systems, decision makers often select schemes with maximal chance to meet the event. Because the payoff function is presented as fuzzy, decision makers hope to maximize the chance function of these events. In order to solve these problems, a fuzzy dependent-chance programming was proposed [29], based on maximizing the credibility level of uncertainty events under uncertain environments. In a fuzzy environment, the standard fuzzy dependent-chance programming is shown as follows:
subject to
where is the objective function; is the credibility level; is the n-dimensional decision variable; is the fuzzy variable; is the fuzzy event and is the uncertain environment.
Let be a triangular fuzzy variable (r1, r2, r3), is a membership function, then the credibility level of can be expressed as:
In general, a meaningful credibility level should be greater than 0.5 [33]. Therefore, based on the definition of the above credibility level, the objective function can be transformed into the case where the objective function is greater than 0.5:
Therefore, it can be seen that the fuzzy dependent-chance programming model is transformed into a linear programming model.
2.3. Interval Quadratic Fuzzy Dependent-Chance Programming (IQFDCP) Model
In a fuzzy environment, the standard IQFDCP model form is
subject to
where is the objective function that indicates the maximum credibility level of the system revenue; is the credibility level; , , and are parameters of the model; is the decision variable; and is the fuzzy number.
The framework of the developed model is shown in Figure 1. The detailed solution process can be summarized as follows:
- (1)
- Determine the input parameters of the model and its fuzzy membership functions.
- (2)
- Analyze the credibility level of the model. According to the triangular fuzzy membership functions, the developed model can be transformed into its equivalent model.
- (3)
- If the , in interval quadratic function have the same sign, we can formulate the upper and lower bound submodels corresponding to and .
- (4)
- If the , in interval quadratic function have different signs, we should formulate and solve mid-values model first, have and or and whether is more than 0.
- (5)
- Solve the above submodels and obtain the optimal objective function and the decision variables.
3. Case Study
3.1. Study Area
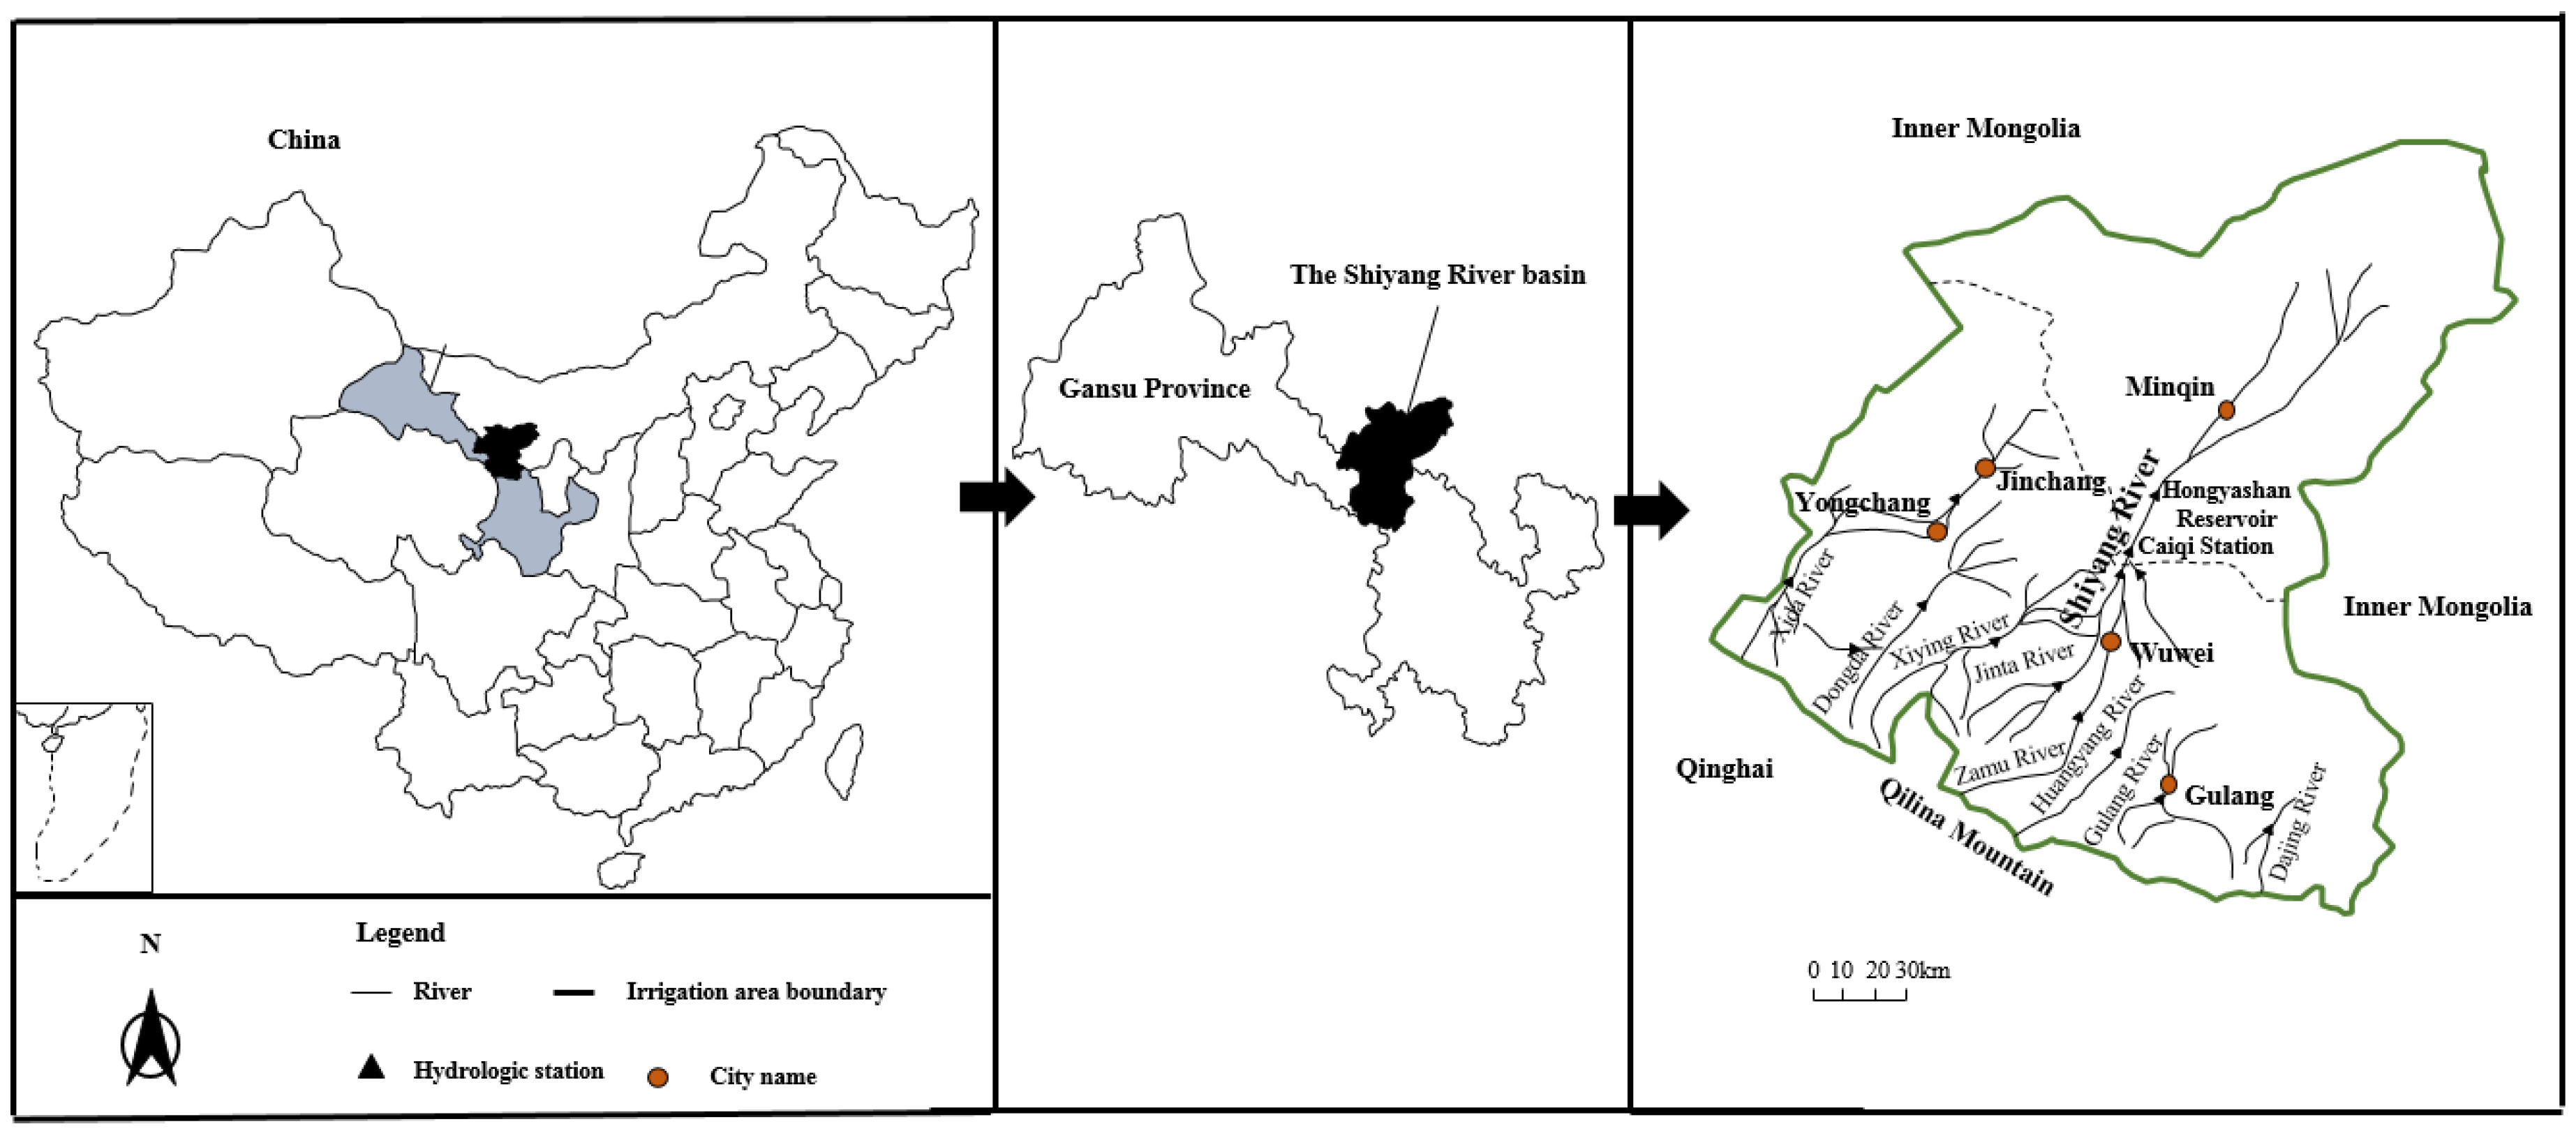
The study area, located in Minqin Oasis, Wuwei city, Gansu province, northwest China, is shown in Figure 2. Minqin Oasis covers an area of 2745 km2 and lies between 102°45′–103°55′ E and 38°20′–39°10′ N in the contiguous zone and between the Badain Jaran desert and Tengger desert [34]. The annual average precipitation is 113 mm, while the annual evapotranspiration reaches 2644 mm [35]. Minqin Oasis is mainly focused on agricultural production, and agricultural water is the largest water use section of Minqin Oasis, accounting for 70–80% of the total water consumption. The surface water resource is delivered only from the Shiyang River, which originates from the Qilian mountains [36]. There are three irrigation districts in study area: Changning irrigation district (CN), Huanhe irrigation district (HH), and Hongyashan irrigation district (HYS). CN and HH are fully irrigated by groundwater, and HYS is irrigated by both groundwater and surface water. The study crops consist of grain crops (e.g., spring wheat, maize) and economic crops (e.g., cotton). The main irrigation method is furrow irrigation.
3.2. Problem Statement
Minqin Oasis is the most important agricultural county of Wuwei City, and over 90% of the arable land requires irrigation [36]. As water consumption increased in the middle reaches of the Shiyang River, the surface water discharged into the Minqin Oasis gradually decreased, shrinking from 5.14 × 10⁸ m3 in 1956 to only 1.79 × 10⁸ m3 in 2006 [32]. Moreover, the amount of extracted groundwater accounts for over 85% of annual water consumption of the oasis [34]. Owing to excessive extraction, the groundwater table has continuously declined. The desertification and salinization of the region are serious and have become the growing concerns. Therefore, irrigation water resources are increasingly limited, and the disparity between supply and demand of agricultural water resources is expanding. Therefore, it is necessary to optimize irrigation water resources so as to alleviate the contradiction between supply and demand.
3.3. Data Collection and Processing
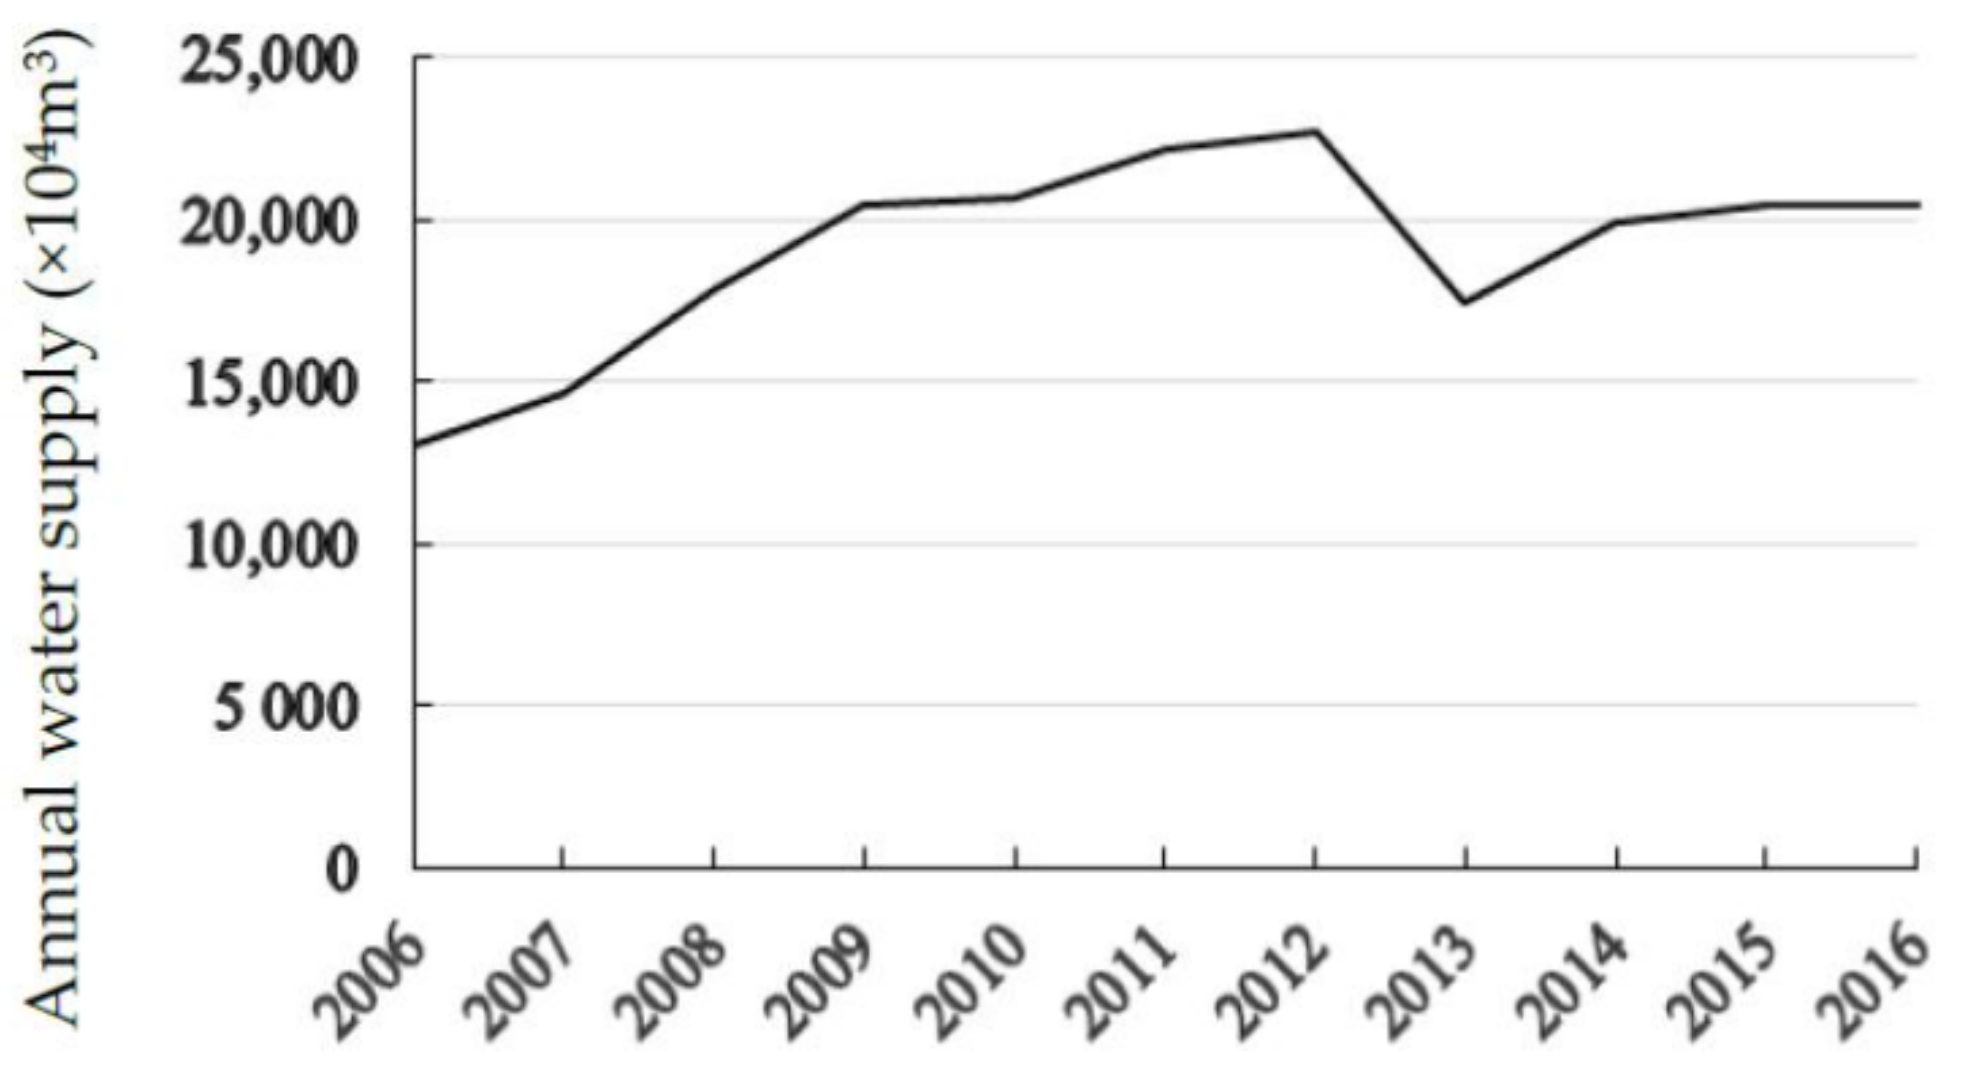
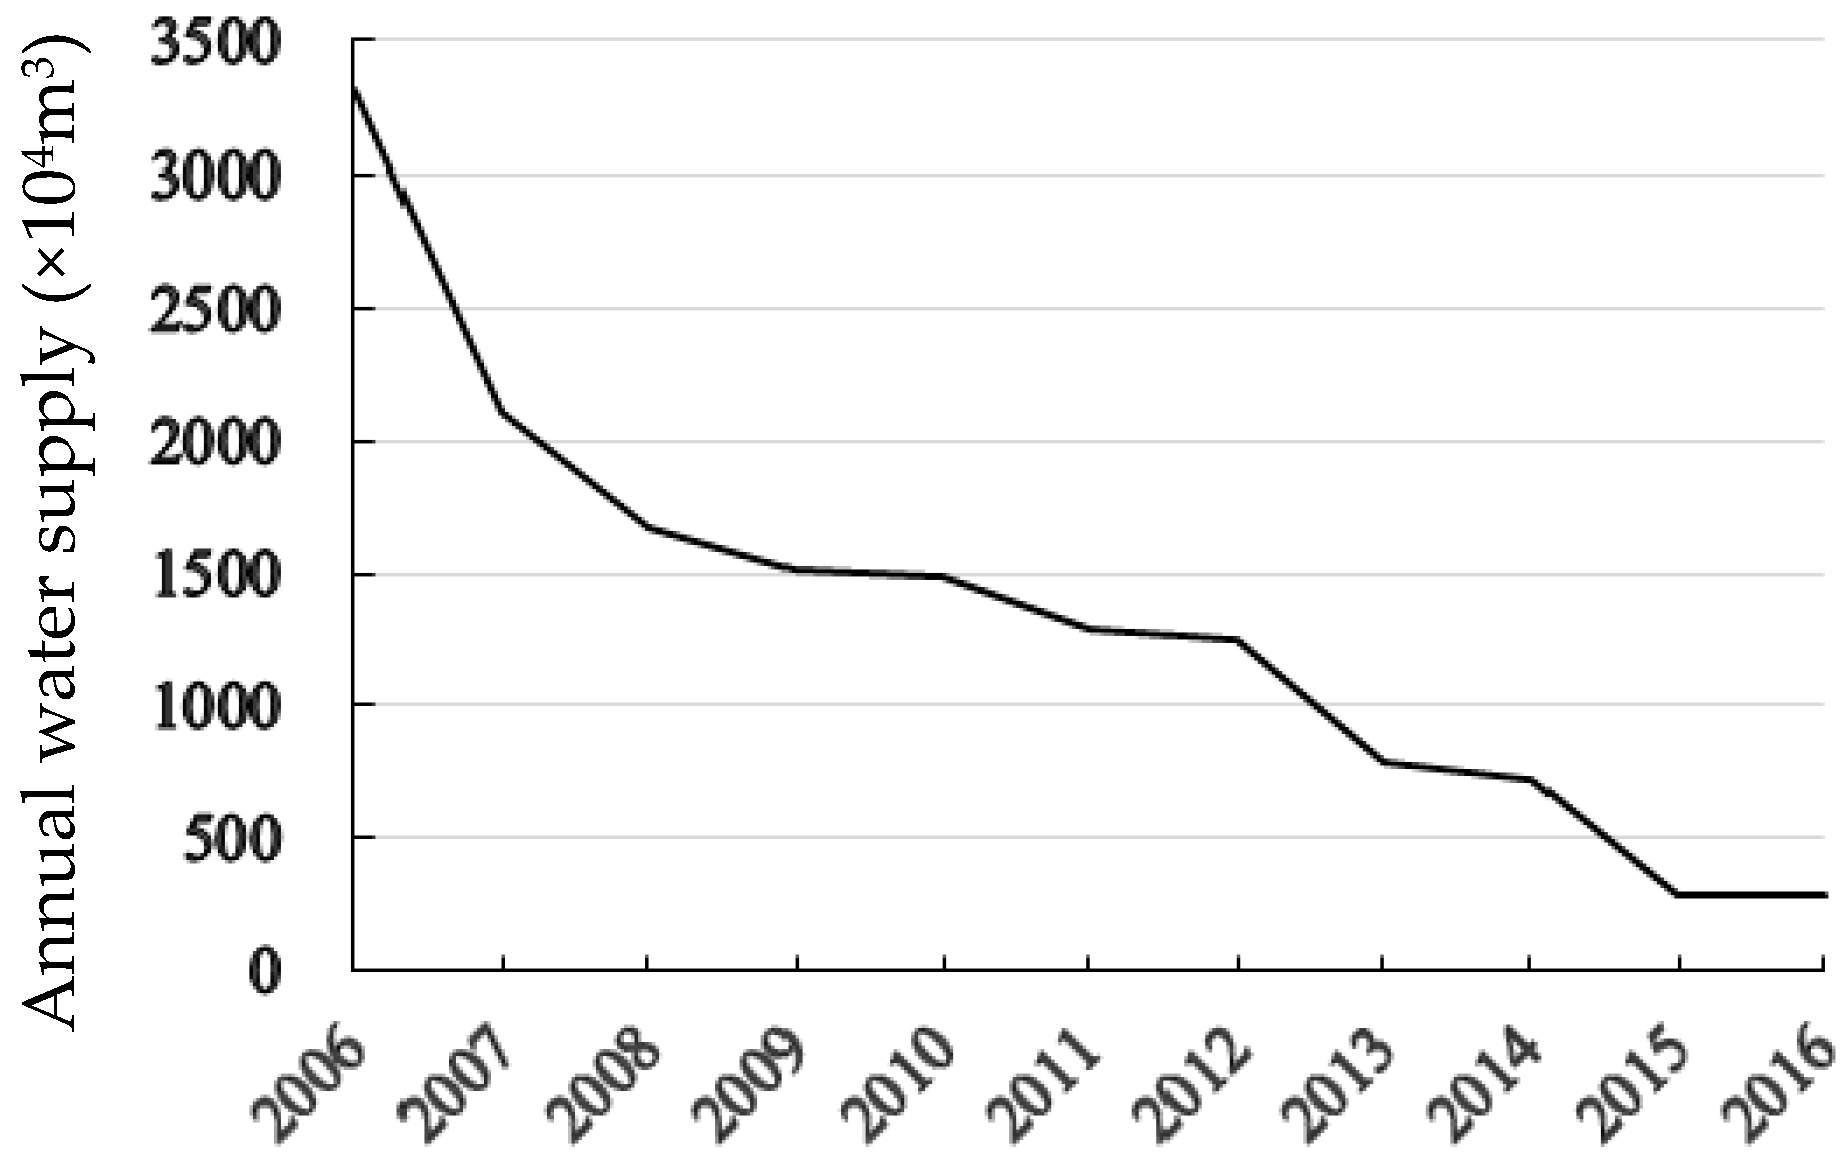
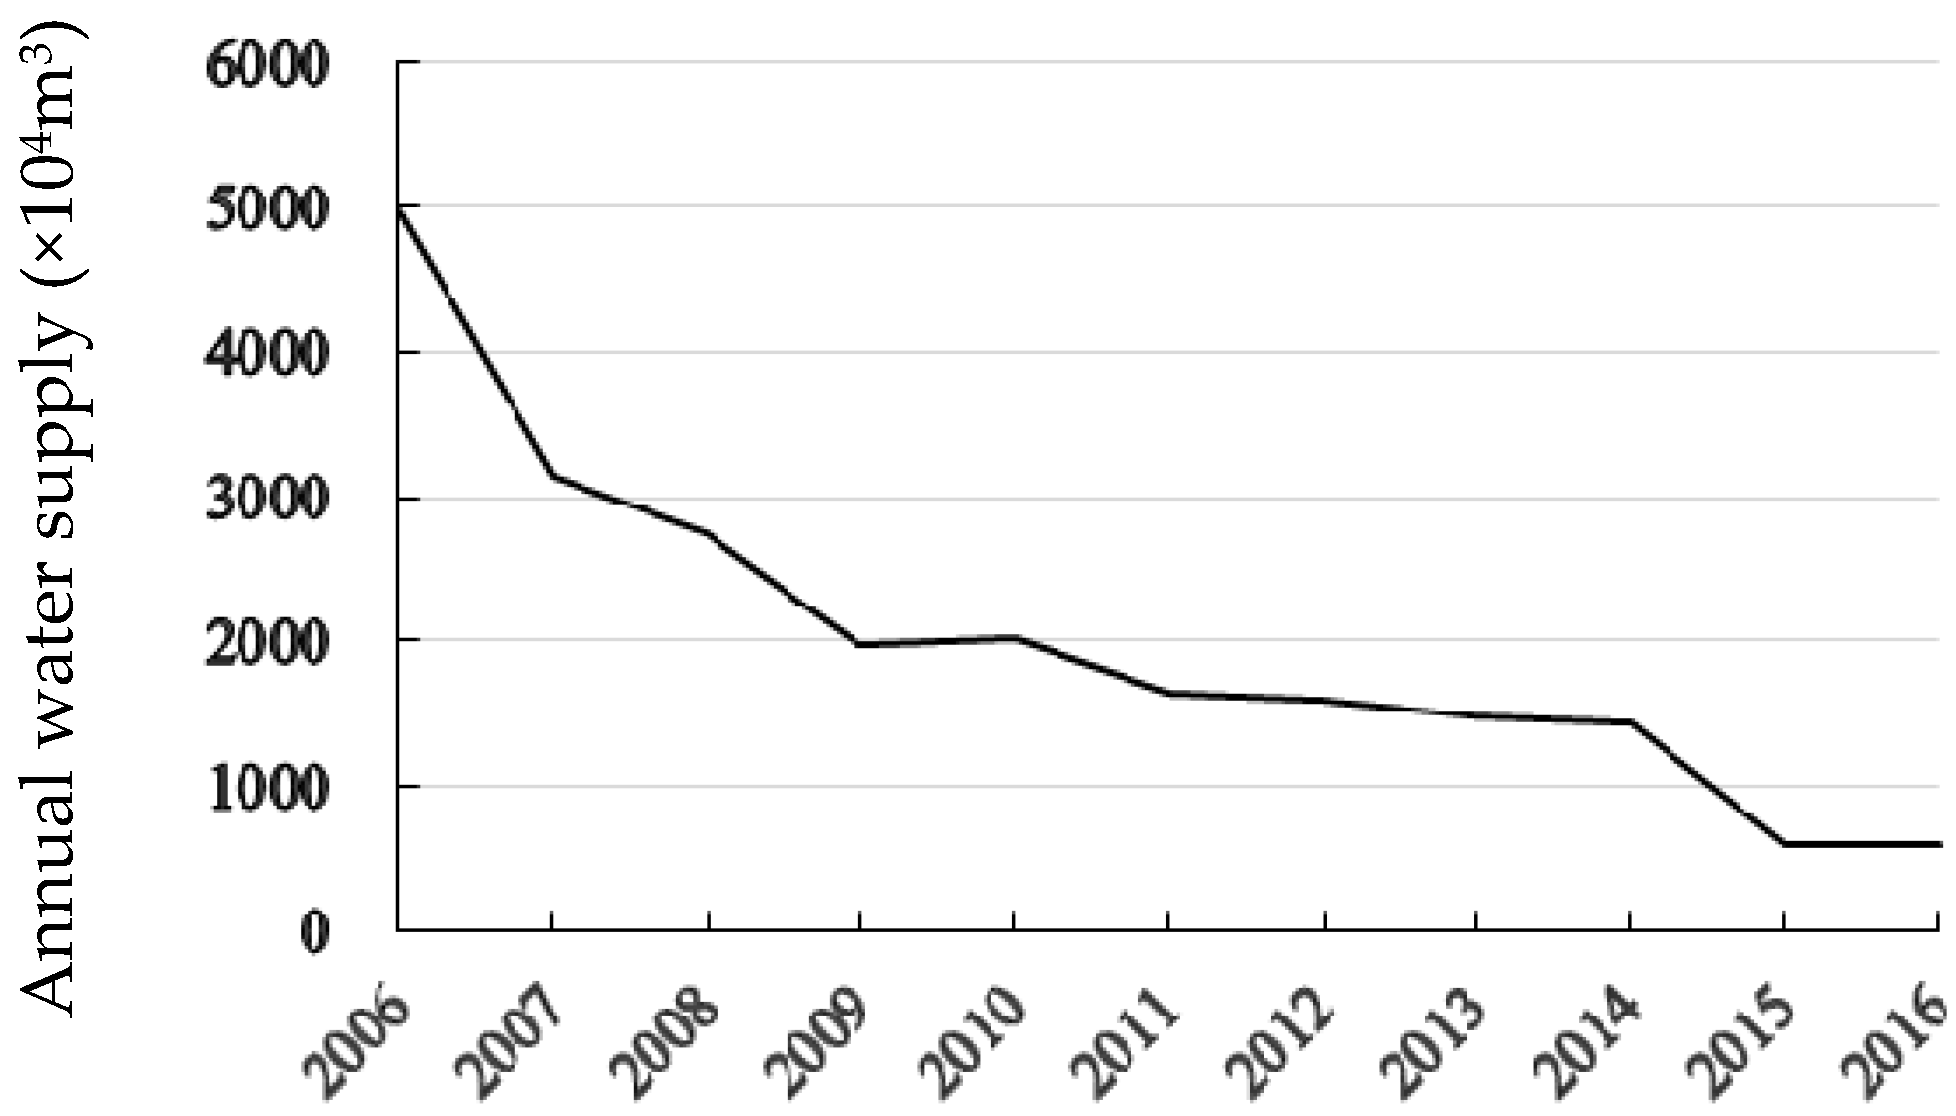
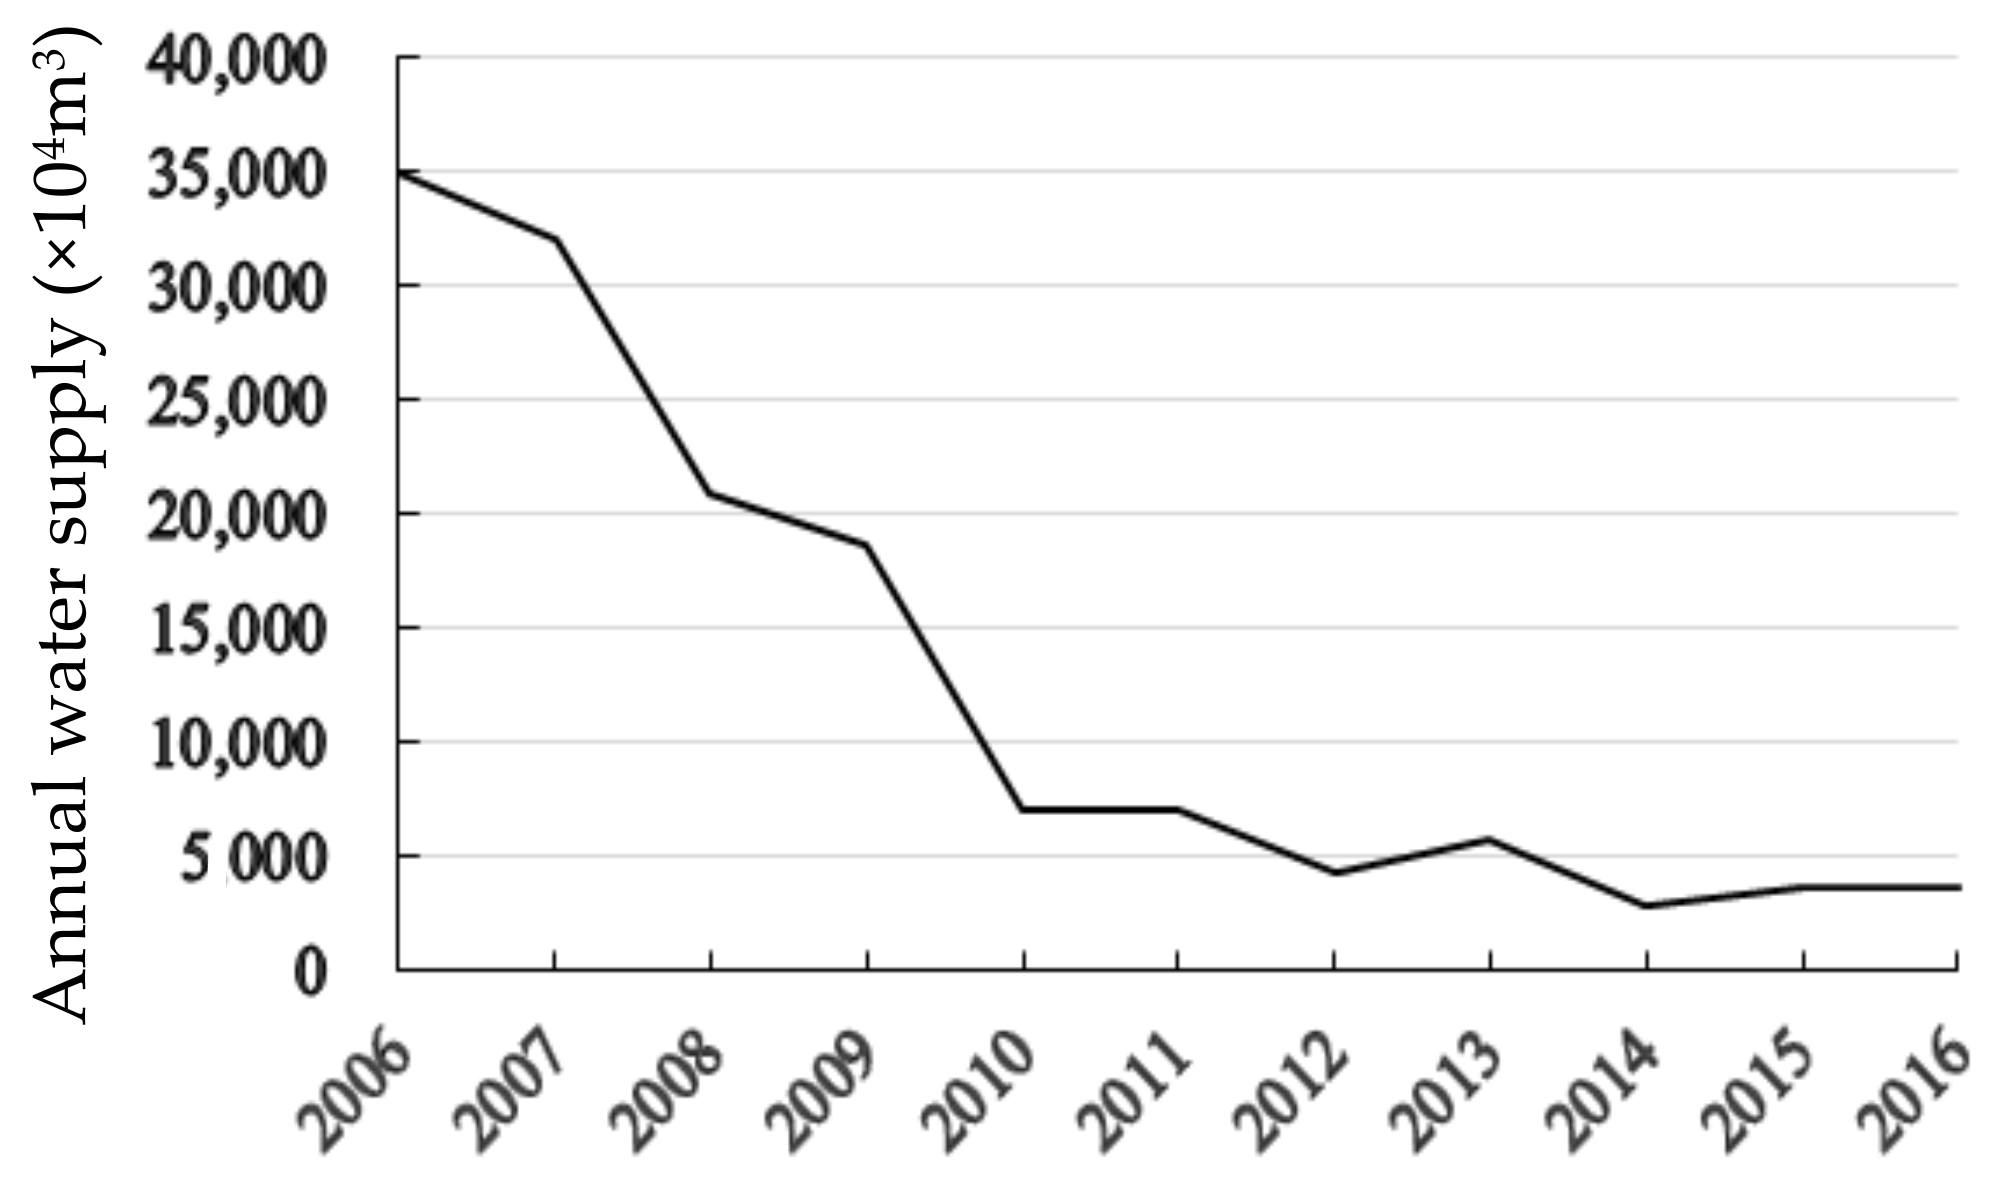
Surface water inflow and groundwater withdrawal in the three irrigation districts in Minqin Oasis from 2006 to 2016 are shown in Figure 3, Figure 4, Figure 5 and Figure 6. The groundwater availability in three irrigation districts shows a downward trend due to the government issues in limiting the amount of groundwater extraction to protect the local ecological environment. The surface water inflow of HYS onward has gradually stabilized from 2014. Therefore, it is reasonable to select the groundwater and the surface water in 2016 as the current situation. The historical records of precipitation data are collected from the Minqin Oasis meteorological station [37] from 1986 to 2016. The category of different precipitation levels was based on the frequency analysis method. Let p express the frequency for dividing different precipitation levels, then the corresponding categories are shown as follows: p < 25% corresponds to wet year level, 25% ≤ p ≤ 75% corresponds to normal year level, and p > 75% corresponds to dry year level [28]. The actual precipitation and the water requirement corresponding to the whole growth period of three crops are shown in Table 1. Some basic information on typical crops can be obtained according to the 2016 Statistical Yearbook of Minqin Oasis and Minqin Oasis Sub-irrigation Area (See Table 2) [38].
In this model, the system revenue is vague and imprecise due to managers’ subjective judgments, which can be better reflected by fuzzy membership functions. Thus, fuzzy theory is introduced to describe this parameter. The triangular fuzzy number (r1, r2, r3) of the system revenue can be obtained by using the planting area data of the past 5 years (2012–2017) and the corresponding economic parameters. In this case, r1, r2, r3 in the triangular fuzzy number of evaluation values were “poor”, “general” and “good”. Therefore, the acreage and economic parameters are selected from 2012–2017 as the lowest, average, the highest value calculation, and r1 = 2.89 × 10⁹ Yuan, r2 = 3.21 × 10⁹ Yuan, r3 = 4.32 × 10⁹ Yuan.
3.4. Application of IQFDCP Model
Based on the above uncertainty theory, this study developed the IQFDCP model to solve practical problems of optimal irrigation water resources allocation under uncertainty. The objective function is to maximize the credibility level of system revenue subject to a series of constraints.
In this study, a crop water production function for the whole growth period of the crops () is used to decide how much water needs to be allocated to different crops. , and are the empirical coefficients in the quadratic crop water production functions. The interval quadratic regression analysis method is adopted based on quadratic programming to analyze crop yield and water consumption in the whole growth period [39]. Accordingly, the model is formulated as follows:
subject to
Surface water supply constraint
Groundwater supply constraint
Water requirement for normal growth of crops
Grain security constraint
Non-negative constraint
The meaning of the parameters and variables in the model above is shown in Table 3.
The basic framework of this model is an interval quadratic programming model under uncertainty. Moreover, it combines with the characteristics of parameters, namely the parameters , , are positive, , are negative. Thus, a mid-values quadratic programming submodel needs to be formulated as
subject to
The optimal solutions for , can be obtained by solving model (4), and the bound distribution for , can be identified according to Equations (1n) and (1o). Then, model (4) can be transformed into two deterministic submodels, the submodel corresponding to can be expressed as
subject to
where , are the decision variables, the solution can provide the maximum credibility level of system revenue, and the submodel corresponding to can be expressed as
subject to
The optimal solution of the model under different scenarios can be obtained as
4. Result Analysis
This model incorporates interval and fuzzy programming into an optimization irrigation water allocation model and introduces the credibility theory combined with the triangular fuzzy membership function to obtain the maximum credibility level under the maximum system revenues. The result is presented in the form of interval values, which can give decision makers a decision space with the upper and lower bounds. Moreover, considering the different precipitation scenarios, decision makers can choose the better irrigation amount of crops corresponding to the interval values of risk level and system revenue. In summary, uncertainty theory is introduced into the optimization irrigation water management framework, which can enhance the practicability and feasibility of the model. Therefore, decision makers have access to a certain level of decision space and relevant decision information.
Table 4 shows the results of optimal allocation of irrigation water resources based on different precipitation scenarios in three irrigation districts. The HYS district is irrigated by both surface water and groundwater, and the price of surface water is less than that of the groundwater. Therefore, when surface water is sufficient to meet the irrigation water demand, the amount of allocated groundwater for the three crops is much less than that of surface water in HYS district. In addition, CN and HH districts are irrigated by only groundwater. The groundwater supply is limited in order to reduce groundwater extraction, leading to decreased irrigation water for crops. By comparing the irrigation water of three crops under different scenarios, it is obvious that there is water competition among the three crops with limited irrigation water resources.
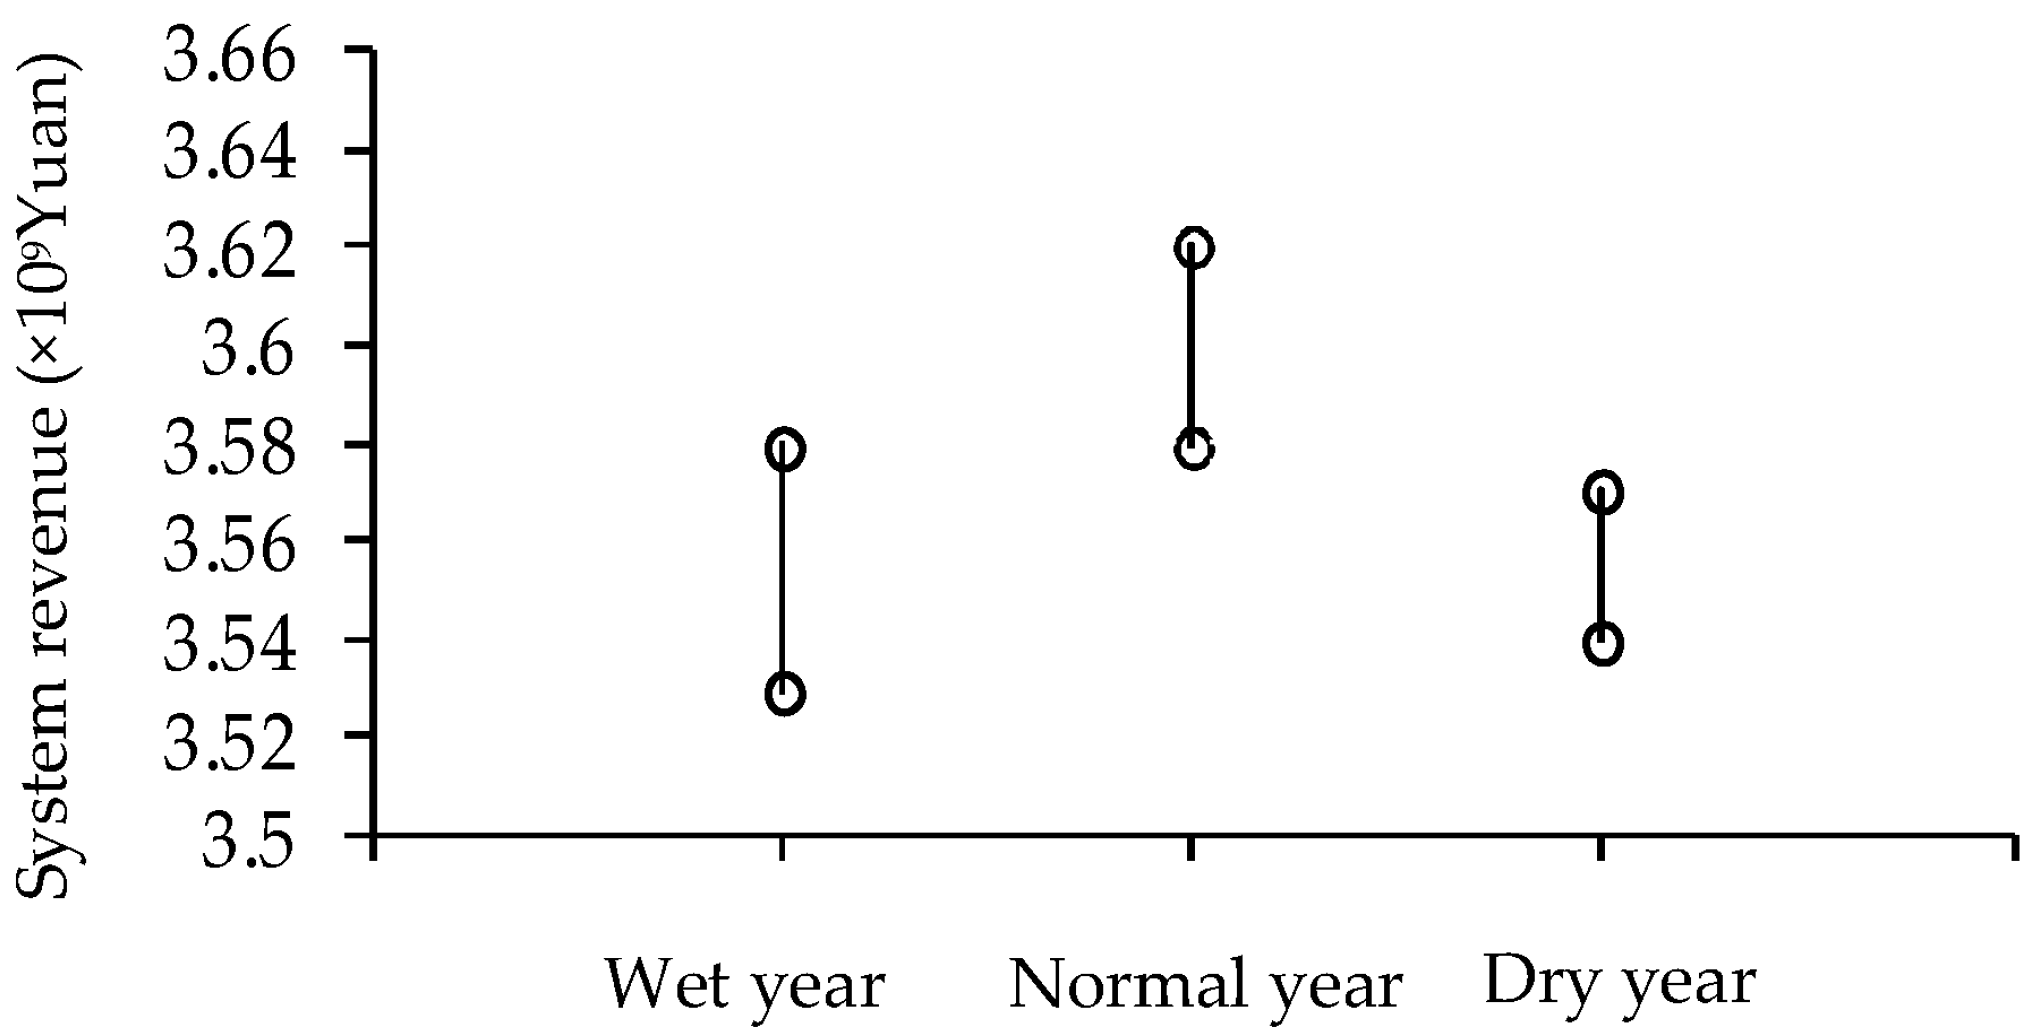
Figure 7 shows the system revenue value (i.e., R) under the wet, normal and dry year level, namely, (3.53, 3.58), (3.58, 3.62), (3.54, 3.57) (×109 Yuan). The normal year level of system revenue is the highest, followed by wet year level, dry year level. R in different scenarios is higher than the general value r2 in the triangular fuzzy number, but less than r3. It can be concluded that the system revenue in different scenarios is higher than the “normal” level, but it is difficult to achieve the “good” level. The range of the interval decreased gradually, that is, 0.05, 0.04, and 0.03. The fluctuation of system revenue is small, and the risk space of irrigation water will decrease accordingly.
The comparison of the optimal irrigation water and actual irrigation water (take the normal year in 2016 as an example) is shown in Table 5. It can be seen that the optimal irrigation water is less than the actual irrigation water. Taking CN and HH districts as examples, reducing groundwater usage to optimum irrigation levels can control groundwater exploitation effectively because the amount of irrigation water is decreased greatly, but the risk level of the revenue system increased. There are two reasons to explain why farmers might be using more water than the optimal irrigation water amount. On the one hand, the characteristics of the IQDCP model is that it belongs to interval quadratic programming framework. When the system revenue gradually approaches the maximum values, the increase of crops irrigation water amount has little effect on the system revenue. However, in the actual irrigation system, the farmers are willing to gain this small benefit at the cost of such an increased crop irrigation water amount. On the other hand, the agricultural irrigation facilities in the Minqin Oasis are backward. Under the current conditions, the level of agricultural water management is relatively low, and the irrigation methods are not efficient, resulting in a lower water use efficiency and a larger waste of water resources. Ultimately, the water used by farmers is higher than the optimized amount of irrigation water.
In addition, compared with the optimal system revenue and actual system revenue, it can be concluded that the optimal system revenue increased by about 4000 × 104 Yuan. Table 5 shows that the interval quadratic fuzzy dependent-chance programming model for optimal irrigation water allocation has achieved obvious water-saving effect and improved the economic benefit. Based on the fuzzy dependent-chance programming, it is possible to obtain the maximum system revenue and its credibility level. When considering the credibility level, there is a certain risk level for obtaining the theoretical maximum system revenue.
Figure 8 shows the credibility level (λ) of system revenue. The λ values in different scenarios are (0.64, 0.66), (0.67, 0.68) and (0.65, 0.66), respectively. In theory, credibility level represents the satisfaction degree level of constraints and (1 − λ) indicates the risk level of the event. Therefore, a decision-maker can choose different irrigation schemes according to the risk level of the system revenue. It can be seen that, under different scenarios, the credibility levels of system revenue are greater than 0.5, ranging from 0.6 to 0.7. On the whole, the degree of credibility level is still low, which means that the system has a greater risk to revenue. The reasons for this situation are
- (1)
- Compared with the actual situation, the interval of the system revenue of the triangular fuzzy number is too big, especially for obtaining r3. The planting area and the price take a more optimistic value. It is difficult to achieve in the actual situation, causing the lower level of credibility of system revenue.
- (2)
- For three irrigation districts in Minqin Oasis, the CN and HH districts are irrigated by only groundwater. In order to decrease groundwater extraction, irrigation water is reduced, resulting in lower crop yield under the low amount of groundwater availability compared to HYS. Thus, low system revenue is obtained in Minqin Oasis and the credibility level is decreased.
- (3)
- There is no cotton in CN and HH. The main crops are spring wheat and maize. However, cotton is a major source of income for system, resulting in low system revenue, causing the low credibility level.
According to Figure 6 and Figure 7, the interval range of system revenue M decreases from 0.05 to 0.03 in different scenarios. The interval range of the credibility level is reduced from 0.02 to 0.01, indicating that system revenue risk space will be correspondingly reduced in different scenarios, and system revenue is relatively decreased with reduced irrigation water.
Decision-makers can determine the optimal irrigation water to different crops according to different scenarios. Moreover, from the mechanism of the optimization model, it can be seen that the system revenue and its credibility level are positively related to the optimization of irrigation water. In other words, when water inflow conforms to the interval value of the model, the greater the amount of irrigation water, the higher the revenue of system, and the higher its credibility level.
5. Conclusions
In this study, an interval quadratic fuzzy dependent-chance programming (IQFDCP) model has been developed for optimal allocation of irrigation water resources. This model combined with credibility level theory to improve the previous irrigation water resources optimization models which only consider the maximum system revenue ignoring the credibility level. At the same time, IQFDCP can address the uncertainties in the agricultural irrigation system. The IQFDCP model can be solved by interval quadratic solution via transferring it into the upper and lower submodels. This study applies the model to Minqin Oasis. The crop water production functions were used to express the relationship between crop yield and the amount of irrigation water, and their empirical coefficients were simulated by a large number of experimental data. Moreover, the uncertain methods and constraints can reflect the actual situation in the area. The results show that the feasibility of IQFDCP model for optimal allocation of irrigation water and generation of the desired irrigation water allocation plans with the maximum credibility level. Therefore, the optimization results can provide decision makers or farmers with the optimal irrigation water schemes. Compared with the previous studies, it has the following advantages: (a) A potential approach is to integrate IQP and FDCP to handle multiple uncertainties and nonlinearities in irrigation systems; (b) it has the ability to address the confliction of maximum system revenue and credibility level for water management; (c) the proposed method is applied to a real case and provides irrigation water allocation schemes with maximum credibility level under different scenarios.
Although the IQFDCP model can solve uncertainties exiting in irrigation management problems, and obtain desired irrigation water with maximum credibility level, more physical processes including transformational processes among atmosphere water, surface water, soil water and groundwater need to be considered in reality. Additionally, irrigation water management policies also have impacts on optimal allocation of irrigation water resources. Taking all these concerns into account is a significant topic that needs to be further studied in the future.
Author Contributions
Model calculation and verification, H.W. and C.Z.; Data collection, H.W.; Writing-Review & Editing, P.G.
Funding
This research was funded by [the National Natural Science Foundation of China] grant number [51439006] and [the Ministry of Water Resources of China] grant number [201501017].
Conflicts of Interest
The authors declare no conflict of interest.
References
- Kang, S.; Hao, X.; Du, T.; Tong, L.; Su, X. Improving agricultural water productivity to ensure food security in China under changing environment: From research to practice. Agric. Water Manag. 2016, 179, 5–17. [Google Scholar] [CrossRef]
- Borrego-Marin, M.M.; Gutiérrez-Martín, C.; Berbel, J. Water Productivity under Drought Conditions Estimated Using SEEA-Water. Water 2016, 8, 138. [Google Scholar] [CrossRef]
- Postel, S. Forging a sustainable water strategy. In State of the World; Worldwatch Institute: Washington, DC, USA, 1996. [Google Scholar]
- Foster, T.; Brozović, N.; Butler, A.P. Effects of initial aquifer conditions on economic benefits from groundwater conservation. Water Resour. Res. 2017, 53, 744–762. [Google Scholar] [CrossRef]
- Tan, Q.; Zhang, S.; Li, R. Optimal Use of Agricultural Water and Land Resources through Reconfiguring Crop Planting Structure under Socioeconomic and Ecological Objectives. Water 2017, 9, 488. [Google Scholar] [CrossRef]
- Hrozencik, R.A.; Manning, D.T.; Suter, J.F.; Goemans, C.; Bailey, R.T. The Heterogeneous Impacts of Groundwater Management Policies in the Republican River Basin of Colorado. Water Resour. Res. 2017, 53, 10757–10778. [Google Scholar] [CrossRef]
- Li, M.; Guo, P.; Ren, C. Water Resources Management Models Based on Two-Level Linear Fractional Programming Method under Uncertainty. J. Water Resour. Plan. Manag. 2015, 141, 05015001. [Google Scholar] [CrossRef]
- Brown, P.D.; Cochrane, T.A.; Krom, T.D. Optimal on-farm irrigation scheduling with a seasonal water limit using simulated annealing. Agric. Water Manag. 2010, 97, 892–900. [Google Scholar] [CrossRef]
- Zhang, F.; Tan, Q.; Zhang, C.; Guo, S.; Guo, P. A Regional Water Optimal Allocation Model Based on the Cobb-Douglas Production Function under Multiple Uncertainties. Water 2017, 8, 923. [Google Scholar] [CrossRef]
- Frizzone, J.A.; Coelho, R.D.; Dourado Neto, D.; Soliani, R. Linear programming model to optimize the water resource use in irrigation projects: An application to the Senator Nilo Coelho Project. Sci. Agric. 1997, 54, 136–148. [Google Scholar] [CrossRef]
- Burgschweiger, J.; Dig, B.; Steinbach, M.C. Nonlinear programming techniques for operative planning in large drinking water networks. Open Appl. Math. J. 2009, 3, 14–28. [Google Scholar] [CrossRef]
- Keramatzadeh, A.; Chizari, A.H.; Moore, R. Economic optimal allocation of agriculture water: Mathematical programming approach. J. Agric. Sci. Technol. 2011, 13, 477–490. [Google Scholar]
- Ahmad, I.; Tang, D. Multi-objective linear programming for optimal water allocation based on satisfaction and economic criterion. Arab. J. Sci. Eng. 2016, 41, 1421–1433. [Google Scholar] [CrossRef]
- Loucks, D.P.; Van Beek, E. Water Resources Systems Planning and Management—Exercises; United Nation Educational, Scientific and Cultural Organization (Unesco): Paris, France, 2005. [Google Scholar]
- Meng, C.; Wang, X.; Li, Y. An Optimization Model for Water Management Based on Water Resources and Environmental Carrying Capacities: A Case Study of the Yinma River Basin, Northeast China. Water 2018, 10, 565. [Google Scholar] [CrossRef]
- Ishibuchi, H.; Tanaka, H. Multiobjective programming in optimization of the interval objective function. Eur. J. Oper. Res. 1990, 48, 219–225. [Google Scholar] [CrossRef]
- Guo, P.; Huang, G.H.; He, L.; Zhu, H. Interval-parameter two-stage stochastic semi-infinite programming: Application to water resources management under uncertainty. Water Resour. Manag. 2009, 23, 1001–1023. [Google Scholar] [CrossRef]
- Zadeh, L.A. Fuzzy sets. Inf. Control 1965, 8, 338–353. [Google Scholar] [CrossRef]
- Li, Y.P.; Huang, G.H.; Yang, Z.F.; Nie, S.L. IFMP: Interval-fuzzy multistage programming for water resources management under uncertainty. Resour. Conserv. Recycl. 2008, 52, 800–812. [Google Scholar] [CrossRef]
- Maqsood, I.; Huang, G.H.; Yeomans, J.S. An interval-parameter fuzzy two-stage stochastic program for water resources management under uncertainty. Eur. J. Oper. Res. 2005, 167, 208–225. [Google Scholar] [CrossRef]
- Liu, B. Fuzzy Dependent-Chance Programming. In Theory and Practice of Uncertain Programming; Physica-Verlag HD: Heidelberg, Germany, 2002; pp. 197–208. [Google Scholar]
- Liu, B. Dependent-chance programming in fuzzy environments. Fuzzy Sets Syst. 2000, 109, 97–106. [Google Scholar] [CrossRef]
- Liang, R.; Gao, J. Dependent-chance programming models for capital budgeting in fuzzy environments. J. Tsinghua Univ. Nat. Sci. Ed. 2008, 13, 117–120. [Google Scholar] [CrossRef]
- Peng, H.; Zhou, H. A fuzzy-dependent chance multi-objective programming for water resources planning of a coastal city under fuzzy environment. Water Environ. J. 2011, 25, 40–54. [Google Scholar] [CrossRef]
- Huang, G.H.; Li, Y.P.; Xiao, H.N.; Qin, X.S. An inexact two-stage quadratic program for water resources planning. J. Environ. Inform. 2007, 10, 99–105. [Google Scholar] [CrossRef]
- Huanga, Y.; Lib, Y.P.; Chenc, X.; Mad, Y.G. Optimization of the irrigation water resources for agricultural sustainability in Tarim River Basin, China. Agric. Water Manag. 2012, 107, 74–85. [Google Scholar] [CrossRef]
- Chen, M.J.; Huang, G.H. A derivative algorithm for inexact quadratic program—Application to environmental decision-making under uncertainty. Eur. J. Oper. Res. 2001, 128, 570–586. [Google Scholar] [CrossRef]
- Li, M.; Guo, P.; Singh, V.P.; Zhao, J. Irrigation Water Allocation Using an Inexact Two-Stage Quadratic Programming with Fuzzy Input under Climate Change. JAWRA J. Am. Water Resour. Assoc. 2016, 52, 667–684. [Google Scholar] [CrossRef]
- Liu, B. Random fuzzy dependent-chance programming and its hybrid intelligent algorithm. Inf. Sci. 2002, 141, 259–271. [Google Scholar] [CrossRef]
- Huang, G.H.; Loucks, D.P. An Inexact Two-Stage Stochastic Programming Model for Water Resources Management under Uncertainty. Civ. Eng. Environ. Syst. 2000, 17, 95–118. [Google Scholar] [CrossRef]
- Zhang, C.; Guo, P. A generalized fuzzy credibility-constrained linear fractional programming approach for optimal irrigation water allocation under uncertainty. J. Hydrol. 2017, 553, 735–749. [Google Scholar] [CrossRef]
- Hu, X.J.; Xiong, Y.C.; Li, Y.J.; Wang, J.X.; Li, F.M. Integrated water resources management and water users’ associations in the arid region of northwest China: A case study of farmers’ perceptions. J. Environ. Manag. 2014, 145, 162–169. [Google Scholar] [CrossRef] [PubMed]
- Li, T. Study on Basin Water Environment Management Optimization Based on Water Quality Simulation under Uncertain Conditions. Doctoral Dissertation, North China Electric Power University, Zhuhai, China, 2013. [Google Scholar]
- Xiao, D.N.; Li, X.Y.; Song, D.M.; Yang, G.J. Temporal and spatial dynamical simulation of groundwater characteristics in Minqin Oasis. Chin. Sci. Earth Sci. 2007, 50, 261–273. [Google Scholar] [CrossRef]
- Zhao, J.; Li, M.; Guo, P.; Zhang, C.; Tan, Q. Agricultural Water Productivity Oriented Water Resources Allocation Based on the Coordination of Multiple Factors. Water 2017, 9, 490. [Google Scholar] [CrossRef]
- Gui, Z.; Li, M.; Guo, P. Simulation-Based Inexact Fuzzy Semi-Infinite Programming Method for Agricultural Cultivated Area Planning in the Shiyang River Basin. J. Irrig. Drainage Eng. 2016, 143, 05016011. [Google Scholar] [CrossRef]
- Minqin Water Bureau (MWB). Minqin Oasis Annual Division of Water Industry Statistics Table; Minqin Water Bureau: Beijing, China, 2016.
- Wuwei Statistics Bureau (WSB). Wuwei Statistical Yearbook; Wuwei Statistics Bureau: Wuwei, China, 2015.
- Tong, F.; Guo, P. Simulation and optimization for crop water allocation based on crop water production functions and climate factor under uncertainty. Appl. Math. Model. 2013, 37, 7708–7716. [Google Scholar] [CrossRef]
Figure 1.
The framework of the interval quadratic fuzzy dependent-chance programming (IQFDCP) model.
Figure 1.
The framework of the interval quadratic fuzzy dependent-chance programming (IQFDCP) model.

Figure 2.
Sketch map of the Minqin Oasis in northwest China

Figure 3.
Surface water inflow of the Hongyashan irrigation district (HYS) from 2006 to 2016.

Figure 4.
Groundwater availability of the Changning irrigation district (CN) from 2006 to 2016.

Figure 5.
Groundwater availability of the Huanhe irrigation district (HH) from 2006 to 2016.

Figure 6.
Groundwater availability of HYS from 2006 to 2016.

Figure 7.
The system revenue in different scenarios in Minqin Oasis.

Figure 8.
Credibility level of system revenue in different scenarios in Minqin Oasis.


Table 1.
The whole growth stage water demand of different crops and precipitation statistics of Minqin Oasis under typical years.
Table 1.
The whole growth stage water demand of different crops and precipitation statistics of Minqin Oasis under typical years.
| Typical Year | Crop | Precipitation (P)/mm | Water Demand (ETmax)/mm |
|---|---|---|---|
| Wet year (2002) | Spring wheat | (98.6, 120.6) | 658.0 |
| Maize | (124.1, 151.7) | 561.0 | |
| Cotton | (135.8, 166.0) | 375.3 | |
| Normal year (1998) | Spring wheat | (77.0, 94.2) | 677.4 |
| Maize | (79.8, 97.6) | 590.6 | |
| Cotton | (90.5, 110.6) | 396.8 | |
| Dry year (2013) | Spring wheat | (34.1, 41.7) | 695.9 |
| Maize | (68.9, 84.3) | 589.8 | |
| Cotton | (76.0, 92.8) | 398.5 |
Table 2.
Basic data of three irrigation districts and crops.
| Irrigation Area | Crop | Acreage/ha | Price/Yuan | Surface Water/×104 m3 | Ground Water/×104 m3 |
|---|---|---|---|---|---|
| CN | Spring wheat | 153.4 | (2.4, 2.7) | 0 | (260, 289) |
| Maize | 530.3 | (2.5, 2.8) | |||
| Cotton | 0 | (7.0, 8.0) | |||
| HH | Spring wheat | 439.7 | (2.4, 2.7) | 0 | (530, 589) |
| Maize | 1214.7 | (2.5, 2.8) | |||
| Cotton | 0 | (7.0, 8.0) | |||
| HYS | Spring wheat | 3764.9 | (2.4, 2.7) | (20180, 22422) | (3231, 3590) |
| Maize | 6868.2 | (2.5, 2.8) | |||
| Cotton | 709.1 | (7.0, 8.0) |
Note: CN: Changning irrigation district; HH: Huanhe irrigation district; HYS: Hongyashan irrigation district.
Table 3.
Explanation of parameters.
| Parameters and Variables | Meaning and Description |
|---|---|
| The credibility level of the event | |
| The upper and lower limits of the parameters | |
| System revenue (×109 Yuan) | |
| Different irrigation areas | |
| Different crop types | |
| Acreage (hm2) | |
| Purchase price (Yuan/kg) | |
| The parameters of the crop water production function | |
| The total amount of surface water in the whole growth period (mm), the decision variables | |
| The total amount of groundwater in the whole growth period (mm), the decision variables | |
| The availability factor of surface water | |
| The availability factor of groundwater | |
| The precipitation during the whole growth period (mm) | |
| Maximum water demand (mm) | |
| Minimum water demand (mm) | |
| The amount of available surface water (m3) | |
| The amount of available groundwater (m3) | |
| The minimum grain demand of per capita (kg) | |
| The total population of research area |
Table 4.
Optimal irrigation water allocation in different scenarios (mm).
| Irrigation District | Typical Year | Irrigation Sources | Irrigation Water Allocation for Different Crops | ||
|---|---|---|---|---|---|
| Spring Wheat | Maize | Cotton | |||
| CN | Wet year | Surface water | 0 | 0 | 0 |
| Groundwater | (267.2, 279.4) | (293.3, 289.8) | 0 | ||
| Normal year | Surface water | 0 | 0 | 0 | |
| Groundwater | (275.9, 286.5) | (290.7, 287.7) | 0 | ||
| Dry year | Surface water | 0 | 0 | 0 | |
| Groundwater | (320.2, 322.8) | (278.0, 277.2) | 0 | ||
| HH | Wet year | Surface water | 0 | 0 | 0 |
| Groundwater | (250.3, 262.2) | (239.1, 234.8) | 0 | ||
| Normal year | Surface water | 0 | 0 | 0 | |
| Groundwater | (258.8, 259.2) | (236.1, 232.3) | 0 | ||
| Dry year | Surface water | 0 | 0 | 0 | |
| Groundwater | (302.2, 304.7) | (220.3, 219.4) | 0 | ||
| HYS | Wet year | Surface water | (459.9, 481.9) | (278.4, 306.4) | (186.4, 212.8) |
| Groundwater | 0 | (130.9, 130.5) | (22.9, 26.7) | ||
| Normal year | Surface water | (486.3, 503.4) | (364.4, 380.0) | (242.1, 282.4) | |
| Groundwater | 0 | (128.7, 130.8) | (44.2, 24.0) | ||
| Dry year | Surface water | (538.8, 546.4) | (374.1, 388.3) | (287.3, 315.7) | |
| Groundwater | 0 | (131.4, 132.6) | (18.4, 6.9) | ||
Table 5.
Comparison of the results from optimal and actual irrigation water allocation.
| Irrigation District | Crop | Irrigation Water Amount | Water Saving Amount | Optimized System Revenue (×108 Yuan) | Actual System Revenue (×108 Yuan) | |
|---|---|---|---|---|---|---|
| Optimization | Actual | |||||
| CN | Spring wheat | (275.9, 286.5) | 410 | (134.1, 123.5) | (3.58, 3.62) | 3.2 |
| Maize | (290.7, 287.7) | 405 | (114.3, 117.3) | |||
| Cotton | 0 | 0 | 0 | |||
| HH | Spring wheat | (258.8, 259.2) | 410 | (151.2, 150.8) | ||
| Maize | (236.1, 232.3) | 405 | (168.9, 172.7) | |||
| Cotton | 0 | 0 | 0 | |||
| HYS | Spring wheat | (486.3, 503.4) | 536 | (49.7, 32.6) | ||
| Maize | (493.1, 510.8) | 563 | (69.9, 52.2) | |||
| Cotton | (286.3, 306.4) | 323 | (36.7, 16.6) | |||
© 2018 by the authors. Licensee MDPI, Basel, Switzerland. This article is an open access article distributed under the terms and conditions of the Creative Commons Attribution (CC BY) license (http://creativecommons.org/licenses/by/4.0/).
Share and Cite
MDPI and ACS Style
Wang, H.; Zhang, C.; Guo, P. An Interval Quadratic Fuzzy Dependent-Chance Programming Model for Optimal Irrigation Water Allocation under Uncertainty. Water 2018, 10, 684. https://doi.org/10.3390/w10060684
AMA Style
Wang H, Zhang C, Guo P. An Interval Quadratic Fuzzy Dependent-Chance Programming Model for Optimal Irrigation Water Allocation under Uncertainty. Water. 2018; 10(6):684. https://doi.org/10.3390/w10060684
Chicago/Turabian StyleWang, Hang, Chenglong Zhang, and Ping Guo. 2018. "An Interval Quadratic Fuzzy Dependent-Chance Programming Model for Optimal Irrigation Water Allocation under Uncertainty" Water 10, no. 6: 684. https://doi.org/10.3390/w10060684
Note that from the first issue of 2016, this journal uses article numbers instead of page numbers. See further details here.