Article

Hydrochemical Characteristics and Multivariate Statistical Analysis of Natural Water System: A Case Study in Kangding County, Southwestern China

1
State Key Laboratory of Geohazard Prevention and Geoenvironment Protection, Chengdu University of Technology, Chengdu 610059, China
2
Guangxi Communications Planning Surveying and Designing Institute Co., Ltd., Nanning 530029, China
3
School of Energy and Power engineering, Xihua University, Chengdu 610039, China
*
Authors to whom correspondence should be addressed.
Water 2018, 10(1), 80; https://doi.org/10.3390/w10010080
Submission received: 16 November 2017 / Revised: 26 December 2017 / Accepted: 11 January 2018 / Published: 19 January 2018
(This article belongs to the Special Issue Water Resources Investigation: Geologic Controls on Groundwater Flow)

Abstract

:
The utilization for water resource has been of great concern to human life. To assess the natural water system in Kangding County, the integrated methods of hydrochemical analysis, multivariate statistics and geochemical modelling were conducted on surface water, groundwater, and thermal water samples. Surface water and groundwater were dominated by Ca-HCO3 type, while thermal water belonged to Ca-HCO3 and Na-Cl-SO4 types. The analyzing results concluded the driving factors that affect hydrochemical components. Following the results of the combined assessments, hydrochemical process was controlled by the dissolution of carbonate and silicate minerals with slight influence from anthropogenic activity. The mixing model of groundwater and thermal water was calculated using silica-enthalpy method, yielding cold-water fraction of 0.56–0.79 and an estimated reservoir temperature of 130–199 °C, respectively. δD and δ18O isotopes suggested that surface water, groundwater and thermal springs were of meteoric origin. Thermal water should have deep circulation through the Xianshuihe fault zone, while groundwater flows through secondary fractures where it recharges with thermal water. Those analytical results were used to construct a hydrological conceptual model, providing a better understanding of the natural water system in Kangding County.

Graphical Abstract

1. Introduction

Water is an incredibly important resource, and has significant uses in agriculture, industry and domestic use. To better utilize it, a number of studies have been conducted to assess water quality [1,2,3,4]. Water quality is determined by the hydrochemistry affected by different hydrochemical processes. Furthermore, hydrochemical processes are determined by natural physical-chemical activities, e.g., ion exchange, mineral dissolution and precipitation, water-rock interaction, and redox transformation [5,6,7].
To date, hydrochemical analysis [8,9], multivariate statistical analysis [10,11], and geochemical modelling [12,13] have proven to be efficient for constraining the hydrochemical process of natural water systems. The ratios of major ions provide critical clues to explain different hydrochemical processes of water resource [14,15]. Principle component analysis (PCA) is useful for analyzing the large hydrochemical dataset, defining the factors controlling hydrochemistry [16,17]. Geochemical modelling using saturation index can specify mineral precipitation and dissolution in natural water system [18,19]. δD and δ18O isotopes are ideal tracers for the source and pathways of groundwater recharge [20,21,22].
Southwestern China is well-known for its abundant water resource, including the Dadu River, Jinsha River and Nu River. The Kangding County is located in southwestern China, and dominated by the Dadu River. However, previous studies were mainly focused on the genesis of thermal water in Kangding County. Qi et al. (2017) achieved a preliminary knowledge of thermal water and discussed the relationship between changing parameters of thermal water and solid tide [23]. Luo et al. (2017) compared the thermal springs in northern and southern Kangding County and evaluated their exploratory potential [24]. Guo et al. (2017) investigated the high-temperature geothermal system using fluid and gas geochemistry [25]. Compared with thermal water, very little knowledge has been achieved on the chemical components of surface water and groundwater and related hydrochemical processes. Moreover, the mixing model between groundwater and thermal water is enigmatic, and has yet to be constrained.
In this study, we investigated the occurrence of fractures, interpreted hydrochemical characteristics, and conducted δD and δ18O isotopic analysis for surface water, groundwater, and thermal water. Then, we attempted to obtain deeper knowledge of the hydrochemical process based on correlations of major ions, PCA analysis and geochemical modelling. Furthermore, the mixing ratio between groundwater and thermal water was evaluated by the silica-enthalpy method. The recharge area of surface water, groundwater, and thermal water was identified by δD and δ18O isotopes. Those analytical results would be helpful to build a hydrological conceptual model for natural water system, providing valuable information for better exploiting water resource in Kangding County.

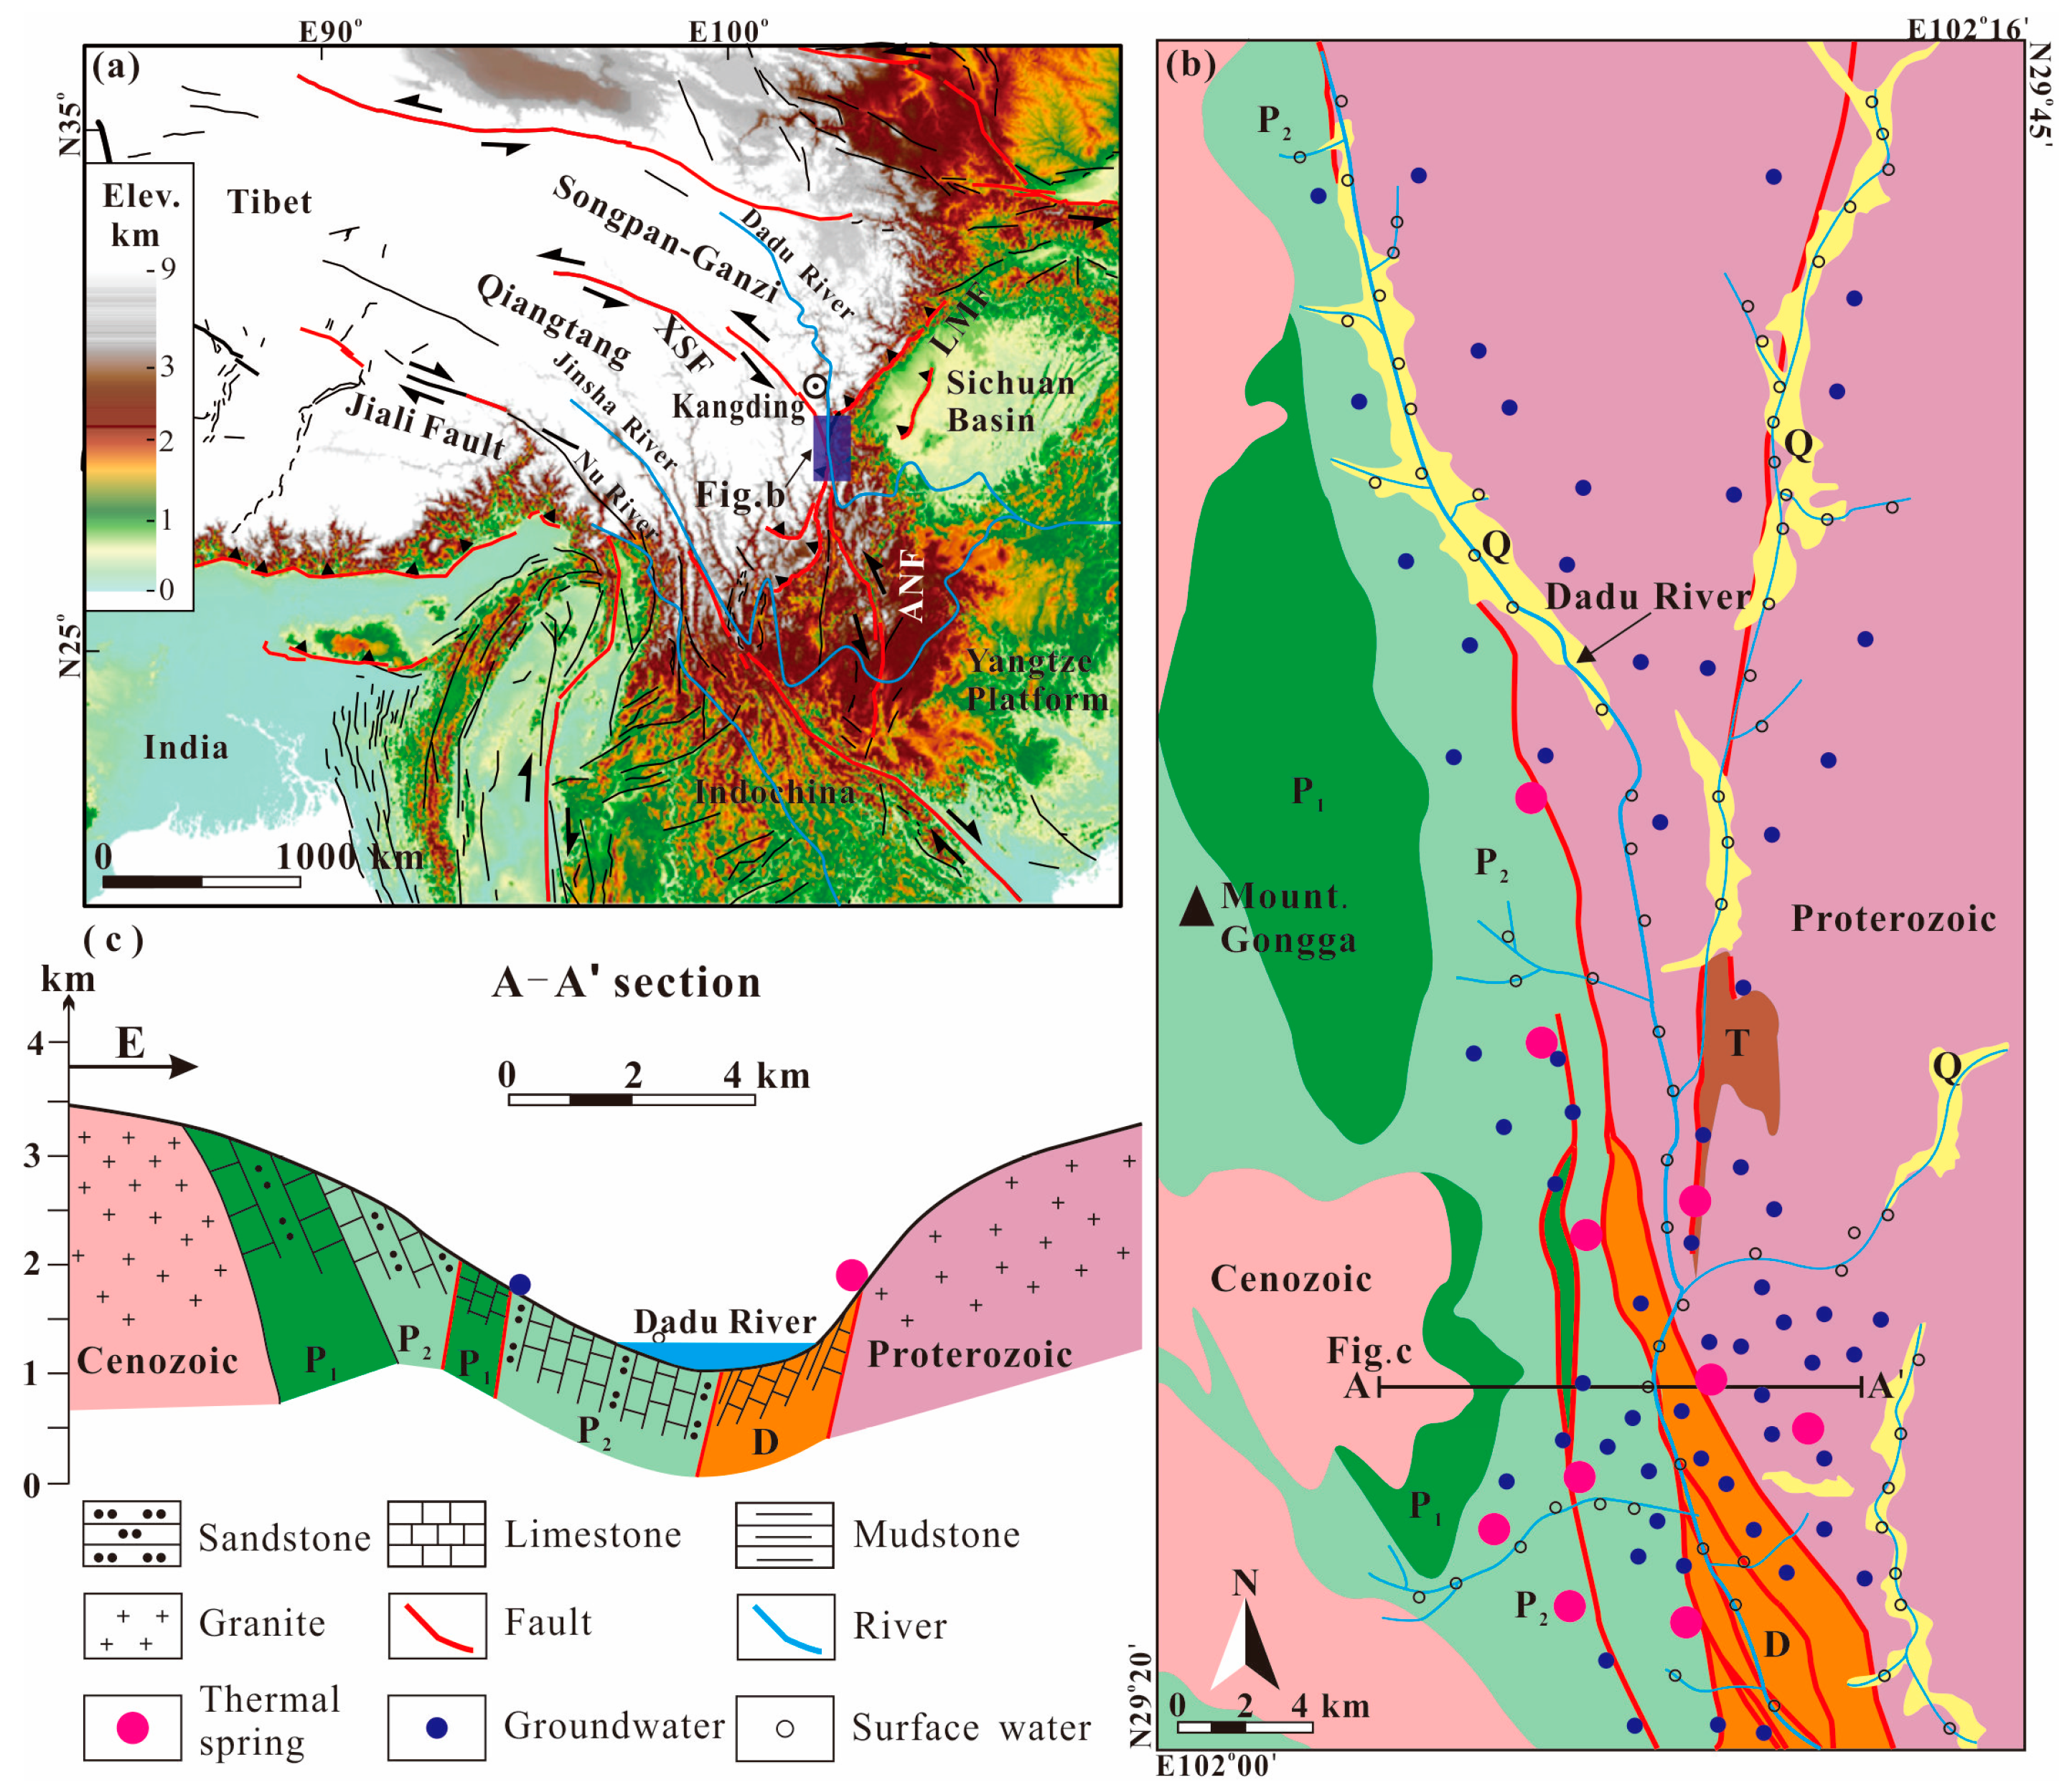
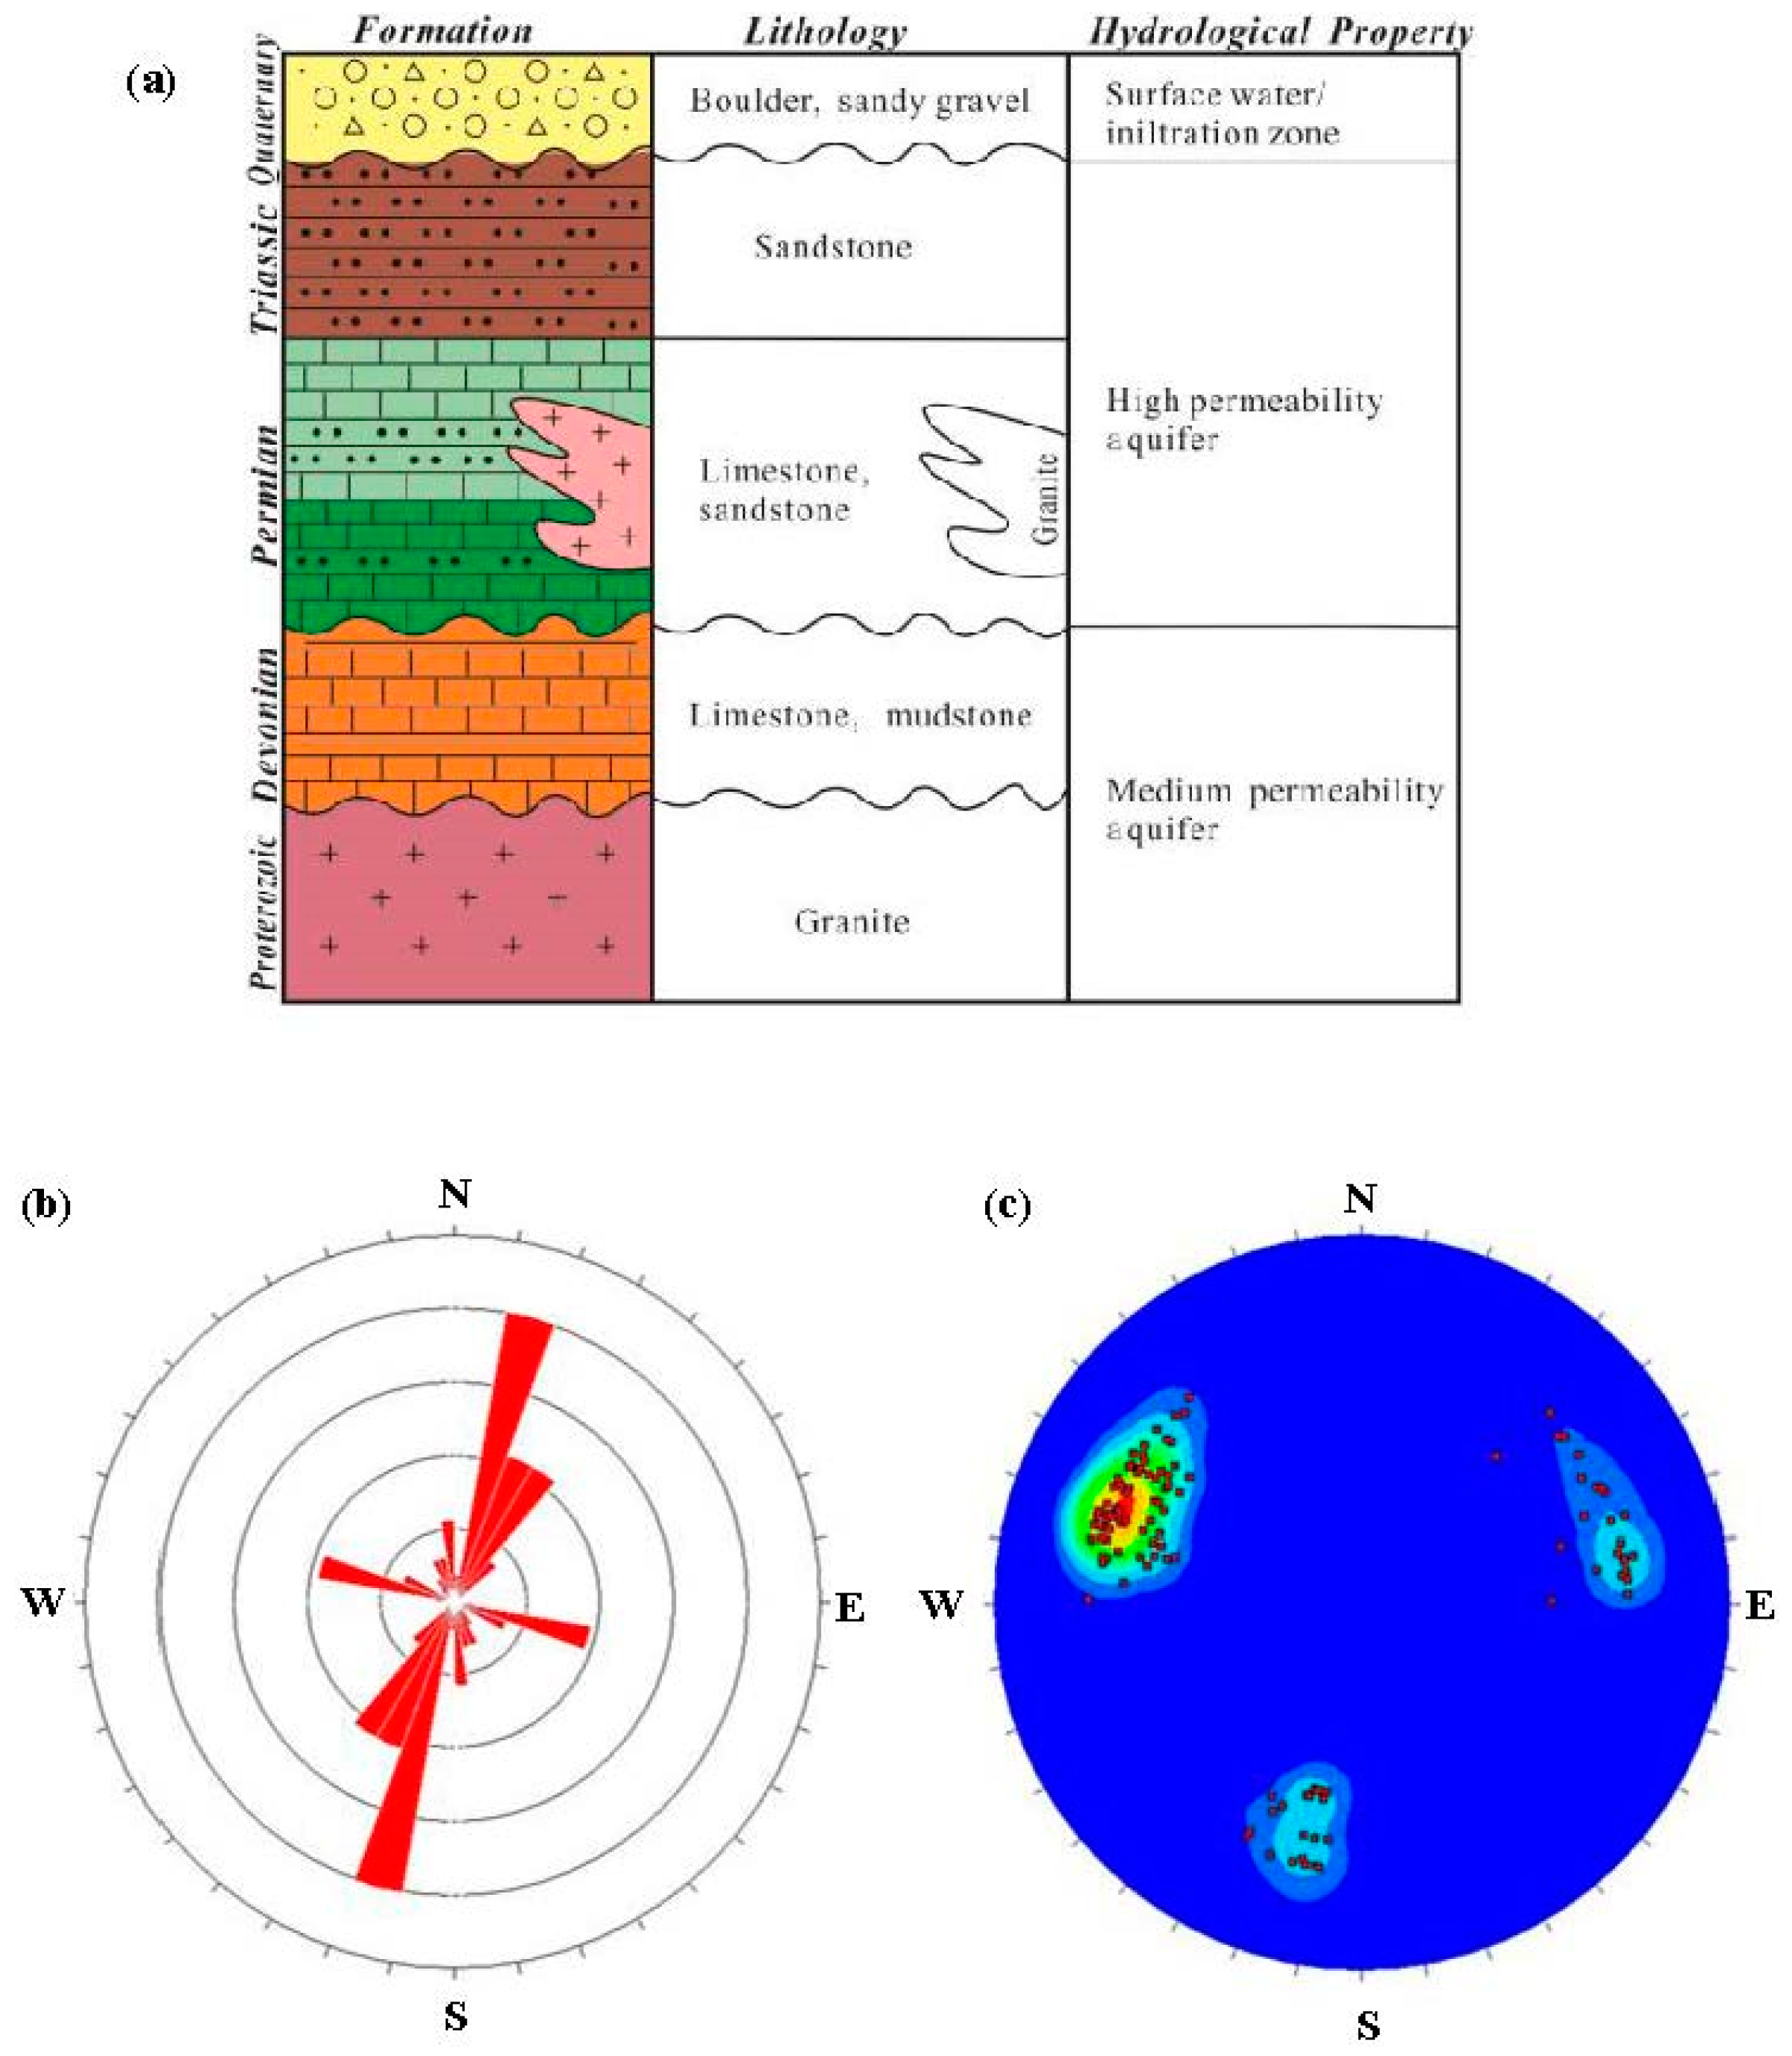
2. Geological Setting

Kangding County is situated in the Sichuan Province, southwestern China. Tectonically, it is located in the eastern margin of Tibet Plateau where three regional fault zones (Xianshuihe (XSF), Anninghe (ANF) and Longmenshan (LMF) fault zones) formed a Y-shape intersection (Figure 1a).
The altitude of Kangding County is generally higher than 1000 m, with the highest elevation of 7556 m (Mount. Gongga). Due to the high-mountain topography and barren environment, anthropogenic activity is rare here. Based on the local meteorological data, annual precipitation and relative humidity are 500–800 mm and 73%, respectively. Annual temperatures range from −14.1 to 29.4 °C (mean = 7.1 °C).
The study area is located in the southern segment of Kangding County. The bedrocks consist of Devonian, Permian, and Triassic sedimentary strata (Figure 1b and Figure 2a). Devonian strata exposed in the south are composed of limestone and mudstone; Permian strata crop in the west and are subdivided into upper and lower Permian strata, consisting of limestone and sandstone; Triassic strata are scarcely distributed in the middle part, dominated by sandstone. Quaternary sediments are locally exposed, including boulder and sandy gravel. Multi-episode magmatic rocks include the Proterozoic granites in the east and Cenozoic granites in the west [26] (Figure 1b). The structures are dominated by the N–S-trending Xianshuihe strike-slip fault that is locally buried by Quaternary sediments [27]. Amounts of NNE-striking secondary fractures are developed along the Xianshuihe fault (Figure 2b,c).
The Dadu River traverses southwardly through Kangding County, fed by a number of streams (Figure 1b). Fractures are extensively distributed in the Triassic sandstone and Cenozoic granite, while karst conduits are developed in the Permian limestone, representing a high permeability aquifer. The less cracked Proterozoic granite and Devonian limestone and mudstone strata represent medium permeability aquifers. Thermal springs are exposed parallel with the Xianshuihe fault, with temperatures over a range of 35 to 81 °C (Local boiling temperature = 89.5 °C) [23,24,25] (Figure 1b,c).

3. Sampling and Methods

Sampling work was conducted in November and December 2012, these months being regarded as the dry season based on local meteorological record. Fifty-three groundwater samples were collected from different cold springs in field crops and fresh rock fractures in tunnels from our study area (Figure 1b). For comparison, 72 surface water samples were collected from the Dadu River and adjacent streams, while 15 rain samples were collected. Additionally, 10 thermal water samples were collected from different thermal springs. 550-mL polyethylene bottles were used to collect water samples. Prior to sampling, these bottles were washed and rinsed at least three times. Hydrochemical analysis of the water samples was performed within 10 days in the State Key Laboratory of Geohazard Prevention and Geo-environment Protection, Chengdu University of Technology. HCO3 was determined by Gran titration with 0.025 N HCl. Cation samples were preserved with concentrated reagent HCl to pH < 1.0. Cations (Na+, K+, Ca2+, Mg2+) were analyzed by Inductively Coupled Plasma Optical Emission Spectrometry (ICP-OES, ICAP6300)and anions (Cl, SO42−) by DIONEX-500 ion chromatograph (ICS-1100), respectively. Quality measurement for hydrochemical data was tested by ionic balance error (better than ±10%, calculated by Aquachem 3.7 software). δD and δ18O isotopes were measured in the Institute of Karst Geology, Chinese Academy of Geological Science, using a mass spectrometer (MAT253). The δD and δ18O analytical precision was better than 1‰ and 0.1‰, respectively.
Phreeqc 3 software was applied to calculate saturation index (SI), based on the MINTEQ database [28]. The SI values of major minerals, containing calcite, dolomite, gypsum, and halite, were calculated to evaluate the chemical equilibrium between minerals and water in nature environment.
Multivariate statistical analysis was carried out using SPSS 20 software. The correlation matrix based on the Pearson’s correlation coefficient was used for showing relationships between those variables, with a range of values from −1 to +1. Values close to +1 present strong positive correlation, while values approximate to −1 imply strong negative correlation. Values equal to 0 mean no linear correlation. Principle Component Analysis (PCA) was conducted to analyze the relationship between the variables and evaluate the factors affecting hydrochemical components.

4. Results and Discussion

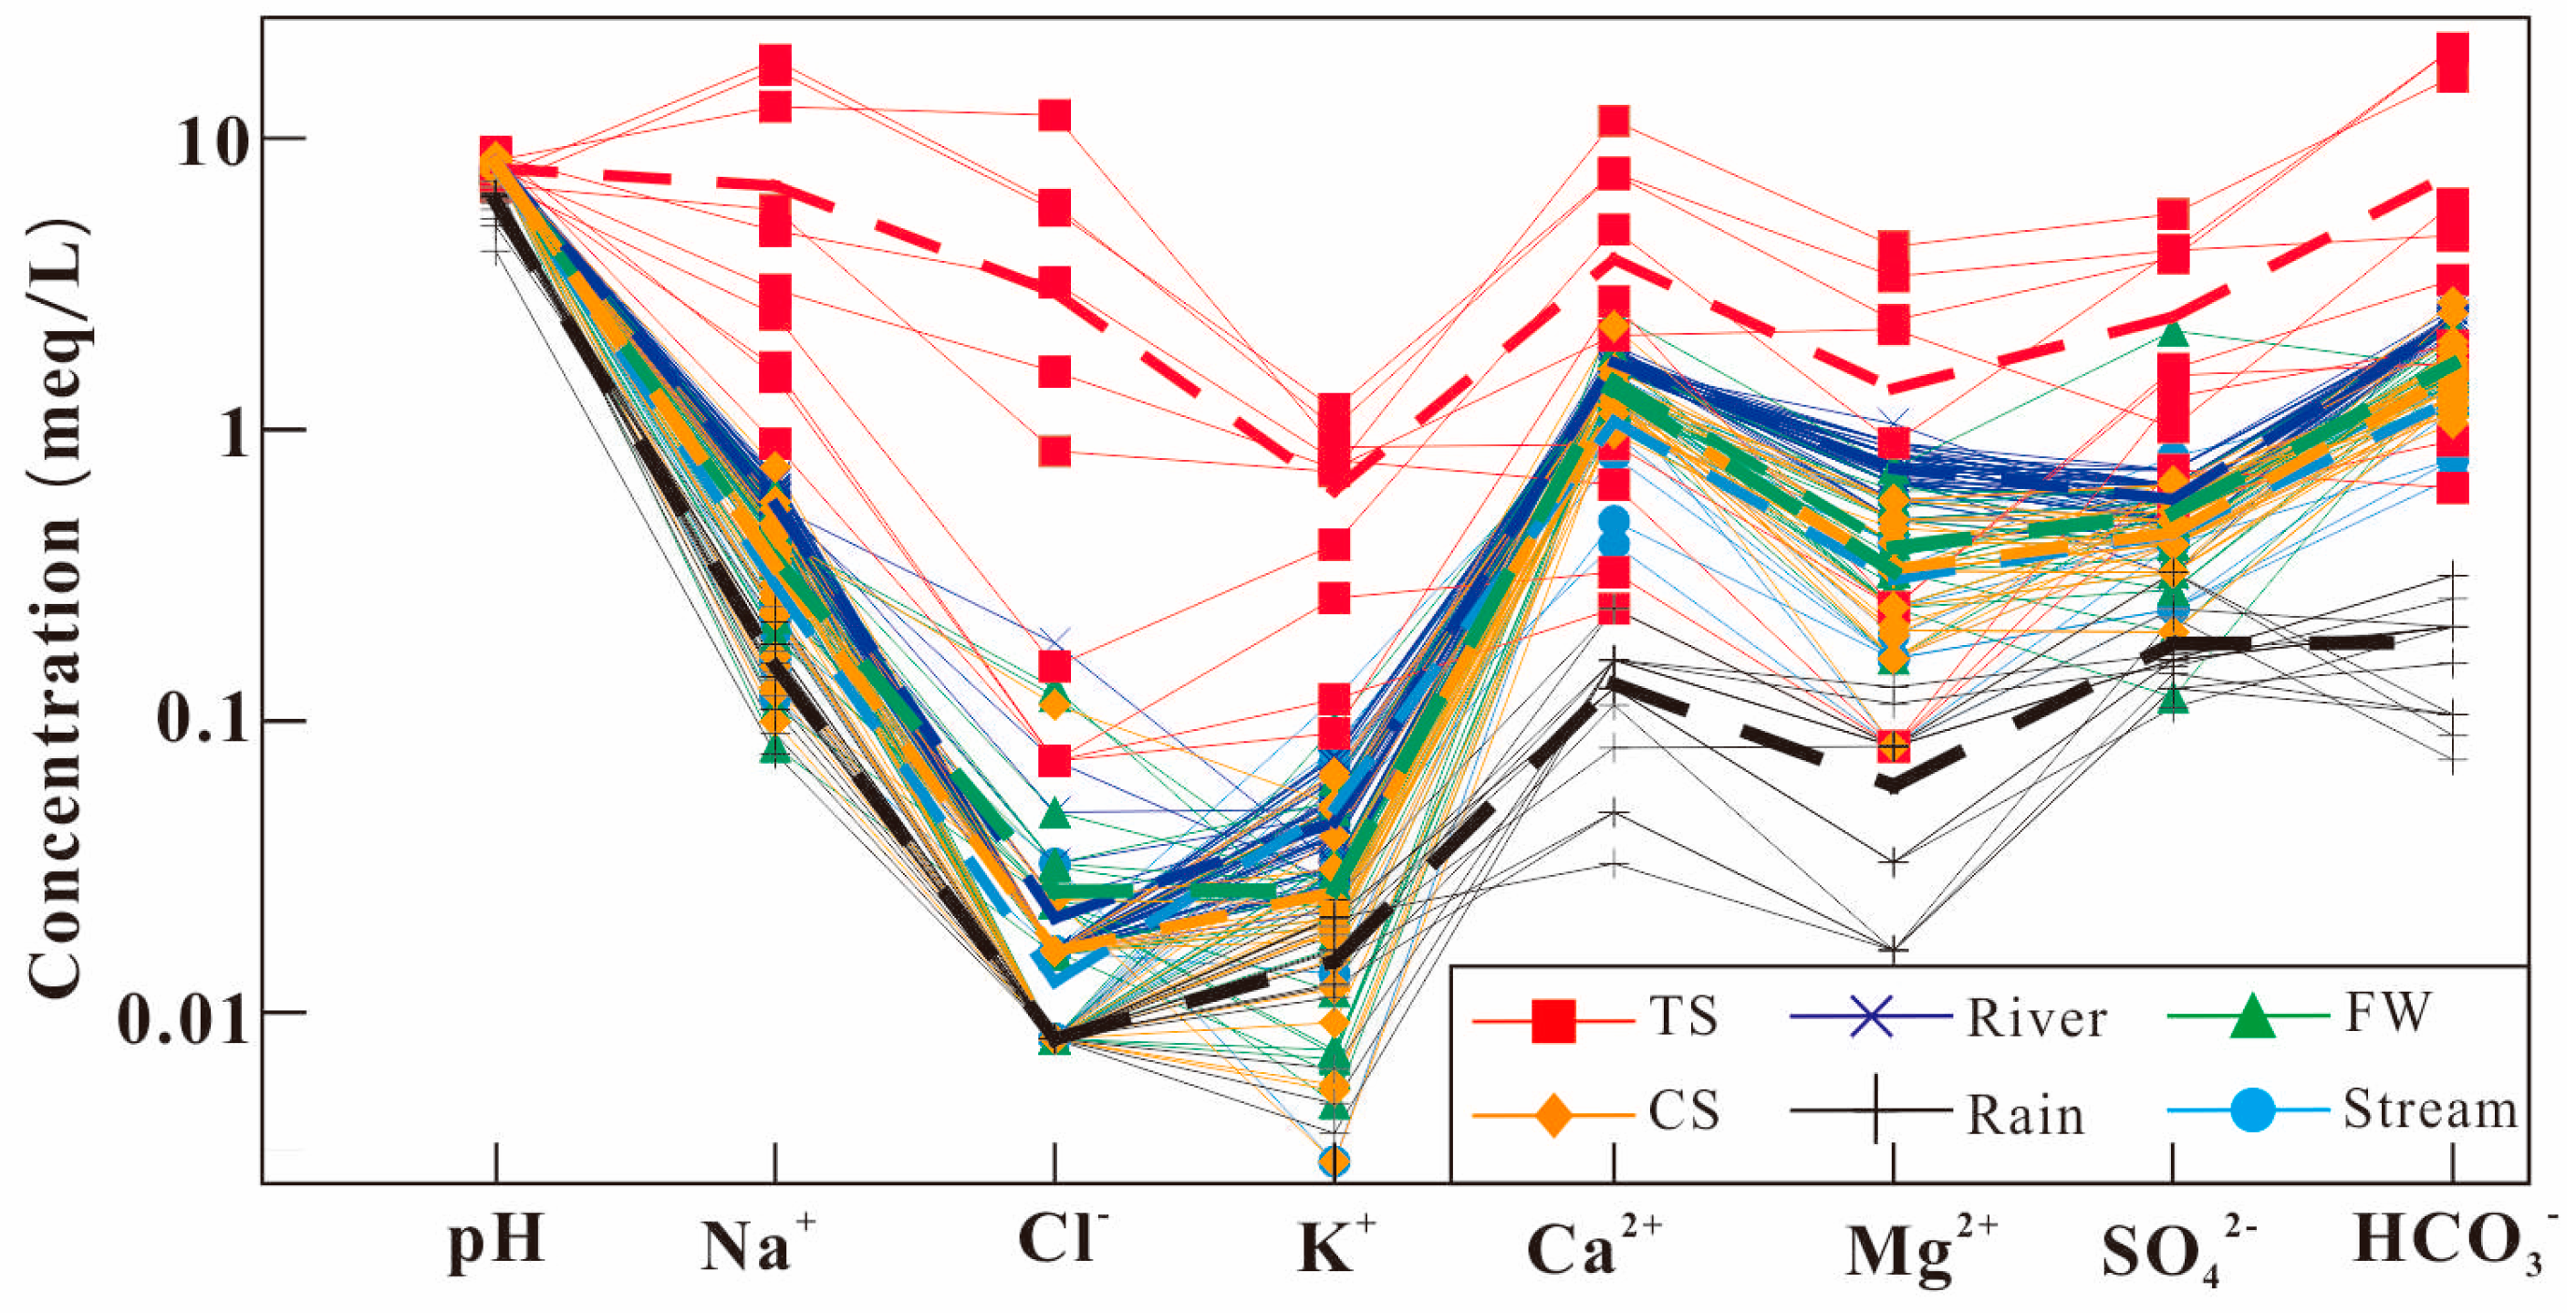
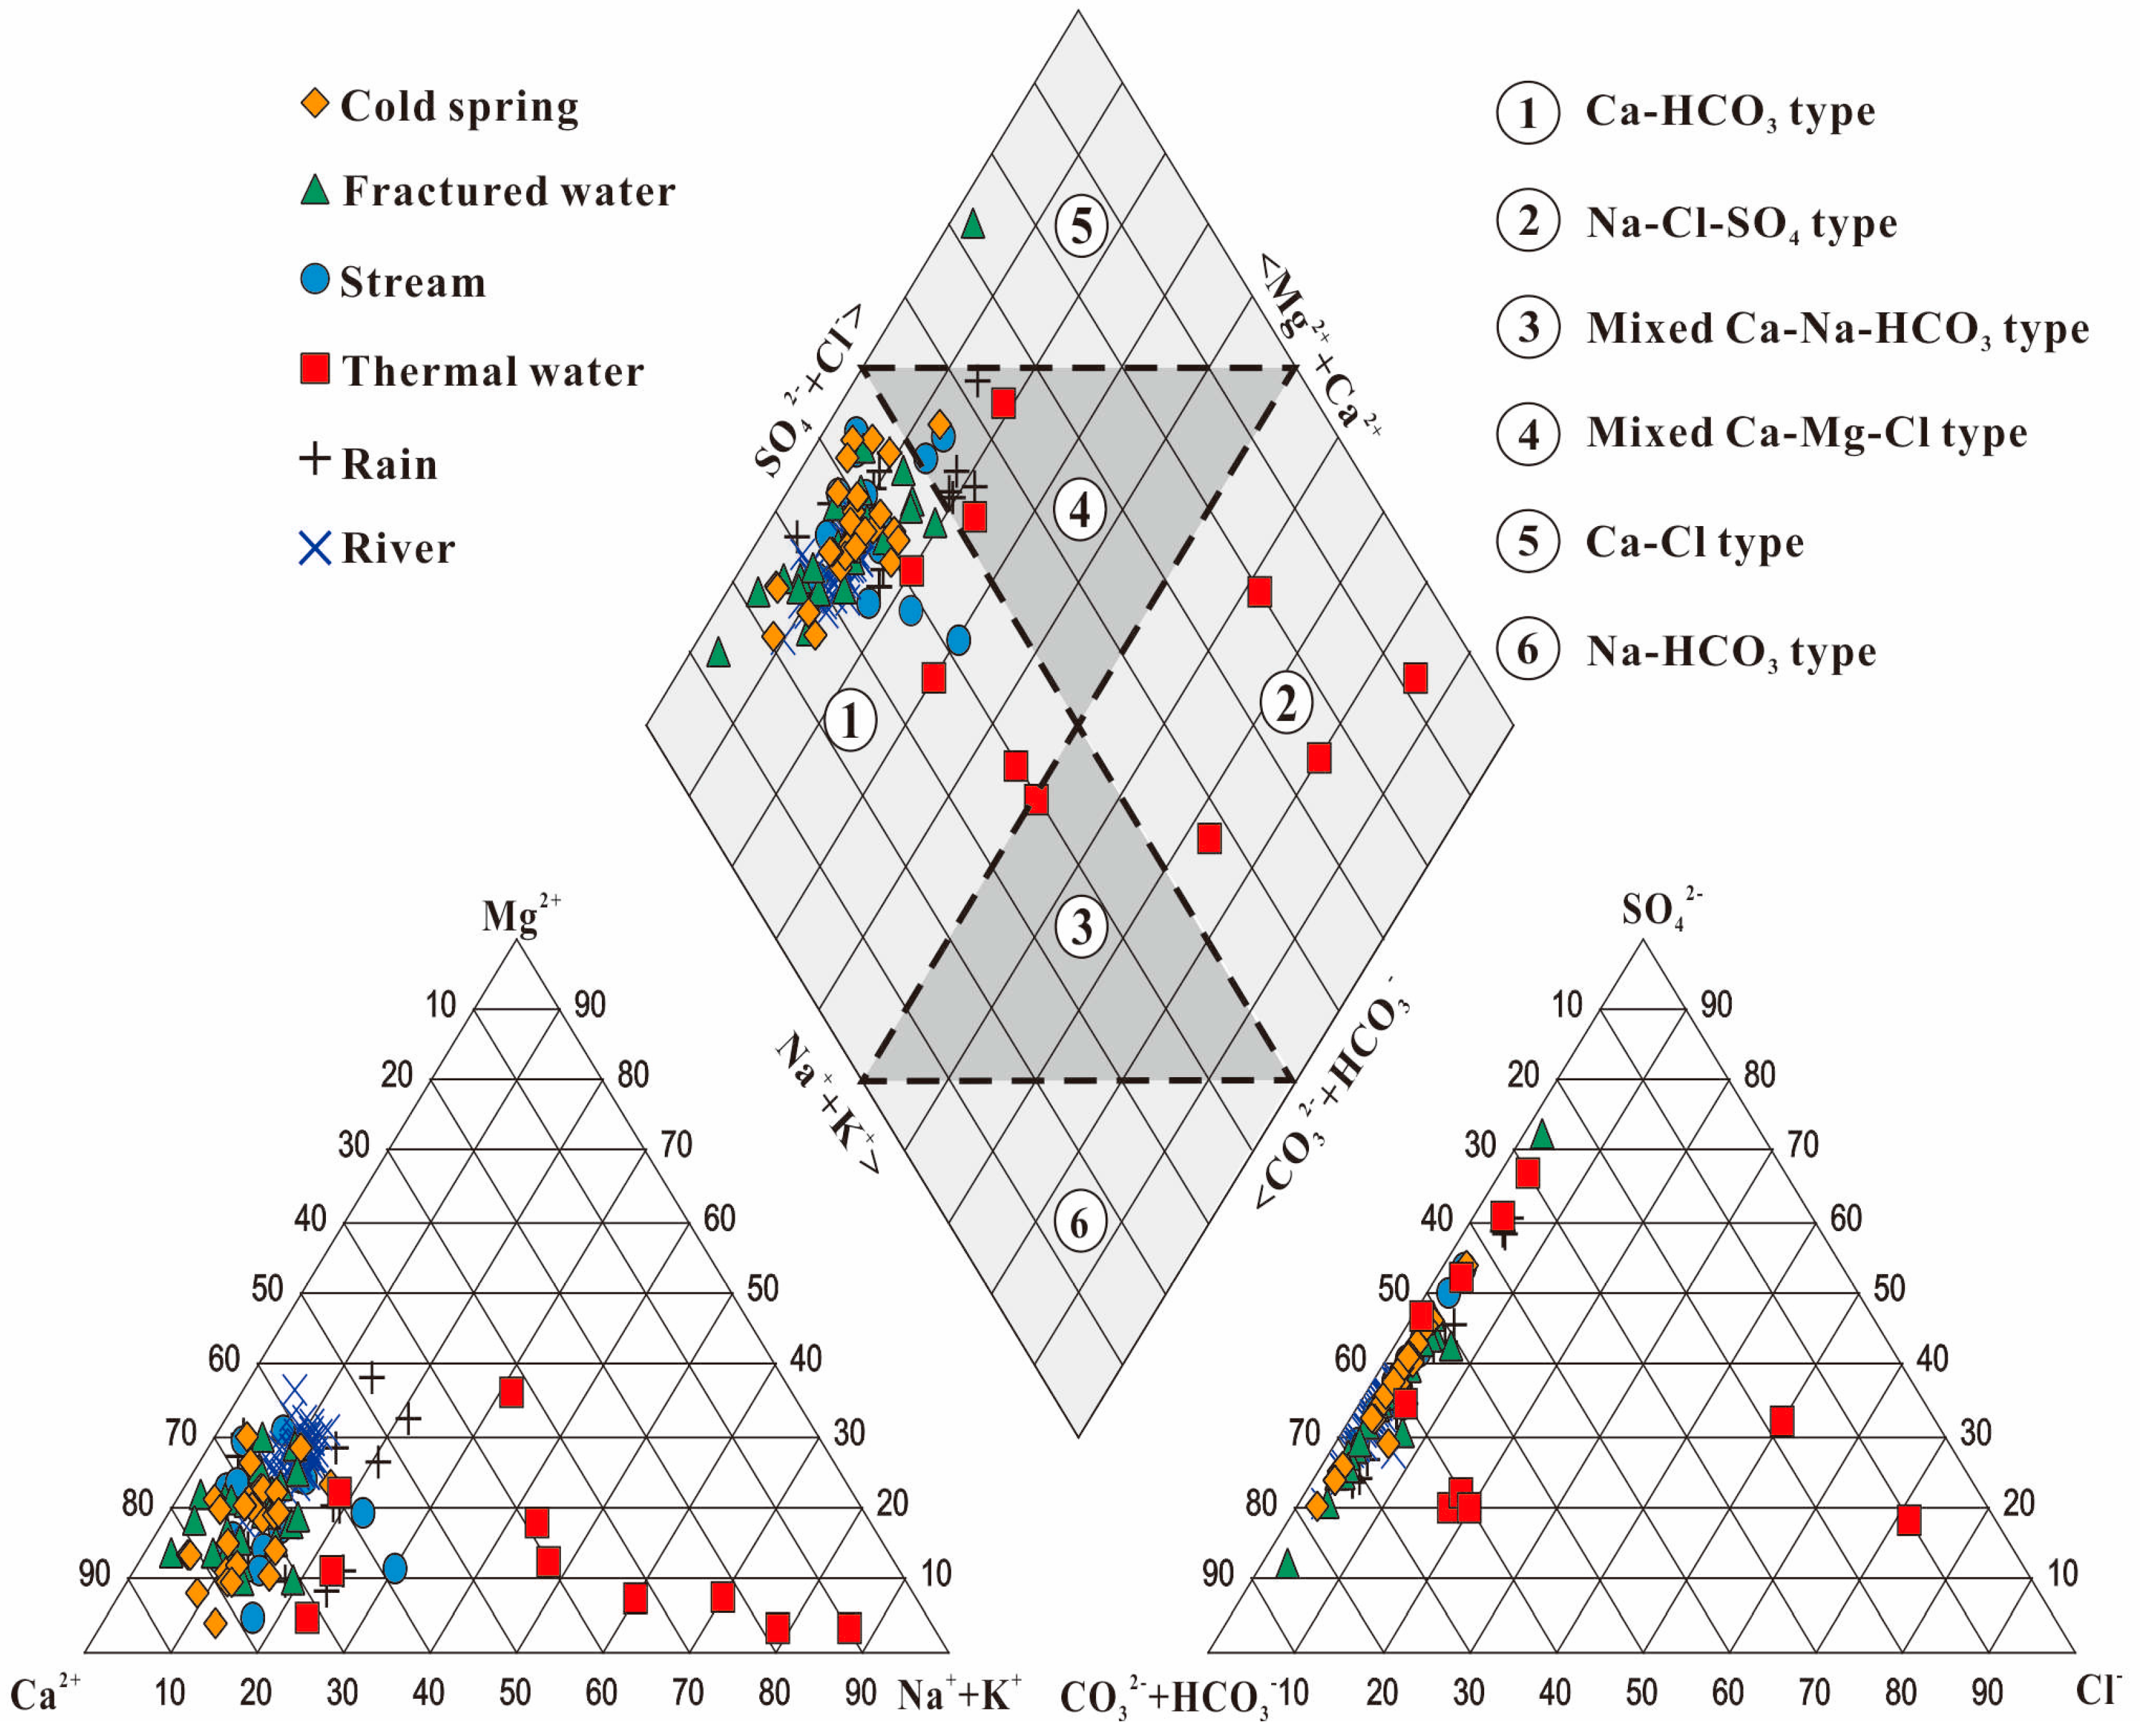
4.1. Hydrochemical Characteristics of Water Samples

Surface water (stream, river), groundwater (fractured water, cold spring), thermal water and rain samples were classified, as shown in Table S1. The Schöeller diagram for those samples is illustrated in Figure 3, indicating the variations of physicochemical parameters.
The surface water and groundwater are neutral to alkaline in nature and have similar chemical compositions, whereas thermal water contains higher concentrations of major ions (Figure 3). The total dissolved solid (TDS) values of surface water, groundwater, and thermal water are 52.2–177.1 mg/L, 82.2–227.4 mg/L, and 104.6–1666.9 mg/L, respectively. In the most water samples, the anions are dominated by HCO3 with abundance order of HCO3 > SO42− > Cl, while the main cation is Ca2+, with abundance order of Ca2+ > Na+ > Mg2+ > K+. Piper’s diagram illustrates the scatter plots of the cations (Na+ + K+, Ca2+, and Mg2+) and anions (HCO3, Cl and SO42−), classifying the hydrochemical characteristics [29]. Herein, two main water types have been identified; most water samples were concentrated on the field of Ca2+-HCO3, whereas a few thermal water samples were plotted on the field of Na+-Cl-SO42 (Figure 4). The greater concentrations of major ions and higher TDS values of thermal water suggest a longer residence time and stronger water-rock interaction.

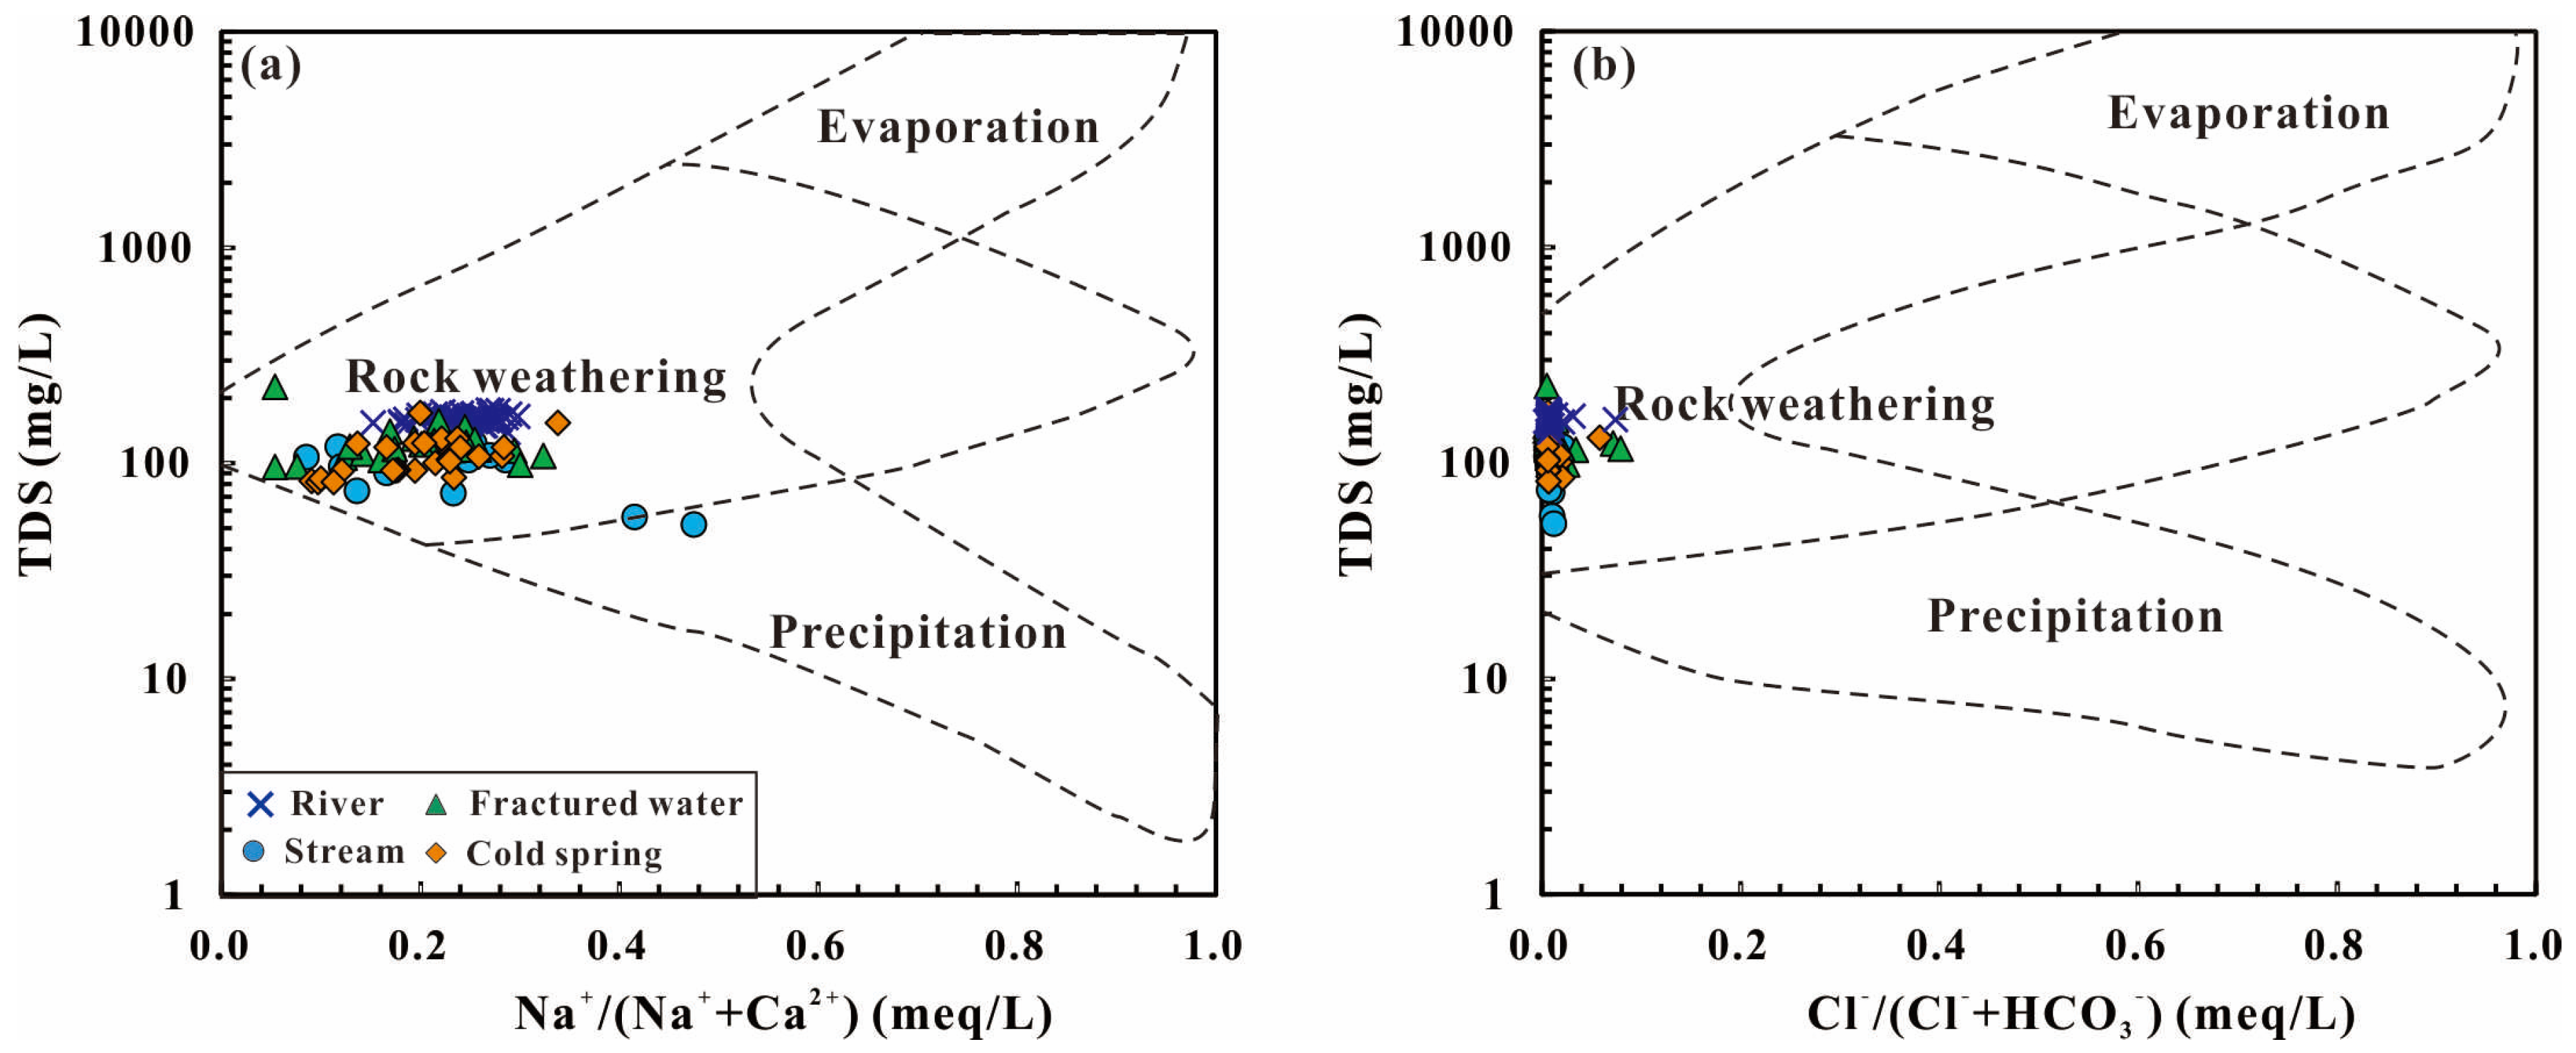
4.2. Hydrochemcial Process of Surface Water and Groundwater

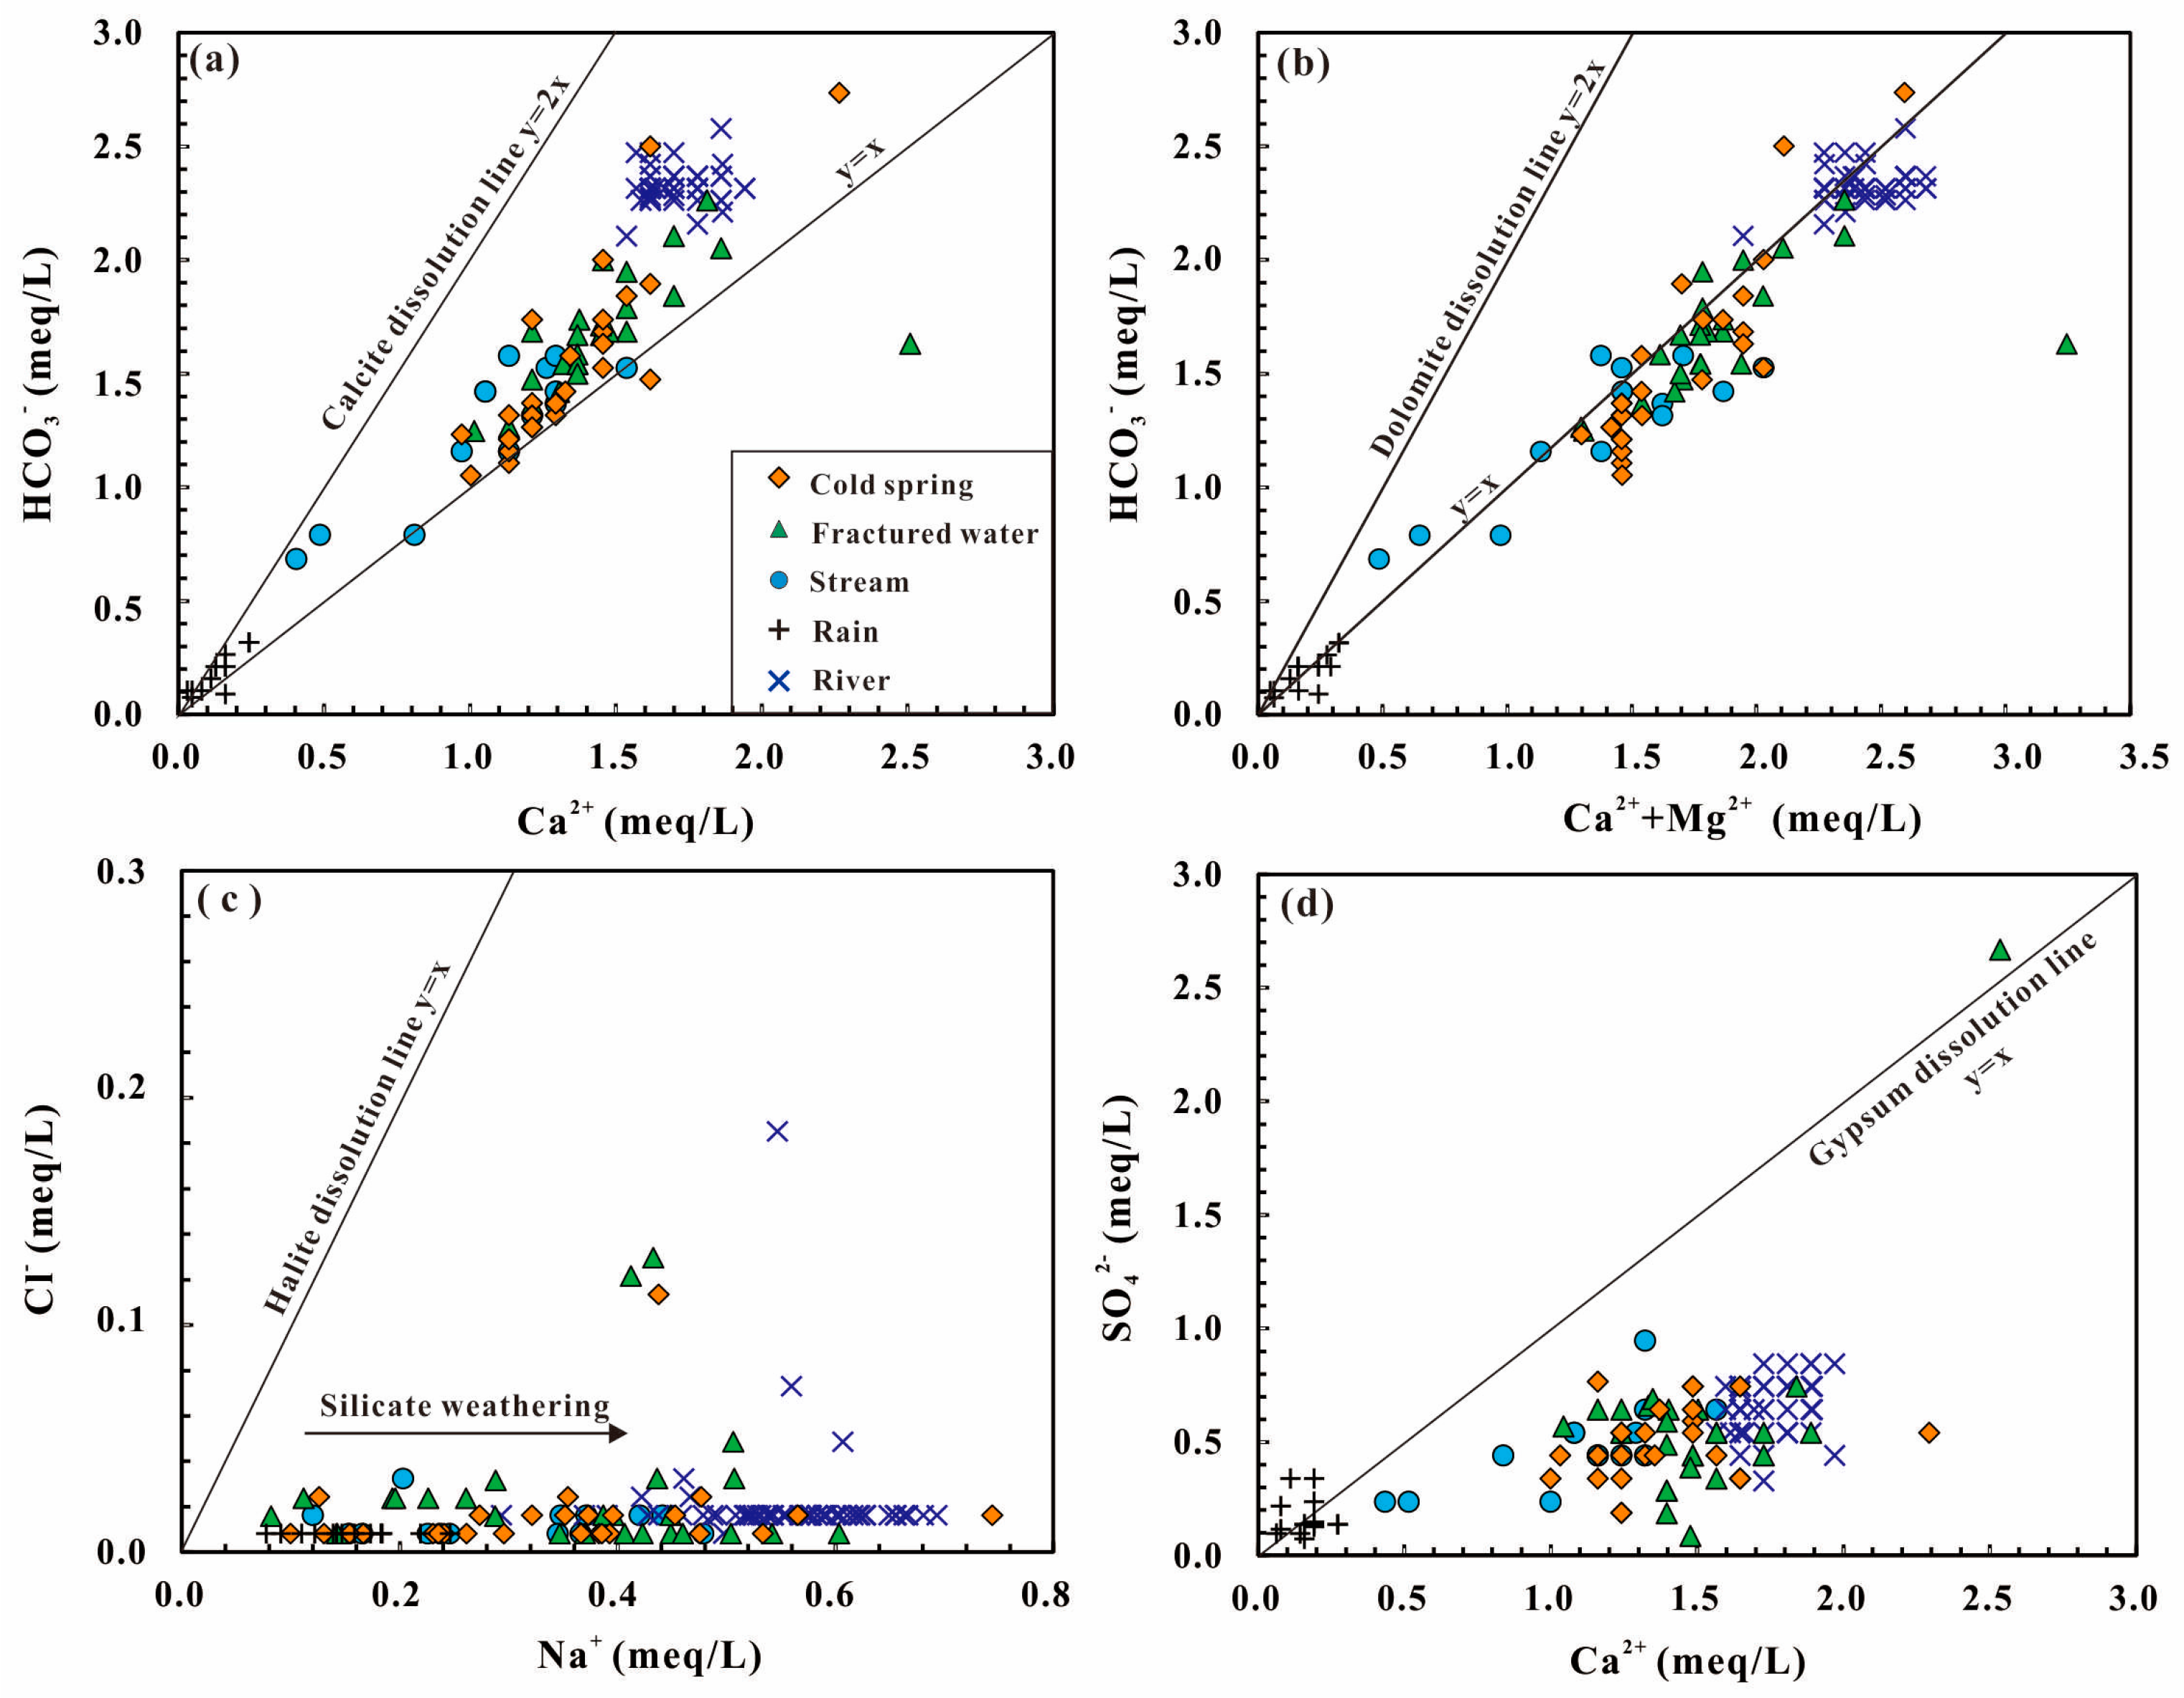
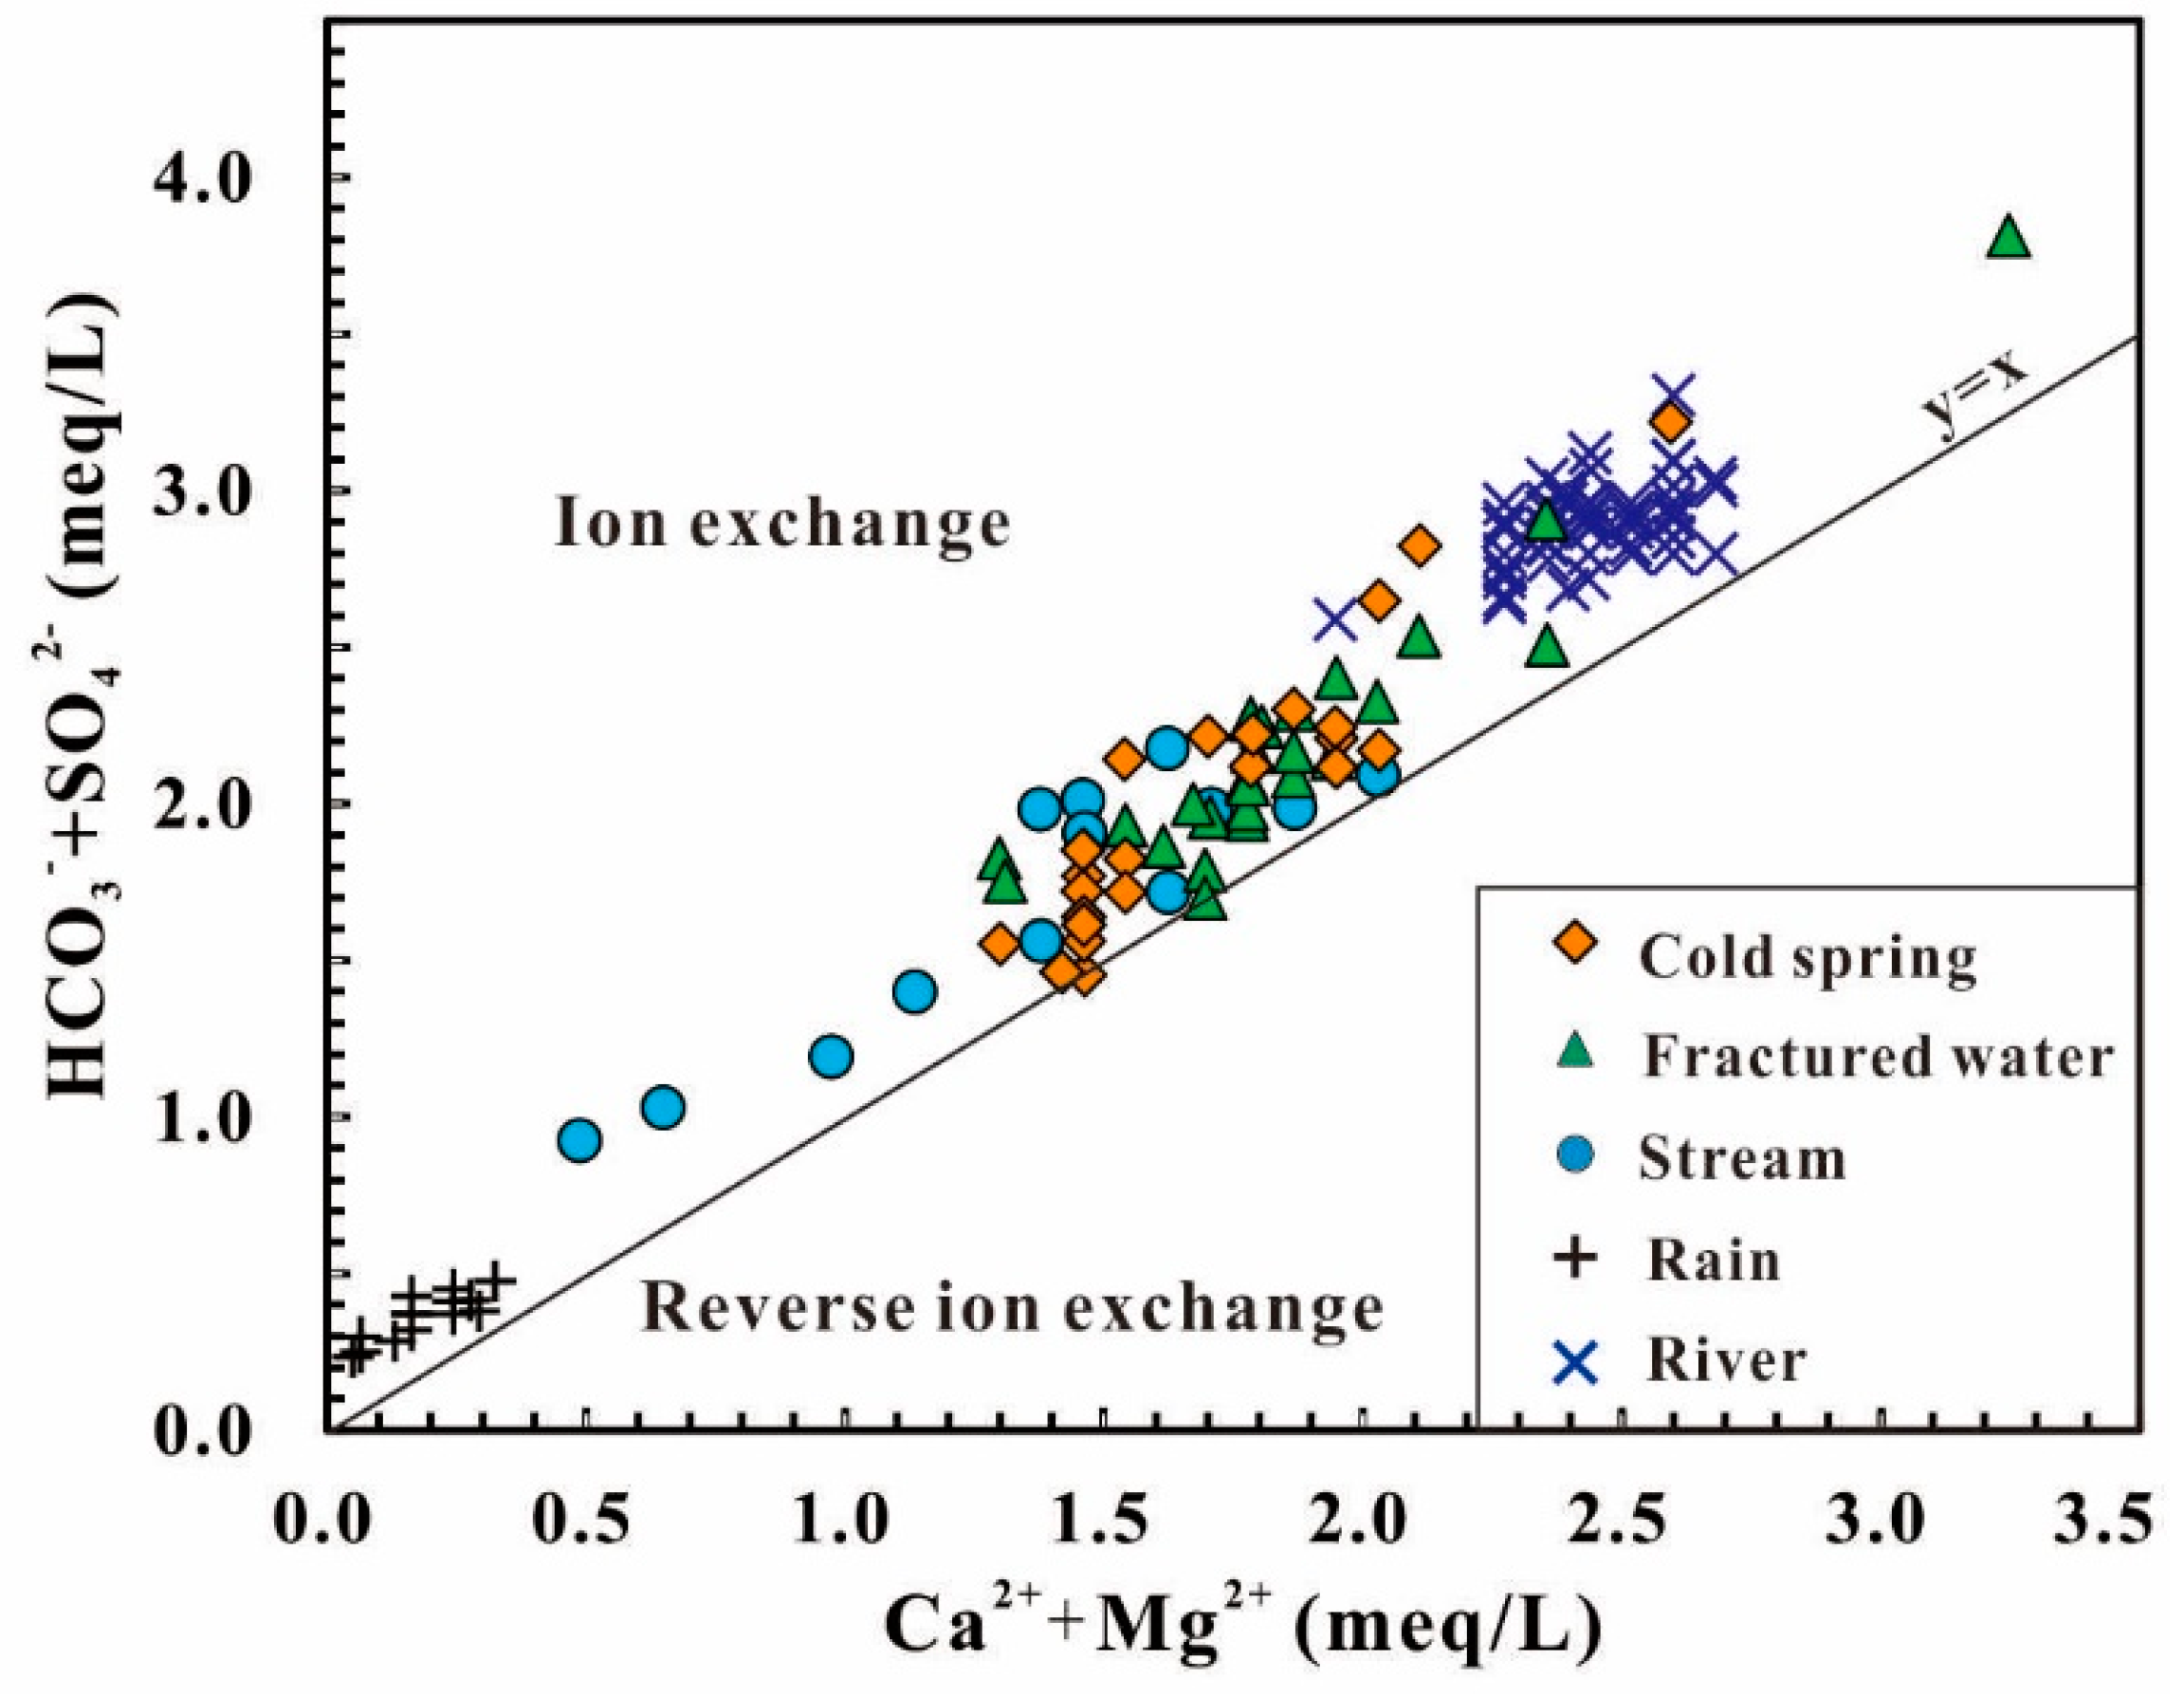
4.2.1. Correlation of Major Ions

The soluble ions of groundwater can be sourced from a variety of natural processes, such as precipitation, evaporation, and water-rock interaction. A Gibbs diagram is used to distinguish the effects of these different processes [30]. In the Gibbs TDS versus Na+/(Na+ + Ca2+) and Cl/(Cl + HCO3) diagrams, the majority of the samples plotted in the field of rock weathering (Figure 5), indicating water-rock interaction is the main factor controlling dissolved hydrochemical components of water samples.
The concentrations of major ions and their correlation give insight to the hydrochemical process triggered by water-rock interaction [31]. Due to the major water type of Ca2+-HCO3, the dissolution of carbonate minerals (calcite and dolomite) should be responsible for the source of Ca2+ and HCO3 in water, as shown in the following Equations (1) and (2).
CaCO3 (calcite) + H2CO3 → Ca2+ + 2HCO3
CaMg(CO3)2 (dolomite) + 2H2CO3 → Ca2+ + Mg2+ + 4HCO3
Based on the Equations (1) and (2) above, the dissolution of calcite and dolomite would produce the Ca2+/HCO3 and (Ca2+ + Mg2+)/HCO3 molar ratio of 0.5. In this study, the Ca2+/HCO3 ratios of most samples were between 0.5 and 1 (Figure 6a), while (Ca2+ + Mg2+)/HCO3 ratios were greater than 1 (Figure 6b). Hence, the excess concentrations of Ca2+ and Mg2+ should be affected by other hydrochemical processes rather than sole dissolution of carbonates (calcite and dolomite). Moreover, the Ca2+/Mg2+ molar ratio is used to clarify the dissolution of carbonates [3]. A Ca2+/Mg2+ molar ratio below 1 triggers dissolution of dolomite, whereas a Ca2+/Mg2+ molar ratio higher than 1 indicates the dissolution of calcite. Additionally, a Ca2+/Mg2+ molar ratio greater than 2 can be the result of the dissolution of silicate minerals. Most samples had Ca2+/Mg2+ molar ratios largely greater than 2 in this study. Therefore, we can infer Ca2+ concentration should be affected by the dissolution of silicate minerals as well.
If Na+ is derived from the dissolution of halite, the Na+/Cl molar ratio generally is equal to 1. However, the Na+/Cl molar ratio of water samples are much higher than 1, implying the excess Na+ concentration is derived from silicate weathering (Figure 6c). In addition, the low Cl concentration is consistent with the absence of Cl-bearing minerals in Kangding County. The Ca2+ and SO42− concentrations of groundwater are controlled by gypsum dissolution and precipitation processes, which are shown in Equation (3) below.
CaSO4·2H2O ⇄ Ca2+ + SO42− + 2H2O
In the condition of simple gypsum dissolution and precipitation, the ratio between Ca2+ and SO42− would be 1:1. The plots are distinctly below 1:1 line in Ca2+ versus SO42− diagram (Figure 6d), implying a majority of enriched Ca2+ that would be produced from dissolution of carbonates and silicate minerals. The deficient SO42− concentration suggests a weak effect from anthropogenic activity.
The Ca2+, Mg2+, HCO3 and SO42− would be derived from the dissolution of carbonates and sulfate minerals when the plots follow the 1:1 line in the (Ca2+ + Mg2+) versus (HCO3 + SO42−) diagram. Furthermore, the plots above the 1:1 line suggest ion exchange as dominant process (4), while the plots below the 1:1 line indicate existence of reverse ion exchange (5).
Ion exchange: 2Na+-Clay + Ca2+ → 2Na+ + Ca2+-Clay2
Reverse Ion exchange: Ca2+-Clay2 + 2Na+ → Ca2+ + 2Na+-Clay
Most samples plotted above the 1:1 line of (HCO3 + SO42−)/(Ca2+ + Mg2+) ratio (Figure 7). The (Ca2+ + Mg2+) concentrations are slightly deficient compared with HCO3 and SO42−. As the dominated cation, Ca2+ is more preferable than Mg2+. Considering Equations (4) and (5), we can assume the deficiency of Ca2+ is due to ion exchange process that is a significant result from silicate weathering.

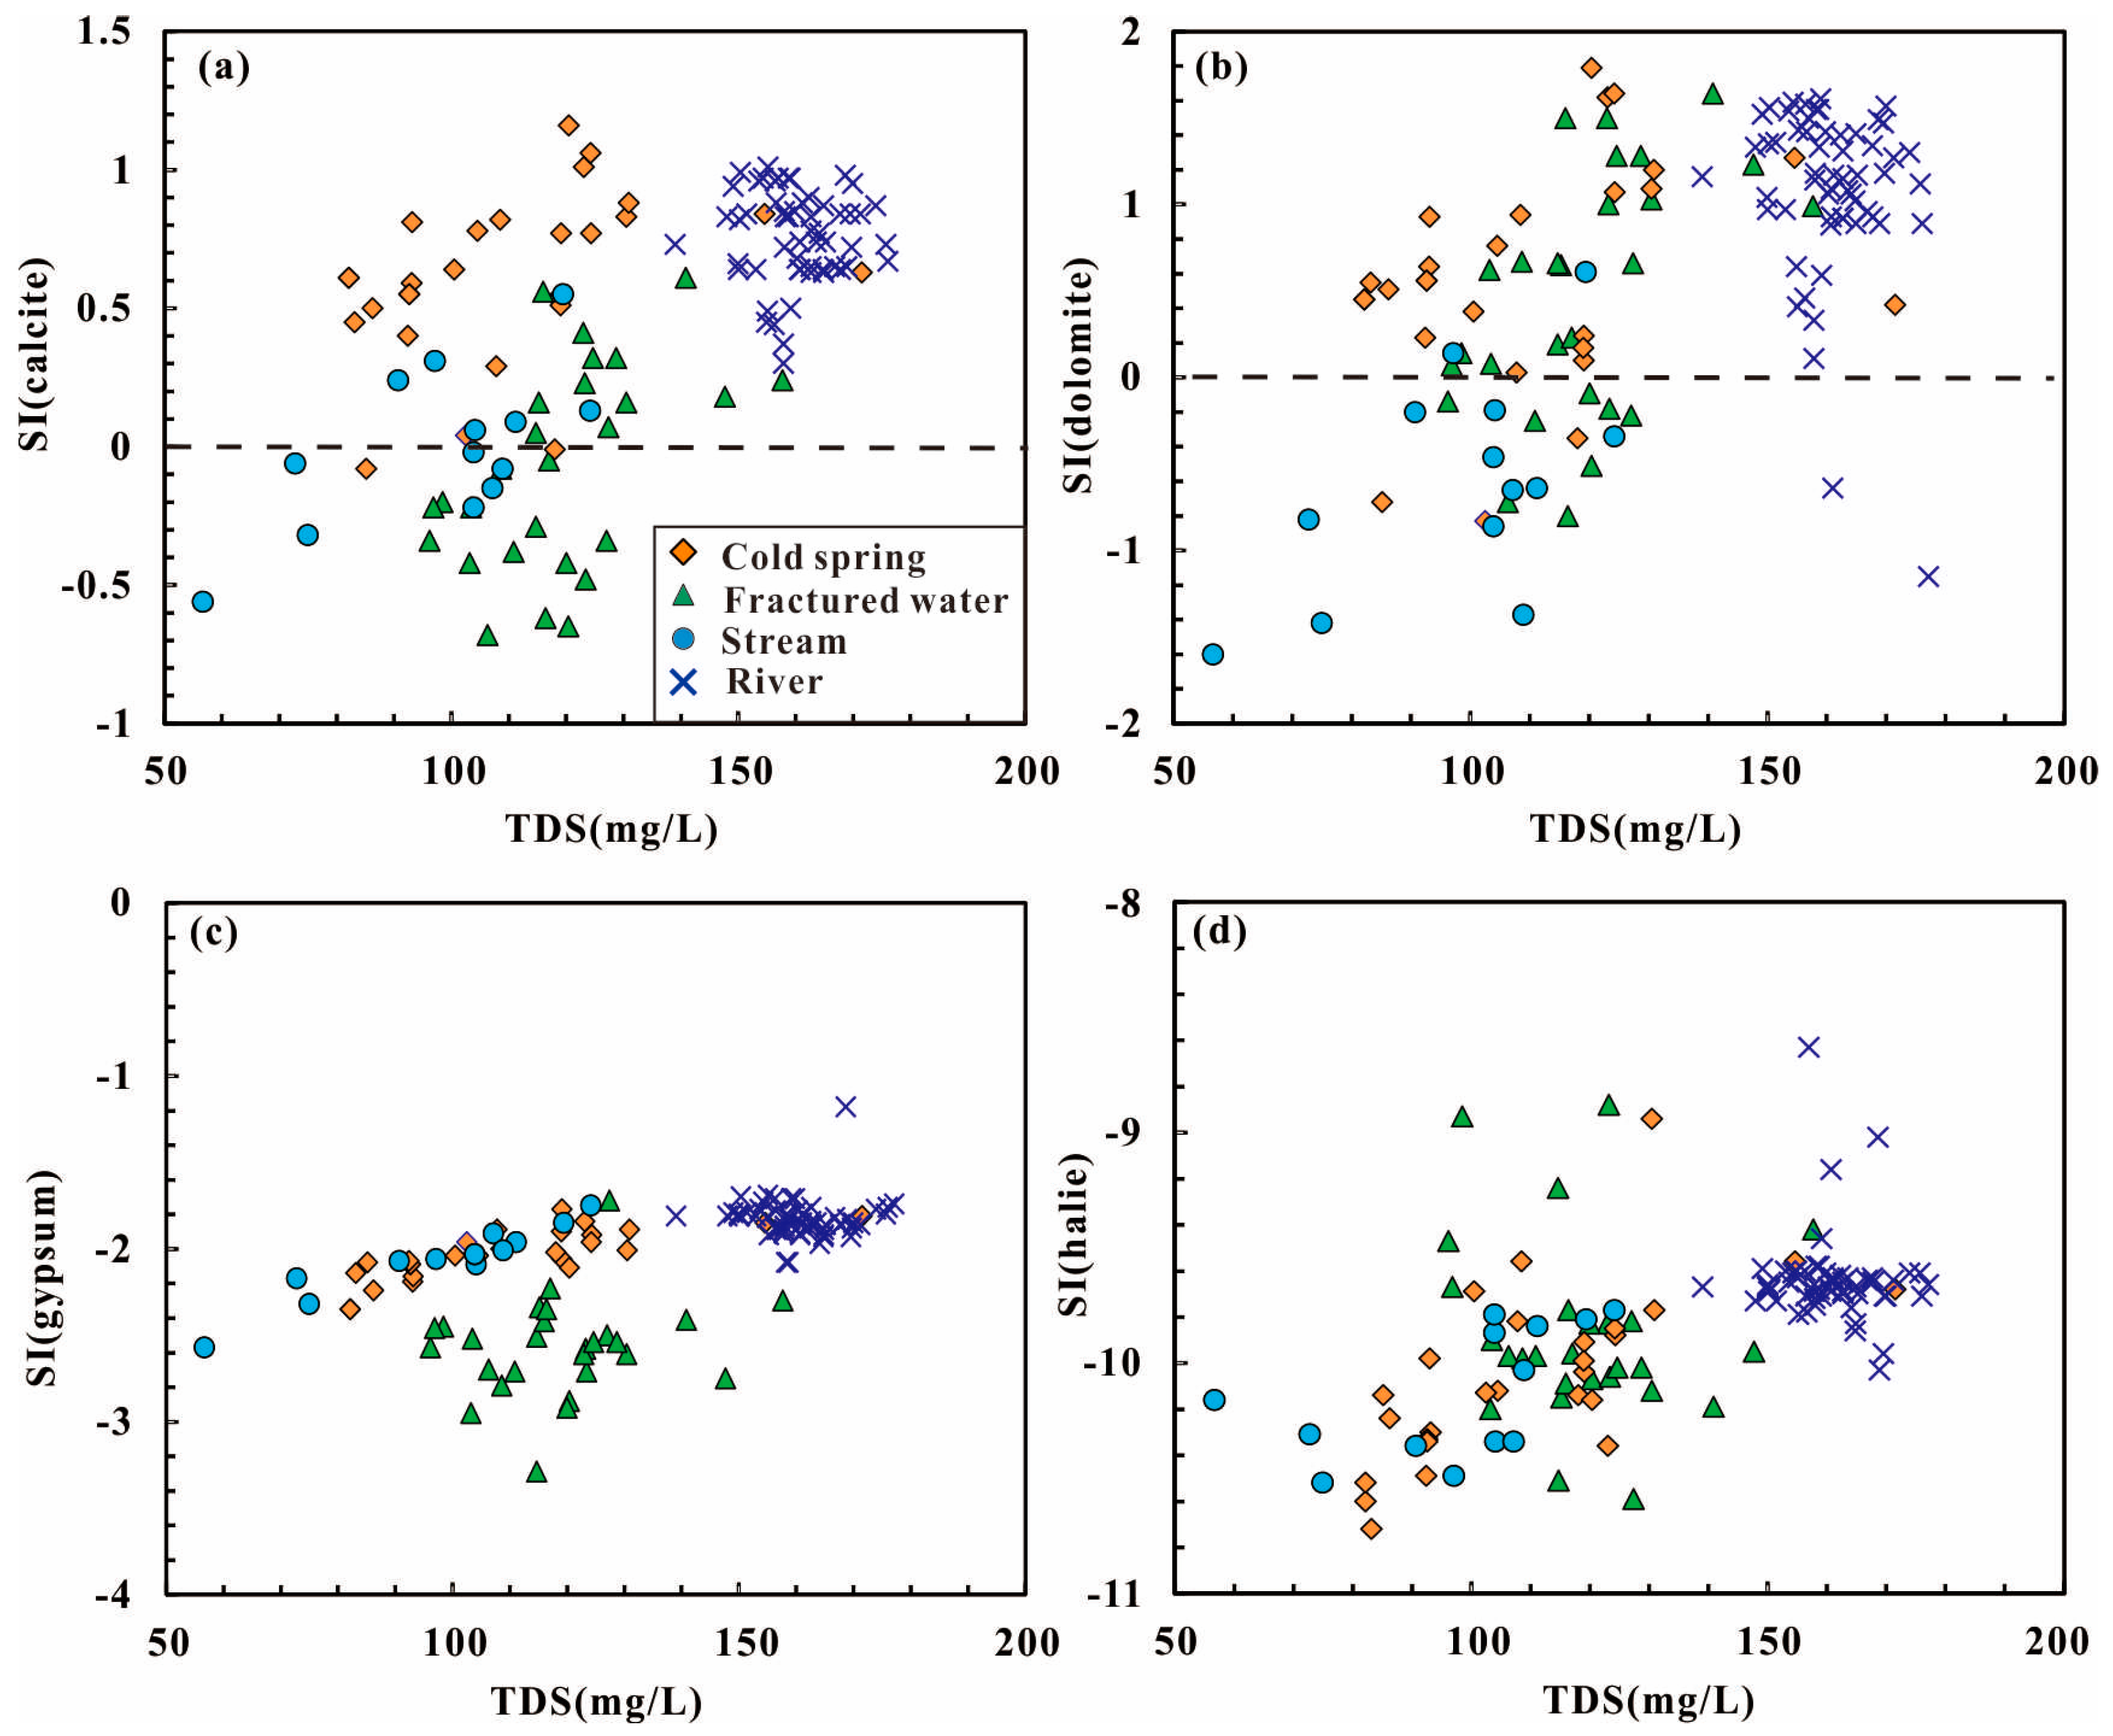
4.2.2. Mineral Saturations

During the process of water-rock interaction, the mineral equilibrium calculation can reflect the thermodynamic process of natural water system [12,13]. Moreover, SI gives an insight of the reactivity of minerals. Herein, SI values of water samples were calculated using Phreeqc 3 software, based on Equation (6) below:
SI = log (IAP)/K
where IAP is the Ion Activity Product, K is the equilibrium constant. Positive SI values (SI > 0) show mineral oversaturation and precipitation, whereas negative SI values (SI < 0) imply minerals under saturation and dissolution. The calculated results for surface water and groundwater samples are listed in Table S1. Most water samples yielded similar SI calculated results as follows: calcite and dolomite were slightly undersaturated to oversaturated, gypsum was weakly under saturated, and halite was strongly under saturated (Figure 8). Those calculated results propose that water-rock interaction had not reached to equilibrium yet in the surface water and groundwater of Kangding County. In Equation (3), abundant Ca2+ released from the dissolution of calcite will hamper the solubility of CaSO4·2H2O, leading to the under saturation of gypsum. The absence of Cl-bearing minerals would account for the low SI values of halite. Due to the positive correlation between SI values and TDS, the hydrochemical characteristics of surface water and groundwater were mainly determined by the dissolution and precipitation of minerals from bedrocks.

4.2.3. Multivariate Statistical Analysis

The correlations applied to the eight variables (pH, TDS and major ions) shed light on the relationships among those variables and water-rock interaction controlling the hydrochemical parameters [1,2,3]. The values of R > 0.75 and 0.75 > R > 0.50 suggested strong and moderate correlations between the hydrochemical parameters, respectively [11,12,13]. To avoid the error triggered by different unite, all variables were treated by log-ratio transforms prior to multivariate statistical analysis. The results of correlation analysis are listed in Table 1. TDS had good consistency with Ca2+, Mg2+, and HCO3. Ca2+ showed great consistency with Mg2+, representing the aquifer system of carbonates. Meanwhile, pH had moderate and positive correlation with carbonates elements (Ca2+, Mg2+ and HCO3), indicating the chemical equilibrium between pH and dissolution of carbonates. However, the correlation between Ca2+, Mg2+ and HCO3 was not as high as expected, against simple sources from the dissolution of carbonates. In addition, the moderate positive correlation between Ca2+, Mg2+ and Na+ revealed the possibility of ion exchange processes from the dissolution of silicate minerals. Hence, it is believable the dissolution of carbonate and silicate minerals dominated the major anions and cations of water in the Kangding area. Additionally, moderate consistency occurring between Ca2+ and SO42− indicated the dissolution of gypsum. The Na+-Cl pair had weak positive correlation, suggesting that they are not considerably affected by the simple dissolution of halite.
Hydrochemical parameters including pH and major ions were used for principal component analysis, which is helpful for tracing the sources of those ions [16,17]. The results of principal component analysis includes eigenvalue, percentage of variance, cumulative percentage of variance, and the factor loading, presented in Table 2. Scree plots for groundwater samples showed a distinct change of slop after the third factor (Figure 9). Using the Kaiser Criterion and scree plot, three principle components (PCs) of eigenvalues greater than 1 have been obtained, accounting for the total variance of 74.456%. The PC1 was responsible for 50.229% of total variance and has a strong loading of TDS, Na+, Ca2+, Mg2+, and HCO3. This factor indicates the general trend of hydrochemcial characteristics, probably dominated by the dissolution of carbonates and silicate minerals. The PC2 explained 12.622% of total variance and has medium positive loading of Ca2+ and SO42−. As such, PC2 could be linked to the dissolution of gypsum. PC3 contributed only 11.604% of the variances, and it only included a single major species, Cl, which was related to the anthropogenic activity or limited dissolution of halite.

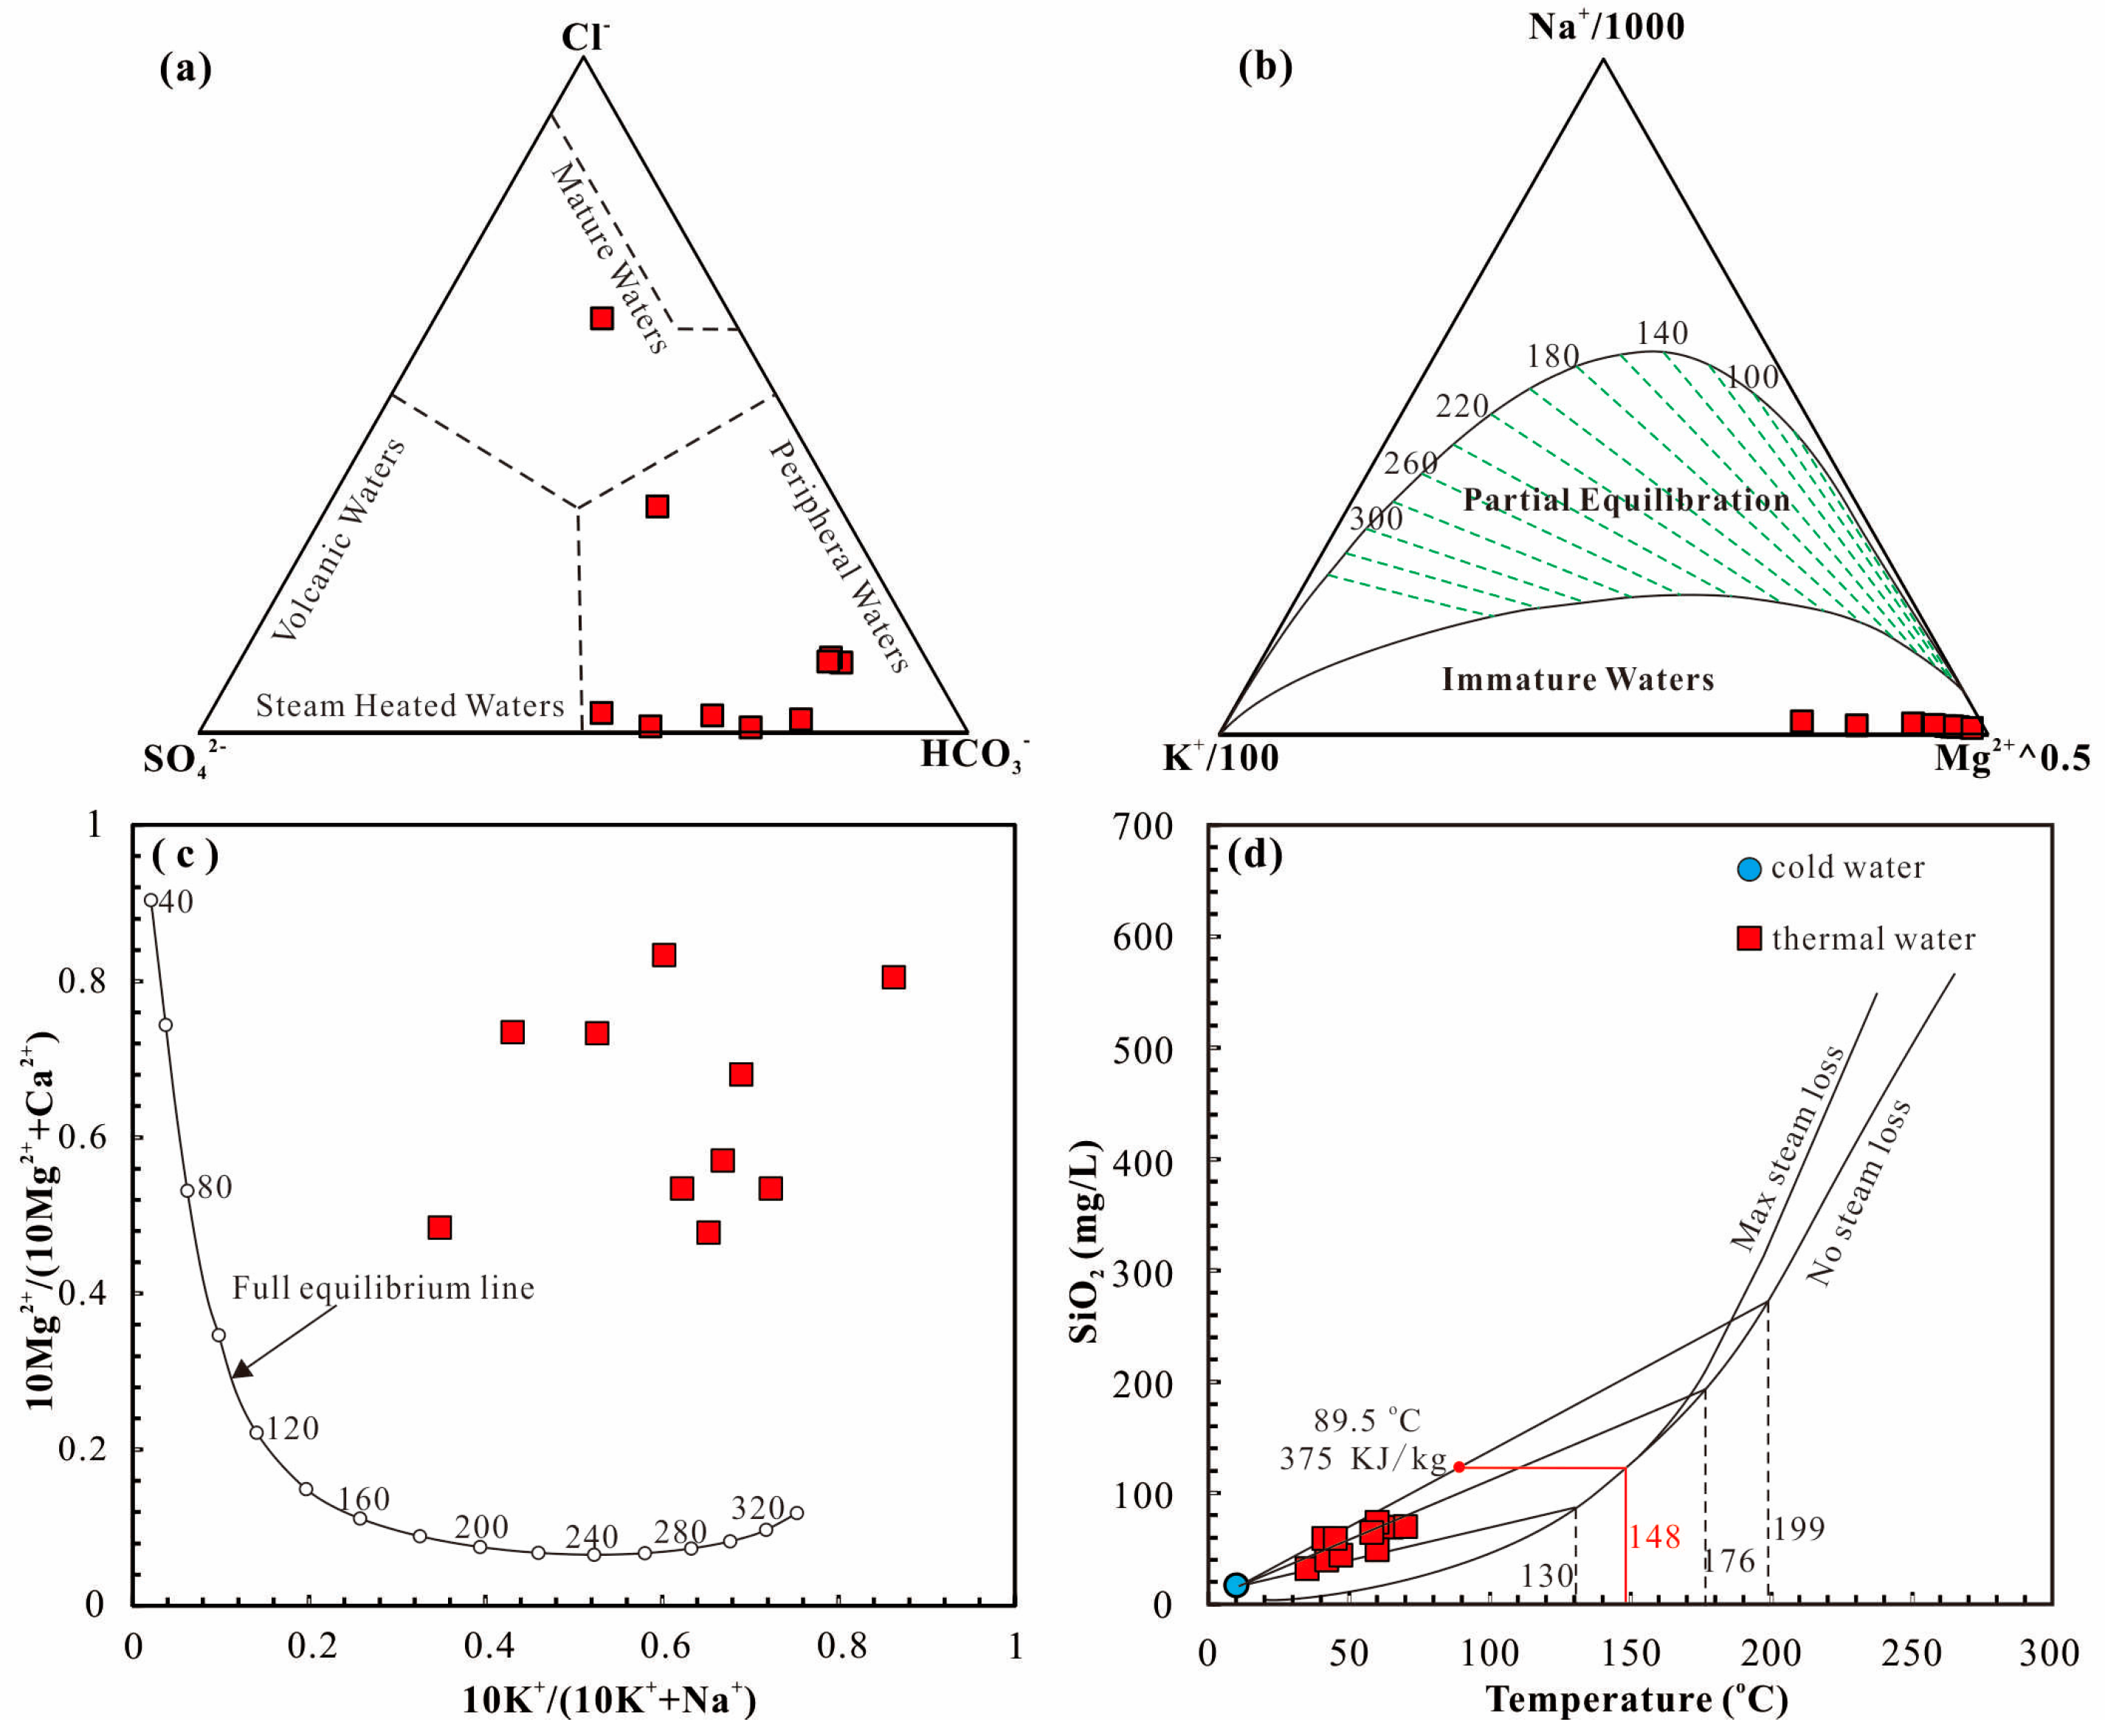
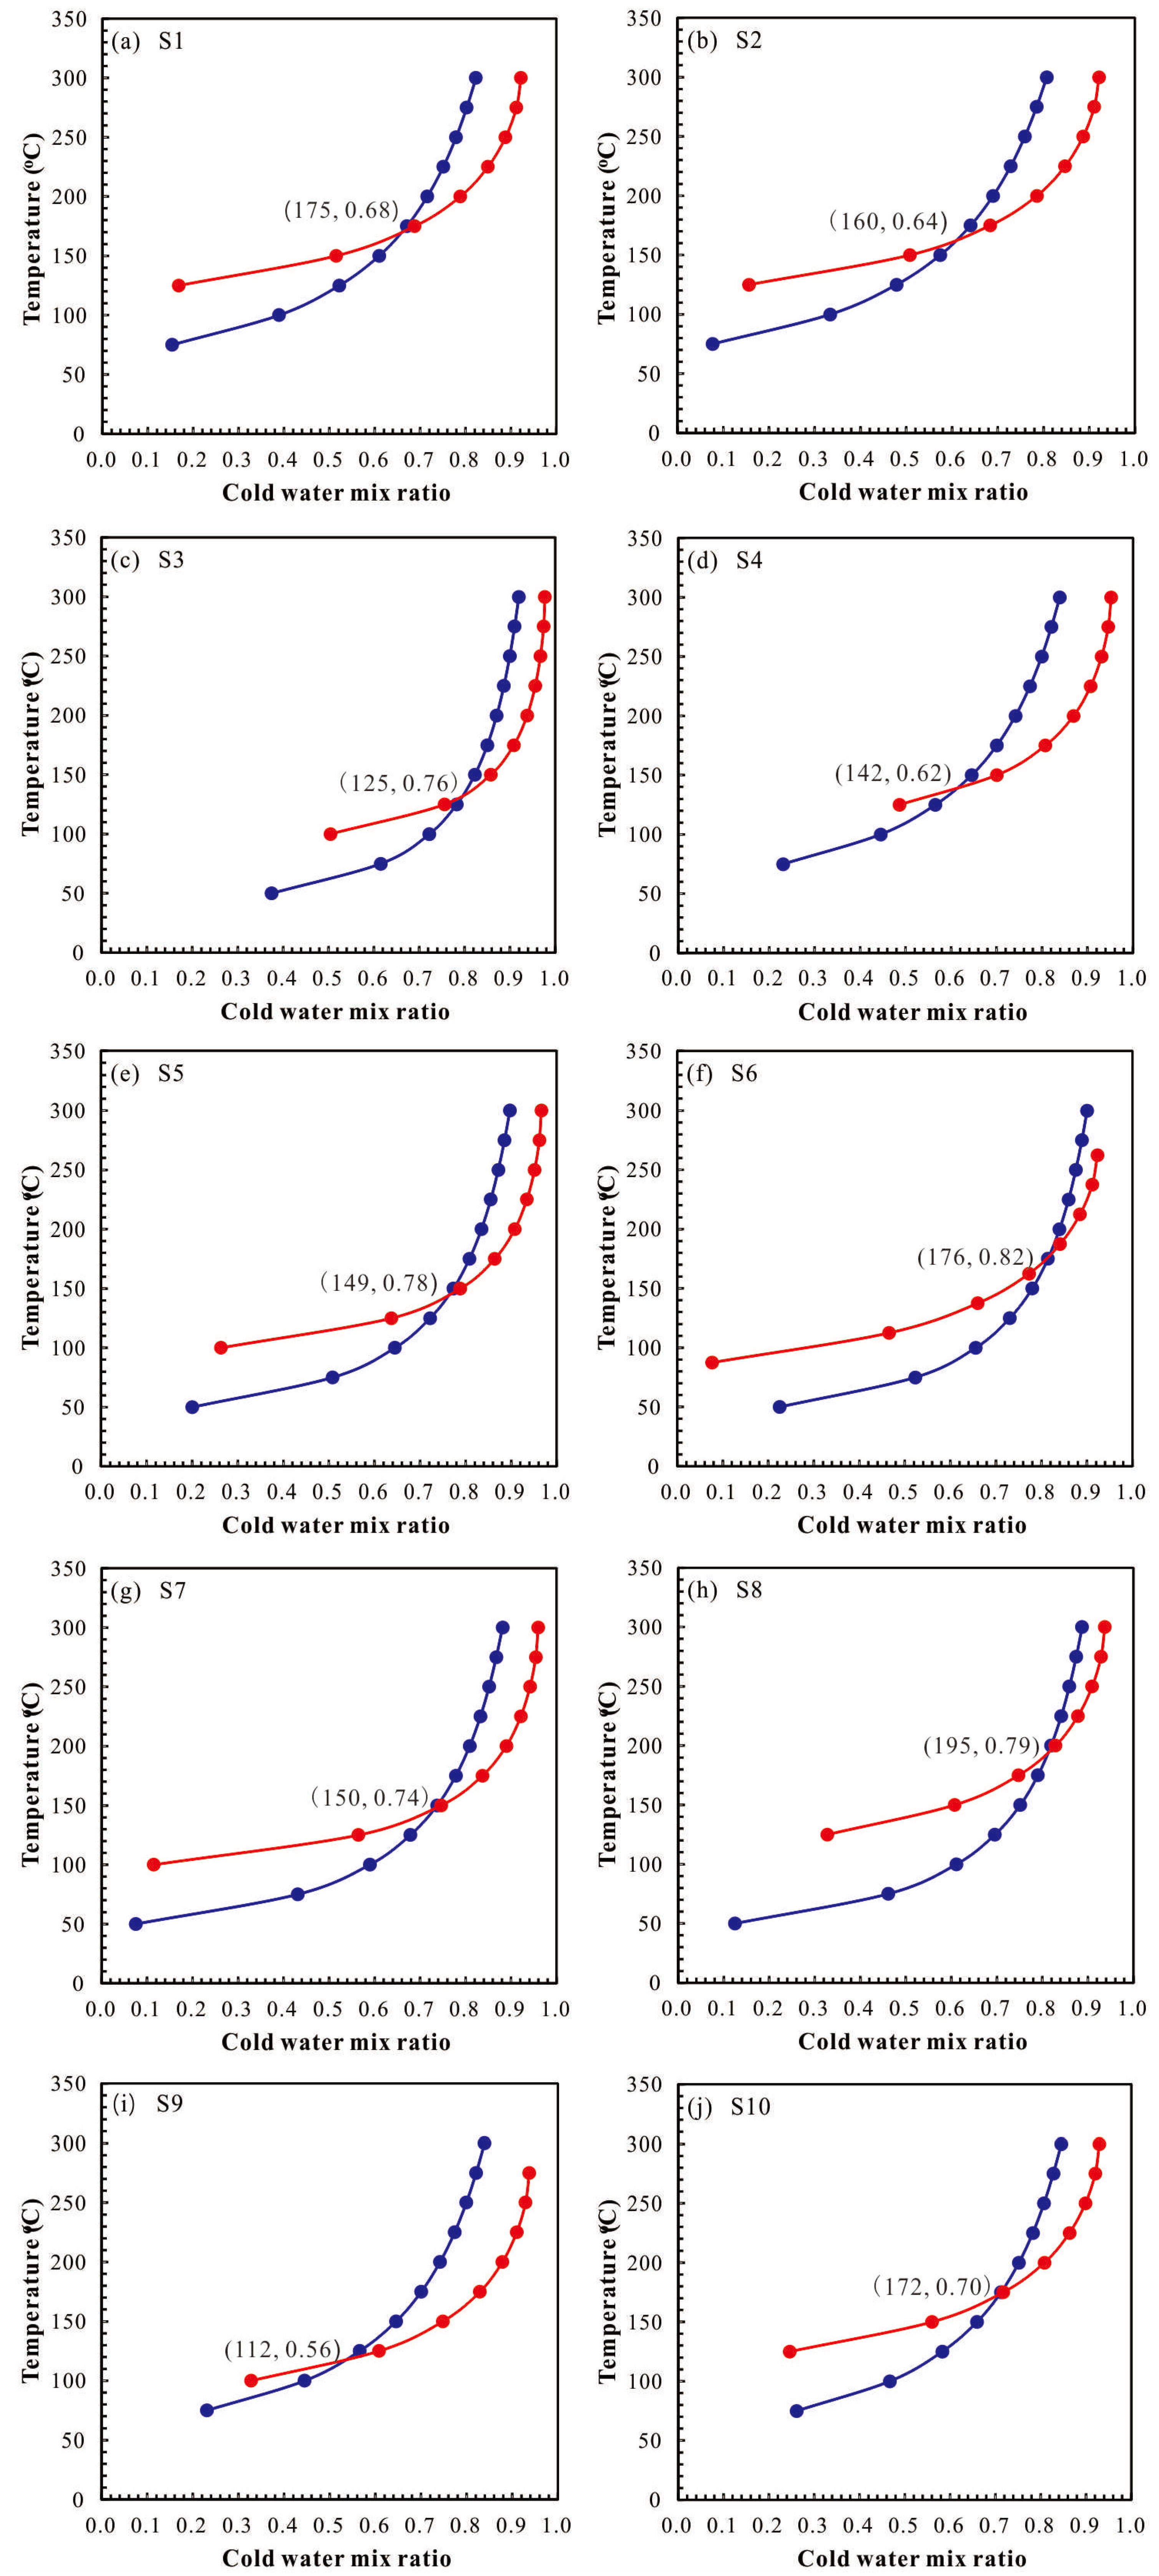
4.3. Mixing Model of Groundwater and Thermal Water

The main anions (Cl, SO42−and HCO3) have been used to identify the mixture between thermal and cold water [32]. The majority of thermal water samples were distributed on the field of peripheral water (Figure 10a), indicative of the involvement of cold water. Furthermore, the Na-K-Mg ternary diagram shows that all thermal water samples were typical of immature water [32] (Figure 10b), as well as relatively deficient saturated indices of different minerals in Table S1. Giggenbach and Goguel (1989) suggested the low equilibrium of thermal water was attributed to the dilution and mixing of surficial cold water [33]. The water-rock equilibrium at different temperatures was interpreted using the 10Mg2+/(10Mg2+ + Ca2+) versus 10K+/(10K+ + Na+) diagram. In Figure 10c, all thermal water samples were plotted above the curved line of the full equilibrium, yielding the recharge of cold water. Hence, we could infer that thermal water was typical of immature water, involved with cold water.
To evaluate the original temperature of thermal water and mixing ratio of cold water, the field temperatures and silica concentration of thermal and cold water have been extensively carried out [34,35], based on the Equations (7) and (8) below:
Scx + Sh (1 − x) = Ss
SiO2c + SiO2h (1 − x) = SiO2s
where Sc is the enthalpy of cold water, Sh is the initial enthalpy of deep thermal water, Ss is the last enthalpy of thermal water, SiO2c is the SiO2 concentration of cold water, SiO2h is the initial SiO2 content of deep thermal water, and SiO2s is the SiO2 concentration of thermal water. Founier and Truesdell (1974) proposed a graphical way to obtain the two unknowns [34]. In Figure 11, red and blue curves are drawn, and their intersections represent the mixing portion of cold water and estimated reservoir temperature. Based on the results from Figure 11, we can infer the original temperature and mixing ratios were 112–195 °C and 0.56–0.79, respectively. Moreover, a silicon-enthalpy graphic method has been conducted to estimate the reservoir temperature of mixing water [33]. It was assumed that no silica deposition existed before or after mixing and that quartz determines the solubility of silica in thermal water. A straight line connecting the points of cold water and points of thermal water intersect with the solubility curve for quartz at a point that gives the silica content and enthalpy value of thermal water in the condition of no steam loss (Figure 10d) [35]. Moreover, the intersection points with the “No steam loss” line also suggested the mixing origin. Those intersection points and cold water samples were regarded as the end member for initial thermal water and cold water, indicative of the reservoir temperature and mixing ratios. If steam separation took place at 89.5 °C (local boiling temperature), the calculated reservoir temperature is 148 °C. When no steam loss occurs, the reservoir temperatures range from 130 to 199 °C, while mixing ratio of cold water is estimated to be 30–40%, consistent with the calculated results from silica-enthalpy formula. Hence, the calculated results should be reliable. It is noteworthy that the estimated reservoir temperatures were much greater than the discharge temperature, suggesting that plenty of cold-water recharge occurred in a surficial place.

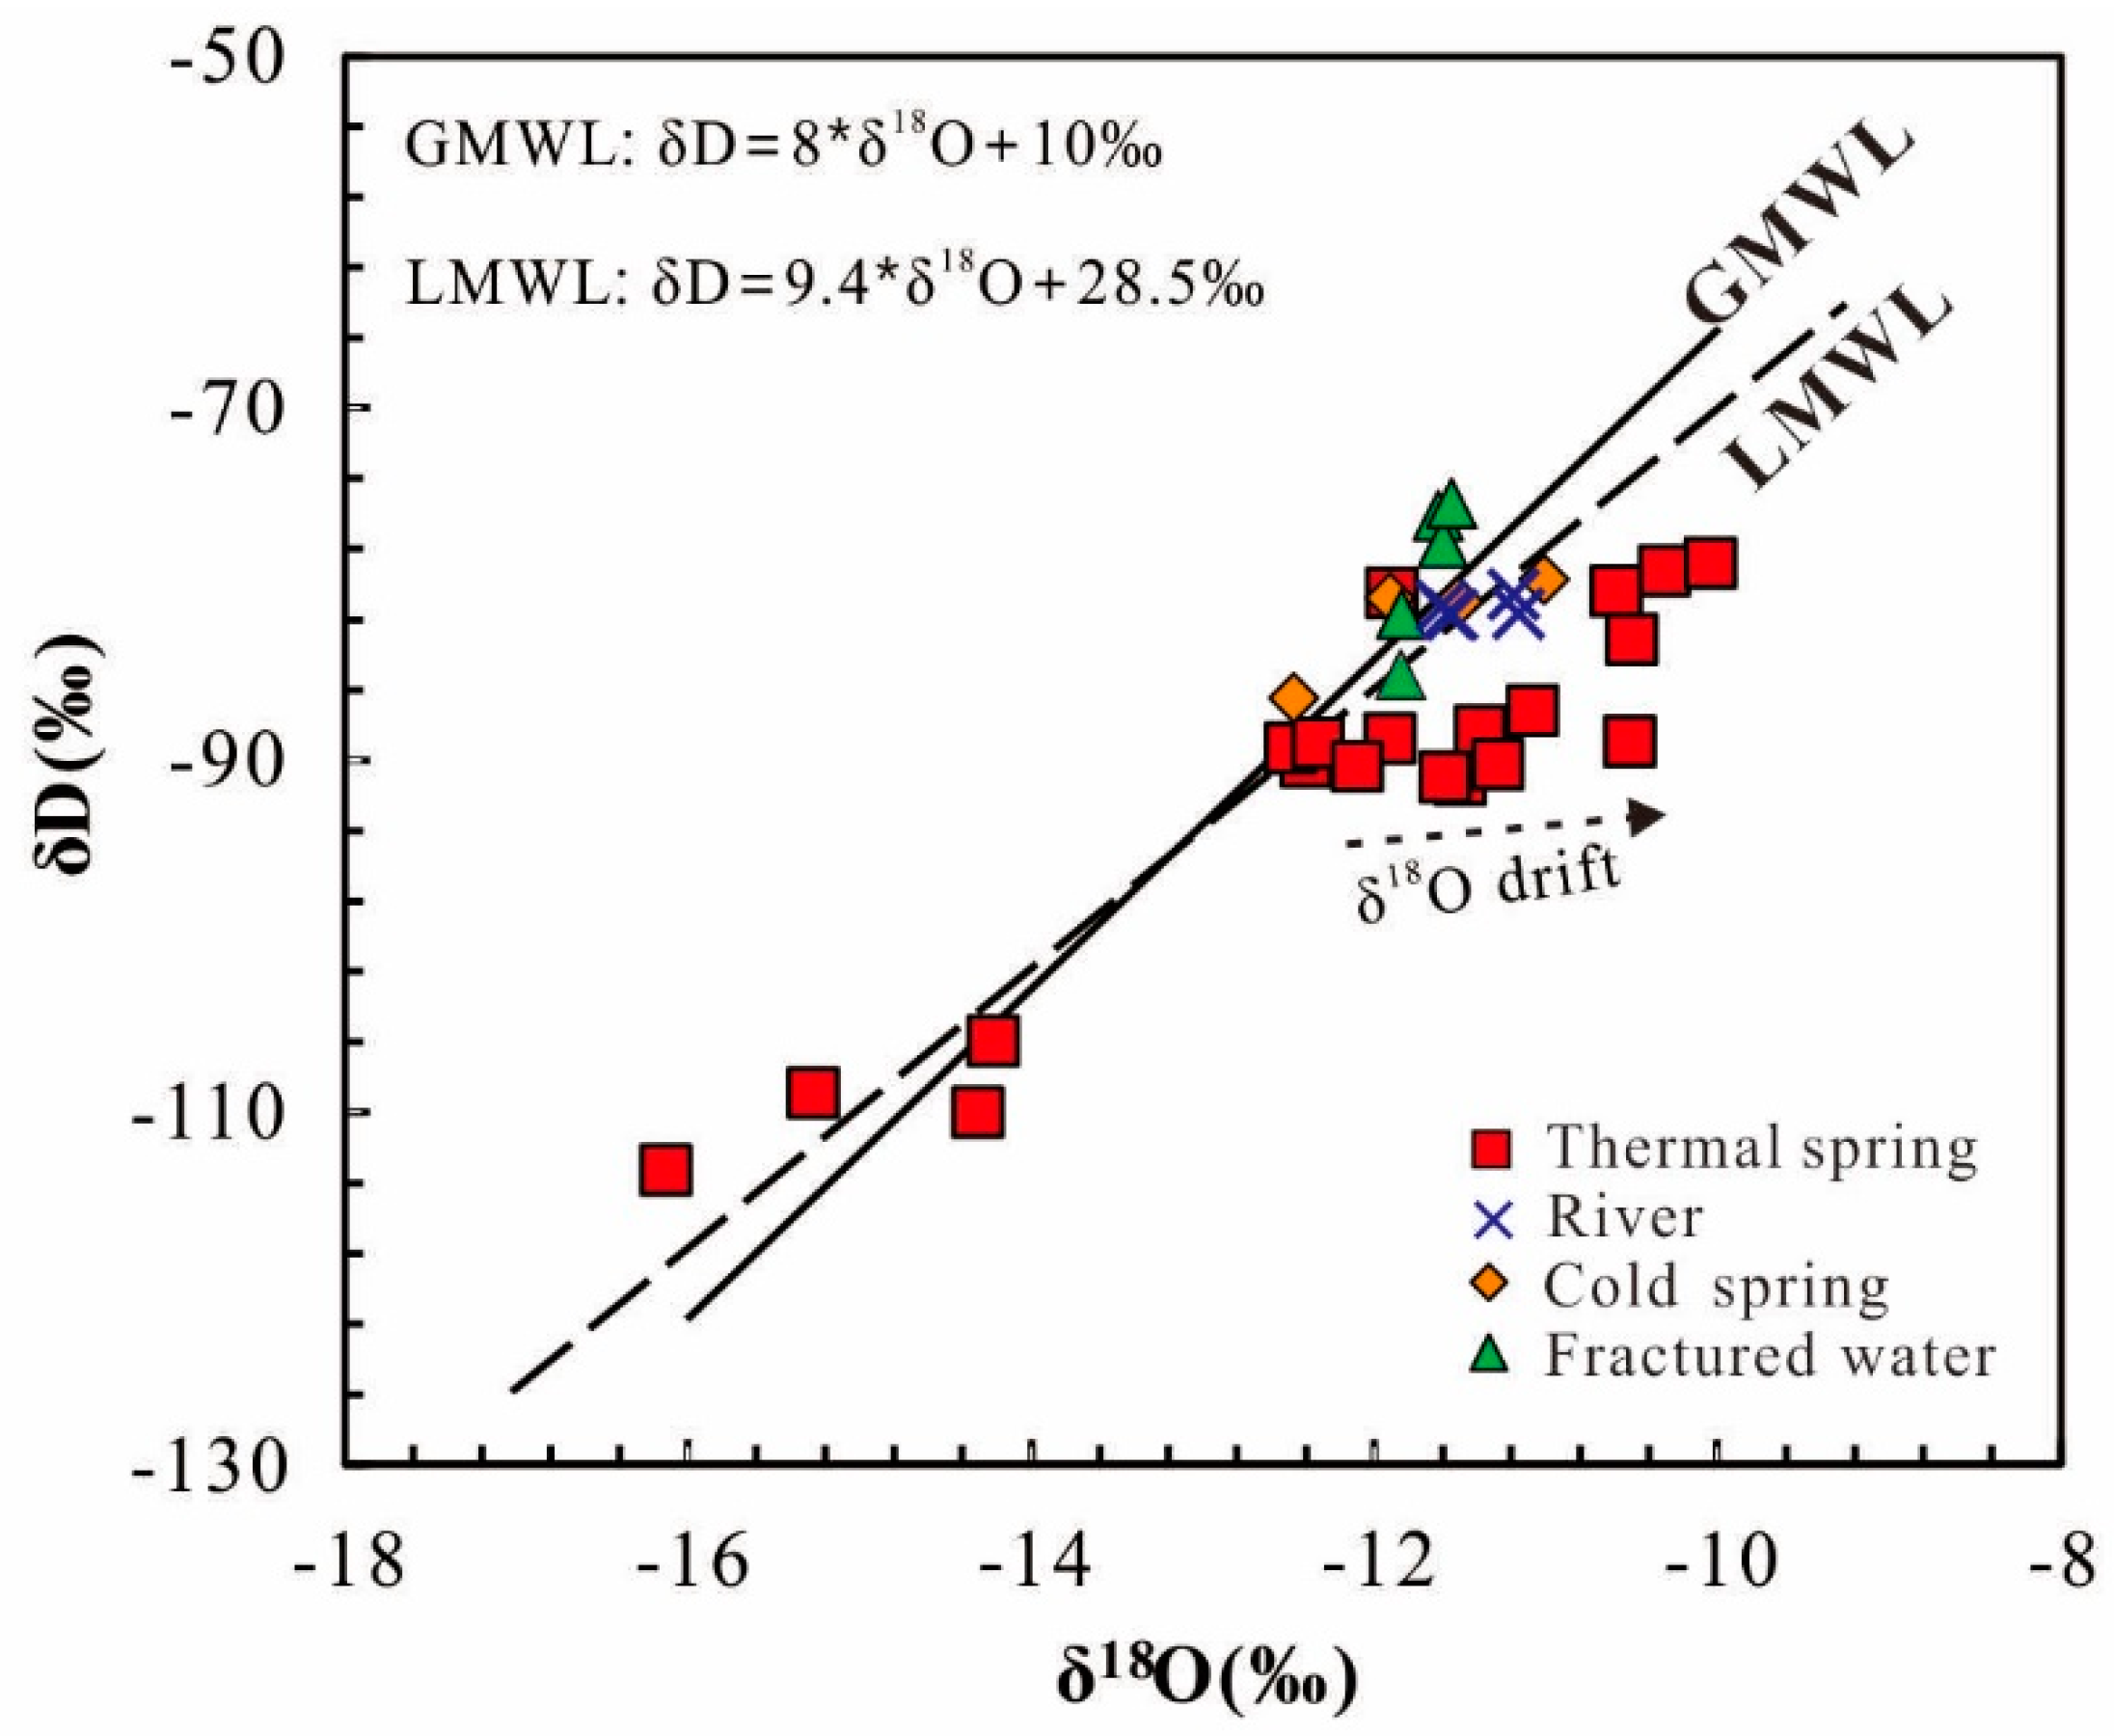
4.4. Evaluation for δD and δ18O Isotopes

The results of δD and δ18O isotopes from surface water (river), groundwater (cold spring and fractured water) and thermal water are listed in Table S2. The δD and δ18O values of surface water and groundwater in study area had a similar range of −75.39 to −86.47‰ and −11.01 to −12.47‰, while δD and δ18O values of thermal water largely varied from −78.77 to −113.27 ‰, and −10.04 to −16.13‰, respectively. Compared to thermal water, surface water and groundwater had richer δD values. Most samples were distributed around the Global Meteoric Water Line (GMWL) (solid line: δD = 8 × δ18O + 10‰) [36] and Local Meteoric Water Line (LMWL) (dash line: δD = 9.4 × δ18O + 28.5‰) [37], indicating a meteoric origin (Figure 12). It is generally acceptable that δD and δ18O values will decrease corresponding to changing elevation, due to topographic precipitation [38]. Hence, using the recharge altitude calculated by δD and δ18O values, we can constrain the general recharge area of those water samples. In the study area, the ratio between δD and altitude has been suggested in −2.24‰ per 100 m [37]. The calculated results presented the recharge altitudes of surface water and groundwater as 1059–1517 m. The recharge area of thermal water was located in a large variation of 2199–5302 m, much higher than those of surface water and groundwater. Therefore, we can propose that thermal water was recharged by precipitation from high elevation, while surface water and groundwater were recharged by precipitation from low elevation. Moreover, obvious δ18O drift in Figure 12 suggests that thermal water experienced remarkable and prolonged water-rock interaction during the deep circulation, corresponding to high TDS and concentrations of major ions.

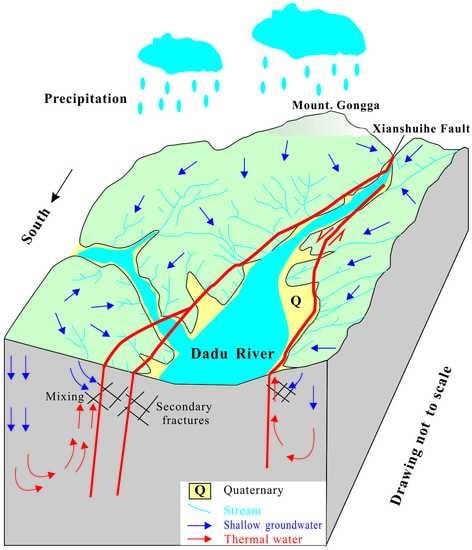
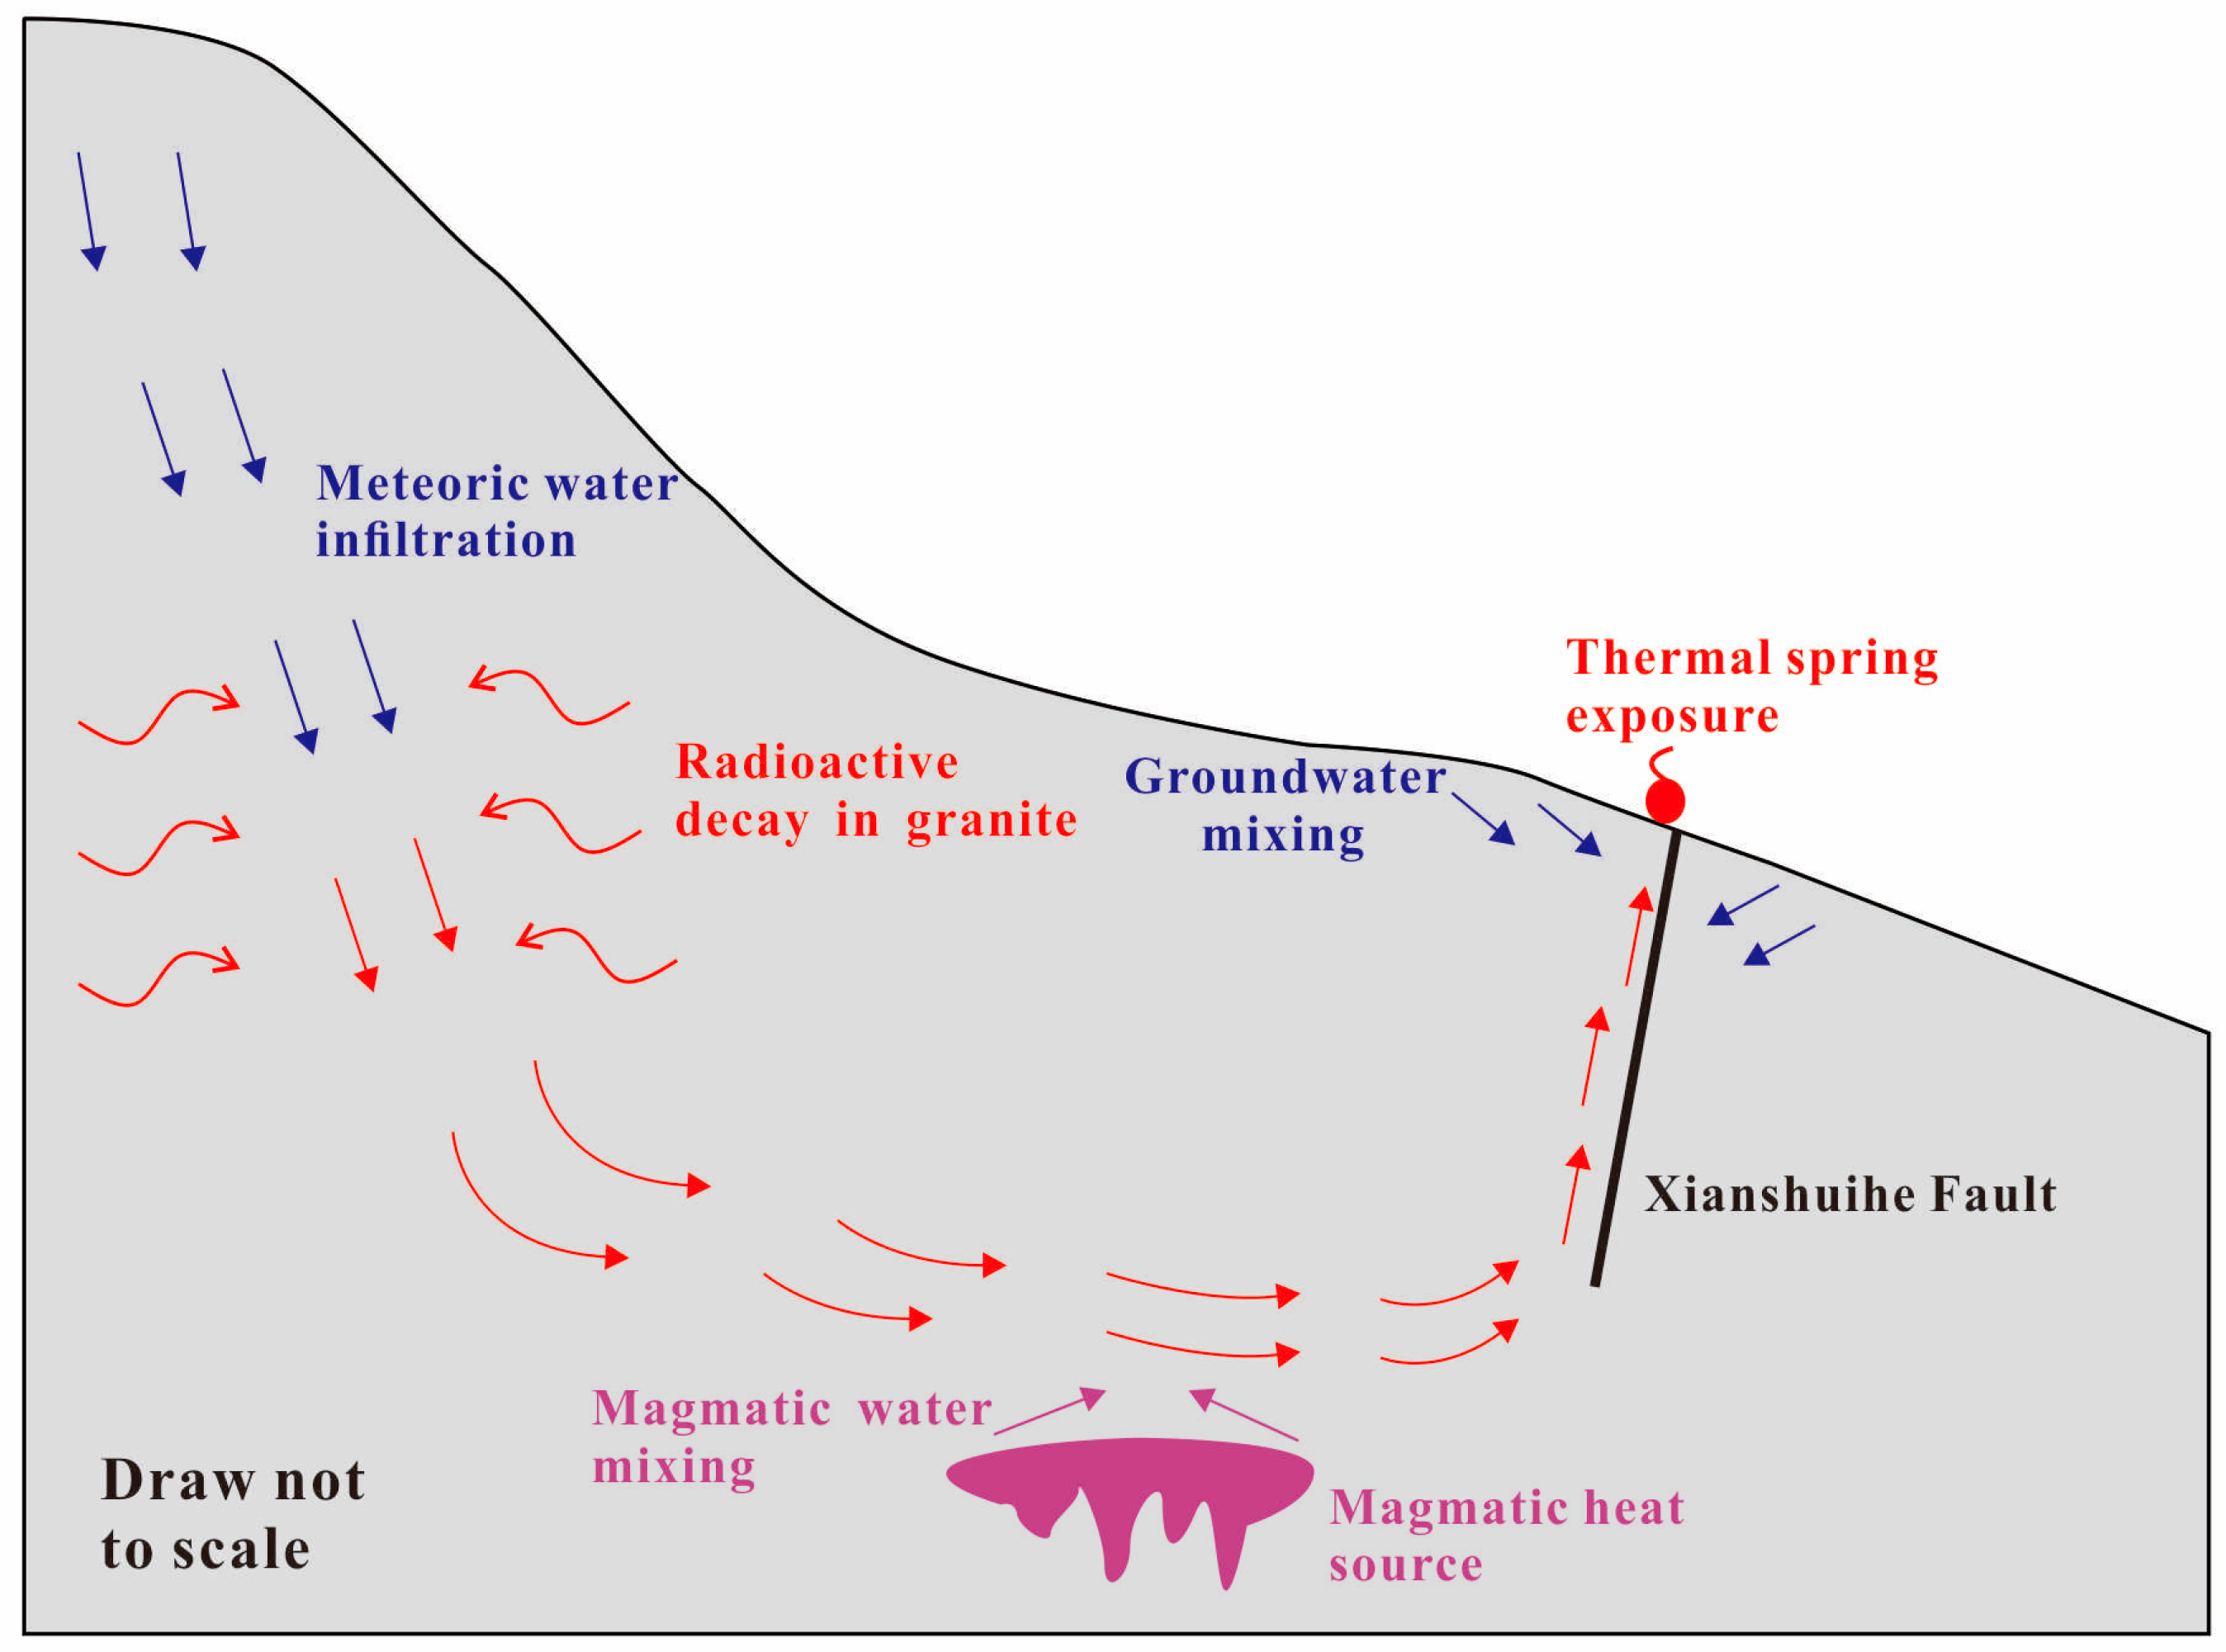
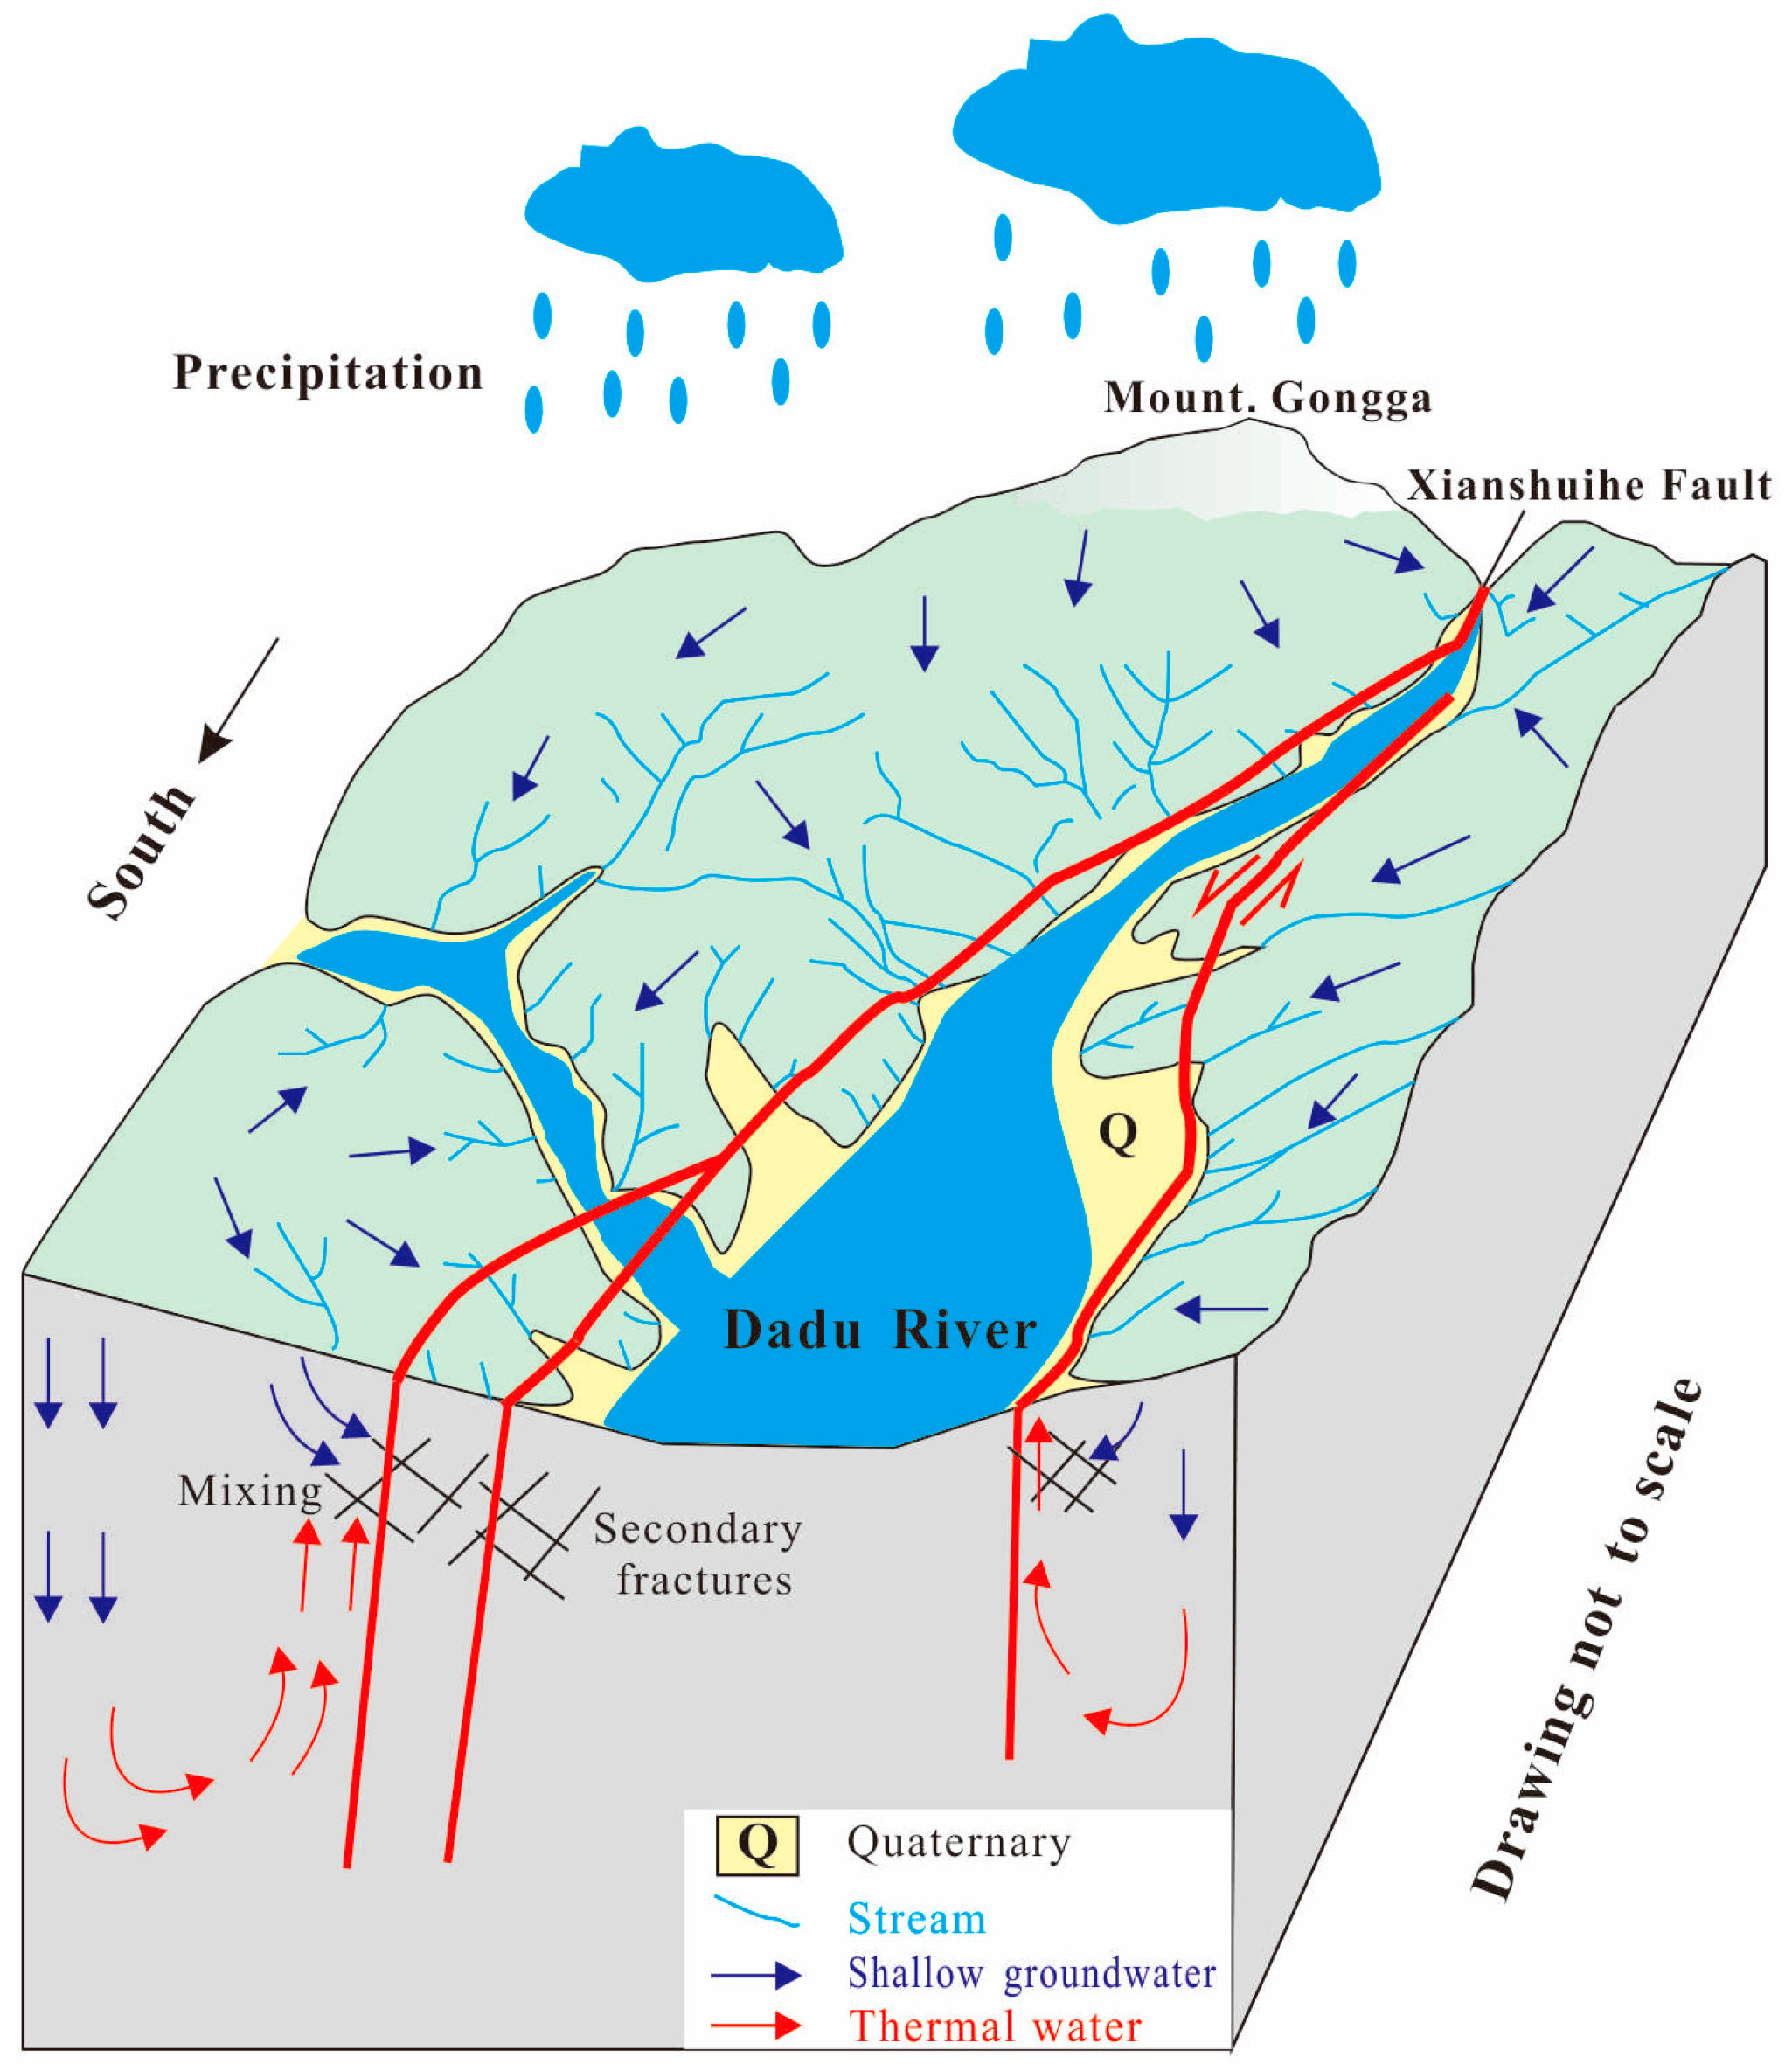
4.5. Hydrological Conceptual Model of Natural Water System

Generally speaking, the concentrations of radiogenic elements (e.g., U, Th, K) in granitic rocks are closely related to thermal source of the Earth, whose radioactive decay can generate great heat production [39]. Mount. Gongga, as a young batholith uplift during Mioncene, preserves quite high amounts of thermal energy [26]. Meanwhile, a previous study proposed that deep magmatic activity is occurring in the Kangding area, which could be another potential thermal source [25]. Moreover, the Xianshuihe fault provides a beneficial circulating conduit for thermal water. Combined the hydrochemical and δD and δ18O isotopes, we can briefly conclude the formation of thermal springs as below: meteoric water was infiltrated and mixed with magmatic water in a deep place. Then, meteoric water was heated by radioactive decay and deep magmatic source. During the circulation, Cl was derived from inputs of magmatic water, while SO42− probably originated from the dissolution of sulfide minerals (e.g., pyrite) in granite. When thermal water reaches shallow location, the mixture between thermal water and cold water would occur through fractures (Figure 13).
Based on the aforementioned geological setting, hydrochemical and isotopic analyses above, a hydrological conceptual model for the natural water system (surface water, groundwater, and thermal water) in Kangding County was constructed (Figure 14). A joint study of the ratio of major ions, geochemical modelling, and multivariate statistical analysis concluded that hydrochemical processes of surface water and groundwater were dominated by the dissolution of carbonates and silicate minerals, corresponding to the limestone and granite aquifers in Kangding County. δD and δ18O isotopic results showed high recharge elevations of 2199–5302 m, implying the potential recharge area from Mount. Gongga (7556 m) and adjacent mountain areas. Based on the concentrations of major ions and SiO2, thermal water samples were identified as immature water, with a cold-water mixing ratio of 0.56–0.79. Meanwhile, the discharge temperatures in surficial places were much lower than the estimated reservoir temperatures, indicative of large involvements of cold water. The N–S Xianshuihe fault direction and adjacent NNE-striking secondary fractures are responsible for vertical and lateral flow in natural water system. Herein, it is reasonable that abundant groundwater penetrating through those fractures recharges the thermal aquifer system. Additionally, the favorable hydraulic connection between surface water and groundwater has been determined by their similar hydrochemical and δD-δ18O isotopic characteristics. Therefore, we can conclude the Xianshuihe fault provides a deep channel for upwelling of thermal water, while those fractures are the ideal chamber for the surface water-groundwater interaction and recharge to thermal water in a surficial place.

5. Conclusions

Integrated assessments of variable data based on hydrochemical analysis, multivariate statistics and geochemical modelling, provide the basis for comprehensive understanding of natural water systems in Kangding County, which can be summarized as follows:
  • Surface water and groundwater are dominated by Ca-HCO3 type, while thermal water belongs to Ca-HCO3 and Na-Cl-SO4 types.
  • Correlations of major ions, multivariate statistical analysis, and saturation index indicated that the dissolution of carbonates and silicate minerals were the main hydrochemical processes affecting chemical components of natural water systems in limestone and granite aquifers. Detailed effects of anthropogenic activity on hydrochemistry have yet to be further investigated by more minor elements in the future.
  • Thermal water is typical of immature water that is involved with a cold-water fraction of 0.56–0.79. The estimated reservoir temperatures have a range of 130 to 199 °C.
  • δD and δ18O isotopes revealed a meteoric origin of hydrological system. Thermal water is recharged by precipitation from high elevation, while surface water and groundwater are recharged by precipitation from low elevation.
  • The Xianshuihe fault is the rising channel for thermal water, while adjacent secondary fractures provide the chambers for groundwater-surface water interaction and groundwater recharging with thermal water.

Supplementary Materials

The following are available online at https://www.mdpi.com/2073-4441/10/1/80/s1, Table S1: Hydrochemical composition of water samples, Table S2: δD and δ18O isotopes of representative water samples.

Acknowledgments

We thank anonymous reviewers and the Editor-in-Chief for their constructive comments. We thank Jing Yu and Ziwen Hu at the State Key Laboratory of Geohazard Prevention and Geo-environment Protection, Chengdu University of Technology for their assistance and helpful discussions. We are also grateful to the English editing by Conor O’Sullivan.

Author Contributions

Yunhui Zhang, Mo Xu, and Xiao Li conceived and designed the research direction. Yunhui Zhang wrote the paper. Jihong Qi, Qiang Zhang and Leilei Yu did the field work and collected water samples; Jian Guo and Rui Zhao performed the experiments and analyzed the data. All authors read and approved the final manuscript.

Conflicts of Interest

The authors declare no conflict of interest.

References

  1. Rakotondrabe, F.; Ngoupayou, J.R.N.; Mfonka, Z.; Rasolomanana, E.H.; Abolo, A.J.N.; Ako, A.A. Water quality assessment in the Betare-Oya gold mining area (East-Cameroon): Multivariate Statistical Analysis approach. Sci. Total Environ. 2018, 610–611, 831–844. [Google Scholar] [CrossRef] [PubMed]
  2. Kazakis, N.; Matta, C.; Pavlou, A.; Patrikaki, O.; Voudouris, K. Multivariate statistical analysis for the assessment of groundwater quality under different hydrogeological regimes. Environ. Earth Sci. 2017, 76, 349–361. [Google Scholar] [CrossRef]
  3. Hamzah, Z.; Aris, A.Z.; Ramli, M.F.; Juahir, H.; Narany, T.S. Groundwater quality assessment using integrated geochemical methods, multivariate statistical analysis, and geostatistical technique in shallow coastal aquifer of Terengganu, Malaysia. Arab. J. Geosci. 2017, 10, 49–65. [Google Scholar] [CrossRef]
  4. Xiao, Y.; Gu, X.M.; Yin, S.Y.; Pan, X.Y.; Shao, J.L.; Cui, Y.L. Investigation of Geochemical Characteristics and Controlling Processes of Groundwater in a Typical Long-Term Reclaimed Water Use Area. Water 2017, 9, 800. [Google Scholar] [CrossRef]
  5. Gu, X.M.; Zhang, Q.L.; Cui, Y.L.; Shao, J.L.; Xiao, Y.; Zhang, P.; Liu, J.X. Hydrogeochemistry and Genesis Analysis of Thermal and Mineral Springs in Arxan, Northeastern China. Water 2017, 9, 61. [Google Scholar] [CrossRef]
  6. Wu, X.; Zheng, Y.; Zhang, J.; Wu, B.; Wang, S.; Tian, Y.; Li, J.G.; Meng, X. Investigating Hydrochemical Groundwater Processes in an Inland Agricultural Area with Limited Data: A Clustering Approach. Water 2017, 9, 723. [Google Scholar] [CrossRef]
  7. Pasvanoğlu, S.; Çelik, M. A conceptual model for groundwater flow and geochemical evolution of thermal fluids at the Kızılcahamam geothermal area, Galatian volcanic Province. Geothermics 2018, 71, 88–107. [Google Scholar] [CrossRef]
  8. Yurteri, C.; Simsek, S. Hydrogeological and hydrochemical studies of the Kaman-Savcili-Büyükoba (Kirsehir) geothermal area, Turkey. Geothermics 2017, 65, 99–112. [Google Scholar] [CrossRef]
  9. Yang, P.H.; Cheng, Q.; Xie, S.Y.; Wang, J.L.; Chang, L.R.; Yu, Q.; Zhan, Z.J.; Chen, F. Hydrogeochemistry and geothermometry of deep thermal water in the carbonate formation in the main urban area of Chongqing, China. J. Hydrol. 2017, 549, 50–61. [Google Scholar] [CrossRef]
  10. Wang, X.C.; Zhou, X.; Zheng, Y.H.; Song, C.; Long, M.; Chen, T.; Ren, Z.H.; Yang, M.L.; Li, X.L.; Guo, J. Hydrochemical characteristics and mixing behavior of thermal springs along the Bijiang River in the Lanping basin of China. Environ. Earth Sci. 2017, 76, 487–505. [Google Scholar] [CrossRef]
  11. Tziritis, E.P.; Datta, P.S.; Barzegar, R. Characterization and Assessment of Groundwater Resources in a Complex Hydrological Basin of Central Greece (Kopaida basin) with the Joint Use of Hydrogeochemical Analysis, Multivariate Statistics and Stable Isotopes. Aquat. Geochem. 2017, 23, 271–298. [Google Scholar] [CrossRef]
  12. Singh, C.K.; Kumar, A.; Shashtri, S.; Kumar, A.; Kumar, P.; Mallick, J. Multivariate statistical analysis and geochemical modeling for geochemical assessment of groundwater of Delhi, India. J. Geochem. Explor. 2017, 175, 59–71. [Google Scholar] [CrossRef]
  13. Liu, P.; Hoth, N.; Drebenstedt, C.; Sun, Y.J.; Xi, Z.M. Hydro-geochemical paths of multi-layer groundwater system in coal mining regions-Using multivariate statistics and geochemical modeling approaches. Sci. Total Environ. 2017, 601–602, 1–14. [Google Scholar] [CrossRef] [PubMed]
  14. Gil-Márquez, J.M.; Barberá, J.A.; Mudarra, B.A.M. Hydrological and geochemical processes constraining groundwater salinity in wetland areas related to evaporitic (karst) systems. A case study from Southern Spain. J. Hydrol. 2017, 544, 538–554. [Google Scholar] [CrossRef]
  15. Wu, J.H.; Li, P.Y.; Qian, H.; Duan, Z.; Zhang, X.D. Using correlation and multivariate statistical analysis to identify hydrogeochemical processes affecting the major ion chemistry of waters: A case study in Laoheba phosphorite mine in Sichuan, China. Arab. J. Geosci. 2013, 7, 3973–3982. [Google Scholar] [CrossRef]
  16. Kumar, M.S.; Dhakate, R.; Yadagiri, G.; Reddy, K.S. Principal component and multivariate statistical approach for evaluation of hydrochemical characterization of fluoride-rich groundwater of Shaslar Vagu watershed, Nalgonda District, India. Arab. J. Geosci. 2017, 10, 83–99. [Google Scholar] [CrossRef]
  17. Argamasilla, M.; Barbera, J.A.; Andreo, B. Factors controlling groundwater salinization and hydrogeochemical processes in coastal aquifers from southern Spain. Sci. Total Environ. 2017, 580, 50–68. [Google Scholar] [CrossRef] [PubMed]
  18. Yuan, J.F.; Xu, F.; Deng, G.S.; Tang, Y.Q. Using stable isotopes and major ions to identify hydrogeochemical characteristics of karst groundwater in Xide country, Sichuan Province. Carbonates Evaporites 2017, 1–12. [Google Scholar] [CrossRef]
  19. Papp, D.C.; Cociuba, I.; Baciu, C.; Cozma, A. Origin and Geochemistry of Mine Water and its Impact on the Groundwater and Surface Running Water in Post-mining Environments: Zlatna Gold Mining Area (Romania). Aquat. Geochem. 2017, 23, 247–270. [Google Scholar] [CrossRef]
  20. Wang, S.Q.; Liu, Z.; Shao, J.L. Hydrochemistry and H-O-C-S Isotopic Geochemistry Characteristics of Geothermal Water in Nyemo-Nagqu, Tibet. Acta Geol. Sin. 2017, 91, 644–657. [Google Scholar] [CrossRef]
  21. Tiwari, S.K.; Rai, S.K.; Bartarya, S.K.; Gupta, A.K.; Negi, M. Stable isotopes (δ13CDIC, δD, δ18O) and geochemical characteristics of geothermal springs of Ladakh and Himachal (India): Evidence for CO2 discharge in northwest Himalaya. Geothermics 2016, 64, 314–330. [Google Scholar] [CrossRef]
  22. Sun, Z.; Ma, R.; Wang, Y.X.; Hu, Y.L.; Sun, L.J. Hydrogeological and hydrogeochemical control of groundwater salinity in an arid inland basin: Dunhuang Basin, northwestern China. Hydrol. Process. 2016, 30, 1884–1902. [Google Scholar] [CrossRef]
  23. Qi, J.H.; Xu, M.; An, C.J.; Wu, M.L.; Zhang, Y.H.; Li, X.; Zhang, Q.; Lu, G.P. Characterizations of geothermal springs along the Moxi deep fault in the western Sichuan plateau, China. Phys. Earth Planet. Inter. 2017, 263, 12–22. [Google Scholar] [CrossRef]
  24. Luo, J.; Pang, Z.H.; Kong, Y.K.; Wang, Y.C. Geothermal potential evaluation and development prioritization based on geochemistry of geothermal waters from Kangding area, western Sichuan, China. Environ. Earth Sci. 2017, 76, 343–366. [Google Scholar] [CrossRef]
  25. Guo, Q.; Pang, Z.H.; Wang, Y.C.; Tian, J. Fluid geochemistry and geothermometry applications of the Kangding high-temperature geothermal system in eastern Himalayas. Appl. Geochem. 2017, 81, 63–75. [Google Scholar] [CrossRef]
  26. Zhang, Y.Z.; Replumaz, A.; Leloup, P.H.; Wang, G.C.; Bernet, M.; Beek, P.; Paquette, J.L.; Chevalier, M.L. Cooling history of the Gongga batholith: Implications for the Xianshuihe Fault and Miocene kinematics of SE Tibet. Earth Planet. Sci. Lett. 2017, 465, 1–15. [Google Scholar] [CrossRef]
  27. Yan, B.; Lin, A.M. Holocene activity and paleoseismicity of the Selaha Fault, southeastern segment of the strike-slip Xianshuihe Fault Zone, Tibetan Plateau. Tectonophysics 2017, 694, 302–318. [Google Scholar] [CrossRef]
  28. Parkhurst, D.L.; Appelo, C.A.J. Description of input and examples for PHREEQC version 3: A computer program for speciation, batch-reaction, one-dimensional transport, and inverse geochemical calculations. In Groundwater in Book 6 Modeling Techniques; U.S. Geological Survey: Reston, VA, USA, 2013. Available online: https://pubs.er.usgs.gov/publication/tm6A43 (accessed on 20 October 2017).
  29. Piper, A.M. A graphic procedure in the geochemical interpretation of water-analyses. Eos Trans. Am. Geophys. Union 1944, 25, 914–928. [Google Scholar] [CrossRef]
  30. Gibbs, R.J. Mechanisms controlling world water chemistry. Science 1970, 170, 1088–1090. [Google Scholar] [CrossRef] [PubMed]
  31. Adams, S.; Titus, R.; Pietersen, K.; Tredoux, G.; Harris, C. Hydrochemical characteristics of aquifers near Sutherland in the Western Karoo, South Africa. J. Hydrol. 2001, 241, 91–103. [Google Scholar] [CrossRef]
  32. Giggenbach, W.F. Geothermal solute equilibria. Derivation of Na-K-Mg-Ca geoindicators. Geochim. Cosmochim. Acta 1988, 52, 2749–2765. [Google Scholar] [CrossRef]
  33. Giggenbach, W.F.; Goguel, R.L. Collection and analysis of geothermal and volcanic water and gas discharges. In DSIR Report CD 2401, 4th ed.; Pentone: Carlstadt, NJ, USA, 1989; Volume 81, Available online: https://openei.org/wiki/Collection_and_Analysis_of_Geothermal_and_Volcanic_Water_and_Gas_Discharges (accessed on 1 November 2017).
  34. Fournier, R.O. Geochemical indicators of subsurface temperature-part 2, estimation of temperature and fraction of hot water mixed with cold. J. Res. US Geol. Surv. 1974, 2, 263–270. [Google Scholar]
  35. Fournier, R.O. Chemical geothermometers and mixing models for geothermal systems. Geothermics 1977, 5, 41–50. [Google Scholar] [CrossRef]
  36. Craig, H. Isotopic variations in meteoric waters. Science 1961, 133, 1702–1703. [Google Scholar] [CrossRef] [PubMed]
  37. Song, C.L.; Sun, X.Y.; Wang, G.X. A study on precipitation stable isotopes characteristics and vapor sources of the subalpine Gongga Mountain, China. Resour. Environ. Yangtze Basin 2015, 24, 1860–1869, (In Chinese and English Abstract). [Google Scholar]
  38. Blasch, K.W.; Bryson, J.R. Distinguishing sources of ground water recharge by using δ2H and δ18O. Groundwater 2007, 45, 294–308. [Google Scholar] [CrossRef] [PubMed]
  39. Artemieva, I.M.; Thybo, H.; Jakobsen, K.; Sørensen, N.K.; Nielsen, L.S. Heat production in granitic rocks: Global analysis based on a new data compilation GRANITE2017. Earth-Sci. Rev. 2017, 172, 1–26. [Google Scholar] [CrossRef]
Figure 1. (a) Topography of Southwestern China; (b) geological map and (c) cross section of Kangding County. D: Devonian, P1: Lower Permian, P2: Upper Permian, T: Triassic, Q: Quaternary.
Water 10 00080 g001
Figure 2. (a) Stratigraphic column showing lithology and hydrological properties; (b) Rose diagram and (c) stereographic diagrams (equal area projection, lower hemisphere) with poles and contouring of fractures in study area. Strata legends are same as Figure 1.
Water 10 00080 g002
Figure 3. Schöeller diagram for different water samples (unit: meq/L). Dash lines stand for the mean values of different water samples. TS: Thermal spring, CS: Cold spring, FW: Fractured water.
Water 10 00080 g003
Figure 4. Piper plot of water samples.
Water 10 00080 g004
Figure 5. Gibbs plot. (a) Total dissolved solids (TDS) versus Na+/(Na+ + Ca2+); (b) TDS versus Cl/(Cl + HCO3).
Water 10 00080 g005
Figure 6. Distributions of ionic ratios in water samples, (a) HCO3 versus Ca2+; (b) HCO3 versus Ca2+ + Mg2+; (c) Cl versus Na+; (d) SO42− versus Ca2+.
Water 10 00080 g006
Figure 7. HCO3 + SO42− versus Ca2+ + Mg2+ diagram.
Water 10 00080 g007
Figure 8. Saturation index (SI) versus total dissolved solids (TDS) (mg/L) diagrams. (a) SI (calcite); (b) SI (dolomite); (c) SI (gypsum), and (d) SI (halite).
Water 10 00080 g008
Figure 9. (a) Scree plot; Factor loadings for (b) PC1 and PC2; (c) PC2 and PC3; (d) PC1 and PC3.
Water 10 00080 g009
Figure 10. (a) Giggenbach Cl-SO42−-HCO3 and (b) Na-K-Mg ternary diagrams; (c) Mg2+/(Mg2+ + Ca2+) versus 10K+/(10K+ + Na+) diagram; (d) SiO2 versus temperature diagram. Silica concentration of cold water is the average values of groundwater samples in Table S1.
Water 10 00080 g010
Figure 11. Relations between fraction of cold water and temperature in the mixing model. Blue curve = enthalpy, red curve = silica.
Water 10 00080 g011
Figure 12. Variation of δD and δ18O in groundwater and thermal springs associated with Global Meteoric Water Line (GMWL) [36] and Local Meteoric Water Line (LMWL) [37].
Water 10 00080 g012
Figure 13. Conceptual model of thermal spring in Kangding County.
Water 10 00080 g013
Figure 14. Hydrological conceptual model of natural water system in Kangding County.
Water 10 00080 g014
Table 1. Correlation matrix of the species in water samples.
CorrelationpHTDSK+Na+Ca2+Mg2+ClSO42−HCO3
pH1
TDS0.3401
K+0.1680.3591
Na+0.2680.6620.6011
Ca2+0.3040.9020.1390.4191
Mg2+0.3550.7800.1810.3830.6171
Cl0.0840.2810.0150.2040.2560.2771
SO420.1820.7070.2610.5160.5120.5550.1441
HCO30.2880.9240.3570.6440.8740.7510.2520.4351
Table 2. Factor loadings and eigenvalues of the eight extracted factors.
Scaled CoordinatesPC1PC2PC3
pH0.4280.1640.393
TDS0.9880.064−0.100
K+0.364−0.8190.170
Na+0.766−0.3670.226
Ca2+0.8680.223−0.115
Mg2+0.8300.162−0.066
Cl0.0980.4190.735
SO42−0.5850.214−0.488
HCO30.921−0.0520.068
Eigenvalues4.5211.1361.044
Variance (%)50.22912.62211.604
Cumulative (%)50.22962.85274.456

