
Lessons From a Historic Decline in Child Poverty
Chapter 4. A Subgroup Analysis of Child Poverty Shifts
Throughout U.S. history, a child’s economic circumstances have been largely driven by their families’ characteristics and the extent to which their families are welcomed in or excluded from the labor market and social safety net programs based on these characteristics. The result has been a wide variation in a child’s risk of experiencing economic deprivation. Over the past 50 years, our nation’s racial and ethnic composition has become increasingly diverse, and we have witnessed the greatest influx of immigrants since the turn of the 20th century. The structure of American families has also become more diverse, with many couples forgoing marriage and others parenting children without partners. In this chapter, we explore the following:
- The extent to which child subgroups benefited from the historic decline in child poverty, and the implications for subgroup disparities in child poverty.
- The extent to which the social safety net protects children from poverty across subgroups.
We answer these questions by examining multiple subgroups of children to understand precisely who benefited from the historic decline in child poverty. Specifically, we examine child subgroups based on the following characteristics: 1) parental nativity, 2) child race/ethnicity, 3) family structure, and 4) parental employment stability. We have selected these subgroups due to longstanding structural and societal forces—including immigration policies, structural racism, and labor market practices—that have differentially shaped a child’s risk of poverty based on their family’s characteristics. However, we recognize that these are not the only important groups of children to examine. Previous research, for example, has shown large disparities in child deep poverty based on parents’ disability status.[1]
As we examine differences across subgroups of children, we contextualize our findings and illuminate trends to understand group differences. We have not conducted causal analyses but, rather, we point to possible explanations of our findings. In contrast with Chapter 3, we do not present a policy-by-policy analysis of child subgroups in this chapter, but rather focus on the role of the safety net as a whole in helping to lift various subgroups of children out of poverty.
What’s in this chapter: In Section 1 of this chapter, we review the four family characteristics listed above, relying on past research and policy shifts to explain how particular child subgroups experience elevated risks of poverty. In Section 2, we examine the extent to which child poverty declined for each child subgroup from 1993 to 2019. This section also explores whether subgroup disparities widened or narrowed. In Section 3, we look at the relative role of the social safety net in protecting different child subgroups from poverty. We conclude (Section 4) with a discussion of themes arising from the findings.
No time to read Chapter 4? Read this instead.
Research parameters to keep in mind
Overall: We examine the rate of the decline in child poverty, by subgroup; and the total role of the social safety net in protecting children from poverty, by subgroup.
More specifically:
-
- We examine the overall factors listed above by parental nativity, or by children living with all U.S.-born parents and children living with at least one foreign-born parent.
- We examine the overall factors listed above by race/ethnicity, or by Asian/Hawaiian/Pacific Islander children, Black children, Hispanic children, and White children.
- We examine the overall factors listed above by family structure, or by children living with two parents and children living with zero or one parent.
- We examine the overall factors listed above by parental employment stability, or by children living with parent(s) who collectively work less than 25 weeks per year at any intensity, and children living with parent(s) who work at least 26 weeks per year at any intensity.
Time frame examined: From 1993-2019
Key findings
-
- Child poverty rates declined—and declined at similar rates—for nearly every subgroup examined: children in immigrant families and non-immigrant families; Asian/Hawaiian/Pacific Islander children, Black children, Hispanic children, and White children; and children living in two-parent families and children living with zero or one parent.
- Because child poverty rates declined at similar rates across groups, disparities in child poverty rates by parental nativity, race and ethnicity, and family structure persisted during the historical decline in child poverty from 1993 to 2019.
- There is one exception to this pattern of similar rates of decline across groups: The gap in poverty rates, and particularly deep poverty rates, grew between children with stably employed parents and those without. Poverty rates declined considerably for children with stably employed parents but much less so for children without stably employed parents.
- The role of the social safety net in reducing child poverty grew dramatically from 1993 to 2019 for nearly every subgroup; however, the social safety net did not work as well for all groups of children.
- The social safety net has consistently played a greater role in protecting children in non-immigrant families from poverty than children in immigrant families—exacerbating disparities in child poverty between these two groups.
- Relatedly, the social safety net exacerbated some racial/ethnic disparities in child poverty: The safety net consistently played a greater role in protecting Black and White children from poverty, compared to Hispanic and Asian/Hawaiian/Pacific Islander children—the groups most likely to live in immigrant families.[2]
- As the safety net shifted its emphasis from out-of-work assistance to work-based assistance, it left behind children with the least resources, those in deep poverty whose parents were not stably employed.
Section 1: Subgroup characteristics associated with child poverty
Past research has repeatedly identified gaps in child poverty based on family characteristics and has connected these subgroup disparities to a confluence of social, economic, demographic, and public policy factors. Many root causes of poverty disparities are long-standing—consider, for example, the legacy of disparate community investment under the GI Bill and redlining, and a shifting labor market structure that provided declining real wages—especially to workers with lower levels of education. The influence of these policies continues today. Some causes of disparities are newer, such as the changes to eligibility criteria in the social safety net discussed in Chapter 3.
Given the social safety net’s increasing role in addressing child poverty from 1993 to 2019, which followed increases in safety net spending during that time frame, public officials need to know whether the safety net is helping reduce inequities, maintain the status quo, or increase inequities.
While the nation has come to contribute greater resources to the social safety net, families do not automatically receive its benefits based on their income. Multiple procedural steps stand between families and the benefits they need. To start, families need to know programs exist. They need to know which programs meet their needs. Armed with that knowledge, they must prove their eligibility for each program and apply for benefits, often through a separate application process for each program. Following successful enrollment, families may face waiting periods before receiving any, or full, benefits. They must comply with program-specific requirements, such as maintaining a minimum number of hours of work when programs have work requirements. At each step, families may encounter barriers that can influence their participation and the benefits they receive, resulting in wide variations in access by family characteristics, as well as by program and state.
We now discuss the four family characteristics of our subgroup analysis. For each, we provide our rationale for focusing on groups classified by this characteristic based on a brief overview of past research examining child poverty disparities and their root causes. Further, for each characteristic we examine how the social safety net might provide disproportionately greater or lesser support to different subgroups due to program design and/or administration.
Parental nativity
The vast majority of children in the United States today are U.S.-born citizens. For example, 93 percent of Latino children were born in the United States. However, the proportion of children living in immigrant families has grown steadily since the 1965 Immigration and Nationality Act, such that one quarter of all children in the United States (across racial and ethnic groups) lived with at least one foreign-born parent in 2019, compared with 6 percent of children in 1970.
Association with poverty. Immigrants may experience unequal access to the labor market—namely, to higher-wage jobs and stable employment—due to language barriers, lower levels of education reflecting the development of their country of origin, lower returns to education attained in other countries, and limited U.S. networks. A sizeable barrier to higher-wage jobs and stable employment is legal status in the United States, which impacts the one quarter of Hispanic children in the United States who have an unauthorized parent, for example. Previous research has found that these barriers place children with immigrant parents at risk for poverty and dampen the protective role of the social safety net.
Social safety net access. Much of the social safety net requires proof of legal immigration status or citizenship. Programs vary in their requirements: For instance, with the passage of the Personal Responsibility and Work Opportunity Reconciliation Act of 1996 (PRWORA), all family members were required to have a Social Security number to be eligible for the Earned Income Tax Credit (EITC). In addition, PRWORA introduced the five-year bar, which requires that immigrants hold a qualified status for at least five years before they become eligible for many social safety net programs. This bar keeps children in immigrant households—the vast majority of whom are U.S.-born citizens—from receiving benefits that their peers in non-immigrants families receive.
Even when the five-year bar does not apply directly to children, citizen children in immigrant families may not realize full social safety net benefits as compared to their peers without immigrant family members. For instance, in 2002, the five-year bar for immigrant children was removed for Supplemental Nutrition Assistance Program (SNAP) benefits. Still, SNAP benefits are prorated to the number of citizens or qualified immigrants in the household. An analysis showed that a non-immigrant family of four could receive $569 as their monthly SNAP benefit, but a family of four with two legal permanent residents who have not met the five-year bar requirement would receive only $459; if those parents had no legal immigration status in the United States, the monthly benefit would be only $193. States have the option to use their own funds to provide Temporary Assistance for Needy Families (TANF) and other programs to immigrants under the five-year bar or to non-qualified immigrants, although fewer than half do.
Additional factors limit access to the social safety net for children in immigrant families, even when they are eligible. The public charge rule, for example, while no longer in effect, has had a “chilling effect” on applications for benefits from families with members who are not U.S. citizens, who fear that receiving benefits may jeopardize their path to permanent residency. Indeed, mixed-status families and families with members who are not U.S. citizens are less likely to access anti-poverty programs—even when they are eligible.
Subgroup analysis. If any of a child’s residential parents were born outside of the United States, we consider them to be living in an immigrant family. If all residential parents were born in the United States, inclusive of U.S. territories, we consider the child to live in a non-immigrant family. Parental nativity is a broad measure of family immigration status that does not fully capture how immigrants with different legal statuses operate within society. That is, parental nativity does not distinguish between naturalized citizens, authorized immigrants, and immigrants lacking authorization in the United States. We anticipate that using parental nativity likely underestimates the high levels of poverty faced by children in immigrant households, in which not all family members are authorized to be in the United States. Differences between groups would likely be more stark if our measures of immigrant status included citizenship status or whether all household members have a Social Security number.
Race and ethnicity
Race and ethnicity are relevant to the study of child poverty because they are social constructs that shape families’ access to resources in U.S. society—both historically and in the present day. These constructs have become increasingly salient to the study of child poverty as the population of children in the United States has become more racially and ethnically diverse: Over the past quarter century, the number of Asian/Hawaiian/Pacific Islander children has almost doubled, the number of Black children has slightly declined, the number of Hispanic children has nearly doubled, and the number of White children has shrunk by about one fifth.
Association with poverty. Legacies of discrimination against people of color have had long-lasting consequences for determining which children are likely to live in poverty today. For example, Black residents in Southern states with more severe historical racial regimes (e.g., slavery and sharecropping, voter disfranchisement, and Jim Crow segregation) are still more likely to live in poverty. Additionally, large shares of Asian and Hispanic children live in immigrant households: 87 percent of Asian and 54 percent of Hispanic children had an immigrant parent in 2019. Since immigrant parents face structural barriers to both workforce entry and the social safety net, these racial and ethnic groups are also at elevated risks of living in poverty. In addition to these structural factors, interpersonal discrimination against American Indian/Alaska Native, Asian, Black, and Hispanic people is well-documented in housing, financing, and other areas of the private sector.
Social safety net access. Research has captured how multiple facets of social safety net programs (e.g., eligibility requirements, administrative burden, program features) and wide variation in program administration across states result in different levels of program access and benefit for families by race and ethnicity. Administrative burden, for example, leads to implicit exclusion of children of color, children from immigrant households, and children from households in which members do not speak English by making it more difficult for families to learn about benefits, apply for benefits, prove their eligibility, and comply with program requirements. Examples of administrative burden include disparate application processes for each program, reapplication procedures, health status screenings, waiting periods, the provision of program information and applications in English only, and programs’ occasional tendency to request sensitive information that is not required for eligibility. Research has found disparities in children’s access to Supplemental Security Income (SSI) along racial lines. In 2019, almost 10 percent of Hispanic children were uninsured, placing them at elevated risk of not receiving SSI benefits. Program generosity, or the dollar amount of a particular benefit, is a major contributor to the effectiveness of the benefit for lifting children out of poverty, and this feature is stratified by race. Research indicates that the least generous TANF and unemployment insurance programs are in states with higher proportions of Black residents, for example. An analysis of 2012-2014 data suggested that neutralizing differences in how states use TANF funds to address poverty could reduce the Black-White child poverty gap by 15 percent. In addition to these concerns, the immigration exclusions discussed earlier place Asian and Hispanic children at the greatest risk of experiencing poverty.
Subgroup analysis. We examine differences in child poverty rates by race and ethnicity due to the constraints families face—both current and historic—that bar their access to the economy, labor market, and social safety net based on their race and ethnicity. We operationalize race and ethnicity with four categories, following the precedent of the Census Bureau: Non-Hispanic Asian/Hawaiian/Pacific Islander, non-Hispanic Black, Hispanic, and non-Hispanic White.[3] Each of these groups is large and heterogeneous. The non-Hispanic Asian/Hawaiian/Pacific Islander group encompasses children with very different identities, including at least 21 ethnic Asian identities (e.g., Chinese, Asian Indian, Mongolian), as well as Native Hawaiians, Samoans, Chamorros, Tongans, and Fijians. Black children are also diverse; for example, they live within a wide diversity of family structures, including married and single-parent households and in grandparent homes where grandparents are the primary caregiver. Additionally, Hispanic children’s families are also diverse and vary by countries of heritage, citizenship status, languages spoken at home, and generational status—all factors tied to their likelihood of living in poverty.
As we have multiple subgroups to compare, we have chosen to use a disparity framing in this section and opted to use White children as the comparison group. While this is a common practice in subgroup analysis, we recognize that it centers the experiences of White children and frames their experiences as “normal” or “typical.” It is not ideal for any child to experience poverty, and the ideal comparison would be against a poverty rate of 0. However, because White children, as a group, are less likely to experience the structural barriers to the social safety net described above, we are using them as our reference group.
This analysis only scratches the surface of the diversity of racialized experiences of children and families in the United States. The Current Population Survey changed how it asked about race and ethnicity in 2003, limiting the groups that we could examine over time. We were not able to include American Indian or Alaska Native (AIAN) children in our analyses. Samples of AIAN children are limited to 500 to 600 children per year, and results are too unstable to present. Please refer to published estimates from the American Community Survey for poverty estimates for AIAN children, as well as for Native Hawaiian and Other Pacific Islander children (captured separately from Asian children).[4]
Family structure
Over the past quarter century, the share of children living in two-parent families, including both married parents and cohabiting parents, has remained more or less stable. Within this group, the proportion of children who live with two married parents has declined and the share of children living with cohabiting parents has increased. Cohabiting parents also contribute to families’ well-being, both in terms of earnings potential and the benefits that accrue to children from having multiple parents present.
Association with poverty. Two-parent families tend to have more economic resources than single-parent families by virtue of having a second adult in the household. With two parents, there are two potential earners in the family and greater earnings potential, as well as potential economies of scale. Two-parent families also have the potential to balance and share child care and household tasks. Meanwhile, single parents face less flexibility and sustainability of employment and additional challenges to labor force participation, including the need for accessible and affordable child care, wage inequities, and the lack of family-friendly work policies—challenges that all parents face but which are especially acute for single parents.
Social safety net access. Anti-poverty programs have shifted in their approach to serving children in two-parent vs. single-parent families over time. Critics of anti-poverty programs in the 1980s and 1990s—especially of Aid to Families with Dependent Children (AFDC), the predecessor to TANF—criticized these programs for discouraging work and encouraging single parenthood. Since the passage of PRWORA, one approach to reducing child poverty has been to encourage family stability through marriage and encouraging two-parent families. Indeed, one of TANF’s four purposes is to “encourage the formation and maintenance of two-parent families.” There is little evidence, however, that welfare reform led to more marriages or fewer unwed births.
Programs that prorate benefits based on earnings, giving larger benefits to families with higher incomes (e.g., the EITC, unemployment insurance, and Social Security), may provide larger benefits to two-parent families. However, means-tested programs that target families in deep poverty may be more accessible for single-parent families.
Subgroup analysis. We compare children living with single or no parents to those in two-parent families. We combine children living with one or no parents together to focus on the resources available to a child—for the reasons discussed above and for parsimony. In 2019, 34 percent of children lived in single-parent families, and 6 percent lived with neither parent (for example, with an aunt or grandparent without a parent present). We include biological parents as well as stepparents, adoptive parents, and cohabiting partners in determining whether a child lives in a two-parent household. This analytic decision may dampen the role of marriage penalties that count both partners’ incomes when determining eligibility because cohabiting partners are included in two-parent families.
Parental employment stability
The primary source of income for most children is their parents’ earned income. However, in 2019, more than one in four children lived in families in which no parent had a regular, full-time job. This does not, however, mean that their parents did not work at all. Parents without full-time employment may experience challenges finding stable work and must instead navigate temporary or short-term employment spells in jobs that are unpredictable and have high levels of churn.
Association with poverty. Nearly one third of parents in deep poverty experience long-term unemployment. Whatever the reason, a lack of secure parental employment can raise a child’s chances of experiencing deep poverty. Challenges to finding and maintaining secure employment can include health issues or disability, mismatches between skills and available jobs, limited job networks or resources, lack of access to affordable child care or transportation, and the many forms of discrimination that certain job seekers face. The loss of a job can also create an unfortunate cycle, as employment interruptions can raise red flags with future employers. Parents out of the labor force could also be attending school to improve their children’s future economic well-being.
Social safety net access. In 1935, during the Great Depression, the Social Security Act created the first federal welfare program for children (Aid for Dependent Children, renamed AFDC in 1962 and replaced by TANF in 1996). AFDC/TANF was specifically designed as an “out-of-work” safety net program, with the goal of providing aid to support the well-being and health of children living in families in which the primary wage earner (usually the father) was absent from the home, deceased, or unable to work. In the 1990s, however, concerns about AFDC/TANF disincentivizing work led to welfare reform. In 1996, PRWORA introduced work requirements to AFDC/TANF and funding for the program was capped; meanwhile, the EITC, which is conditioned on work, was significantly expanded.
Today, many social safety net programs have work requirements (e.g., TANF), are experimenting with work requirements (e.g., housing assistance), or tie benefits directly to employment and earned income (e.g., EITC and unemployment insurance). Work requirements assume that all parents can obtain and maintain stable employment, and programs with work requirements have time limits on job seeking. Many parents cannot meet those assumptions, however, as they face complex and often overlapping barriers to stable employment, including unstable housing, unreliable child care, health problems (including those that are not severe enough to qualify for exemptions or disability benefits), lack of education, and criminal records.
Other programs in the social safety net, such as the EITC, tie benefits to earned income. While some of the largest increases in federal spending from the early 1990s through the Great Recession were seen for work-conditioned programs such as the EITC, these programs do not equally benefit all children. Notably, children whose parents are unable to work—or whose work hours are limited due to disability, chronic health problems, or unreliable child care—may not receive the credit or may receive substantially smaller credits because their earned income is lower than required to receive the full benefit.
Subgroup analysis. We compare children with at least one stably employed parent to children without a stably employed parent. We define stable employment as all available residential parents working a combined total of at least 25 weeks in the past year, regardless of how many hours were worked. This simple definition of stable employment does not capture challenges associated with consistent but part-time work that may not afford a family access to benefits like health insurance.
Given the high risk of deep poverty for children without stably employed parents, we look at how the safety net protects children with both characteristics from poverty and deep poverty.
Section 2: Declines in child poverty, by subgroup
This section is dedicated to answering the following question: Did different groups of children experience similar declines in child poverty during the past quarter century’s historic decline in child poverty? For each of the four characteristics discussed previously, we also explore the resulting implications for child poverty disparities.
Parental nativity
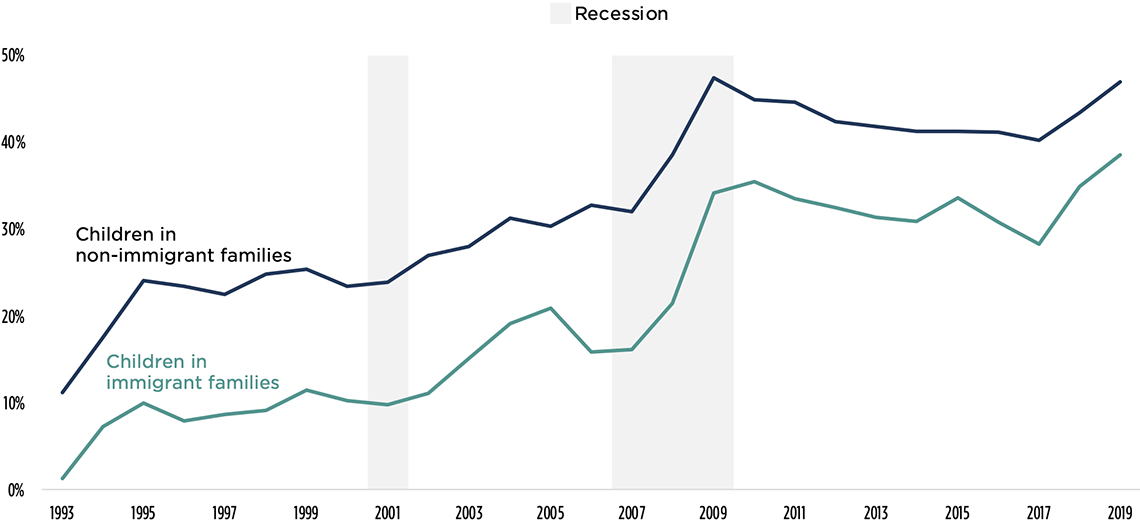
Child poverty rates declined by nearly two thirds from 1993 to 2019 for both children in immigrant families and children in non-immigrant families (see Figure 4.1). For children in immigrant families, child poverty decreased by 61 percent, from 41 percent in 1993 to 16 percent in 2019. Similarly, for children in non-immigrant families, poverty decreased from 24 percent in 1993 to 9 percent in 2019, a decrease of 62 percent. While the percentage point gap in child poverty rates by parental nativity decreased—from a gap of 16.2 percentage points in 1993 to a gap of 6.6 percentage points in 2019—children in immigrant families remain about 1.7 times as likely to be in poverty as children in non-immigrant families in both 1993 and 2019.
Figure 4.1. Child Poverty by Parental Nativity, as Measured by the Supplemental Poverty Measure (SPM), 1993-2019
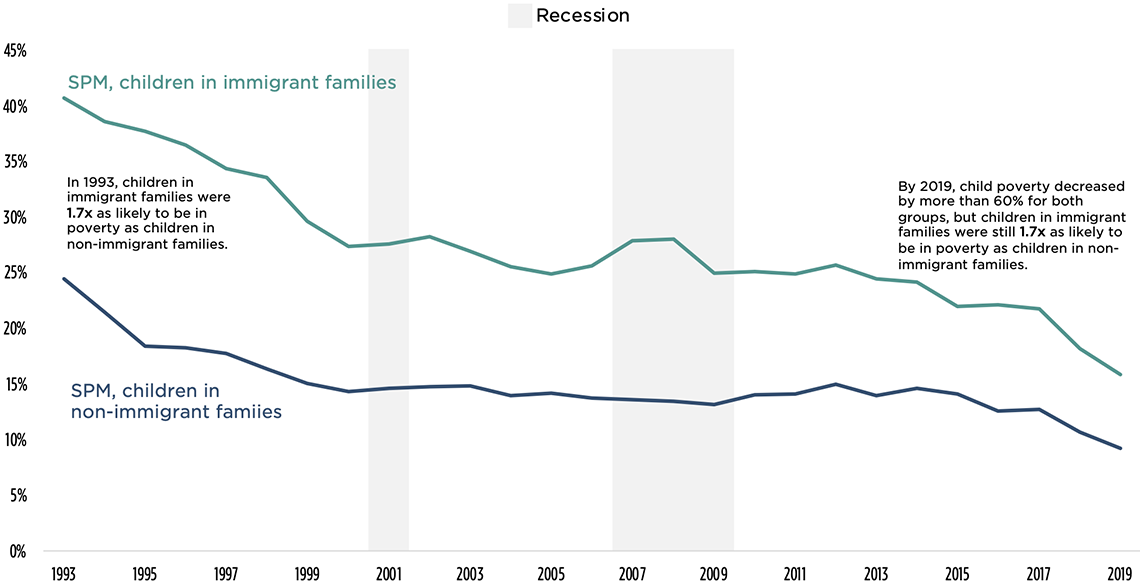
Notes: If any of a child’s residential parents were born outside of the United States, we consider them to be living in an immigrant family. If all residential parents were born in the United States, inclusive of U.S. territories, we consider the child to live in a non-immigrant family. The Current Population Survey did not ask about birthplace until 1994, so data are not presented before 1993 (the 1994 survey asks about income in 1993).
Sources: Child Trends’ analysis of the historical Supplemental Poverty Measure data from the Columbia Center on Poverty and Social Policy, anchored to 2012 thresholds and the CPS ASEC. Recession data are from the National Bureau of Economic Research.
Race and ethnicity
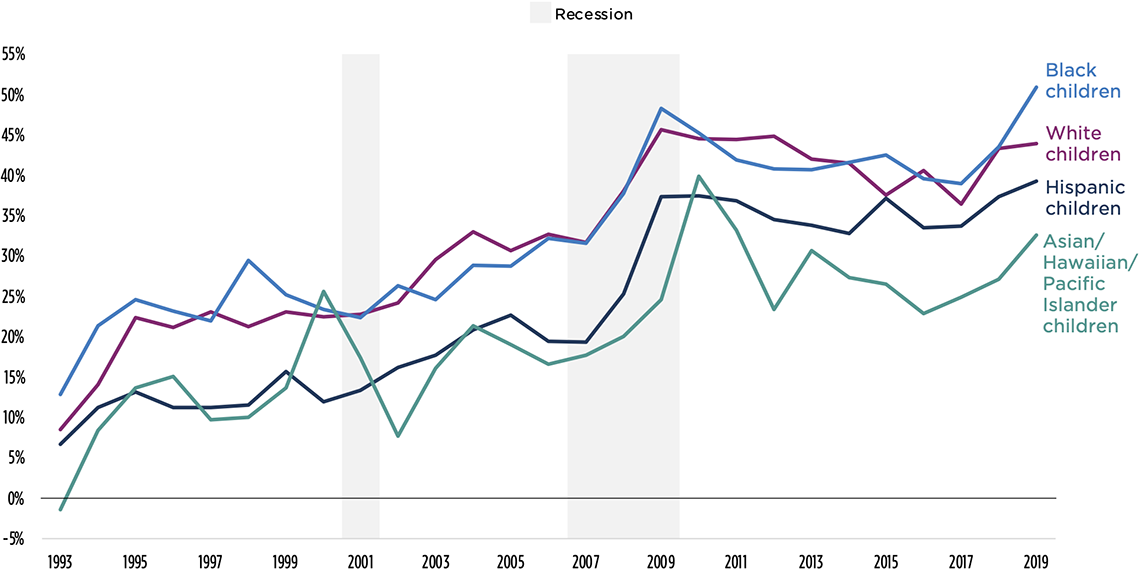
From 1993 to 2019, the percentage of children experiencing poverty decreased for all racial and ethnic groups at similar rates, between 63 and 66 percent (see Figure 4.2).
- For Asian/Hawaiian/Pacific Islander children, poverty decreased by 66 percent, from 27 percent in 1993 to 9 percent in 2019.
- For Black children, poverty decreased by 64 percent, from 49 percent in 1993 to 18 percent in 2019.
- For Hispanic children, poverty decreased by 64 percent, from 52 percent in 1993 to 19 percent in 2019.
- For White children, poverty decreased by 63 percent, from 18 percent in 1993 to 7 percent in 2019.
Because child poverty rates declined at similar rates across groups, relative disparities in poverty between racial and ethnic groups remained fairly stable over time. Focusing on White children (who consistently had the lowest levels of poverty) as the reference group, percentage point gaps with Asian/Hawaiian/Pacific Islander children, Black children, and Hispanic children shrank, respectively, from 9.5 percentage points to 2.9 percentage points, from 31.6 percentage points to 11.1 percentage points, and from 34.3 percentage points to 12.1 percentage points. Nevertheless, the percentage of Asian/Hawaiian/Pacific Islander, Black, and Hispanic children living in poverty—when compared to White children—remained relatively consistent in both 1993 and 2019: Asian/Hawaiian/Pacific Islander children remained about 1.5 times as likely to be in poverty as White children; Black children remained about 2.7 times as likely to be in poverty as White children, and Hispanic children remained about 2.9 times as likely to be in poverty as White children. Notably, Hispanic children are the racial/ethnic group with the largest number of children in poverty.
Figure 4.2. Child Poverty by Race and Ethnicity, as Measured by the Supplemental Poverty Measure (SPM), 1993-2019
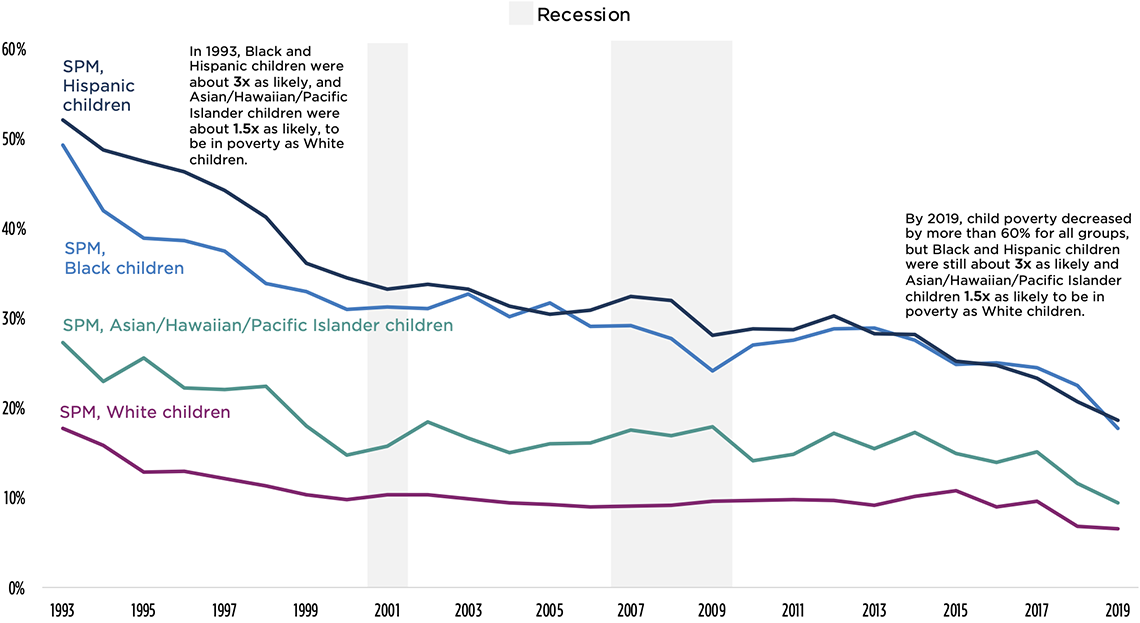
Notes: The Current Population Survey changed its race and ethnicity questions in 2003, limiting the groups that can be examined over time. We present data starting in 1993 in order to include the Asian/Hawaiian/Pacific Islander group. We were not able to include American Indian or Alaska Native (AIAN) children in our analyses due to sample size limitations.
Sources: Child Trends’ analysis of the Historical Supplemental Poverty Measure Data and CPS ASEC. Recession data are from the National Bureau of Economic Research.
Family structure
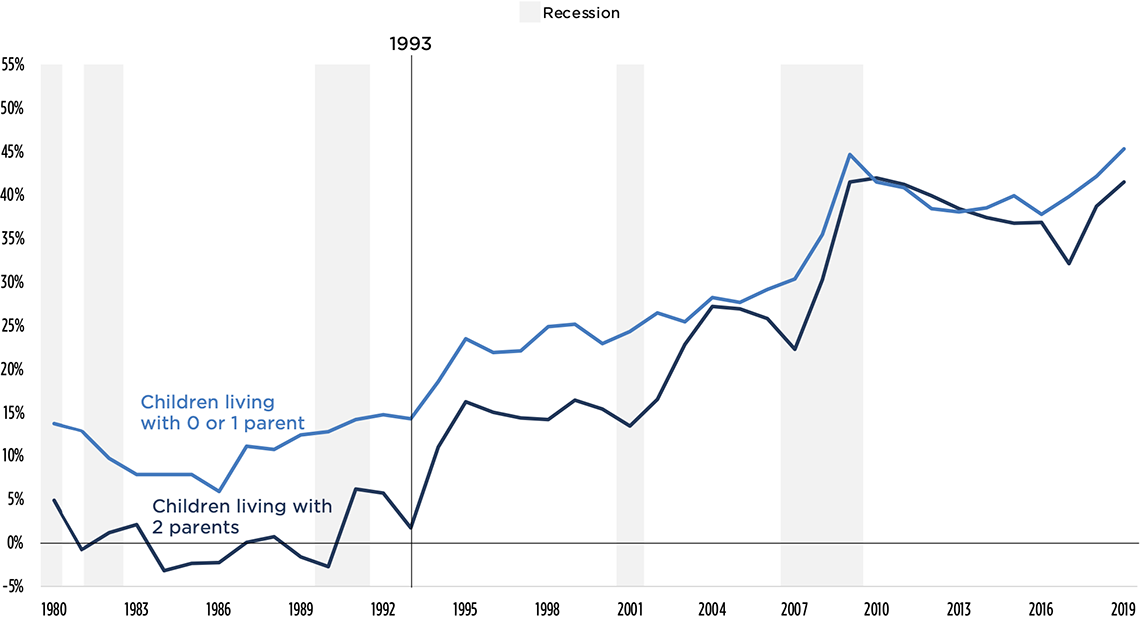
Child poverty rates decreased at similar rates for both children in two-parent families and families with one or no parents from 1993 to 2019 (see Figure 4.3). For children in two-parent families, poverty decreased by 60 percent, from 18 percent in 1993 to 7 percent in 2019. For children in families with one or no parents, illustrated in light blue, poverty decreased by 54 percent, from 51 percent in 1993 to 23 percent in 2019.
Consistently, though, poverty rates for children in two-parent families have been much lower than for children living with one or no parents. In 1993, rates of poverty for children living with two parents were 33.3 percentage points lower than for children living with a single parent or no parents. In 2019, this absolute difference fell to 16.1 percentage points.
When looking at relative rates, however, we see that children living with one or no parents remain about three times as likely to be in poverty as children living with two parents, in both 1993 and 2019. In other words, the relative inequities in poverty rates between children in two-parent families and children living with one or no parents persisted from 1993 to 2019.
Figure 4.3. Child Poverty by Family Structure, as Measured by the Supplemental Poverty Measure (SPM), 1980-2019
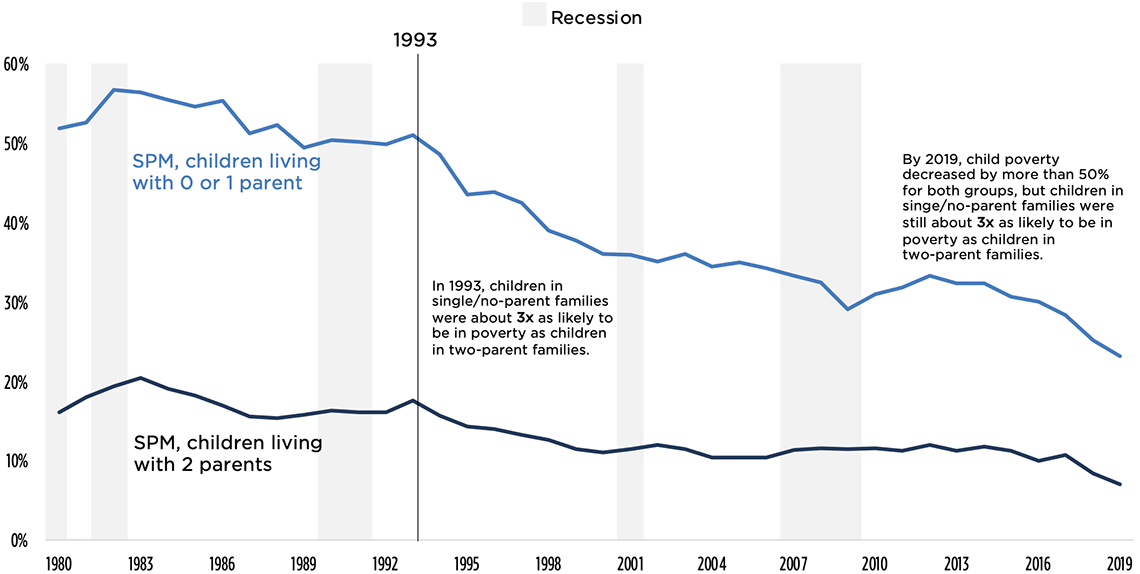
Notes: We provide data back to 1980 to provide context for the decline in child poverty that occurred from 1993 to 2019. We include biological parents as well as stepparents, adoptive parents, and cohabiting partners in determining whether a child lives in a two-parent household.
Sources: Child Trends’ analysis of the historical Supplemental Poverty Measure data from the Columbia Center on Poverty and Social Policy, anchored to 2012 thresholds and the CPS ASEC. Recession data are from the National Bureau of Economic Research.
Parental employment stability
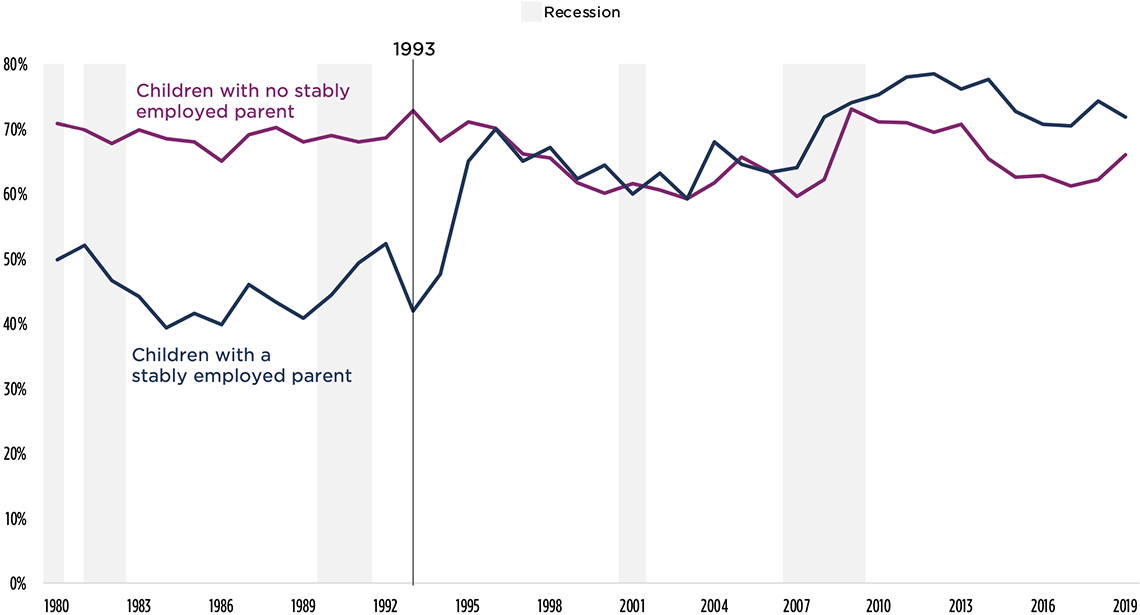
Child poverty rates declined at different rates for children with and without stably employed parents from 1993 to 2019. Child poverty rates declined by 28 percent for children without stably employed parents, from 71 percent to 52 percent. However, for children with stably employed parents, child poverty rates fell faster in relative terms: For these children, child poverty declined by 61 percent, from 18 percent to 7 percent.
Given the high risk of deep poverty for children without stably employed parents, we also look at how deep poverty rates changed for children with and without stably employed parents.
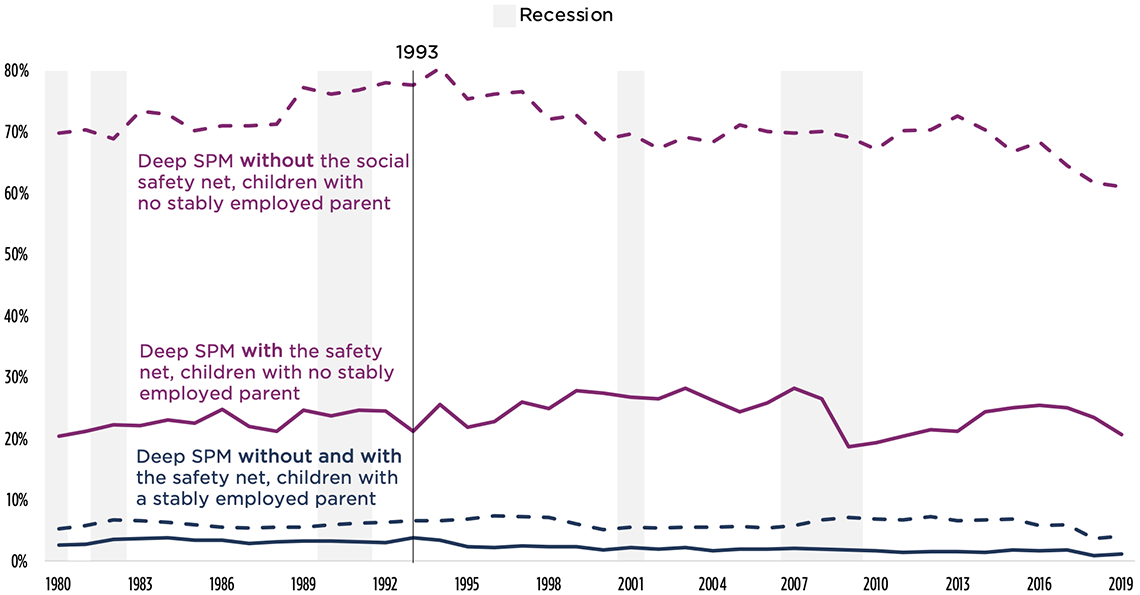
Child deep poverty rates declined for children with stably employed parents from 1993 to 2019, but remained about the same for children without stably employed parents (see Figure 4.4). In 1993, one in five children (21%) without a stably employed parent lived in deep poverty.[5] Twenty-six years later, in 2019, the share of children without a stably employed parent in deep poverty remained essentially unchanged, at 21 percent. On the other hand, over the same period, the deep poverty rate for children with at least one stably employed parent decreased from 4 percent to 1 percent—a decline of 69 percent. Children with stably employed parents are less likely to live in deep poverty than children without stably employed parents, and this disparity grew over time.[6]
Figure 4.4. Child Deep Poverty (<50% Supplemental Poverty Measure, or SPM) by Parental Employment Stability, as Measured by the SPM, 1980-2019
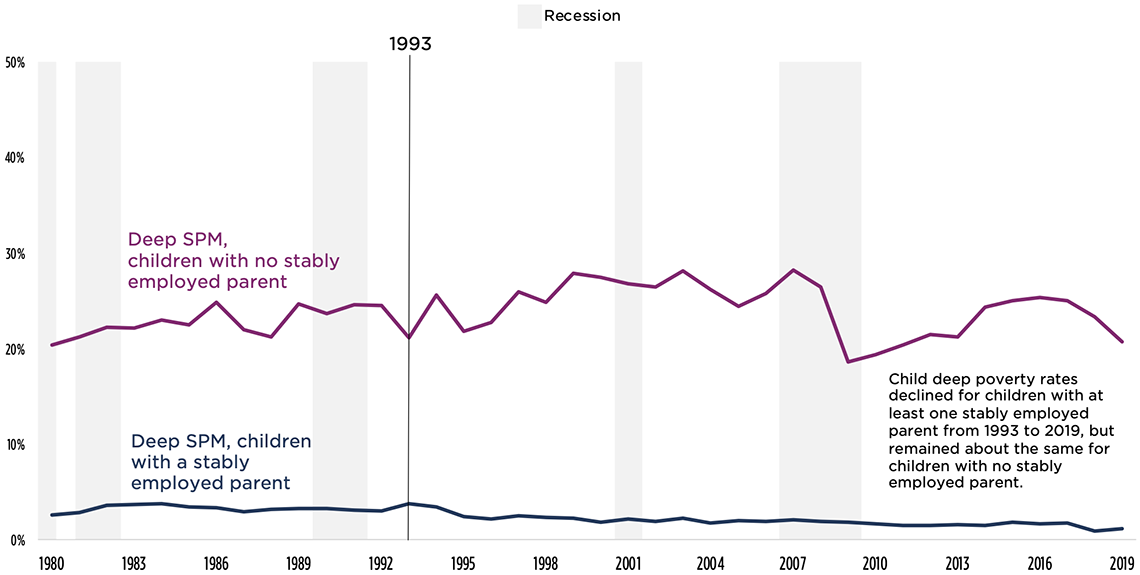
Notes: We provide data back to 1980 to provide context for the decline in child poverty that occurred from 1993 to 2019. We define stable employment as all available residential parents working a combined total of at least 25 weeks in the past year, regardless of how many hours were worked.
Sources: Child Trends’ analysis of the historical Supplemental Poverty Measure data from the Columbia Center on Poverty and Social Policy, anchored to 2012 thresholds and the CPS ASEC. Recession data are from the National Bureau of Economic Research.
Section 3: Contribution of the social safety net to the decline in child poverty, by subgroup
We now transition to our second research question: To what extent does the social safety net protect children from poverty in each subgroup? In this section, we examine the contribution of the social safety net to protecting children from poverty for the same four subgroups of children discussed previously.
For each subgroup, we first examine child poverty rates with and without the social safety net. As in the previous analysis, we provide multiple measures to illustrate what we found. Dashed lines in the figures show the pre-tax-and-transfer (PTT) poverty rate for each group, or what the poverty rate would have been without the social safety net. Solid lines show rates based on the Supplemental Poverty Measure (SPM), which factors in the resources provided by the social safety net. The area between the dashed and solid lines—the percentage point difference—is the absolute contribution of the social safety net toward child poverty reduction for a subgroup. We then provide a relative measure of the social safety net’s contribution to each subgroup, illustrated in a second figure, by presenting the percent decline in child poverty due to the social safety net. This second figure supports more direct comparisons between subgroups examined.
Parental nativity
The role of the social safety net in reducing child poverty grew dramatically over time for children in both immigrant families and non-immigrant families. As illustrated in Figure 4.5, the social safety net reduced poverty by 0.5 percentage points for children in immigrant families and by 3.1 percentage points for children in non-immigrant families in 1993. By 2019, that contribution grew to a reduction of 9.9 percentage points for children in immigrant families and 8.1 percentage points for children in non-immigrant families. For kids in immigrant families, the social safety net lowered poverty by a relatively small amount until about 2003, when its role began to grow. The growth of the social safety net accelerated during the Great Recession for children in immigrant families. SPM poverty rates continued to decrease this group through the Great Recession, whereas they slightly increased for children in non-immigrant families. During this time, the social safety net played a larger absolute role for kids in immigrant families than for kids in non-immigrant families. After the Great Recession, the percentage point reduction in poverty due to the social safety net shrank for both groups.
Figure 4.5. Child Poverty by Parental Nativity, With and Without the Social Safety Net, 1993-2019
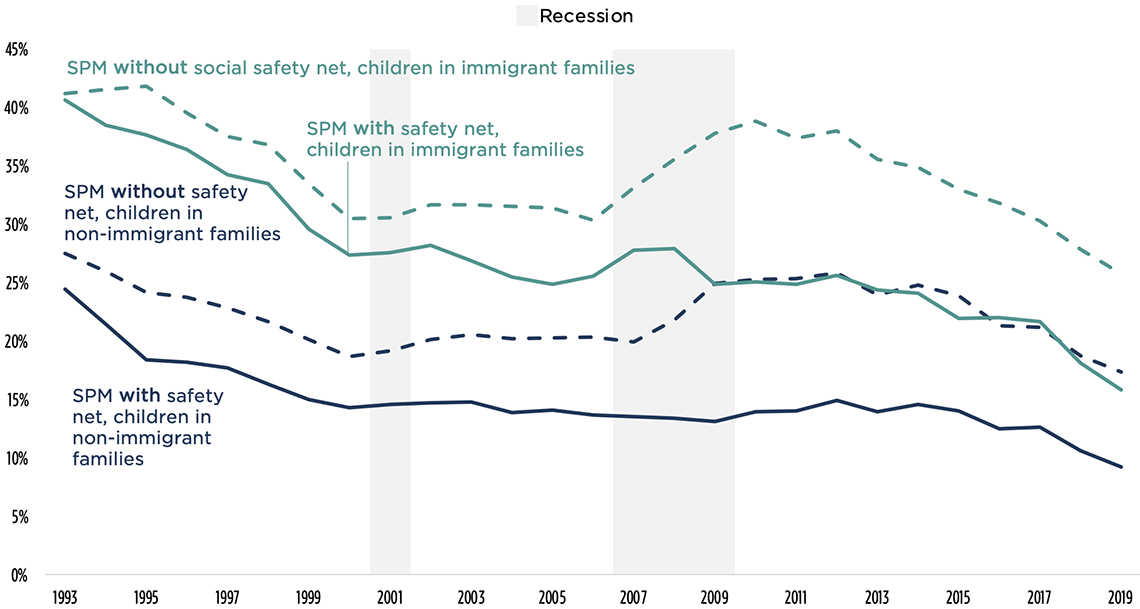
The social safety net played a consistently larger relative role in reducing child poverty for children in non-immigrant families than for children in immigrant families from 1993 to 2019, exacerbating child poverty disparities by immigration status. Figure 4.6 below illustrates the degree to which the social safety net reduced child poverty rates for children in immigrant families (in green) and children in non-immigrant families (in dark blue). Similar to Figure 4.5, this figure illustrates the growth in the role of the social safety net over time for each group: In 1993, the social safety net reduced child poverty by 1 percent for children in immigrant families and by 11 percent for children in non-immigrant families. This grew to 39 percent and 47 percent, respectively, by 2019. The social safety net was consistently associated with a larger percent decrease in child poverty for children in non-immigrant families than for children in immigrant families.[7]
Because the social safety net disproportionately benefited children in non-immigrant families, it exacerbated pre-existing disparities in child poverty by parental nativity. Before the social safety net, kids in immigrant families were 1.5 times as likely to live in poverty as kids in non-immigrant families in 2019. After accounting for the social safety net, kids in immigrant families were 1.7 times as likely to live in poverty.
Figure 4.6. Percent Decrease in Child Poverty Attributable to the Social Safety Net, by Parental Nativity, 1993-2019
Importantly, our results likely overestimate the role of the social safety net for children in immigrant families, relative to children in non-immigrant families, due to the limitations with the simulation of the EITC explained in Chapter 3. EITC values in the Historical SPM Dataset are simulated based on family income, and on family structure and composition, and do not account for family ineligibility on the basis of household members’ immigration status. That is, the Historical SPM Dataset captures the potential, rather than the actual, reach of the EITC. Based on these values, our analysis suggests that the EITC may have the potential to decrease gaps in poverty between children with immigrant and non-immigrant parents, as immigrant families are more likely to have two parents and thus two incomes. However, as the estimate of the total role of the social safety net in protecting children from poverty includes the potential role of the EITC, this subgroup analysis likely overstates the support provided to children in immigrant families. As a result, this analysis likely also underestimates the extent to which the social safety net exacerbates disparities between child poverty rates in households based on parental nativity status. The overestimation of the EITC’s anti-poverty role using simulation methods has also been noted in recent work by Maggie Jones and James Ziliak.
Race and ethnicity
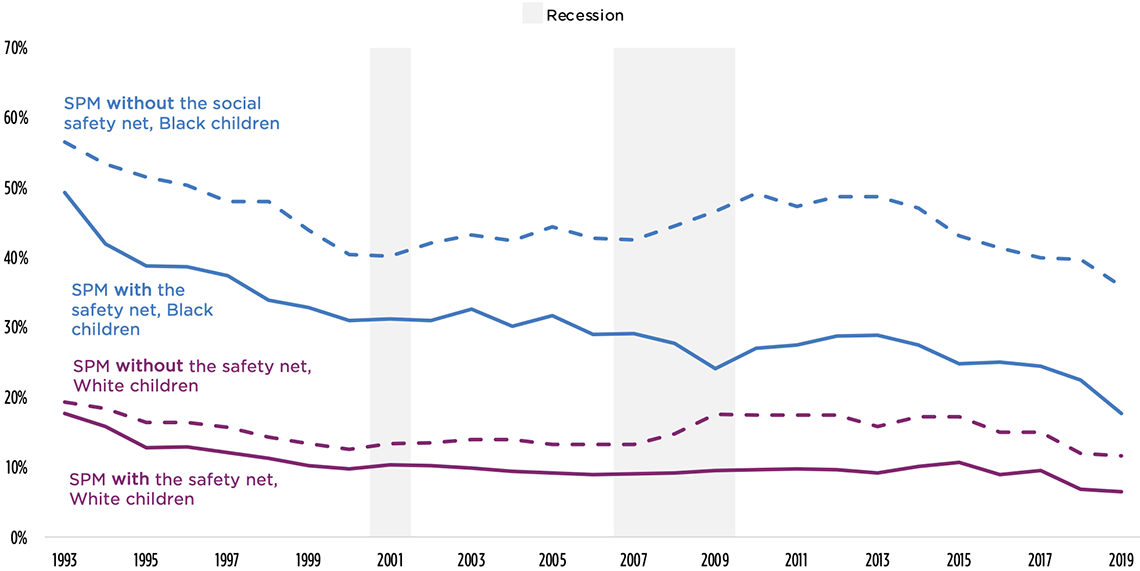
The size of the social safety net’s role in protecting children from poverty grew over time for children of all races and ethnicities. The growth in the size of the social safety net’s role was particularly large for Black and Hispanic children, especially during the Great Recession. In Figure 4.7, this growth is illustrated by the expanded space between the solid and dashed lines around the Great Recession for Black and Hispanic children, before shrinking again post-recession. In absolute terms, in 2019, the social safety net lowered poverty by more percentage points for Black and Hispanic children than for White or Asian/Hawaiian/Pacific Islander children: The social safety net lowered poverty by 18.3 percentage points for Black children, 12.0 percentage points for Hispanic children, and about 5 percentage points for White and Asian/Hawaiian/Pacific Islander children.
Figure 4.7. Child Poverty, by Race and Ethnicity With and Without the Social Safety Net, as Measured by the Supplemental Poverty Measure (SPM), 1993-2019
Asian/Hawaiian/Pacific Islander
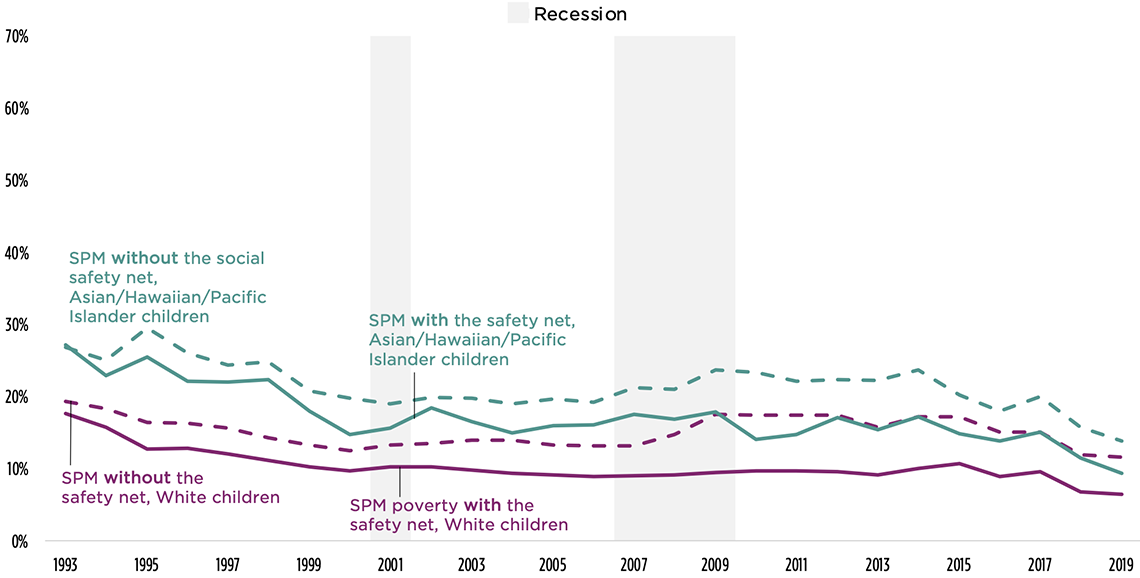
Black
Hispanic
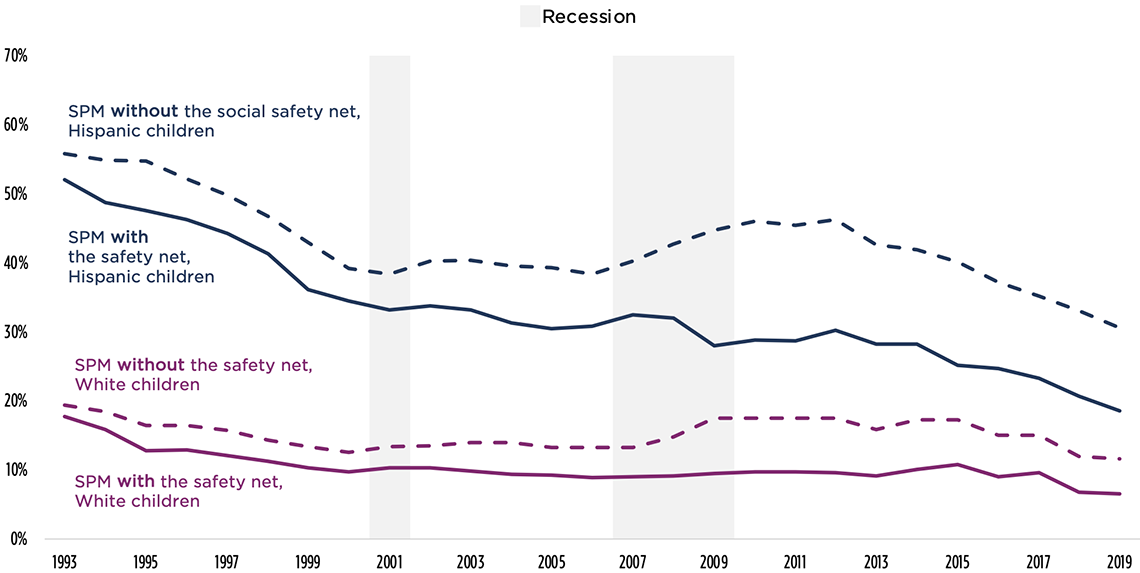
The relative decrease in poverty due to the social safety net has been consistently larger for Black and White children, and smaller for Hispanic and Asian/Hawaiian/Pacific Islander children—exacerbating disparities in poverty rates between White children and Hispanic or Asian/Hawaiian/Pacific Islander children. In 2019, the social safety decreased poverty by about 51 percent for Black children, 44 percent for White children, 39 percent for Hispanic children, and 33 percent for Asian/Hawaiian/Pacific Islander children (see Figure 4.8).[8] The social safety net was more supportive of Black children than White children in 2019, and slightly reduced disparities in poverty between Black and White children that year, but this was a historical blip. In most years—and even recently—the social safety net has played near-equal roles in reducing poverty for Black and White children.
Without the social safety net, Asian/Hawaiian/Pacific Islander children were 1.2 times as likely as White children to be in poverty. Accounting for the role of social safety net, though, this disparity grew so that Asian/Hawaiian/Pacific Islander children were 1.4 times as likely to be in poverty as White children in 2019. Without the social safety net, Hispanic children were 2.6 times as likely as White children to be in poverty; with the social safety net, though, this difference grew slightly to 2.9 times as likely.
Again, these estimates may underestimate disparities for groups with high proportions of immigrant families (particularly Asian and Hispanic children) due to the EITC-related data limitations mentioned earlier.
Figure 4.8. Percent Decrease in Child Poverty Attributable to the Social Safety Net, by Race and Ethnicity, 1993-2019
Family structure
The social safety net’s role in protecting children from poverty grew for both children living with two parents and children living with no or one parent. In 2019, the social safety net decreased poverty by 19.1 percentage points for children living in families with a single parent or no parents, and by 5.0 percentage points for children living with two parents. Consistently, though, the social safety net has played a larger absolute role in protecting children living in families with one or no parents from poverty than for children in two-parent families. In other words, the social safety net has consistently lowered poverty by more percentage points for children in no- or one-parent families than for children living with two parents (see Figure 4.9).
Figure 4.9. Child Poverty, by Family Structure With and Without the Social Safety Net, 1980-2019
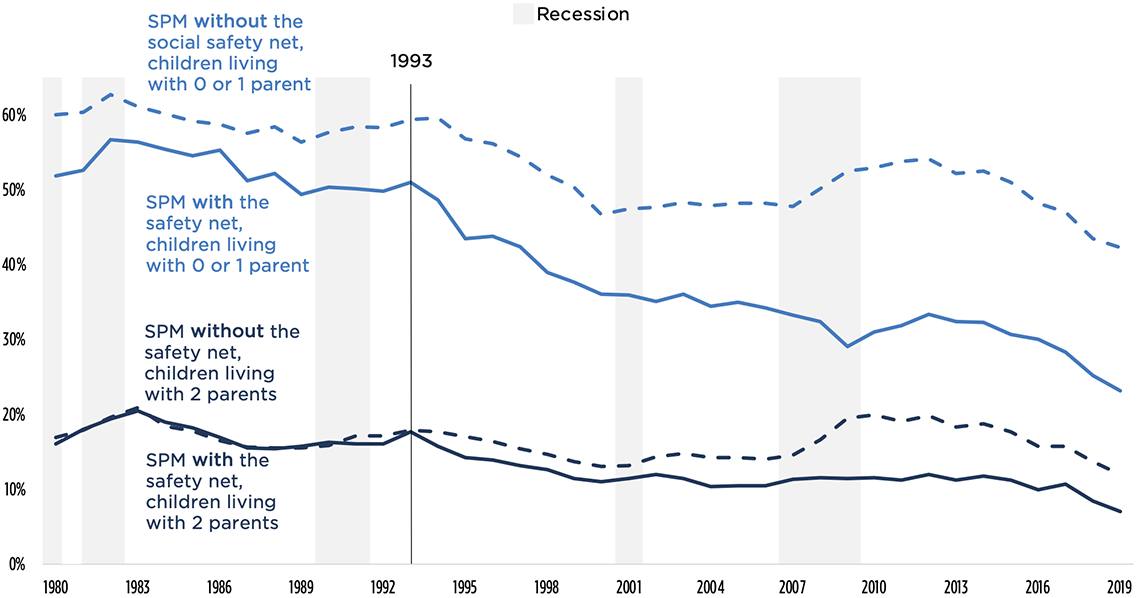
The relative contribution of the social safety net is relatively comparable for children regardless of their family structure and may slightly reduce disparities in poverty rates by family structure. Once we consider the elevated poverty rates of children living in families with single or no parents, the social safety net’s role in protecting children from poverty looks much more similar for children with single or no parents and children with two parents. Prior to 2005, the social safety net played a larger role in reducing poverty in single-parent families than in two-parent families—meaning that it helped narrow disparities between the two groups (see Figure 4.10). In both 2002 and 2009, the relative role of the social safety net in protecting children from poverty increased steeply for children in two-parent families, corresponding to two policy interventions in the EITC that reduced the “marriage penalty.” Note that the role of marriage penalties may be muted in our analysis as we group children living with two parents together, including those with cohabitating parents and married parents. Since the Great Recession, the contribution of the social safety net in reducing poverty has been relatively comparable for children in two-parent families and those in zero- or one-parent families.
Figure 4.10. Percent Decrease in Child Poverty Attributable to the Social Safety Net, by Family Structure, 1993-2019
Without the social safety net, children in zero- or one-parent families were 3.5 times as likely to live in poverty as children in two-parent families in 2019. After accounting for the social safety net, though, this disparity is slightly diminished so that children living in families with zero or one parent were 3.3 times as likely to live in poverty.
Parental employment stability
The social safety net’s role in protecting children from poverty grew for both children with and without stably employed parents. In 1993, the social safety net was associated with a 15.3 percentage point decrease in poverty for parents without stably employed parents, which rose to a 22.7 percentage point decrease in 2019. For children with stably employed parents, the social safety net accounted for a 0.3 percentage point decrease in poverty in 1993, which rose to 7.3 percentage points by 2019.
The relative decrease in poverty due to the social safety net is, as of 2019, larger for children with stably employed parents than for children without stably employed parents. This represents a dramatic shift from the role of the social safety net in earlier years, when the relative decrease in poverty was larger for children without stably employed parents. In 1993, the social safety accounted for an 18 percent decrease in child poverty for children without stably employed parents, and a 2 percent decrease for children with stably employed parents. However, by 2019, the social safety net accounted for 51 percent of the decrease in poverty for children with stably employed parents, and only 31 percent of the decrease for children without stably employed parents.
Given the high risk of deep poverty for children without stably employed parents, we also look at changes in the social safety net’s role in reducing deep poverty rates for children with and without stably employed parents.
The story shifts for deep poverty: In absolute terms, the social safety net consistently played a larger role in protecting children without a stably employed parent from deep poverty than it did for children with at least one stably employed parent; however, its role in protecting children from deep poverty has decreased over time. In 1993, the social safety net decreased deep poverty rates by 2.8 percentage points for children with stably employed parents and by 56.5 percentage points for children without stably employed parents (see Figure 4.11). In 2019, the social safety net reduced deep poverty rates for children without stably employed parents by 40.3 percentage points (reducing deep poverty from 61% to 21%). In comparison, the social safety net reduced deep poverty by 3.0 percentage points for children with stably employed parent(s) in 2019.
Over time, deep poverty rates without the social safety net declined for children without stably employed parents from 1993 to 2019 (shown in magenta in Figure 4.11), partially thanks to the economic and demographic factors described in Chapter 2. At the same time, after accounting for the social safety net, deep poverty rates for this group remained pretty stable. This indicates that the absolute role of the social safety net shrank over time for kids without stably employed parents.
Figure 4.11. Child Deep Poverty, by Parental Employment Stability With and Without the Social Safety Net, 1980-2019
In relative terms, the social safety net played a larger role in reducing deep poverty for children without stably employed parents before welfare reform, but now plays a comparatively larger role in reducing deep poverty for children with stably employed parents; as a result, we see the exacerbation of disparities. Accounting for the much higher poverty rates among kids without stably employed parents adds another layer to this story (see Figure 4.12). Prior to and including 1993, the social safety net reduced poverty by about 70 percent for children without stably employed parents, compared to 40 to 50 percent for children with stably employed parents.
Between 1996 and the Great Recession, though, the story was very different. The role of the social safety net for children without stably employed parents decreased, while its role for children with stably employed parent dramatically increased—such that the role of the social safety net was roughly equal for both subgroups of children. Since the Great Recession, the social safety net has proportionally reduced poverty more for children with at least one stably employed parent than for children without a stably employed parent.
Figure 4.12. Percent Decrease in Child Deep Poverty Attributable to the Social Safety Net, by Parental Employment Stability, 1993-2019
By 2019, the social safety net had exacerbated disparities in deep poverty between children based on their parents’ employment status. The social safety net was more beneficial for children with lower poverty rates. Because children living without stably employed parents were more likely to be in deep poverty, and because the social safety net was less effective for these families, the safety net exacerbated disparities by parental employment stability.
Section 5: Summary and discussion
In this chapter, we examined whether various subgroups of children experienced similar declines in child poverty over the past quarter century, and the extent to which these subgroups benefitted from the social safety net. The first question points to the potential for large-scale change in the experience of child poverty in the United States. The second question shines a light on a system that has the potential to maintain—or ameliorate—disparities in child poverty.
Child poverty rates declined—and declined at similar rates—for nearly every subgroup examined. This is, in many ways, a success story. As the nation increased its investment in anti-poverty programs, reductions in child poverty were experienced similarly across groups of children with different backgrounds. The exception to this pattern is seen among children without stably employed parents: The likelihood of poverty, and particularly deep poverty, for a child whose parents are not stably employed did not dramatically decline from 1993 to 2019. Worse, the likelihood of deep poverty for this group of children remained unchanged.
Yet this is also a story about inequity. Disparities in child poverty persisted throughout this time period, and children in immigrant families, Black children, Hispanic children, children living in families with single or no parents, and children without a stably employed parent remain far more likely to live in poverty (and in deep poverty, in the case of parental employment) than their peers.
It’s important to keep in mind, however, that demographics are not destiny. While some groups of children are at an elevated risk of living in poverty due to a range of social, political, and economic factors, no child is destined to live in poverty.
Taking a step back, we found that the role of the social safety net in decreasing child poverty grew dramatically for nearly all subgroups from 1993 to 2019. This is also a success story: As spending on the social safety net increased, all subgroups examined were able to draw an increasing benefit over time, resulting in decreased exposure to poverty for children. Again, there was one exception to this pattern: The role of the social safety net in reducing deep poverty rates among children without stably employed parents did not grow.
Inequity, again, is a consistent thread in the narrative. In 2019, the social safety net excerbated existing inequities in child poverty by parental nativity, for some racial/ethnic groups, and by parental employment stability. These disparities mirror policy decisions that tie benefits to a child’s family characteristics, rather than their level of need.
Children in immigrant families face growing obstacles that impede their access to the current social safety net, relative to their peers in non-immigrant families. This is likely due to policies that specifically block these children—including U.S-citizen children—from receiving the full benefits of the social safety net based on the citizenship status of their family members. For example, the EITC—the largest program protecting children from poverty—requires all family members to have a Social Security number. Our analysis very likely underestimates the role of these exclusionary eligibility criteria, as we used parental nativity as a proxy for family immigration status. If we looked at parents’ citizenship or immigration status, disparities would likely be more pronounced. For example, previous estimates have placed child poverty rates as high as 33 percent for non-citizen children in households with unauthorized immigrant household members. In addition to explicit exclusionary criteria, immigrant families may face additional hurdles to accessing the social safety net, including administrative burdens such as language barriers, as well as hesitancy to participate in programs due to chilling effects of anti-immigrant sentiment. Given the barriers that immigrant families face, the social safety net is not as influential in lifting children in immigrant families out of poverty as it is for children with all U.S.-born parents, and thus exacerbates inequities in child poverty.
The social safety net exacerbates inequities in child poverty by race and ethnicity. While immigration exclusion policies may appear on their face to be race-neutral, they are, in fact, not. Indeed, previous research found that the largest contributor to the Hispanic-White and Asian-White gaps in poverty was immigration. Asian and Hispanic children are most likely to feel the effects of immigrant exclusion policies, as 87 percent of Asian and 54 percent of Hispanic children had an immigrant parent in 2019. It follows, then, that the social safety net, as a whole, has consistently played a greater role in protecting Black and White children from poverty, compared to Hispanic and Asian children. This finding is especially problematic as the country becomes more racially and ethnically diverse. Notably, Hispanic children are the racial/ethnic group with the largest number of children in poverty. As explained in Chapter 2, increases in the share of Hispanic children and children in immigrant families were associated with increases in child poverty rates. This does not need to be the case, however. Immigrant exclusion criteria help to explain why this is currently true, and, crucially, help explain what can be done about the issue.
The social safety net may slightly reduce disparities in child poverty between children in two-parent families and children in one- or no-parent families. This was a surprising finding, given our earlier analyses indicating that the EITC was the most significant program for child poverty reduction. Because the EITC is designed to provide greater benefit for households with greater incomes, children in two-parent households (with two wage earners) are best able to draw the full benefits of the EITC.
The social safety net’s role in protecting children without stably employed parents from deep poverty did not expand. In contrast with every other group examined, the social safety net did not expand to support children whose parents are not stably employed from deep poverty. Rather, children whose parents do not or cannot work—a situation over which a child has no control—are largely left behind in today’s social safety net following the shift to work-based programs in the early- to mid-1990s. Conditioning benefits on work presumes that all parents can work and can find a job. However, social forces often shape who is able to work a regular, full-time job. Access to the labor market may be challenging for parents with disabilities; immigrant parents without work authorization; Black, AIAN, and Hispanic parents facing discrimination in the labor market; and single parents who need accessible, affordable child care in order to work, to name a few examples.
Some readers may reflect on our findings of similar declines in child poverty rates, but differential roles of the social safety net across subgroups, and ask themselves: How is it possible that child poverty rates declined at similar rates across groups, when children benefitted from the social safety net to different degrees? Exploratory analyses presented in Chapter 2 suggest that children in immigrant families and some racial/ethnic groups may have benefitted more from some economic and demographic shifts during this time period, potentially compensating for lower levels of support from the social safety net. For example, increases in the minimum wage may have especially benefitted Hispanic children, Black children, and children in immigrant families.
Our analytical approach prioritized breadth, opting to look at many different subgroups of children over a deep dive into any single group—or at the intersections between groups of children. Fortunately, existing research points to important intersectional nuances of our findings. For example, men born outside of the United States have higher labor force participation rates than men born in the United States, which should theoretically grant immigrant families access to a work-based social safety net. But, welfare reform restricted immigrants’ access to the social safety net based on their immigration status, even if they were otherwise qualified.
Similarly, our study focused on the direct role of social safety net benefits in increasing a family’s resources. We did not examine any indirect role that the social safety net may have had on child poverty rates through behavioral changes that may affect the economic and demographic factors examined in Chapter 2, among others. Evidence from welfare-to-work experiments from the early 1990s and more recent research consistently indicate that work requirements can boost short-term employment and earnings, but do not have their intended effect of getting people stable jobs that sustainably lift them out of poverty with their incomes. Similarly, there is little evidence that expansions to the social safety net disincentivize people from seeking out employment. But prior research has found that the growth of the EITC, which is conditional on earnings, has indeed led to increased employment, particularly among single mothers.
In sum, declines in child poverty have been remarkably consistent across demographic groups to date (with the exception of children without stably employed parents), but these trends leave disparities in place. Continuing the historic decline in child poverty will require steps to address the root causes of absolute differences in child poverty across subgroups. There are multiple paths forward, including making the social safety net more equitable.
Click to continue to Chapter 5: Summary of Findings
View Chapter 5Chapter 4 Endnotes
[1] We were unable to examine children of parents with disabilities as a subgroup due to data limitations described in Chapter 5.
[2] We were unable to separate out Asian, native Hawaiian, and other Pacific Islander children due to data limitations.
[3] Throughout the report, we drop “non-Hispanic” from descriptions for parsimony.
[4] Specifically, the c17001A-I table series on data.census.gov provides these data.
[5] Deep poverty is defined as having an income less than 50 percent of the SPM poverty threshold. In 2019, this is less than approximately $14,440 for a two-adult, two-child household that rents.
[6] We do not present a ratio of poverty by parental employment stability because the poverty rate for children with stably employed parents is very low.
[7] Ideally, we would examine the role of the social safety net in earlier years as well, to serve as a longer reference period before additional immigrant eligibility restrictions were put in place in 1996 with PRWORA and the Illegal Immigration Reform and Immigrant Responsibility Act of 1996. However, the Current Population Survey did not ask about birthplace before 1994, so we are not able to extend this analysis earlier.
[8] This is a case where the absolute measures and relative measures of declines in child poverty seem in conflict. Given the higher child poverty rates for Hispanic children, the social safety net plays a larger absolute role, but a smaller relative role, in reducing child poverty for these groups.
© Copyright 2024 ChildTrendsPrivacy Statement
Newsletter SignupLinkedInThreadsYouTube