


04/13/24
INRIX identifies 1200+ traffic bottlenecks in totality path
On April 8, 2024, a total solar eclipse stretched across North America from Mexico to Canada, experiencing complete totality across...
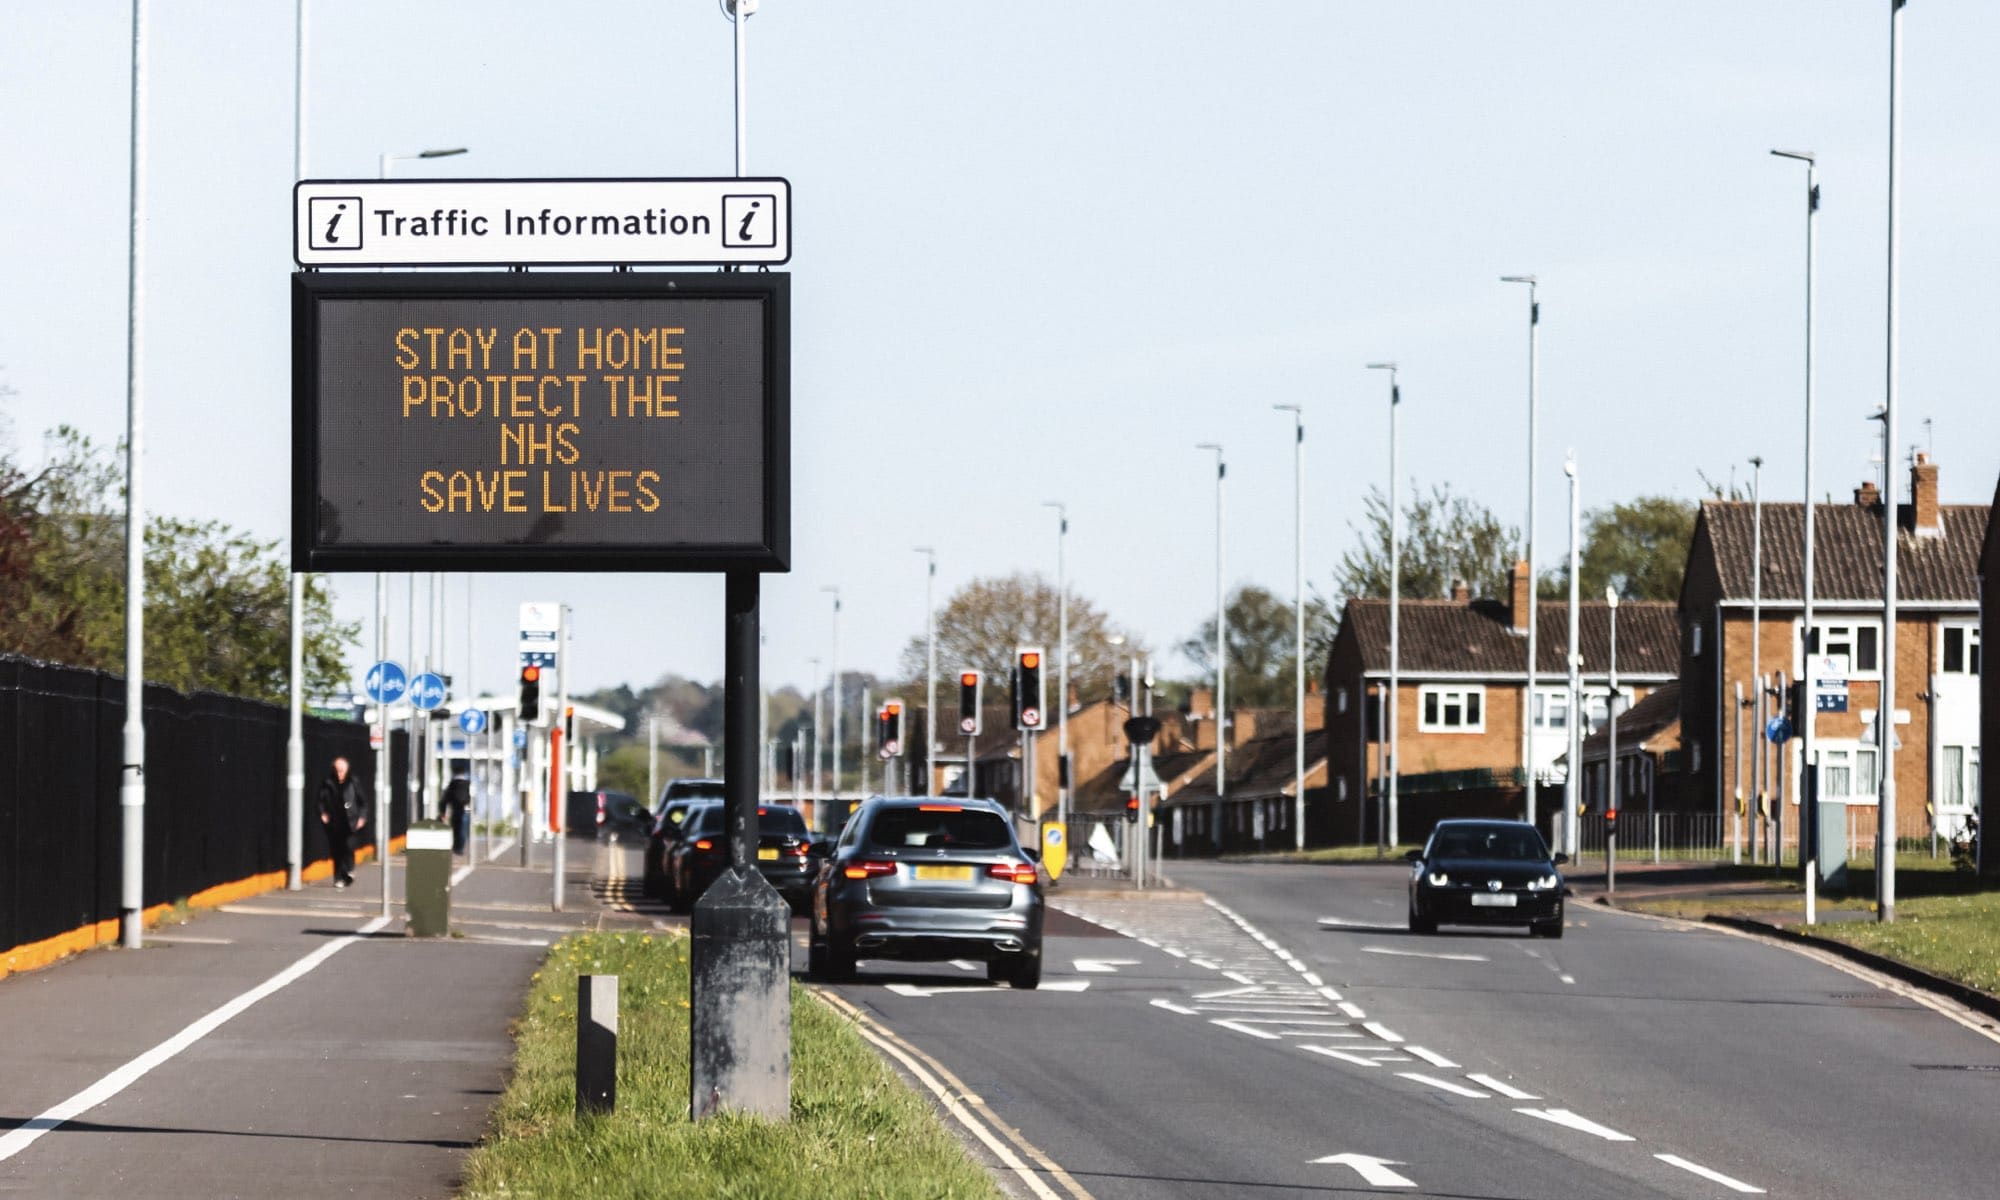
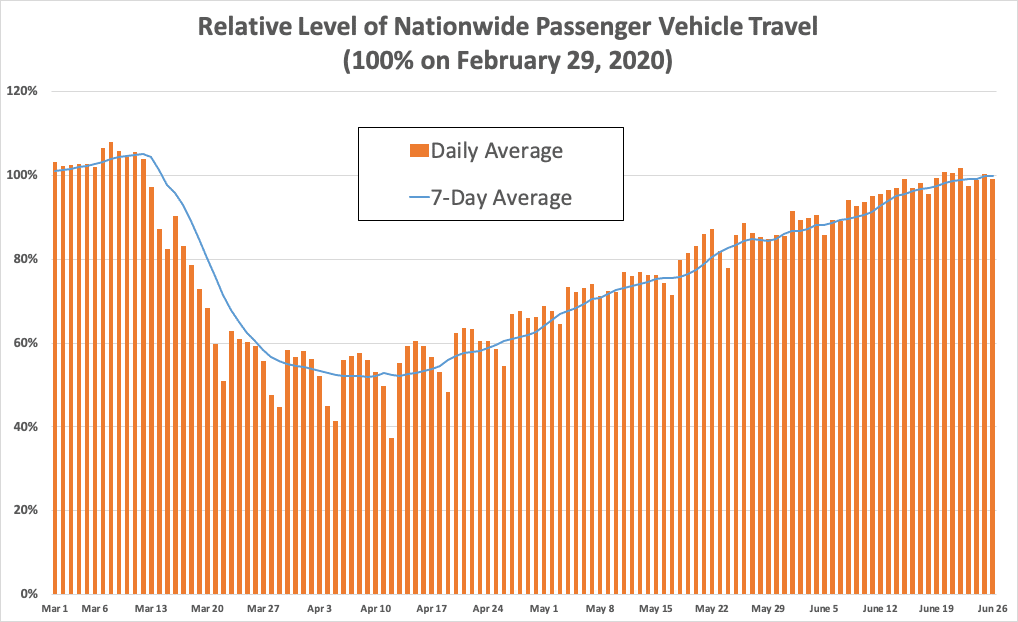
Read OnCOVID-19 restrictions have impacted transportation regionally and nationally. Throughout the pandemic, INRIX has analyzed the movement of people and goods around the world to provide insight into the dramatic changes on our roadways.
Several overlying trends have emerged: First, consumer trips were down massively while freight trips have decreased to a much lower degree. Second, trip reductions in metros closely track official guidance regarding work from home, social distancing, and shelter in place restrictions. As this crisis progresses, it is likely more cities will come to resemble those current most impacted.
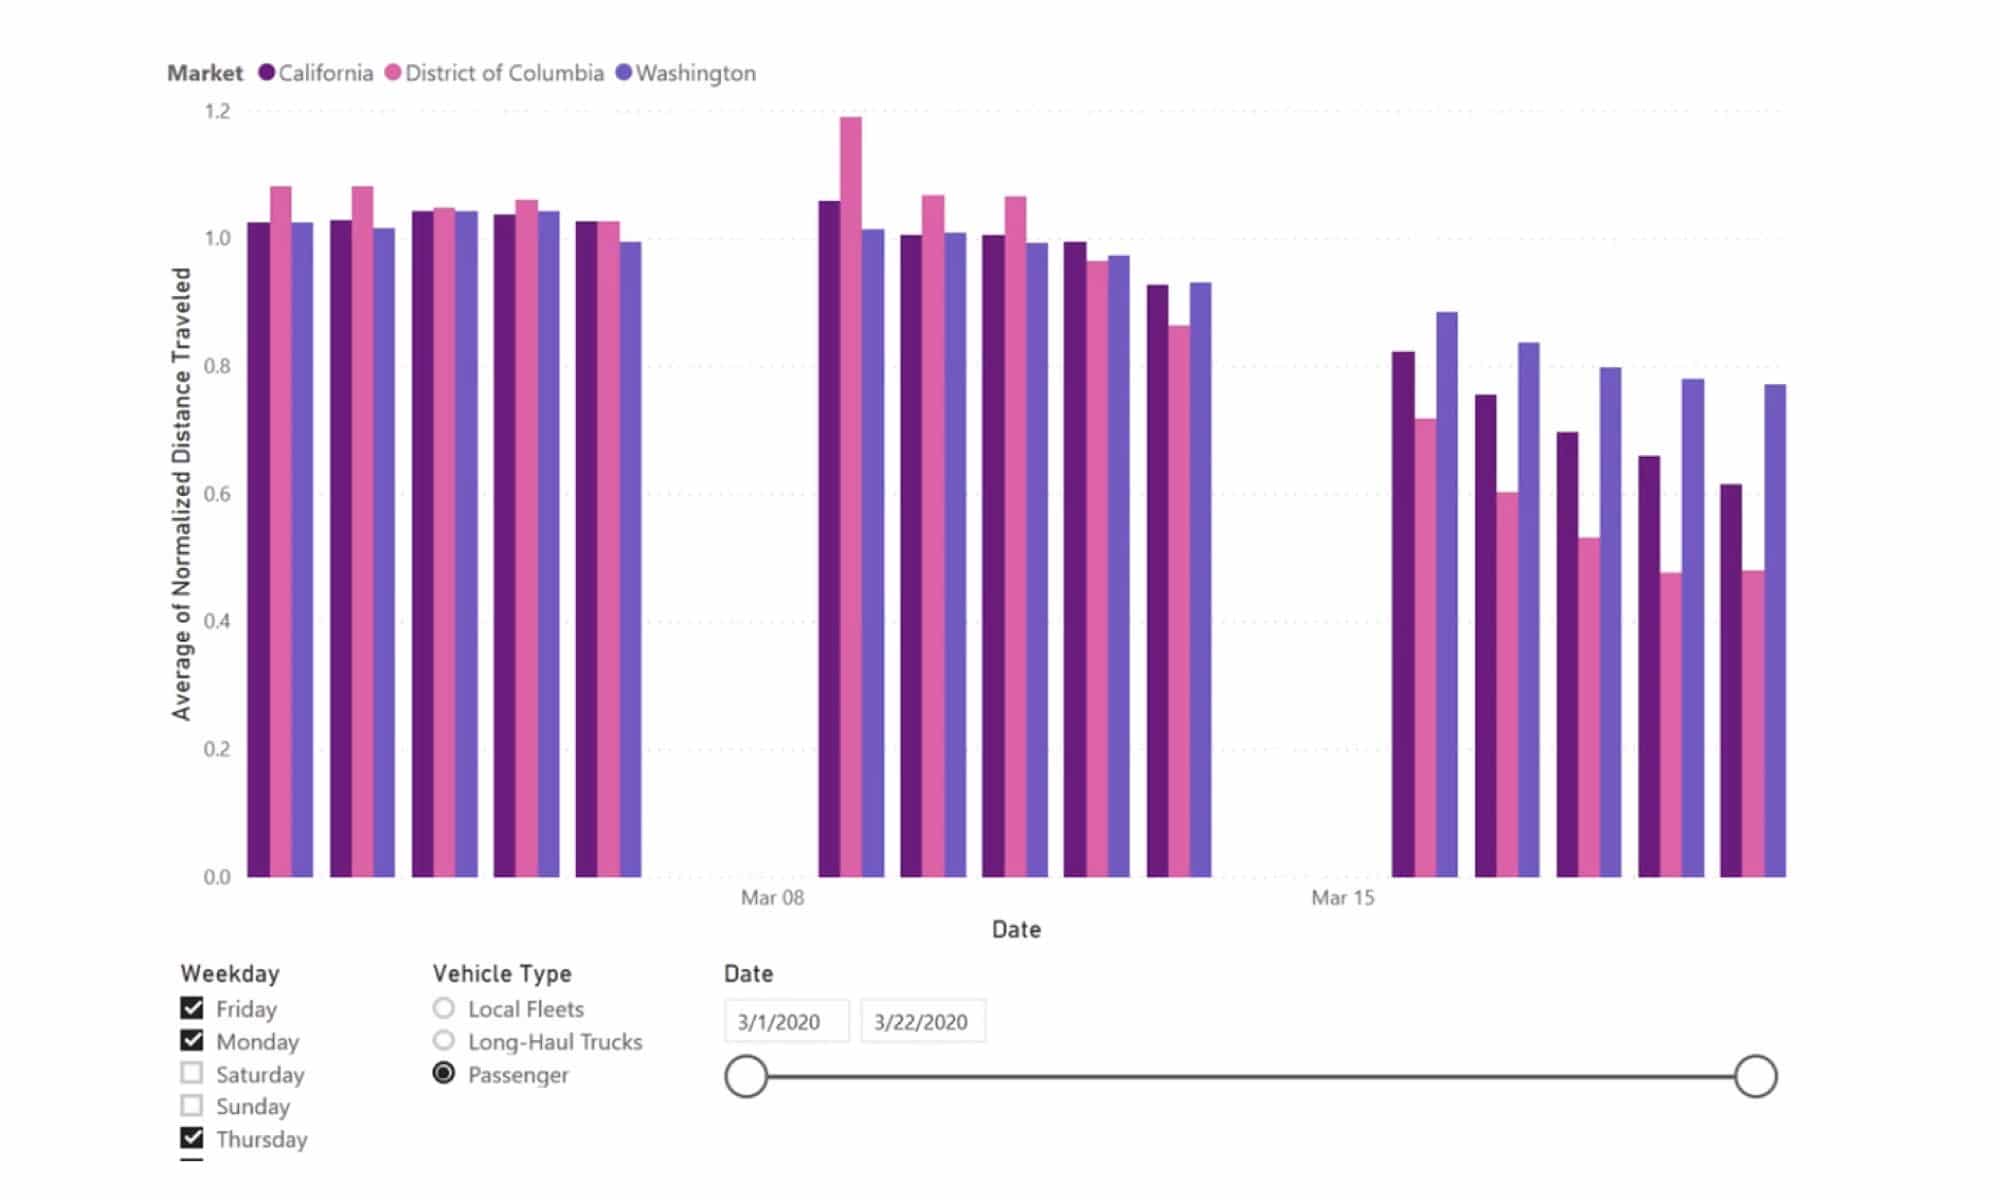
INRIX Trip Analytics provides a powerful means to measure and describe just how these changes are manifesting across the country and world which we're providing access to in the free dashboard below.
To better capture the re-emergence of cities and businesses, INRIX has also developed metrics and visuals to measure activity, regardless of mode using INRIX Visit Analytics metadata. We call this, “Activity Re-Emergence Trends”.
[s201_bai id=”21″]
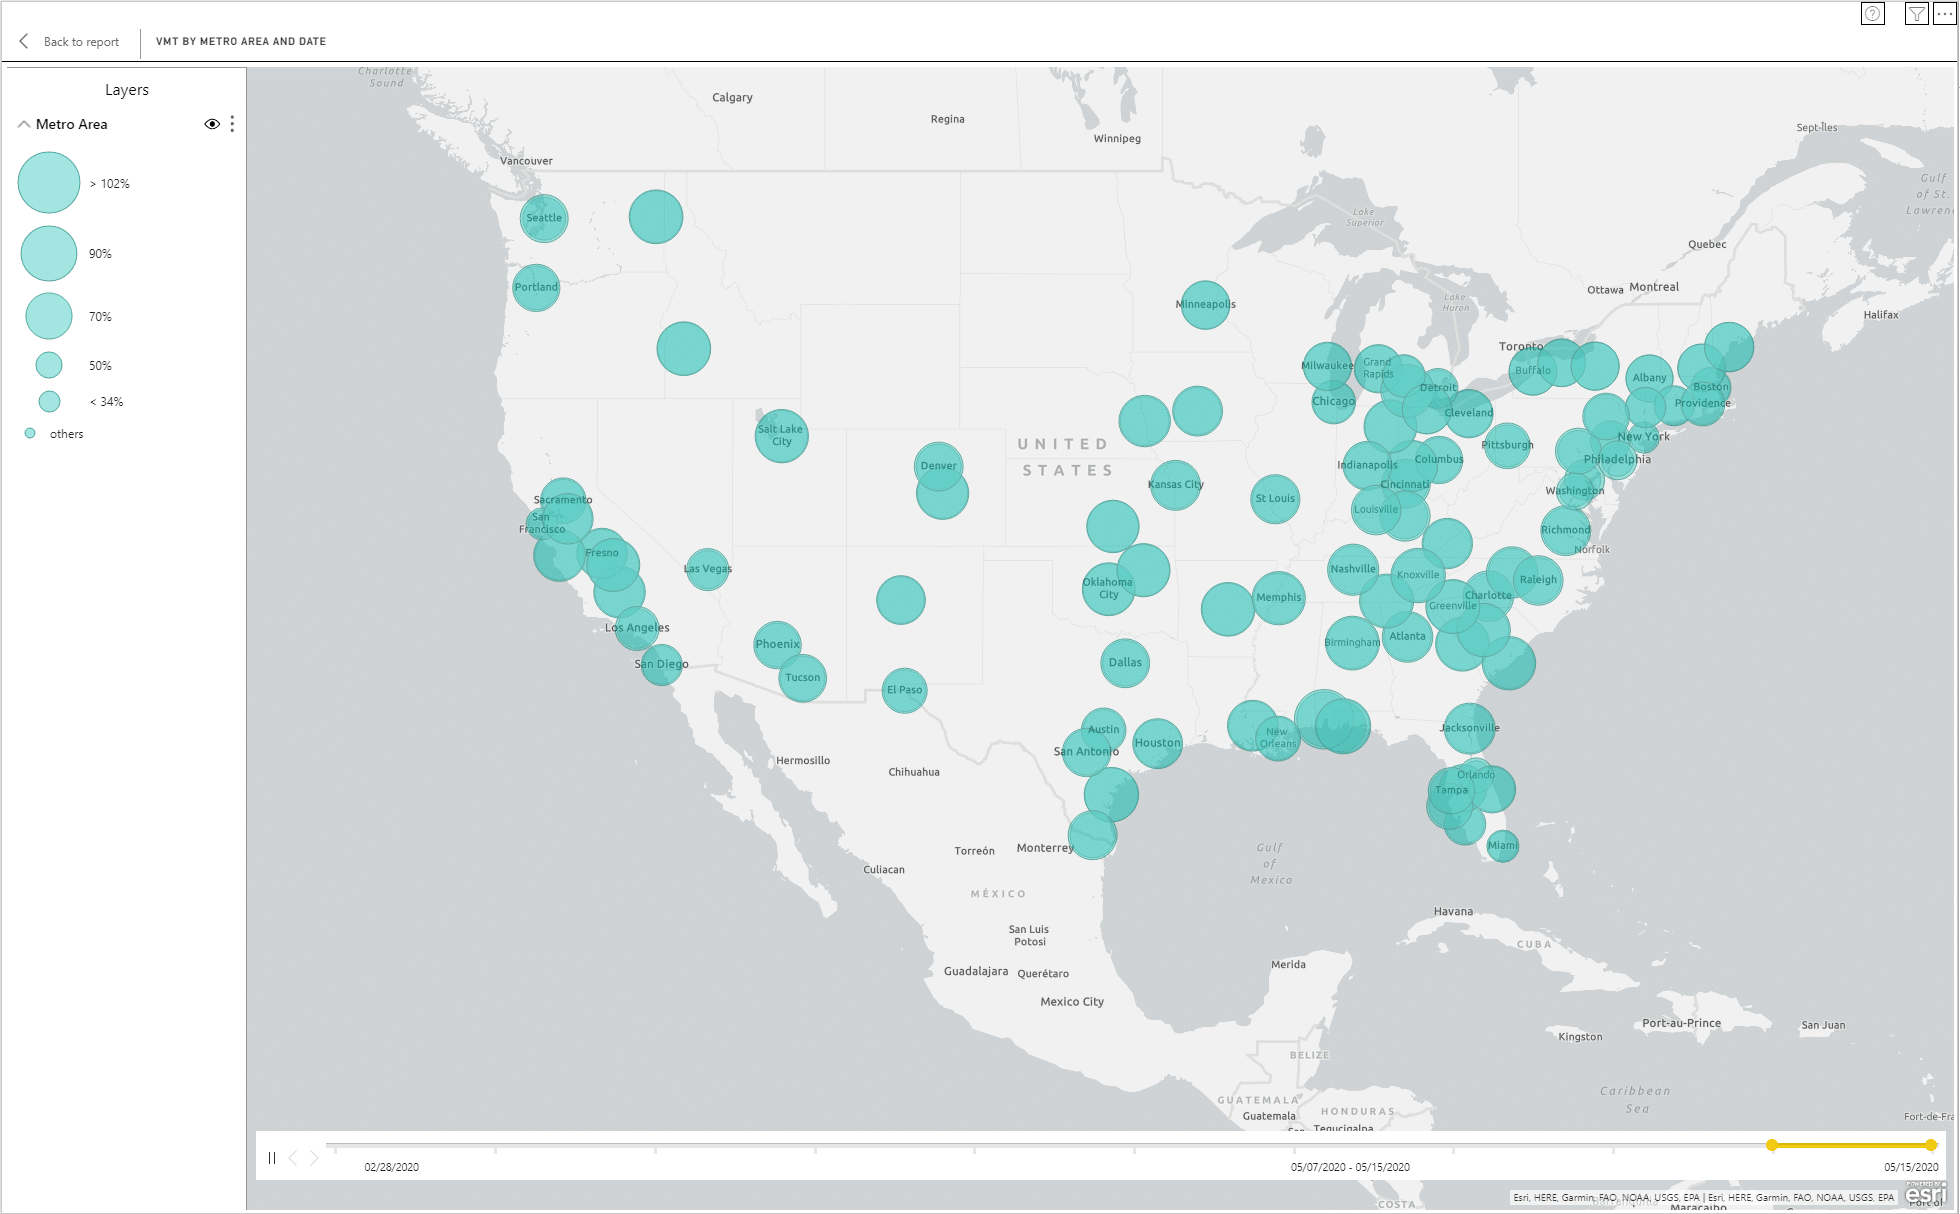
As people, cities and businesses start to recover from COVID-19, location-based insights from hundreds of millions of connected devices can help us see what areas and industries are seeing the most activity.
INRIX has created information and interactive “Activity Maps” on this new activity re-emergence trends page to understand which cities, areas, and businesses are seeing the most change in activity.
INRIX is committed to empowering people, cities, and businesses with location-based insights to make mobility safer, happier, and greener. We built this free tool to provide instant insight into current trends that are happening around the world as the COVID-19 outbreak spreads.
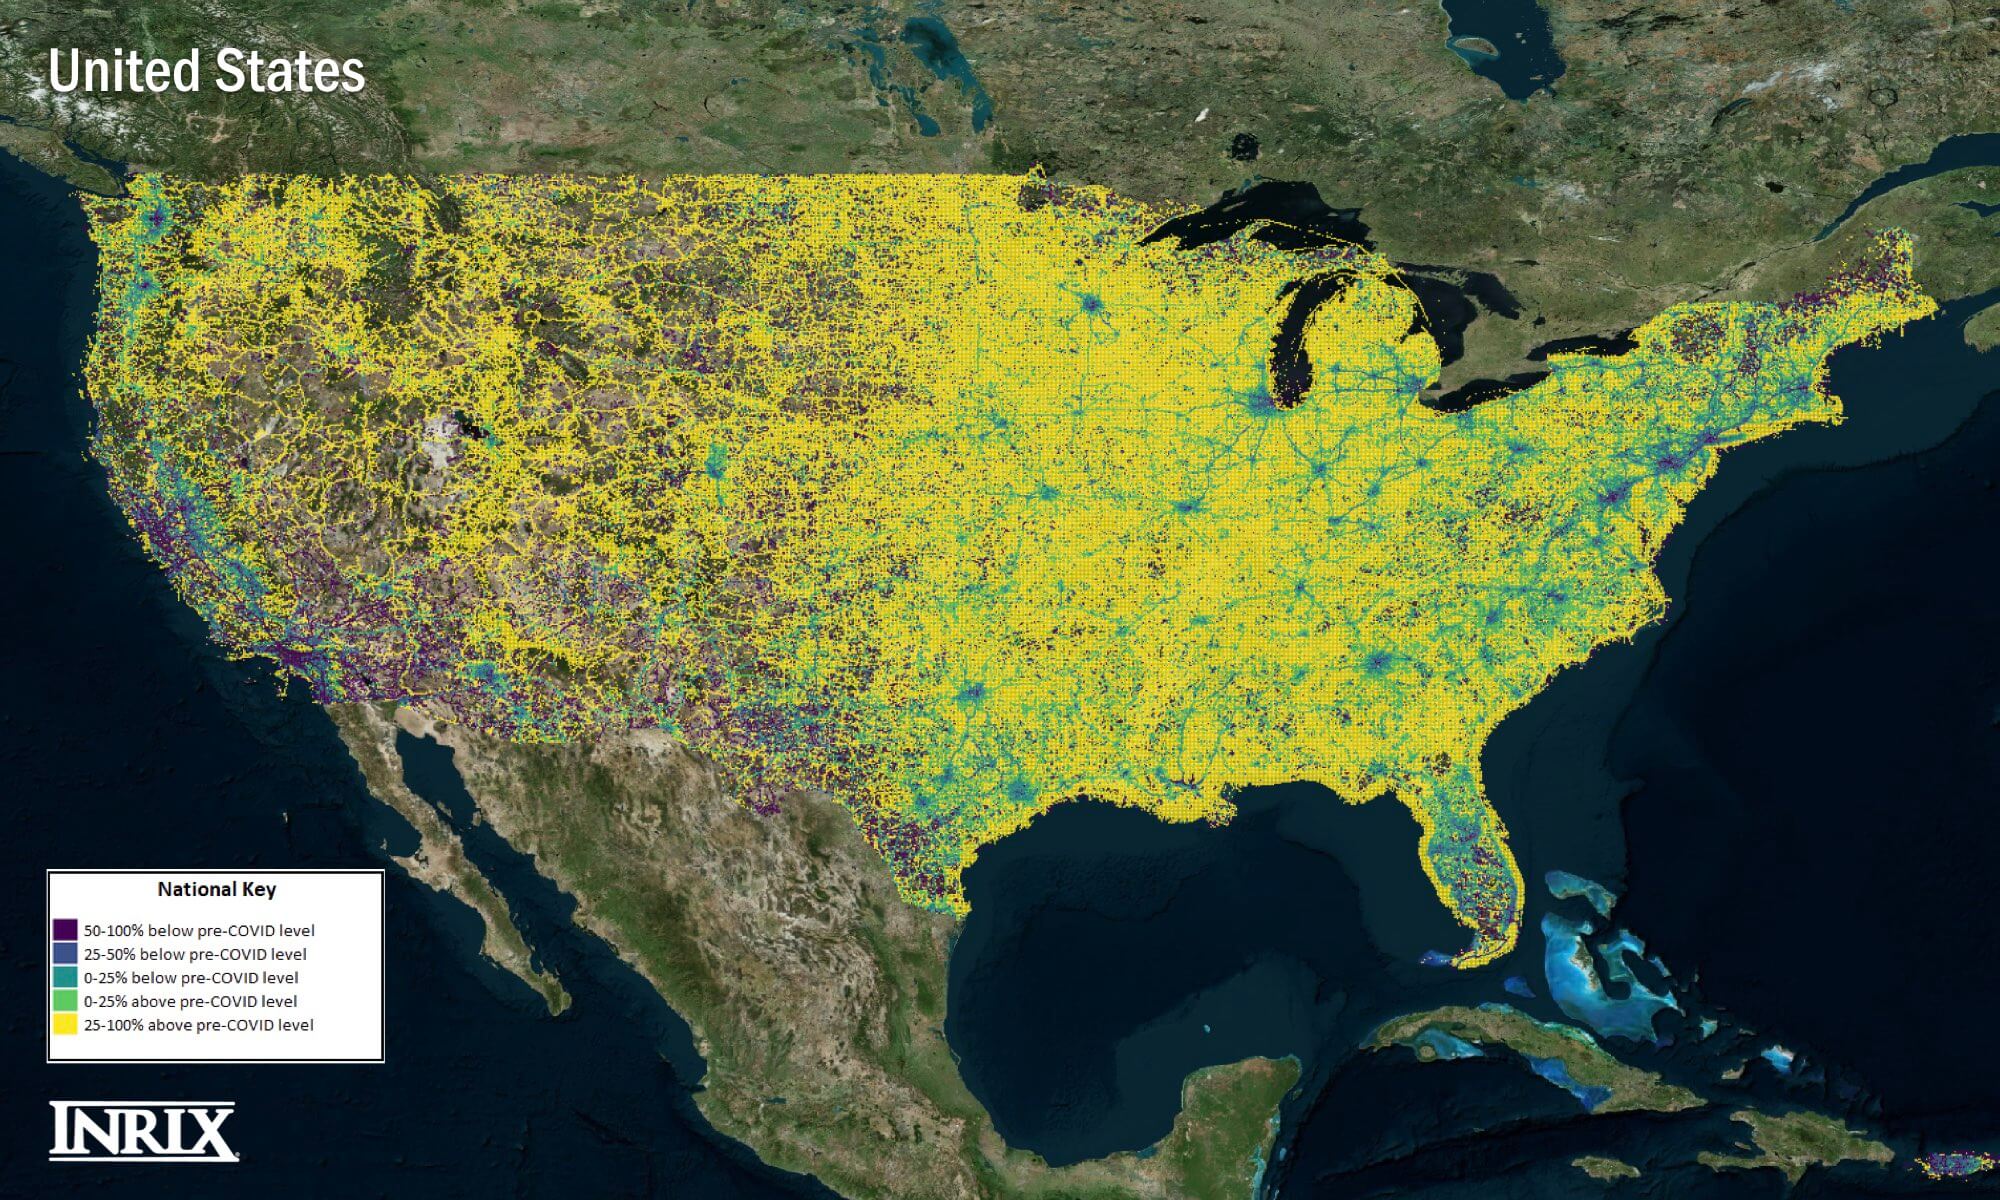
In this extraordinary time, we have re-purposed our INRIX Trips metadata to generate relevant summary level information about traffic demand and are providing free summaries of this data below. (Pick a country from the list on the left)
The data above provides a great snapshot into what’s happening on our roadways but if you’re interested in accessing more detailed insights using INRIX Trip Trends, click the link below to get access to more detailed reports.
INRIX analyzed traffic speeds, volumes and collisions to rank the riskiest roads in the US. and abroad to understand COVID-19's impact on road safety.
GET THE FREE REPORTThis new report analyses vehicle miles traveled (VMT) to understand how the pandemic impacted movement and transportation in Europe.
GET THE FREE REPORTBy understanding what happened in the first U.S. city to report COVID-19 cases we can provide insight into its impact on buyer behavior and transportation.
GET FREE REPORTOur new research analyzed location-based insights to understand how freight movement is being affected and how supply chains are being impacted.
GET FREE REPORTUse INRIX Trips metadata to generate relevant summary-level information about traffic demand by long-haul, fleets, and passenger vehicle trips.
ACCESS FULL DASHBOARD & INSIGHTSINRIX analyzed billions of anonymous data points to understand exactly how our cities, roadways, and supply chains have been affected by COVID-19.
WATCH NOWA (virtual) panel on how cities, businesses and transportation companies are responding to COVID-19’s impact.
WATCH NOWFind out how the world is bouncing back from COVID-19 with our Activity Re-Emergence Maps that are updated weekly.
See Activity Re-Emergence MapsAs cities and state slowly begin reemergence from COVID-related shutdowns, get the latest data on re-emergence through our Trip Trends platform.
READ THE FULL BLOG
Every Monday throughout this crisis we will publish a weekly synopsis to provide a national look at road traffic demand changes from the COVID-19 virus spread and our collective response.
Check our blog every week or subscribe to get the most update insight on what’s happening with passenger vehicle, long-haul freight, and local fleet movement as this crisis evolves.
On April 8, 2024, a total solar eclipse stretched across North America from Mexico to Canada, experiencing complete totality across...
Read On
On April 8, 2024, a total solar eclipse stretched across North America from Mexico to Canada, experiencing complete totality across...
Read On
On April 8, 2024, a total solar eclipse will sweep across the United States, offering a spectacular celestial show that...
Read OnWe will be using this information to respond to your request and to send news/information about our products. Please see our Privacy Policy for more information.