Treatment of Post-Hydrothermal Liquefaction Wastewater (PHWW) for Heavy Metals, Nutrients, and Indicator Pathogens


Department of Agricultural and Biological Engineering, University of Illinois Urbana-Champaign, 1304 W. Pennsylvania Ave., Urbana, IL 61801, USA
*
Author to whom correspondence should be addressed.
Water 2019, 11(4), 854; https://doi.org/10.3390/w11040854
Submission received: 11 March 2019
/
Revised: 9 April 2019
/
Accepted: 22 April 2019
/
Published: 24 April 2019
(This article belongs to the Section Wastewater Treatment and Reuse)
Abstract
:Recycling post-hydrothermal liquefaction wastewater (PHWW) may allow the use of nutrients in the aqueous phase that may otherwise go unused. PHWW is an attractive option for use as fertilizer in systems like crop production. However, there are potential contaminants in the PHWW that may inhibit crop growth or pose a food safety risk. This study investigated the concentrations of heavy metals and nutrients in the PHWW, as well as the presence of indicator pathogens. In addition, four different water treatment methods were used: (1) dilution of raw PHWW, (2) sand filtration after dilution, (3) sand and carbon filtration after dilution, and (4) reverse osmosis after dilution. Our results indicate that the concentrations of cadmium, lead, and arsenic in raw PHWW were well below the maximum recommended concentrations set by the US Environmental Protection Agency (US EPA) for Water Reuse. In addition, the treatment methods in this study achieved percent removals ranging from 82–100% for cadmium, 99–100% for mercury, 75–99.5% for lead, and 71–99% for arsenic. Nitrogen in raw PHWW was predominantly in the total N form, preventing it from being accessible to plants. After nitrification was induced, the concentration of NO3 + NO2 increased by 1.75 mg/L in the untreated 5% PHWW mixture, but remained unchanged or decreased for all other treatments and mixtures. There were no E. coli or coliform colonies detected in the raw PHWW, or in any PHWW mixtures. All PHWW mixtures with and without treatment are within US EPA guidelines for metals for irrigation water reuse. However, fertilizer supplementation may be required for PHWW to be suitable for crop production, as the low concentrations of NO3 + NO2 may prove challenging for growing crops.
1. Introduction
In order to meet the future world food requirements for a growing human population, it is imperative to better utilize all available resources, including reusing and recycling streams of wastewater. Food production requires water and other nutrients essential for growth. Therefore, it is imperative to develop agricultural technologies that use those resources efficiently. Meanwhile, humans and livestock produce manure and wastewater that require treatment to protect health and the environment. Manure and food waste are readily available resources, amounting to approximately 77 million dry tons of biowaste annually in the United States [1]. Therefore, previous studies have examined the use and treatment of wastewater for crop irrigation [2,3]. However, the health and safety of such practices have garnered concern; metals, pathogens, and medical drugs have been reported in using conventionally treated wastewater [4,5]. This study examines a wastewater treatment that has potential to supply nutrients for crop growth under hydroponic conditions: post-hydrothermal liquefaction wastewater (PHWW).
Hydrothermal liquefaction (HTL) is a chemical process that uses heat and pressure to convert biomass into biofuel in the form of biocrude [6]. It utilizes manure, sewage sludge, algae, and other feedstocks to produce a biofuel product, but for our purposes, its main attraction is the wastewater from this process—all the liquid mass that could not be turned into biofuel. The process by which HTL occurs makes this wastewater very attractive for crop production. Pathogens, genetic material, and pharmaceuticals present in the feedstock should be destroyed by the high temperatures and pressures [7,8], while passing on plant nutrients like nitrogen, potassium, and phosphorus [9]. These are reasons why PHWW has been used to produce algae [10,11,12], but the potential to use this wastewater for food production has yet to be deeply investigated in the literature. Currently, the only research done on PHWW has been with growing rice [13]. Therefore, this study seeks to investigate if wastewater can be treated for use as a hydroponic fertilizer for leafy greens, specifically lettuce (Lactuca Sativa).
Hydroponic crop production, which uses water and fertilizers without a soil medium to grow food, is on the rise, with a 653 percent increase in investments in vertical farming from 2016–2017 [14]. Hydroponic fertilizer can be either organic or synthetic, and is applied at a rate to optimize the crop being grown [15], thus finding a renewable source of nutrients that can be used in fertilizer recipes may be of great interest to hydroponic vegetable growers. However, before measuring the potential for PHWW as a fertilizer in terms of crop growth and yields, it is important to ensure that it is safe for use.
1.1. Treatment of Wastewater Using Granular Media and Membranes
This study investigates the use of rapid sand filtration (referred to as sand filtration in this study), combined sand and carbon filtration, and reverse osmosis filtration. These three treatment methods provide a range of fast filtration methods. Sand filtration is primarily used for the physical removal of inorganics like iron and manganese [16], and can also be effective at removing trace metals [17]. Removal can be increased by coating the sand with iron or manganese oxides by increasing the surface area and adsorption sites. Sand filtration is also a simple method that can be operated by people with only basic training [18]. Activated carbon is commonly used as a filtration media to adsorb pesticides and viruses [19,20], and can be operated at high loading rates [21]. Reverse osmosis is a membrane process that removes ions from water by reversing the natural flow of water towards the more concentrated solution by overcoming the osmotic pressure. Due to the small openings in the membrane, fouling can occur and reduce performance over time [22,23]. While reverse osmosis membranes can achieve >95% removal of contaminants, complete removal of contaminants is difficult to achieve [24,25]. Of the three treatment methods tested in this study, reverse osmosis requires the most training and expertise to effectively operate the system [26,27,28,29].
Sand filtration of wastewater was examined by Hamoda et al. [30] in a study of rapid sand filters in three tertiary wastewater treatment plants in Kuwait to determine if sand filtration of wastewater could produce water effluent that meets water quality requirements for irrigation, in order to meet agricultural water demand. The study claims that tertiary treatment of secondary-treated wastewater using rapid sand filtration provided stability to secondary treatment quality variation and effectively improved water quality of wastewater for landscape irrigation.
Gude et al. [31] investigated the effect of pH, Fe(II), Fe(III), filtration velocity, and media size on the removal of As(III) in rapid filters. The study aimed to investigate the interaction of As and Fe in rapid filter columns with biological activity. It was found that regardless of filter media, As(III) was fully converted after 70 days, with improved As removal using coarse media, added Fe(III), and lowering pH to 7.4.
Genç-Fuhrman et al. [32] studied the effect of using different sorbent media to remove heavy metals from stormwater. The study compared the heavy metal removal efficiency of different media under controlled experimental conditions. Using alumina, activated bauxsol-coated sand, bauxsol-coated sand, granulated activated carbon, granulated ferric hydroxide, iron oxide-coated sand, natural zeolite, sand, and spinel with synthetic stormwater, the removal efficiencies of As, Cd, Cr, Cu, Ni, and Zn were found and ranked for each metal. They found that alumina was the most effective at removing heavy metals and that alumina, bauxsol-coated sand, granulated ferric hydroxide, and granulated activated carbon removed heavy metals in compliance with the Danish Emission Limit Values.
Use of Wastewater for Hydroponic Crop Production
Androver et al. [33] investigated using hydroponics to determine the nutrients in different treated wastewaters. The study investigated alternative sources of water for crop irrigation in areas with water shortages. The production of barley was reduced by 47% and 17% for conventional activated sludge and water from a lagoon system, respectively. The authors concluded that treated wastewater can provide some nutrients, but that additional fertilizer is necessary for proper growth and production of barley. Al-Karaki [34] also looked at barley production using vertical hydroponic growing towers in controlled environment chambers. Three treatments were used in this experiment: tertiary treated sewage wastewater, tap water, and mixed wastewater and tap water. They found that wastewater improved yields, water efficiency, and nutrient content compared to tap water treatment. However, they found that heavy metals did increase in wastewater treatment, but not beyond maximum regulation levels. Thus, the author stated that this shows that wastewater can be used to grow barley in hydroponic systems.
A study by Muñoz et al. [35] focused on characterizing the contaminants in wastewater effluent. The aim of this study was to understand the contaminants in wastewater effluent and their potential for use in agriculture, considering increased water stress and the drive to use wastewater effluents. The method quantified 27 priority and emerging (not-regulated, but dangerous) pollutants that were found in the effluents of two wastewater-treatment plants in Spain. Amongst the various compounds, metals had the highest concentrations in the soil tested. Beyond heavy metals, pharmaceuticals were the largest risk factor. Thus, the authors concluded that wastewater could be unsafe for agriculture without a tertiary treatment. While this study does not direct itself at the use of wastewater for hydroponics, we can still use this information to understand the contaminants in wastewater that could be used as a fertilizer for hydroponics.
Overall, there are contamination concerns for using sewage wastewater in hydroponics, but proper treatment can mitigate contamination. Furthermore, different wastewater treatments can give different production results, sometimes less than traditional hydroponic fertilizer.
1.2. Hydrothermal Liquefaction and Post-Hydrothermal Liquefaction Wastewater
Lu et al. [36] sought to see how human feces could be used as a feedstock for HTL to both treat the hazardous waste and produce energy. They studied the production of biocrude oil, the recovery of nutrients and metals via hydrothermal liquefaction of human feces. The feedstock used was homogenized and refrigerated human feces taken fresh from a latrine in a suburb of Beijing, China. The analysis showed that 54% of the carbon was incorporated into the biocrude and 72% of the nitrogen went to the aqueous phase. Other ratios were calculated for each phase and associated elements. Most heavy and alkali-earth metals were found precipitated in the solid phase, while alkali metals (primarily Na and K) were found dissolved in the aqueous phase. The authors claimed that the study showed the feasibility of using HTL to treat human feces and separate nutrients and metals in biowastes as a whole.
These reviews and studies are important in that they establish several key points: the nutrient composition of the algae HTL wastewater, the metals present in the wastewater, and the time and temperatures used to perform this conversion. The study by Lu et al. [36] further shows how most of metals are not in the aqueous phase of wastewater and the nutrient recycling capacity of HTL.
Pham et al. [37] investigated how hydrothermal liquefaction affects the bioactive contaminants in the manure and algae used as feedstock in the process. The authors performed this study to investigate whether HTL is an effective means of destroying bioactive contaminants in wastewater and biosolids, while also producing bioenergy. The bacteria transformations found that the HTL process killed all bacteria and the antibiotic resistance plasmids. The authors concluded that HTL is a good method for producing bio-crude oil, while also destroying bioactive contaminants in the feedstock used.
In the scope of this study, there are two major safety concerns of using PHWW for hydroponic crops, due to its biowaste origin, heavy metals content, and presence of pathogens. Genetic material, medication, and endocrine disruptors were not investigated in this study, and only four heavy metals (lead, cadmium, arsenic, and mercury) were considered due to cost limitations. Furthermore, in addition to safety concerns, PHWW nutrient composition needs to be within ranges tolerable for successful crop growth. We focused on nitrogen and phosphorous in this study, which proved to be the dominant macronutrients necessary for plant growth. Therefore, this study will explore two major questions: can PHWW be safely used and how does its composition compare to commercial hydroponic fertilizer solutions? To answer these questions, we addressed the following objectives:
- Establish the heavy metals concentrations for arsenic, lead, cadmium, and mercury in the PHWW,
- Measure the concentrations of nitrogen and phosphorus nutrients in the PHWW and compare to synthetic hydroponic fertilizer and the needed nutrients for lettuce (Lactuca Sativa), as well as the US EPA standards for irrigation water used for crops, and
- Determine if fecal coliforms or E. coli are present in the PHWW.
These objectives were carried out for raw PHWW, different PHWW mixtures, and filtration methods. These can be used to select several promising PHWW treatments for hydroponic fertilizer. With this achieved, research can be done on optimizing the production of crops with this new fertilizer source.
2. Materials and Methods
2.1. Experimental Design
Experimental Variables and Experimental Units
Raw PHWW received treatment combinations in a randomly assigned order, with the following factors and factor levels:
- Mixture of PHWW (1%, 2.5%, and 5% solution by volume)
- Nitrification of PHWW (no nitrification allowed and nitrification allowed)
- Filtration method of diluted PHWW (no filter, sand filter, sand + carbon filter, and reverse osmosis filter).
These factors were used in addition to tap water and commercial hydroponic fertilizer as control groups, for a total of 26 treatments. Each treatment was repeated three times, by repeating the random assigning and processing of treatments, for a grand total of 78 experimental units. For each of these units, the dependent variables measured after treatment were:
- Heavy metals concentrations (Hg, As, Cd, and Pb in µg/L),
- Nutrient concentrations (NO3 + NO2, total N, orthophosphate, and total P in mg/L),
- Presence of fecal coliforms and E. coli (colonies detected on plating).
During the experiment, the PHWW source, water source, room conditions, volume of PHWW processed per treatment, and filter operating pressure were kept constant. In order to convey the intended purpose of the experimental groups, Table 1 lists the groups and what they seek to test.
2.2. Materials
The PHWW was sourced from the Dr. Yuanhui Zhang research group at the University of Illinois at Urbana-Champaign. The PHWW comes from the hydrothermal liquefaction of algae grown on swine manure in a laboratory pilot reactor. The PHWW was stored undiluted in barrels prior to being collected and was well-mixed before collected in five 5-gallon sealed plastic buckets.
All water used to prepare PHWW dilutions in this experiment came from the tap water in the lab, and was not deionized before use, due to the large volume of water needed for the experiment. The dilutions were performed in 55-gallon plastic barrels.
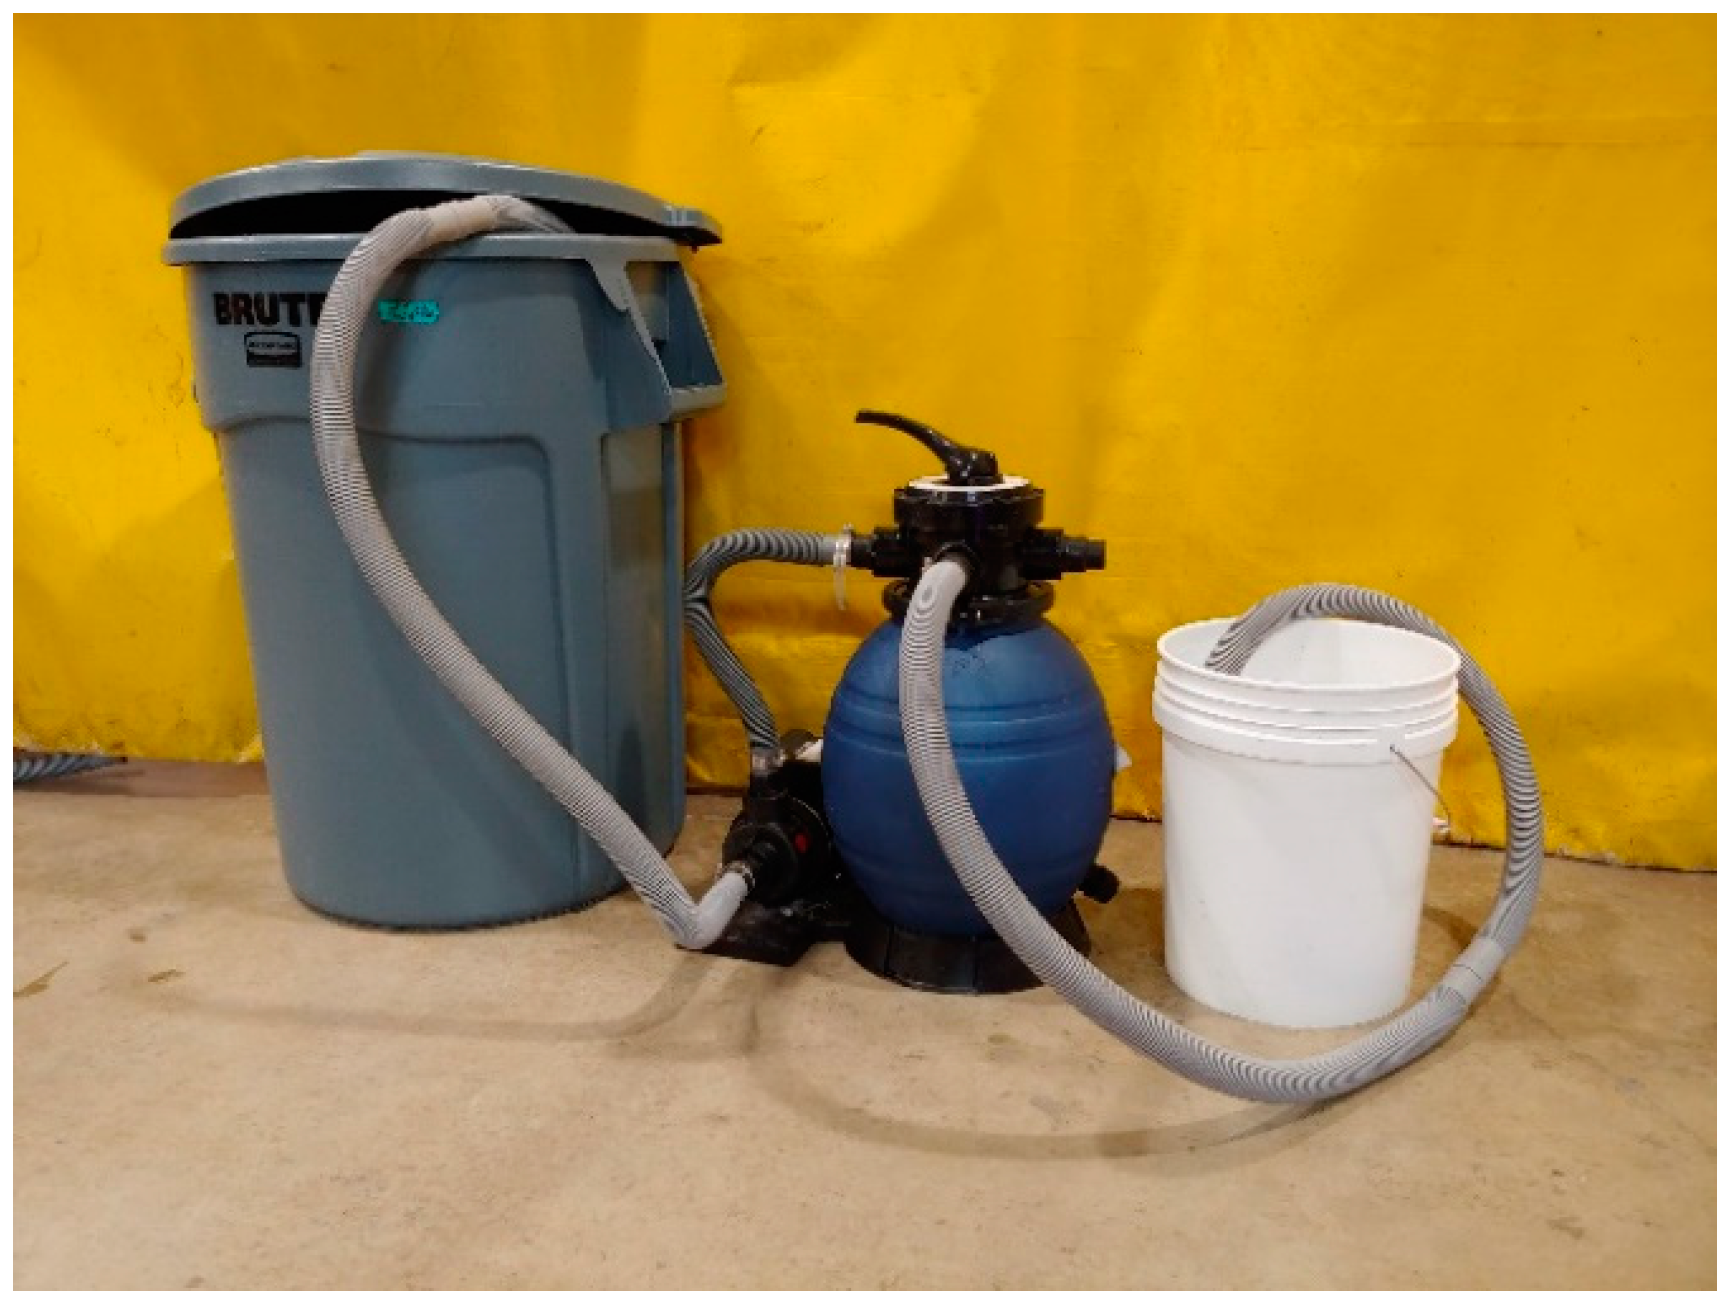
Sand and sand + carbon filtration treatments were performed with a Sand Master Soft Sided Above Ground Pool Sand Filter System (Figure 1; Swimline, Edgewood, NY, USA), filled with sand and a sand–carbon–sand layering, respectively. The sand was Fairmount Minerals Pool Filter #20 Grade Silica Sand (Fairmount Santrol, Benton Harbor, MI, USA), and the activated carbon source was 4 × 8 US mesh size (particles were in the range of 0.25” to 0.125”) Custom Aquatic Premium Bulk Granular Activated Carbon (Custom Aquatic, Vista, CA, USA).
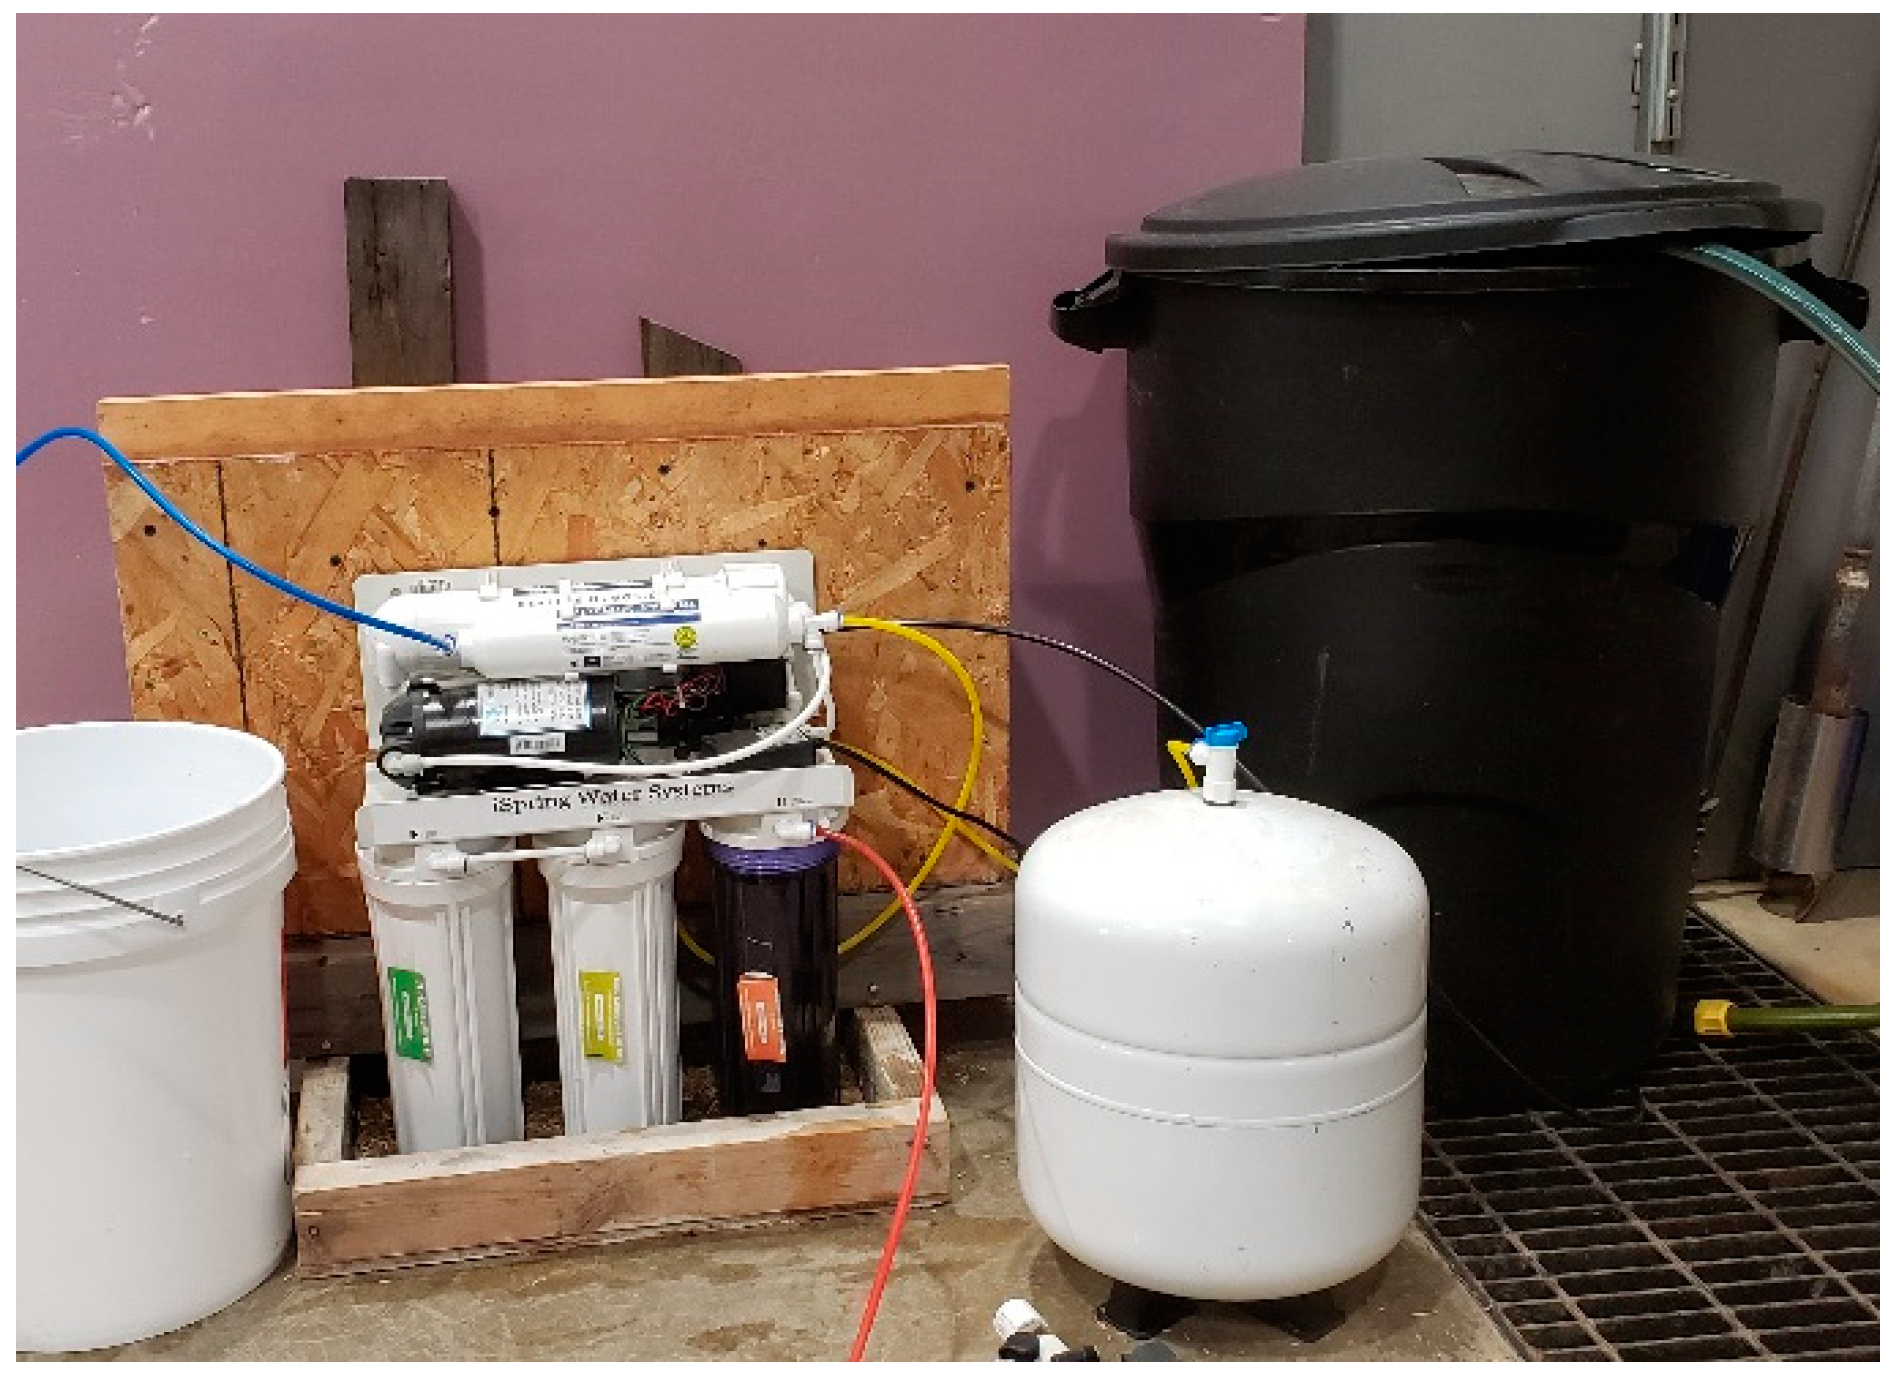
The reverse osmosis treatments were performed with an iSpring RCC7P Performance-boosted Under Sink 5-Stage Reverse Osmosis Drinking Water Filtration System with Pump and Ultimate Water Softener (Figure 2; iSpring, Alpharetta, GA, USA) connected to a SHURflo 198 GPH (Pentair, Minneapolis, MN, USA) industrial water pump.
Nitrification was performed in 55-gallon plastic barrels and was aided by ATM Aquarium Products Colony Nitrifying Bacteria (ATM Aquarium Products, Las Vegas, NV, USA) true nitrifying bacteria starter, a 45 L/min Hydrofarm AAPA45L Active Aqua Commercial Air Pump (Hydrofarm, Petaluma, CA, USA), 6 VIVOSUN 4 × 2 Inch Large Air Stone Cylinders (Vivosun, Los Angeles, CA, USA), and Aquatic Experts Rigid Latex-Coated Coarse Bulk Roll Pond Filter Media, 18 × 72 × 1 Inches (Aquatic Experts, Greensboro, NC, USA) as biofilter material for the bacteria.
The coliform and E. coli indicator organisms were detected and enumerated using 3M PetrifilmTM E. coli/Coliform Count plates (Product Code 6414). These E. coli/Coliform plates contain Violet Red Bile nutrients, a cold-water-soluble gelling agent, an indicator of glucuronidase activity, and a tetrazolium indicator that facilitate colony detection and enumeration in food and aqueous samples. One milliliter of water was taken from each sample, plated, and incubated at 37 °C for 24 h.
2.3. Procedure
The experiments were conducted in the Soil and Water Laboratory of the University of Illinois at Urbana-Champaign. The lab was kept at room temperature (21.1 °C) throughout the duration of the study, except when otherwise noted. When not in use, PHWW was sealed in the 5-gallon plastic buckets to prevent contamination from the room environment.
Raw PHWW was first well-mixed with a powered stirring rod for 3 min, then sampled. This was done to establish the base concentration of nutrients, metals, and E. coli/coliforms in raw PHWW, i.e., PHWW before dilution or other treatments.
For the preparation of diluted/unfiltered PHWW, the PHWW was first well-mixed with a powered stirring rod for 3 min, then measured out for the corresponding mixture for a total volume of diluted PHWW of 200 L, repeated three times for replication. Samples for diluted/unfiltered samples were taken from this solution. This was done to establish the base concentration of nutrients, metals, and indicator pathogens in the PHWW before further treatments. Solutions for nitrification treatment proceeded to be nitrified before filtration, whereas solutions for no nitrification treatment proceeded directly to filtration.
Nitrification was performed in order to convert some of the ammonium and organic forms of nitrogen in the raw PHWW into NO3 + NO2. In order to achieve nitrification through true nitrifying bacteria, Nitrosomonas and Nitrobacter, 100 mL of true nitrifying bacteria solution per 200 L of diluted PHWW to introduce the bacteria to the wastewater. To establish optimal conditions for bacteria growth, the temperature was held at 26.67 °C in closed-lid 55-gallon bins and supplied with oxygen from 45 L/min air pumps using 6 air diffusing stones for 8 days. In addition, 48 × 72 × 1 inches of filter pad media was submerged in the nitrifying solution to increase the surface area for nitrifying bacteria to multiply on. After 8 days of reaction, the equipment was removed from the bins and heating was stopped, unfiltered samples were taken, and then the remaining diluted/nitrified solution proceeded to filtration.
2.4. Filtration Treatments
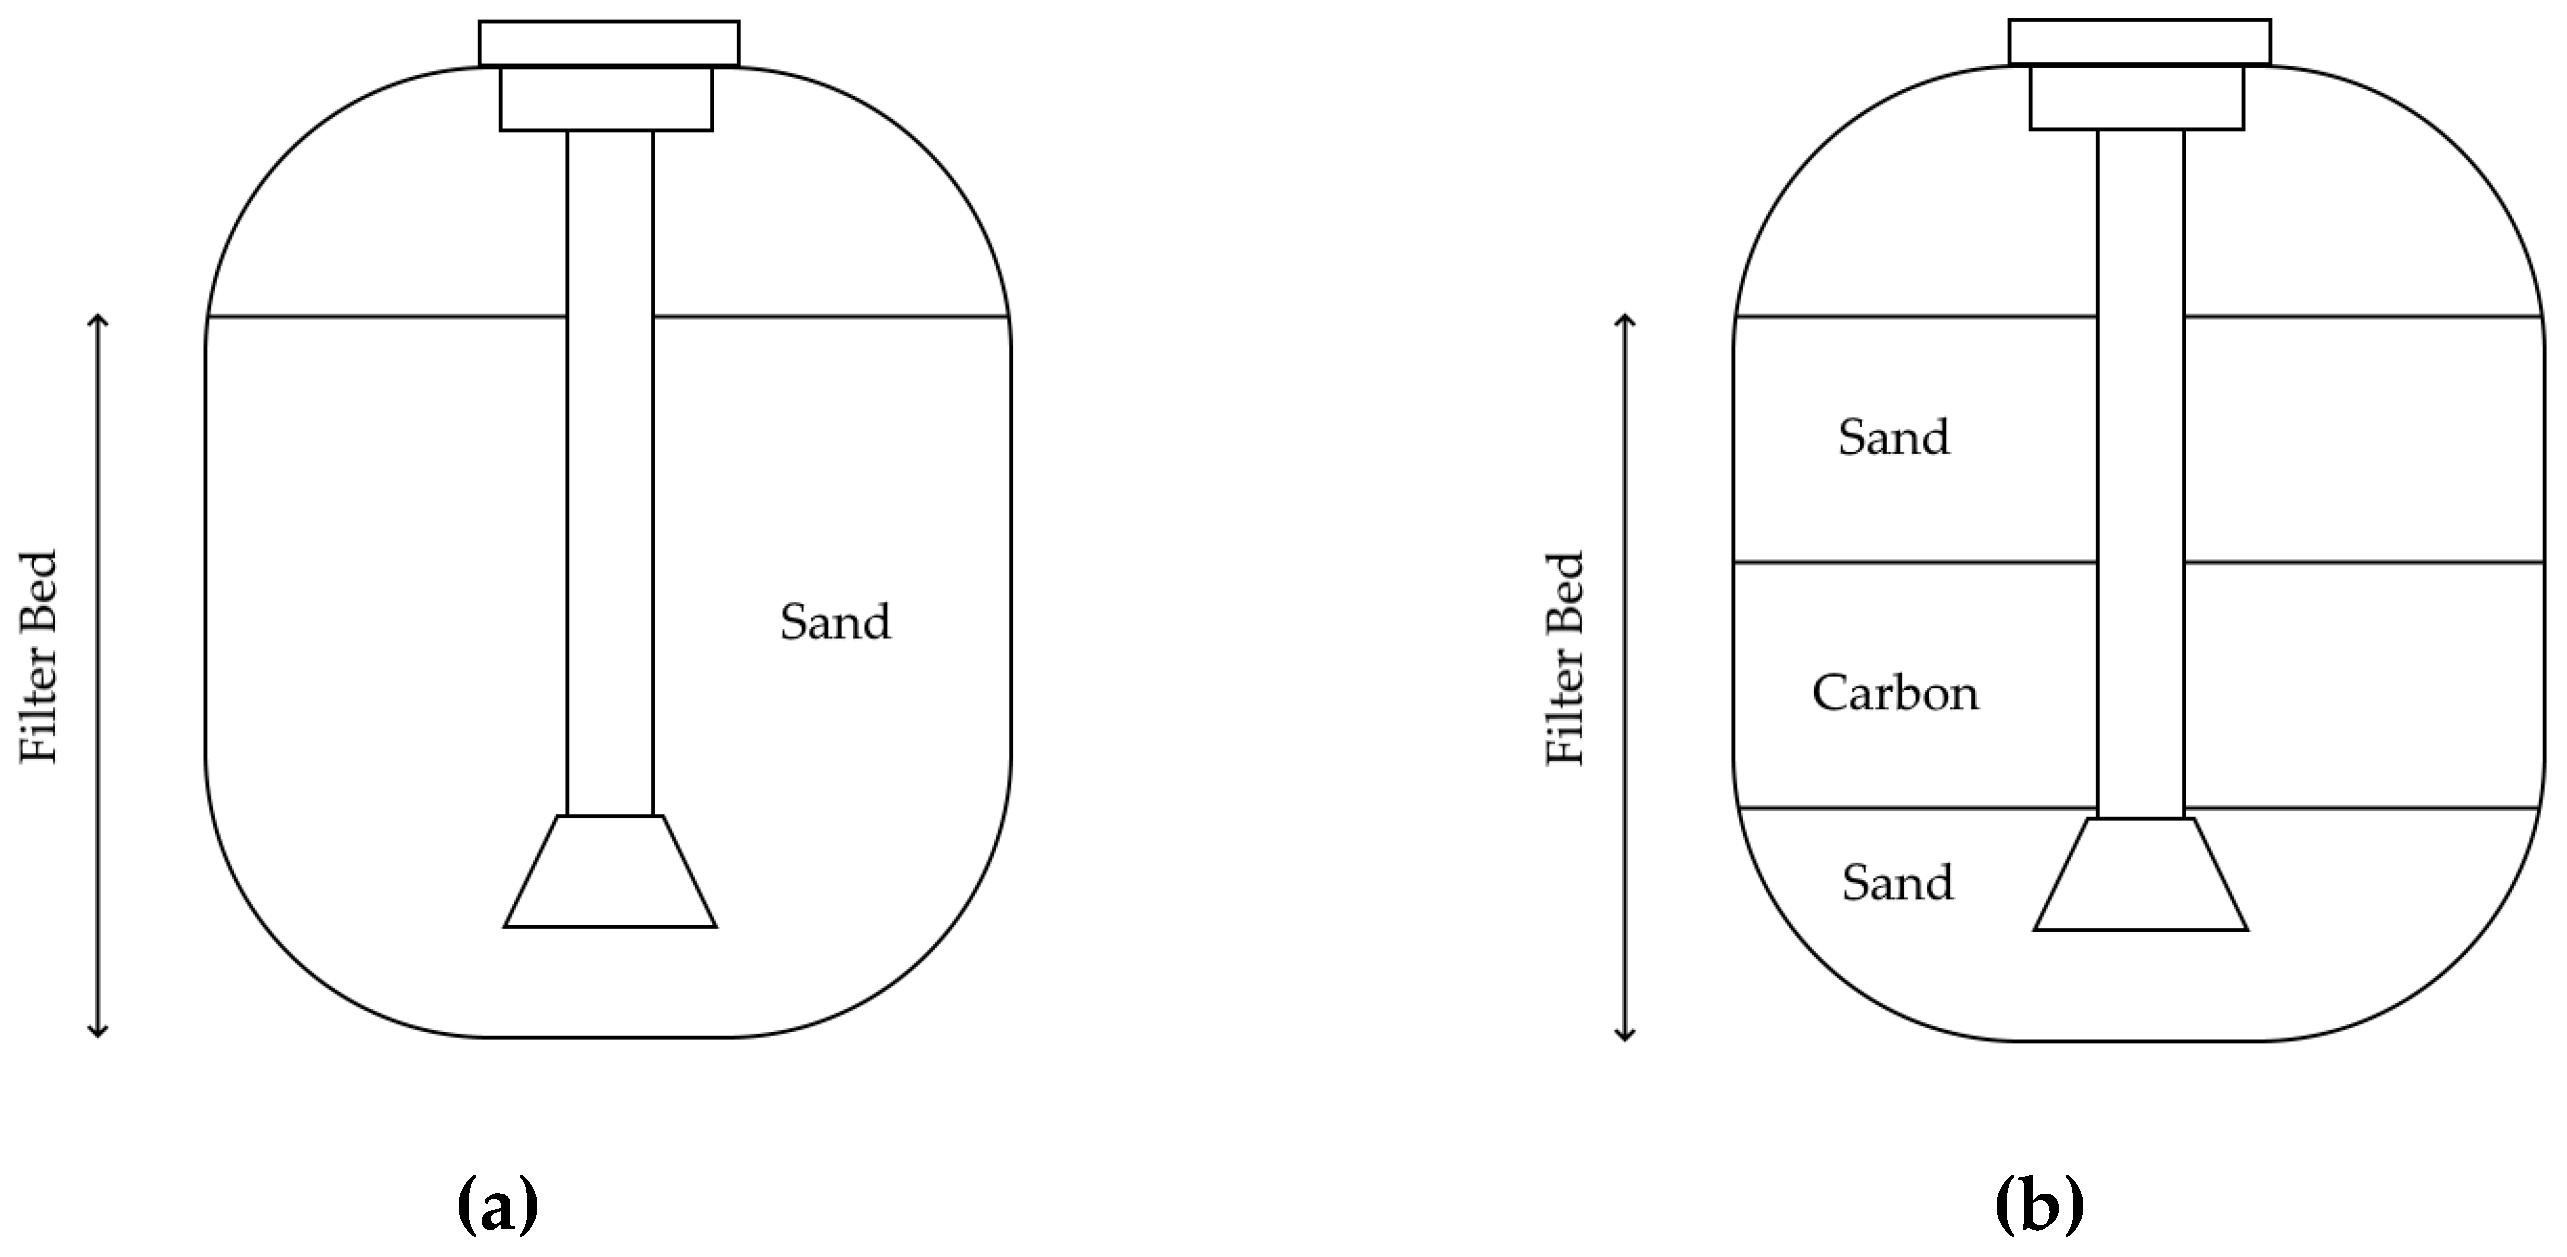
Two pool filters were used, one for sand filtration and the other for sand + carbon filtration. For sand filtration, filter-quality sand was poured into the filtration bed of the pool filter to three-quarters of the height of the bed, according to manufacturer instructions. For sand + carbon filtration, the middle third of the filter sand was replaced with activated carbon (Figure 3).
In either case, the filter bed was primed with tap water before use. Between different mixtures and nitrified versus non-nitrified solutions, the filter media was removed, the filter bed was cleaned with bleach and thoroughly rinsed, and fresh filter media was added to the filter bed—the filter bed was not refreshed between different replications. However, new stock diluted/unfiltered PHWW solution was prepared from raw PHWW for each replication.
The 200 L of diluted/unfiltered (both non-nitrified and nitrified) PHWW were then passed through the pool filter at 5 psi at a flow rate of 75.7 liters per minute (20 gallons per minute) for a single-pass filtration. From the filtered PHWW, the sample solution was taken from the well-mixed filtered PHWW product.
The reverse osmosis system, which included sand filtration, carbon filtration, and clarifying segments in addition to the reverse osmosis, was assembled on a wooden frame to hold the system upright. A pump was used to provide sufficient water pressure for the system. For each experimental unit, the reverse osmosis system was fed 15 L of the well-mixed 200 L diluted/unfiltered solution, due to the slow process of the reverse osmosis system and expense of replacing parts if the system became overloaded. Sample solutions were collected from the well-mixed product water of the reverse osmosis system. The reverse osmosis system did not have any of its filtration or reverse osmosis components replaced throughout the experiment.
2.5. Analyses
Water samples were collected into 250 mL Nalgene bottles. Immediately after sample collection, all sample bottles were capped, sealed, labeled, and refrigerated at 4 °C. Samples were analyzed for E. coli/coliform the day following sample collection, nutrient analysis was conducted within one week after sampling, and heavy metal analyses was completed within approximately 2 weeks after sample collection.
Heavy metals in all solution samples were tested at the Microanalysis Laboratory at the School of Life Sciences and the University of Illinois using Inductively Coupled Plasma Mass Spectrometry with “PerkinElmer—MODELS NEXION 350D (ICP-MS) and OPTIMA 8300 (ICP-OES)” (Waltham, MA, USA), for detecting the heavy metals down to parts per billion (µg/L) concentrations. The metals tested were mercury, lead, cadmium, and arsenic.
Nutrients in all samples were tested at the Water Quality Lab at the Agricultural Engineering Sciences Building. Samples were analyzed for nitrogen (total N and NO3 + NO2) according to Automated Hydrazine Reduction Method (Standards Methods 4500-NO3-H, NEMI) and for orthophosphate and total P using the Ascorbic Acid Reduction Method (Standard Methods 4500-P-F, NEMI).
E. coli/coliforms in all samples were tested internally at the Soil Pathogens Lab at the Agricultural Engineering Sciences Building. One milliliter of sample solution was pipetted onto a 3 M E. coli/coliforms plates and incubated for 24 h. The plates were then counted by hand for colonies of fecal coliforms and colonies of E. coli.
Differences between the treatments were analyzed for significance using a one-way analysis of variance (ANOVA) with post-hoc Tukey Honestly Significant Difference (HSD) for comparing multiple treatments. When sample sizes were unequal, the Tukey–Kramer method was used.
3. Results
The concentrations (µg/L) of cadmium, mercury, lead, and arsenic in raw and PHWW treatments of different mixtures (1%, 2.5%, and 5%) and filtration methods (none, sand, sand + carbon, reverse osmosis), with three replications and the average of those replications are presented in Table 2.
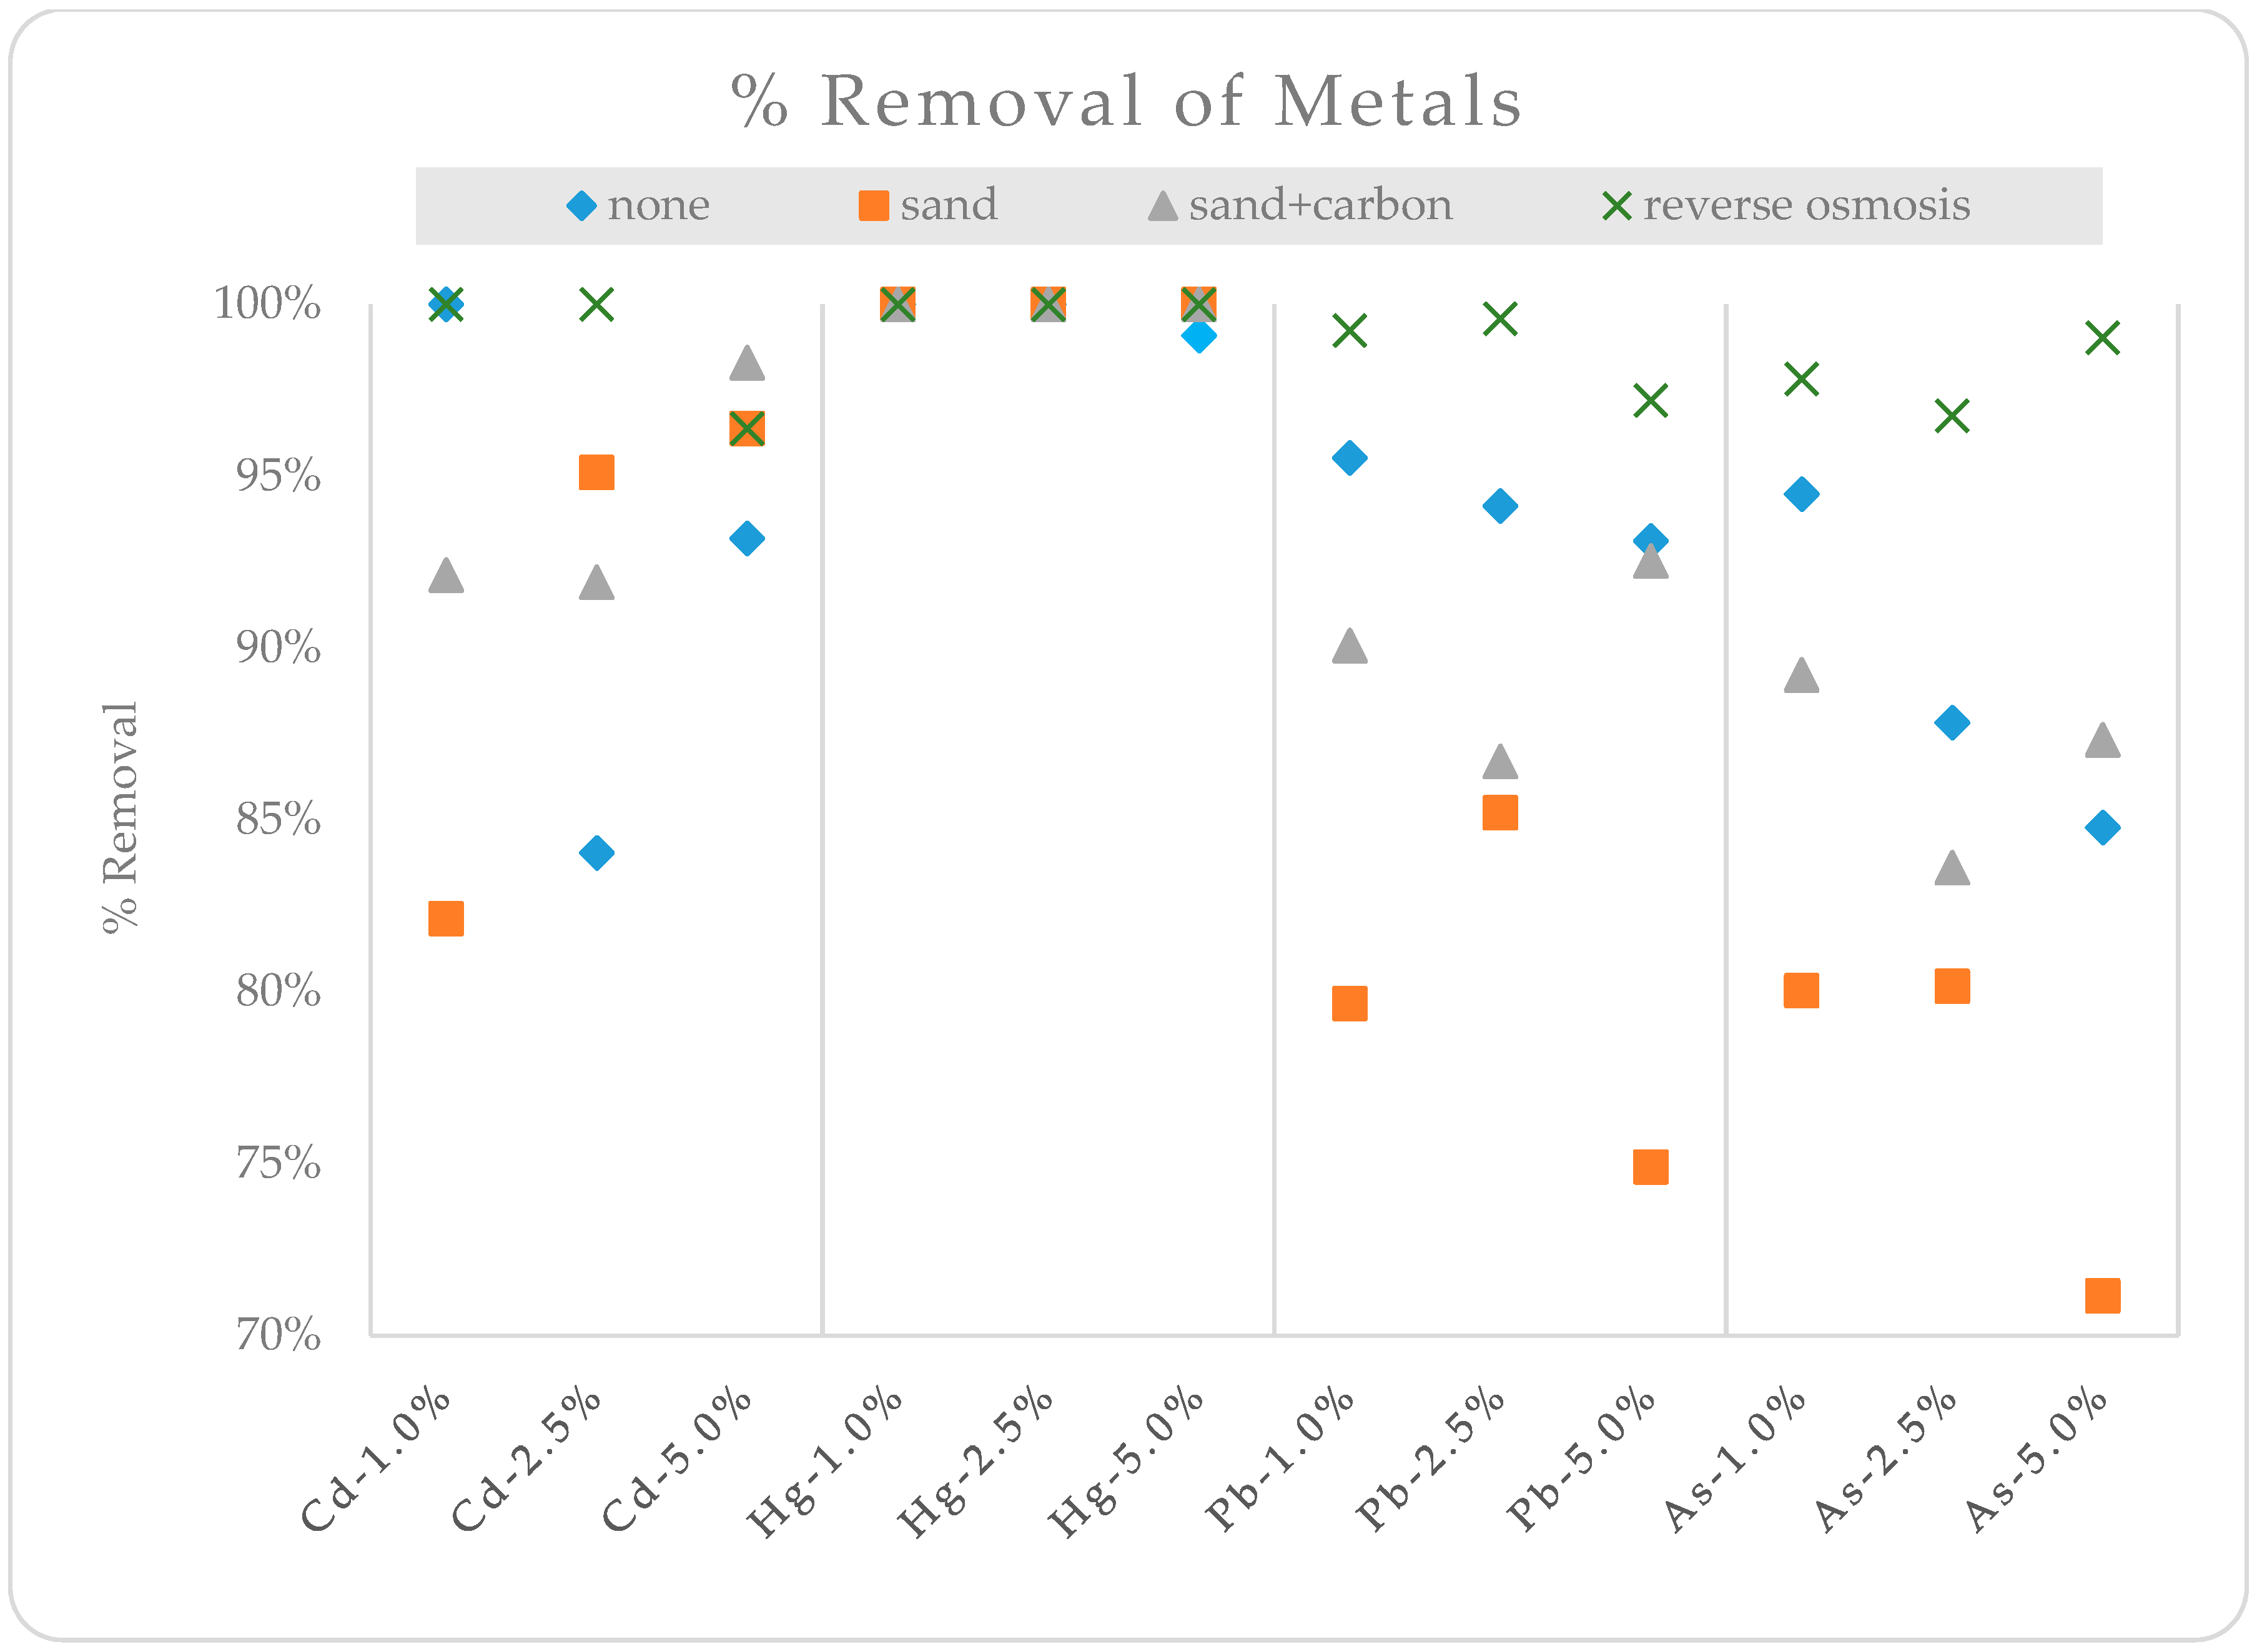
Arsenic and lead had the highest concentrations, having an average of 41.2 µg/L and 20.68 µg/L, respectively. Across all treatments and mixtures, mercury was below detectable levels. The reverse osmosis treatments had the lowest concentrations of all metals and within each mixture. Within each mixture, both the sand and sand + carbon treatments had higher lead and arsenic concentrations than the diluted unfiltered PHWW, except for the 5% sand + carbon treatment. Between sand and sand + carbon, the latter had lower lead and arsenic concentrations. For the 1% mixture, cadmium was higher in the filtered treatments than the unfiltered treatments, but for the 2.5% and 5% mixtures, cadmium was reduced after filtration. Figure 4 presents the percent removal of metals by each treatment method and for each mixture.
As seen in Table 1, mercury was easily removed from the PHWW for all mixtures and with all treatment methods. However, the removal of cadmium, lead, and arsenic was more variable. For cadmium, reverse osmosis achieved a 100% reduction for the 1% and 2.5% mixtures, and a 96% removal with the 5% mixture. Sand filtration removed 82%, 95%, and 96% of the cadmium, respectively, from the 1%, 2.5%, and 5% mixtures. When carbon filtration was added to the sand, the removal of cadmium was 92%, 91%, and 98% from the 1%, 2.5%, and 5% mixtures, respectively. For lead and arsenic, there was a more dominant trend between treatments. The reverse osmosis achieved the highest removals for all three mixtures, while sand + carbon achieved the second highest removal, followed by sand filtration alone. It is worth noting that the diluted mixture receiving no treatment performed better than the sand filtration and sand + carbon filtration, with the exception of the arsenic removal at the 5% mixture, where the sand + carbon filtration performed slightly better than the untreated mixture. Table 3 shows the p-values for all treatment comparison of metals removal. The significant differences (p < 0.05) are highlighted in red for convenience.
Table 3 shows that the only significant differences between treatments are for the 1% mixture and for lead and arsenic removal. The removal of lead and arsenic follow the following trend: reverse osmosis > sand + carbon > sand > none. Table 4 shows the average metals concentrations for the 2.5% mixture both with, and without nitrification.
Cadmium concentrations were higher for the 2.5% mixture with nitrification for the sand, sand + carbon, and reverse osmosis treatments, but lower for the untreated mixture with nitrification. Mercury concentrations were zero for all 2.5% mixture treatments receiving no nitrification and the sand and sand + carbon treatments for the 2.5% mixture with nitrification. Lead concentrations were higher for the 2.5% mixture without nitrification when no treatment was used, as well as when sand and sand + carbon treatments were used. Only when reverse osmosis was used was the lead concentration higher for the 2.5% mixture with nitrification. All arsenic concentrations were higher for the 2.5% mixture with no nitrification. Figure 5 presents the percent removal of metals by each treatment method for the 2.5% mixture of PHWW.
From Figure 5, it can be seen that cadmium was more difficult to remove after nitrification was induced. The percent removal was lower for all treatments after nitrification. The untreated mixture, however, was slightly higher (84% vs. 89%) for cadmium. Since no mercury was detected in the PHWW before nitrification but low detections were recorded after nitrification, the percent removal was slightly lower after nitrification for mercury. The percent removal for lead decreased from 99.6% to 90.6% with reverse osmosis, but increased for sand filtration (from 85.2% to 97.6%) and sand + carbon filtration (from 86.7% to 94.5%). The percent removal of arsenic increased for all treatment methods when nitrification was induced. Table 5 shows the p-values for all treatment comparison of metals removal. The significant differences (p < 0.05) are highlighted in red for convenience.
The only significant difference in treatment method prior to nitrification being induced in the PHWW was between sand filtration and reverse osmosis (p = 0.021) for arsenic removal. After nitrification was induced in the PHWW, there was a significant difference in arsenic removal between no treatment and reverse osmosis (p = 0.001), between sand filtration and reverse osmosis (p = 0.001), and between sand + carbon and reverse osmosis (p = 0.001). It is also important to assess the impact of nitrification on each treatment method. Table 6 shows the p-values for each treatment method before and after nitrification was induced in the PHWW.
No significant differences were found when nitrification was induced for any of the treatment methods. Table 7 shows the concentrations of nitrogen and phosphorus compounds in the PHWW mixtures.
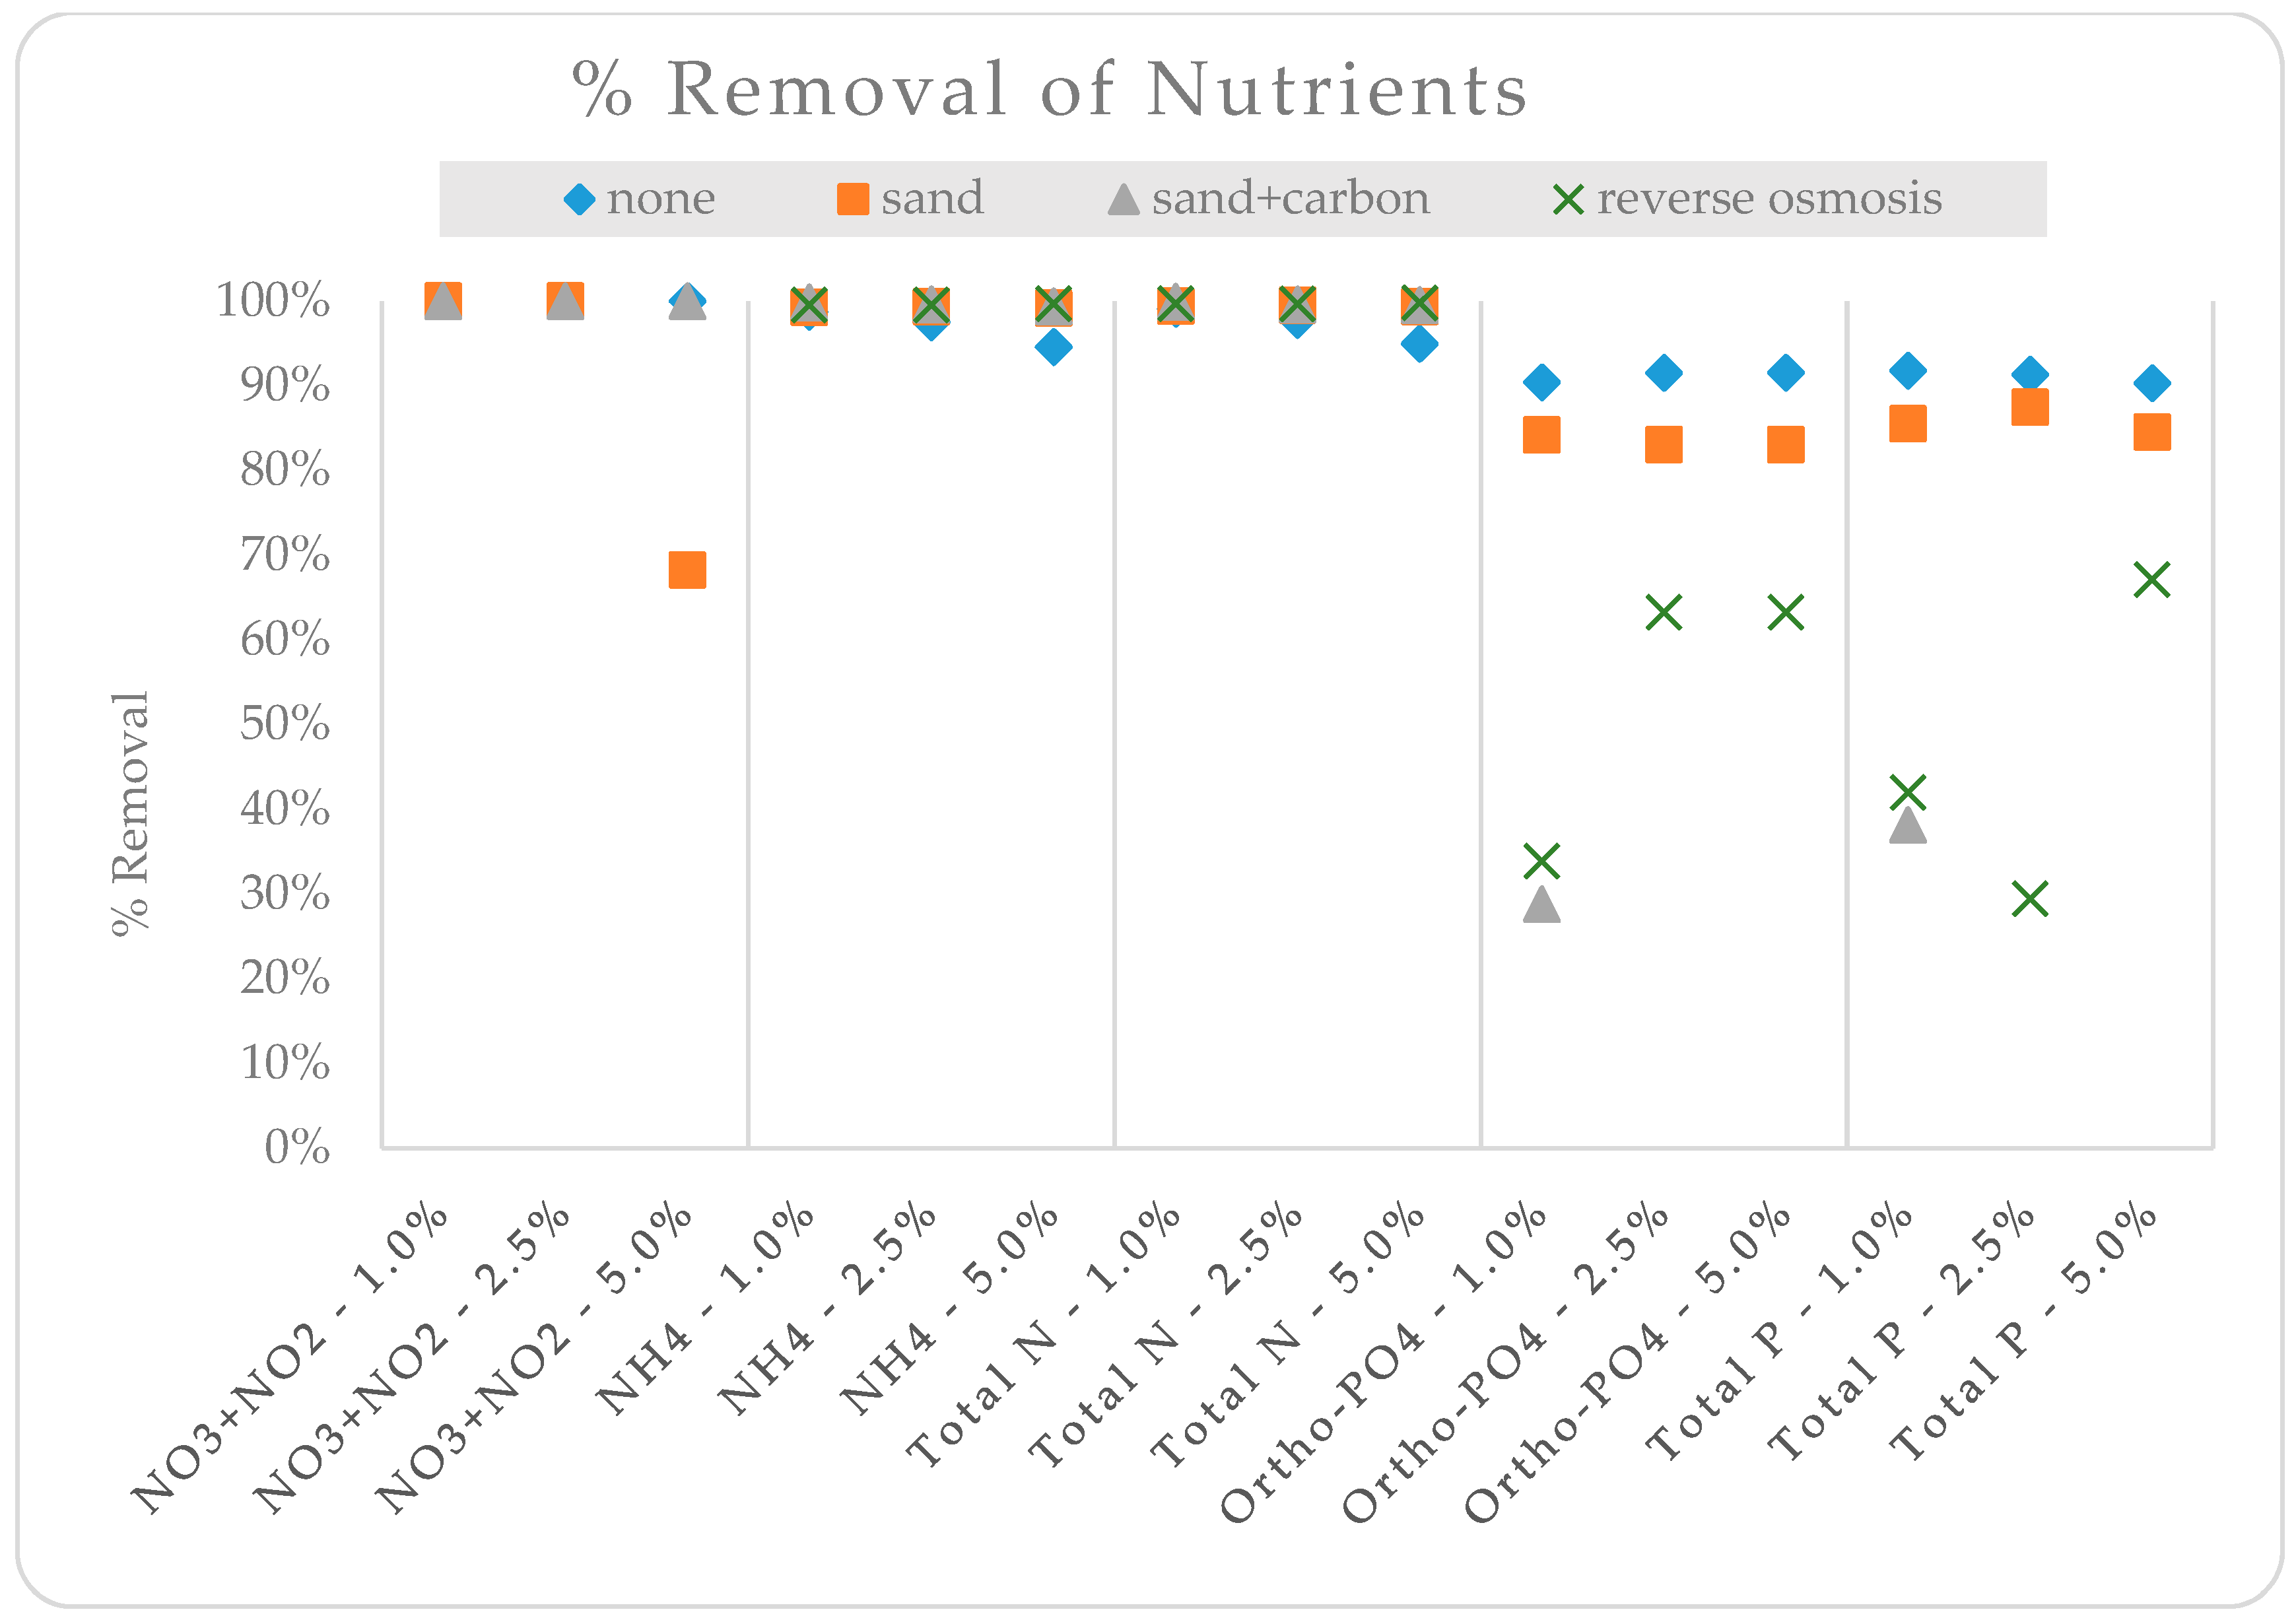
The raw PHWW had high concentrations of NH3-N and total N (Table 6), which aligned with what was found in the literature [11,13,36,37]. However, phosphorous was on a much lower scale. However, very little of this was in the form of NO3 + NO2. Across all mixtures, reverse osmosis treatments had higher NO3 + NO2 concentrations than any other filtered or unfiltered treatment, which was not expected. Within each mixture, sand + carbon treatments had lower nitrogen concentrations than sand alone and sand alone had lower nitrogen compound concentrations than unfiltered. Altogether, the less dilute mixtures had higher nutrient concentrations than the more dilute mixtures. For phosphorus, within each mixture, sand alone had higher phosphorus compound concentrations than unfiltered and sand + carbon had higher than sand alone. Figure 6 presents the percent removal of nutrients by each treatment method and mixture of PHWW.
Nitrogen compounds were relatively easily removed by the sand and sand + carbon treatment methods in this study. However, the sand filtration was only able to remove 68% of the NO3 + NO2 from the 5% mixture, and the reverse osmosis treatment showed higher NO3 + NO2 than the raw PHWW, so the reverse osmosis percent removals are not included in Figure 6. The ammonium and total N were entirely removed from all mixtures by all treatment methods. The orthophosphate and total P concentrations were higher in the treated PHWW than the initial diluted PHWW mixtures. Of the treatment methods, sand filtration was most effective, followed by reverse osmosis and then sand + carbon filtration. Since the sand + carbon filtration had higher concentrations than the raw PHWW (it is not shown in Figure 6). Table 8 shows the p-values for all treatment comparison of nutrients removal. The significant differences (p < 0.05) are highlighted in red for convenience.
There was a significant difference between reverse osmosis treatment and the untreated 1% PHWW mixture, as well as between reverse osmosis and sand filtration, as well as between sand + carbon and reverse osmosis for NO3 + NO2. In these cases, the untreated 1% mixture had lower concentrations of NO3 + NO2 than the treated water. With the 2.5% mixture, significant differences between treatment methods existed for all of the nutrient compounds. Significant differences were only seen between the nitrogen compounds with the 5% PHWW mixture and primarily only between the treatment methods and the untreated PHWW mixture, but not between the filtration methods (except between sand + carbon and reverse osmosis). Table 9 shows the nitrogen and phosphorus mean concentrations after nitrification was induced in the PHWW mixtures. Figure 7 shows the change in concentration before and after nitrification for each nutrient and treatment method.
There was an increase in NO3 + NO2 concentration only for the untreated PHWW mixture (+1.75 mg/L). The reverse osmosis treatment caused a decrease in NO3 + NO2 concentration for the 2.5% and 5% mixtures. Total N concentrations increased after nitrification with the sand + carbon filtration for the 1% (+1.08 mg/L) and 5% (+8.37 mg/L) mixtures, but remained unchanged for the 2.5% mixture. Sand filtration decreased the total N concentration for the 1% (−6.25 mg/L) mixture, but increased concentrations for the 2.5% (+13.43 mg/L) and 5% (+3.08 mg/L) mixtures. Reverse osmosis filtration slightly decreased total concentrations for all three PHWW mixtures. The untreated PHWW mixture increased total N concentrations for the 1% (+7.10 mg/L) and 2.5% (+2.83 mg/L) mixtures, but substantially decreased the total N concentration for the 5% mixture (−68.55 mg/L).
The orthophosphate concentrations were slightly higher after nitrification for the untreated 1% (+0.39 mg/L) and 2.5% (+0.17 mg/L) PHWW mixtures, but remained unchanged for the untreated 5% PHWW mixture. There were also slight increases in orthophosphate concentrations for the 1% PHWW mixture when sand filtration (+0.02 mg/L) and sand + carbon filtration (+0.17 mg/L) were used, but a 0.14 mg/L decrease when reverse osmosis was used. There were decreases in orthophosphate concentrations for the 2.5% PHWW mixture when sand filtration (−0.03 mg/L), sand + carbon filtration (−1.32 mg/L), and reverse osmosis filtration (−0.41 mg/L) were used. In addition, the orthophosphate concentrations decreased for the 5% PHWW mixture when sand + carbon filtration (−0.75 mg/L) and reverse osmosis filtration (−0.12 mg/L) were used. Total P concentrations increased for all three untreated PHWW mixtures and also with the addition of sand filtration, but decreased when sand + carbon filtration and reverse osmosis filtration were used, except for the 1% mixture, which experienced an increase in total P concentration when sand + carbon filtration was used. Table 10 shows the p-values for all treatment comparison of nutrient removal after nitrification was induced, and Table 11 shows the comparison of each nitrogen and phosphorus compound concentration in the untreated PHWW mixtures before and after nitrification was induced. The significant differences (p < 0.05) are highlighted in red for convenience.
Many differences between treatments exist for PHWW mixtures after nitrification, most notably for NO3 + NO2 and total N. Significant differences existed for NO3 + NO2 between all three untreated PHWW mixture and reverse osmosis filtration as well as between sand filtration and reverse osmosis filtration and between sand + carbon filtration and reverse osmosis filtration for the 1% and 2.5% mixtures. For the 5% PHWW mixture, significant differences were seen between sand filtration and the untreated PHWW mixture and also between sand + carbon filtration and the untreated PHWW mixture. For total N, there were significant differences between all three filtrations and the untreated 1% PHWW mixture, between reverse osmosis filtration and the untreated 2.5% PHWW mixture, and for all treatment interactions for the 5% PHWW mixture except between reverse osmosis filtration and the untreated 2.5% PHWW mixture and between sand filtration and sand + carbon filtration.
For phosphorus, there were only significant differences between sand filtration and sand + carbon filtration for orthophosphate in the 1% PHWW mixture and between sand filtration and the untreated 1% PHWW mixture for total P. For the 2.5% PHWW mixture, there were significant differences between sand + carbon filtration and the untreated PHWW mixture, between sand filtration and sand + carbon filtration, and between sand + carbon filtration and reverse osmosis filtration for orthophosphate. There were significant differences in total P between sand filtration and sand + carbon filtration and between sand + carbon filtration and reverse osmosis filtration for the 2.5% PHWW mixture. For the 5% PHWW mixture, there were significant differences between sand + carbon filtration and the untreated 5% PHWW mixture for both orthophosphate and total P and between sand + carbon filtration and reverse osmosis filtration for total P.
Nitrification caused significant differences in nutrient concentrations for all three PHWW mixtures. The concentrations of NO3 + NO2, total N, orthophosphate, and total P were all different for the 1% PHWW mixture. For the 2.5% mixture, orthophosphate and total P were different after nitrification occurred. The NO3 + NO2 concentrations were zero both before and after nitrification, thus the p-value could not be computed. The NO3 + NO2 and total N concentrations were significantly different after nitrification for the 5% PHWW mixture.
Across all treatments, mixtures, and the raw PHWW, no E. coli or fecal coliform colonies were detected.
4. Discussion
The results from heavy metal analyses indicate that arsenic and lead are the most concentrated heavy metals in raw PHWW. Mercury seems to be almost undetectable and cadmium is similarly very low. The 2012 EPA Guidelines for Water Reuse holds criteria for elemental concentrations in wastewater used for irrigation [38]. These guidelines for arsenic, cadmium, and lead are 0.10, 0.01, and 5.0 mg/L, respectively. Compared to these guidelines, raw PHWW and all PHWW treatments have acceptable arsenic, cadmium, and lead concentrations. Mercury is not included in these guidelines. Furthermore, in 2018 EPA Drinking Water Standards and Health Advisories, the maximum contaminant level (MCL) for arsenic, cadmium, lead, and mercury are 0.01, 0.005, 0.15, and 0.002 mg/L, respectively [39]. Compared to these guidelines for drinking water, raw PHWW exceeds the MCL for arsenic, lead, and mercury, but not cadmium. However, all unfiltered PHWW dilutions followed the guidelines for drinking water for arsenic, cadmium, lead, and mercury. In addition, all filtered PHWW dilutions followed these guidelines for drinking water, except for the 5% dilution with sand filtration alone for Arsenic.
Furthermore, the finding that, within each PHWW mixture, arsenic and lead concentrations increased after filtration with sand or sand with granulated activated carbon, compared to the PHWW mixture alone, shows that filtration may adverse effects on diluted PHWW treatments. It is suspected that this is because diluted PHWW has very low heavy metal concentrations and is contaminated by heavy metals in the filter media used. Therefore, it is difficult to determine the effect of different granular filter media on the reduction of concentrations found in diluted PHWW. However, as sand with granulated activated carbon had lower concentrations than sand alone, sand with granulated activated carbon may be an effective filter media for PHWW or other wastewaters with higher heavy metal concentrations. Reverse osmosis was used in this study as a benchmark, as it is one of the most effective filtering methods available [16,40,41]. Reverse osmosis proved to be quite effective in removing metals from the PHWW mixtures, achieving percent removals ranging from 82.77% for cadmium in the nitrified 2.5% PHWW mixture to complete removal of cadmium and mercury in the 1% and 2.5% PHWW mixtures before nitrification. Budgetary constraints may prevent reverse osmosis from being feasible in a large-scale production system. Therefore, sand filtration or sand + carbon filtration may be suitable considering the ability of both of these filtering methods to achieve acceptable concentrations of cadmium, lead, and arsenic for EPA Water Reuse criteria.
Nutrient analyses show that while PHWW may have excess nitrogen, it may not be in the NO3 + NO2 form, which plants can more easily utilize. The raw PHWW in this study had 1,364 mg/L of total N, but only 0.43 mg/L of NO3 + NO2, which means only 0.03% of the nitrogen is in the preferred form for plant uptake. A recommended rate of 150 mg/L of nitrogen is needed for optimal lettuce production [15]. Therefore, significant fertilizer supplementation will be needed in order to effectively use PHWW for crop production. Furthermore, filtration to reduce heavy metals content has the side effect of removing nutrients from the PHWW. If filtration is used to reduce metals content, further supplementation with fertilizer in addition to the PHWW may be necessary. While the nitrified treatments did have higher phosphorus concentrations, NO3 + NO2 was not greatly affected. This may be due to a failure to establish true nitrifying bacteria, the nitrate being filtered out, or not allowing enough time for the reaction to occur. The concentrations of orthophosphate (0.59 mg/L) and total P (0.69 mg/L) were quite low even in the raw, undiluted and untreated PHWW. In the diluted mixtures, the concentrations were very low and undetectable in some cases. For several of the treatments, especially the sand + carbon filtration, the orthophosphate and total P concentrations were higher than the untreated 2.5% and 5% PHWW mixtures. Perhaps the slight heterogeneity and very low concentrations of the raw PHWW simply magnified an otherwise typical effect.
For E. coli/coliforms, all treatments tested negative, so PHWW should be a safe choice for a water source free of pathogens. This is likely due to the high heat and pressure involved in the HTL process, which should destroy any pathogens present [37]. The US EPA guidelines for water reuse on food crops states no detectable fecal coliforms are allowed per 100 mL of reclaimed water [38]. It should be noted, however, that these guidelines were established with surface or spray irrigation for food crops in mind, in which the water comes into direct contact with the food portion of the crop. Hydroponic lettuce production, in contrast, would consist of providing reclaimed and treated water only to the roots of the crop. No specific guideline currently exists for this scenario.
5. Conclusions
Raw PHWW and PHWW treatments meet US EPA guidelines for wastewater reuse for crop irrigation in terms of heavy metals and E. coli and coliforms. While PHWW has N concentrations exceeding those needed by plants, it is not in the form of NO3. Furthermore, PHWW does not have sufficient P concentrations for optimal plant growth. Seeing as the raw PHWW used in this study meet the guidelines for wastewater reuse for crop irrigation, the treatment of PHWW should focus on treating it to be the most effective crop fertilizer. Only the reverse osmosis treatment was able to consistently remove heavy metals from the PHWW mixtures. However, even without any treatment, heavy metal concentrations in the PHWW mixtures were below the US EPA recommended levels for water reuse, and even below the US EPA MCL for drinking water. Therefore, diluted PHWW does not necessitate treatment for heavy metals.
A limitation of this study is that there was only one specific source of PHWW from one pilot HTL reactor. In order to assure that all PHWW have similar results, performing this study with PHWW from different reactors run on different feedstocks in different reactor runs should be done. Another limitation is that the PHWW had been in storage without temperature control before use; ideally, fresh PHWW should be used, to limit changes in the PHWW over time. Furthermore, a larger sample size for each treatment could increase confidence in the findings.
Author Contributions
Conceptualization, P.C.D.; data curation, S.D.J.; formal analysis, S.D.J. and P.C.D.; investigation, S.D.J.; methodology, S.D.J. and P.C.D.; project administration, P.C.D.; resources, P.C.D.; supervision, P.C.D.; writing—original draft, S.D.J.; writing—review and editing, P.C.D.
Funding
This research received no external funding.
Acknowledgments
The authors would like to thank Yuanhui Zhang’s research group for providing the raw PHWW used in this study.
Conflicts of Interest
The authors declare no conflict of interest.
References
- United States Department of Energy Office of Energy Efficiency and Renewable Energy Bioenergy Technologies Office. Biofuels and Bioproducts from Wet and Gaseous Waste Streams: Challenges and Opportunities; United States Department of Energy: Washington, DC, USA, 2017.
- Jaramillo, M.F.; Restrepo, I. Wastewater reuse in agriculture: A review about its limitations and benefits. Sustainability 2019, 9, 1734. [Google Scholar] [CrossRef]
- Ambika, S.R.; Ambika, P.K. Crop growth and soil properties affected by sewage water irrigation—A review. Agric. Rev. 2010, 31, 203–209. [Google Scholar]
- Khalid, S.; Shahid, M.; Bibi, I.; Sarwar, T.; Shah, A.H.; Niazi, N.K. A review of environmental contamination and health risk assessment of wastewater use for crop irrigation with a focus on low and high-income countries. Int. J. Environ. Res. Public Health 2018, 15, 895. [Google Scholar] [CrossRef]
- Christou, A.; Agüera, A.; Bayona, J.M.; Cytryn, E.; Fotopoulos, V.; Lambropoulou, D.; Manaia, C.M.; Michael, C.; Revitt, M.; Schroder, P.; Fatta-Kassinos, D. The potential implications of reclaimed wastewater reuse for irrigation on the agricultural environment: The knowns and unknowns of the fate of antibiotics and antibiotic resistant bacteria and resistance genes—A review. Water Res. 2017, 123, 448–467. [Google Scholar] [CrossRef]
- Akhtar, J.; Amin, N.A.S. A review on process conditions for optimum bio-oil yield in hydrothermal liquefaction of biomass. Renew. Sustain. Energy Rev. 2011, 15, 1615–1624. [Google Scholar] [CrossRef]
- Huang, H.J.; Yuan, X.Z. Recent progress in the direct liquefaction of typical biomass. Prog. Energy Combust. Sci. 2015, 49, 59–80. [Google Scholar] [CrossRef]
- Peterson, A.; Vogel, F.; Lachance, R.P.; Fröling, M.; Antal, M.J., Jr.; Tester, J.W. Thermochemical biofuel production in hydrothermal media: A review of sub-and supercritical water technologies. Energy Environ. Sci. 2008, 1, 32–65. [Google Scholar] [CrossRef]
- Leng, L.; Zhou, W. Chemical compositions and wastewater properties of aqueous phase (wastewater) produced from the hydrothermal treatment of wet biomass: A review. Energy Sources Part A Recover. Util. Environ. Eff. 2018, 40, 2648–2659. [Google Scholar] [CrossRef]
- Yang, L.; Si, B.; Tan, X.; Chu, H.; Zhou, X.; Zhang, Y.; Zhang, Y.; Zhao, F. Integrated Anaerobic Digestion and Algae Cultivation for Energy Recovery and Nutrient Supply from Post-Hydrothermal Liquefaction Wastewater. Bioresour. Technol. 2018, 266, 349–356. [Google Scholar] [CrossRef]
- Stablein, M.J. Augmented Growth of Haematococcus Pluvialis Using Nutrients from Post Hydrothermal Liquefaction Wastewater (PHWW). Master’s Thesis, Department of Agricultural and Biological Engineering, University of Illinois at Urbana-Illinois, Urbana-Champaign, IL, USA, 2018. [Google Scholar]
- Leng, L.; Li, J.; Wen, Z.; Zhou, W. Use of microalgae to recycle nutrients in aqueous phase derived from hydrothermal liquefaction process. Bioresour. Technol. 2018, 256, 529–542. [Google Scholar]
- Mazur, Z. The Co-Cultivation of Rice and Algae to Imporve Process Economics for Algal Biofuel Production. Master’s Thesis, Department of Agricultural and Biological Engineering, University of Illinois at Urbana-Illinois, Urbana-Champaign, IL, USA, 2016. [Google Scholar]
- Eater. Available online: https://www.eater.com/2018/7/3/17531192/vertical-farming-agriculture-hydroponic-greens (accessed on 7 March 2019).
- Mattson, N.S.; Peters, C. A Recipe for Hydroponic Success. Available online: http://www.greenhouse.cornell.edu/crops/factsheets/hydroponic-recipes.pdf (accessed on 7 March 2019).
- Hoslett, J.H.; Massara, T.M.; Malamis, S.; Ahmad, D.; van den Boogaert, I.; Katsou, E.; Ahmad, B.; Ghazal, H.; Simons, S.; Wrobel, L.; Jouhara, H. Surface water filtration using granular media and membranes: A review. Sci. Total Environ. 2018, 639, 1268–1282. [Google Scholar] [CrossRef] [Green Version]
- Chaudhry, S.A.; Khan, T.A.; Ali, I. Equilibrium, kinetic and thermodynamic studies of Cr(VI) adsorption from aqueous solution onto manganese oxide coated sand grain (MOCSG). J. Mol. Liq. 2017, 236, 320–330. [Google Scholar] [CrossRef]
- Smith, K.; Li, Z.; Chen, B.; Liang, H.; Zhang, X.; Xu, R.; Li, Z.; Dai, H.; Wei, C.; Liu, S. Comparison of sand-based water filters for point-of-use arsenic removal in China. Chemosphere 2017, 168, 155–162. [Google Scholar] [CrossRef]
- Guo, Z.; Zhang, J.; Kang, Y.; Liu, H. Rapid and efficient removal of Pb(II) from aqueous solutions using biomass-derived activated carbon with humic acid in-situ modification. Ecotoxicol. Environ. Saf. 2017, 145, 442–448. [Google Scholar] [CrossRef] [PubMed]
- Kårelid, V.; Larsson, G.; Björlenius, B. Pilot-scale removal of pharmaceuticals in municipal wastewater: Comparison of granular and powdered activated carbon treatment at three wastewater treatment plants. J. Environ. Manag. 2017, 193, 491–502. [Google Scholar] [CrossRef] [PubMed]
- Shanmuganathan, S.; Loganathan, P.; Kazner, C.; Johir, M.A.H.; Vigneswaran, S. Submerged membrane filtration adsorption hybrid system for the removal of organic micropollutants from a water reclamation plant reverse osmosis concentrate. Desalination 2017, 401, 134–141. [Google Scholar] [CrossRef]
- Wu, B.; Suwarno, S.R.; Tan, H.S.; Kim, L.H.; Hochstrasser, F.; Chong, T.H.; Burkhardt, M.; Pronk, W.; Fane, A.G. Gravity-driven microfiltration pretreatment for reverse osmosis (RO) seawater desalination: Microbial community characterization and RO performance. Desalination 2017, 418, 1–8. [Google Scholar] [CrossRef]
- Zhang, Y.; Wan, Y.; Pan, G.; Shi, H.; Yan, H.; Xu, J.; Guo, M.; Wang, Z.; Liu, Y. Surface modification of polyamide reverse osmosis membrane with sulfonated polyvinyl alcohol for antifouling. Appl. Surf. Sci. 2017, 419, 177–187. [Google Scholar] [CrossRef]
- Bi, F.; Zhao, H.; Zhou, Z.; Zhang, L.; Chen, H.; Gao, C. Optimal design of nanofiltration system for surface water treatment. Chin. J. Chem. Eng. 2016, 24, 1674–1679. [Google Scholar] [CrossRef]
- Hedayatipour, M.; Jaafarzadeh, N.; Ahmadmoazzam, M. Removal optimization of heavy metals from effluent of sludge dewatering process in oil and gas well drilling by nanofiltration. J. Environ. Manag. 2017, 203, 151–156. [Google Scholar] [CrossRef]
- Suresh, K.; Pugazhenthi, G. Cross flow microfiltration of oil-water emulsions using clay based ceramic membrane support and TiO2 composite membrane. Egypt. J. Pet. 2017, 26, 679–694. [Google Scholar] [CrossRef]
- Carpintero-Tepole, V.; Brito-de la Fuente, E.; Torrestiana-Sánchez, B. Microfiltration of oil in water (O/W) emulsions: Effect of membrane microstructure and surface properties. Chem. Eng. Res. Des. 2017, 126, 286–296. [Google Scholar] [CrossRef]
- Hung, M.T.; Liu, J.C. Microfiltration of microalgae in the presence of rigid particles. Sep. Purif. Technol. 2016, 198, 10–15. [Google Scholar] [CrossRef]
- Ortega Sandoval, A.D.; Barbosa Brião, V.; Cartana Fernandes, V.M.; Hemkemeier, A.; Friedrich, M.T. Stormwater management by microfiltration and ultrafiltration treatment. J. Water Process Eng. 2017, 18. [Google Scholar] [CrossRef]
- Hamada, T.; Al-Ghusain, I.; Al-Mutairi, N. Sand filtration of wastewater for tertiary treatment and water reuse. Desalination 2004, 164, 203–211. [Google Scholar] [CrossRef]
- Gude, J.C.J.; Joris, K.; Huysman, K.; Rietveld, L.C.; van Halem, D. Effect of supernatant water level on as removal in biological sand filters. Water Res. X 2018, 1, 100013. [Google Scholar] [CrossRef]
- Genç-Fuhrman, H.; Mikkelsen, P.S.; Ledin, A. Simultaneous removal of As, Cd, Cr, Cu, Ni and Zn from stormwater: Experimental comparison of 11 different sorbents. Water Res. 2007, 41, 591–602. [Google Scholar] [CrossRef]
- Androver, M.; Moyà, G.; Vadell, J. Use of hydroponics culture to assess nutrient supply by treated wastewater. J. Environ. Manag. 2013, 127, 162–165. [Google Scholar] [CrossRef]
- Al-Karaki, G.N. Utilization of treated sewage wastewater for green forage production in a hydroponic system. Emir. J. Food Agric. 2011, 23, 80–94. [Google Scholar] [CrossRef]
- Muñoz, I.; Gómez-Ramos, M.J.; Agüera, A.; Fernández-Alba, A.R.; García-Reyes, J.F.; Molina-Díaz, A. Chemical evaluation of contaminants in wastewater effluents and the environmental risk of reusing effluents in agriculture. Trends Anal. Chem. 2009, 28, 676–694. [Google Scholar] [CrossRef]
- Lu, J.; Zhang, J.; Zhu, Z.; Zhang, Y.; Zhao, Y.; Li, R.; Watson, J.; Li, B.; Liu, J. Simultaneous production of biocrude oil and recovery of nutrients and metals from human feces via hydrothermal liquefaction. Energy Convers. Manag. 2017, 134, 340–346. [Google Scholar] [CrossRef]
- Pham, M.; Schideman, L.; Sharma, B.K.; Zhang, Y.; Chen, W.T. Effects of hydrothermal liquefaction on the fate of bioactive contaminants in manure and algal feedstocks. Bioresour Technol. 2013, 149, 126–135. [Google Scholar] [CrossRef] [PubMed]
- United States Environmental Protection Agency. 2018 Edition of the Drinking Water Standards and Health Advisories Tables; US EPA Office of Wastewater Management: Washington, DC, USA, 2012; pp. 45–123.
- United States Environmental Protection Agency. 2012 Guidelines for Water Reuse; US EPA Office of Water: Washington, DC, USA, 2018; pp. 1–12.
- Victor-Ortega, M.D.; Ratnaweera, H.C. Double filtration as an effective system for removal of arsenate and arsenite from drinking water through reverse osmosis. Process Saf. Environ. Prot. 2017, 111, 399–408. [Google Scholar] [CrossRef]
- Baudequin, C.; Couallier, E.; Rakib, M.; Deguerry, I.; Severac, R.; Pabon, M. Purification of firefighting water containing a fluorinated surfactant by reverse osmosis coupled to electrocoagulation-filtration. Sep. Purif. Technol. 2011, 76, 275–282. [Google Scholar] [CrossRef]
Figure 1.
Pump and filter system for sand and sand + carbon filtration treatments.

Figure 2.
Reverse osmosis system used in this study.

Figure 3.
Schematic diagrams depicting the (a) sand and (b) the sand + carbon filtration systems.

Figure 4.
The percent removal of each metal from the four treatments and three mixtures.

Figure 5.
The percent removal of each metal from the four treatments with and without nitrification.
Figure 5.
The percent removal of each metal from the four treatments with and without nitrification.

Figure 6.
The percent removal of each form of nitrogen and phosphorus from the raw PHWW for the four treatments.
Figure 6.
The percent removal of each form of nitrogen and phosphorus from the raw PHWW for the four treatments.

Figure 7.
The change in concentration of each form of nitrogen and phosphorus after nitrification was induced from the four treatments.
Figure 7.
The change in concentration of each form of nitrogen and phosphorus after nitrification was induced from the four treatments.


Table 1.
Explanation of experimental groups for Post-Hydrothermal Liquefaction Wastewater (PHWW) treatment.
Table 1.
Explanation of experimental groups for Post-Hydrothermal Liquefaction Wastewater (PHWW) treatment.
| Experimental Group | Explanation |
|---|---|
| Raw PHWW | Composition of raw PHWW before any treatment; untreated |
| Diluted PHWW | Effect of different mixtures to reduce metals concentration and bring nutrients to plant-sufficient concentrations. PHWW was diluted using tap water. |
| Sand Filtered PHWW | Effect of a basic filtration method on diluted PHWWs to further reduce metals and filter out E. coli/coliforms, but also effect on nutrients. Diluted and then filtered through a sand filtration bed. |
| Sand + Carbon Filtered PHWW | Effect of mid-level filtration on diluted PHWW to further reduce metals and filter out E. coli/coliforms, but also effect on nutrients. Diluted and then filtered through a layered sand and activated carbon filtration bed |
| Reverse Osmosis PHWW | Effect of high-level filtration on diluted PHWWs to further reduce metals and filter out E. coli/coliforms, but also effect on nutrients |
| Nitrified PHWW | Effect of nitrification and aeration on the composition of nutrient availability. Nitrifying bacteria were added to the water to induce nitrification over a 1-week period. Diluted, nitrified, and then filtered, when applicable. |
Table 2.
Metal concentrations in the raw PHWW and treated PHWW. Concentrations are shown in µg/L.
| Metal Concentrations in PHWW and PHWW Treatments | |||||
|---|---|---|---|---|---|
| Sample | Cadmium | Mercury | Lead | Arsenic | |
| Mixture (% raw) | Treatment | Avg. Conc. (µg/L) | Avg. Conc. (µg/L) | Avg. Conc. (µg/L) | Avg. Conc. (µg/L) |
| 100% | none | 1.57 | 6.25 | 20.68 | 41.20 |
| 1.0% | none | 0.00 | 0.00 | 0.92 | 2.28 |
| sand | 0.28 | 0.00 | 4.21 | 8.23 | |
| sand + carbon | 0.12 | 0.00 | 2.05 | 4.44 | |
| reverse osmosis | 0.00 | 0.00 | 0.16 | 0.89 | |
| 2.5% | none | 0.25 | 0.00 | 1.21 | 5.01 |
| sand | 0.08 | 0.00 | 3.06 | 8.18 | |
| sand + carbon | 0.13 | 0.00 | 2.75 | 6.75 | |
| reverse osmosis | 0.00 | 0.00 | 0.09 | 1.34 | |
| 5.0% | none | 0.11 | 0.06 | 1.42 | 6.27 |
| sand | 0.06 | 0.00 | 5.19 | 11.89 | |
| sand + carbon | 0.03 | 0.00 | 1.54 | 5.22 | |
| reverse osmosis | 0.06 | 0.00 | 0.58 | 0.40 | |
Table 3.
Significant differences between methods for each metal were calculated using Tukey HSD method and the p-values are presented for each treatment comparison. Significant differences (p < 0.05) are highlighted in red for convenience.
Table 3.
Significant differences between methods for each metal were calculated using Tukey HSD method and the p-values are presented for each treatment comparison. Significant differences (p < 0.05) are highlighted in red for convenience.
| 1% Mixture | |||||
| Treatment 1 | Treatment 2 | Cd | Hg | Pb | As |
| none | sand | 0.311 | - | 0.002 | 0.007 |
| none | sand + carbon | 0.826 | - | 0.258 | 0.391 |
| none | reverse osmosis | 0.900 | - | 0.547 | 0.698 |
| sand | sand + carbon | 0.712 | - | 0.020 | 0.072 |
| sand | reverse osmosis | 0.311 | - | 0.001 | 0.002 |
| sand + carbon | reverse osmosis | 0.826 | - | 0.038 | 0.093 |
| 2.5% Mixture | |||||
| Treatment 1 | Treatment 2 | Cd | Hg | Pb | As |
| none | sand | 0.573 | - | 0.498 | 0.589 |
| none | sand + carbon | 0.768 | - | 0.624 | 0.886 |
| none | reverse osmosis | 0.299 | - | 0.791 | 0.483 |
| sand | sand + carbon | 0.900 | - | 0.900 | 0.900 |
| sand | reverse osmosis | 0.900 | - | 0.164 | 0.090 |
| sand + carbon | reverse osmosis | 0.755 | - | 0.228 | 0.202 |
| 5% Mixture | |||||
| Treatment 1 | Treatment 2 | Cd | Hg | Pb | As |
| none | sand | 0.886 | 0.524 | 0.578 | 0.768 |
| none | sand + carbon | 0.668 | 0.524 | 0.900 | 0.900 |
| none | reverse osmosis | 0.886 | 0.524 | 0.900 | 0.746 |
| sand | sand + carbon | 0.900 | 0.900 | 0.599 | 0.678 |
| sand | reverse osmosis | 0.900 | 0.900 | 0.429 | 0.293 |
| sand + carbon | reverse osmosis | 0.900 | 0.900 | 0.900 | 0.836 |
Table 4.
Metal concentrations in the raw PHWW and treated PHWW with and without nitrification. Concentrations are shown in µg/L.
Table 4.
Metal concentrations in the raw PHWW and treated PHWW with and without nitrification. Concentrations are shown in µg/L.
| Metal Concentrations in Nitrified and Non-Nitrified PHWW Treatments | |||||
|---|---|---|---|---|---|
| Sample | Cadmium | Mercury | Lead | Arsenic | |
| Mixture (% raw) | Treatment | Avg. Conc. (µg/L) | Avg. Conc. (µg/L) | Avg. Conc. (µg/L) | Avg. Conc. (µg/L) |
| 100% | none | 1.57 | 6.25 | 20.68 | 41.20 |
| 2.5% Without nitrification | none | 0.25 | 0.00 | 1.21 | 5.01 |
| sand | 0.08 | 0.00 | 3.06 | 8.18 | |
| sand + carbon | 0.13 | 0.00 | 2.75 | 6.75 | |
| reverse osmosis | 0.00 | 0.00 | 0.09 | 1.34 | |
| 2.5% With nitrification | none | 0.17 | 0.06 | 1.09 | 2.19 |
| sand | 0.54 | 0.00 | 0.50 | 2.21 | |
| sand + carbon | 0.43 | 0.00 | 1.13 | 2.40 | |
| reverse osmosis | 0.27 | 0.03 | 1.94 | 0.47 | |
Table 5.
Significant differences between methods for each metal were calculated using Tukey HSD method and the p-values are presented for each treatment comparison. Significant differences (p < 0.05) are highlighted in red for convenience.
Table 5.
Significant differences between methods for each metal were calculated using Tukey HSD method and the p-values are presented for each treatment comparison. Significant differences (p < 0.05) are highlighted in red for convenience.
| 2.5% Mixture (Non-Nitrified) | |||||
| Treatment 1 | Treatment 2 | Cd | Hg | Pb | As |
| none | sand | 0.900 | 0.900 | 0.777 | 0.609 |
| none | sand + carbon | 0.900 | 0.900 | 0.900 | 0.900 |
| none | reverse osmosis | 0.900 | 0.900 | 0.900 | 0.453 |
| sand | sand + carbon | 0.900 | 0.900 | 0.900 | 0.900 |
| sand | reverse osmosis | 0.900 | 0.900 | 0.301 | 0.021 |
| sand + carbon | reverse osmosis | 0.900 | 0.900 | 0.425 | 0.097 |
| 2.5% Mixture (Nitrified) | |||||
| Treatment 1 | Treatment 2 | Cd | Hg | Pb | As |
| none | sand | 0.581 | 0.608 | 0.900 | 0.900 |
| none | sand + carbon | 0.783 | 0.608 | 0.900 | 0.811 |
| none | reverse osmosis | 0.900 | 0.900 | 0.889 | 0.001 |
| sand | sand + carbon | 0.900 | 0.900 | 0.900 | 0.845 |
| sand | reverse osmosis | 0.758 | 0.900 | 0.638 | 0.001 |
| sand + carbon | reverse osmosis | 0.900 | 0.900 | 0.900 | 0.001 |
Table 6.
Significant differences between each method before (−) and after (+) nitrification was induced in the PHWW for each metal were calculated using the Tukey HSD method, and the p-values are presented for each treatment comparison. Significant differences (p < 0.05) are highlighted in red for convenience.
| 2.5% Mixture | |||||
|---|---|---|---|---|---|
| Treatment 1 | Treatment 2 | Cd | Hg | Pb | As |
| none (−) | none (+) | 0.900 | 0.633 | 0.900 | 0.712 |
| sand (−) | sand (+) | 0.450 | 0.900 | 0.471 | 0.054 |
| sand + carbon (−) | sand + carbon (+) | 0.839 | 0.900 | 0.874 | 0.267 |
| reverse osmosis (−) | reverse osmosis (+) | 0.900 | 0.900 | 0.774 | 0.900 |
Table 7.
Nitrogen and phosphorus concentrations in the raw PHWW and treated PHWW. Concentrations are shown in mg/L. The standard deviation from the mean is also presented for each form of nitrogen and phosphorus.
Table 7.
Nitrogen and phosphorus concentrations in the raw PHWW and treated PHWW. Concentrations are shown in mg/L. The standard deviation from the mean is also presented for each form of nitrogen and phosphorus.
| Nitrogen and Phosphorus Nutrients in Raw and Treated PHWW | ||||||
|---|---|---|---|---|---|---|
| Sample | Nitrogen | Phosphorus | ||||
| Mixture (% raw) | Filtration | NO3 + NO2 (mg/L) | NH4 (mg/L) | Total N (mg/L) | Ortho-PO4 (mg/L) | Total P (mg/L) |
| 100% | none | 0.43 | 472.00 | 1364.00 | 0.59 | 0.69 |
| 1% | none | 0.00 | 5.83 | 12.37 | 0.06 | 0.06 |
| sand | 0.00 | 3.68 | 8.54 | 0.09 | 0.10 | |
| sand + carbon | 0.00 | 0.72 | 1.36 | 0.42 | 0.43 | |
| reverse osmosis | 1.75 | 2.31 | 4.37 | 0.39 | 0.40 | |
| 2.50% | none | 0.00 | 11.73 | 30.20 | 0.05 | 0.06 |
| sand | 0.00 | 3.10 | 7.14 | 0.08 | 0.09 | |
| sand + carbon | 0.00 | 1.93 | 5.49 | 2.14 | 2.24 | |
| reverse osmosis | 2.16 | 2.21 | 4.50 | 0.48 | 0.49 | |
| 5.00% | none | 0.00 | 25.60 | 68.63 | 0.05 | 0.07 |
| sand | 0.14 | 4.04 | 8.99 | 0.10 | 0.11 | |
| sand + carbon | 0.00 | 3.00 | 6.43 | 1.22 | 1.26 | |
| reverse osmosis | 1.10 | 1.52 | 2.78 | 0.22 | 0.23 | |
Table 8.
Significant differences between methods for each form of nitrogen and phosphorus were calculated using the Tukey HSD method, and the p-values are presented for each treatment comparison. Significant differences (p < 0.05) are highlighted in red for convenience.
Table 8.
Significant differences between methods for each form of nitrogen and phosphorus were calculated using the Tukey HSD method, and the p-values are presented for each treatment comparison. Significant differences (p < 0.05) are highlighted in red for convenience.
| 1% Mixture | ||||||
| Treatment 1 | Treatment 2 | NO3 + NO2 | NH3 | Total N | Ortho-P | Total P |
| none | sand | 0.900 | 0.689 | 0.857 | 0.900 | 0.900 |
| none | sand + carbon | 0.900 | 0.118 | 0.204 | 0.081 | 0.071 |
| none | reverse osmosis | 0.001 | 0.346 | 0.433 | 0.113 | 0.096 |
| sand | sand + carbon | 0.900 | 0.481 | 0.515 | 0.121 | 0.116 |
| sand | reverse osmosis | 0.001 | 0.893 | 0.822 | 0.168 | 0.156 |
| sand + carbon | reverse osmosis | 0.001 | 0.836 | 0.900 | 0.900 | 0.900 |
| 2.5% Mixture | ||||||
| Treatment 1 | Treatment 2 | NO3 + NO2 | NH3 | Total N | Ortho-P | Total P |
| none | sand | 0.900 | 0.001 | 0.001 | 0.900 | 0.900 |
| none | sand + carbon | 0.900 | 0.001 | 0.001 | 0.001 | 0.001 |
| none | reverse osmosis | 0.001 | 0.001 | 0.001 | 0.119 | 0.112 |
| sand | sand + carbon | 0.900 | 0.567 | 0.859 | 0.001 | 0.001 |
| sand | reverse osmosis | 0.001 | 0.732 | 0.627 | 0.153 | 0.141 |
| sand + carbon | reverse osmosis | 0.001 | 0.900 | 0.900 | 0.001 | 0.001 |
| 5% Mixture | ||||||
| Treatment 1 | Treatment 2 | NO3 + NO2 | NH3 | Total N | Ortho-P | Total P |
| none | sand | 0.900 | 0.001 | 0.001 | 0.900 | 0.900 |
| none | sand + carbon | 0.900 | 0.001 | 0.001 | 0.055 | 0.069 |
| none | reverse osmosis | 0.039 | 0.001 | 0.001 | 0.900 | 0.900 |
| sand | sand + carbon | 0.900 | 0.824 | 0.729 | 0.066 | 0.079 |
| sand | reverse osmosis | 0.070 | 0.261 | 0.143 | 0.900 | 0.900 |
| sand + carbon | reverse osmosis | 0.039 | 0.644 | 0.510 | 0.102 | 0.120 |
Table 9.
Nitrogen and phosphorus concentrations in the raw PHWW and treated PHWW after nitrification. Concentrations are shown in mg/L. The standard deviation from the mean is also presented for each form of nitrogen and phosphorus.
Table 9.
Nitrogen and phosphorus concentrations in the raw PHWW and treated PHWW after nitrification. Concentrations are shown in mg/L. The standard deviation from the mean is also presented for each form of nitrogen and phosphorus.
| Nutrients of (Nitrified + Aerated) PHWW Treatments | |||||
|---|---|---|---|---|---|
| Sample | Nitrogen | Phosphorous | |||
| Mixture (% raw) | Treatment | NO3 + NO2 (mg/L) | Total N (mg/L) | Ortho-PO4 (mg/L) | Total P (mg/L) |
| 100% | none | 0.43 | 1364.00 | 0.59 | 0.69 |
| 1% | none | 0.12 | 19.47 | 0.45 | 0.61 |
| sand | 0.00 | 2.29 | 0.12 | 0.15 | |
| sand + carbon | 0.00 | 2.44 | 0.59 | 0.54 | |
| reverse osmosis | 2.10 | 2.71 | 0.25 | 0.32 | |
| 2.50% | none | 0.00 | 33.03 | 0.22 | 0.35 |
| sand | 0.00 | 20.57 | 0.05 | 0.19 | |
| sand + carbon | 0.05 | 5.50 | 0.83 | 0.72 | |
| reverse osmosis | 0.79 | 1.44 | 0.07 | 0.12 | |
| 5.00% | none | 1.75 | 0.08 | 0.05 | 0.11 |
| sand | 0.18 | 12.07 | 0.14 | 0.27 | |
| sand + carbon | 0.19 | 14.80 | 0.48 | 0.69 | |
| reverse osmosis | 0.46 | 0.96 | 0.09 | 0.13 | |
Table 10.
Significant differences between methods for each form of nitrogen and phosphorus after nitrification were calculated using the Tukey HSD method, and the p-values are presented for each treatment comparison. Significant differences (p < 0.05) are highlighted in red for convenience.
Table 10.
Significant differences between methods for each form of nitrogen and phosphorus after nitrification were calculated using the Tukey HSD method, and the p-values are presented for each treatment comparison. Significant differences (p < 0.05) are highlighted in red for convenience.
| 1% Mixture | |||||
| Treatment 1 | Treatment 2 | NO3 + NO2 | Total N | Ortho-P | Total P |
| none | sand | 0.900 | 0.001 | 0.079 | 0.010 |
| none | sand + carbon | 0.900 | 0.001 | 0.643 | 0.900 |
| none | reverse osmosis | 0.011 | 0.001 | 0.371 | 0.085 |
| sand | sand + carbon | 0.900 | 0.900 | 0.015 | 0.038 |
| sand | reverse osmosis | 0.008 | 0.900 | 0.658 | 0.391 |
| sand + carbon | reverse osmosis | 0.008 | 0.900 | 0.076 | 0.274 |
| 2.5% Mixture | |||||
| Treatment 1 | Treatment 2 | NO3 + NO2 | Total N | Ortho-P | Total P |
| none | sand | 0.900 | 0.527 | 0.248 | 0.704 |
| none | sand + carbon | 0.757 | 0.097 | 0.001 | 0.168 |
| none | reverse osmosis | 0.001 | 0.035 | 0.334 | 0.498 |
| sand | sand + carbon | 0.757 | 0.469 | 0.001 | 0.038 |
| sand | reverse osmosis | 0.001 | 0.219 | 0.900 | 0.900 |
| sand + carbon | reverse osmosis | 0.001 | 0.900 | 0.001 | 0.022 |
| 5% Mixture | |||||
| Treatment 1 | Treatment 2 | NO3 + NO2 | Total N | Ortho-P | Total P |
| none | sand | 0.001 | 0.001 | 0.892 | 0.705 |
| none | sand + carbon | 0.001 | 0.001 | 0.050 | 0.024 |
| none | reverse osmosis | 0.001 | 0.843 | 0.900 | 0.900 |
| sand | sand + carbon | 0.900 | 0.215 | 0.133 | 0.105 |
| sand | reverse osmosis | 0.516 | 0.001 | 0.900 | 0.792 |
| sand + carbon | reverse osmosis | 0.623 | 0.001 | 0.082 | 0.030 |
Table 11.
Significant differences between concentrations of each form of nitrogen and phosphorus before and after nitrification in the untreated PHWW mixtures were calculated using the Tukey HSD method, and the p-values are presented for each treatment comparison. Significant differences (p < 0.05) are highlighted in red for convenience. The “—“ for the 2.5% mixture signifies that the mean concentrations before and after nitrification were both zero.
| Mixture | Treatment 1 | Treatment 2 | NO3 + NO2 | Total N | Ortho-P | Total P |
|---|---|---|---|---|---|---|
| 1% | Non-nitrified | Nitrified | 0.002 | 0.010 | 0.001 | 0.001 |
| 2.5% | Non-nitrified | Nitrified | - | 0.066 | 0.048 | 0.032 |
| 5% | Non-nitrified | Nitrified | 0.001 | 0.001 | 0.374 | 0.123 |
© 2019 by the authors. Licensee MDPI, Basel, Switzerland. This article is an open access article distributed under the terms and conditions of the Creative Commons Attribution (CC BY) license (http://creativecommons.org/licenses/by/4.0/).
Share and Cite
MDPI and ACS Style
Jesse, S.D.; Davidson, P.C. Treatment of Post-Hydrothermal Liquefaction Wastewater (PHWW) for Heavy Metals, Nutrients, and Indicator Pathogens. Water 2019, 11, 854. https://doi.org/10.3390/w11040854
AMA Style
Jesse SD, Davidson PC. Treatment of Post-Hydrothermal Liquefaction Wastewater (PHWW) for Heavy Metals, Nutrients, and Indicator Pathogens. Water. 2019; 11(4):854. https://doi.org/10.3390/w11040854
Chicago/Turabian StyleJesse, Samuel D., and Paul C. Davidson. 2019. "Treatment of Post-Hydrothermal Liquefaction Wastewater (PHWW) for Heavy Metals, Nutrients, and Indicator Pathogens" Water 11, no. 4: 854. https://doi.org/10.3390/w11040854
Note that from the first issue of 2016, this journal uses article numbers instead of page numbers. See further details here.