Non-Parametric Regression Analysis of Diuron and Gabapentin Degradation in Lake Constance Water by Ozonation and Their Toxicity Assessment


1
Department of Civil Engineering and Environmental Management, Glasgow Caledonian University, Glasgow G4 0BA, UK
2
Qualitaetssicherung und Forschungslabor, Zweckverband Bodensee-Wasserversorgung, Suessenmuehle 1, 78354 Sipplingen, Germany
*
Author to whom correspondence should be addressed.
Water 2019, 11(4), 852; https://doi.org/10.3390/w11040852
Submission received: 22 March 2019
/
Revised: 15 April 2019
/
Accepted: 18 April 2019
/
Published: 23 April 2019
(This article belongs to the Special Issue Water Quality Control: Monitoring, Analysis and Treatment of Emerging Micropollutants)
Abstract
:Ozone possesses high selectivity in the oxidation of organic pollutants. It actively reacts with electron donating participants which contain π bonds and non-protonated amines groups. The removal efficiency of organic pollutants hugely depends upon the pollutants’ initial concentration and amount of ozone supplied. This study was conducted at Zweckverband Bodensee-Wasserversorgung (Lake Constance Water Supply), Germany. The prime objective of the research was to observe the performance of diuron and gabapentin ozonation for low ozone doses, therefore meeting the real application requirements of the water treatment plant. Thereby, 1 mg·L−1 of the given organic pollutants was chosen for the treatment. The ozone with a dosage of ≈0.68–1.01 mg·L−1 was generated and homogeneously mixed into Lake Constance water in a semi-batch reactor system. The adequate aliquots of diuron/gabapentin were spiked into the homogenous matrix to acquire the desired initial concentration. The effect of ozone dose and reaction time on the degradation of diuron and gabapentin was investigated. Low ozone doses were sufficient for the complete degradation of diuron and gabapentin, although satisfactory total organic carbon (TOC) reduction was not achieved. Nonetheless, the toxicity from ozone treated effluents can be avoided by adjusting treatment conditions. Due to that degradation data obtained did not follow normalization, the non-parametric (non-normalised) data were analysed with a generalised linear regression model for Gaussian and Poisson distribution. Statistical analysis showed that the ozonation treatment of diuron/gabapentin followed the Gaussian model distribution and the degradation data obtained was proven significant using the Kruskal–Wallis test.
1. Introduction
The usage of pharmaceuticals, steroids, pesticides, surfactants, and many other chemical products is exponentially increasing with globalisation. Eventually, the extensive uses of these products adversely impact human health, as well as pollute surface/ground waters. Thereby, the European Union Directives (EU) commend strict standards for drinking water for limiting organic pollutants’ concentrations in water [1].
Diuron and gabapentin are widely used in organic compounds. Diuron (3-(3,4-dichlorophenyl)-1,1-dimethylurea) is an algicide of aryl urea which is used as a sensitive inhibitor of photosynthesis [2]. Diuron is a dangerous threat to the environment and thereby, included in the priority list of harmful compounds established by the European Parliament in water policy [3]. Gabapentin (2-(1-(aminomethyl)cyclohexyl) acetic acid) is an anti-epileptic drug and sold under the brand name ‘Neurontin’ [4]. Neurontin is prescribed for seizure treatment of epileptic patients. It also possesses some severe side effects like dizziness, loss of memory, lack of coordination, tremors, and double vision.
Ozone treatment is demonstrated as an effective method of degrading organic compounds from contaminated water [3,5,6]. The procedure is cost-effective and can efficiently breakdown most aliphatic and aromatic compounds [7]. The significant advantage of ozone is its gaseous state application which does not alter the overall volume of wastewater [5]. In an alkaline condition, ozone disintegrates to more reactive and less selective oxidants like OH•, HO2•, HO3•, and HO4•, and thus initiates a free-radical mechanism [5,8] to degenerate organic compounds.
In this study, the ozonation performance and its limitation were examined for the removal of diuron and gabapentin using Lake Constance water to make test solutions. More than four million people use drinking water from Lake Constance. Gabapentin is detectable in raw water from Lake Constance (about 40 ng·L−1). Diuron is widely used as a biocide in a lot of products like a coating of walls for buildings (e.g., facade plaster, rendering) and is washed out by rain (leaching out of material). Diuron is detectable in wastewater in the area. It is interesting in what would happen with both compounds, and if there might be toxic effects in water after ozonation.
The non-parametric data exhibit skewness to data distribution. The parametric linear models are unable to solve the skewness issues. Hence, the generalised linear model (GLM) is functioned [9]. It comprises the distribution of the observations, the linear predictor(s), the variance function, and the link function. The GLM analysis uses Gaussian and Poisson regression models. Both models describe prior distributions on functions [10]. Gaussian and Poisson process models perform nonparametric regression for the present study. The model deals with the uncertainty inherent in function from noisy data and gives full probabilistic predictions.
The ozone was used under a stress environment with a nominal concentration between 0.68–1.01 mgO3·L−1 and treated with 1 mg·L−1 organic pollutant. The degradation of diuron and gabapentin by ozone treatment was investigated using regression statistics. Generally, the experimental data are limited to predict precise performance. The current study thus has an approach to evaluate the experimental data and obtain the model prediction. Due to non-normalized data obtained from bench-scale experiments, extensively used parametric methods do not comply. Thus, the non-parametric techniques are implemented to model the experimental results. The mathematical framework is developed to predict the low ozone dose efficiency in degrading refractory organic micropollutants like diuron and gabapentin. The ozonised results were tested for the best fitted generalised linear model (GLM) which perfectly describes the process yield. Then, the data of micropollutants ozonation were fed into a GLM Gaussian model (best-fitted model for the present study) to derive a relation between inlet ozone dose and contact time. The regression equation is developed to predict the ozonation performance, given the dose of ozone (mg·L−1) and contact time (min).
2. Material and Methods
2.1. Material and Water Quality Measurement Methods
Methanol and formic acid used were in LC-MS grade, other chemical reagents used were in analytical grade, and all these were purchased from Sigma-Aldrich. Water quality characteristics were measured following German standard methods and are listed as pH (DIN EN ISO 10523-C5:2012); turbidity (DIN EN 7027:1999); colour at 436 nm (DIN EN ISO 7887:2012); UV-abs at 254 nm (DIN EN ISO 7887:2012); total organic carbon (TOC) (DIN EN 1484:1997). Procedures of measuring diuron and gabapentin concentrations were measured following DIN 38407-F36:2011 and details of these can be seen in Section 2.5.
2.2. Sample Preparation
The stock solutions were prepared in Lake Constance water. Diuron is least soluble in water; the solution was made in an ultrasonic water bath (Sonorex RK 102H, Bandelin electronic GmbH & CoKg., Berlin, Germany), and it was operated at room temperature with a nominal power of 120 W and frequency of 35 kHz for 1 h to obtain a homogeneous solution. Gabapentin is highly soluble and was dissolved in lake water with vigorous mixing. The ozone was generated and mixed in the reactor to achieve the desired concentration. The measured analytes solution was spiked into the reactor containing ozonised lake water to get a final level of 1 mg·L−1 into a 2.5 L solution.
2.3. Experimental Process and Data Analysis
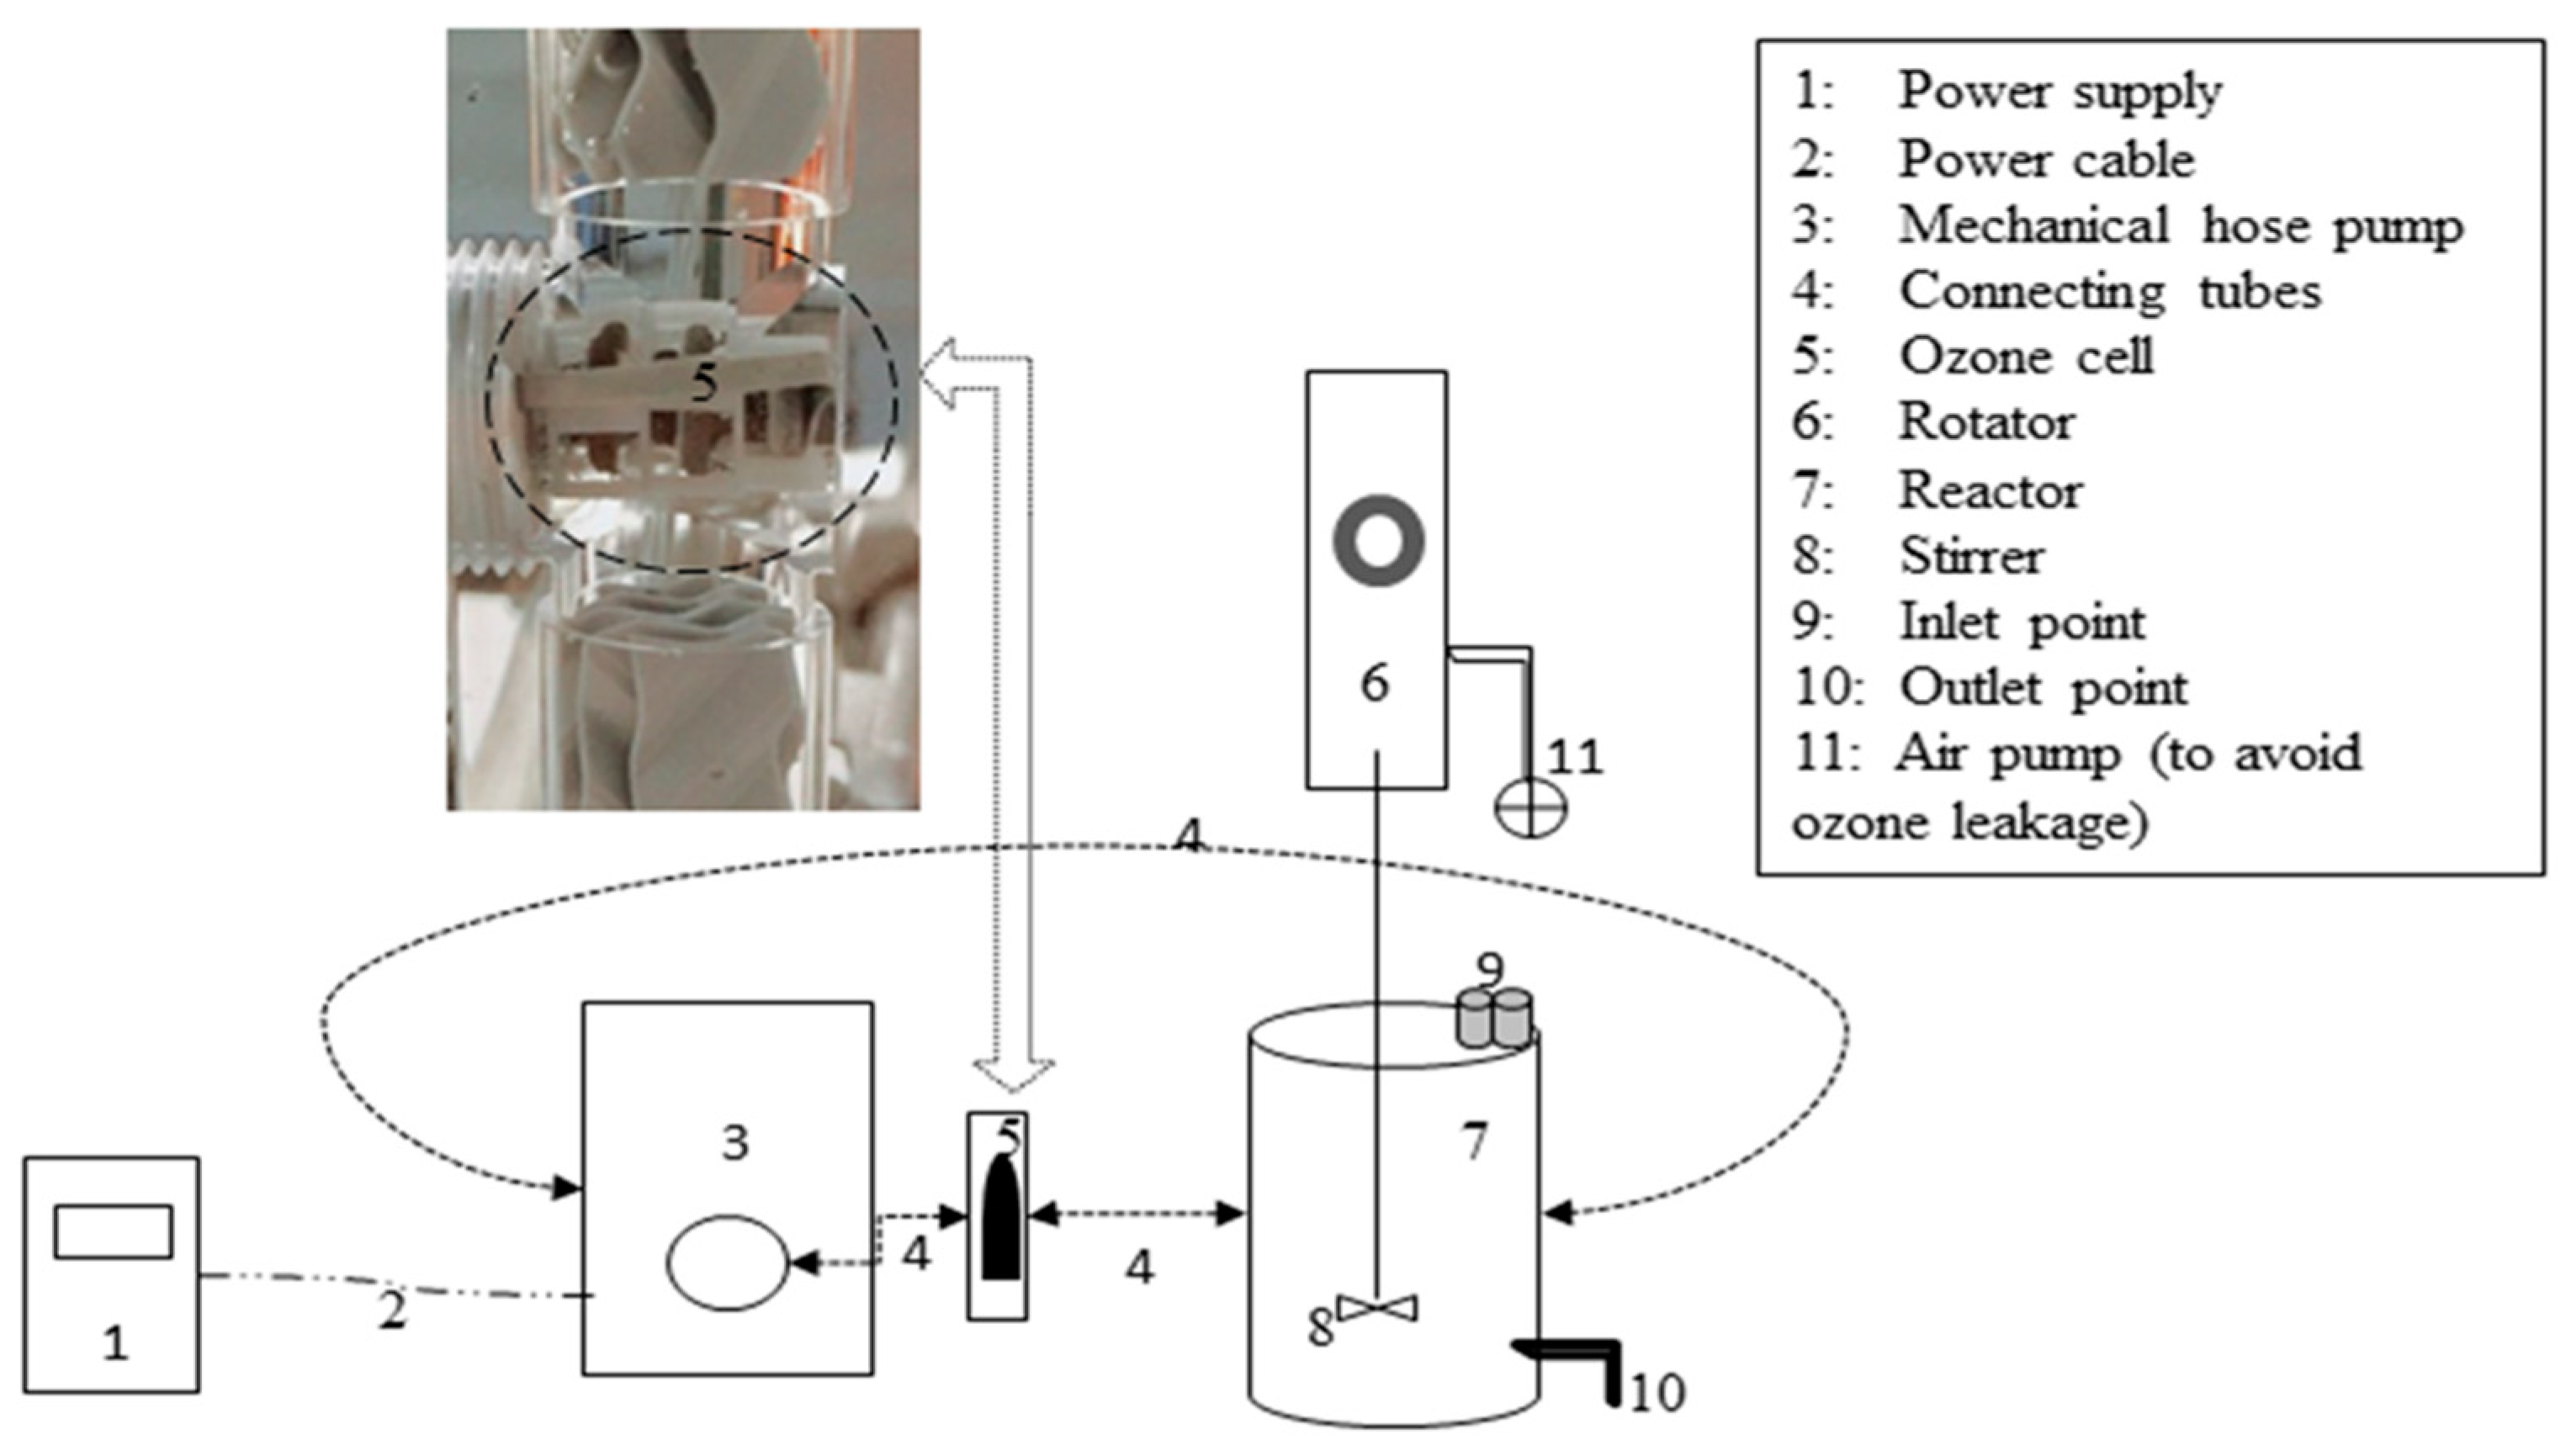
The semi-batch system setups used are shown in Figure 1. An electrolytic ozone generator with Ozone micro cell ELEK 4.4 was purchased from Innovatec Geraetetechnik GmbH, Rheinbach, Germany. The Ozone micro-cell was supplied with power throughout the experiment for continuous ozone generation. The Lake Constance water was circulated via a mechanical pump at 120 rpm through the ozone cells to produce the chosen ozone concentration in the reactor. The air pump was installed to drive excess ozone, thereby avoiding ozone leakage into the surroundings. Throughout the experiment, the solution inside the reactor (2.5 mL) was stirred at 85 rpm to maintain the homogeneous solution and prominent dissolution of ozone. The temperature did not rise beyond 20 ± 2 °C during the experiment, and thus the water jacket was not required. The pH recorded before (8.0 ± 0.09) and after (7.9 ± 0.03) the treatments were almost similar. The experiment was conducted at alkaline pH without adjusting the initial pH of the solution.
The ozone doses were 0.69 ± 0.01, 0.85 ± 0.03, and 0.95 ± 0.06 mgO3·L−1. The effluents collected in dark glass vials at 0, 1, 5, 15, 20, 30, 40, and 45 min were immediately analysed for the residual ozone. The residual ozone became extinct within 60–100 s after the sample collection. Each set of experiments were run in duplicate to minimise the error and obtain reproducible results. The effluent collected was stored at ±2 °C for further analysis. The samples were analysed within a week for pollutants degradation and total organic carbon (TOC) removal. The toxicity was analysed within 10–15 days of sample collection. Control samples were run under the same conditions as stated above, but using Lake Constance water, and its quality characteristics are shown in Section 3.1.
The experimental data were studied in the R project v-3.5.0 to develop a regression model. Pollutant degradation data were used to predict the ozonation performance at the given treatment condition and compared with the actual value. Each model developed was compared for its accuracy. Algorithms used are mentioned in Supplementary Materials.
2.4. Ozone Measurement
Ozone concentration was analysed in Hach Pocket Colorimeter using N, N-diethyl-1,4 phenylenediammonium (DPD) method. The DPD-method has been widely used in Germany to measure ozone concentration in water to validate the data gained from the online monitoring systems next in the treatment facility. It is the standard method in Germany (DIN 3840-3:2011-04) and to be accurate in measuring ozone concentration ranging from 0.02 to 2.5 mg·L−1 if no chlorine/other oxidants are present in the sample [11]; and this is the case for this study.
In an empty sampling cuvette, 3 drops of Reagent B (DPD-B) was added, and around 10 ml of the sample was collected immediately and mixed thoroughly. Reagent B prevents ozone loss from the sample. A total of 3 drops of Reagent A1 (DPD-A1) and 2 drops of Reagent A2 (DPD-A2) was then added and mixed to obtain a pink-red dye solution. The amount of colour developed is directly dependent on the amount of ozone into the solution. The exact ozone concentration (in mgO3·L−1) can be evaluated by multiplying factor (0.67) to the value obtained from the Hach Pocket colourimeter. Due to the instability of ozone, it was measured and recorded immediately after the collection.
2.5. Pollutants’ Concentration Measurement
The organic pollutants were quantified in a Q Exactive mass spectrometer, OrbitrapTM instrument equipped with an atmospheric pressure ionisation (API) source for liquid chromatography (LC) mass spectrometry (MS). The chromatographic separation was achieved using a C18 column (AQUILTY UPLC HSS T3 1.8 µM, WATERS). The eluents consisted of 0.05% formic acid in water (Eluent A) and 0.05% formic acid in methanol (Eluent B). The gradient elution and volume flow are given in Table 1.
The mineralisation of ozonised samples was estimated as equivalent to the percentage difference in total organic carbon (TOC) before and after treatment. The Vario TOC cube (Elementar Hanau, Germany), and the TOC/Dissolve Organic Carbon (DOC)-method based on DIN EN 1484:1997 was used.
2.6. Toxicity Assessment
The Microtox acute toxicity protocol based on British standards, BS EN ISO 11348-3:2008, was used to observe the samples’ toxicity. BioFix Lumi freeze-dried luminescent bacteria, (Aliivibrio fischeri) was activated by the addition of 11 mL Biofix Lumi medium for freeze-dried luminescent bacteria. Before using reactivated bacteria, the solution was stored at 4 °C for 30 min to stabilise. The reference solution was 18.7 mg·L−1 Cr (VI), equivalent to 52.9 mg L−1 potassium dichromate, and was used as the positive control. Test samples were prepared using freeze-dried bacteria in 2% sodium chloride to provide ambient conditions for bacteria to grow. The bacterial solution (0.1 mL) was added into individual fresh vials and incubated at 16 ± 1 °C for 15 min. After that, the initial (I0) relative light unit (RLU) value was measured. Next, the control solutions and samples were added into the vials with incubated bacteria. The vials were mixed gently and left to incubate for 30 min. The RLU (I30) after 30 min was recorded. The correction ratio (fk = I0/I30) for the individual negative control vials were calculated to find the mean correction value. The results obtained were evaluated as bioluminescence inhibition relative to negative control.
3. Results and Discussion
3.1. Characterisation of Lake Constance Water and Inlet Ozone Concentration
The organic compounds were spiked into the Lake Constance water, and their removal efficiency through ozone treatment was studied. The characteristics of Lake Constance water are given in Table 2. The given organic pollutants were spiked into the natural lake water, and ozonation treatment was examined without pH adjustment.
The relative range of ozone doses used to initiate the diuron and gabapentin treatment are shown in Table 3. The ozone level dropped abruptly immediately after the addition of an organic pollutant into the solution. Table 4 presents the changes in ozone at various time intervals throughout the treatment. Slight variances in ozone concentrations were observed, and the sample variance is defined as the average of the squared differences from the mean.
3.2. Degradation and Mineralization of the Pollutants
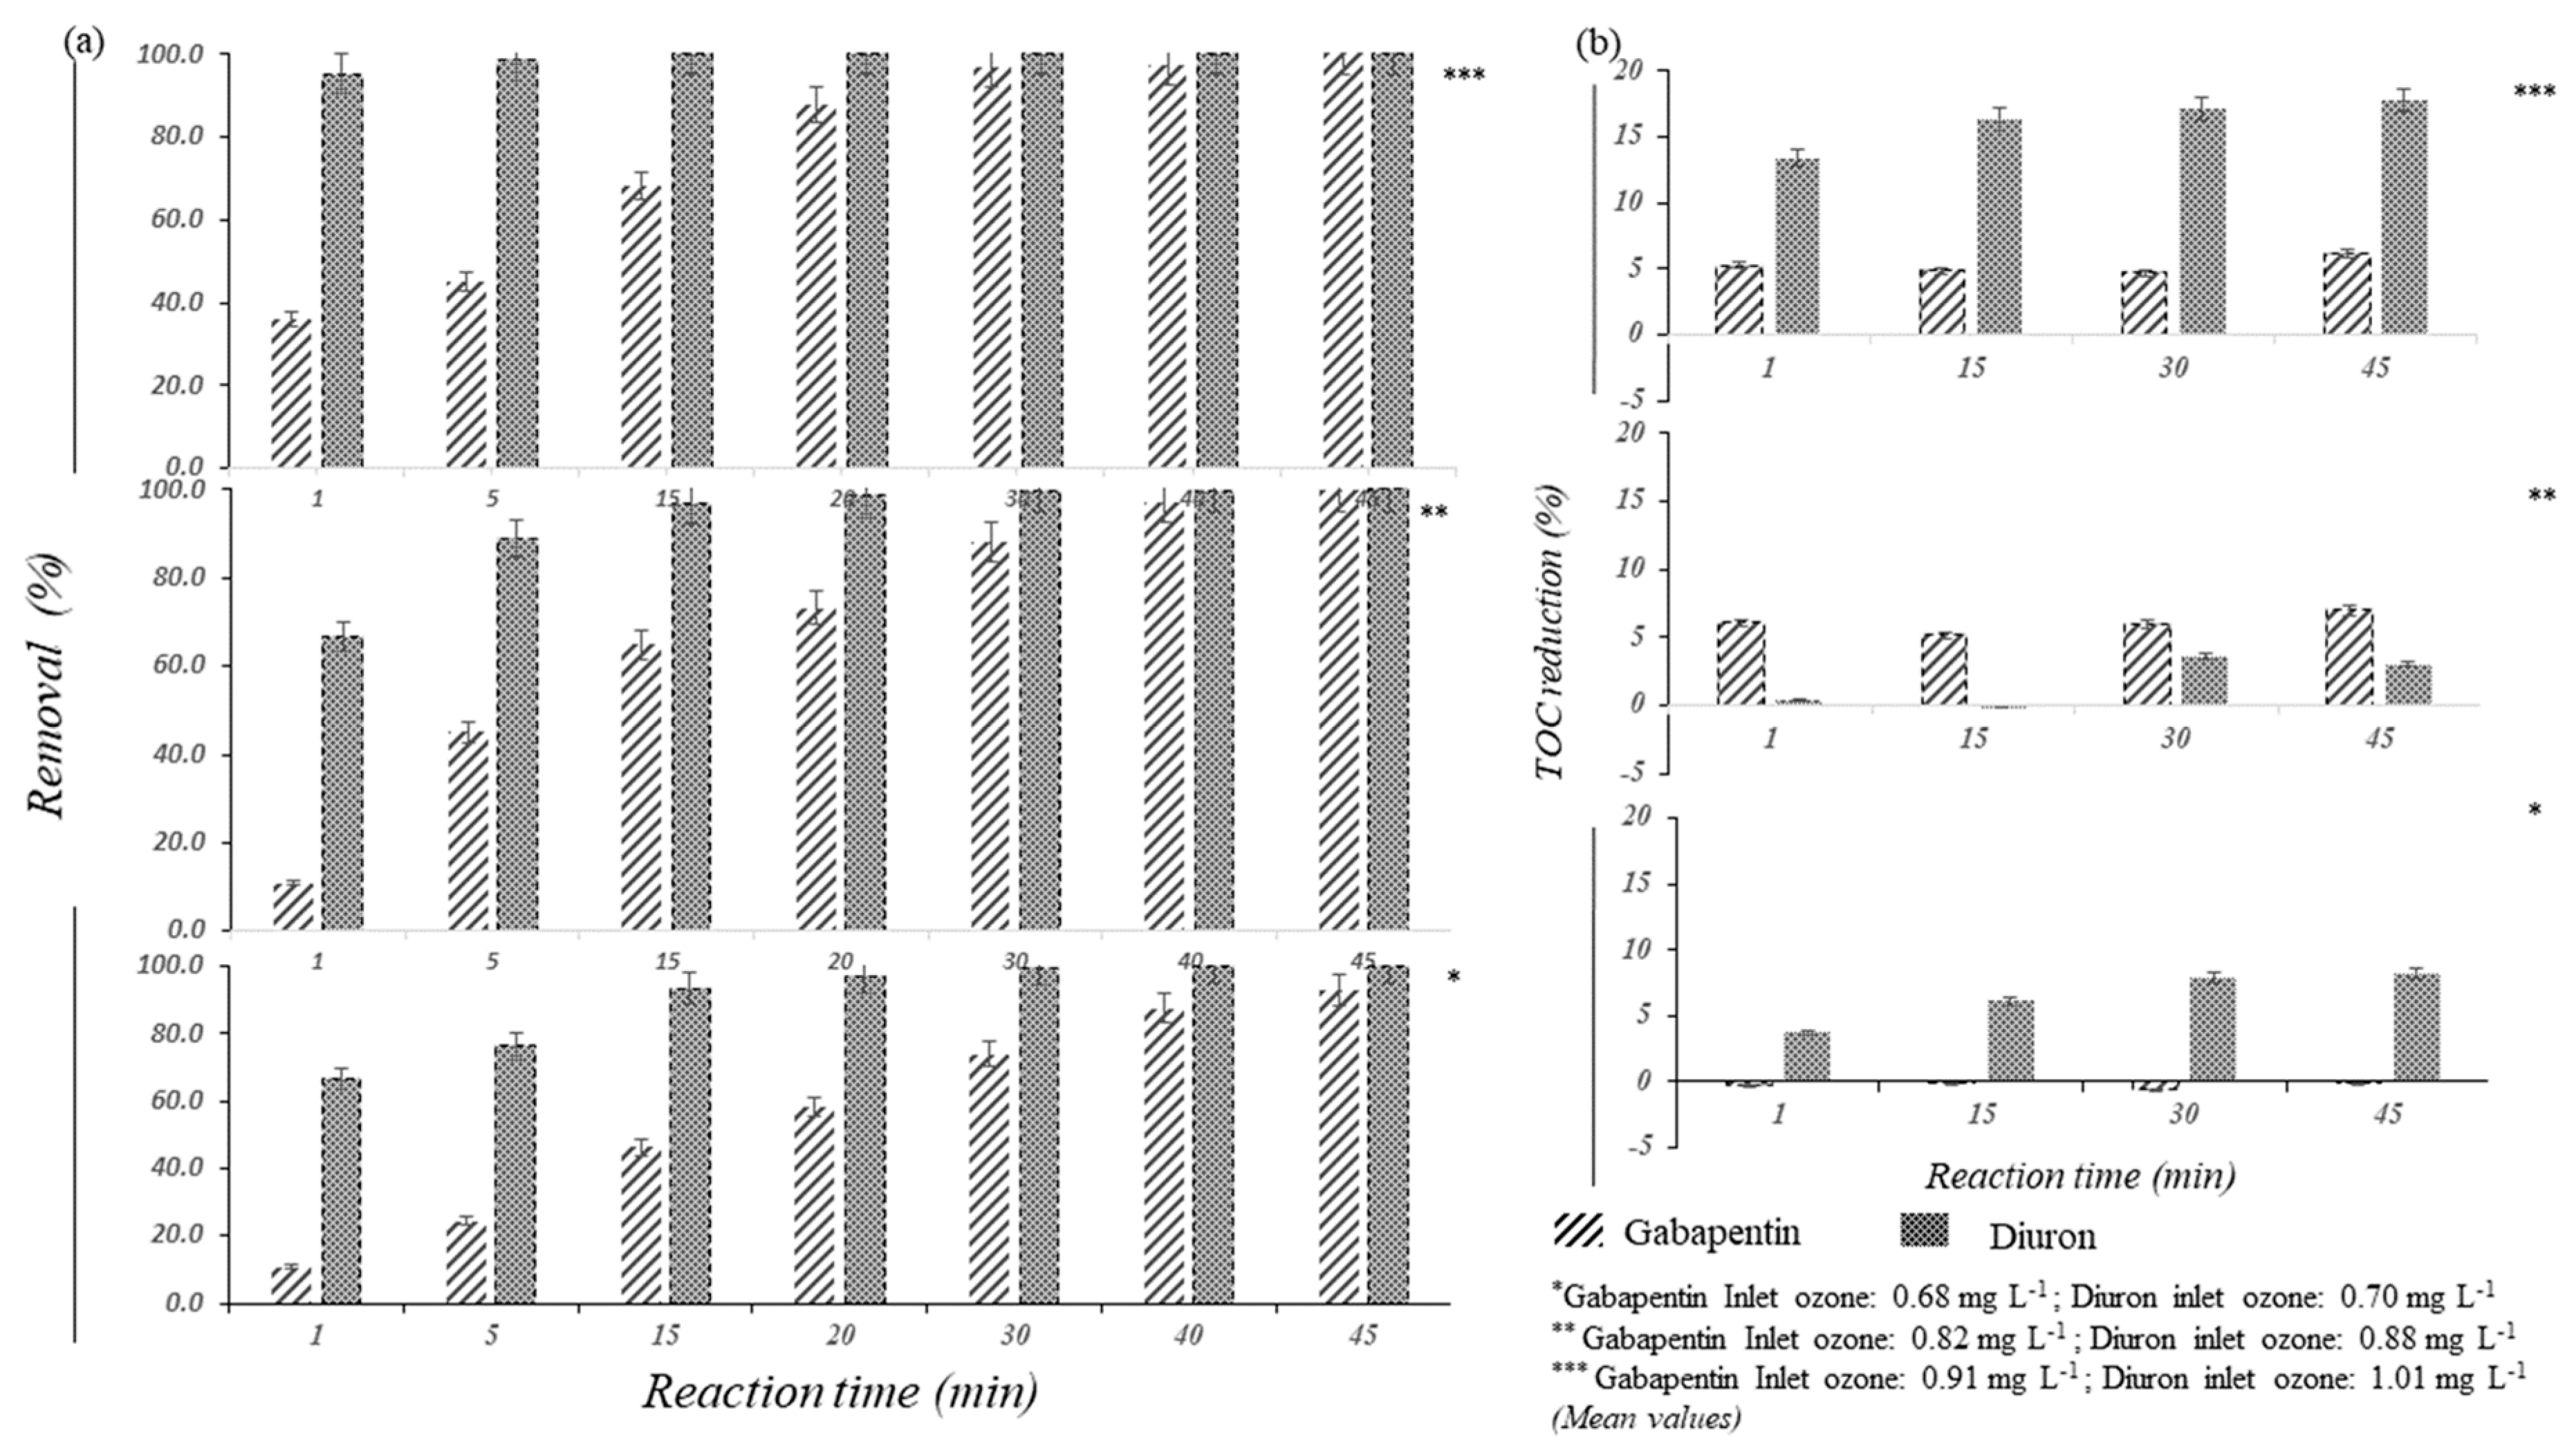
The degradation and mineralisation of each given pollutant were studied after 1, 5, 15, 20, 30, 40, and 45 min reactions (shown in Figure 2). Both pollutants showed different reaction affinity with ozone. As shown in Figure 2a, diuron was more reactive than gabapentin, it was degraded as the reaction initiated with 0.88–1.01 mgO3·L−1 and achieved 92%–95% reduction. Besides, 0.70 mgO3·L−1 could remove 67 ± 0.1% diuron in 1 min reaction time. At initial 0.70 mgO3·L−1, the performance gradually improved and attained 76 ± 1.8% (5 min), 93.3 ± 0.2% (15 min), 96.7 ± 0.1% (20 min), and 99%–100% removal with prolonged reaction (30–45 min). While 0.88–1.01 mgO3·L−1 performed extraordinarily; removing 95%–98% diuron within 5 min and almost 100% with an increase in the reaction time.
On the other hand, only about 11%–36% of gabapentin was degraded after ozonation (1 min) at a dose of 0.68–0.9 mgO3·L−1. Likewise, the degradation showed a direct proportionate relation with the ozone dose. Around 88 ± 1.2% removal was achieved after 20 min reaction with a high dose of 0.9 mgO3·L−1. Almost 100% gabapentin removal was attained after 45 min at 0.9 mgO3·L−1.
Mineralisation of two given pollutants was evaluated by measuring TOC. Even though the pollutants concentrations can be removed thoroughly for the given optimised conditions, TOC reduction by a low dose of ozonation was not effective (Figure 2b). A maximum of 13%–18% of TOC removal was achieved for diuron, whereas 5%–7% for gabapentin at high O3 doses (0.8–1.01 mgO3·L−1). Thus, it can be interpreted that 1 mg·L−1 ozone dose is not sufficient for the mineralisation of diuron and gabapentin. Complete degradation and low mineralisation after ozonation indicate the possibility of the formation of oxidation products during the treatment. Thereby, the effluent samples were analysed for the risks of toxicity caused by the oxidation products.
3.3. Toxicity Assessment
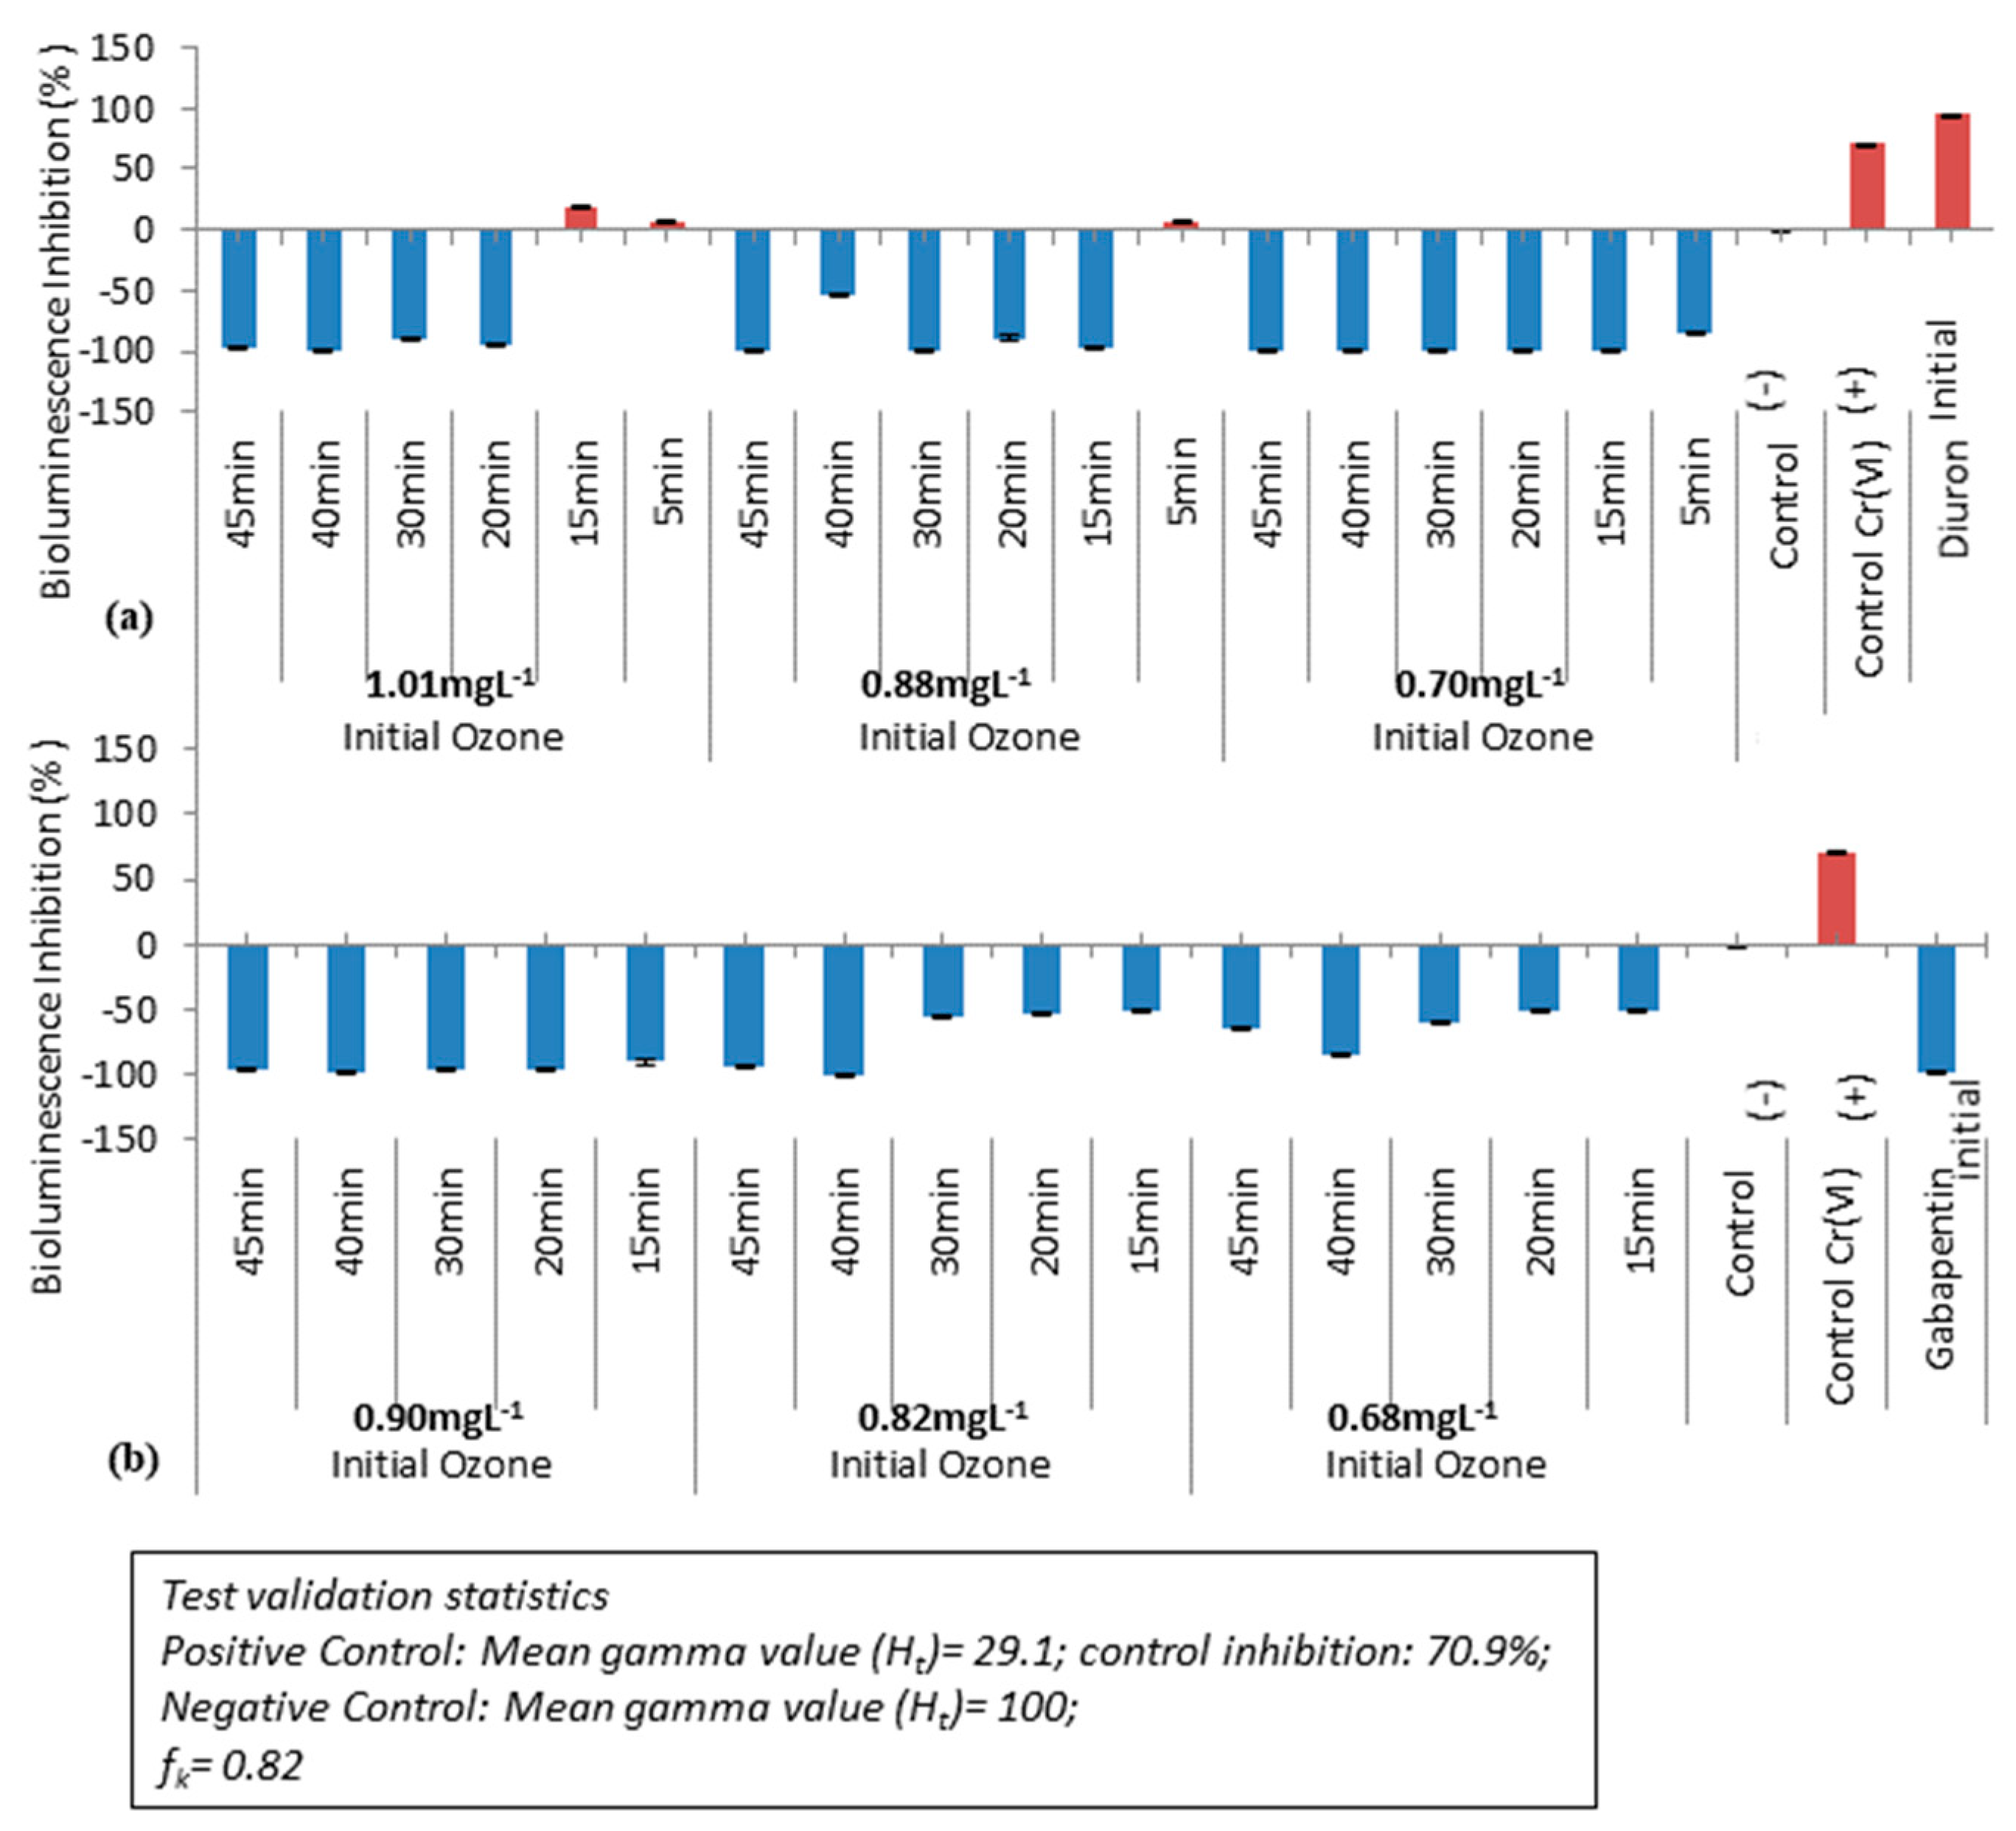
Figure 3a,b displays triplet results of the bioluminescence inhibition (%) of ozonised samples with controls and initial diuron and gabapentin solutions (1 mg·L−1). Samples causing bioluminescence inhibition are said to inhibit bacterial growth thereby having toxic effects (BS EN ISO 11348-3:2008), which are presented in red bars. Positive reference Cr (VI) solution showed 70.9% inhibition after 30 min contact time, which meets the assay validation standards. When initial diuron solution possesses bioluminescence inhibition, Lake Constance water has been observed non-toxicity in the study [12]. Ozonised diuron samples did not possess any toxicity for the dose of 0.7 mgO3·L−1 but presented toxicity when contact time was 5 min and 15 min with O3 dose of 0.88 mg·L−1 and 1.01 mg·L−1, respectively. The results can be interpreted as the cumulative effect of toxic pollutant and residual ozone in the early stage of ozonation. Thereby, to avoid toxicity caused by the oxidation products and residual ozone, this study recommends to initiate the reaction with a low ozone dose or prolong treatment by at least ≥20 min. In contrast, gabapentin raw test solution and its ozonised effluents did not inhibit bioluminescence; and thus considered non-toxic.
3.4. Kruskal–Wallis Test
The data obtained have arbitrary distribution (i.e., variances are unequal as mentioned in Supplementary Materials). Therefore, the data portray non-parametric conditions. The sample data collected (diuron and gabapentin degradation) are independent and the Kruskal–Wallis sum test was performed to check the independence of each data in case of non-normalised data. As shown in Table 5, diuron and gabapentin ozonation treatment are significantly identical.
3.5. Generalised Linear Model
For this study, a non-parametric regression Generalised Linear Model (GLM) [13] was adopted to build a regression-type model. A generalised linear model is a flexible generalisation of ordinary linear regression models which allows for the response variables (dependent) to have an error distribution other than the normal distribution. It generalises linear regression by allowing the linear model to be related to the response variable via a link function and by allowing the magnitude of the variance of each measurement to be a function of its predicted value. GLM was developed to unify other statistical methods (linear, logistic, Poisson regression). A simplified approach used in GLM is of maximum likelihood [14]. The ozonation degradation effect was analysed using Poisson and Gaussian model represented in Table 6. Each model was run to identify the significance of individual ozone concentration and reaction time with the response variable (degradation). Correspondingly, the interaction between the ozone concentration and reaction time for diuron and gabapentin degradation were studied. The most significant model for the study was identified from the Akaike information criterion (AIC) value obtained from the model. In comparing models fitted by maximum likelihood to the same response data, the smaller the AIC, the better the fit [15]. The preference of AIC validation over the p-value is further described by [15]. Thus, the Gaussian model was selected as a significant model to perform the non-parametric regression study of diuron and gabapentin ozonation treatment. The output of GLM Poisson distributions is mentioned in Supplementary Materials.
Gaussian modelling is a non-parametric method and does not produce an explicit functional representation of the data. It is assumed that the underlying function, f(ŷi), that produces the outputs will remain unknown, but the data are obtained from an (infinite) set of functions, with a Gaussian distribution in the function space. Usually, a Gaussian is completely characterised by its mean (µ) and covariance function, or residual variance (σ2). A more comprehensive contextual discussion to Gaussian is provided by [16]. Considering, a simple linear regression represented as Equation (1):
where xi: process variable; εi: error in system for i = 1, 2, 3….n; α, β is coefficient of the equation. It can be written in probabilistic notation as Equations (2) and (3):
f(yi) = α + βxi + εi
f(yi) ~ Ɲ (µi, σ2)
µi = α + βxi
So, it can be said that εi follows the Ɲ (µi, σ2) distribution. Therefore, the Gaussian distribution does not predict yi rather the expected value of ŷi, depending on response and parameters Equations (4) and (5).
ŷi = ˆµi = ˆα + ˆβ ˆxi
f(ŷi) ~ Ɲ (µi, σ2)
Thus, the response value predicted should not be expected as the same actual value obtained, rather in the model only expected value µi are predicted. Additionally, the variance of the predicted value ŷi is a variance of µi. It is assumed that errors εi are independent and identically distributed and assumed as Equation (6)
εi ~ Ɲ(0, σ2) [f(εi) = 0, variance(εi) = σ2]
The data from Table 4 and Figure 2a were used to fit the GLM model representing the degradation percentage (response) as a function of initial ozone concentration and reaction time. According to the Gaussian distribution, regression modelling was operated between the responses of the corresponding values of two different process variables and the final optimum fit model equation from Table 7 is as follows:
where x1: initial ozone concentration (mgO3·L−1); x2: reaction time (min); µd is mean diuron degradation, µg is mean gabapentin degradation after ozonation.
µd = 88.37 − 64.01 x1+ 0.98 x2
µg = 39.42 − 45.08 x1+ 1.55 x2
Likewise, the GLM model can also determine the interaction between the independent processes variables during the experiment to achieve the response obtained. Levels for initial ozone concentration and reaction time required to achieve complete degradation of diuron and gabapentin were set independently but showed an interaction during the treatment. Diuron showed a significant interaction between two process variables, whereas the Gaussian model could not depict any prominent interaction behaviour between ozone and reaction time (Table 8).
The regression equation after the interaction study is given below in Equations (9) and (10). It is noticeable that equations for gabapentin obtained after examining the Gaussian distribution, either with or without the interaction of process variables, are very similar (Equations (8) and (10)).
µd = 112.84 − 112.60 x1− 0.33 x2+ 2.86 x1× x2
µg = 41.31 − 48.50 x1+ 1.30 x2
3.6. Gaussian Model Prediction
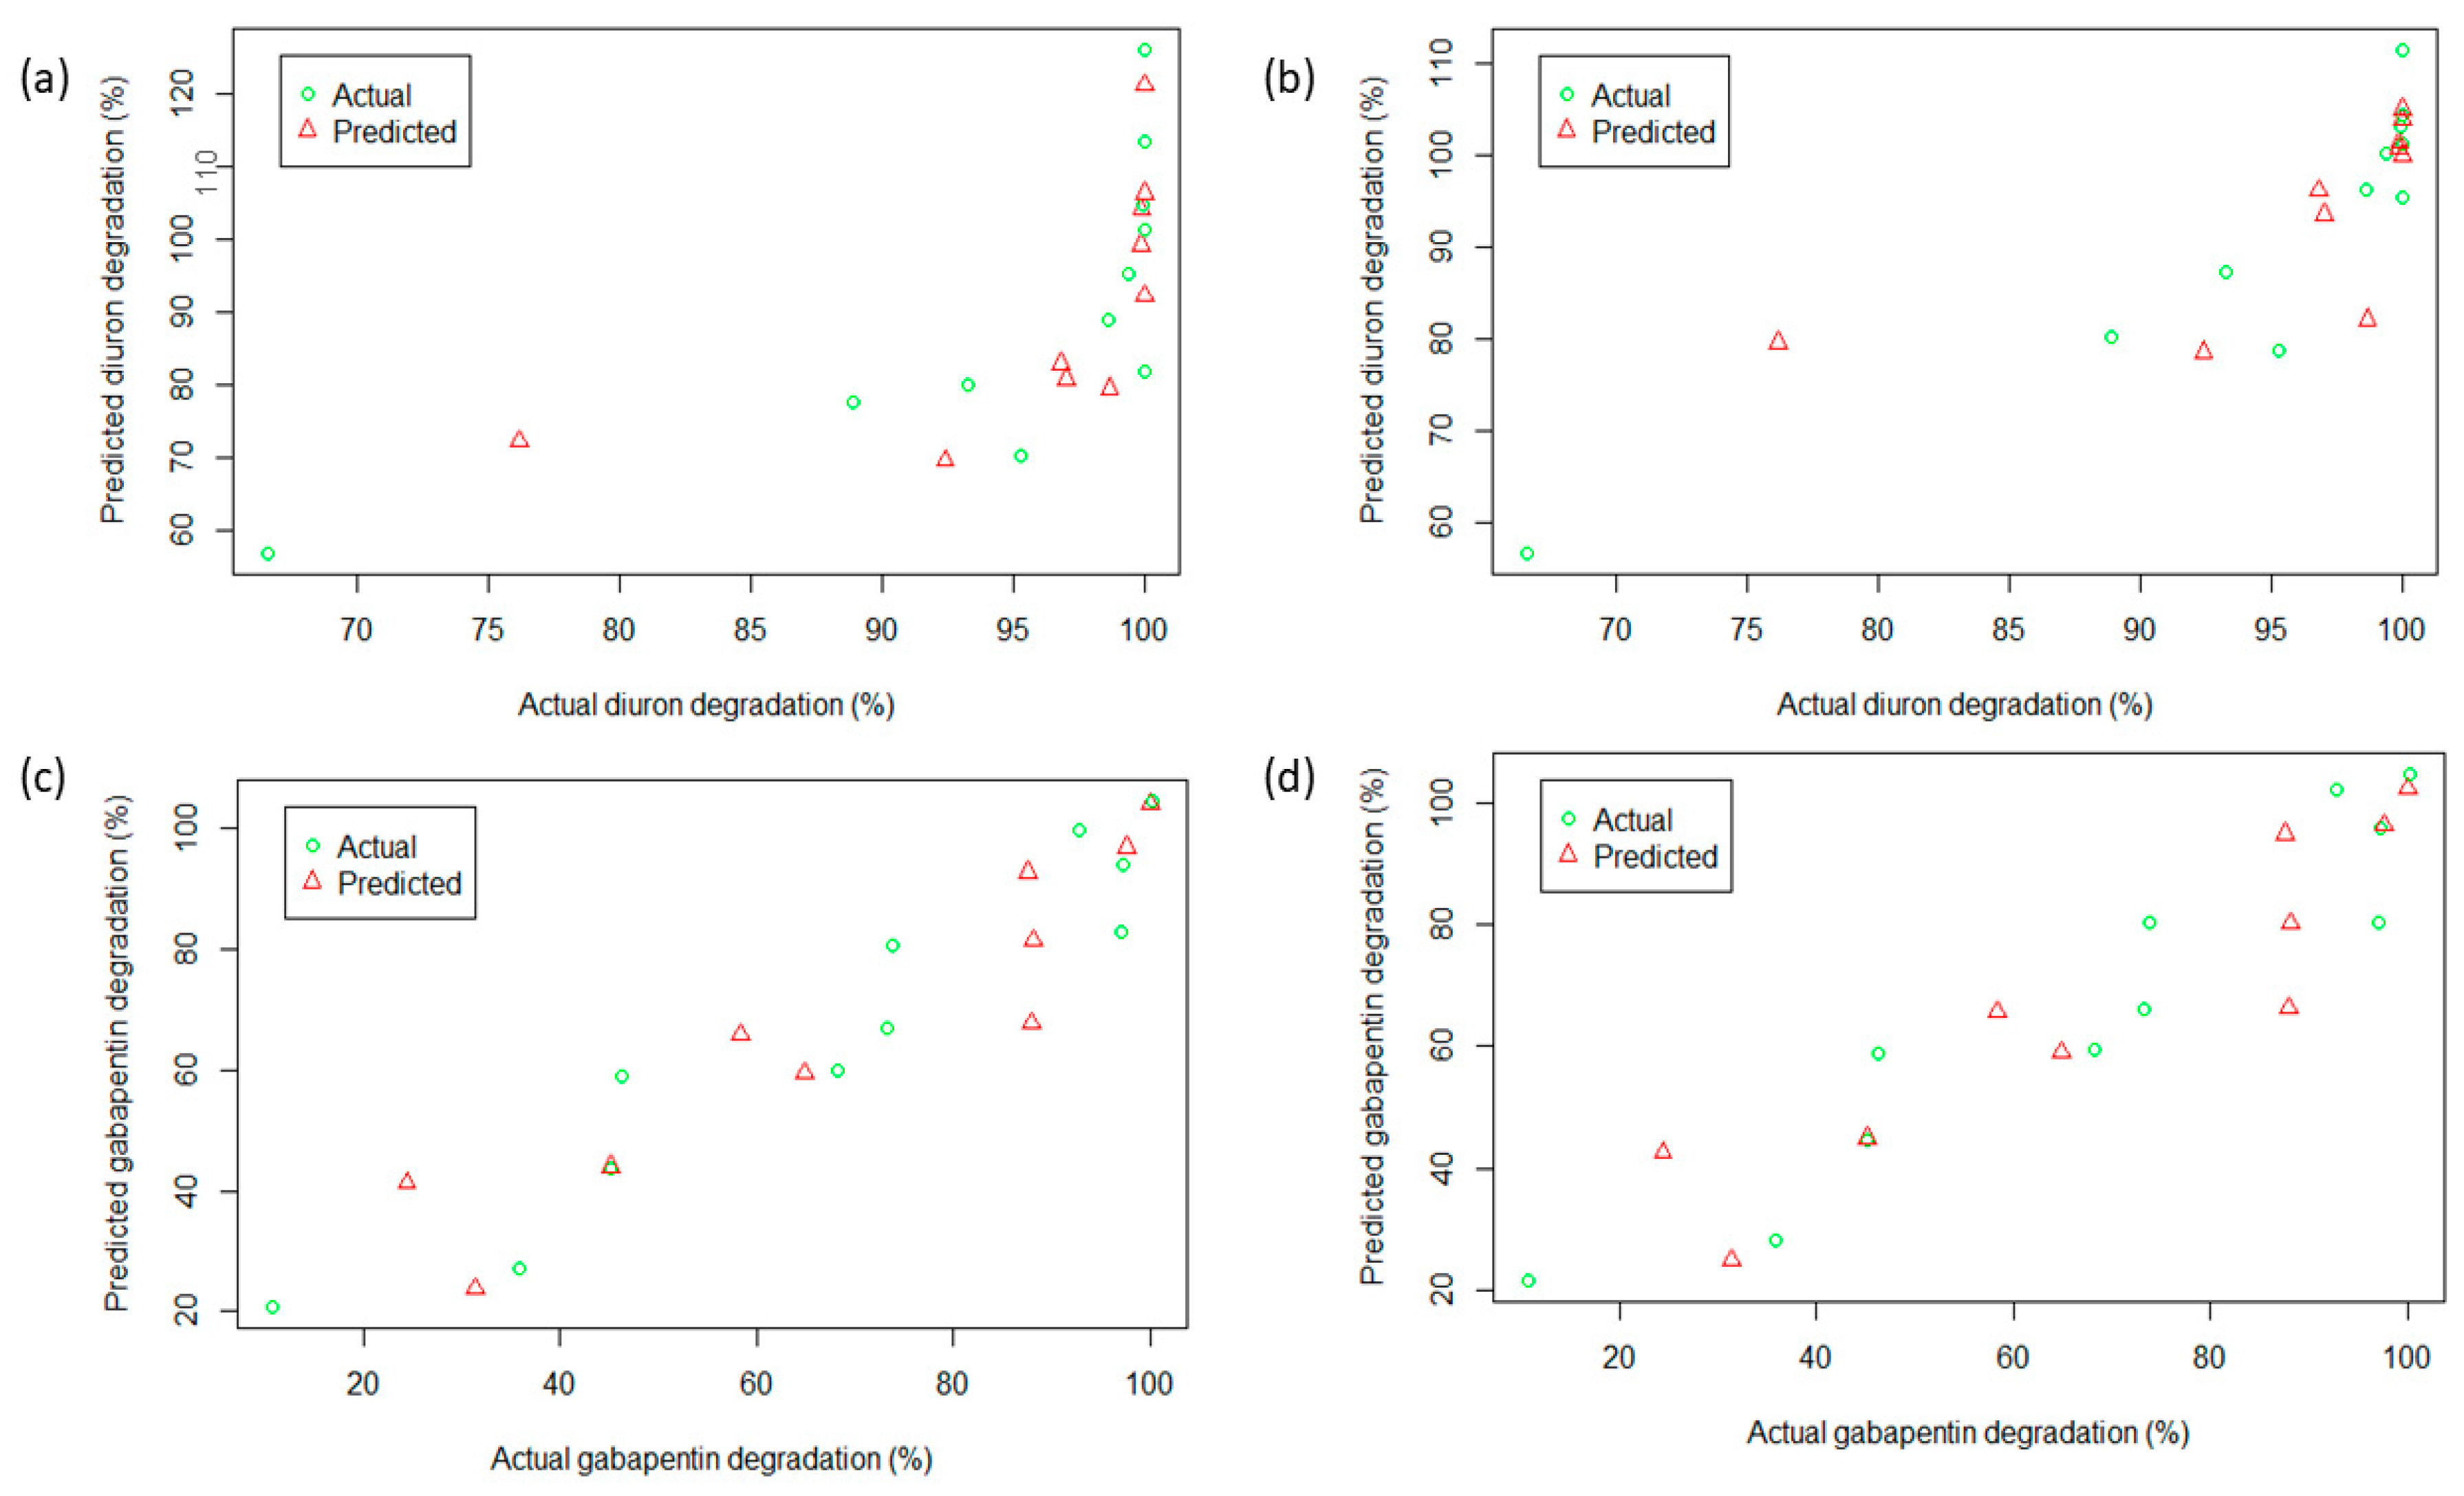
Considering AIC value, the Gaussian model was further selected to predict ozonation performance. The study includes both conditions with and without process variables interaction. The residuals plots for the model are shown in Supplementary Materials. Figure 4a–d demonstrates the predicted degradation of actual degradation obtained. The predicted values obtained were in a good correlation (Table 9), suggesting that the Gaussian model could be used to predict the ozonation performance in treating diuron and gabapentin.
4. Conclusions
The effect of ozone dose and reaction time on the degradation of diuron and gabapentin was investigated. Diuron and gabapentin can be successfully degraded with minimal mineralisation. Also, the study showed the performance of ozonation directly depends on the ozone dose and contact time that pollutants were exposed to ozone. The diuron toxicity appeared after ozonation, but it can be beneficial to keep the reaction time to at least 20 min when applying a relatively high dose of ≈1 mgO3·L−1 to avoid the toxicity effect. For gabapentin and its effluent after ozone treatment, the results showed no toxicity effect. The ozone experiment was further studied for non-parametric regression analysis. The Gaussian model showed maximum significance to predict the diuron and gabapentin ozonation.
Supplementary Materials
The following are available online at https://www.mdpi.com/2073-4441/11/4/852/s1, Figure S1: Degradation data distribution (a–c) diuron and, (d–f) gabapentin, Figure S2: Gaussian model residuals plot (a) diuron without process variables interaction, (b) diuron with process variables interaction, (c) gabapentin without process variables interaction, (d) gabapentin with process variables interaction. Table S1: Poisson GLM regression analysis for diuron degradation results after ozonation treatment (without interaction), Table S2: Poisson GLM regression analysis for diuron degradation results after ozonation treatment (with interaction), Table S3: Poisson GLM regression analysis for gabapentin degradation results after ozonation treatment (without interaction), Table S4: Poisson GLM regression analysis for gabapentin degradation results after ozonation treatment (with interaction).
Author Contributions
Conceptualization, J.-Q.J. and A.G.; methodology, J.-Q.J., A.G. and M.P.; software, A.G.; validation, J.-Q.J. and A.G.; experiments, A.G.; draft preparation, A.G.; manuscript’s review, re-structure, correction and editing, J.-Q.J.; visualization, J.-Q.J. and A.G.; supervision, J.-Q.J. and M.P.; funding acquisition, J.-Q.J.
Funding
This research was funded by Glasgow Caledonian University and Lake Constance Water Supply.
Acknowledgments
The authors are grateful to Glasgow Caledonian University for offering a studentship to Goswami for her PhD study. Also, we thank Lake Constance Water Supply for their financial sponsorship for this field research. Special thanks go to Michael Faißt, Christian Mosbach, Felix Weinmann, and Manuela Bauer for their support when running the trials. The views expressed in this paper are not necessary representing from the water company.
Conflicts of Interest
The authors declare no conflict of interest.
References
- Proposal for a Directive of the Europian Parliament of the Council Amending Directives 2000/60/EC and 2008/105/EC as Regards Priority Substances in the Field of Water Policy. 2012. Available online: https://europa.eu/european-union/eu-law/legal-acts_en (accessed on 27 February 2018).
- Thornton, I.; Butler, D.; Docx, P.; Hession, M.; Markropoulos, C.M.M. Pollutants in Urban Waste Water and Sewage Sludge; Office for Official Publications of the European Communities: Luxembourg, 2001. [Google Scholar]
- Benitez, F.J.; Real, F.J.; Acero, J.L.; Garcia, C. Kinetics of the transformation of phenyl-urea herbicides during ozonation of natural waters: Rate constants and model predictions. Water Res. 2007, 41, 4073–4084. [Google Scholar] [CrossRef] [PubMed]
- Herrmann, M.; Menz, J.; Olsson, O.; Kümmerer, K. Identification of phototransformation products of the antiepileptic drug gabapentin: Biodegradability and initial assessment of toxicity. Water Res. 2015, 85, 11–21. [Google Scholar] [CrossRef] [PubMed]
- Arslan, A.; Veli, S.; Bingöl, D. Use of response surface methodology for pretreatment of hospital wastewater by O3/UV and O3/UV/H2O2 processes. In Separation and Purification Technology; Elsevier: Amsterdam, The Netherlands, 2014; pp. 561–567. [Google Scholar]
- Paździor, K.; Wrebiak, J.; Smólka, A.K.; Gmurek, M.; Bilińska, L.; Kos, L.; Ledakowicz, J.S.; Ledakowicz, S. Influence of ozonation and biodegradation on toxicity of industrial textile wastewater. J. Environ. Manag. 2017, 195, 166–173. [Google Scholar] [CrossRef] [PubMed]
- Ziabari, S.S.H.; Khezri, S.M.; Kalantary, R.R. Ozonation optimization and modeling for treating diesel-contaminated water. Mar. Pollut. Bull. 2016, 104, 240–245. [Google Scholar] [CrossRef] [PubMed]
- Tizaoui, C.; Grima, N. Kinetics of the ozone oxidation of Reactive Orange 16 azo-dye in aqueous solution. Chem. Eng. J. 2011, 173, 463–473. [Google Scholar] [CrossRef]
- Robinson, T.J. Book review: Generalized linear models: With applications in engineering and the sciences. IIE Trans. 2003, 35, 917–918. [Google Scholar] [CrossRef]
- Snelson, E.L. Flexible and Efficient Gaussian Process Models for Machine Learning. Ph.D. Thesis, University London, London, UK, 2007; pp. 1–135. [Google Scholar]
- Gilbert, E.; Hoigné, J. Messung von ozon in wasserwerken: Vergleich der DPD- und indigo-methode. GWF-Wasser/Abwasser 1983, 124, 527–531. [Google Scholar]
- Jiang, J.-Q.; Durai, H.B.P.; Petri, M.; Grummt, T.; Winzenbacher, R. Drinking water treatment by ferrate(VI) and toxicity assessment of the treated water. Desalinat. Water Treat. 2016, 57, 26369–26375. [Google Scholar] [CrossRef]
- McCullagh, P.; Nelder, J.A. Generalized linear models. J. R. Stat. Soc. 1972, 135, 370–384. [Google Scholar] [CrossRef]
- Fox, J. Effect displays in R for generalised linear models. J. Stat. Softw. 2003, 8, 1–27. [Google Scholar] [CrossRef]
- McCullagh, P.; Nelder, J.A. Generalized Linear Models, 2nd ed.; CRC Press: Boca Raton, FL, USA, 1989. [Google Scholar]
- Burnham, K.P.; Anderson, D.R. Multimodel inference: Understanding AIC and BIC in model selection. Sociol. Methods Res. 2004, 33, 261–304. [Google Scholar] [CrossRef]
Figure 1.
Ozonation reactor system set-up.

Figure 2.
Ozonised gabapentin and diuron solution (a) percentage removal; (b) TOC reduction. (Non-detectable gabapentin and diuron after ozonation of Lake Constance water for same the operating conditions as stated in the study methods).
Figure 2.
Ozonised gabapentin and diuron solution (a) percentage removal; (b) TOC reduction. (Non-detectable gabapentin and diuron after ozonation of Lake Constance water for same the operating conditions as stated in the study methods).

Figure 3.
Bioluminescence inhibition before and after ozonation treatment (Microtox acute toxicity assay): (a) diuron, (b) gabapentin.
Figure 3.
Bioluminescence inhibition before and after ozonation treatment (Microtox acute toxicity assay): (a) diuron, (b) gabapentin.

Figure 4.
The Gaussian model predicted versus actual degradation (a) diuron without process variables interaction, (b) diuron with process variables interaction, (c) gabapentin without process variables interaction, (d) gabapentin with process variables interaction.
Figure 4.
The Gaussian model predicted versus actual degradation (a) diuron without process variables interaction, (b) diuron with process variables interaction, (c) gabapentin without process variables interaction, (d) gabapentin with process variables interaction.


Table 1.
LC-MS gradient elution programme. (The limit of detection (LOD) is 1.27 ng·L−1 (for gabapentin) and 1.15 ng·L−1, (for diuron), respectively; the limit of quantification (LOQ) for both compounds is 10 ng·L−1).
Table 1.
LC-MS gradient elution programme. (The limit of detection (LOD) is 1.27 ng·L−1 (for gabapentin) and 1.15 ng·L−1, (for diuron), respectively; the limit of quantification (LOQ) for both compounds is 10 ng·L−1).
| Gradient Programme no. | Time (min) | Eluent A (%) | Eluent B (%) | Volume Flow (µL min−1) |
|---|---|---|---|---|
| 0 | 0 | 95 | 5 | 300 |
| 1 | 0.5 | 80 | 20 | 300 |
| 2 | 10 | 20 | 80 | 300 |
| 3 | 12 | 20 | 80 | 300 |
| 4 | 12.5 | 95 | 5 | 300 |
| 5 | 20 | 95 | 5 | 300 |
Table 2.
The characteristics of Lake Constance water.
| Parameter | Value |
|---|---|
| pH | 8.0 ± 0.09 at 25 °C |
| Temperature | 7.0 ± 2.5 °C |
| Turbidity | 0.30 ± 0.03 NTU |
| Colour at 436 nm | 0.10 ± 0.02 m−1 |
| UV-abs at 254 nm | 3.1 ± 0.1 m−1 |
| TOC | 1.2 ± 0.1 mg L−1 |
| Diuron | <LOQ (10 ng L−1) |
| Gabapentin | 40 ng L−1 |
Table 3.
Initial ozone concentration in the ozone treatment.
| Organic Compound | Low-Level Inlet mgO3 L−1 | Medium Level Inlet mgO3 L−1 | High-Level Inlet mgO3 L−1 | ||||||
|---|---|---|---|---|---|---|---|---|---|
| R1 | R2 | Average | R1 | R2 | Average | R1 | R2 | Average | |
| Diuron | 0.71 | 0.68 | 0.70 | 0.86 | 0.89 | 0.88 | 1.01 | 1.01 | 1.01 |
| Gabapentin | 0.68 | 0.68 | 0.68 | 0.81 | 0.83 | 0.82 | 0.91 | 0.90 | 0.90 |
| R1: replication 1; R2: replication 2 | |||||||||
Table 4.
Ozone inlet levels and fall in concentration throughout the experiment.
| Gabapentin | Diuron | ||||||||
|---|---|---|---|---|---|---|---|---|---|
| min | (R1) mgO3 L−1 | (R2) mgO3 L−1 | Average | Variance | min | (R1) mgO3 L−1 | (R2) mgO3 L−1 | Average | Variance |
| 0 | 0.68 | 0.68 | 0.68 | 0 | 0 | 0.71 | 0.68 | 0.70 | 3.59 × 10⁻⁵ |
| 1 | 0.26 | 0.37 | 0.31 | 5.75 × 10⁻³ | 1 | 0.26 | 0.31 | 0.28 | 1.10 × 10⁻³ |
| 5 | 0.07 | 0.07 | 0.07 | 0 | 5 | 0.13 | 0.11 | 0.12 | 2.02 × 10⁻⁴ |
| 15 | 0.07 | 0.05 | 0.06 | 8.98 × 10⁻⁵ | 15 | 0.15 | 0.15 | 0.15 | 2.24 × 10⁻⁵ |
| 20 | 0.07 | 0.05 | 0.06 | 2.02 × 10⁻⁴ | 20 | 0.17 | 0.15 | 0.16 | 2.02 × 10⁻⁴ |
| 30 | 0.08 | 0.05 | 0.07 | 3.48 × 10⁻⁴ | 30 | 0.22 | 0.21 | 0.21 | 9.66 × 10⁻⁵ |
| 40 | 0.09 | 0.11 | 0.10 | 3.59 × 10⁻⁴ | 40 | 0.30 | 0.25 | 0.27 | 1.44 × 10⁻³ |
| 45 | 0.10 | 0.11 | 0.10 | 2.24 × 10⁻⁵ | 45 | 0.32 | 0.21 | 0.27 | 5.75 × 10⁻³ |
| 0 | 0.81 | 0.84 | 0.82 | 3.59 × 10⁻⁴ | 0 | 0.86 | 0.89 | 0.88 | 3.59 × 10⁻⁴ |
| 1 | 0.50 | 0.40 | 0.45 | 5.75 × 10⁻³ | 1 | 0.21 | 0.38 | 0.30 | 1.40 × 10⁻² |
| 5 | 0.13 | 0.13 | 0.13 | 2.24 × 10⁻⁵ | 5 | 0.13 | 0.23 | 0.18 | 5.05 × 10⁻³ |
| 15 | 0.08 | 0.08 | 0.08 | 0 | 15 | 0.14 | 0.21 | 0.17 | 2.24 × 10⁻³ |
| 20 | 0.12 | 0.09 | 0.10 | 5.61 × 10⁻⁴ | 20 | 0.16 | 0.24 | 0.20 | 3.24 × 10⁻³ |
| 30 | 0.13 | 0.11 | 0.12 | 2.02 × 10⁻⁴ | 30 | 0.20 | 0.32 | 0.26 | 7.27 × 10⁻³ |
| 40 | 0.22 | 0.15 | 0.19 | 2.24 × 10⁻³ | 40 | 0.29 | 0.43 | 0.36 | 1.06 × 10⁻² |
| 45 | 0.26 | 0.17 | 0.21 | 4.40 × 10⁻³ | 45 | 0.34 | 0.48 | 0.41 | 1.09 × 10⁻² |
| 0 | 0.91 | 0.9 | 0.90 | 6.27 × 10⁻⁵ | 0 | 1.01 | 1.01 | 1.01 | 2.24 × 10⁻⁵ |
| 1 | 0.38 | 0.37 | 0.37 | 7.08 × 10⁻⁵ | 1 | 0.50 | 0.52 | 0.51 | 8.98 × 10⁻⁵ |
| 5 | 0.09 | 0.08 | 0.08 | 2.52 × 10⁻⁵ | 5 | 0.37 | 0.38 | 0.38 | 5.62 × 10⁻⁵ |
| 15 | 0.07 | 0.07 | 0.07 | 6.84 × 10⁻⁶ | 15 | 0.40 | 0.41 | 0.40 | 3.61 × 10⁻⁵ |
| 20 | 0.08 | 0.08 | 0.08 | 8.00 × 10⁻⁸ | 20 | 0.39 | 0.49 | 0.44 | 4.90 × 10⁻³ |
| 30 | 0.10 | 0.11 | 0.11 | 4.51 × 10⁻⁵ | 30 | 0.59 | 0.55 | 0.57 | 7.20 × 10⁻⁴ |
| 40 | 0.17 | 0.16 | 0.16 | 2.81 × 10⁻⁵ | 40 | 0.56 | 0.45 | 0.50 | 6.20 × 10⁻³ |
| 45 | 0.17 | 0.05 | 0.05 | 6.90 × 10⁻³ | 45 | 0.48 | 0.38 | 0.43 | 4.82 × 10⁻³ |
Table 5.
Kruskal–Wallis rank sum test.
| Organic-Pollutant | Chi-Squared | Degree of Freedom | P-Value | Significance |
|---|---|---|---|---|
| Diuron | 35.70 | 2 | 1.7 × 10⁻⁸ | Significant |
| Gabapentin | 33.15 | 2 | 6.3 × 10⁻⁸ | Significant |
Table 6.
Poisson and Gaussian model in GLM regression analysis for degradation results after ozonation treatment.
Table 6.
Poisson and Gaussian model in GLM regression analysis for degradation results after ozonation treatment.
| Analyte | Model | Interaction Studied | Significant Interaction (Ozone × Reaction Time) | AIC | Model Significance |
|---|---|---|---|---|---|
| Diuron | |||||
| Poisson | No | - | Infinity | No | |
| Gaussian | No | - | 220.69 | Yes | |
| Poisson | Yes | Yes | Infinity | No | |
| Gaussian | Yes | Yes | 208.89 | Yes | |
| Gabapentin | |||||
| Poisson | No | - | Infinity | No | |
| Gaussian | No | - | 188.15 | Yes | |
| Poisson | Yes | Yes | Infinity | No | |
| Gaussian | Yes | No | 189.46 | Yes | |
| AIC: Akaike information criterion | |||||
Table 7.
Gaussian distribution analysis without considering parameters interactions.
| Analyte | Estimate | Coefficients | Std. Error | z Value | P | Significant |
|---|---|---|---|---|---|---|
| Diuron | ||||||
| Intercept | 88.37 | 9.76 | 9.06 | 1.06 × 10⁻⁸ | Yes | |
| Ozone | −64.01 | 16.33 | −3.92 | 0.000789 | Yes | |
| Reaction time | 0.98 | 0.27 | 3.58 | 0.001747 | Yes | |
| Gabapentin | ||||||
| Intercept | 39.42 | 5.44 | 7.25 | 3.84 × 10⁻⁷ | Yes | |
| Ozone | −45.08 | 10.96 | −4.11 | 0.000497 | Yes | |
| Reaction time | 1.55 | 0.16 | 9.56 | 4.27 × 10⁻⁹ | Yes |
Table 8.
Gaussian distribution analysis considering parameters interactions.
| Analyte | Estimate | Coefficients | Std. Error | z Value | P | Significant | |
|---|---|---|---|---|---|---|---|
| Diuron | |||||||
| Intercept | 112.84 | 9.73 | 11.59 | 2.49 × 10⁻¹⁰ | Yes | ||
| Ozone | −112.60 | 0.39 | −0.82 | 0.424535 | No | ||
| Reaction time | −0.33 | 17.59 | −6.40 | 3.04 × 10⁻⁶ | Yes | ||
| Ozone × Reaction time | 2.86 | 0.73 | 3.94 | 0.000804 | Yes | ||
| Gabapentin | |||||||
| Intercept | 41.31 | 6.02 | 6.862 | 0.00000115 | Yes | ||
| Ozone | −48.50 | 11.94 | −4.06 | 0.0006 | Yes | ||
| Reaction time | 1.30 | 0.36 | 3.58 | 0.0019 | Yes | ||
| Ozone × Reaction time | 1.60 | 2.09 | 0.77 | 0.4530 | No | ||
Table 9.
Gaussian model correlation study.
| Pollutant | Interaction | Correlation |
|---|---|---|
| Diuron | ||
| No | 0.67 | |
| Yes | 0.84 | |
| Gabapentin | ||
| No | 0.94 | |
| Yes | 0.94 |
© 2019 by the authors. Licensee MDPI, Basel, Switzerland. This article is an open access article distributed under the terms and conditions of the Creative Commons Attribution (CC BY) license (http://creativecommons.org/licenses/by/4.0/).
Share and Cite
MDPI and ACS Style
Goswami, A.; Jiang, J.-Q.; Petri, M. Non-Parametric Regression Analysis of Diuron and Gabapentin Degradation in Lake Constance Water by Ozonation and Their Toxicity Assessment. Water 2019, 11, 852. https://doi.org/10.3390/w11040852
AMA Style
Goswami A, Jiang J-Q, Petri M. Non-Parametric Regression Analysis of Diuron and Gabapentin Degradation in Lake Constance Water by Ozonation and Their Toxicity Assessment. Water. 2019; 11(4):852. https://doi.org/10.3390/w11040852
Chicago/Turabian StyleGoswami, Anuradha, Jia-Qian Jiang, and Michael Petri. 2019. "Non-Parametric Regression Analysis of Diuron and Gabapentin Degradation in Lake Constance Water by Ozonation and Their Toxicity Assessment" Water 11, no. 4: 852. https://doi.org/10.3390/w11040852
Note that from the first issue of 2016, this journal uses article numbers instead of page numbers. See further details here.