Profound Impacts of the China Meteorological Assimilation Driving Datasets for the SWAT Model (CMADS)


1
College of Resources and Environmental Science, China Agricultural University (CAU), Beijing 100094, China
2
Department of Civil Engineering, The University of Hong Kong (HKU), Pokfulam 999077, Hong Kong, China
3
China Institute of Water Resources and Hydropower Research (IWHR), Beijing 100038, China
*
Authors to whom correspondence should be addressed.
Water 2019, 11(4), 832; https://doi.org/10.3390/w11040832
Submission received: 5 April 2019
/
Revised: 5 April 2019
/
Accepted: 18 April 2019
/
Published: 19 April 2019
(This article belongs to the Special Issue Application of the China Meteorological Assimilation Driving Datasets for the SWAT Model (CMADS) in East Asia)
Abstract
:As global warming continues to intensify, the problems of climate anomalies and deterioration of the water environment in East Asia are becoming increasingly prominent. In order to assist decision-making to tackle these problems, it is necessary to conduct in-depth research on the water environment and water resources through applying various hydrological and environmental models. To this end, the China Meteorological Assimilation Driving Datasets for the Soil and Water Assessment Tool (SWAT) model (CMADS) has been applied to East Asian regions where environmental issues are obvious, but the stations for monitoring meteorological variables are not uniformly distributed. The dataset contains all of the meteorological variables for SWAT, such as temperature, air pressure, humidity, wind, precipitation, and radiation. In addition, it includes a range of variables relevant to the Earth’s surface processes, such as soil temperature, soil moisture, and snowfall. Although the dataset is used mainly to drive the SWAT model, a large number of users worldwide for different models have employed CMADS and it is expected that users will not continue to limit the application of CMADS data to the SWAT model only. We believe that CMADS can assist all the users involved in the meteorological field in all aspects. In this paper, we introduce the research and development background, user group distribution, application area, application direction, and future development of CMADS. All of the articles published in this special issue will be mentioned in the contributions section of this article.
1. Introduction
The China Meteorological Assimilation Driving Datasets for the Soil and Water Assessment Tool (SWAT) (CMADS) is a product employed before the start of the intensive coupling process of model-driven research of atmospheric science and hydrology [1]. From the perspective of natural processes, the region’s sensitivity to climate and its impact on the global climate are important in regard to the geological structure of East Asia. From the perspective of social development, however, the construction of basic meteorological facilities in the region is imperfect due to the economy and various other objective factors. From the perspective of the nature–societal water cycle, research and investment in protecting the underlying surface environment in East Asia has not kept pace with the excessive exploitation and pollution of natural resources in the region. Therefore, because the underlying surface of the region is not well understood, it is improper to use the deviated meteorological data to erroneously analyze the water resources, water environment, and air quality of the region [2] for later decision-making. Such applications will further damage the ecological environment of the region and pose a devastating impact in a vicious circle on the region’s economy and ecosystem.
The territory of East Asia is vast and includes many countries, each of which differs significantly in its means of meteorological observation, processing methods, and post-assimilation correction methods for meteorological data. In addition, obstacles exist for the sharing of meteorological data among countries and even departments within the same country. This can result in the problem of repeated data collection, which has further led to the lack of reanalyzed datasets in East Asia that follow uniform procedures with uniform latitude/longitude and resolution that can be corrected by additional sources of reliable observation data [1,3]. In addition, from a cross-disciplinary perspective, atmospheric researchers need to provide meteorological data with higher density and less uncertainty which can be easily accessed and used by others. Such an achievement will effectively match hydrological models that are rapidly being physically modularized [4] and can enhance the accuracy of regional climate models in East Asia [5] to ultimately improve the long-term predictive capability for future East Asian climates [6,7]. The CMADS was created precisely in the above context, and its appearance was originally tailored for the SWAT model. The CMADS can be used efficiently without any adjustments and treatments to the SWAT model, which will save at least 90% of the time spent by SWAT users on meteorological data preparation. From the perspective of data precision, the CMADS has been validated by users worldwide in combination with various international reanalysis data, such as Climate Forecast System Reanalysis (CFSR) and Tropical Rainfall Measuring Mission (TRMM) in various river basins in East Asia, with satisfactory results [8,9,10,11,12,13,14,15,16,17,18,19,20,21,22]. These verification results demonstrate that the performance of CMADS products in East Asia can be trusted, especially in mountainous and highland areas with high altitudes and large differences of land use and geography, where meteorological stations are sparse.
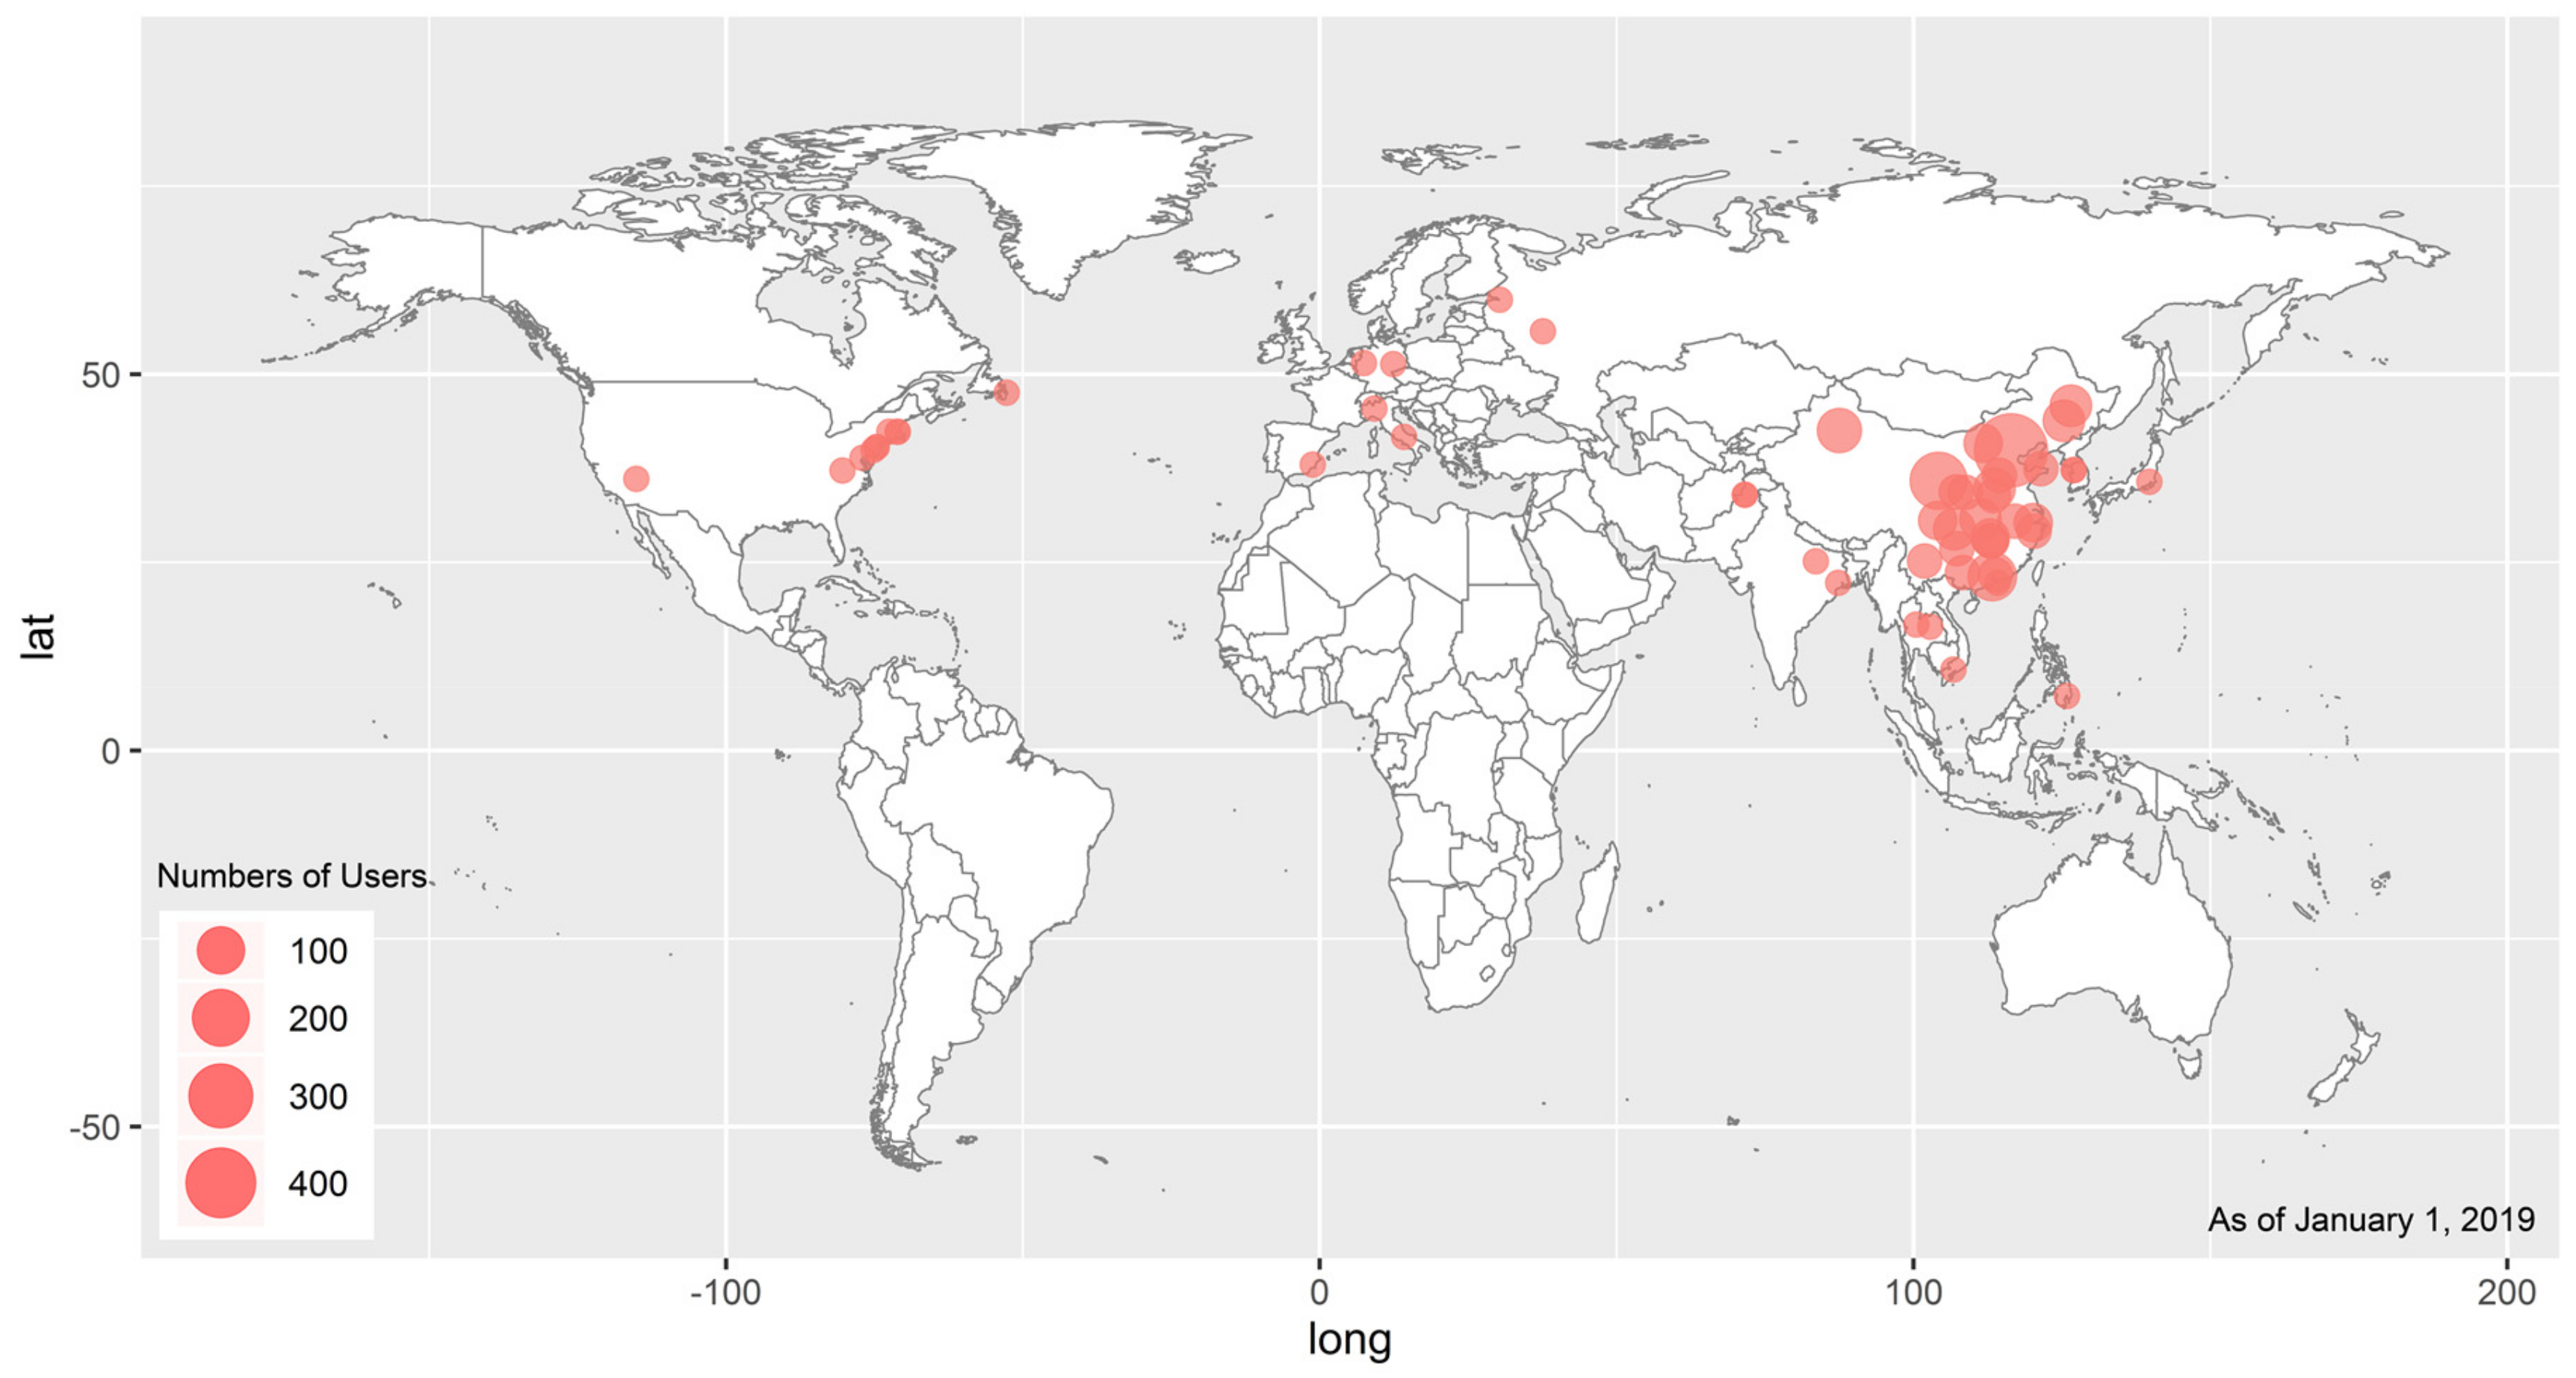
In April 2016, we released a series of CMADS in the Cold and Arid Regions Science Data Centre at Lanzhou (CARD), China (http://westdc.westgis.ac.cn/). Shortly afterwards, the official website of the SWAT model (https://swat.tamu.edu/software/) included our CMADS. As of 1 January 2019, according to a rough estimation, the official website of CMADS (http://www.cmads.org) has recorded nearly 170,000 visits from the world, and we have received nearly 2630 applications from the teams all over the world (Figure 1). Distribution of CMADS users has rapidly expanded from major scientific research institutes in mainland China to research institutes and governmental agencies in Taiwan (Tamkang University), South Korea (Sungkyunkwan University and Seoul National University), Japan (Kyushu University), Thailand (Khon Kaen University and Naresuan University), the Philippines (University of the Philippines), India (Indian Institute of Technology Kharagpur), Pakistan (The University of Agriculture Peshawar), Russia (Far Eastern Regional Hydrometeorological Research Institute (FERHRI)), Germany (TU Dortmund University and UFZ Helmholtz Centre For Environmental Research), Italy (Polytechnic University of Milan), Canada (Memorial University of Newfoundland), and the United States (Virginia Polytechnic Institute and State University, The University of Nevada, United States Department of Agriculture (USDA), University of Massachusetts, and Massachusetts Institute of Technology).
As the founder of CMADS data, our original intention was to make it easier for users in East Asia to obtain high-precision data produced by uniform procedures. According to the data application and usage during the past three years, our original goal has been achieved. We are honoured that a large number of users are in Asia. Through offline emails and online communication of users, we are also excited to learn that CMADS has greatly supported users in East Asia for scientific research. In addition, we are surprised and encouraged to find that many researchers from the regions that are not covered by the CMADS data, such as Europe and North America, have shown great interest.
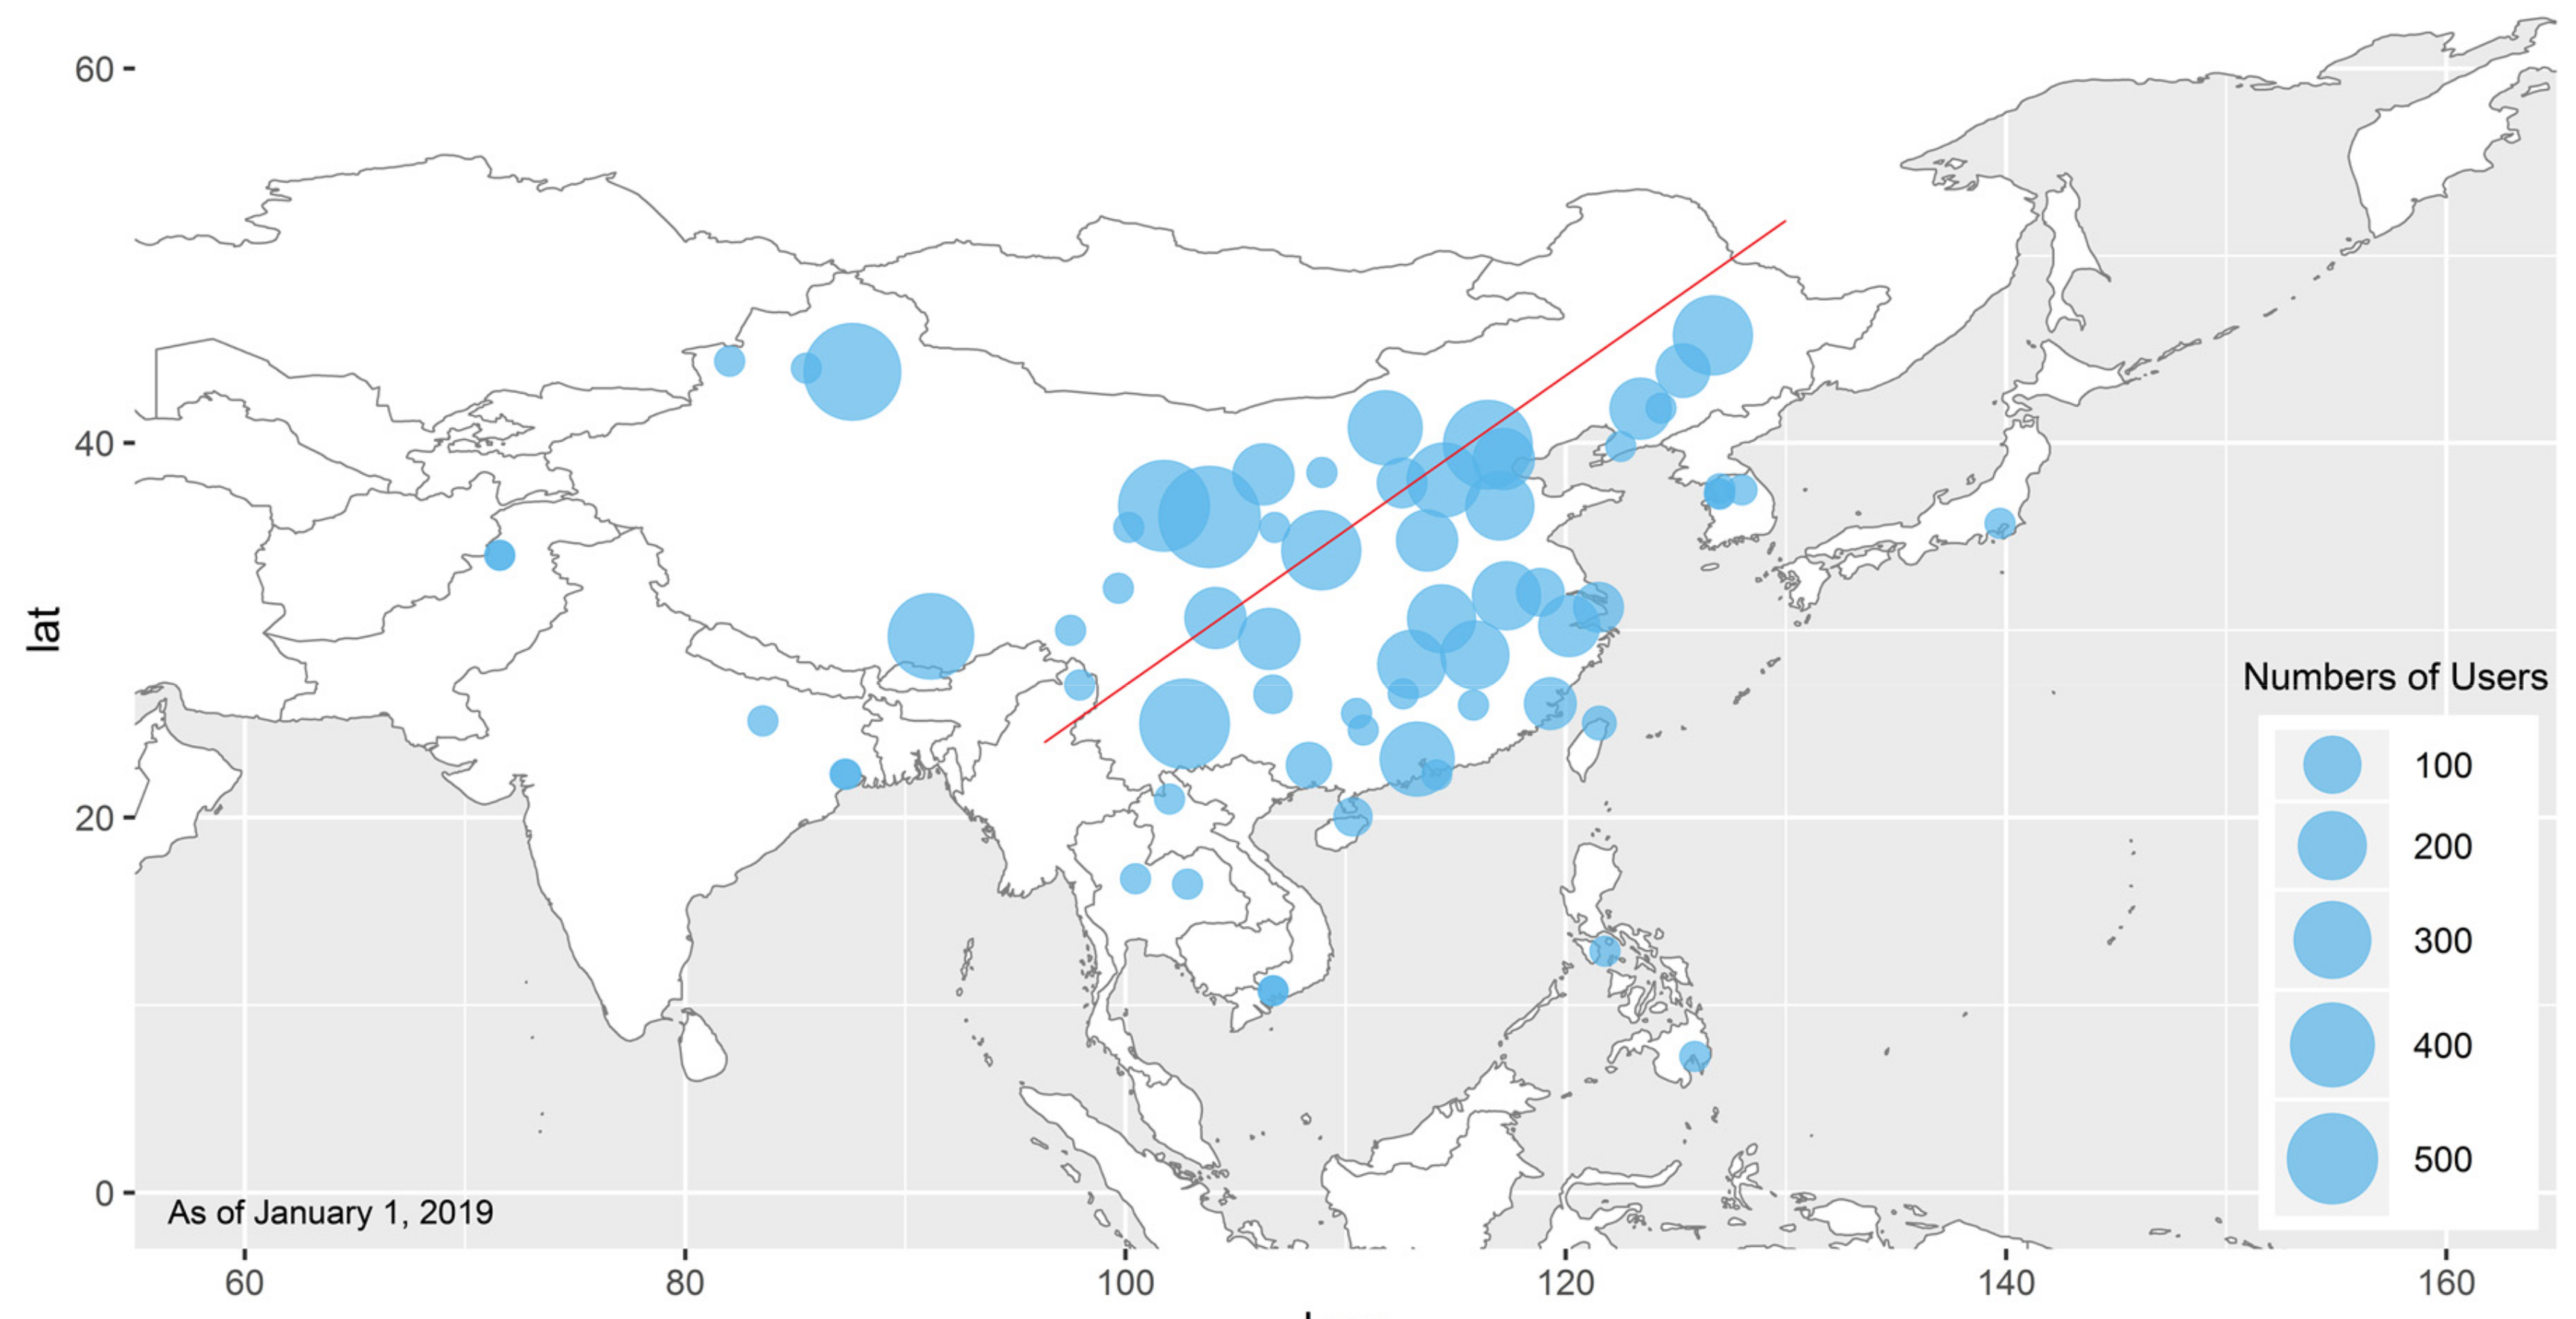
We evaluated the areas in East Asia to which researchers have applied the CMADS data most often; however, this analysis is a rough estimation because some users did not reveal the application purpose when applying for the data (Figure 2). We found that the CMADS datasets is most widely used in mainland China. The most frequent research area for data application is concentrated in Northwest China, followed by North China, Northeast China, and finally Southwest China, Central China, East China, and South China. Moreover, we found that the number of data applications on the upper left side of the Hu Line is higher than that in the lower right region. Similarly, the number of meteorological stations in China differs significantly on both sides of the Hu Line. Most meteorological stations are located in the lower right region of the Hu Line in Southeast China. This interesting phenomenon may explain why CMADS is used often for filling in missing data owing to a lack of meteorological stations in that region of China. We also noted that the CMADS datasets has been widely used in many countries outside China, including Pakistan, India, Russia, Thailand, South Korea, Japan, and the Philippines (Figure 2).
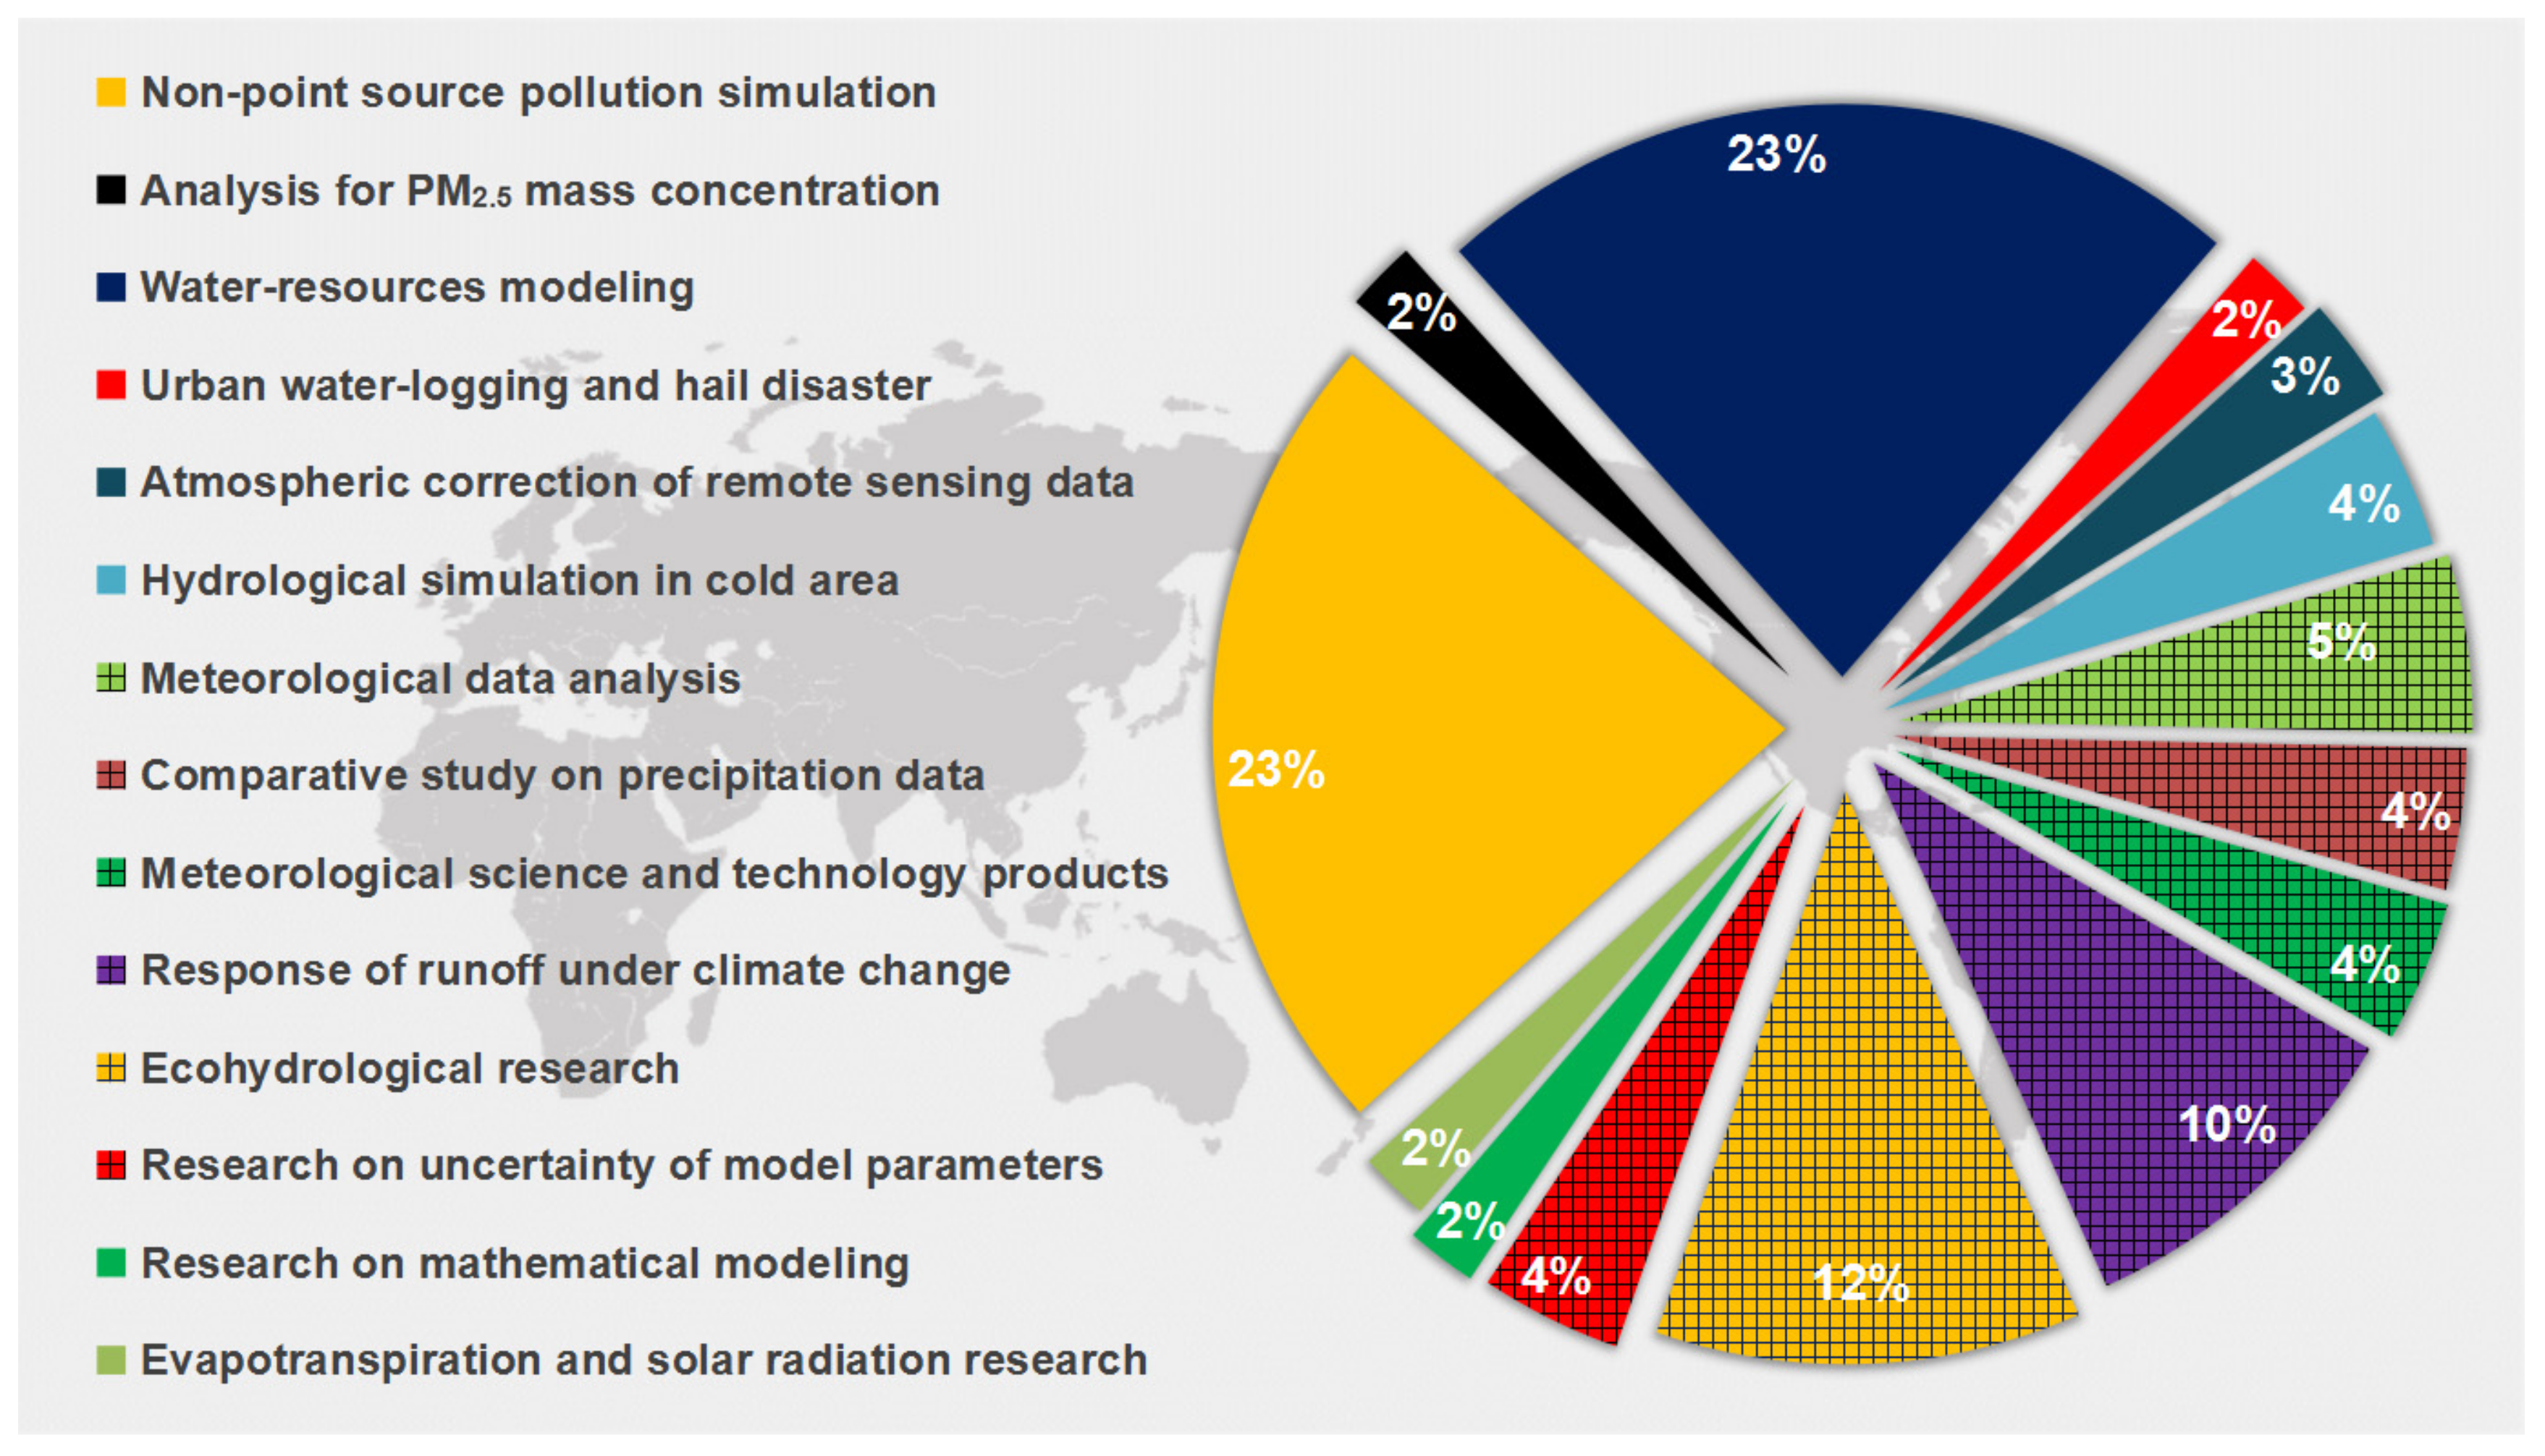
We requested almost all the applicants for the CMADS data to state the purpose of using the data. Figure 3 shows the statistical results of using the data and it can be seen that the hotspot applications are non-point source pollution simulation and water resources modeling, both of which were 23%.
Other research purposes in order of popularity are ecohydrological research (12%), response of runoff under climate change (10%), and meteorological data analysis (5%). There are four purposes with 4%, which are hydrological simulation in cold areas, comparative study on precipitation data, meteorological science and technology products, and research on uncertainty of model parameter. The purpose for atmospheric correction of remote sensing data is 3%. Finally, there are four purposes with 2%, which are analysis for the mass concentration of atmospheric particulate matter (PM) less than 2.5 µm in diameter (PM2.5), urban water-logging and hail disasters, research on mathematical modeling, and evapotranspiration (ET) and solar radiation research. We are pleased to report that the CMADS datasets has been applied in different research purposes. Particularly in East Asia, more researchers are using CMADS to focus on non-point source pollution simulation and water resource modeling, which shows that researchers are paying more attention to the current water environment problems in East Asia and the problems of drought and flood caused by uneven spatiotemporal differentiation of water resources. Runoff and ecological hydrology research under climate change is an additional research focus in East Asia. In the future, the CMADS datasets will provide users with historical data, real-time data, and forecast data at multiple resolutions to meet the different needs of users for various research applications.
This special issue provides a platform for researchers by assisting with the use of CMADS to conduct in-depth research on water quality and quantity modeling in East Asia in order to improve the research in the atmosphere, hydrology, and water environment in East Asia. The papers included in this special issue fall into eight broad categories: Meteorological verification and analysis [3,11], non-point source pollution [12], water resource modeling and parameter uncertainty analysis [13,14,15,16], comparison of reanalysis products [17,18,19,20], optimal operational of reservoirs [21,22], water footprint assessment [23], changes in water resources under climate and land use change [24], hydrological simulation in cold area [25,26], and CMADS-Soil Temperature (ST) application [27]. The following section summarizes the individual research within each application.
2. Contributions
The following is a summary of the papers discussed in the special issue titled “Application of the China Meteorological Assimilation Driving Datasets for the SWAT Model (CMADS) in East Asia”.
1. As a CMADS producer, Meng et al. [3] gave a detailed introduction of the CMADS datasets establishment method and the elements provided in this special issue. In addition, we verified the accuracy of the CMADS datasets based on using 2421 automatic weather stations in China.
2. Tian et al. [11] used CMADS to evaluate the potential evapotranspiration (PET) over China with the Penman–Monteith method. Their research compared PET derived from CMADS to that derived from 836 meteorological stations during the period from 2008 to 2016 and analyzed the contribution of different factors to the bias of PET. They concluded that the overall estimation from CMADS agreed well with the observations. In the central and eastern part of China, wind speed and solar radiation were determined to be the major factors influencing the biases in the PET estimation. The wind speed induced biases ranging from −15% to −5% and the solar radiation induced 15% to 50% biases in terms of different locations. Their research discussed the addition of PET elements in CMADS.
3. Qin et al. [12] reported that dam construction changed the watershed nutrient cycle and caused nutrient retention in the reservoir, which led to eutrophication of the surface water. Based on the SWAT model driven by CMADS, the author analyzed the Biliuhe Reservoir Basin in Northeast China and proposed an integrated method to analyse the total nitrogen (TN) accumulation in drinking water reservoirs. Finally, they concluded that fertiliser, atmospheric deposition and soil, and non-point sources accounted for the highest proportions of TN inputs to the Biliuhe Reservoir, at 35.15%, 30.15%, and 27.72%, respectively. Moreover, 19.76% of the TN input was accumulated in the reservoir. Inter-basin water diversion projects also play an important role in the TN accumulation process of the reservoir. Nitrogen pollution of the Biliuhe Reservoir can be alleviated by discharging high nitrogen concentrations of water and sediment through the bottom hole of the dam.
4. Cao et al. [13] used the CMADS-driven SWAT model to validate the runoff in the fan-shaped Lijiang River Basin in China. In addition, the sensitivity and uncertainty of the model parameters were analyzed by using the Sequential Uncertainty Fitting 2 (SUFI-2) method. The authors found that the performance of CMADS-driven SWAT mode was excellent in the calibration and validation periods, with Nash–Sutcliffe model efficiency coefficients (NSEs) of 0.89 and 0.88 and correlation coefficients (R2) of 0.92 and 0.89, respectively. Based on the accuracy of model results, the temporal and spatial variations of ET, the surface runoff, and the groundwater discharge in the watershed were analyzed. The spatial and temporal variations of surface runoff and groundwater discharge in the Lijiang River Basin were found to be closely related to precipitation and ET was largely controlled by land use type. In flood and dry years, the contributions of surface runoff, groundwater flow, and lateral flow to the water budget differed significantly.
5. Guo et al. [14] compared the accuracy of three precipitation datasets including CMADS, Tropical Rainfall Measuring Mission (TRMM) 3B42V7, and an interpolation dataset obtained using rainfall gauges. The study area was the Lijiang River Basin, the same as the study area of Cao et al. [14]. The performances of the three types of precipitation datasets were compared through two rainfall runoff models, IHACRES and Sacramento. Compared with the interpolation dataset through rainfall gauges (NSE = 0.83) and TRMM 3B42 V7 (NSE = 0.89), CMADS (NSE = 0.93) performed the best in the rainfall runoff modeling, especially for peak flow modeling. Compared with TRMM 3B42 V7 (CSI = 0.40), CMADS (CSI = 0.61) showed better agreement with the observation from rainfall gauges. The results also showed that both IHACRES and Sacramento performed well in the Lijiang River basin. The uncertainty analysis revealed that IHACRES showed less uncertainty and higher applicability than Sacramento.
6. Zhao et al. [15] considered that, although the SWAT hydrologic model has been commonly used in investigating the hydrological processes at the watershed scale, it can have various uncertainties. It is therefore essential to conduct parameter uncertainty analysis to gain more confidence in the modeling task. They employed high-resolution meteorological driving datasets–CMADS to investigate the parameter uncertainty of SWAT in a semi-arid loess—mountain transitional watershed with an emphasis on filtering the appropriate uncertainty analysis tool. The results showed that the SUFI2 method was more efficient than ParaSol and GLUE, although all three methods can yield good performance for SWAT through using the CMADS. Further analysis showed that the CN2 SOL_K and ALPHA_BF were more sensitive to peak flow, average flow, and low flow simulations, respectively, than others, including the soil evaporation compensation factor (ESCO), channel hydraulic conductivity (CH_K2), and available soil water capacity of the soil layer (SOL_AWC).
7. Zhou et al. [16] reported that the results of runoff simulation are closely related to local climate and catchment conditions. They proposed a three-step framework: (1) Using multiple regression models for parameter sensitivity analysis based on the results of Latin hypercube sampling (LHS-OAT); (2) using the multi-level factorial decomposition method to quantitatively evaluate the impact of individual and interaction parameter effects on the hydrological processes; and (3) analyzing the reasons for changes in dynamic parameters. The authors concluded that the sensitivity of the parameters differed significantly among the periods. Specifically, the interaction effect between the parameters soil bulk density (SOL_BD) and CN2 as well as those between SOL_BD and CH_K2 were obvious, which indicates that SOL_BD affects the surface runoff and the loss of groundwater recharged by the river. Those findings help to provide optimal parameter input for the SWAT model to improve the applicability of the SWAT model.
8. Gao et al. [17] compared CMADS, the National Center for Environment Prediction Climate Forecast System Reanalysis (NCEP-CFSR), the TRMM 3B42 V7, and the Precipitation Estimation from Remotely Sensed Information using Artificial Neural Networks–Climate Data Record (PERSIANN–CDR) with the observed precipitation and evaluated the hydrological application of the datasets in the Xiang River Basin. The results showed that (1) for daily time steps, reanalysis datasets had better linear correlations with gauge observations (>0.55) than satellite-based datasets; (2) CMADS and TRMM 3B42 V7 had better linear correlations with gauge observations than PERSIANN-CDR and NCEP-CFSR, and satellite-based datasets were better than reanalysis datasets in terms of bias for monthly temporal scale; and (3) CMADS and 3B42 V7 simulated streamflow well for both daily and monthly time steps, with NSEs >0.70 and >0.80, respectively. Moreover, CMADS performed slightly better than TRMM 3B42 V7; the performances of NCEP-CFSR and PERSIANN-CDR were not acceptable.
9. Guo et al. [18] evaluated the accuracy and hydrological simulation utility of CMADS, TMPA 3B42 V7, and Integrated Multi-Satellite Retrievals for Global Precipitation Measurement (IMERG-F) products in the Jinsha River, which is a complex terrain area. The results of statistical analysis showed that the three types of datasets had relatively high accuracy on the average grid scale with R2 values greater than 0.8, at 0.86, 0.81, and 0.88, respectively. In addition, CMADS had the highest success rate of detecting extreme precipitation events. The study analysis showed that all three precipitation products obtained acceptable results when driven the SWAT model. CMADS performed best, followed by TMPA and IMERG with NSEs of 0.55, 0.50, and 0.45, respectively.
10. Liu et al. [19] evaluated the accuracy of five elements from CMADS and CFSR by comparing them at 131 meteorological stations in the Qinghai–Tibetan Plateau. The results indicated that CMADS outperformed CFSR with a higher correlation coefficient and smaller bias. The authors also used different climate data including CMADS, CFSR, and observations to run the SWAT model. The results indicated that CMADS performed best in forcing the SWAT model, with NSEs of 0.78 and 0.68 in calibration and validation periods, respectively. With the help of Geodetector, the authors found that the air temperature, soil moisture, and soil temperature at 1.038 m had a larger impact on snowmelt than other factors. Ultimately, the paper revealed that CMADS is suitable for study regions in the Qinghai–Tibetan Plateau.
11. Vu et al. [20] compared several precipitation products, including PERSIANN, TRMM 3B42 V7, and CMADS, with the observed precipitation. They found that the accuracy of TRMM and CMADS precipitation products was higher than that of PERSIANN and PERSIANN-CDR when compared with traditional observatories through a series of indicator validations. They reported that TRMM and CMADS products can better capture mountainous precipitation. Finally, the authors used all of these precipitation products to drive the SWAT model. After the model was validated in the Han River Basin, Korean Peninsula, they concluded that the model performance driven by gauged rainfall data was the best, at NSE = 0.68, followed by TRMM, CMADS, and PERSIANN with an NSE = 0.49, 0.42, and 0.13, respectively; PERSIANN-CDR had an NSE of 0.16. Because CMADS products have not yet been assimilated in the Korea region, there is a large amount of room for improvement in the expressiveness of CMADS products in that region.
12. Dong et al. [21] indicated the reservoir operation should be incorporated into the hydrological model to quantify its hydrological impact. Accordingly, the authors developed a reservoir module and integrated this module into the Noah Land Surface Model and Hydrology System (LSM-HMS). The module aggregates small reservoirs into one large reservoir by employing a simple statistical approach. The integrated model was applied to the upper Gan River Basin to quantitatively assess the impact of a group of reservoirs on the streamflow. The results indicate that the model can reasonably depict the storage variations of both the large and small reservoirs. With the newly developed module, the performance of the model in simulating streamflow improved at a 0.05 level of significance. The results also indicated that the operation of a group of reservoirs led to an increase in streamflow in dry seasons and a decrease in flood seasons; the impacts of the large and small reservoirs had almost the same order of magnitude.
13. Liu et al. [22] considered that the construction and operation of cascade reservoirs changed the hydrological cycle of the basin and reduced the accuracy of hydrological forecasting. The authors took the Yalong River Basin as the study area and designed eight scenarios using the SWAT model to change the reservoir capacity, operating location, and relative locations of the two reservoirs. After comparing the various scenarios, the authors found that the reservoir decreased and delayed the flood during the flood season and increased the runoff during the dry season. The flood control benefit and the adjustment of the runoff process of the reservoir rose with an increase in the storage capacity. When the reservoir was close to the downstream region, the peak flow of the basin outlet was reduced by 48.9%. The construction of the small reservoir in the upper reaches of the large reservoir resulted in further flood control benefits, with a maximum reduction of 55% in peak flow.
14. Yuan et al. [23] estimated the virtual water in the Bohai Basin, including blue water flow (BWF) and green water flow (GWF) based on the CMADS-driven SWAT model. In addition, they studied the laws of spatiotemporal changes in BWF, GWF and green water coefficient (GWC), and analyzed the sensitivity of GWF and BWF to temperature and precipitation under climate change. Overall, the study showed that the CMADS can be used to detect the observed probability density function of daily precipitation and temperature. CMADS also performed well in simulations when the relative and absolute deviations of monthly variables of precipitation and temperature were less than 7% and 0.5 °C, respectively. From 2009 to 2016, the BWF increased and the GWF decreased. Ridges of high pressure showed an uneven spatial distribution with a gradual increase from lower altitudes to mountainous areas. However, the spatial distribution of GWF was relatively even. Moreover, the precipitation increased 10% and the BWF increased 20.8%; the watershed-scale GWF increased only 2.5%. When the temperature increased 1.0 °C, the BWF and GWF changed by −3% and 1.7%, respectively. BWF and GWF were more sensitive to precipitation in the areas with lower altitude. Under those conditions, the mountainous water flow was more sensitive to temperature.
15. Shao et al. [24] used meteorological data from traditional observation stations and land use data during the period 1970–2014 of the Hailiutu River Basin combined with the Mann–Kendall (MK) and STARS (Sequential t-Test Analysis of Regime Shift) methods to develop seven land use changes or climate variability scenarios. CMADS was introduced to enhance the representativeness of traditional observation stations during the period 2008–2014. Moreover, the simulation performance was analyzed when CMADS and observed data were used to drive the SWAT model. The results showed that CMADS has an adjustment and optimization effect on the meteorological data of traditional observation stations owing to its high resolution and precision. Therefore, the authors found that in the Hailiutu River Basin, the impact of climate variability on streamflow was more profound than the impact of land use change.
16. Zhang et al. [25] studied the Hunhe River Basin (HRB) in China to evaluate the impact of land-use change on sediment erosion and runoff in alpine regions, using SWAT driven by CMADS. The SWAT model driven by CMADS performed well in the HRB with NSEs of 0.67–0.92 and 0.56–0.95 and R2 values of 0.69–0.94 and 0.57–0.96 for monthly runoff and monthly sediment, respectively. Forestland played an important role in soil and water conservation, which increased the ET and soil infiltration capacity, decreased the surface runoff (SURQ), and resulted in a reduction in runoff and sediment yield, whereas it decreased the water percolation and increased the runoff in the dry season. The responses of grassland and forestland to runoff and sediment yield were similar, although the former was weaker than the latter in soil and water conservation. Cropland usually increased the SURQ, runoff, and sediment yield. Compared with cropland, when the precipitation is low, urban land might lead to higher sediment yields owing to its higher runoff yield. Additionally, the runoff and sediment yield under different land use scenarios increased along with an increase in average monthly precipitation.
17. Li et al. [26] used CMADS data to drive the SWAT model in the Jingbo River (JBR) Basin in western China to provide scientific elaboration on the region’s surface processes. Owing to limitations posed by the local climate and a lack of meteorological stations, in-depth research on surface processes in that region is limited. The authors found that the CMADS-driven SWAT model produced satisfactory results in the JBR Basin, with monthly and daily NSEs of 0.659–0.942 and 0.526–0.815, respectively. Their research also revealed that the soil moisture in the JBR Basin will reach the first peak level in March and April each year as a result of spring snowmelt, whereas the soil moisture after October is constant owing to cold air transit.
18. Zhao et al. [27] used CMADS-ST and soil moisture observation data to study the dynamic characteristics of the near-surface hydrothermal process in a typical frozen soil region near Harbin and analyzed the soil moisture distribution in the black soil region during the freeze–thaw period. The results showed that the shallow soil moisture in the black soil slope farmland had a Gaussian distribution with the freeze–thaw period and that the peak of the soil moisture Gaussian distribution appeared in the early freeze–thaw period in early spring. Under the conditions of shallow melting and deep freezing of the black soil plowing layer, the research results were consistent with the natural phenomenon, such that the snow-melted water infiltrated into the soil in the early spring. Then, for the northeast black soil region, the CMADS-ST was used to explore the change trend of the soil moisture content during the freeze–thaw cycle period. The research would have impacts on decision-making for the protection of water and soil resources and the environment in northeastern China’s seasonal frozen soil zones and the conservation of soil and water of sloping farmland in the black soil zone.
As a summary, Table 1 lists the general information of the above 18 papers.
Funding
This research was financially joint supported by the National Science Foundation of China (41701076) and the National key Technology R & D Program of China (2017YFC0404305,2018YFA0606303).
Acknowledgments
The authors wish to thank the journal editors for their support.
Conflicts of Interest
The authors declare no conflict of interest.
References
- Meng, X.; Wang, H. Significance of the China Meteorological Assimilation Driving Datasets for the SWAT Model (CMADS) of East Asia. Water. 2017, 9, 765. [Google Scholar] [CrossRef]
- Meng, X.; Wu, Y.; Pan, Z.; Wang, H.; Yin, G.; Zhao, H. Seasonal Characteristics and Particle-size Distributions of Particulate Air Pollutants in Urumqi. Int. J. Environ. Res. Public Health 2019, 16, 396. [Google Scholar] [CrossRef] [PubMed]
- Meng, X.; Wang, H.; Shi, C.; Wu, Y.; Ji, X. Establishment and Evaluation of the China Meteorological Assimilation Driving Datasets for the SWAT Model (CMADS). Water 2018, 10, 1555. [Google Scholar] [CrossRef]
- Meng, X.; Yu, D.; Liu, Z. Energy balance-based SWAT model to simulate the mountain snowmelt and runoff—Taking the application in Juntanghu watershed (China) as an example. J. Mt. Sci. 2015, 12, 368–381. [Google Scholar] [CrossRef]
- Meng, X.; Sun, Z.; Zhao, H.; Ji, X.; Wang, H.; Xue, L.; Wu, H.; Zhu, Y. Spring Flood Forecasting Based on the WRF-TSRM mode. Teh. Vjesn. 2018, 25, 27–37. [Google Scholar]
- Meng, X.; et al. Snowmelt Runoff Analysis Under Generated Climate Change Scenarios for the Juntanghu River Basin in Xinjiang, China. Tecnología y Ciencias del Agua 2016, 7, 41–54. [Google Scholar]
- Xue, L.; Zhu, B.; Yang, C.; Wei, G.; Meng, X. Study on the characteristics of future precipitation in response to external changes over arid and humid basins. Sci. Rep. 2017, 7, 15148. [Google Scholar] [CrossRef] [PubMed]
- Meng, X.; Wang, H.; Long, A.; Wang, J.; Shi, C.; Ji, X. Investigating spatiotemporal changes of the land surface processes in Xinjiang using high-resolution CLM3.5 and CLDAS: Soil temperature. Sci. Rep. 2017, 7, 13286. [Google Scholar] [CrossRef] [PubMed]
- Meng, X.; Wang, H.; Cai, S.; Zhang, X.; Leng, G.; Lei, X.; Shi, C.; Liu, S.; Shang, Y. The China Meteorological Assimilation Driving Datasets for the SWAT Model (CMADS) Application in China: A Case Study in Heihe River Basin. Preprints. 2016, 2016120091. [Google Scholar]
- Meng, X.; Wang, H.; Lei, X.H.; Cai, S.Y.; Wu, H.J. Hydrological Modeling in the Manas River Basin Using Soil and Water Assessment Tool Driven by CMADS. Teh. Vjesn. 2017, 24, 525–534. [Google Scholar]
- Tian, Y.; Zhang, K.; Xu, Y.-P.; Gao, X.; Wang, J. Evaluation of Potential Evapo-transpiration Based on CMADS Reanalysis Dataset over China. Water 2018, 10, 1126. [Google Scholar] [CrossRef]
- Qin, G.; Liu, J.; Wang, T.; Xu, S.; Su, G. An Integrated Methodology to Analyze the Total Nitrogen Accumulation in a Drinking Water Reservoir Based on the SWAT Model Driven by CMADS: A Case Study of the Biliuhe Reservoir in Northeast China. Water 2018, 10, 1535. [Google Scholar] [CrossRef]
- Cao, Y.; Zhang, J.; Yang, M. Application of SWAT Model with CMADS Data to Estimate Hydrological Elements and Parameter Uncertainty Based on SUFI-2 Algorithm in the Lijiang River Basin, China. Water 2018, 10, 742. [Google Scholar] [CrossRef]
- Guo, B.; Zhang, J.; Xu, T.; Croke, B.; Jakeman, A.; Song, Y.; Yang, Q.; Lei, X.; Liao, W. Applicability Assessment and Uncertainty Analysis of Multi-Precipitation Datasets for the Simulation of Hydrologic Models. Water 2018, 11, 1611. [Google Scholar] [CrossRef]
- Zhao, F.; Wu, Y. Parameter Uncertainty Analysis of the SWAT Model in a Mountain Loess Transitional Watershed on the Chinese Loess Plateau. Water 2018, 10, 690. [Google Scholar] [CrossRef]
- Zhou, S.; Wang, Y.; Chang, J.; Guo, A.; Li, Z. Investigating the Dynamic Influence of Hydrological Model Parameters on Runoff Simulation Using Sequential Uncertainty Fitting-2-Based Multilevel-Factorial-Analysis Method. Water 2018, 10, 1177. [Google Scholar] [CrossRef]
- Gao, X.; Zhu, Q.; Yang, Z.; Wang, H. Evaluation and Hydrological Application of CMADS against TRMM 3B42V7, PERSIANN-CDR, NCEP-CFSR, and Gauge-Based Datasets in Xiang River Basin of China. Water 2018, 10, 1225. [Google Scholar] [CrossRef]
- Guo, D.; Wang, H.; Zhang, X.; Liu, G. Evaluation and Analysis of Grid Precipitation Fusion Products in Jinsha River Basin Based on China Meteorological Assimilation Datasets for the SWAT Model. Water 2019, 11, 253. [Google Scholar] [CrossRef]
- Liu, J.; Shanguan, D.; Liu, S.; Ding, Y. Evaluation and Hydrological Simulation of CMADS and CFSR Reanalysis Datasets in the Qinghai Tibet Plateau. Water 2018, 10, 513. [Google Scholar] [CrossRef]
- Vu, T.T.; Li, L.; Jun, K.S. Evaluation of Multi Satellite Precipitation Products for Streamflow Simulations: A Case Study for the Han River Basin in the Korean Peninsula, East Asia. Water 2018, 10, 642. [Google Scholar] [CrossRef]
- Dong, N.; Yang, M.; Meng, X.; Liu, X. CMADS-Driven Simulation and Analysis of Reservoir Impacts on the Streamflow with a Simple Statistical Approach. Water 2019, 11, 178. [Google Scholar] [CrossRef]
- Liu, X.; Yang, M.; Meng, X.; Wen, F.; Sun, G. Assessing the Impact of Reservoir Parameters on Runoff in the Yalong River Basin using the SWAT Model. Water 2019, 11, 643. [Google Scholar] [CrossRef]
- Yuan, Z.; Xu, J.; Meng, X.; Wang, Y.; Yan, B.; Hong, X. Impact of Climate Variability on Blue and Green Water Flows in the Erhai Lake Basin of Southwest China. Water 2019, 11, 424. [Google Scholar] [CrossRef]
- Shao, G.; Guan, Y.; Zhang, D.; Yu, B.; Zhu, J. The Impacts of Climate Variability and Land Use Change on Streamflow in the Hailiutu River Basin. Water 2018, 10, 814. [Google Scholar] [CrossRef]
- Zhang, L.; Meng, X.; Wang, H.; Yang, M. Simulated runoff and sediment yield responses to land-use change using SWAT model in Northeast China. Water 2019, in press. [Google Scholar]
- Li, Y.; Wang, Y.; Zheng, J.; Yang, M. Investigating Spatial and Temporal Variation of Hydrological Processes in Western China Driven by CMADS. Water 2019, 11, 435. [Google Scholar] [CrossRef]
- Zhao, X.; Xu, S.; Liu, T.; Qiu, P.; Qin, G. Moisture Distribution in Sloping Black Soil Farmland during the Freeze–Thaw Period in Northeastern China. Water 2019, 11, 536. [Google Scholar] [CrossRef]
Figure 1.
Distribution of the China Meteorological Assimilation Driving Datasets for the Soil and Water Assessment Tool (SWAT) (CMADS) users.
Figure 1.
Distribution of the China Meteorological Assimilation Driving Datasets for the Soil and Water Assessment Tool (SWAT) (CMADS) users.

Figure 2.
Research hotspot areas of East Asia employing CMADS.

Figure 3.
Hotspot application directions of CMADS.


Table 1.
Summary of the contributions published in the special issue.
| Research Focuses | Study Area | Country | Re-Analysis Data | Authors | |
|---|---|---|---|---|---|
| 1 | Meteorological verification | China | China | CMADS | Meng et al. [3] |
| 2 | PET evaluate | China | China | CMADS | Tian et al. [11] |
| 3 | Non-point source pollution | Biliuhe Reservoir Basin | China | CMADS | Qin et al. [12] |
| 4 | Sensitivity and uncertainty | Lijiang River Basin | China | CMADS | Cao et al. [13] |
| 5 | Comparison of reanalysis products | Lijiang River Basin | China | CMADS, TRMM 3B42 V7 | Guo et al. [14] |
| 6 | Sensitivity and uncertainty | Jingchuan River Basin | China | CMADS | Zhao et al. [15] |
| 7 | Sensitivity and uncertainty | Yellow River | China | CMADS | Zhou et al. [16] |
| 8 | Comparison of reanalysis products | Xiang River Basin | China | CMADS, CFSR, TRMM 3B42 V7, PERSIANN-CDR | Gao et al. [17] |
| 9 | Comparison of reanalysis products | Jinsha River | China | CMADS, TRMM 3B42 V7, IMERG-F | Guo et al. [18] |
| 10 | Comparison of reanalysis products | Qinghai–Tibetan Plateau | China | CMADS, CFSR | Liu et al. [19] |
| 11 | Comparison of reanalysis products | Han River Basin | Korean Peninsula | CMADS, TRMM, PERSIANN, PERSIANN-CDR | Vu et al. [20] |
| 12 | Reservoir operation | Gan River Basin | China | CMADS | Dong et al. [21] |
| 13 | Reservoir operation | Yalong River Basin | China | CMADS | Liu et al. [22] |
| 14 | Water footprint assessment | Bohai Basin | China | CMADS | Yuan et al. [23] |
| 15 | Changes in water resources under climate and Land Use Change | Hailiutu River Basin | China | CMADS | Shao et al. [24] |
| 16 | Hydrological simulation in cold area | Hunhe River Basin | China | CMADS | Zhang et al. [25] |
| 17 | Hydrological simulation in cold area | Jing and Bo River Basin | China | CMADS | Li et al. [26] |
| 18 | CMADS-ST application | Heilongjiang Province | China | CMADS-ST | Zhao et al. [27] |
© 2019 by the authors. Licensee MDPI, Basel, Switzerland. This article is an open access article distributed under the terms and conditions of the Creative Commons Attribution (CC BY) license (http://creativecommons.org/licenses/by/4.0/).
Share and Cite
MDPI and ACS Style
Meng, X.; Wang, H.; Chen, J. Profound Impacts of the China Meteorological Assimilation Driving Datasets for the SWAT Model (CMADS). Water 2019, 11, 832. https://doi.org/10.3390/w11040832
AMA Style
Meng X, Wang H, Chen J. Profound Impacts of the China Meteorological Assimilation Driving Datasets for the SWAT Model (CMADS). Water. 2019; 11(4):832. https://doi.org/10.3390/w11040832
Chicago/Turabian StyleMeng, Xianyong, Hao Wang, and Ji Chen. 2019. "Profound Impacts of the China Meteorological Assimilation Driving Datasets for the SWAT Model (CMADS)" Water 11, no. 4: 832. https://doi.org/10.3390/w11040832
Note that from the first issue of 2016, this journal uses article numbers instead of page numbers. See further details here.