Study on the Attachment of Escherichia coli to Sediment Particles at a Single-Cell Level: The Effect of Particle Size

1
State Key Laboratory of Hydroscience and Engineering, Tsinghua University, Beijing 100084, China
2
Key Laboratory of Systems Bioengineering (Ministry of Education), School of Chemical Engineering and Technology, Tianjin University, Tianjin 300072, China
3
Southwest University of Science and Technology, 59 Qinglong Road, Mianyang 621010, Sichuan, China
*
Authors to whom correspondence should be addressed.
†
These authors contributed equally to this work.
Water 2019, 11(4), 819; https://doi.org/10.3390/w11040819
Submission received: 1 April 2019
/
Revised: 16 April 2019
/
Accepted: 16 April 2019
/
Published: 19 April 2019
(This article belongs to the Section Water Quality and Contamination)
Abstract
:The attachment of bacteria to sediment particles has a significant impact on the level of bacterial contamination in water. In this work, the attachment of Escherichia coli to particles was investigated with emphasis on the effect of particle size. To exclude the impact of other facts, e.g., the irregularity of particles, we used regular spherical glass particles in addition to natural sediment particles. Both types of particles are mainly composed of SiO2 and are similar in density. Through a bacterial tracking method together with microfluidic techniques, the attachment of single Escherichia coli cells on the particles was observed. The results showed that only a small portion of the cells that approach the particles remain attached and that the attachment probability per approach increases with surface area for both sediment and glass particles within the size range (8–62 μm) examined in this study. Therefore, finer sediments with more surface area have a higher E. coli attachment capacity. The attachment probability is higher on sediment particles than on glass microspheres of equivalent size, indicating preferential attachment of E. coli to sediment particles. The partition coefficient of the commonly used linear partition model was calculated based on microscopic measurements and the obtained relation of the partition coefficient with attachment probability and particle size was validated with data from the published literature.
1. Introduction
Pathogen contamination in drinking, recreational, and irrigation water results in numerous diseases and poses a serious health threat to human society. E. coli and fecal coliforms in fresh water are considered to be closely associated with outbreaks of gastrointestinal illness and are thus used as typical indicator bacteria to evaluate the contamination level of fresh water [1].
Attachment to sediment particles affects the transport and fate of bacteria in water and, in turn, has a major effect on the contamination level of water. Particles larger than a certain size (4~8 μm) are settleable under natural conditions [2] and particle-associated bacteria (i.e., attached cells) thus have a higher settling rate than their free-floating counterparts. Once settled to the bottom, the bacteria can survive much longer than planktonic bacteria because of the hospitable environment [3,4]. The bacteria concentration in bottom sediments has been found to be 10–1000 times higher than that in the overlying water [5]. Therefore, sediments can act as reservoirs of bacteria [6] and when sediment particles are resuspended by, for example, storms, tides, or winds, attached bacteria can detach and move freely again in the water column. Studies have shown that in some cases the resuspension of sediments, rather than runoff from surrounding lands, results in elevated E. coli concentration in water [5].
Although the importance of bacterial attachment to particles is widely acknowledged, the exact portion of attached bacteria, i.e., the ratio of the number of attached bacteria to the total number in water, remains incompletely understood, as do the factors influencing this variable. In some cases, the portion was found to vary between 15% and 40% [2,7,8], while in other cases it can exceed 90% [9,10]. Bacterial attachment is reported to be dependent on particle concentration; for example, George et al. found that the percentage of E. coli associated with suspended particles larger than 5 μm increased proportionally with particle concentration [11]. Bacterial attachment was also found to be significantly dependent on the size of particles. Most previous researchers have found that bacteria tend to attach to smaller particles; this finding is consistent with the explanation that, for a given mass, smaller solid particles have more surface area and can provide more attachment sites, resulting in more attached cells. Results have shown that bacterial attachment is more efficient on soil, silt and clay particles than on sand particles [12]. Soupir et al. assumed any bacteria that could not pass through an 8-μm filter were attached and found that at least 60% of all attached E. coli and enterococci were associated with particles smaller than 62 μm [13]. Among particles of different sizes, more than 90% of E. coli were attached to smaller particles (5–30 μm) [14]. A similar study indicated that the number of attached cells per gram of sediment was negatively correlated with particle size in a size range from 4 μm to 75 μm [15]. On the other hand, Oliver et al. investigated preferential attachment and found that E. coli preferentially attached to soil particles within a size range of 16–32 μm [16] by comparing the number of attached cells per unit surface area on particles of different sizes, but they did not explain the mechanism of this preferential attachment.
The linear partition model has been widely used to describe theoretically the relation between particle-associated and planktonic bacteria [17,18]:
where Cs = the concentration of particle-associated bacteria (the number of bacteria associated with particles per unit water volume), colony-forming units (cfu)/L; s = sediment concentration, g/L; k = the partition coefficient, L/g; Cw = the concentration of planktonic bacteria, cfu/L. This linear model works reasonably well in groundwater with relatively low bacteria concentrations [19,20] and has been verified in surface water [19], although it is still an empirical formula and lacks a fundamental thermodynamic basis [21,22]. Equation (1) agrees with the aforementioned observations that the particle concentration has an impact on bacterial attachment, but it does not explain how factors such as particle size affect bacterial attachment, and the influencing factors of the partition coefficient k is still not clear.
The abovementioned relationship between particle-associated and planktonic bacteria was observed using traditional methods. Typically, the attached and free cells are separated using filtration or centrifugation and then enumerated based on incubation [23]. These methods, however, may involve great uncertainty and measurement error. With the development of microscopy, it may seem straightforward to directly observe the distribution of attached bacteria on particles. However, the number of bacteria is much fewer than the number of particles under ordinary conditions. For example, when the concentration of bacteria is 105 (cfu)/L and the suspended sediment concentration, with a density of 2.6 g/cm3 and diameter of 30 μm, is 1 g/L, the number of sediment particles is 272 times the number of bacteria. This finding is in agreement with Goulder’s (1977) observation that in an estuary, there were many particles on which no bacteria were attached [24]. Thus, very few particles have attached bacteria on their surface, which makes direct observation very difficult.
On the other hand, microfluidic devices have been shown to be able to make observations at high spatial resolution in controlled microenvironments [25,26,27] and offer a powerful tool to study microbial motility, including bacterial attachment [28]. Recent advances in bacterial imaging and tracking also enable the study of microbial activity to be performed at a single-cell level [29,30]. Microscopical features of substrates like surface topography of micrometer and nanometer scale were also found to influence bacterial attachment [31]. The aim of this study is to gain an improved understanding of bacterial attachment to particles. The emphasis was placed on the impact of size on the attachment and to exclude the impact of other facts, we used regular spherical glass particles of different diameters in addition to natural sediment particles. The glass particles, similar to the natural sediment particles used, are mainly composed of SiO2 and are similar in density to the natural particles. We placed particles of different sizes in flow cells, through which we continuously streamed an E. coli suspension. Using microscopy, we chose a number of particles, estimated the number of bacteria coming into contact with them, and directly counted the number of bacteria that remained attached on them. From these data, the attachment probability, i.e., the number of bacteria attached to a particle versus the number ever approaching the particle, was calculated. Then, the relation between cell attachment probability and particle size was analyzed. The partition coefficient of the linear partition model was conceptualized based on the microscopic measurements and compared with the results from the literature.
2. Materials and Methods
2.1. Bacterial Strain and Bacterial Suspension
The strain of E. coli used in the experiments is American Type Culture Collection (ATCC) 8099 and was purchased from the China General Microbiological Culture Collection Center. Stock E. coli cultures were maintained on beef extract-peptone agar and stored at 4 °C between experiments.
The bacterial suspension used in the experiments was prepared by suspending ATCC 8099 cells in Phosphate-buffered saline (PBS) at OD600~0.1 at room temperature and the concentration was assessed following membrane filtration procedures (USEPA method 1603). Ten-micromolar PBS (pH = 7.4) was used throughout the experiments. Before each experiment, bacteria were first grown on nutrient broth (NB) agar plates at 37 °C overnight. Monoclonal colonies were isolated and inoculated into culturing tubes containing 5 mL NB medium and then grown in an incubator shaken at 150 rpm at 37 °C. After 7 h, 1 mL of E. coli culture, which reached the exponential growth phase (OD600 ≈ 1.0), was further diluted 20-fold in 100 mL NB medium and grown again in the same incubator for 15 h. Subsequently, cells were harvested in the stationary phase by centrifugation at 12,000 rpm for 2 min, after which they were washed three times with sterile PBS.
2.2. Particles
Two types of particles were used in this study: natural sediment particles (quartz sand) and monodispersed glass microspheres (Duke Standards).
The sediment was taken from the Yongding River in Beijing, China. Sediment particles within the size ranges of 8–16 μm, 16–31 μm, and 31–62 μm were separated out by repeated sedimentation based on Stokes’ law and were then used in experiments. The median diameters for the three groups are 12 μm, 23.5 μm, and 46.5 μm, respectively. Before use, the sediment particles were first cleaned by soaking in distilled water and hydrogen peroxide to remove any inorganic matter or microorganisms deposited on them. Then, the particles were dried in an oven at 45 °C for 10 h. The sediment particles have a specific gravity of 2.650 and are composed mainly of quartz (silica content > 90%), along with some feldspar, chlorite and illite. The size of the sediment particles was analyzed by a laser particle analyzer (HORIBA LA-920).
The glass microspheres used in this study are an ideal model for studying the isolated effect of particle size on bacterial attachment due to their uniform size and shape as well as their isotropic surface properties. Microspheres of three different diameters (10 μm, 20 μm, and 50 μm) were chosen, corresponding to the mean sizes of the sediment particles. The glass microspheres are made of borosilicate glass and are similar to the sediment particles in chemical composition (silica content > 80%) and specific gravity (2.550). The microspheres have a size polydispersity of no more than 10%.
2.3. Microfluidic Device and Microscope
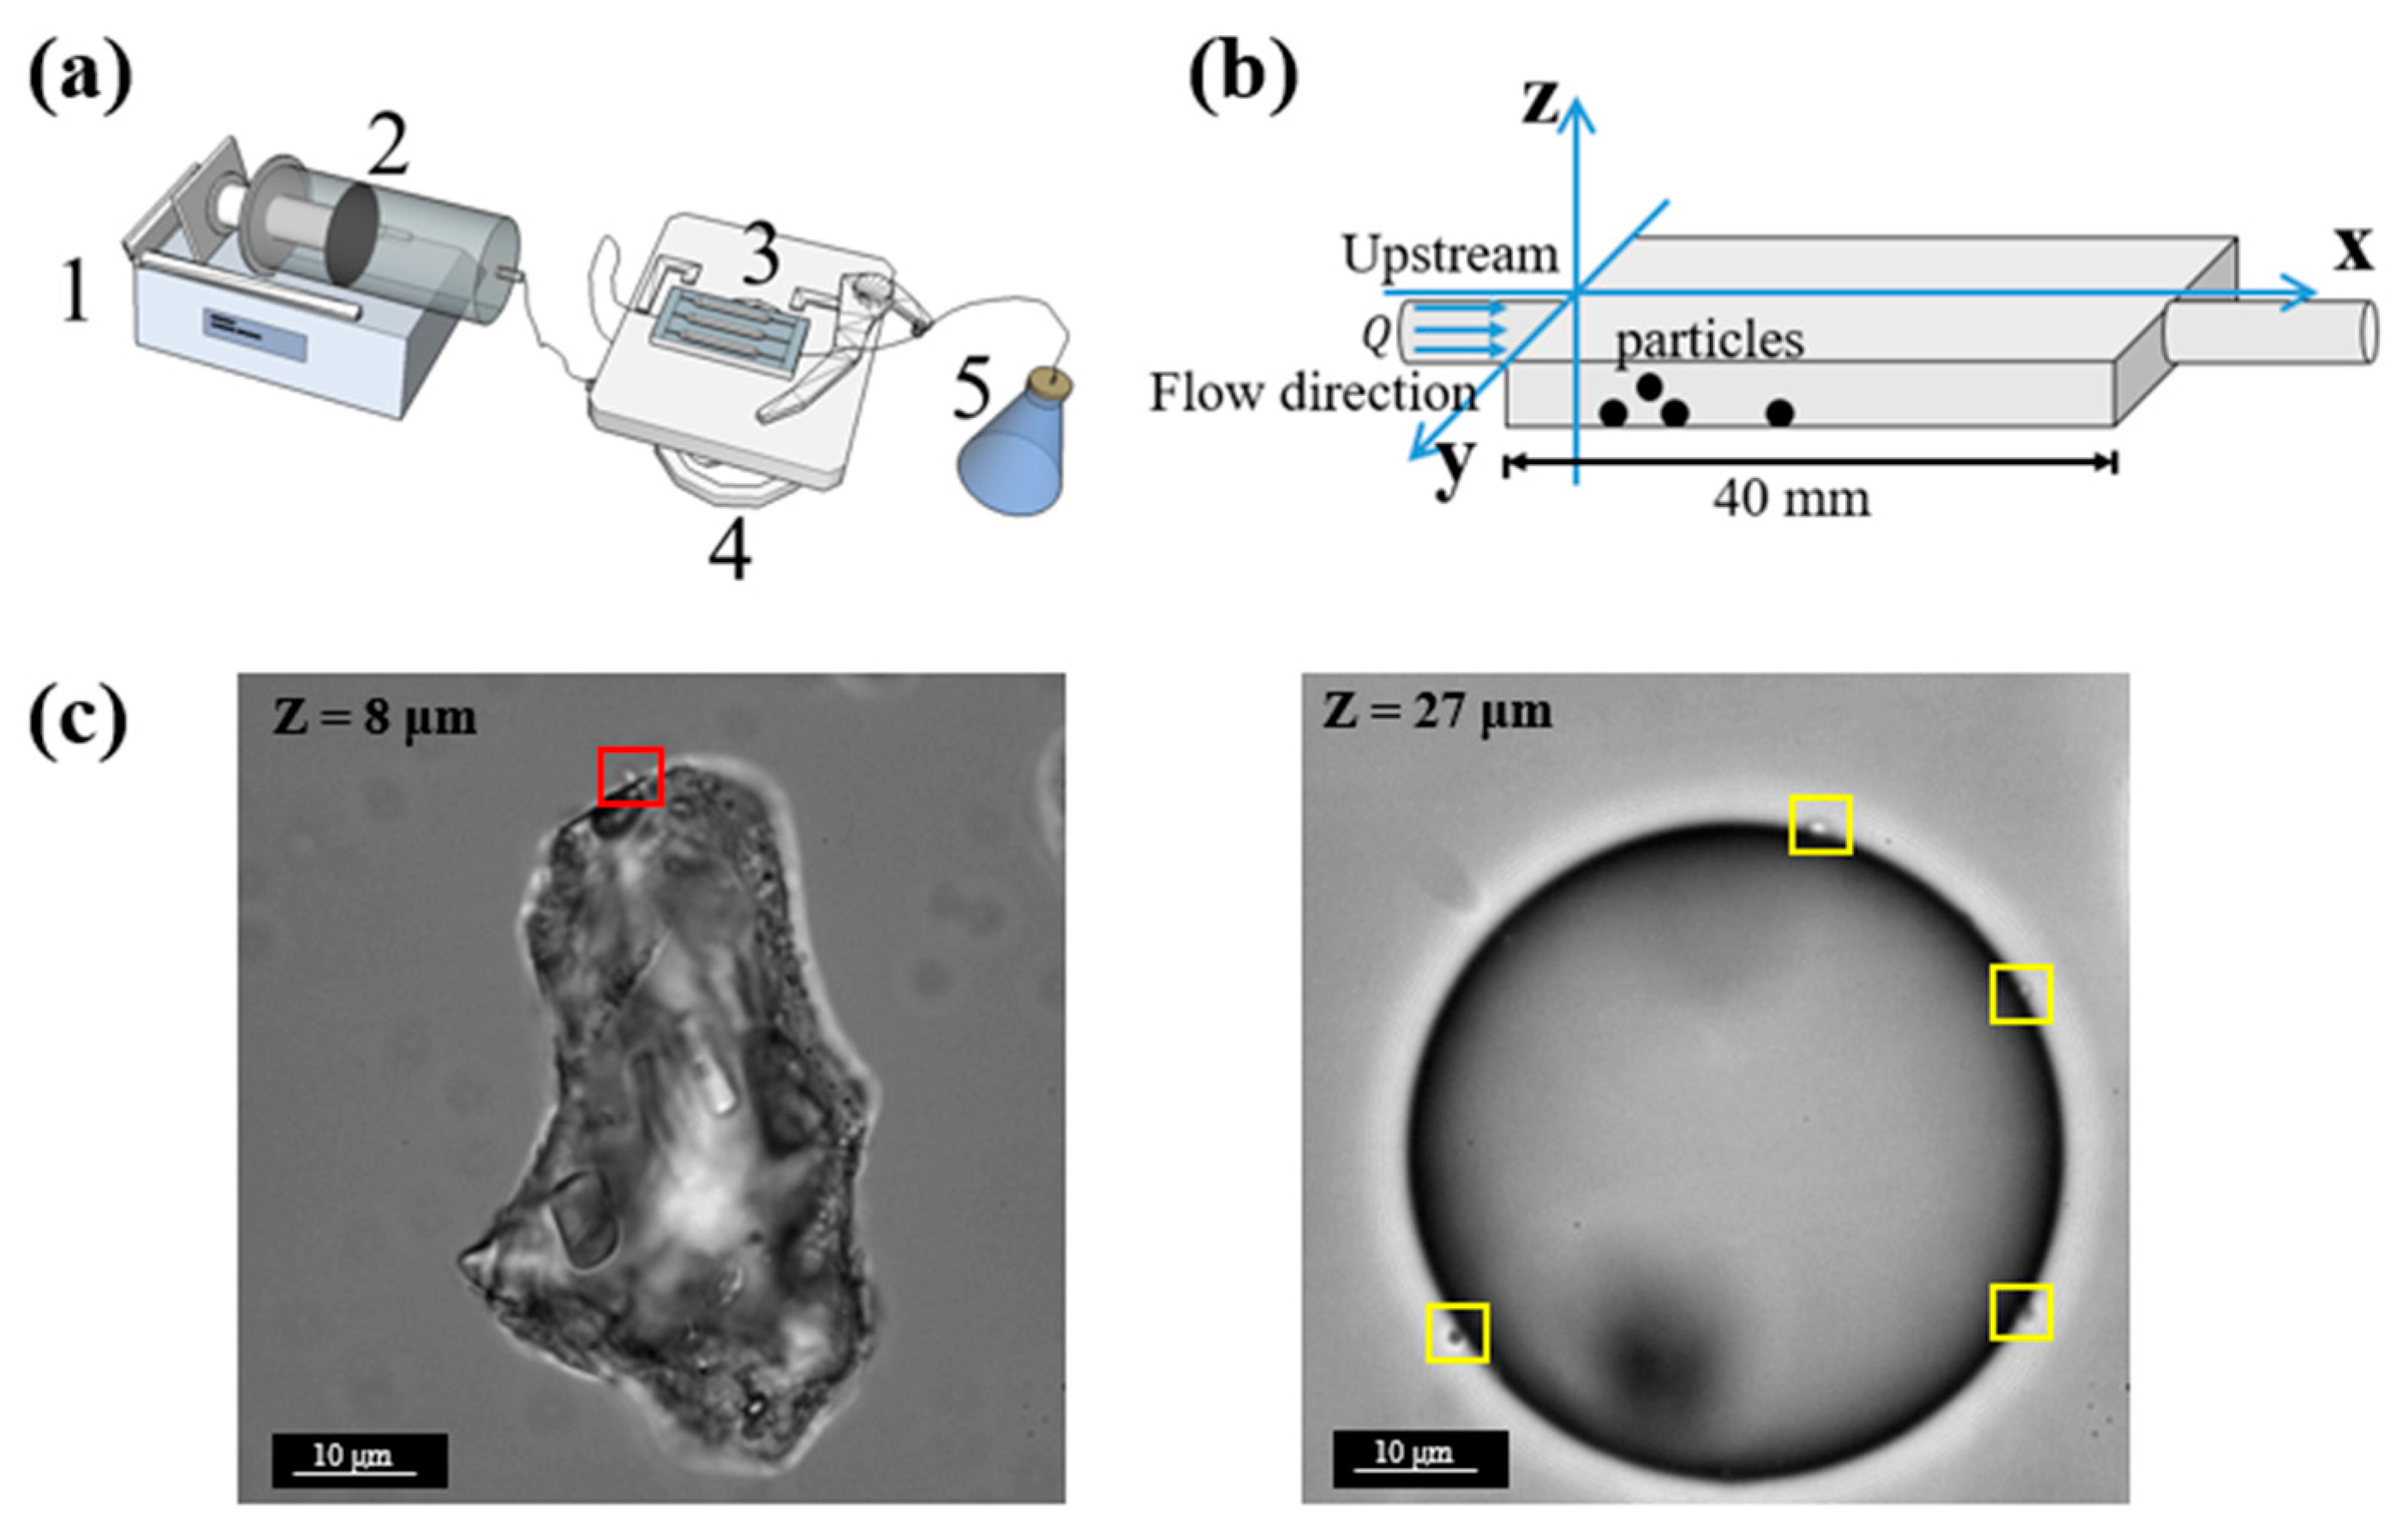
Flow cells (purchased from the Department of Biotechnology and Biomedicine, Technical University of Denmark) were used to observe bacterial attachment under a microscope. Each of the flow cells has three identical rectangle channels with dimensions of 40 mm × 4 mm × 1 mm (length × width × depth). The microfluidic system was prepared using a standard protocol [32]. A syringe was connected to the inlet of a microchannel via silicone tubing (inner diameter: 0.8 mm), and the plunger was pushed by a syringe pump (Harvard Apparatus PHD Ultra 703006, Harvard Apparatus, MA, USA) (Figure 1a).
Images and videos in the experiments were taken using an electron-multiplying charge-coupled device (EMCCD) camera (Andor iXon) on a Leica DMi8 inverted microscope. Due to the limited depth of focus of the optical microscope (with 100x objective, numerical aperture = 1.4), we could not obtain a full view of a particle in only one frame. Therefore, a z-scan was conducted. The z-scan was performed at a step size of 1 μm, a typical z-scan takes 5.5 s, 8.8 s, and 17.6 s for particles of 10 μm, 20 μm, and 50 μm, respectively. From the latter results, we can see that in each z-scan period, the attached bacteria can be considered stationary. The size of the field of view is 66.5 μm × 66.5 μm. Particles at different positions were picked. For each condition, at least 3 repeats were performed. To minimize errors, we manually checked each image from z-scan period and counted the number of attached cells.
2.4. Experimental Procedure
The attachment of bacteria to surfaces can be separated into three stages: (1) the approaching stage; (2) the initial attachment stage; and (3) attachment strengthening stage [33]. In the approaching stage, the bacteria achieve proximity to a surface, which can be achieved by active motion or passive transport such as fluid flow and Brownian motion. When bacteria are sufficiently close to the surface, attachment can be initiated through further direct contact with the surface. The initial attachment is influenced by multiple factors, including the physical and chemical properties of the surface and the biological properties of the bacteria. After initial attachment, bacteria can strengthen their bond by producing adhesion molecules [33].
Here, we define the adjacent area as the water region that is within 2 μm of the surface of the particle. When entering this adjacent area, bacteria are considered to have completed the approaching stage and could initialize attachment later.
The experiment contained two steps. In the first step, particles were placed in the channels before the flow-cell system was assembled and when the E. coli suspension flowed through the channels, cells attached to the particles were counted. In the second step, the number of cells that had ever approached a particle (entered its adjacent area) in the flow cell was estimated based on fluid mechanics. By comparing the number of attached cells and the number of approaching cells, the attachment probability was calculated and then analyzed. The attachment probability reflects the efficiency of initial attachment and attachment strengthening. Thus, the influence of sediment properties on bacterial attachment can be studied by analyzing the relationship between those properties and attachment probability. Moreover, the number of attached bacteria and the partition coefficient in real water can also be inferred through estimation of the approaching number combined with the attachment probability.
2.5. Counting of Attached Cells
Particles were placed in the channels before the flow-cell system was assembled. For each run, pure sterile PBS was first injected with a constant flow rate of 3.0 mL/h at 25 °C for 5 min until the particles settled to the bottom of the channel and remained immobile there. Then, the E. coli suspension was continuously injected into the flow-cell channel at a constant flow rate of 3.0 mL/h at 25 °C.
In this step, cells that remained attached to some of the particles were directly counted under the microscope. The observation fields were randomly chosen, while each field of view contained only one particle.
For each type of particle (sediment particles and glass microspheres of different sizes), 30 observation fields were picked randomly along the Y-axis (i.e., perpendicular to the flow direction). The data collection was performed every 0.5 h for 20 h. In each collection, a z-scan of the particles with a step size of 1 μm was conducted for each of the 30 observation fields in turn. Images obtained from the z-scans were carefully examined to count the number of attached E. coli (Figure 1c). The error due to misrecognition between bacteria and surface defects of the particles is estimated to be no more than 5%.
Microspheres are transparent; therefore, attached E. coli cells above the particle equator are still distinguishable when observed through an inverted microscope and the total number of cells attached to the whole surface can be counted. However, sediment particles are opaque; therefore, it is difficult to clearly see the attached cells above the particle equator. (Considering that a sediment particle is very often nonspherical, the equator of a sediment particle is defined here as the perimeter of the largest cross-section of the particle from the top/bottom view.) For this purpose, we first obtained a partial attachment number by counting the number of attached cells below the particle equator, then, with the assumption that the distribution of attached cells on the sediment particle is roughly uniform, we could estimate the total number of bacteria attached to the whole surface by multiplying the partial attachment number with a compensation factor defined by the ratio between the average diameter of sediment particles and the average height of the below-equator part of sediment particles, which is Na = fc Nlocal = DNlocal/H, where fc = the compensation factor; D = the median diameter of suspended sediment particles, μm; H = the height of the below-equator part of sediment particles that is used for counting E. coli, μm; Nlocal = the local attachment number of cells on the below-equator part of sediment particles. It is found that the number of attached cells on the front surface of the particles is roughly the same as that on the rear surface, which suggests that the assumption of a roughly uniform distribution of attached cells on particles is reasonable.
The average heights of the below-equator part of sediment particles were measured to be 9.48 μm, 12.50 μm and 27.78 μm for diameter groups of 8–16 μm, 16–31 μm, and 31–62 μm, respectively.
2.6. Estimating of Approaching Cells
Counting the number of cells contacting a single selected particle requires a very long time to obtain statistically meaningful counting results with the current setup, which makes this impractical. Therefore, the number of approaching cells was estimated based on fluid mechanics.
The E. coli suspension was continuously injected into the flow-cell channel with a constant flow rate of 3.0 mL/h at 25 °C. At this flow rate, the velocity in the flow cell is approximately 208 μm/s, much greater than the swimming speed of E. coli (~20 μm/s) [34]. These conditions are similar to the case of typical surface waters, where the flow velocity is much greater and planktonic E. coli can be considered to be carried by water flow while the active movement can be neglected [34]. E. coli in the channel is pulled away by the flow, and because the Reynolds number is very low (<<1) and the flow follows Stokes flow.
During a time period of t, we can estimate the number of cells that have approached a particle (entered the adjacent area) Nap using Equation (2):
where Φ1 = the flux of E. coli at the adjacent area, count/(μm2·s); t = time period, s; S = the projected area of the adjacent area perpendicular to the flow direction, which was a circular ring, μm2; u1 = the flow velocity at the adjacent area, μm/s; l = distance between the particle surface and the boundary of adjacent area, μm; R0 = the radius of particle, μm; = the average concentration of planktonic bacteria, cfu/L.
Here, we use the average concentration of planktonic bacteria () to simplify the calculation. This assumption is reasonable because we selected many particles randomly and used the average cell concentration to obtain the overall number of approaching cells. was measured by standard membrane filtration procedures. Furthermore, we used a direct counting method under a microscope to calculate and obtained consistent results (Supplementary Materials Figure S1). However, it is worth mentioning that Cw may not be constant throughout the channel due to ‘shear trapping’. Some motile cells, such as E. coli, tend to be depleted in the low-shear region and accumulate in the high-shear region due to the alignment of the swimming direction with fluid streamlines caused by shear forces [35].
u1 can be expressed as Equation (3) according to the theoretical solution of Stokes flow:
where U0 = average velocity, μm/s.
Thus, Nap can be calculated with Equation (4):
where Φp = U0·Cw, the flux of non-particle-associated E. coli that is directly measured, count/(μm2·s).
2.7. Attachment Probability Per Approach and Per Contact
We define attachment probability per approach as Equation (5):
where Na is the number of cells that are ultimately attached to a particle, while Nap is the number of cells that have ever approached the particle.
Furthermore, we introduce the attachment probability per contact, pc. After approaching the particles, cells need to directly contact the surface to initiate attachment [33]. However, not every cell-particle contact can lead to attachment. E. coli in contact with particles can still escape from the near-surface regions of the particles. Tumbling, identified as rapid changes in swimming direction, is one of the influencing factors [36]. Therefore, pc reflects the influence of biological and chemical properties of cells and particles on attachment while excluding the effect of external hydrodynamic conditions. pc can be calculated as the attachment probability per approach, dividing the number of contacts by the number per approach. In the microfluidic experiment, i.e., under laminar flow, the larger the size of the particle, the longer distance cells would move to pass through the particle and thus lead to higher contact frequency. The contact number per approach is assumed to be proportional to the particle size. Thus, pc can be expressed as Equation (6):
3. Results and Discussion
3.1. The Time Evolution of the Number of Attached Cells on Both Sediment and Glass Particles with Different Sizes
The variation in the number of attached E. coli with time is plotted in Figure 2. The number of attached cells increases with time for all tested particles. At early time points, the number of attached cells increases approximately linearly with time. The approximate linear relation shown by the early stage (for example, the 0–12 h part of the curve for 10 μm sediment particles) indicates that existing attachments might have little influence on subsequent attachment because the attached cells are few and are distributed sparsely on particles (see Figure 1c). This observation is consistent with common circumstances in most surface waters. The E. coli concentration in surface waters is often in the range of 101~105 cfu/L [5]. In a typical water environment [37], where the suspended sediment concentration is 0.5 g/L and the average equivalent diameter of suspended sediment is 30 μm, it can be calculated that the number density of suspended sediment is more than 107 L−1. Therefore, the number of suspended sediment particles is much larger than the number of E. coli cells, and only a minority of particles would have attached cells on them. In this case, the attached cells on particles are so sparse that they would not affect subsequent attachments.
The number of attached cells on the same type of particle increases with the diameter for both sediment particles and glass microspheres. Compared with glass microspheres, more cells are attached to sediment particles than to glass microspheres with equivalent sizes. For example, the number of cells attached to 20 μm particles at 20 h is approximately 21 for sediment particles and 11 for glass microspheres. Since sediment particles and glass microspheres have similar compositions that mainly contain silica compounds, the preferential attachment on sediment particles is likely due to the surface morphology of those particles, as the surface of a sediment particle is rough and contains high-curvature spots, whereas the surface of a glass microsphere is relatively smooth (Supplementary Materials Figures S2 and S3). It was reported that sediment surface morphology, such as local concave and convex areas, can affect surface charge distribution and thus influence the adsorption of phosphorus [38]. However, to what extent the surface morphology affects bacterial attachment requires further study.
3.2. Attachment Probability of Cells and Its Relation with the Size of Particles
The cell-particle approach number Nc was obtained from time t via Equation (2) while = 5.4 × 10⁹ cfu/L. The result is also plotted in Figure 2. From the resulting curves of Na vs. Nap, by linearly fitting the early time part of the curves (i.e., before the curves reach a plateau), we can obtain the attachment probabilities, which are the slopes of the fitting lines. For 10 μm sediment, the data from the initial 10 h were used for the linear fitting, and for other particles, the data from the initial 15 h were used. The obtained attachment probabilities for sediment particles and glass microspheres with different sizes are shown in Figure 3.
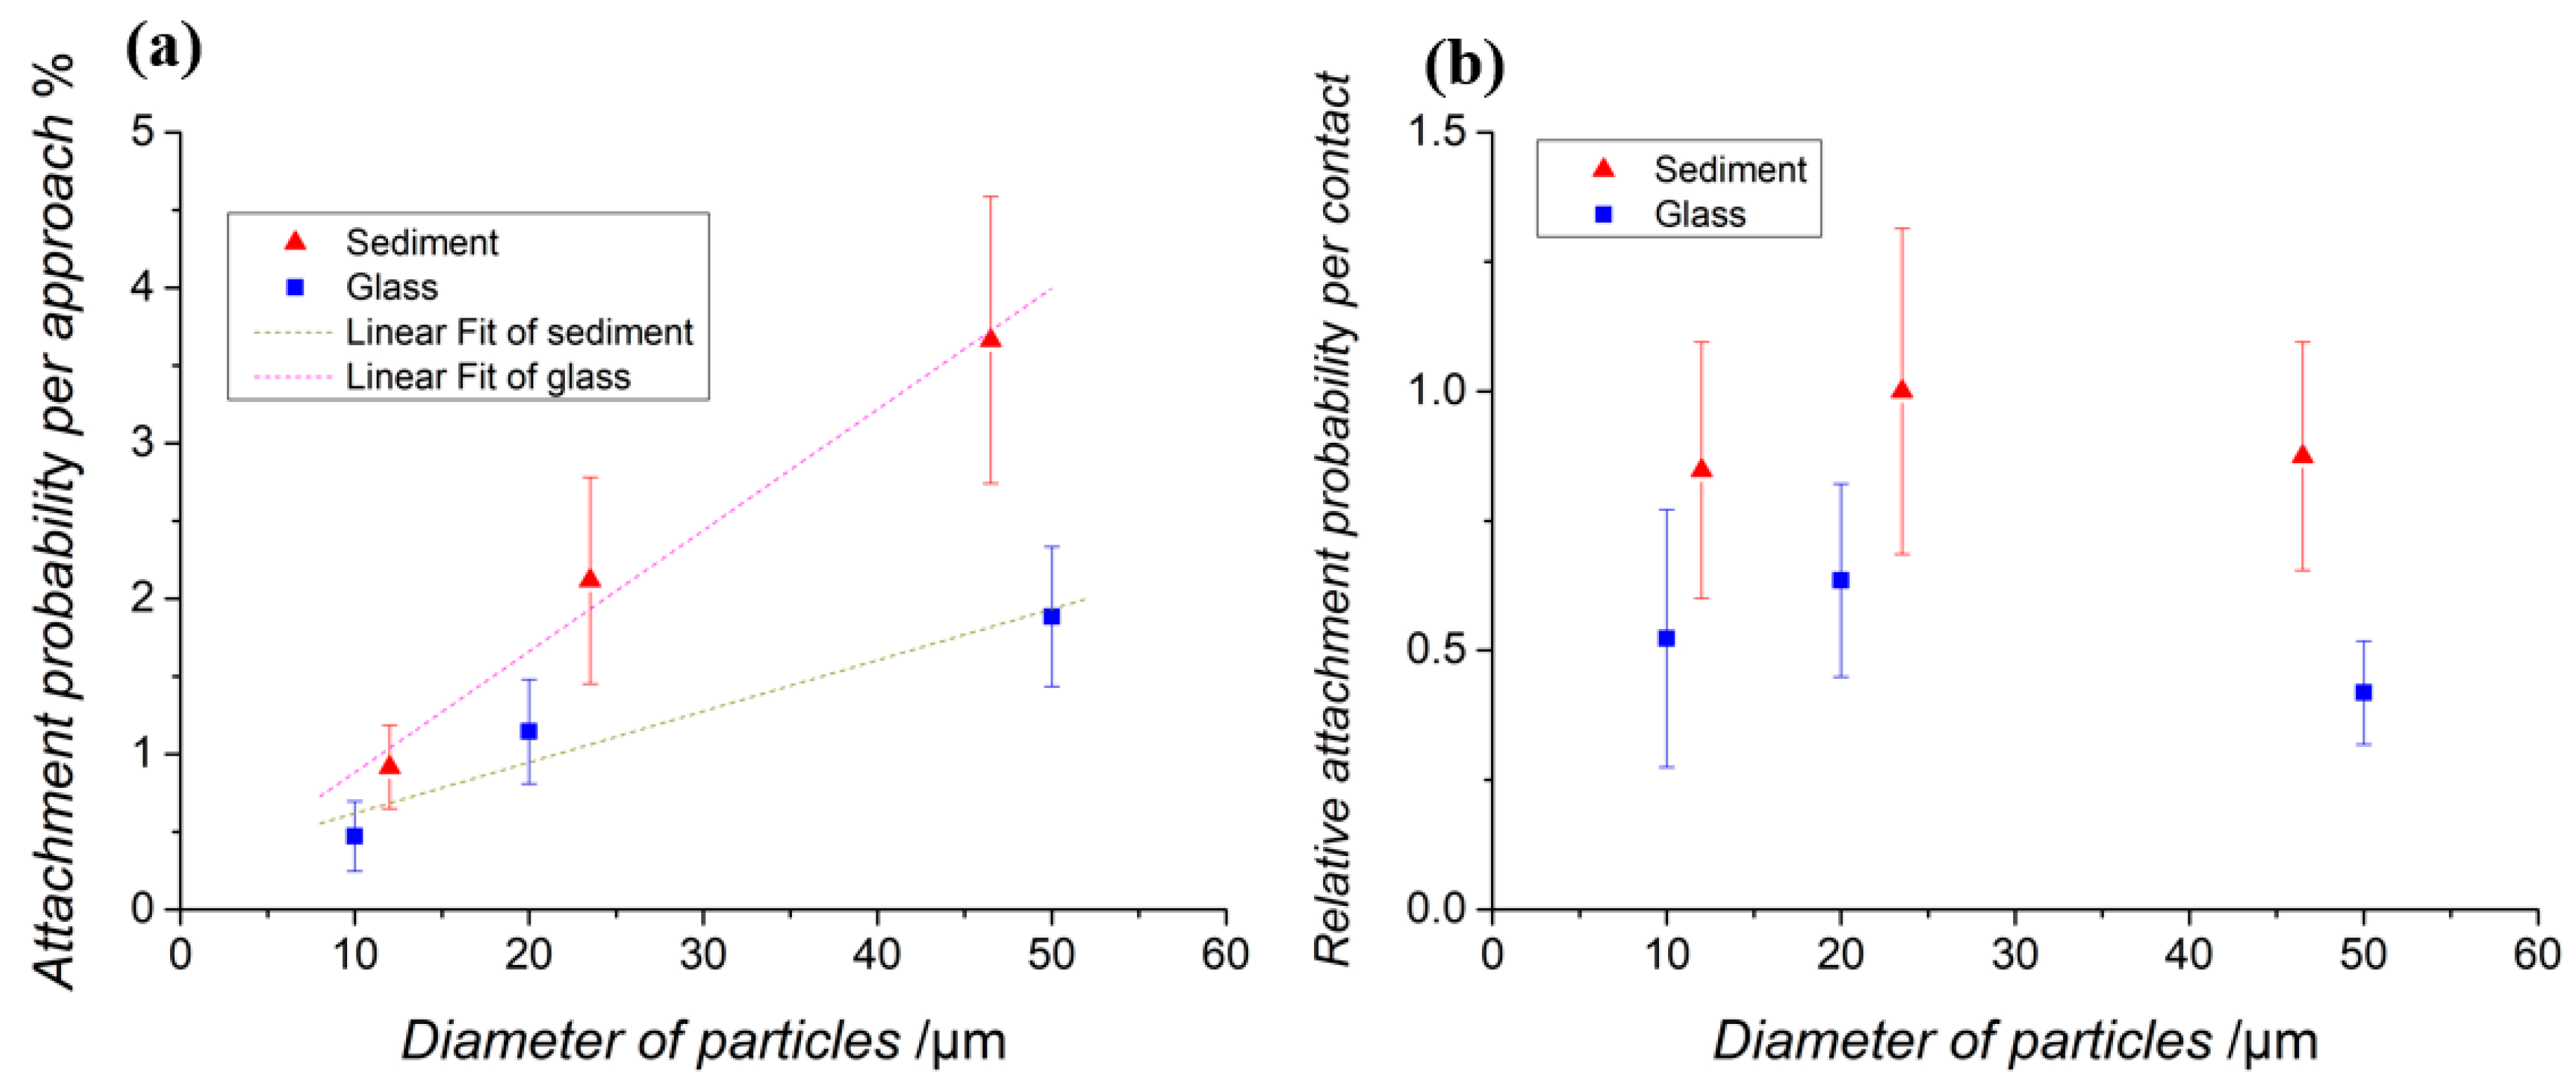
As shown in Figure 3a, the attachment probability per approach increases with diameters for both sediment and glass particles, indicating that under laminar flow, E. coli cells have a higher probability of attaching to larger particles with each approach. The relative values of attachment probability per contact calculated based on Equation (6) are shown in Figure 3b. There is little difference between pc for particles with different sizes. Thus, the attachment number is dependent on the total cell-particle contact number, and the influence of particle size on E. coli attachment is more likely reflected through an impact on hydrodynamic conditions than through an impact on surface properties. The results also verify Hispsey’s assumption (2008) that the attachment probability per unit surface area could be considered the same for sediments within the size range of 8–62 μm [39]. Although the attachment probability on sediment with different grain sizes could be considered the same from statistical perspectives, it is likely that there exists a preferred attachment surface in single sediment particles.
The ratios of attachment probability between sediment particles and glass microspheres are 2.0, 1.9, and 1.9 for particle sizes of 10 μm, 20 μm, and 50 μm, respectively. The roughly constant value of this ratio might indicate the intrinsic nature of the surface properties of particles. The results also indicate that most cells (>95%) that approached the particles did not attach and passed through the surface.
A regression analysis was carried out, and linear relationships between the attachment probability per approach and the particle size were obtained as shown in Equation (7) and Equation (8) (within the range of 8–62 μm).
3.3. Conceptualization of the Partition Coefficient and its Relation with the Attachment Probability Per Approach and the Particle Size
To better understand the behavior of bacterial attachment on particles, we conceptualized the partition coefficient of the widely used linear partition model based on the microscopic experimental measurements of bacterial attachment.
When the attachment of E. coli reaches an equilibrium, the attached number of E. coli per unit time would be equal to the detached number of E. coli per unit time, which is expressed in Equation (9):
where NEw = the number of E. coli in the water column, cfu; ra = the attachment rate, s−1; NEs = the number of attached E. coli, cfu; rd = the detachment rate, s−1.
The attachment rate ra is proportional to the total cell-particle contact number and attachment probability per contact. It is reasonable to assume that the cell-particle contact number is proportional to the available area of the particle. A similar relationship was also used in an earlier work [39]. Then, ra can be expressed as ra ∝ As·pc, here As is the total surface area provided by all particles per unit water volume, and As = 6 s/(ρsD) given ρs = the density of suspended sediment particles.
Combining Equation (6), the attachment rate ra can be expressed as:
where λ = the attachment rate coefficient. By substituting Equation (10) into Equation (9) and dividing by the water volume V on both sides, Equation (11) is obtained:
Comparing Equation (11) with Equation (1), we can obtain the partition coefficient k of the linear partition model expressed with microscopic parameters such as the attachment probability per approach pap: k = λpap/ρsD2rd. The attachment rate coefficient λ is related to external hydrodynamic conditions. Bacterial detachment would occur most likely when the shear stress of flow exceeds a threshold. Of course, cell properties and factors influencing cell itself, such as EPS, matrix-degrading enzymes and nutrient levels, etc. may also affect bacterial detachment [40]. However, the detachment would be less affected by the particle size. Therefore, it is reasonable to treat the detachment rate rd as a constant when flow conditions are set. Then, the partition coefficient can be expressed as Equation (12).
where λa = λa/rd is independent of particle size. Combining Equations (7) and (12), the partition coefficient would have a negative correlation with D, and this agrees with previous literature reports [14,15].
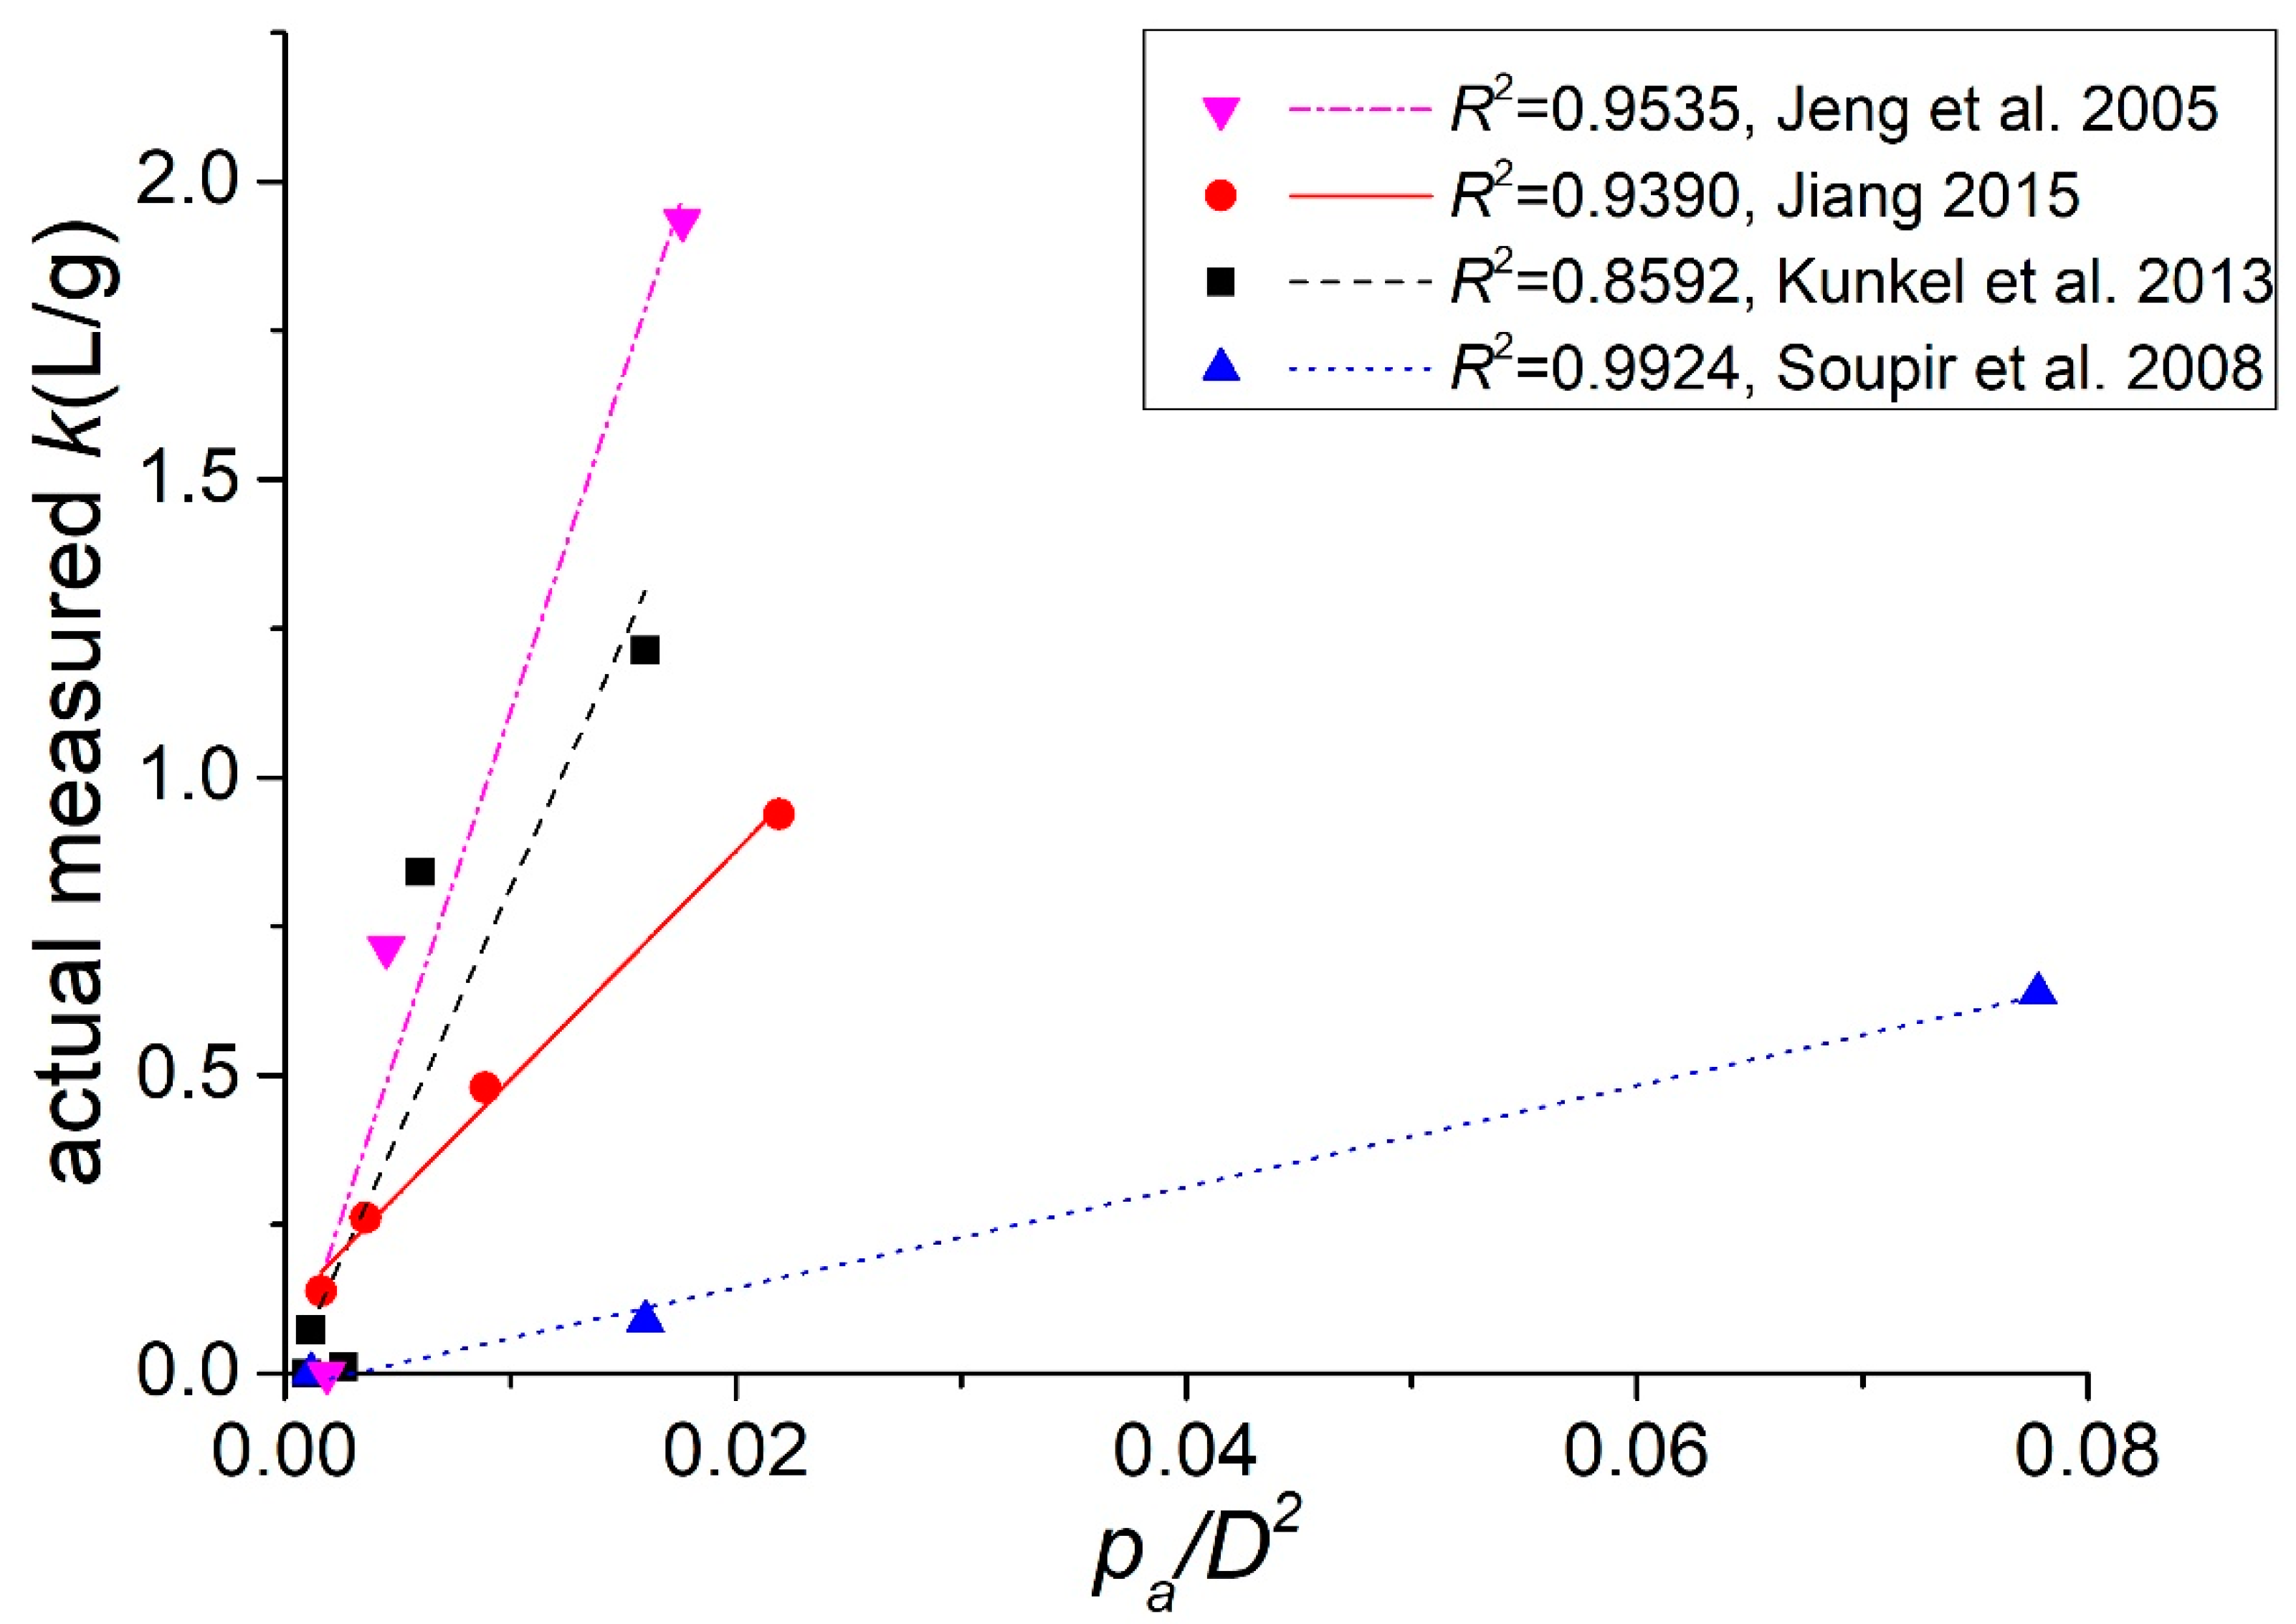
Equation (12) indicates a linear relationship between the partition coefficient k and the ratio of pap/D2. To test this relation, we applied it to data from the published literature and examined its validity. First, for different sized particles used in the literature data, we calculated pap/D2 using the regression function in Equation (7). Then, the measured values of k in the literature were plotted against the calculated pap/D2 as shown in Figure 4. All the data can be well fitted linearly. The slope, which equals λa/ρs in Equation (12), varies because λa is related to system-dependent external hydrodynamic conditions and thus is different for different works [1,14,15,41]. The good results of linear fitting suggest the validity of the linear relation between k and pap/D2. Moreover, considering that those previous results were measured by different groups at the macro level, Equation (12) is derived from a microscopic picture of bacterial attachment, so the agreement between earlier reported experimental results and Equation (12) indicates a generality of the obtained linear relation between k and pap/D2. However, due to the limited size range that the data covered, to what extent Equation (12) can be effectively used needs to be further studied.
4. Conclusions
In this work, bacterial attachment to sediment and glass particles of different sizes was directly observed. Our experiments separated the process of bacterial approach to particles from the process of initializing attachment after direct contact. The results showed that the particle size of sediments is the mainly influence on the number of cells that approach and directly contact the sediment particle. However, there is little difference in initializing attachment after direct contact when particle sizes changed.
In addition, the attachment probability per approach and per contact on sediment particles were found to be higher than those on glass microspheres with equivalent sizes under similar conditions. This difference in attachment is probably due to the different surface morphologies between sediment and glass particles. Work is underway to reveal the effect of sediment surface heterogeneity on E. coli attachment.
Based on the widely used linear partition model, we conceptualized the partition coefficient by incorporating the experimentally measured positive correlation between the attachment probability per approach and the particle size. The obtained expression of the partition coefficient k (Equation (9)) indicates a linear relation between k and the ratio pap/D2, which is quantitatively verified using data from the published literature. The work herein introduces a new way to study attachment and distribution of indicator bacteria to sediments at a single-cell resolution by combining bacterial tracking methods and microfluidic devices. Both physical and biochemical processes influence bacterial attachment to sediments. However, as shown in this work, we can separate and study the factors influencing the different stages of bacterial attachment individually. We hope this study will inspire additional work in the future to provide further details at the microscopic level for cell-particle interactions and to develop a comprehensive ecological model that could account for both attachment and detachment of E. coli on sediments, which will help to improve control over the contamination level of surface waters.
Supplementary Materials
The following are available online at https://www.mdpi.com/2073-4441/11/4/819/s1, Figure S1: E. coli flux measurement and results. (a) Picked positions for measuring E. coli flux in the cross-section of the channel. (b) The cumulative average of E. coli flux at selected positions, Figure S2: Scanning electron microscope (SEM) micrographs of glass microspheres. (a) 10 μm microspheres at low magnification (× 10k); (b) 10 μm microspheres at high magnification (× 30k); (c) 20 μm microspheres at low magnification (× 10k); (d) 20 μm microspheres at high magnification (× 30k); (e) 50 μm microspheres at low magnification (× 3.6k); (f) 50 μm microspheres at high magnification (× 20k), Figure S3: SEM micrographs of sediment particles. (a) 10 μm sediment particles at low magnification (× 10k); (b) 10 μm sediment particles at high magnification (× 30k); (c) 20 μm sediment particles at low magnification (× 3k); (d) 20 μm sediment particles at high magnification (× 10k); (e) 50 μm sediment particles at low magnification (× 3k); (f) 50 μm sediment particles at high magnification (× 10k).
Author Contributions
Conceptualization: D.Z., K.Z., and Y.C.; Investigation: T.W., C.Z., and J.Z.; Methodology: T.W., D.Z., and K.Z.; Visualization: T.W.; Writing—Original Draft: T.W; Writing—Review and Editing: T.W., C.Z., J.Z., D.Z., K.Z., and Y.C.; Funding Acquisition: D.Z. and K.Z.
Funding
This work was funded by the National Natural Science Foundation of China (91647107 to D.Z. and 21573159 to K.Z.) and the Tianjin Municipal Natural Science Foundation Grant (15JCZDJC41100).
Acknowledgments
Danxun Li of Tsinghua University is acknowledged for providing helpful comments and discussion.
Conflicts of Interest
The authors declare no conflict of interest.
References
- Soupir, M.L.; Mostaghimi, S.; Love, N.G. Method to partition between attached and unattached E. coli in runoff from agricultural lands. J. Am. Water Resour. Assoc. 2008, 44, 1591–1599. [Google Scholar] [CrossRef]
- Schillinger, J.E.; Gannon, J.J. Bacterial adsorption and suspended particles in urban stormwater. J. Water Pollut. Control Fed. 1985, 57, 384–389. [Google Scholar]
- Davies, C.M.; Long, J.A.H.; Donald, M.; Ashbolt, N.J. Survival of fecal microorganisms in marine and freshwater sediments. Appl. Environ. Microbiol. 1995, 61, 1888–1896. [Google Scholar] [PubMed]
- Burton, G.A.; Gunnison, D.; Lanzai, G.R. Survival of pathogenic bacteria in various freshwater sediments. Appl. Environ. Microbiol. 1987, 53, 633–638. [Google Scholar] [PubMed]
- Pachepsky, Y.A.; Shelton, D.R. Escherichia Coli and Fecal Coliforms in Freshwater and Estuarine Sediments. Crit. Rev. Environ. Sci. Technol. 2011, 41, 1067–1110. [Google Scholar] [CrossRef]
- Donovan, E.P.; Staskal, D.F.; Unice, K.M.; Roberts, J.D.; Haws, L.C.; Finley, B.L.; Harris, M.A. Risk of gastrointestinal disease associated with exposure to pathogens in the sediments of the Lower Passaic River. Appl. Environ. Microbiol. 2008, 74, 1004–1018. [Google Scholar] [CrossRef]
- Cizek, A.R.; Characklis, G.W.; Krometis, L.A.; Hayes, J.A.; Simmons, O.D., 3rd; Di Lonardo, S.; Alderisio, K.A.; Sobsey, M.D. Comparing the partitioning behavior of Giardia and Cryptosporidium with that of indicator organisms in stormwater runoff. Water Res. 2008, 42, 4421–4438. [Google Scholar] [CrossRef]
- Fries, J.S.; Characklis, G.W.; Noble, R.T. Attachment of Fecal Indicator Bacteria to Particles in the Neuse River Estuary, N.C. J. Environ. Eng. 2006, 132, 1338–1345. [Google Scholar] [CrossRef]
- Aueg, M.T.; Niehaus, S.L. Modeling fecal coliform bacteria-I. Field and laboratory determination of loss kinetics. Water Res. 1993, 27, 693–701. [Google Scholar]
- Mahlera, B.J.; Personne, J.-C.; Lodsa, G.F.; Droguea, C. Transport of free and particulate-associated bacteria in karst. J. Hydrol. 2000, 238, 179–193. [Google Scholar] [CrossRef]
- George, I.; Anzil, A.; Servais, P. Quantification of fecal coliform inputs to aquatic systems through soil leaching. Water Res. 2004, 38, 611–618. [Google Scholar] [CrossRef]
- Guber, A.K.; Pachepsky, Y.A.; Shelton, D.R.; Yu, O. Effect of bovine manure on fecal coliform attachment to soil and soil particles of different sizes. Appl. Environ. Microbiol. 2007, 73, 3363–3370. [Google Scholar] [CrossRef] [PubMed]
- Soupir, M.L.; Mostaghimi, S.; Dillaha, T. Attachment of Escherichia coli and enterococci to particles in runoff. J. Environ. Qual. 2010, 39, 1019–1027. [Google Scholar] [CrossRef]
- Jeng, H.; England, A.; Bradford, H. Indicator Organisms Associated with Stormwater Suspended Particles and Estuarine Sediment. J. Environ. Sci. Health Part A 2005, 40, 779–791. [Google Scholar] [CrossRef]
- Kunkel, E.A.; Privette, C.V.; Sawyer, C.B.; Hayes, J.C. Attachment of Escherichia coli to fine sediment particles within construction sediment basins. Adv. Biosci. Biotechnol. 2013, 4, 407–414. [Google Scholar] [CrossRef]
- Oliver, D.M.; Clegg, C.D.; Heathwaite, A.L.; Haygarth, P.M. Preferential Attachment of Escherichia coli to Different Particle Size Fractions of an Agricultural Grassland Soil. Water Air Soil Pollut. 2007, 185, 369–375. [Google Scholar] [CrossRef] [Green Version]
- Bai, S.; Lung, W.S. Modeling sediment impact on the transport of fecal bacteria. Water Res. 2005, 39, 5232–5240. [Google Scholar] [CrossRef] [PubMed]
- Jiang, L.; Chen, Y.C.; Zhu, D.J.; Liu, Z.W. Faecal coliform attachment to settleable suspended sediments in fresh surface waters: Linear partition model validation and sediment concentration effects. Water Sci. Technol. Water Supply 2015, 15, 864. [Google Scholar] [CrossRef]
- Ling, T.Y.; Achberger, E.C.; Drapcho, C.M.; Bengtson, R.L. Quantifying adsorption of an indicator bacteria in a soil-water system. Trans. ASAE 2002, 45, 669–674. [Google Scholar]
- Gantzer, C.; Gillerman, L.; Kuznetsov, M.; Oron, G. Adsorption and survival of faecal coliforms, somatic coliphages and F-specific RNA phages in soil irrigated with wastewater. Water Sci. Technol. 2001, 43, 117–124. [Google Scholar] [CrossRef]
- Burge, W.D.; Enkiri, N.K. Virus adsorption by five soils. J. Environ. Qual. 1978, 7, 73–76. [Google Scholar] [CrossRef]
- Drewry, W.A.; Eliassen, R. Virus movement in groudwater. J. Water Pollut. Control Fed. 1968, 40, 257–271. [Google Scholar]
- Krometis, L.A.; Dillaha, T.A.; Love, N.G.; Mostaghimi, S. Evaluation of a filtration/dispersion method for enumeration of particle-associated Escherichia coli. J. Environ. Qual. 2009, 38, 980–986. [Google Scholar] [CrossRef] [PubMed]
- Goulder, R. Attached and free bacteria in an estuary with abundant suspended solids. J. Appl. Bacteriol. 1977, 43, 399–405. [Google Scholar] [CrossRef]
- Ahmed, T.; Shimizu, T.S.; Stocker, R. Microfluidics for bacterial chemotaxis. Integr. Biol. 2010, 2, 604. [Google Scholar] [CrossRef] [Green Version]
- Keymer, J.E.; Galajda, P.; Muldoon, C.; Park, S.; Austin, R.H. Bacterial metapopulations in nanofabricated landscapes. Proc. Natl. Acad. Sci. USA 2006, 103, 17290–17295. [Google Scholar] [CrossRef] [Green Version]
- Seymour, J.R.; Simo, R.; Ahmed, T.; Stocker, R. Chemoattraction to dimethylsulfoniopropionate throughout the marine microbial food web. Science 2010, 329, 342–345. [Google Scholar] [CrossRef]
- Son, K.; Brumley, D.R.; Stocker, R. Live from under the lens: Exploring microbial motility with dynamic imaging and microfluidics. Nat. Rev. Microbiol. 2015, 13, 761–775. [Google Scholar] [CrossRef] [PubMed]
- Gibiansky, M.L.; Conrad, J.C.; Jin, F.; Gordon, V.D.; Motto, D.A.; Mathewson, M.A.; Stopka, W.G.; Zelasko, D.C.; Shrout, J.D.; Wong, G.C.L. Bacteria Use Type IV Pili to Walk Upright and Detach from Surfaces. Science 2010, 330, 197. [Google Scholar] [CrossRef] [PubMed]
- Zhao, K.; Tseng, B.S.; Beckerman, B.; Jin, F.; Gibiansky, M.L.; Harrison, J.J.; Luijten, E.; Parsek, M.R.; Wong, G.C.L. Psl trails guide exploration and microcolony formation in Pseudomonas aeruginosa biofilms. Nature 2013, 497, 388–391. [Google Scholar] [CrossRef] [PubMed]
- Ren, Y.; Wang, C.; Chen, Z.; Allan, E.; van der Mei, H.C.; Busscher, H.J. Emergent heterogeneous microenvironments in biofilms: Substratum surface heterogeneity and bacterial adhesion force-sensing. FEMS Microbiol. Rev. 2018, 42, 259–272. [Google Scholar] [CrossRef] [PubMed]
- Sternberg, C.; Tolker-Nielsen, T. Growing and analyzing biofilms in flow cells. Curr. Protoc. Microbiol. 2006, 1B. 2.1–1B. 2.15. [Google Scholar]
- Berne, C.; Ellison, C.K.; Ducret, A.; Brun, Y.V. Bacterial adhesion at the single-cell level. Nat. Rev. Microbiol. 2018, 16, 616–627. [Google Scholar] [CrossRef] [PubMed]
- Jamieson, R.; Joy, D.M.; Lee, H.; Kostaschuk, R.; Gordon, R. Transport and deposition of sediment-associated Escherichia coli in natural streams. Water Res. 2005, 39, 2665–2675. [Google Scholar] [CrossRef] [PubMed]
- Barry, M.T.; Rusconi, R.; Guasto, J.S.; Stocker, R. Shear-induced orientational dynamics and spatial heterogeneity in suspensions of motile phytoplankton. J. R. Soc. Interface 2015, 12, 20150791. [Google Scholar] [CrossRef] [PubMed] [Green Version]
- Molaei, M.; Barry, M.; Stocker, R.; Sheng, J. Failed escape: Solid surfaces prevent tumbling of Escherichia coli. Phys. Rev. Lett. 2014, 113, 068103. [Google Scholar] [CrossRef] [PubMed]
- Gray, J.R.; Glysson, G.D.; Turcios, L.M.; Schwarz, G.E. Comparability of Suspended-Sediment Concentration and Total Suspended Solids Data; US Geological Survey, Water-Resources Investigations Report: Reston, VA, USA, 2000; p. 20.
- Cui, Z.; Fang, H.; Huang, L.; Ni, K.; Reible, D. Effect of surface heterogeneity on phosphorus adsorption onto mineral particles: Experiments and modeling. J. Soils Sediments 2017, 17, 2887–2898. [Google Scholar] [CrossRef]
- Hipsey, M.R.; Antenucci, J.P.; Brookes, J.D. A generic, process-based model of microbial pollution in aquatic systems. Water Resour. Res. 2008, 44, W07408. [Google Scholar] [CrossRef]
- Jang, H.; Rusconi, R.; Stocker, R. Biofilm disruption by an air bubble reveals heterogeneous age-dependent detachment patterns dictated by initial extracellular matrix distribution. NPJ Biofilms Microb. 2017, 3, 6. [Google Scholar] [CrossRef] [Green Version]
- Jiang, L. Research on Faecal Coliforms Attachment to Suspended Sediments and Transfer Processses Near Sediment Water Interface in Surface Waters; Tsinghua University: Beijing, China, 2015. [Google Scholar]
Figure 1.
Schematic of a microfluidic system and a flow-cell channel. (a) Schematic of a microfluidic system: 1, syringe pump; 2, syringe; 3, flow cell; 4, inverted microscope; 5, waste container. (b) The definitions of the x-, y-, and z-axes in one channel of the flow cell: Z = 0 at the bottom of the channel. (c) E. coli attachment on a 50 μm sediment particle (left) and a 50 μm glass microsphere (right).

Figure 2.
Time evolution of bacterial attachment to particles of different sizes. (a,c,e) are for 10 μm, 20 μm, and 50 μm sediment particles, respectively; (b,d,f) are for 10 μm, 20 μm, and 50 μm glass microspheres, respectively. The results were obtained by averaging 30 samples for each type of particle. Red arrows show the final measured numbers of attachments.

Figure 3.
The relation between attachment probability and the diameter of particles for both sediment particles and glass microspheres. (a) The relation between pap and D. Lines are linear fittings of the corresponding data. (b) The relation between relative pc and D. The base pc was for 20 μm sediments.

Figure 4.
The relation between the calculated pap/D2 from Equation (9) and the measured k. Measured data were obtained from literature [1,14,15,41] and the corresponding partition coefficient was calculated for different particle sizes from 8 μm to 62 μm. Lines are linear fittings of the corresponding data.

© 2019 by the authors. Licensee MDPI, Basel, Switzerland. This article is an open access article distributed under the terms and conditions of the Creative Commons Attribution (CC BY) license (http://creativecommons.org/licenses/by/4.0/).
Share and Cite
MDPI and ACS Style
Wu, T.; Zhai, C.; Zhang, J.; Zhu, D.; Zhao, K.; Chen, Y. Study on the Attachment of Escherichia coli to Sediment Particles at a Single-Cell Level: The Effect of Particle Size. Water 2019, 11, 819. https://doi.org/10.3390/w11040819
AMA Style
Wu T, Zhai C, Zhang J, Zhu D, Zhao K, Chen Y. Study on the Attachment of Escherichia coli to Sediment Particles at a Single-Cell Level: The Effect of Particle Size. Water. 2019; 11(4):819. https://doi.org/10.3390/w11040819
Chicago/Turabian StyleWu, Tao, Chunhui Zhai, Jingchao Zhang, Dejun Zhu, Kun Zhao, and Yongcan Chen. 2019. "Study on the Attachment of Escherichia coli to Sediment Particles at a Single-Cell Level: The Effect of Particle Size" Water 11, no. 4: 819. https://doi.org/10.3390/w11040819
Note that from the first issue of 2016, this journal uses article numbers instead of page numbers. See further details here.