Article

The Study of Hydrogeochemical Environments and Microbial Communities along a Groundwater Salinity Gradient in the Pearl River Delta, China

1
Institute of Groundwater and Earth Sciences, Jinan University, Guangzhou 510632, China
2
State Key Laboratory of Desert and Oasis Ecology, Xinjiang Institute of Ecology and Geography, Chinese Academy of Sciences, Urumqi 830011, China
3
Cele National Station of Observation and Research for Desert-Grassland Ecosystem, Xinjiang Institute of Ecology and Geography, Chinese Academy of Sciences, Cele 848300, China
4
Department of Ecology, Jinan University, Guangzhou 510632, China
5
Laboratory of Marine Organism Taxonomy and Phylogeny, Institute of Oceanology, Chinese Academy of Sciences, Qingdao 266071, China
*
Authors to whom correspondence should be addressed.
Water 2019, 11(4), 804; https://doi.org/10.3390/w11040804
Submission received: 25 March 2019 / Revised: 11 April 2019 / Accepted: 15 April 2019 / Published: 18 April 2019
(This article belongs to the Section Hydrology)

Abstract

:
The salinization of groundwater is an issue in coastal areas because it causes the deterioration of freshwater resources, significantly impacting human livelihoods and ecosystems. This study integrated isotopic geochemical measurements with high-throughput sequencing of 16S rRNA gene amplicons to evaluate the source of groundwater salinity and the influence of hydrogeochemical variations on microbial communities under different salinity gradients in the Pearl River Delta of China. Results showed that the groundwater salinity in this area varied from fresh water in the inland area to brackish water, and then to saline water close to the southeast shoreline. The major ions (Na+, K+, Ca2+, Mg2+, Cl, NO3, SO42−, and HCO3) and isotope analyses (2H, 3H, 18O, and 14C) indicated that the groundwater in the confined aquifer was recharged by local precipitation and seawater. A further 14C analysis showed that the salinity of the groundwater was likely attributed to the Holocene transgression. Analysis of the microbial community showed that γ-proteobacteria were frequently observed in all the groundwater samples, while the other main microbial community at class level varied greatly, from β-proteobacteria in the freshwater wells to ε-proteobacteria in the brackish wells and to Bacilli in the saline wells. Exiguobacterium and Acinetobacter were dominant in saline water and the brackish water sample of Q144, while Sulfuricurvum dominated in the brackish water sample of Q143. Aeromonas, no rank Gallionellaceae, no rank Methylophilaceae, Acidovorax, and Comamonas unevenly thrived in the freshwater samples collected from different locations. Therefore, the distribution of microbial communities reflected the salinity and hydrogeochemical characteristics of a groundwater aquifer, and can be regarded as a potential environmental indicator in the groundwater.

1. Introduction

Many coastal cities are affected by salinization of groundwater because of various sources of induced salinity, including domestic and industrial wastewater [1], fossil seawater [2], as well as modern seawater intrusion [3]. In order to explore the source of groundwater salinity and the impacts of groundwater salinization on human livelihoods and ecosystems, some studies have been conducted to investigate the hydrogeochemical processes and variations of microbial communities in areas of seawater intrusion [2,3,4]. The research has demonstrated that seawater intrusion caused groundwater pollution and changes in microbial communities [5,6]. Moreover, the microorganisms in the groundwater ecosystems are sensitive to environmental changes and can be useful indicators for biomonitoring the chemical/biochemical pollutants [7]. Some researchers analyzed the relationships between microbial communities and hydrological chemistry, and concluded that the microbial analysis was a potential tool for monitoring the groundwater quality [3,4]. However, the microbial communities, distribution, and activity are greatly influenced by various aquifer conditions [8,9]. Therefore, understanding the composition of microbial assemblages, hydrological chemistry, and the relationship between biological activity and environmental condition would significantly improve our understanding of the complicated groundwater system and biogeochemical processes.
Seawater intrusion is a serious problem in China, which has a relatively long coastline (up to 18,000 km); almost 45% of the total population live in coastal areas [5]. The increasing demand for freshwater and over-exploitation of groundwater has significantly decreased the groundwater level and exacerbated the extent of seawater intrusion [10]. Many studies have simulated the influence of microbial community composition and biogeochemical processes affected by seawater intrusion in laboratory experiments [11,12]. However, the response of aquifer microbial communities to seawater intrusion has not been studied extensively in China [5]. Marina Hery [4] studied the bacterial community structure in the salt‒fresh water mixing zone created by seawater intrusion and concluded that the bacterial community structure of the aquifer at different depths had significant differences, and salinity was one of the most important driving factors. Therefore, it is of great significance to clarify the diversity and community structure of microorganisms in the aquifer to understand the distribution characteristics of subsurface microorganisms and the response to environmental disturbance of seawater intrusion.
The plain of the Pearl River Delta (PRD) is one of the most populous and economically dynamic regions in China, supplying water to 50 million people, but the groundwater in almost half of the area is saline [13,14]. Although water is available, not all of it is suitable for consumption due to groundwater pollution [15] and the continuing saltwater intrusion into the Pearl River Estuary [16]. However, the source of groundwater salinity is a much debated issue. Some studies indicated that the groundwater salinity probably originated from paleo-seawater [2,17] due to the Holocene transgression [18]. The application of isotope analysis technology has made it possible to reconstruct paleo-climate, trace subsurface flow regimes, and determine the directions of chemical or biological reactions [2,19]. For instance, the analysis of heavier 18O and 2H isotopes of water in regional water cycle has been broadly applied in many respects, such as moisture origin [20], precipitation recharge to groundwater [21], and transport process [22].
There have been several studies on the groundwater of PRD that included hydrogeochemical characteristics [17,23], microbial communities, and biogeochemical function [24]. However, the complex hydrogeochemical conditions of subsurface environments have made it difficult to completely understand the microbial assemblages and geochemical processes from just one subject. In recent years, multidisciplinary approaches have been applied to study the complicated underground environment [19,25,26]. For instance, Kim et al. [25] integrated methodologies of hydrogeology, molecular microbiology, and isotopic analysis to investigate the microbial community in an underground nitrogen pollution area, and concluded that comprehensive multidisciplinary research was a useful tool for tracing pollution sources and microbial processes. Though some microbial investigations on diversity and abundance have been managed in the Pearl River [27], riparian soil [28], and an aquifer-aquitard system [14], few multidisciplinary studies (e.g., molecular microbiology and hydrogeochemistry) have been conducted to determine the influence of hydrogeochemical variations on microbial communities under different salinity gradients in the PRD aquifers.
The primary purpose of this study was to explore the response of groundwater microbes to hydrogeochemical changes along freshwater to saline water gradients, and the potential role of microbial assemblages as an environmental indicator in hydrogeochemical investigations. To achieve this objective, groundwater samples were collected at several locations along a salinity gradient from inland to the South China Sea. Isotopic analyses, including 2H, 3H, and 18O in groundwater and 14C in dissolved organic carbon (DIC), were conducted to trace the sources of salinity and identify groundwater recharge characteristics. Furthermore, variations in diversity indices and the structure of microbial communities were estimated by a high-throughput DNA sequencing analysis. Finally, the relationships between microbes and the environment were investigated by combining the genetic profile results with various physicochemical parameters.

2. Materials and Methods

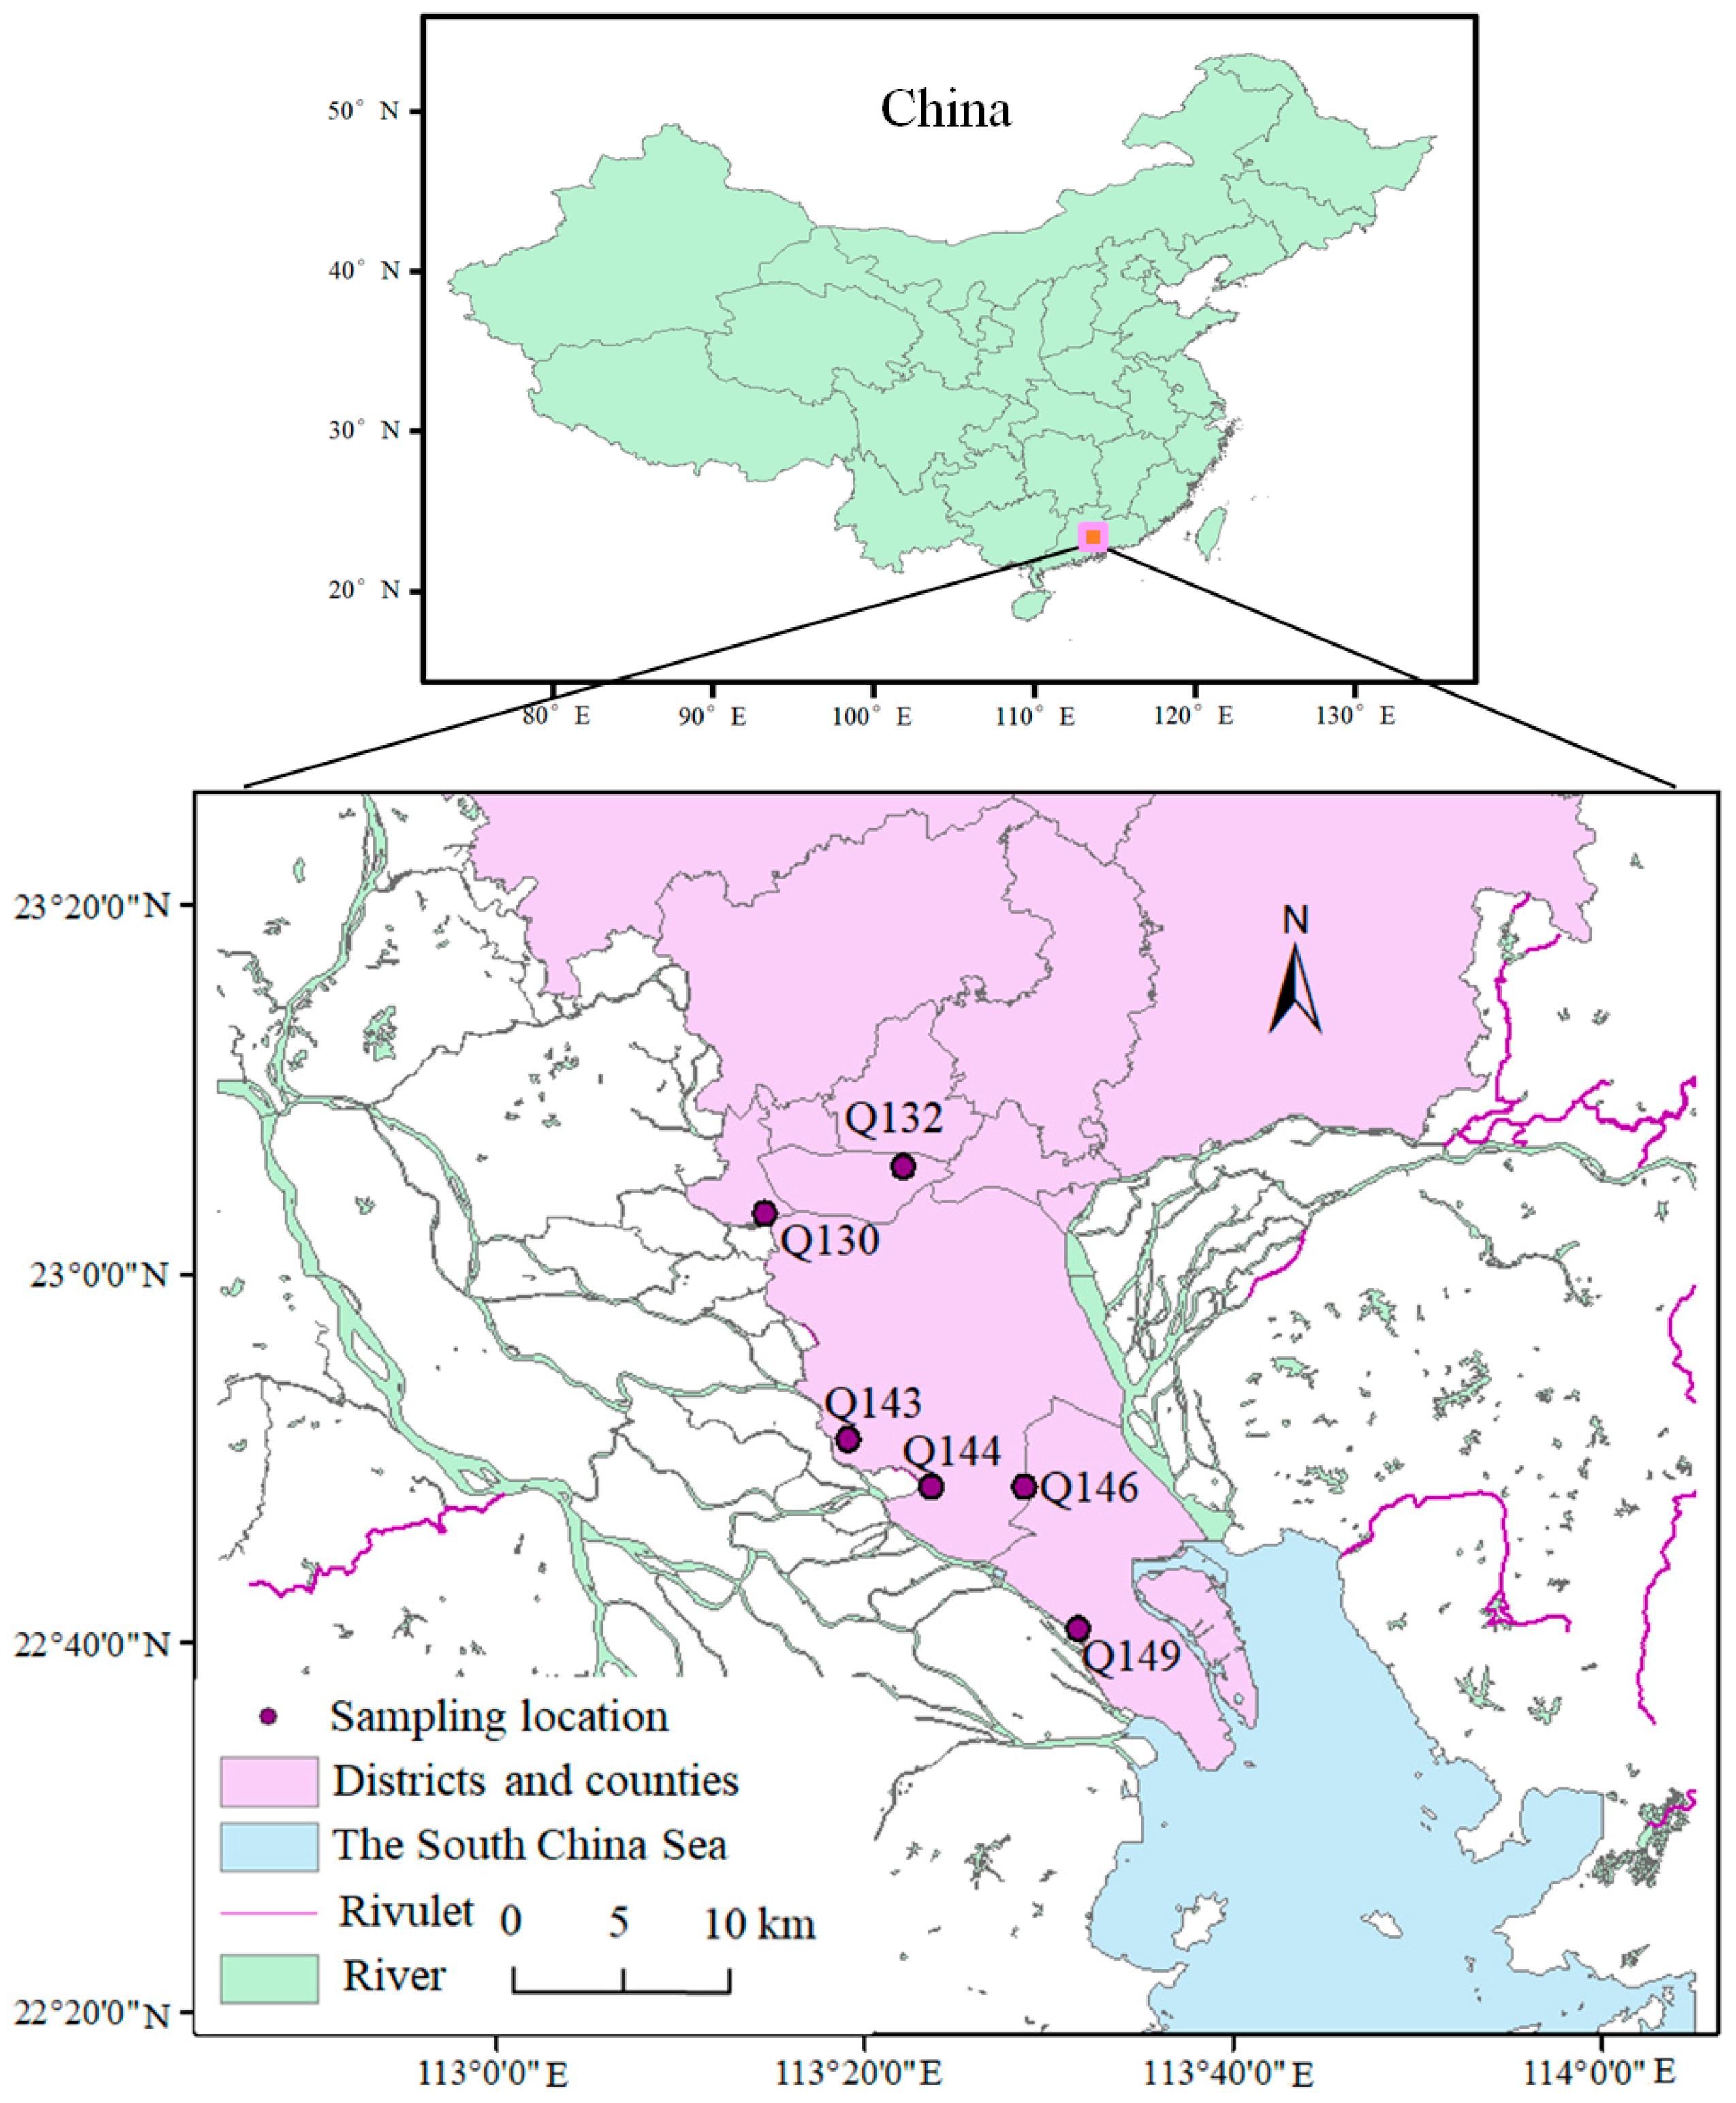
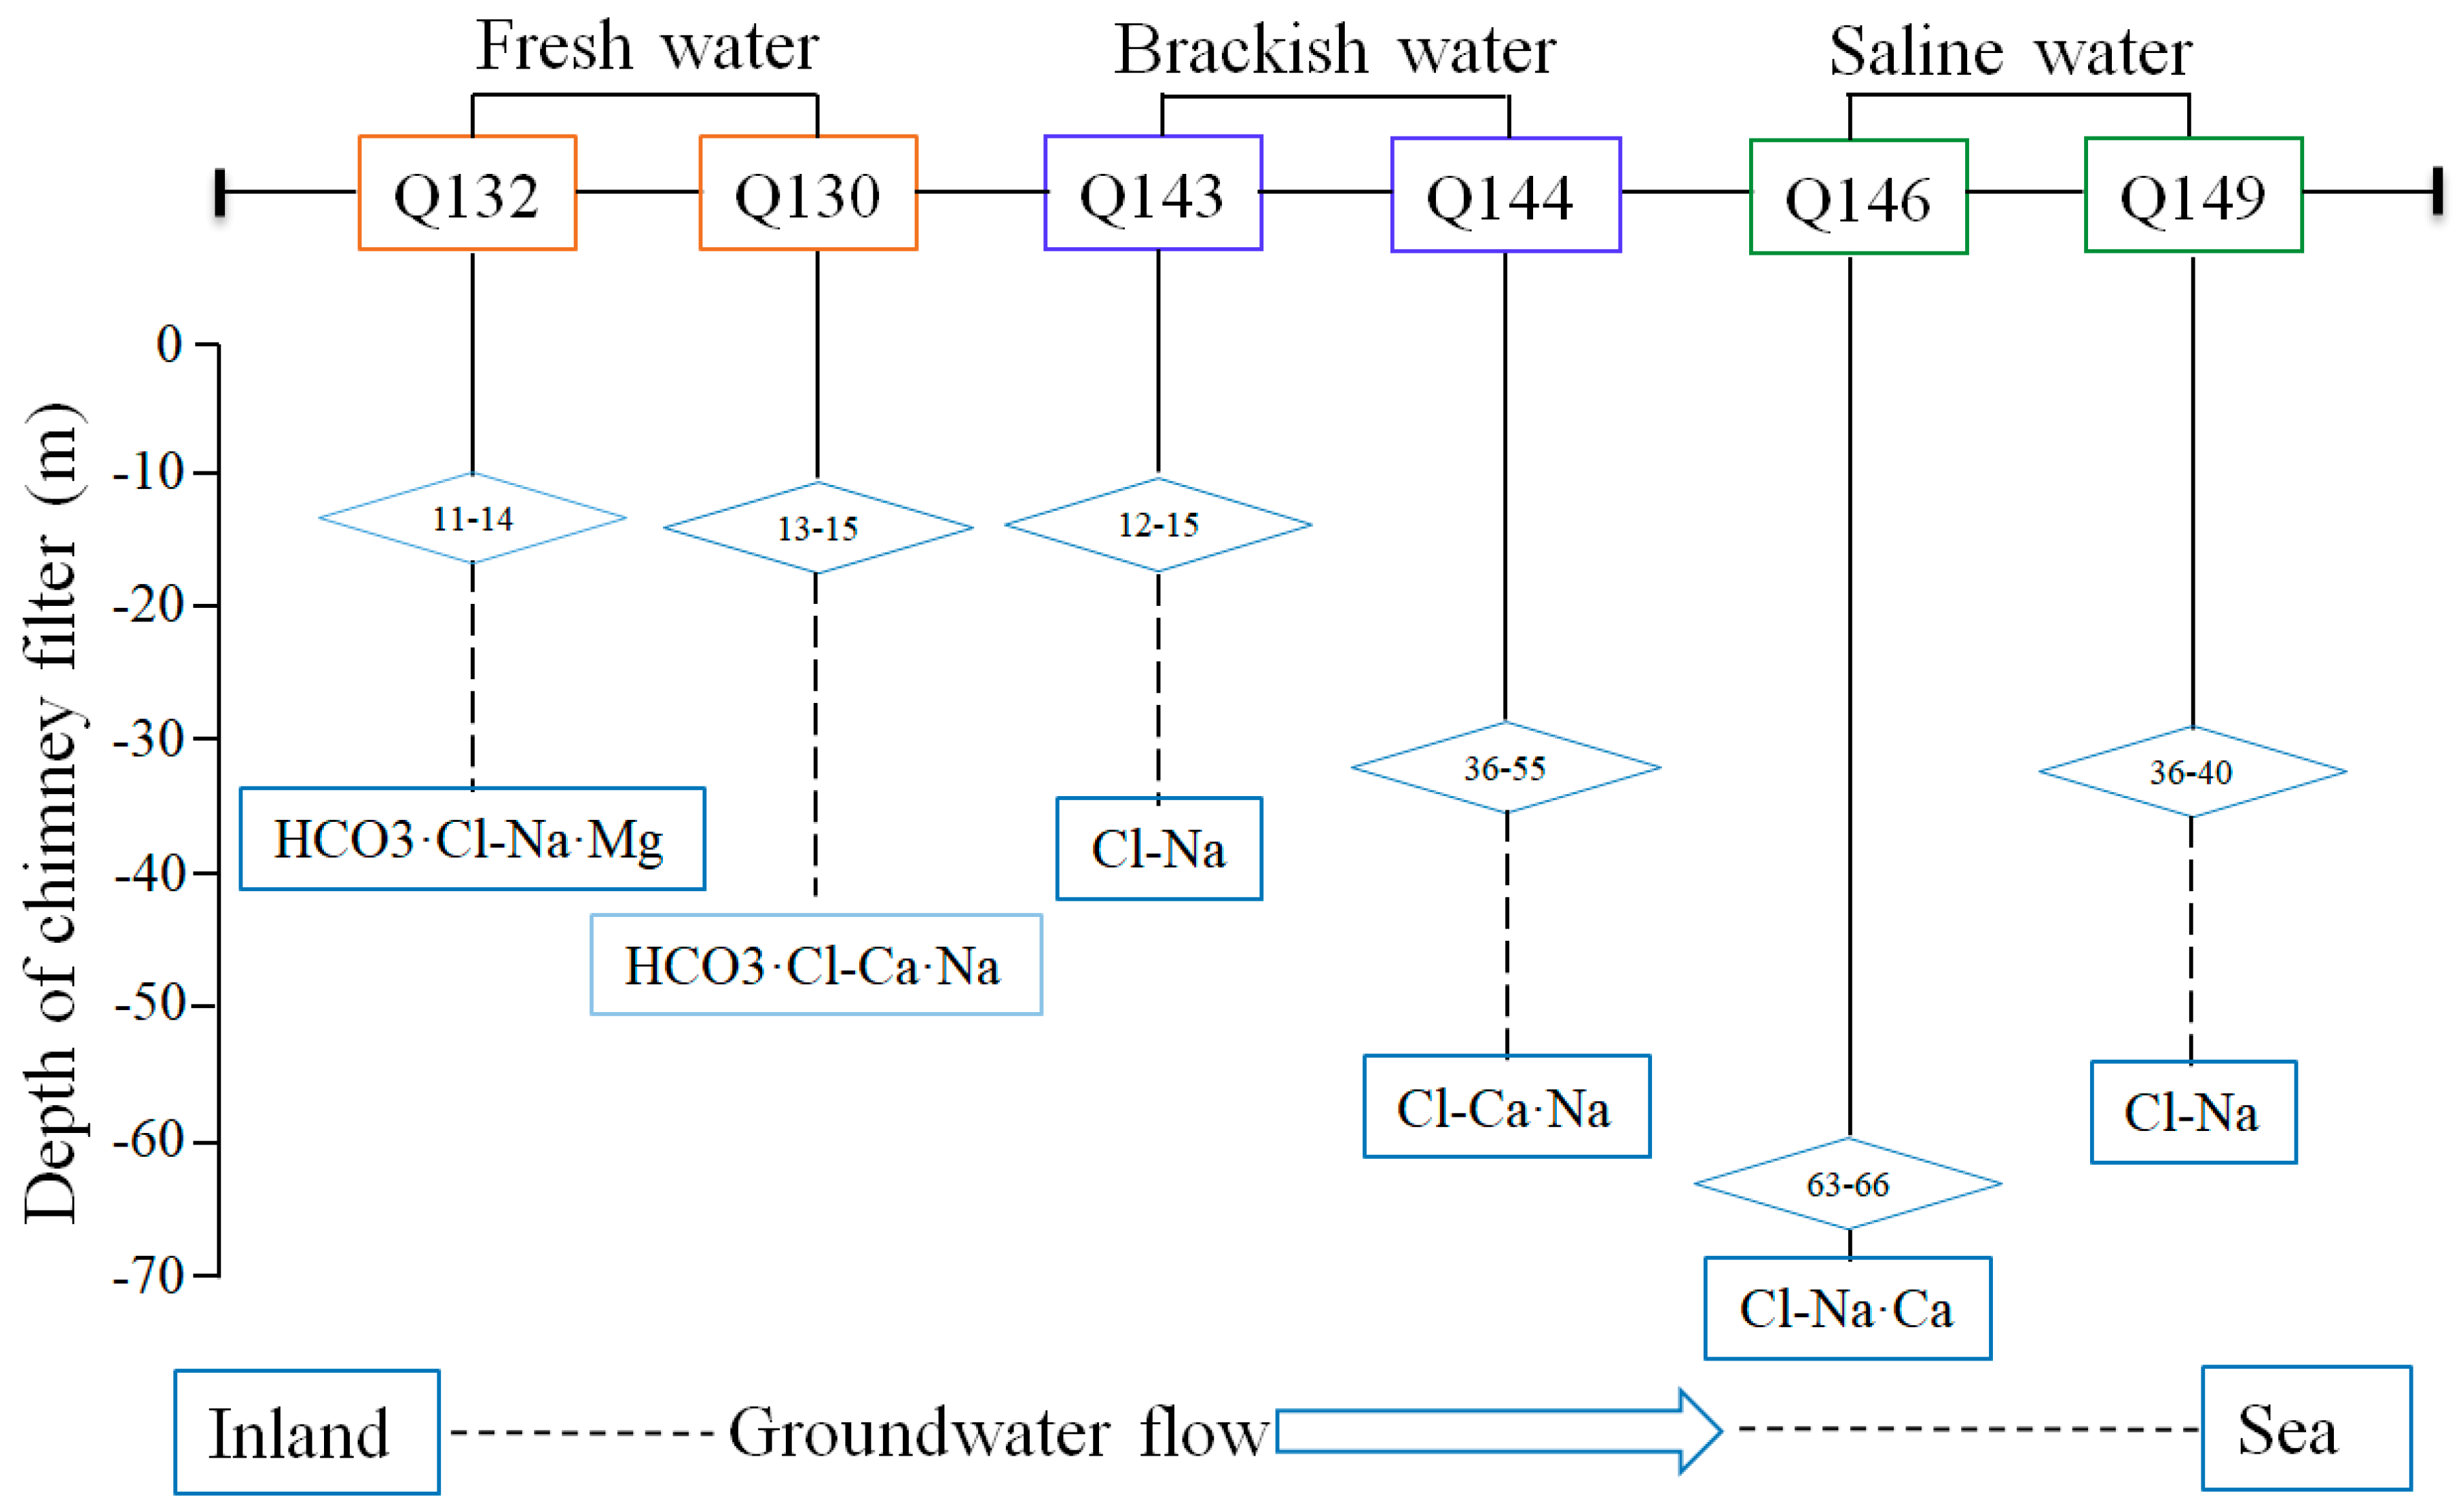
2.1. Site Description

The studied area is located at the PRD area, Guangzhou City, the southern area of south China (Figure 1). PRD belongs to a subtropical monsoon climate, with an annual average temperature of 21.9 °C. The average annual precipitation is around 1836 mm, mainly from March to November, accounting for 79.8–88.3% of the whole year’s precipitation [29]. Similar to the higher precipitation, the annual evaporation averages 1738.5 mm [29]. In general, the groundwater was recharged by surface waters and infiltration of precipitation [18]. Geologically, the PRD was formed during the Tertiary and Quaternary periods [30], with a groundwater flow direction from northwest to southeast towards the South China Sea [18]. The investigated lithostratigraphic groups belong to the Quaternary and the groundwater samples collected were from confined aquifers.

2.2. Sample Collection and Physicochemical Analysis

Multiple boreholes were drilled in the study area to trace the groundwater recharges and resources. Six of them were selected to collect samples, on 10 May 2017, including two saline monitoring wells (S) with TDS (Total dissolved solids) > 10 g/L, two brackish monitoring wells (B) with 1 g/L < TDS < 10 g/L, and two freshwater monitoring wells (F) with TDS < 1 g/L from the inland areas to the South China Sea, as shown in Figure 1. Three well volumes of groundwater were removed with an electric submersible pump before sampling.
Cations (K+, Ca2+, Na+, and Mg2+), anions (NO3, Cl, and SO42−), total nitrogen (TN), total phosphorus (TP), total organic carbon (TOC), and isotopes (2H, 3H, 18O, and 14C) were analyzed. Specific analysis procedures are described in the Supplementary Materials.

2.3. Microbial Community Characterization

For each monitoring well, approximately 5 L of groundwater was filtered through a sterile 0.2-μm nitrocellulose membrane filter (Millipore, Sigma, Burlington, MA, USA) to collect biomass for microbial DNA. Protocols for molecular analyses of water samples are described in the Supplementary Materials. All sequences reported in this study were submitted to the NCBI Sequence Read Archive (SRA) under the accession number SRP118856.

3. Results and Discussion

3.1. Hydrochemical Characterization

The physicochemical variations are summarized in Table 1. We used the classification of salinity as a criterion, based on total dissolved solids (TDS) of 0–1 g/L (freshwater = F), 1–10 g/L (brackish = B), and 10–100 g/L (saline = S) [31]. Based on the salinity standard, six groundwater samples were separated into three groups: freshwater (F) included two boreholes (Q130 and Q132) with a salinity ranging from 0.41 to 0.74 g/L, indicating a freshwater environment; brackish water (B) included two boreholes (Q143 and Q144) with a salinity ranging from 3.52 to 3.61 g/L, indicating a slightly salty environment; and saline water (S) included two boreholes (Q146 and Q149) with a salinity ranging from 10.79 to 15.30 g/L, indicating a saltwater environment. The results showed that the salinity gradually increased from the inland areas to the southeast shoreline (Table 1; Figure 1).
The other hydrochemical parameters are also presented in Table 1. The water temperature did not vary greatly (24.5–26 °C) and the pH ranged from 6.88 to 7.68, showing a neutral environment. The oxidation reduction potential (ORP) ranged from −220.1 to 71.2, indicating a highly variable redox condition in the geochemical niches, which may have a great effect on microbe-mediated redox reactions [19]. The concentrations of main ions (K+, Ca2+, Na+, Mg2+, NO3, HCO3, Cl, and SO42−) ranged from 0.01 to 13,441.8 mg/L. The highest values of K+, Na+, Mg2+, and Cl were obtained from sample Q149 (the highest salinity). Notably, the concentration of SO42− was highest from sample Q143. The substances (TOC, TN, and TP) varied greatly at different sampling sites, from 0.02 to 87.27 mg/L. According to the Schukalev classification [32], the groundwater chemistry type varied from HCO3·Cl–Na·Mg to Cl–Na (Figure 2; Table 1), reflecting the evolution of groundwater geochemistry from freshwater to saltwater. In general, the results indicate that different groundwater chemical types have considerably variable environments, which may have a potential influence on microbial growth.
Generally, major ions (e.g., Na+, K+, Mg2+, Ca2+, Cl, NO3, SO42−, and HCO3) in groundwater are used to trace geological events and the evolution in fluid systems [19]. In these major ions, chloride (Cl) is considered a “hydrologically and chemically inert element” that can hardly be absorbed by clay or precipitated with other ions [33]. The increase of Cl concentration in groundwater is generally attributed to evaporation in arid or semi-arid regions or seawater intrusion in coastal areas [34]. The study area is located in the subtropical PRD region, which belongs to the subtropical monsoon climate, with abundant rainfall throughout the year [30]. Hence, the increase of Cl concentration in groundwater is mainly caused by seawater intrusion. According to the Pearson correlation analysis (Table S1), the sea elements of Na+, K+, and Cl had a significantly positive correlation with each other and were correlated positively with salinity (TDS) (P < 0.05), indicating a significant influence of the marine environment on the groundwater. The concentrations of Ca2+ and Mg2+ were significantly positively correlated with Na+, K+, Cl, and salinity (P < 0.05). Generally, Ca2+ and Mg2+ are major ions in freshwater, and are related to the dissolution of gypsum (CaSO4·2H2O) and dolomite (CaMg(CO3)2). In coastal aquifers, the Ca2+ and Mg2+ have ion exchanges with Na+ and K+ from seawater, which enhance the dissolution of gypsum and dolomite [35]. Hence, the positive relationships among them showed Ca2+ and Mg2+ (r = 0.89, P < 0.05) were mainly affected by seawater and subjected to ion-exchanging processes (Table S1). HCO3 was significantly negatively correlated with Ca2+ (r = −0.83, P < 0.05) and had no significant relationship with other seawater ions, suggesting that the bicarbonate may be generated after the deposition of the sediments [2]. Hence, the concentration and correlation of main ions (e.g., Na+, K+, Ca2+, Mg2+, Cl, NO3, SO42−, and HCO3) can also reflect the influence of the marine environment on the groundwater to a certain extent.

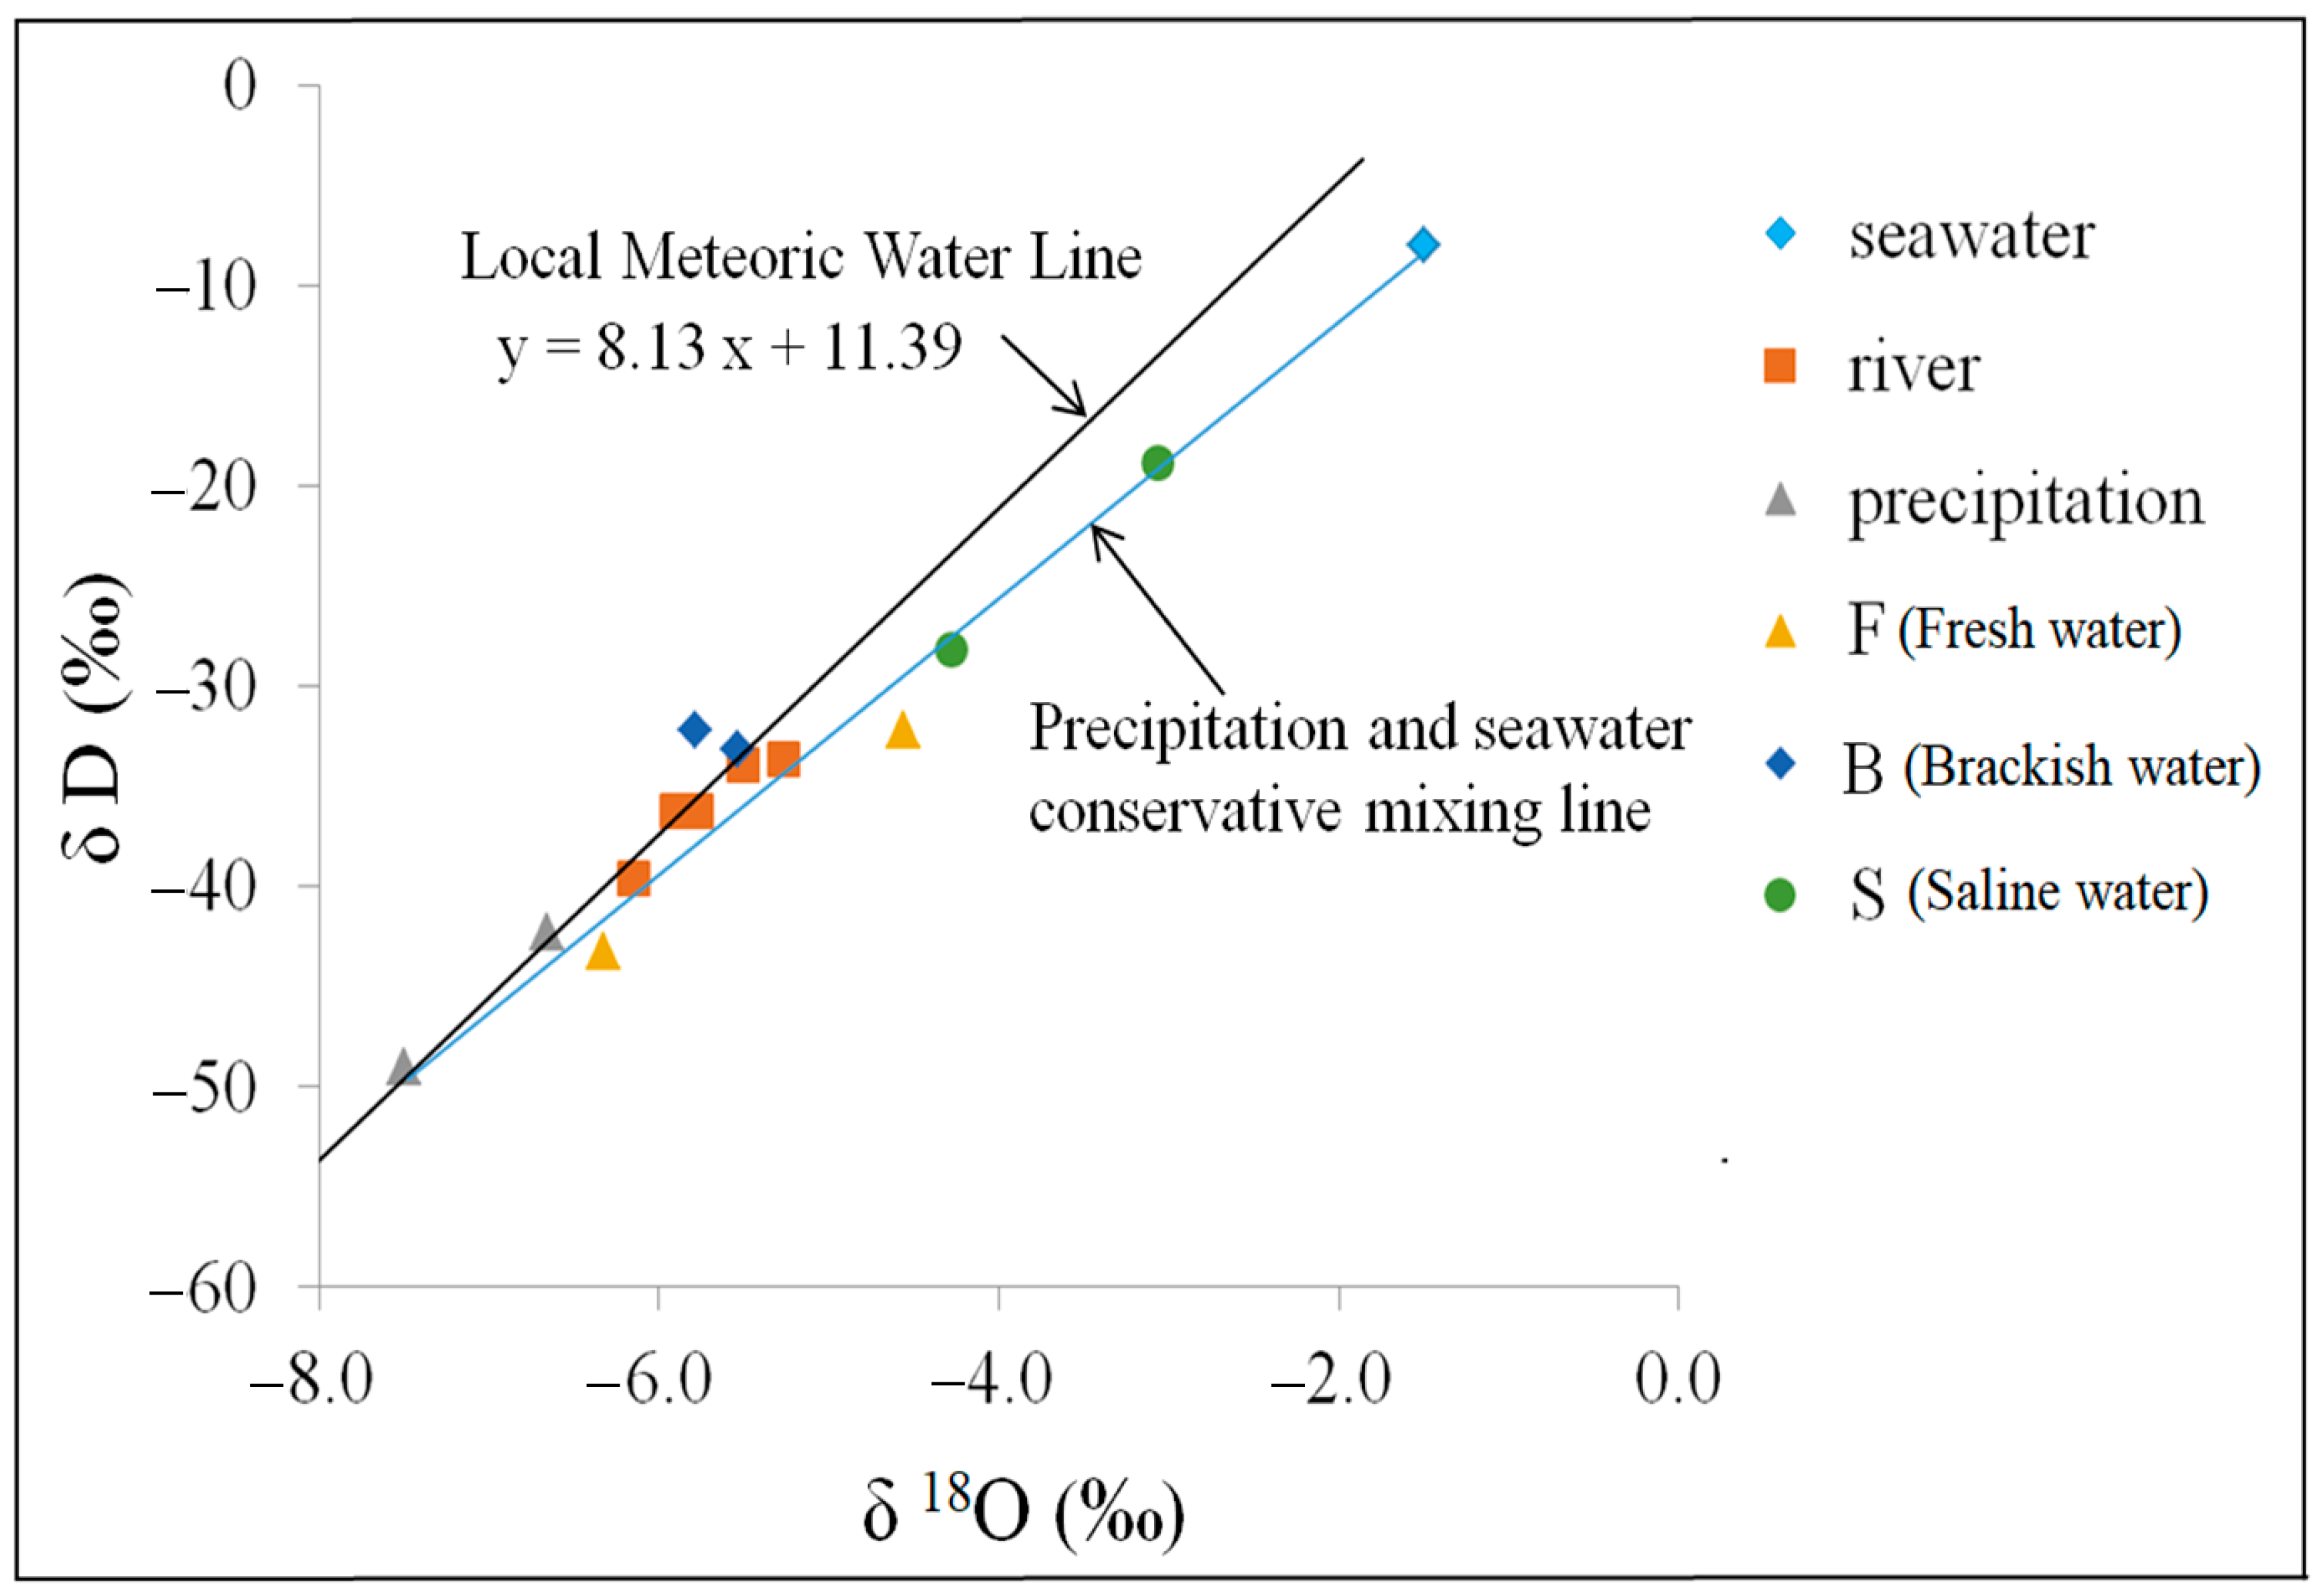
3.2. Isotopic Geochemical Characterization

Both δ2H and δ18O values can be used to identify the sources of groundwater salinity from precipitation or seawater sources [36]. The δD values in groundwater are highly variable between −43.25% and −18.84%, and δ18O values ranged between −6.33% and −3.07% (Table 1). The most δ18O- and δD-depleted samples had a low salinity off the coastline, while the δ18O and δD enriched samples had a high salinity located close to the South China Sea. The δ18O and δD values for groundwater samples generally increased towards the sea (Figure 3; Table 1), indicating that the enrichment of isotopes may be related to the effect of seawater. The Hong Kong meteoric line, which is considered to be the representative local meteoric water line (LMWL), is based on the following equation [37]: δD = 8.13 × δ18O + 11.39. As demonstrated in Figure 3, the δD–δ18O isotope values of the groundwater samples were compared with the LMWL and a conservative mixing line between precipitation and seawater. The majority of δD–δ18O isotope data were between the LMWL and the conservative mixing line, suggesting that the investigated groundwater was recharged by the infiltration of local precipitation and seawater. The saline water samples (S) are closely aligned with the seawater and the freshwater samples (F) accompanying the precipitation. It can be concluded that the difference in groundwater salinity was attributed to the extent of mixing between seawater and precipitation from northwest to southeast.
The radioactive isotopes of 3H and 14C were used to quantitatively estimate the groundwater age [38]. The 3H values in the groundwater samples were all less than 1.3 TU, indicating a similar source of water (Table 1). According to the definition for groundwater age dating by Clark and Fritz [39], it can be inferred that the studied groundwater was recharged by a mixing between ancient water before 1952 when tritium released from hydrogen bomb tests carried out in the 1950s and modern water. According to the 14C measurements, the dating result was 1750 ± 15 BP in Q130, 4720 ± 80 BP in Q146, and 8820 ± 40 BP in Q149, which was almost in line with previous research that showed that the age of groundwater in PRD ranged between 2.2 and 9.3 ka BP [13,18]. During the Holocene period, the PRD experienced two large-scale transgressions, reaching its culmination at 5.9–7.4 ka BP [13,18], resulting in a prolonged interaction between paleo-seawater and groundwater. The measured 14C ages may be slightly different from previous research [13,18]. Many geochemical processes including matrix diffusion of 14C, dissolution and exchange of carbonate, sulfate reduction, and methanogenesis will partly disturb 14C activity in DIC in the groundwater system [21]. Hence, it will be quite difficult to acquire the actual age of the groundwater. Nevertheless, the results of isotope analysis (2H, 3H, 18O, and 14C) indicated that the salinity of aquifers of PRD was recharged by the infiltration of local precipitation and paleo-seawater.

3.3. Alpha Diversity of the Microbial Assemblages

In the present study, a total of 222,763 high-quality microbial sequences (294 bp average lengths) were obtained from six groundwater samples. After clustering and alignment, a total of 411 OTUs (Operational taxonomic unit) were obtained on a 97% threshold across all samples with a range of 237–308 OTUs (Table 2). Microbial richness reflected by the Chao and ACE, between 271.93 and 341.51 for ACE index, as well as between 264.13 and 343.36 for Chao index with similar trends. Microbial evenness, reflected by Heip, varied between 0.02 and 0.12. In general, the freshwater samples contained a relatively higher richness and evenness (Table 2). As determined by the Shannon and Simpson index, the diversity of the microbial assemblages varied along the salinity gradient, between 1.85 and 3.54 for Shannon and between 0.06 and 0.26 for Simpson. In general, the richness (Chao and ACE), evenness (Heip), and diversity (Shannon and Simpson) all indicated that the α-diversity of microbial assemblages was relatively higher in freshwater samples than in saltwater samples (Table 2). Some studies of microbial communities in aquatic environments also indicated that a higher diversity accompanied lower salinity [40,41]. Therefore, salinity may have a great influence on microbial richness, evenness, and diversity, which generally decrease with increasing salinity. Good’s coverage, which reached over 99% of all samples, reflects an excellent estimate of sampling completeness (Table 2).

3.4. Taxonomic Composition of Microbial Assemblages

Sequences were clustered into different taxonomic levels, including 29 phyla, 54 classes, 101 orders, 144 families, and 235 genera. The taxonomic composition of microbial assemblages at the phylum level (relative abundance > 1% at least one sample), class level (relative abundance > 1% at least one sample), and genus level (top 50) are demonstrated in Figure 4. In accordance with earlier studies in groundwater or coastal marine ecosystems [4,42,43], the majority of sequences were assigned to Proteobacteria (56.1–86.9%); Firmicutes had the second-highest proportion (7.4–43%), followed by Bacteroidetes (0.1–5.8%) and Cyanobacteria (0–1.2%). In general, there was a higher abundance of Firmicutes in the saltwater samples than freshwater samples (Figure 4A; Table S2), which may be related to the physiological function to produce spores to resist extreme conditions [44]. Moreover, Firmicutes are typically gut microbes [45], such as Lactococcus, Streptococcus, and Enterococcus. These genera were found in some groundwater samples, though they accounted for a lower percentage (abundance < 1%), indicating the possible fecal contamination of the groundwater. The phylum Bacteroidetes was dominant in freshwater samples (Figure 4A; Table S2), and has the ability to degrade organic matter [46]. Interestingly, Cyanobacteria was absent from saline water monitoring wells (S) with TDS > 10 g/L (Figure 4A; Table S2), which can be related to limited photosynthesis because of reduced sunlight exposure with depth. According to the sample depth (Table 1), the saline water wells are much deeper than the freshwater wells. Additionally, it is possible that Cyanobacteria, which are known to live within soil [47,48], have spread into aquifers through the soil.
Figure 4B shows the compositions of microbial communities at the class level. γ-proteobacteria was the most abundant class in all analyzed samples (42.2–57.7%), except the sample of Q143 (25.1%) (Table S3). The class γ-proteobacteria was enriched in most marine environments [49,50], indicating that the groundwater was affected by seawater. In other class taxons, the microbial community assemblages changed regularly: β-proteobacteria was enriched in freshwater samples Q132 (29.9%) and Q130 (39.9%), which were heavily recharged by the infiltration of local precipitation (Figure 3; Table 1). This was consistent with previous research that showed that β-proteobacteria was predominant in various freshwater ecosystems on a global scale [51,52]; as the salinity increased, ε-proteobacteria was ubiquitous in brackish water sample Q143 (47%), which was common in deep-sea hydrothermal vents and can absorb energy from chemolithotrophic processes [53]. As the salinity continued to increase, Bacilli were significantly dominant in brackish water sample Q144 (36.3%) and saline water samples Q146 (43.0%) and Q149 (37.8%), which were heavily recharged by paleo-seawater (Figure 3; Table 1). We calculated the ratios between γ-proteobacteria and β-proteobacteria, which go down gradually from saline water (51.54 and 56.12) to brackish water (2.57 and 10.33), and then to freshwater (1.06 and 1.54). To some extent, the proportion of saltwater and freshwater species probably reflects the seawater/freshwater mixing ratio. Other dominant classes included α-proteobacteria, Sphingobacteriia, and Cyanobacteria.
The hierarchical heat-map at the genus level (top 50) revealed that groundwater samples could be divided into three main groups (Figure 4C; Table S4): group I included two freshwater samples, Q130 and Q132; group II included one brackish water sample, Q143; group III was composed of three samples that included one brackish water sample, Q144, and two saline water samples, Q146 and Q149. The differences and similarities among the microbial communities may be attributed to the physicochemical variations or the similarity of the aquatic environment. Similar to the distribution of microbial communities in other aquatic environments, the microbial taxa of subsurface water were distinct: β-proteobacteria dominated in freshwater systems [51,52], Firmicutes dominated in alkaline lakes [54], γ-proteobacteria dominated in most marine environments [49,50], and β-proteobacteria and Bacteroidetes dominated in moraine lake water [55].

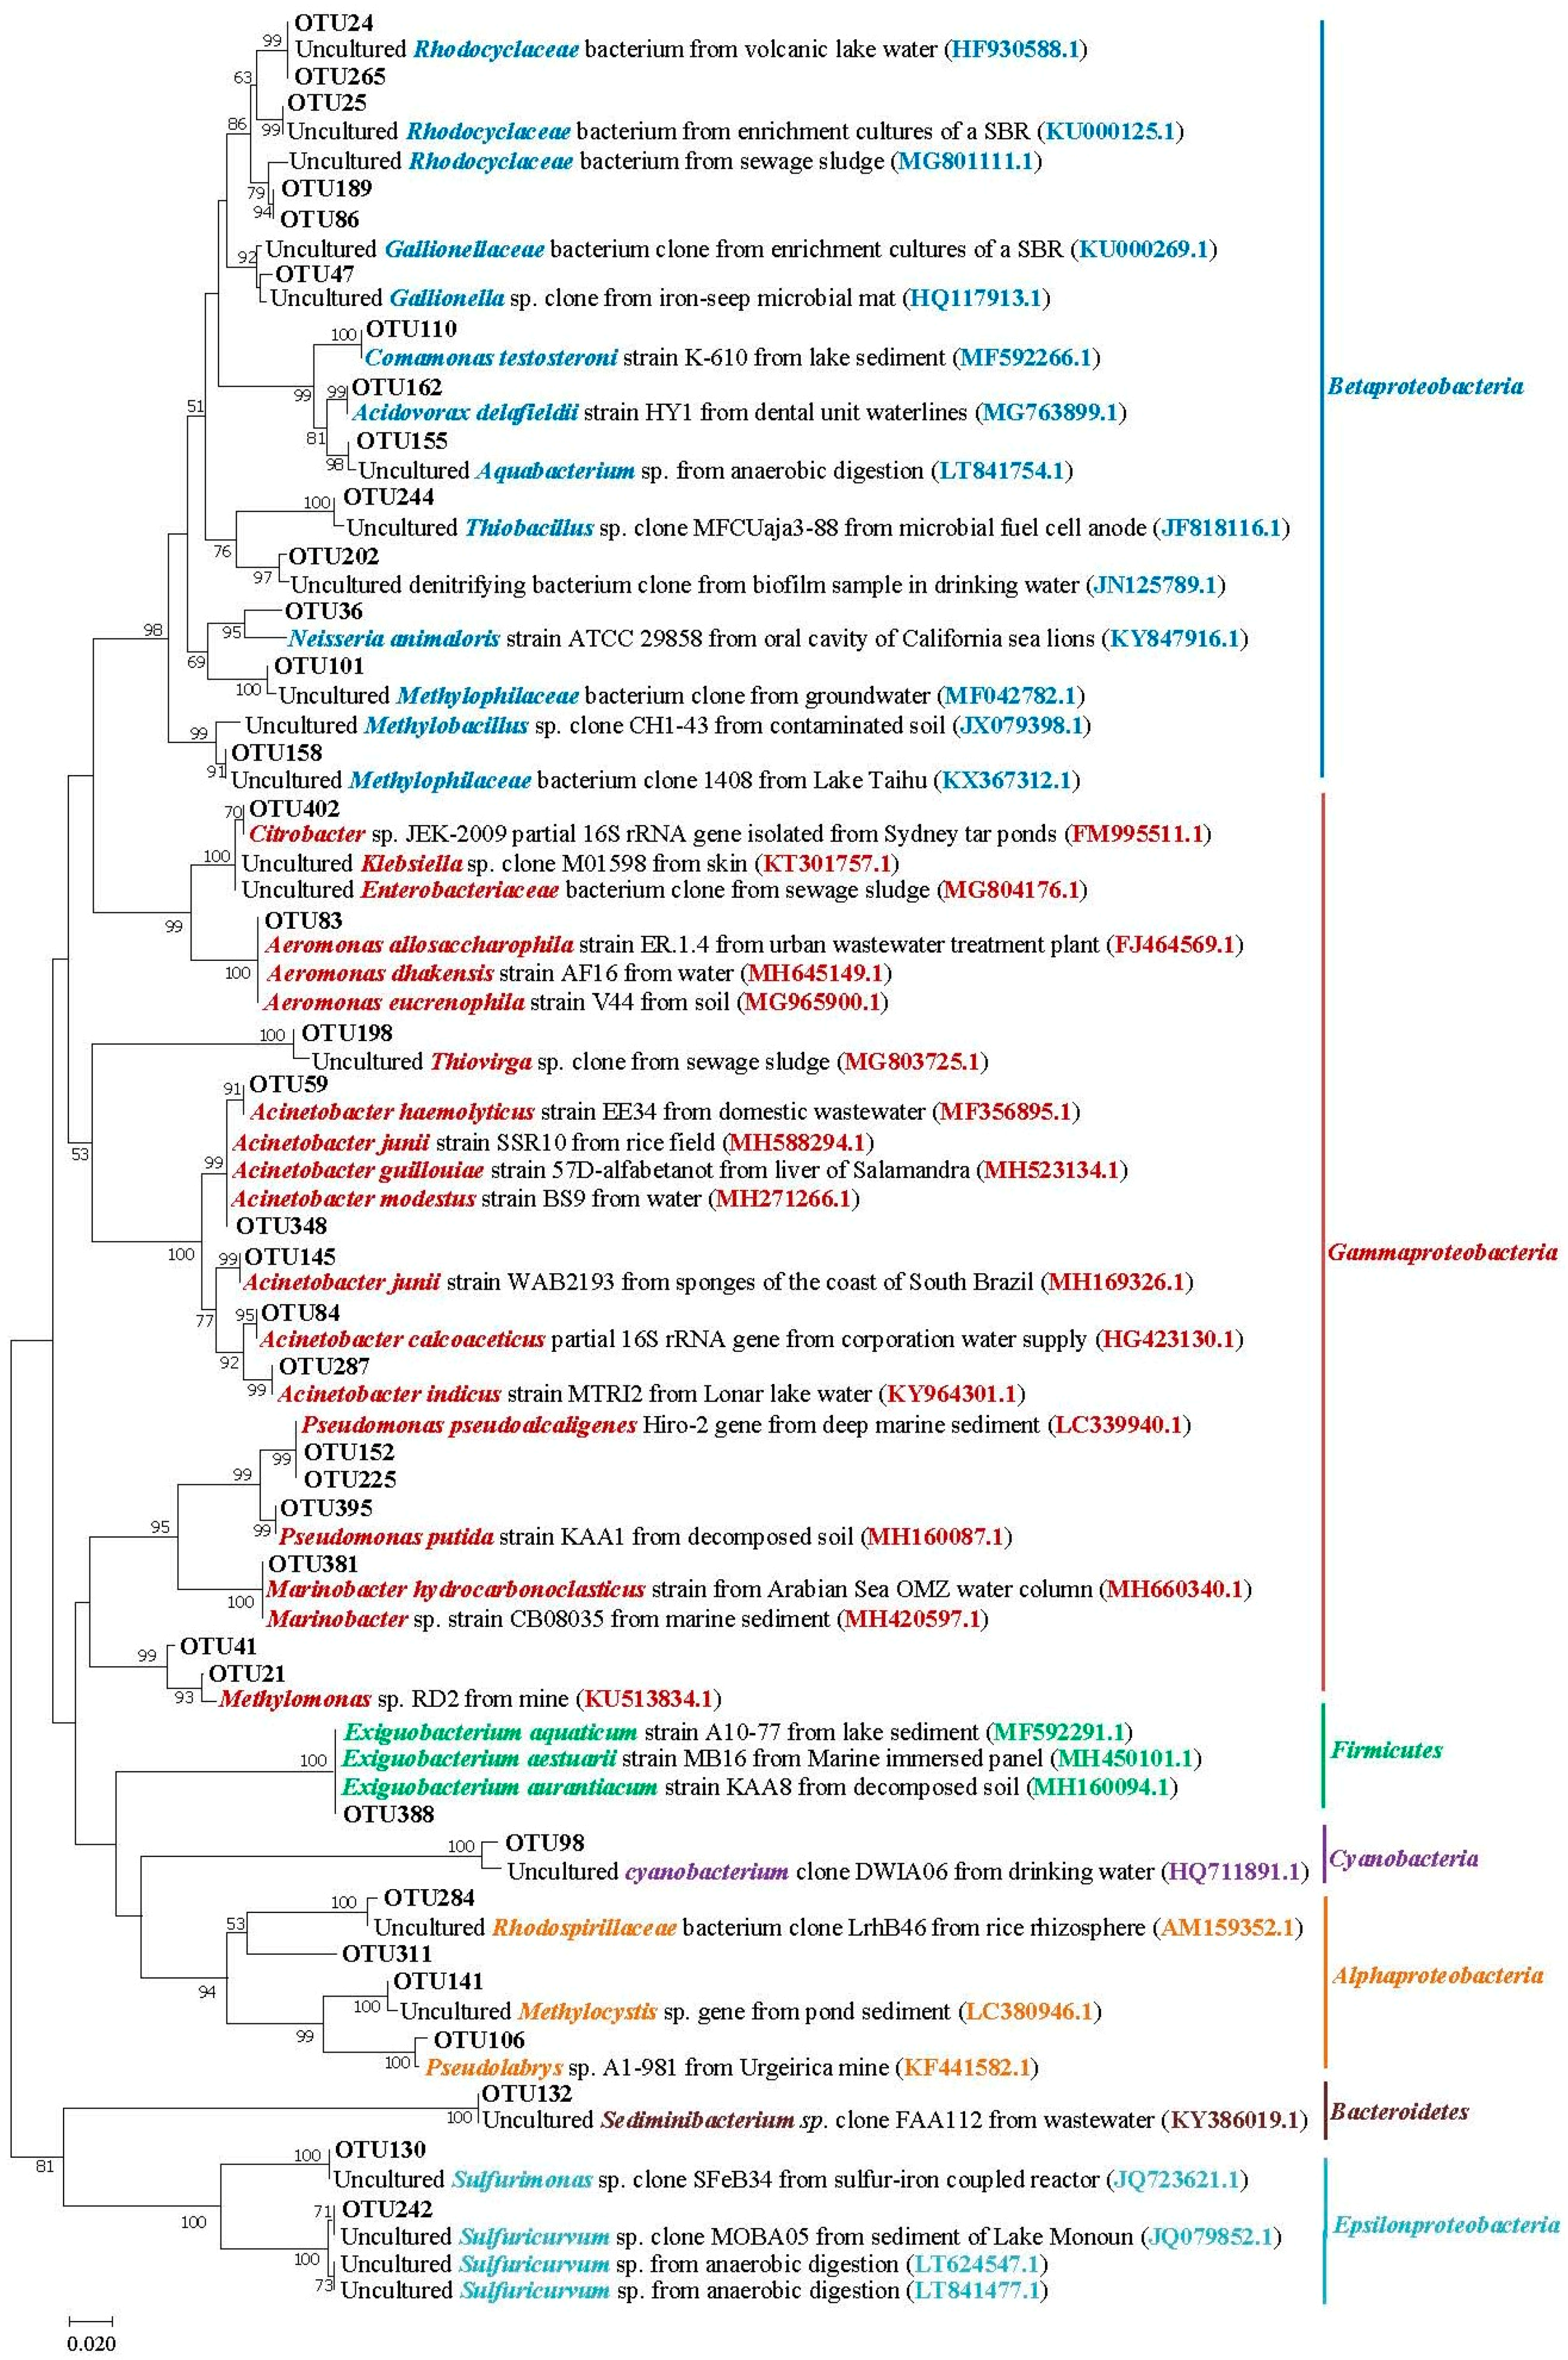
3.5. Phylogenetic Analysis of Main Phylum/Class Taxa within Different Salinity Groundwater

The OTUS that accounted for the highest relative abundance in saline water were most related to Exiguobacterium spp. (36.5% in Q149 and 41.3% in Q146) (Table S5). Exiguobacterium spp. were widely distributed in the permafrost of Siberia [56], hydrothermal vents on the sea floor [57], and plant rhizosphere [58] (Figure 5), having resistance to extreme conditions such as heat, cold, alkali, and salt. Though Exiguobacterium spp. were enriched in saline water, they also occupied a relatively high proportion in other wells. Exiguobacterium sp. is a common environmental microbe, and may also be involved in the remediation of various environmental pollutants [59,60], which could explain their ubiquity in all investigated wells. Exiguobacterium sp. was also dominant in a moderate saltwater sample, Q144 (34.5%), followed by Acinetobacter spp. (16.7% in Q144, 19.1% in Q146, and 15.6% in Q149), which were frequently detected in the marine environment with an ability to degrade herbicides, organophosphorus pesticides, and various petroleum hydrocarbon components [61,62]. Apart for Exiguobacterium spp. and Acinetobacter spp., unclassified Enterobacteriaceae sp. also had a relatively high percentage in salt water samples. The representative sequences of OTU402 had 99% similarity with an Enterobacteriaceae bacterium clone from sewage sludge (MG804176.1), uncultured Klebsiella sp. clone from skin (KT301757.1), and Citrobacter sp. clone from tar ponds (FM995511.1) (Figure 5). It is worth noting that Marinobacter was enriched in saline water Q149 (Figure 4C). Some representative OTU381 sequences had 99% similarity with Marinobacter hydrocarbonoclasticus from the Arabian Sea (MH660340.1) and Marinobacter sp. from marine sediment (MH420597.1) (Figure 5). Marinobacter spp. were known as halophilic microorganisms, which usually live in marine environments [63]. Hence, the marine species sequence may be brought into coastal aquifers by seawater intrusion.
Microbial assemblages in Q143 varied greatly (Figure 4). The conspicuously dominant microbial group was affiliated to Sulfuricurvum spp. (45.9%) (Table S4). Species of the genus have a variety of energy metabolisms and adaptations to redox including denitrification, oxygen reduction, and sulfur oxidation [19]. According to the physicochemical parameters (Table 1), it seems reasonable that these sulfur-related metabolisms sequences were more abundant in well Q143 with abundant SO42−, low pH, and low NO3. The well Q143 was brackish water, indicating that the microbial assemblages were related to the sulfur-related biochemical pathways in the transition zone from freshwater to saltwater.
In accordance with previous studies that β-proteobacteria had positive correlations with low salinity [64], class β-proteobacteria accounted for 29.9–39.9% in freshwater samples (Table S3). Most OTUs of β-proteobacteria were members of three orders, including Rhodocyclales, Nitrosomonadales, and Burkholderiales (Table S6). Although the majority of sequences related to Rhodocyclales were identified as uncultured Rhodocyclaceae bacterium (Figure 5), some genera were reported to have the function of denitrification [65,66]. The order Nitrosomonadales were known as bacterial nitrifiers, which play a vital role in the nitrification process [67]. The order Burkholderiales were also related to nitrogen-fixing [68], and most representative sequences from this order were similar to Comamonas, related to denitrifying the bacterium clone from a biofilm sample in drinking water (JN125789.1) and Acidovorax (Figure 5). Hence, the relatively high abundance orders/genera related to the nitrogen cycle in freshwater samples were reasonable due to the highest concentration of nitrite and nitrite being available in fresh wells (Table 1). Except for the class β-proteobacteria, Aeromonas spp. affiliated with γ-proteobacteria were also enriched in freshwater samples, both Q130 (19.3%) and Q132 (15.8%) (Table S5). It is notable that some species of the genus Aeromonas are present within the gut flora [69]. Some other genera (e.g., Lactococcus, Streptococcus, and Enterococcus) were also identified in saline water, as typically gut microbes accounted for a lower percentage (abundance < 1%). However, the species and abundance of pathogenic microorganisms are different along the groundwater salinity gradient. Other genera of β-proteobacteria included Gallionellaceae, Methylophilaceae, and Rhodocyclaceae with a relatively high percentage in freshwater samples (Figure 5).
Collectively, at the OTU level (relative abundance > 1% at least one sample), the microbial taxa were greatly different in wells of different salinity. Exiguobacterium and Acinetobacter were dominant in saline water samples (S) and Q144, while Sulfuricurvum dominated in brackish water (Q143). Aeromonas, no rank Gallionellaceae, no rank Methylophilaceae, Acidovorax, and Comamonas isolated from similar environments unevenly thrived in the spatially different freshwater samples.

3.6. Linking the Distribution of Microbial Assemblages to the Hydrogeochemical Characteristics

The analysis relating to microbial communities and physicochemical characteristics was conducted as in Figure 6. Physicochemical characteristics clustered closely according to the salinity of groundwater (Figure 6A). The two saline water samples (Q146 and Q149) were separated from the other samples. The two brackish water samples (Q143 and Q144) clustered closely and the two freshwater samples (Q130 and Q132) clustered closely. According to the δ2H and δ18O measurements, the varying extent of mixing between seawater and freshwater shaped the distinct salinity gradient from northwest to southeast. Hence, the influence of seawater decreased from fresh water in the inland area to saline water close to the southeast shoreline.
A hierarchical clustering tree showed similarities among microbial communities (Figure 6B). In terms of salinity, samples from different boreholes were completely separate: two branches included freshwater and saltwater. Two saline water samples (Q146 and Q149) clustered closely, two brackish water samples (Q143 and Q144) clustered closely, and two freshwater samples (Q130 and Q132) clustered closely. The clusters of microbial communities and hydrochemical characteristics were similar. According to the results, physicochemical properties have an impact on the distribution of microbial communities. Some OTUs were more abundant in certain groundwater, indicating that the environmental factors determined some microbial presence. Except for the widely distributed γ-proteobacteria within the given groundwater samples, the other main microbial community differed significantly, changing from β-proteobacteria in freshwater to ε-proteobacteria in brackish water Q143, and Bacilli in saline water. Therefore, these spatial distribution patterns of microbial assemblages may reflect the hydrogeochemical evolutions (e.g., salinity) along the generalized groundwater flow path. However, the deeper nodes are different between the groundwater physicochemical properties and the microbial communities. In Figure 6A, Q130, Q132, Q143, and Q144 are in a single cluster, distinct from the Q146‒Q149 pair, while in Figure 6B, Q144, Q143, Q146, and Q149 are clustered together, separate from the Q130‒Q132 pair. So, there is also a big difference in that chemically, the brackish samples are most similar to the freshwater samples, while biologically, the brackish samples are most similar to the saline samples. Except for the main physicochemical factors listed (Table 1), there are too many abiotic factors that could affect the habitat-based microbial community structures, such as spatial and temporal distances, hydrochemical processes, and environmental variations. Other ecological mechanisms may also play a role, such as deterministic and stochastic processes, dispersal limitation, and disturbances [70,71,72,73]. We should also be aware of some OTUs that may not be sensitive to environmental variations, such as Exiguobacterium: though enriched in saline water, they were still common in all wells. Even so, the microbial communities and physicochemical properties between saline wells (S) and freshwater wells (F) are completely separate. To unravel the interaction between microbial characteristics and groundwater geochemistry, the genetic diversity of microorganisms needs to be studied further.

4. Conclusions

In this study, we integrated different methodologies of hydrochemistry, isotopic analysis, and microbiology to study the hydrogeochemical features and microbial communities induced by saltwater intrusion in the aquifer of PRD. The hydrochemical and isotopic measurements indicated that the salinity of the aquifer originated from seawater during the Holocene transgression period. The varying salinity was attributed to the extent of mixing between seawater and precipitation. The microbial community composition varied greatly with the groundwater salinity and the most abundant phylum in the aquifer of PRD area was Proteobacteria, followed by Firmicutes, Bacteroidetes, and Cyanobacteria. β-proteobacteria was enriched in the freshwater samples, which were heavily recharged by the infiltration of local precipitation. Bacilli dominated in the brackish water sample Q144 and saline water samples, which were heavily recharged by the paleo-seawater. Based on the further analysis of the OTU levels (relative abundance > 1% at least one sample), the microbial taxa were very different in all the variant salinity samples and freshwater samples from distinct locations.
The results also indicated that the variations of microbial assemblages in the groundwater were a consequence of the hydrogeochemical and isotopic fluctuations. Furthermore, the data suggest that the differences in microbial community structure in different water bodies were possibly caused by precipitation, paleo-seawater, and other hydrochemical processes. Therefore, information on microbial communities is capable of reflecting the characteristics of hydrochemistry of groundwater and indicates a change of water source or quality. Although this research focused on the area of PRD, China, our results and conclusions are extendable and can provide useful information and tools for similar research areas with seawater intrusion problems.

Supplementary Materials

The following are available online at https://www.mdpi.com/2073-4441/11/4/804/s1.

Author Contributions

Wrote the paper: S.S. Conceived and designed the research: H.D. and B.X.H. Sampling and performing the analysis: S.S., Y.H. and T.Z. Corrected the paper: J.Z.

Funding

This research was funded by the Ministry of Science and Technology (Grant No. 2016YFC0402805), Western Light—western region leading scientists supporting project, Chinese Academy of Sciences (2018-XBYJRC-002), Regional collaborative innovation project for Xinjiang Uygur Autonomous Region (Shanghai cooperation organization science and technology partnership project) (2017E01029), the National Natural Science Foundation of China (Grant No. 41807182, U1603343, 41601595), and the Guangzhou Water Technology Project (Grant No. 400117017).

Acknowledgments

We also thank Yanru Hao, Liwei Sun, Guangxiong Qin, and Hao Ou for their help.

Conflicts of Interest

The authors declare no conflict of interest.

References

  1. Ghabayen, S.M.; McKee, M.; Kemblowski, M. Ionic and isotopic ratios for identification of salinity sources and missing data in the Gaza aquifer. J. Hydrol. 2006, 318, 360–373. [Google Scholar] [CrossRef]
  2. Wang, Y.; Jiao, J.J. Origin of groundwater salinity and hydrogeochemical processes in the confined Quaternary aquifer of the Pearl River Delta, China. J. Hydrol. 2012, 438, 112–124. [Google Scholar] [CrossRef]
  3. Unno, T.; Kim, J.; Kim, Y.; Nguyen, S.G.; Guevarra, R.B.; Kim, G.P.; Lee, J.; Sadowsky, M.J. Influence of seawater intrusion on microbial communities in groundwater. Sci. Total Environ. 2015, 532, 337–343. [Google Scholar] [CrossRef]
  4. Hery, M.; Volant, A.; Garing, C.; Luquot, L.; Poulichet, F.E.; Gouze, P. Diversity and geochemical structuring of bacterial communities along a salinity gradient in a carbonate aquifer subject to seawater intrusion. FEMS Microbiol. Ecol. 2014, 90, 922–934. [Google Scholar] [CrossRef] [Green Version]
  5. Shi, L.; Jiao, J.J. Seawater intrusion and coastal aquifer management in China: A review. Environ. Earth Sci. 2014, 72, 2811–2819. [Google Scholar] [CrossRef]
  6. Teng, Y.; Su, J.; Wang, J.; Dai, N.; Li, J.; Song, L.; Zuo, R. Soil microbial community response to seawater intrusion into coastal aquifer of Donghai Island, South China. Environ. Earth Sci. 2014, 72, 3329–3338. [Google Scholar] [CrossRef]
  7. Pronk, M.; Goldscheider, N.; Zopfi, J. Microbial communities in karst groundwater and their potential use for biomonitoring. Hydrogeol. J. 2009, 17, 37–48. [Google Scholar] [CrossRef]
  8. Hahn, H.J.; Fuchs, A. Distribution patterns of groundwater communities across aquifer types in south-western Germany. Freshw. Biol. 2009, 54, 848–860. [Google Scholar] [CrossRef] [Green Version]
  9. Korbel, K.L.; Hancock, P.J.; Serov, P.; Lim, R.P.; Hose, G.C. Groundwater ecosystems vary with land use across a mixed agricultural landscape. J. Environ. Qual. 2013, 42, 380–390. [Google Scholar] [CrossRef]
  10. Qi, S.; Qiu, Q. Environmental hazard from saltwater intrusion in the Laizhou Gulf, Shandong Province of China. Nat. Hazards 2011, 56, 563–566. [Google Scholar] [CrossRef]
  11. van Dijk, G.; Smolders, A.J.; Loeb, R.; Bout, A.; Roelofs, J.G.; Lamers, L.P. Salinization of coastal freshwater wetlands; effects of constant versus fluctuating salinity on sediment biogeochemistry. Biogeochemistry 2015, 126, 71–84. [Google Scholar] [CrossRef]
  12. Edmonds, J.W.; Weston, N.B.; Joye, S.B.; Mou, X.; Moran, M.A. Microbial community response to seawater amendment in low-salinity tidal sediments. Microb. Ecol. 2009, 58, 558–568. [Google Scholar] [CrossRef]
  13. Zhi, F.; Yao, P.; Jiang, S.; Tu, S.; Kong, D.; Wang, L. Hydrochemical evidence of salt water formation in the Pearl River Delta. Hydrogeol. Eng. Geol. 2015, 42, 133–139. (In Chinese) [Google Scholar]
  14. Liu, K.; Jiao, J.J.; Gu, J. Investigation on bacterial community and diversity in the multilayer aquifer-aquitard system of the Pearl River Delta, China. Ecotoxicology 2014, 23, 2041–2052. [Google Scholar] [CrossRef]
  15. Lu, F.; Ni, H.; Liu, F.; Zeng, E.Y. Occurrence of nutrients in riverine runoff of the Pearl River Delta, South China. J. Hydrol. 2009, 376, 107–115. [Google Scholar] [CrossRef]
  16. Chen, S.; Fang, L.; Zhang, L.; Huang, W. Remote sensing of turbidity in seawater intrusion reaches of Pearl River Estuary–A case study in Modaomen water way, China. Estuar. Coast. Shelf Sci. 2009, 82, 119–127. [Google Scholar] [CrossRef]
  17. Jiao, J.J.; Wang, Y.; Cherry, J.A.; Wang, X.; Zhi, B.; Du, H.; Wen, D. Abnormally High Ammonium of Natural Origin in a Coastal Aquifer-Aquitard System in the Pearl River Delta, China. Environ. Sci. Technol. 2010, 44, 7470–7475. [Google Scholar] [CrossRef]
  18. Zong, Y.; Huang, G.; Switzer, A.D.; Yu, F.; Yim, W. An evolutionary model for the Holocene formation of the Pearl River delta, China. Holocene 2009, 19, 129–142. [Google Scholar] [CrossRef]
  19. Sheng, Y.; Wang, G.; Zhao, D.; Hao, C.; Liu, C.; Cui, L.; Zhang, G. Groundwater Microbial Communities Along a Generalized Flowpath in Nomhon Area, Qaidam Basin, China. Groundwater 2018, 56, 719–731. [Google Scholar] [CrossRef]
  20. Yamanaka, T.; Tsujimura, M.; Oyunbaatar, D.; Davaa, G. Isotopic variation of precipitation over eastern Mongolia and its implication for the atmospheric water cycle. J. Hydrol. 2007, 333, 21–34. [Google Scholar] [CrossRef]
  21. Wu, X.; Wang, X.; Wang, Y.; Hu, B.X. Origin of water in the Badain Jaran Desert, China: New insight from isotopes. Hydrol. Earth Syst. Sci. 2017, 21, 4419–4431. [Google Scholar] [CrossRef]
  22. Reckerth, A.; Stichler, W.; Schmidt, A.; Stumpp, C. Long-term data set analysis of stable isotopic composition in German rivers. J. Hydrol. 2017, 552, 718–731. [Google Scholar] [CrossRef]
  23. Wang, Y.; Jiao, J.J.; Cherry, J.A.; Lee, C.M. Contribution of the aquitard to the regional groundwater hydrochemistry of the underlying confined aquifer in the Pearl River Delta, China. Sci. Total Environ. 2013, 461, 663–671. [Google Scholar] [CrossRef]
  24. Lee, K.; Wang, Y.; Wang, Y.; Gu, J.; Jiao, J.J. Abundance and diversity of aerobic/anaerobic ammonia/ammonium-oxidizing microorganisms in an ammonium-rich aquitard in the Pearl River Delta of South China. Microb. Ecol. 2016, 76, 81–91. [Google Scholar] [CrossRef]
  25. Kim, H.; Kaown, D.; Mayer, B.; Lee, J.; Hyun, Y.; Lee, K. Identifying the sources of nitrate contamination of groundwater in an agricultural area (Haean basin, Korea) using isotope and microbial community analyses. Sci. Total Environ. 2015, 533, 566–575. [Google Scholar] [CrossRef]
  26. Bethencourt, M.; Fernández-Montblanc, T.; Izquierdo, A.; González-Duarte, M.M.; Muñoz-Mas, C. Study of the influence of physical, chemical and biological conditions that influence the deterioration and protection of Underwater Cultural Heritage. Sci. Total Environ. 2018, 613, 98–114. [Google Scholar] [CrossRef] [Green Version]
  27. Liu, Z.; Huang, S.; Sun, G.; Xu, Z.; Xu, M. Diversity and abundance of ammonia-oxidizing archaea in the Dongjiang River, China. Microbiol. Res. 2011, 166, 337–345. [Google Scholar] [CrossRef]
  28. Wang, Y.; Jiao, J.J.; Cherry, J.A. Occurrence and geochemical behavior of arsenic in a coastal aquifer–aquitard system of the Pearl River Delta, China. Sci. Total Environ. 2012, 427, 286–297. [Google Scholar] [CrossRef]
  29. Lu, Y.; Tang, C.; Chen, J.; Sakura, Y. Impact of septic tank systems on local groundwater quality and water supply in the Pearl River Delta, China: Case study. Hydrol. Process. Int. J. 2008, 22, 443–450. [Google Scholar] [CrossRef]
  30. Aitchison, J.C.; Ali, J.R.; Davis, A.M. When and where did India and Asia collide? J. Geophys. Res. Solid Earth 2007, 112, 1–2. [Google Scholar] [CrossRef]
  31. Freeze, R.A.; Cherry, J.A. Groundwater; Prentice-Hall, Inc.: Englewood Cliffs, NJ, USA, 1974; Volume 604, pp. 21–51. [Google Scholar]
  32. Renquan, Z.; Xing, L.; Menggui, J.; Li, W.; Qingchun, Y. Fundamentals of Hydrogeology; Geological Publishing House: Beijing, China, 2011. [Google Scholar]
  33. Christophersen, N.; Neal, C. Linking hydrological, geochemical, and soil chemical processes on the catchment scale: An interplay between modeling and field work. Water Resour. Res. 1990, 26, 3077–3086. [Google Scholar]
  34. Fritz, P.; Fontes, J. Handbook of Environmental Isotope Geochemistry; Elsevier: Amsterdam, The Netherlands, 1980; pp. 1–19. [Google Scholar]
  35. Wen, X.; Diao, M.; Wang, D.; Gao, M. Hydrochemical characteristics and salinization processes of groundwater in the shallow aquifer of Eastern Laizhou Bay, China. Hydrol. Process. 2012, 26, 2322–2332. [Google Scholar] [CrossRef]
  36. Carreira, P.M.; Marques, J.M.; Nunes, D. Source of groundwater salinity in coastline aquifers based on environmental isotopes (Portugal): Natural vs. human interference. A review and reinterpretation. Appl. Geochem. 2014, 41, 163–175. [Google Scholar] [CrossRef]
  37. Zhang, L.; Chen, L.; Liu, J.; Liu, F.L.; Chen, Z.Y. D and 18O isotopes in atmospheric precipitation in Hongkong area. Ecol. Environ. Sci. 2009, 18, 572–577. [Google Scholar]
  38. Bethke, C.M.; Johnson, T.M. Groundwater age and groundwater age dating. Annu. Rev. Earth Planet. Sci. 2008, 36, 121–152. [Google Scholar] [CrossRef]
  39. Clark, I.D.; Fritz, P. Tracing the carbon cycle. In Environmental Isotopes in Hydrogeology; CRC Press: Boca Raton, FL, USA, 1997; pp. 111–134. [Google Scholar]
  40. Abed, R.M.; Kohls, K.; de Beer, D. Effect of salinity changes on the bacterial diversity, photosynthesis and oxygen consumption of cyanobacterial mats from an intertidal flat of the Arabian Gulf. Environ. Microbiol. 2007, 9, 1384–1392. [Google Scholar] [CrossRef]
  41. Campbell, B.J.; Kirchman, D.L. Bacterial diversity, community structure and potential growth rates along an estuarine salinity gradient. ISME J. 2013, 7, 210. [Google Scholar] [CrossRef]
  42. Griebler, C.; Lueders, T. Microbial biodiversity in groundwater ecosystems. Freshw. Biol. 2009, 54, 649–677. [Google Scholar] [CrossRef] [Green Version]
  43. Manes, C.D.O.; Barbe, C.; West, N.J.; Rapenne, S.; Lebaron, P. Impact of seawater-quality and water treatment procedures on the active bacterial assemblages at two desalination sites. Environ. Sci. Technol. 2011, 45, 5943–5951. [Google Scholar] [CrossRef]
  44. Fimlaid, K.A.; Shen, A. Diverse mechanisms regulate sporulation sigma factor activity in the Firmicutes. Curr. Opin. Microbiol. 2015, 24, 88–95. [Google Scholar] [CrossRef] [Green Version]
  45. Xu, Z.; Knight, R. Dietary effects on human gut microbiome diversity. Br. J. Nutr. 2015, 113, S1–S5. [Google Scholar] [CrossRef]
  46. Thomas, F.; Hehemann, J.; Rebuffet, E.; Czjzek, M.; Michel, G. Environmental and gut Bacteroidetes: The food connection. Front. Microbiol. 2011, 2, 93. [Google Scholar] [CrossRef]
  47. Redfield, E.; Barns, S.M.; Belnap, J.; Daane, L.L.; Kuske, C.R. Comparative diversity and composition of cyanobacteria in three predominant soil crusts of the Colorado Plateau. FEMS Microbiol. Ecol. 2002, 40, 55–63. [Google Scholar] [CrossRef] [Green Version]
  48. Issa, O.M.; Défarge, C.; le Bissonnais, Y.; Marin, B.; Duval, O.; Bruand, A.; Acqui, L.P.D.; Nordenberg, S.; Annerman, M. Effects of the inoculation of cyanobacteria on the microstructure and the structural stability of a tropical soil. Plant Soil 2007, 290, 209–219. [Google Scholar] [CrossRef]
  49. Leloup, J.; Fossing, H.; Kohls, K.; Holmkvist, L.; Borowski, C.; Jørgensen, B.B. Sulfate-reducing bacteria in marine sediment (Aarhus Bay, Denmark): Abundance and diversity related to geochemical zonation. Environ. Microbiol. 2009, 11, 1278–1291. [Google Scholar] [CrossRef]
  50. Amano, T.; Yoshinaga, I.; Okada, K.; Yamagishi, T.; Ueda, S.; Obuchi, A.; Sako, Y.; Suwa, Y. Detection of anammox activity and diversity of anammox bacteria-related 16S rRNA genes in coastal marine sediment in Japan. Microbes Environ. 2007, 22, 232–242. [Google Scholar] [CrossRef]
  51. Lefort, T.; Gasol, J.M. Global-scale distributions of marine surface bacterioplankton groups along gradients of salinity, temperature, and chlorophyll: A meta-analysis of fluorescence in situ hybridization studies. Aquat. Microb. Ecol. 2013, 70, 111–130. [Google Scholar] [CrossRef]
  52. Logares, R.; Brate, J.; Bertilsson, S.; Clasen, J.L.; Shalchian-Tabrizi, K.; Rengefors, K. Infrequent marine-freshwater transitions in the microbial world. Trends Microbiol. 2009, 17, 414–422. [Google Scholar] [CrossRef]
  53. Takai, K.; Campbell, B.J.; Cary, S.C.; Suzuki, M.; Oida, H.; Nunoura, T.; Hirayama, H.; Nakagawa, S.; Suzuki, Y.; Inagaki, F.; et al. Enzymatic and genetic characterization of carbon and energy metabolisms by deep-sea hydrothermal chemolithoautotrophic isolates of Epsilonproteobacteria. Appl. Environ. Microb. 2005, 71, 7310–7320. [Google Scholar] [CrossRef]
  54. Xiong, J.; Liu, Y.; Lin, X.; Zhang, H.; Zeng, J.; Hou, J.; Yang, Y.; Yao, T.; Knight, R.; Chu, H. Geographic distance and pH drive bacterial distribution in alkaline lake sediments across Tibetan Plateau. Environ. Microbiol. 2012, 14, 2457–2466. [Google Scholar] [CrossRef] [Green Version]
  55. Liu, Y.; Yao, T.; Jiao, N.; Tian, L.; Hu, A.; Yu, W.; Li, S. Microbial diversity in the snow, a moraine lake and a stream in Himalayan glacier. Extremophiles 2011, 15, 411. [Google Scholar] [CrossRef]
  56. Rodrigues, D.F.; Goris, J.; Vishnivetskaya, T.; Gilichinsky, D.; Thomashow, M.F.; Tiedje, J.M. Characterization of Exiguobacterium isolates from the Siberian permafrost. Description of Exiguobacterium sibiricum sp. nov. Extremophiles 2006, 10, 285–294. [Google Scholar] [CrossRef]
  57. Knudston, K.E.; Haas, E.J.; Iwen, P.C.; Ramaley, W.C.; Ramaley, R.F. Characterization of a Gram-positive, non-spore-forming Exiguobacterium-like organism isolated from a Western Colorado (USA) hot spring. Abstr. Annu. Meet. Am. Soc. Microbiol. 2001, 1, 30. [Google Scholar]
  58. Selvakumar, G.; Joshi, P.; Nazim, S.; Mishra, P.K.; Kundu, S.; Gupta, H.S. Exiguobacterium acetylicum strain 1P (MTCC 8707) a novel bacterial antagonist from the North Western Indian Himalayas. World J. Microbiol. Biotechnol. 2009, 25, 131–137. [Google Scholar] [CrossRef]
  59. Mohanty, G.; Mukherji, S. Biodegradation rate of diesel range n-alkanes by bacterial cultures Exiguobacterium aurantiacum and Burkholderia cepacia. Int. Biodeter. Biodegr. 2008, 61, 240–250. [Google Scholar] [CrossRef] [Green Version]
  60. Tan, L.; Qu, Y.; Zhou, J.; Li, A.; Gou, M. Identification and characteristics of a novel salt-tolerant Exiguobacterium sp. for azo dyes decolorization. Appl. Biochem. Biotechnol. 2009, 159, 728. [Google Scholar] [CrossRef]
  61. Rocha, L.L.; Colares, G.B.; Angelim, A.L.; Grangeiro, T.B.; Melo, V.M. Culturable populations of Acinetobacter can promptly respond to contamination by alkanes in mangrove sediments. Mar. Pollut. Bull. 2013, 76, 214–219. [Google Scholar] [CrossRef]
  62. Labbé, D.; Margesin, R.; Schinner, F.; Whyte, L.G.; Greer, C.W. Comparative phylogenetic analysis of microbial communities in pristine and hydrocarbon-contaminated Alpine soils. FEMS Microbiol. Ecol. 2007, 59, 466–475. [Google Scholar] [CrossRef] [Green Version]
  63. Beyer, A.; Rzanny, M.; Weist, A.; Moeller, S.; Burow, K.; Gutmann, F.; Neumann, S.; Lindner, J.; Muesse, S.; Brangsch, H.; et al. Aquifer community structure in dependence of lithostratigraphy in groundwater reservoirs. Environ. Sci. Pollut. R. 2015, 22, 19342–19351. [Google Scholar] [CrossRef]
  64. Mosier, A.C.; Francis, C.A. Relative abundance and diversity of ammonia-oxidizing archaea and bacteria in the San Francisco Bay estuary. Environ. Microbiol. 2008, 10, 3002–3016. [Google Scholar] [CrossRef]
  65. Saito, T.; Ishii, S.; Otsuka, S.; Nishiyama, M.; Senoo, K. Identification of novel Betaproteobacteria in a succinate-assimilating population in denitrifying rice paddy soil by using stable isotope probing. Microbes Environ. 2008, 23, 192–200. [Google Scholar] [CrossRef]
  66. Nishizawa, T.; Uei, Y.; Tago, K.; Isobe, K.; Otsuka, S.; Senoo, K. Taxonomic composition of denitrifying bacterial isolates is different among three rice paddy field soils in Japan. Soil Sci. Plant Nutr. 2013, 59, 305–310. [Google Scholar] [CrossRef] [Green Version]
  67. Ye, L.; Shao, M.; Zhang, T.; Tong, A.H.Y.; Lok, S. Analysis of the bacterial community in a laboratory-scale nitrification reactor and a wastewater treatment plant by 454-pyrosequencing. Water Res. 2011, 45, 4390–4398. [Google Scholar] [CrossRef]
  68. Barton, H.A.; Northup, D.E. Geomicrobiology in cave environments: Past, current and future perspectives. J. Cave Karst Stud. 2007, 69, 163–178. [Google Scholar]
  69. Rhee, J.Y.; Jung, D.S.; Peck, K.R. Clinical and therapeutic implications of Aeromonas bacteremia: 14 years nation-wide experiences in Korea. Infect. Chemother. 2016, 48, 274–284. [Google Scholar] [CrossRef]
  70. Sheng, Y.; Bibby, K.; Grettenberger, C.; Kaley, B.; Macalady, J.L.; Wang, G.; Burgos, W.D. Geochemical and temporal influences on the enrichment of acidophilic iron-oxidizing bacterial communities. Appl. Environ. Microb. 2016, 82, 3611–3621. [Google Scholar] [CrossRef]
  71. Tripathi, B.M.; Kim, M.; Kim, Y.; Byun, E.; Yang, J.; Ahn, J.; Lee, Y.K. Variations in bacterial and archaeal communities along depth profiles of Alaskan soil cores. Sci. Rep. 2018, 8, 504. [Google Scholar] [CrossRef] [Green Version]
  72. Hatosy, S.M.; Martiny, J.B.; Sachdeva, R.; Steele, J.; Fuhrman, J.A.; Martiny, A.C. Beta diversity of marine bacteria depends on temporal scale. Ecology 2013, 94, 1898–1904. [Google Scholar] [CrossRef] [Green Version]
  73. Stegen, J.C.; Lin, X.; Konopka, A.E.; Fredrickson, J.K. Stochastic and deterministic assembly processes in subsurface microbial communities. ISME J. 2012, 6, 1653. [Google Scholar] [CrossRef]
Figure 1. Geographical map of sampling locations in six boreholes.
Water 11 00804 g001
Figure 2. Sketch map of sampling depths (chimney filter) and displaying hydrochemistry type.
Water 11 00804 g002
Figure 3. δ2H versus δ18O values of the analyzed groundwater samples compared with the local meteoric water line and a conservative mixing line between precipitation and seawater.
Water 11 00804 g003
Figure 4. The composition of microbial communities in groundwater samples (A) at the phylum level (relative abundance > 1% at least one sample), (B) at the class level (relative abundance > 1% at least one sample), and (C) at the genus level (top 50).
Water 11 00804 g004
Figure 5. Neighbor-joining tree showing phylogenetic analysis of the representative OTUs (abundance > 1% at least one sample) in groundwater samples and reference 16S rRNA sequences from the NCBI GenBank. The OTUs were represented by more than 1% reads from a single station and/or from multiple stations within groundwater samples. The representative sequences obtained in this study are indicated in bold. Scale bars indicate the estimated number of nucleotide changes per sequence position. Bootstrap values of >50% (for 1000 iterations) are shown. Accession numbers of reference sequences are indicated in parentheses on the right side.
Water 11 00804 g005
Figure 6. (A) The tree figure of groundwater physicochemical properties based on Euclidean distance; (B) and hierarchical clustering tree of microbial communities based on the unweighted Unifrac distance.
Water 11 00804 g006
Table 1. Physicochemical parameters and isotopic geochemical results in the groundwater samples.
Geochemical TypeParameterQ132Q130Q143Q144Q146Q149
Physiochemical characterizationDepth (m)11–14.113–15.212.2–1536–5563–6636–40
Longitude (°)113.37 113.24 113.32 113.39 113.48 113.53
Latitude (°)23.10 23.06 22.85 22.81 22.81 22.68
Temperature (°C)24.525.824.9525.125.126
TOC (mg/L)3.530.30.532.012.853.08
TN (mg/L)32.4247.591.373.781.2787.27
TP (umol/L)2.580.560.680.561.040.8
NO2 (μg/L)27.6928.436.746.447.252.33
Cl (mg/L)92.518228.192089.12484.69451.713441.8
DO (%)60.828.54955.228.81.4
pH7.266.886.977.097.047.68
ORP(mV)−30.671.229.132.5−100.7−220.1
TDS (g/L)0.410.743.523.6110.7915.3
NO3 (mg/L)0.010.660.060.070.030.01
SO42− (mg/L)2.4581.19337.51.413757
HCO3 (mmol/L)6.49.397.982.270.180.26
K+ (mg/L)15.68.0148.3636.3465.27121.59
Na+ (mg/L)104.87158.351252.29538.252060.742456.13
Ca2+ (mg/L)47.68158.94286.51831.531754.09849.48
Mg2+ (mg/L)32.6537.29128.48127.44382.72539.06
Isotopic geochemical characterizationδD(‰)−43.25 −32.18 −33.21 −32.25 −28.13 −18.84
δ18O(‰)−6.33 −4.56 −5.54 −5.79 −4.28 −3.07
3H(T.U)<1.3<1.3<1.3<1.3<1.3<1.3
14C(BP)-1750 ± 15--4720 ± 808820 ± 40
water typeconfined waterconfined waterconfined waterconfined waterconfined waterconfined water
ND, not detected. TOC: Total Organic Carbon; TN: Total Nitrogen; TP: Total Phosphorus; ORP: Oxidation-Reduction Potential; TDS: Total Dissolved Solids.
Table 2. Diversity indices of the analyzed groundwater microbial assemblages.
SamplesObserved OTUsShannonSimpsonACEChaoHeipCoverage (%)
Q1302833.31 0.07 314.31 312.22 0.09 99.83
Q1322883.54 0.06 310.27 307.50 0.12 99.86
Q1432672.48 0.24 291.99 290.76 0.04 99.84
Q1443082.60 0.18 341.51 343.36 0.04 99.80
Q1462371.85 0.26 271.93 264.13 0.02 99.81
Q1492432.15 0.21 279.99 278.78 0.03 99.80

