Article

Estimation of Urbanization Impacts on Local Weather: A Case Study in Northern China (Jing-Jin-Ji District)

1
Department of Hydraulic Engineering, Tsinghua University, Beijing 100084, China
2
The State Key Laboratory of Simulations and Regulations of Water Cycles in River Basins (SKL-WAC), China Institute of Water Resources and Hydropower Research (IWHR), Beijing 100038, China
3
Laboratory of Spatial Information Integration, Institute of Remote Sensing and Digital Earth, Chinese Academy of Sciences, Beijing 100101, China
*
Author to whom correspondence should be addressed.
Water 2019, 11(4), 797; https://doi.org/10.3390/w11040797
Submission received: 6 January 2019 / Revised: 19 March 2019 / Accepted: 1 April 2019 / Published: 17 April 2019

Abstract

:
With the past rapid economic development and large population growth, Jing-Jin-Ji District has been undergoing rapid urbanization, which has caused considerable regional weather changes in local regions. In this paper, we used the Weather Research and Forecasting (WRF) model to quantitatively analyze the effects of past urbanization and potential future urbanization on the regional weather in the center of Jing-Jin-Ji District. The hydrometeorological data from two weeks in July 2019 were used to simulate the influence of urbanization on local weather in the Jing-Jin-Ji District at regional scales using a single-layer canopy parameterization scheme. To better quantify the differences in temperature and precipitation induced by urbanization, three simulation scenarios were designed, which were no urban cover (NU), current urbanization cover (CU), and full urban land cover (FU), respectively. The results showed that: (1) Urbanization progress (from NU to CU and from CU to FU) in Jing-Jin-Ji District increased the daytime temperature, night temperature, and temperature difference between day and night, while decreasing the total rainfall and peak rainfall. (2) Compared with NU, the mean temperature of the CU and FU increased 0.3 K and 0.6 K, respectively, and the mean precipitation of CU and FU decreased by approximately 6% and 8.4%, respectively. (3) The main influence of urbanization on weather was reflected by the maximum temperature and peak rainfall, while the other impacts were relatively insignificant. (4) Compared with NU, the maximum temperature of CU and FU increased 0.82 K and 1.35 K, respectively, and the peak rainfall of NU and FU decreased by approximately 9.5% and 19.0%, respectively; The results of this study bring to light the urban management strategies for policy makers.

1. Introduction

Urbanization refers to the process in which the original, natural land surface is replaced by an artificial surface. Urbanization changes the surface roughness, the radiation and the thermal and dynamic characteristics of the underlying surface, and the atmosphere of the city; additionally, urbanization causes the energy and moisture balance to differ from the surrounding environment, which has impacts upon temperature and precipitation.
Many studies have reported on the effects of urbanization, including urban climate [1,2], urban heat islands [3,4,5,6,7,8,9], contributions of urban environments to global warming [10], changes in precipitation [2,11,12], and reductions of air moisture and evaporation in cities [13].
One important issue that has been widely studied is the effect of urbanization on temperature. Cities have experienced more significant warming than the mean annual surface air temperature change. Based on observation data from 1219 stations across the United States, Karl [14] established the relations between the warming effect and urban growth. Ren, et al. [15] used data from 282 meteorological stations in North China to investigate the effect of urbanization on surface air temperature trends, and found that the largest effect of urbanization on temperature occurred in large cities, with an urban warming rate of 0.16 °C per decade. Jones et al. [16] used sea surface temperature (SST) data to assess the possible urban influences of the East China mainland, and found that urban-related warming over China was approximately 0.1 °C every 10 years during the period of 1951–2004, with climatic warming accounting for 0.81 °C over this period. Based on a reanalysis of global weather data from 1950 to 1999, Kalnay [17] suggested that half of the observed decrease in the diurnal temperature range in the continental United States was due to urban and other land-use changes. They estimated that the mean surface warming per century due to land-use changes was 0.27 °C.
Another important issue that has been widely studied is how urbanization changes the distribution of precipitation. Urbanization impacts precipitation by changing the atmospheric thermal and dynamic conditions in the urban atmospheric environment, which can be attributed to urban heat islands [18,19,20], underlying surface changes [21,22] and aerosol emissions [23,24,25]. Many early observational and modeling studies indicated that the rainfall patterns, quantities and distributions in and downwind of cities could be modified [11,26,27,28]. Landsberg [29] found a 9–17% increase in warm-season rainfall over and downwind of major urban cities. The results also showed that urban effects led to precipitation that was 5–25% higher than background values within cities and in the area 50 to 75 km downwind from cities during the summer season [30]. Bornstein and LeRoy [31] found that the formation and movement of summer daytime thunderstorms were affected by New York City, and that the maximum radar echoes were produced on the lateral edges of the city, and downwind from the city. Jaurequi and Romales [32] found that the frequency of intense rain showers has increased in recent decades in Mexico City. Bornstein and Lin [26] analyzed data from a surface meteorological network around Atlanta to show that the urban heat island (UHI) effect induced a convergence zone that initiated storms during the summer of 1996.
The studies cited above demonstrated that the effects of urbanization varied with the local topography and atmospheric circulation, and the levels of urbanization in different regions of the city had different effects on the urban climate. However, most previous studies have focused on observational data analysis [33], and numerical simulations are relatively scarce. Previous studies have also mainly focused on the effects of urbanization on climate over large cities or regions [34,35,36], and little research has focused on the impact of urbanization on climate in suburban areas or rural-suburban-urban areas. Furthermore, current research on the effects of urbanization using the Weather Research and Forecasting (WRF) model has been conducted using only two scenarios, and the use of three scenarios has rarely been reported. Therefore, further studies are necessary to investigate the effects of different urbanization locations and time scales on city climates, using three scenarios.
The Jing-Jin-Ji Economic Belt (or Jing-Jin-Ji District), with its counterparts the Pearl River Delta, and Yangtze River Delta, are the three most developed metropolitan circles in China. The belt comprises Bei-Jing, Tian-Jin, and Ji (also known as Hebei Province), which has been undergoing rapid urbanization. Take Beijing as an example, which is the capital of the People’s Republic of China, where the city has experienced rapid economic development and an explosive growth in the urban population (i.e., the population size increased from 8.7 million people in 1978 to 21.7 million people in 2017, nearly three times that of 1978). In the past forty years, Beijing has been undergoing rapid urbanization, leading to significant climate change and environmental issues.
For example, the large-scale urbanization process increases the probability of an urban “dry island effect” [37], a city heat wave, fog and haze weather, and other phenomena in cities [38], and these events may cause widespread panic and hazards. Additionally, “Xiongan New Area” was approved as a national-level new area by the State Council in 2017, and since then, the project was under construction. It means another considerable urbanization in Jing-Jin-Ji District in the future. Thus, to study and develop effective strategies for Jing-Jin-Ji District, a deeper understanding of the influence of urbanization on regional weather is necessary. In this paper, the WRF model was applied to simulate the influence of urbanization on regional weather in the center of the Jing-Jin-Ji District at regional and short time scales. Due to the potential possibility of urbanization, we selected the junction of Bei-Jing, Tian-Jin, and Hebei Province as the research domain, which was indeed the center of this Jing-Jin-Ji District. In order to investigate the impact of urbanization on precipitation and temperature, we chose a typical moderate rainfall in the area (a more frequent rainfall). And three scenarios we designed and modeled: (i) No urban cover, all cover is grass (NU); (ii) current urbanization cover, semi grass and urban (CU); and (iii) full urban land cover, all cover is urban (FU). By comparing the simulations of these three scenarios, the differences in temperature and precipitation were more convincingly quantified. The results of this study bring to light the urban management strategies for policy makers.

2. Methodology and Case Study Design

2.1. Study Area

The Jing-Jin-Ji District is a common abbreviation used to refer to the close socio-economic ties of Bei-Jing, Tian-Jin, and Hebei Province (Hebei Province is also called Ji for short), and this region is a well-known economic development center in China, with a large population size (110 million). Jing-Jin-Ji District is located in the northern part of the North China Plain, and is surrounded by mountains on the western, northern and eastern sides (Figure 1). Jing-Jin-Ji District has a total area of 218,000 km2 (84170 sq. mi.). In 2016, the gross domestic product of Jing-Jin-Ji District totaled 7461.26 billion-yuan, accounting for 10% of the country’s total.
Due to the Siberian air masses that move southward across the Mongolian Plateau, Jing-Jin-Ji District has a typical continental monsoon climate, and its winters are cold and dry. The summers are hot due to the warm and humid monsoon winds from the southeast that bring the city most of its annual precipitation of approximately 600~700 mm; furthermore, most precipitation falls in July and August. The distribution of buildings and vegetation in the center of the city remain basically unchanged in future. However, in the center of Jing-Jin-Ji District, there is still ample space for urbanization. Therefore, the suburban region is more suitable for use as our study area. However, the District recently faced severe water-related problems, including urban flooding, water shortages, and water pollution. Figure 1 presents the location of the study area and the meteorological stations that collected the precipitation and temperature data.

2.2. WRF Model

The Weather Research and Forecasting (WRF) model, which was used here to investigate the influence of urbanization in Jing-Jin-Ji District, is a mesoscale numerical weather forecasting system designed to serve both atmospheric research and operational prediction needs. The WRF model was developed by the National Center for Atmospheric Research, USA (NCAR), the National Oceanic and Atmospheric Administration, USA (NOAA), the National Centers for Environmental Prediction, USA (NCEP), the Forecast Systems Laboratory (FSL), and other collaborators. The WRF model is suitable for studies that examine different scales of atmospheric phenomena, and can be used in fully compressible and nonhydrostatic conditions. Further descriptions of the WRF model can be found at the website http://www.wrf-model.org/index.php.

2.3. Experiment Design

The WRF model was configured with two one-way nests (offline, without feedback) of 3 × 3 km (d 01) and 1 × 1 km (d 02), with a center at (116.6° E, 39.5° N). Both nests comprised 108 × 108 grids points. The simulation domain 01 covered most of the Jing-Jin-Ji District. The simulation domain 02 is located in the center of the Jing-Jin-Ji District, which was adjacent to the Xionan New Area. The relevant model parameterizations included the following: num_metgrid_levels was thirty-two and num_metgrid_soil_levels was four; mp_physics used WRF Single—Moment 6 class microphysics scheme (WSM6) [39,40]; cu_physics was off; ra_lw_physics and ra_sw_physics used NCAR Community Atmosphere Model Version 3 (CAM3) [41]; sf_surface_physics used Noah Land Surface Model (LSM) [42]. The initial conditions and lateral boundary conditions data were obtained from NCEP Global Final Analysis 6 h data with a horizontal resolution of 1° × 1°. We performed the simulations from 08:00 UTC+8 on 17 July 2017, to 08:00 UTC+8 on 1 August 2017, which period includes two weeks and two rainfall events. We chose the temperature and rainfall of the two weeks for further analysis over the inner domain (d 02). The output of results is 1 h a time.
For the 1-km nest, three scenarios were designed: Case full urban land cover (FU), case current urbanization cover (CU), and case no urban cover (NU). In case FU, the area was completed covered by urban areas. In case CU, the area was covered by current land use category. In case NU, all area cover was replaced by grassland, which was the natural land-use type surrounding the urban area in this region. Cases FU, CU, and NU were compared to study the influence of urbanization in this area. Figure 1 illustrates the land-use category and hydrometeorological data distribution in our simulation domain.

3. Results and Discussion

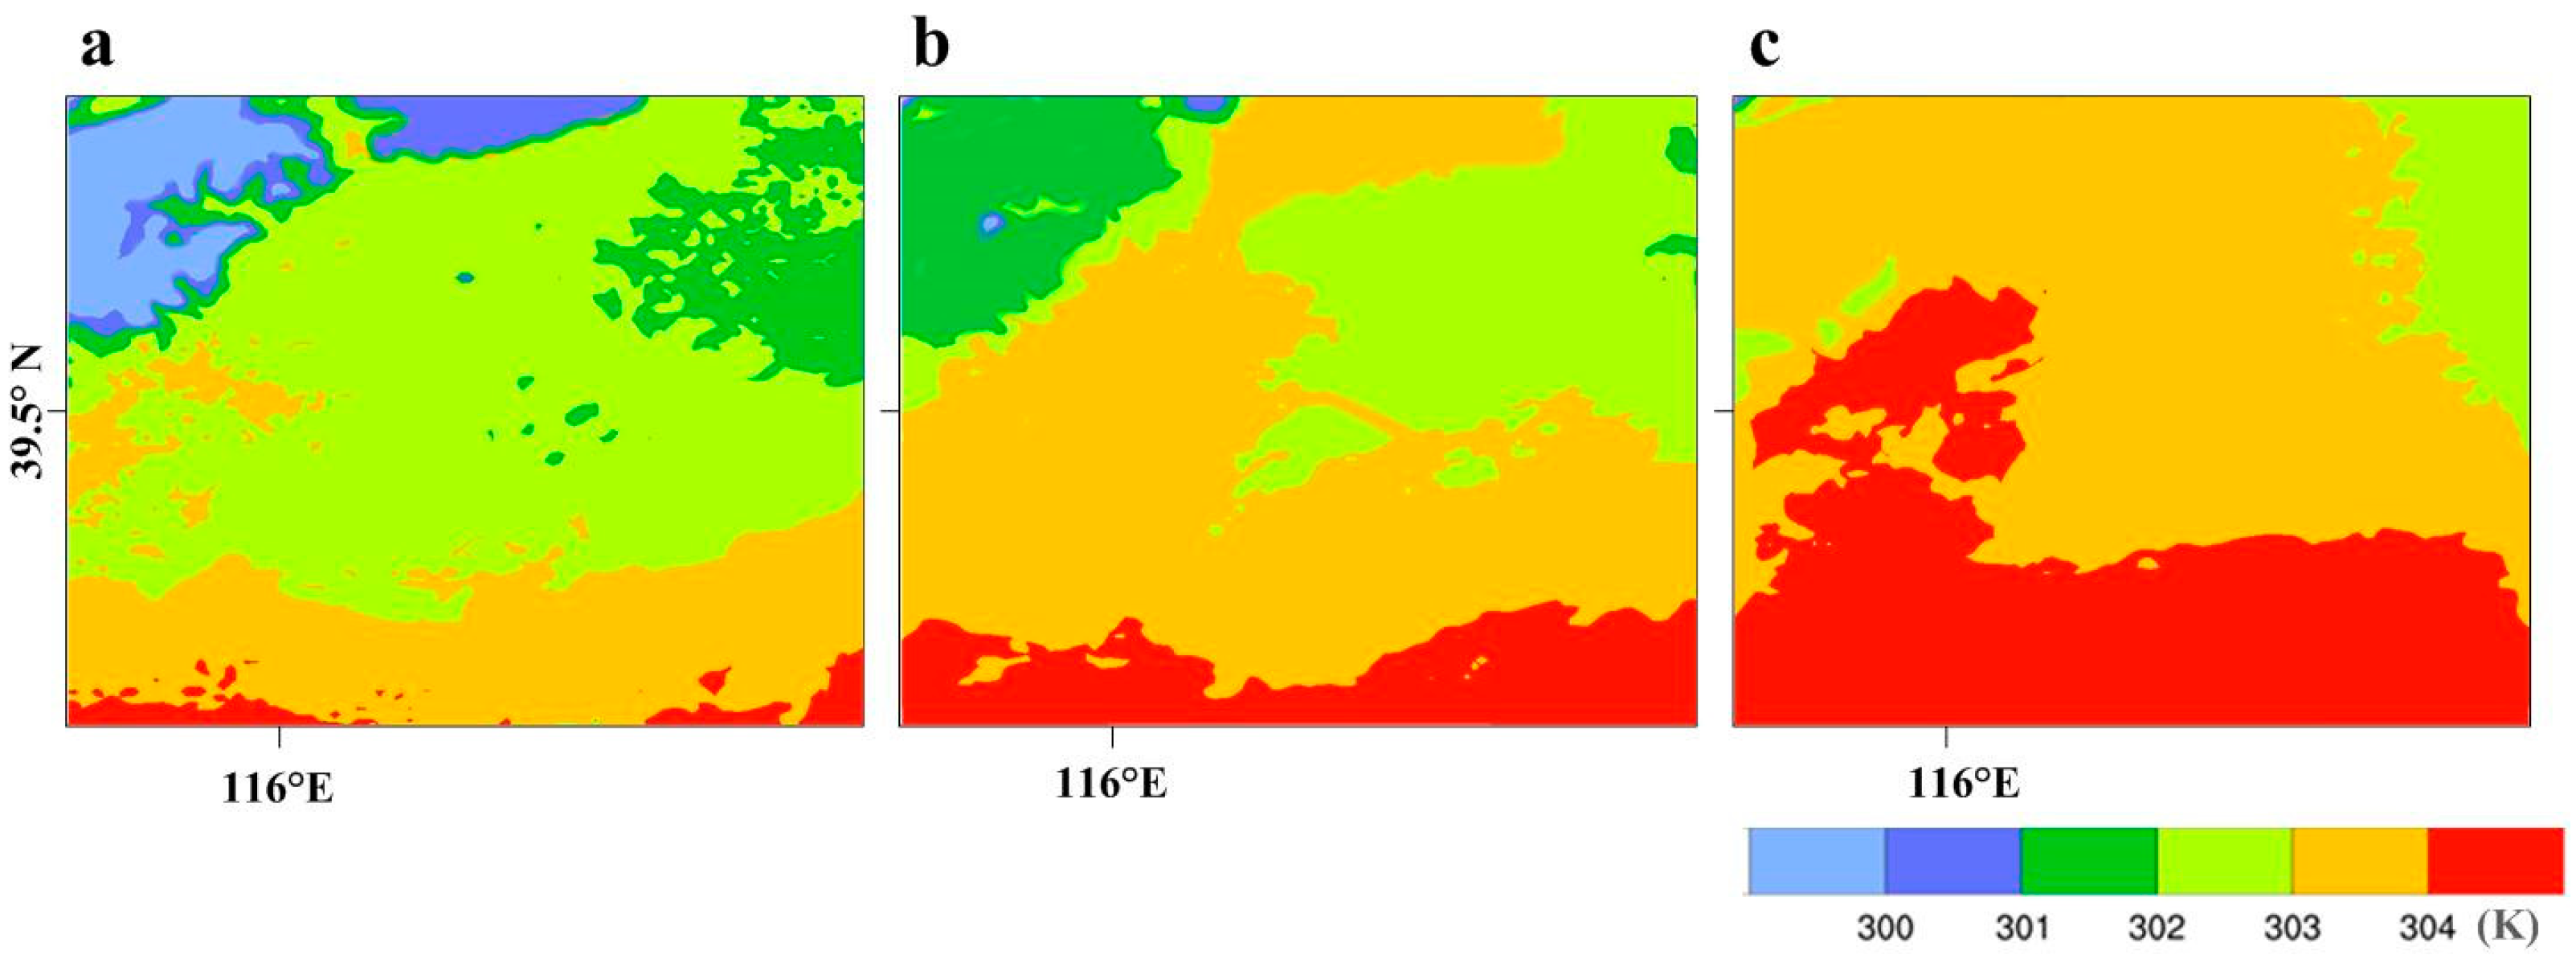
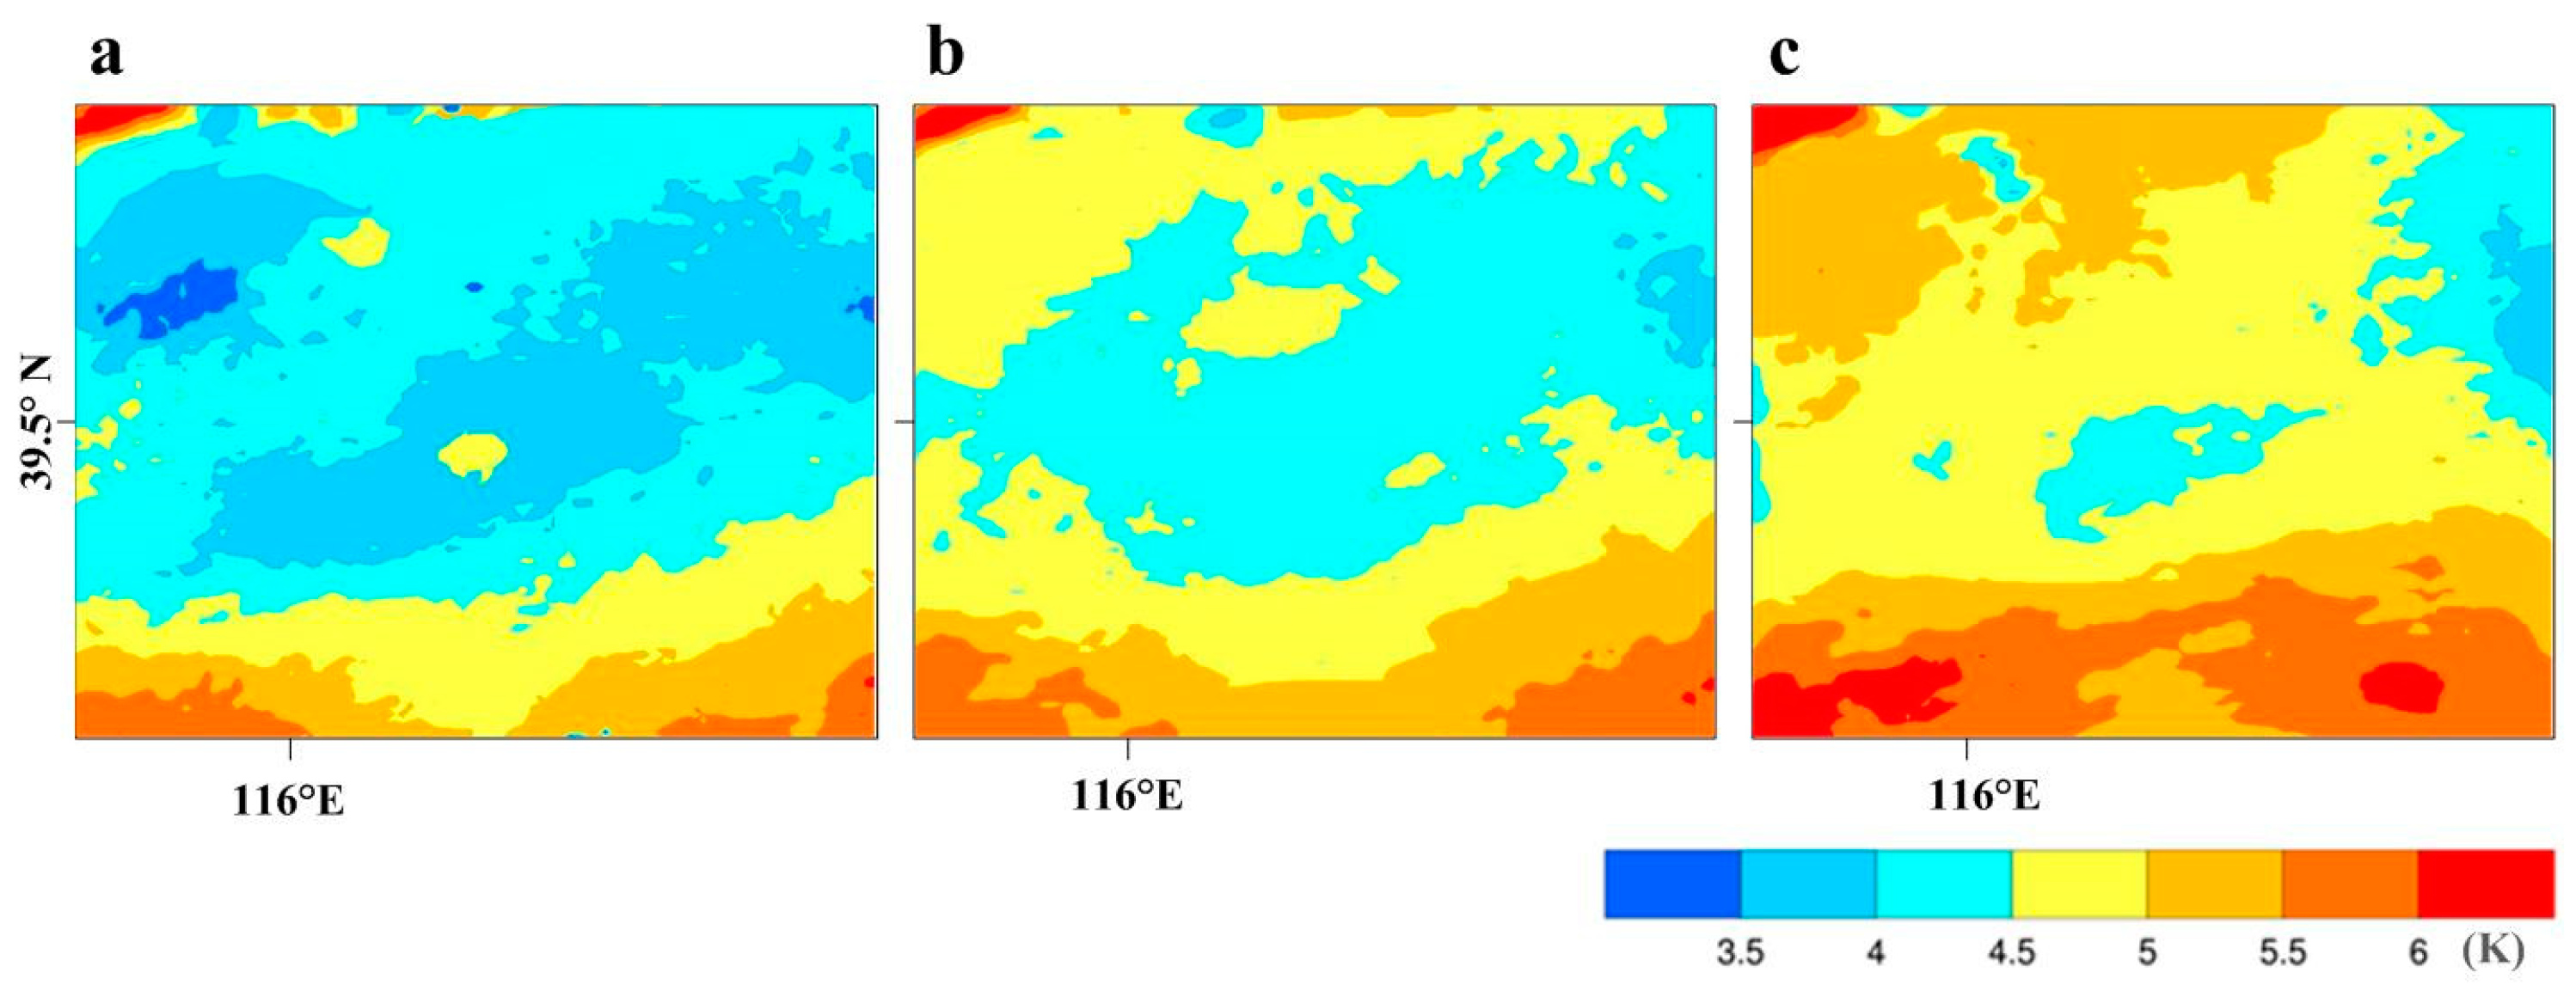
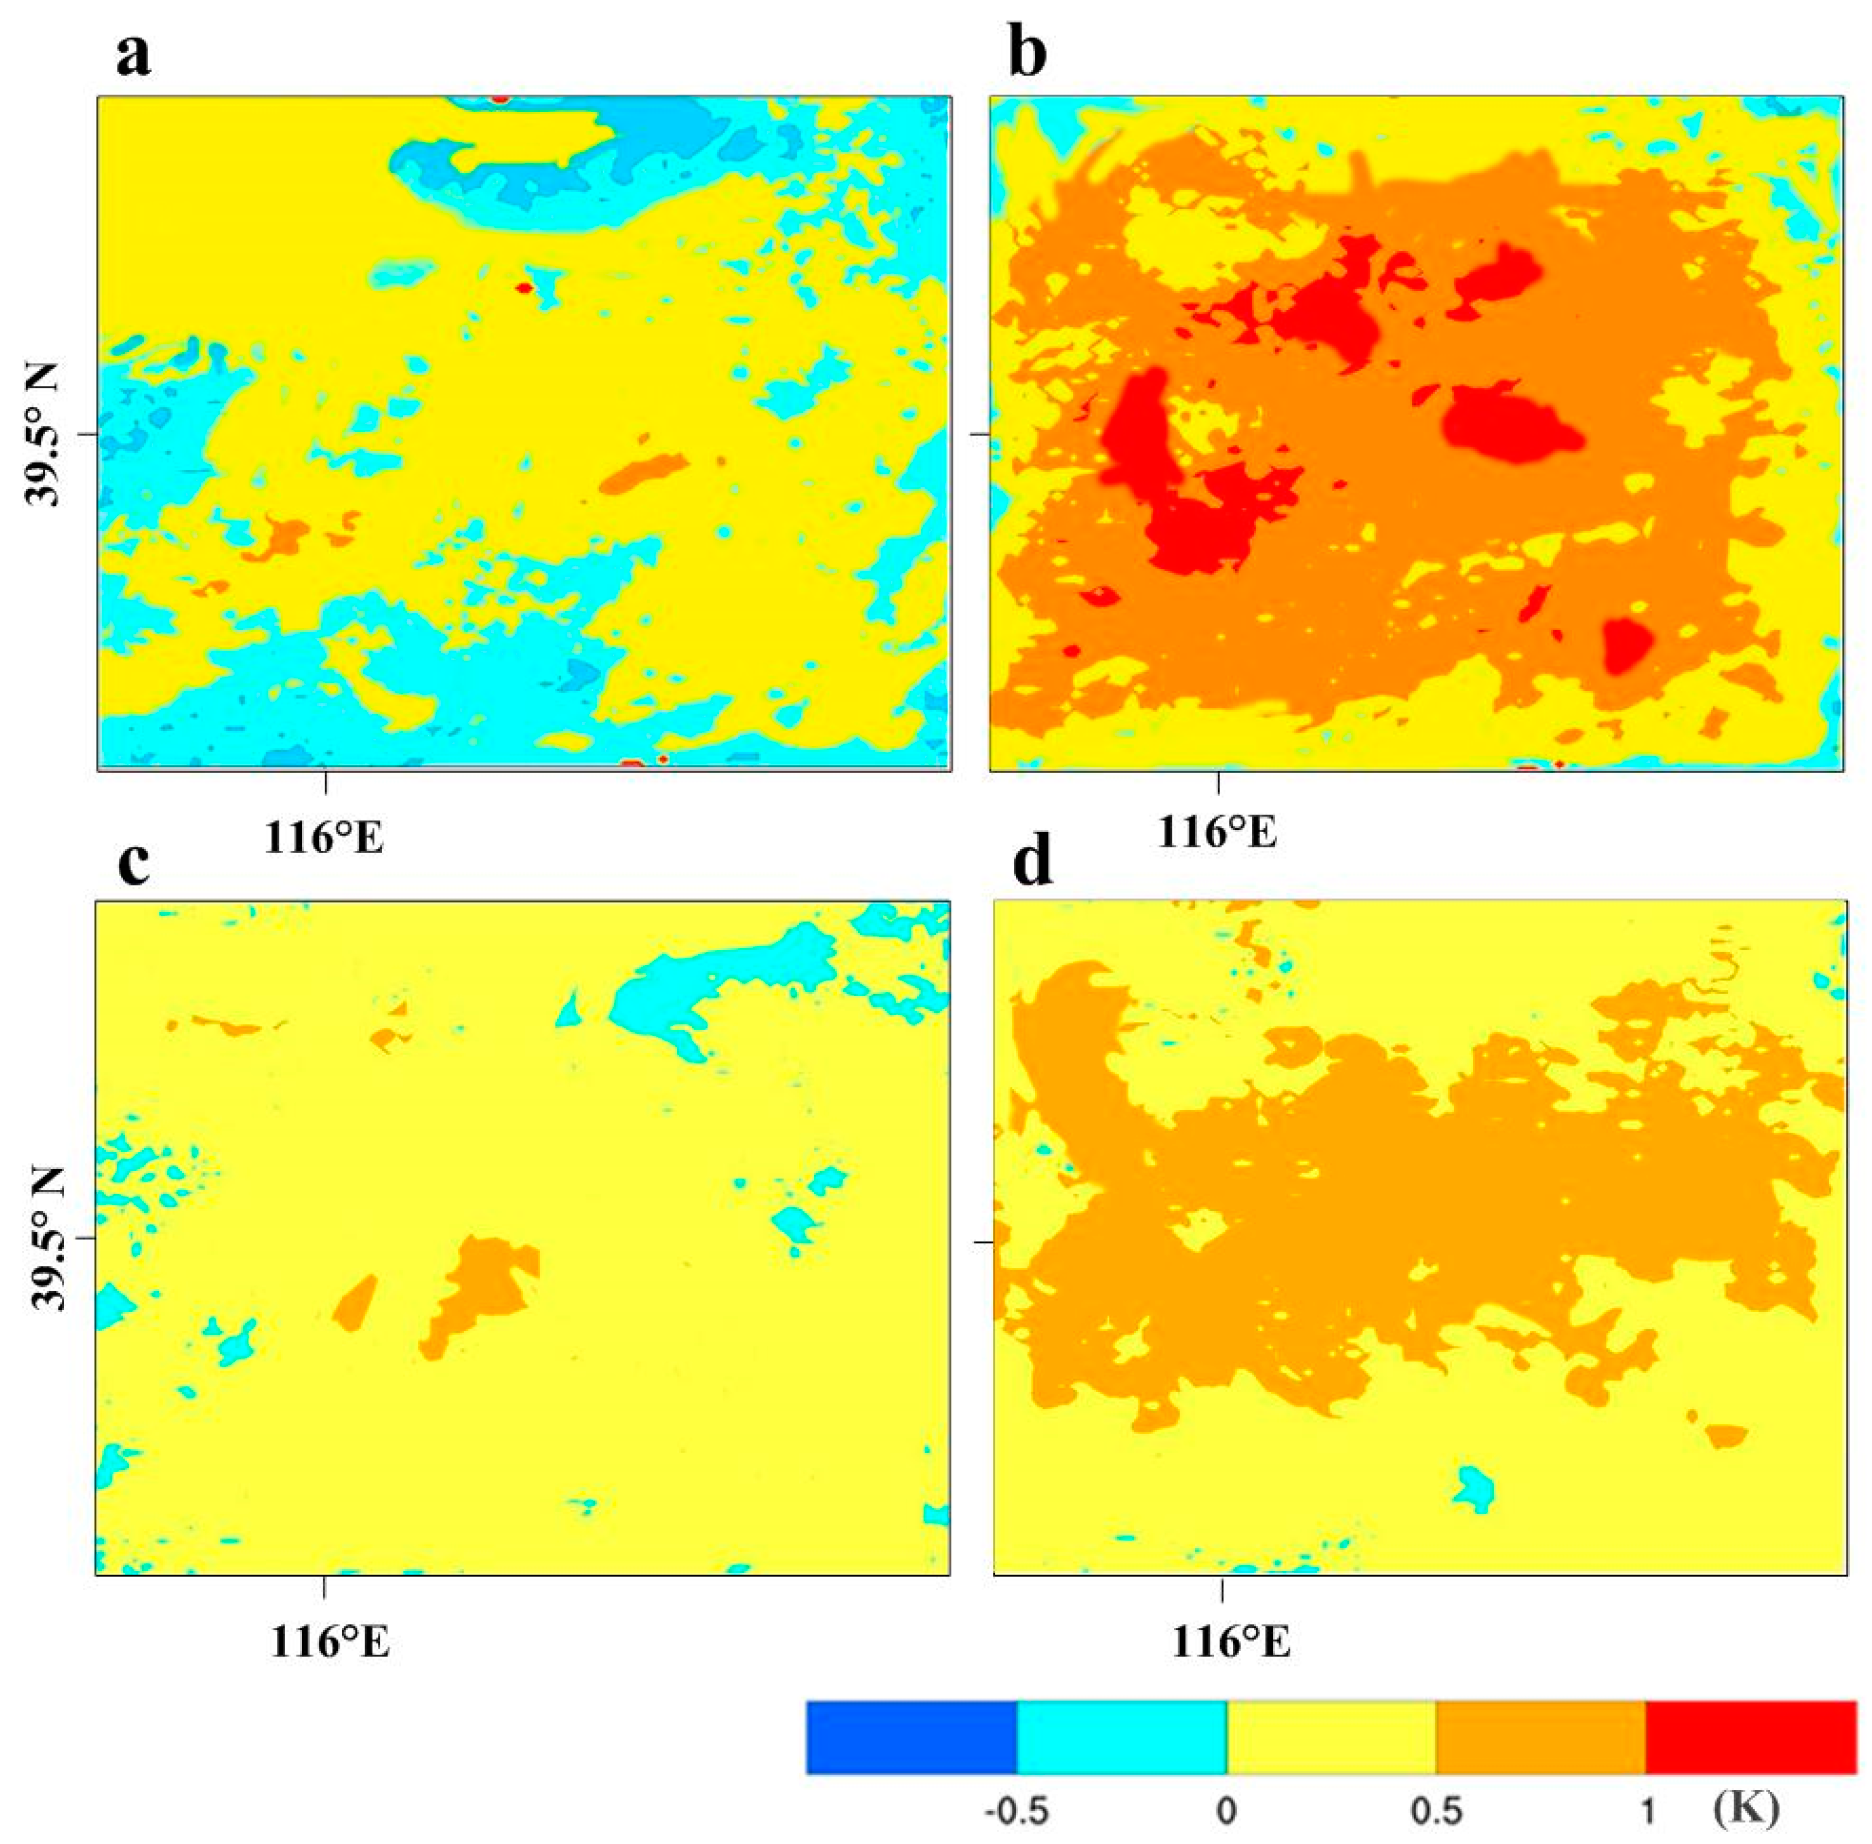
3.1. Impacts of Urbanization on the Temperature

To conduct a deep analysis of the influence of urbanization on temperature, we choose the mean value of the two-week period (from 17 July to 1 August) for further analysis. And we analyzed the results of d 02, including the following: (1) Daytime temperature contrast among three scenarios, (2) night temperature contrast among three scenarios, (3) temperature difference between day and night, and (4) temperature difference among three scenarios.
(1) Daytime temperature contrast among three scenarios
The average air temperature at 2 m above the land surface during the daytime (i.e., from 11:00 to 15:00) was simulated based on the WRF model (Figure 2). Among them, a, b and c indicate the grassland, the current/present suburban underlying surface, and the fully urbanized underlying surface, respectively.
As shown in Figure 2, the average daytime temperature was between 299 K and 305 K. It is clearly identified that four major regions exist in the research area, including the cold region (298 K~299 K) in the northwest of the map, the light-yellow region (302 K~303 K) in the middle of the map, the orange region (303 K~304 K) in the middle and south of the map, and the red region (304 K~305 K) in the south of the map, respectively. From (a) to (b) and from (b) to (c), as shown in Figure 2, the area between 301 K~303 K decreased gradually, while the areas between 303 K~305 K increased significantly, especially the red area of FU. The results can be concluded that daytime temperatures increased in the study area. In Figure 1, the current urban area and shrublands area is at the top of the figure. Yet in Figure 2a, there are some little warmer temperatures at the top of the figure than in Figure 2b, which suggests that removing the current urban land cover, and replacing it with grass would make the regions warmer somewhere. This may be due to the influence of the surrounding environment, which makes it a certain variation of the temperature in the simulated boundary area. But in general, urbanization increases the temperature of the simulated area. Therefore, compared with NU, the daytime temperature of CU and FU increased, while the daytime temperature of FU increased by a greater extent. In other words, urbanization increased the daytime temperature of Jing-Jin-Ji District.
The order of daytime temperature was NU < CU < FU. The main reasons why urbanization increased the daytime temperature were as follows: (i) With the development of urbanization and the replacement of grassland with urban land, the surface roughness of the whole area increased. Therefore, the wind speed of the urban area decreased as the temperature increased. (ii) Compared with flat grassland, the walls of buildings can absorb and store more heat due to multiple solar reflection and radiation from the urban buildings. (iii) The urban area is covered with a large area of dry impermeable asphalt and concrete surface, which will lead to less heat consumption by evaporation. The grassland has more vegetation for the processes of transpiration and evapotranspiration to consume energy, thus reducing the land surface temperature. Finally, (iv) there are more man-made sources of heat in the city.
(2) Night temperature contrast among three scenarios
The average night (from 24:00 to 3:00) temperature of the surface at 2 m was simulated based on the WRF model (Figure 3a–c) are the results simulated by NU, CU, and FU, respectively.
From Figure 3, we can see that the average night temperature is between 295 K and 300 K, which is lower than the average daytime temperature. It is clear that three major regions exist in the research area, including the cold region between 295 K~298 K in the northwest of the map, the region between 298 K~299 K in most of the central part of the map, and the sparkly red region between 299 K~300 K. In the three scenarios, the minimum temperature and its range at night were almost unchanged, which were similar to the daytime results. From (a) to (b) and from (b) to (c), as shown in Figure 3, the area between 297 K~298 K decreased gradually, while the red district (294 K~297 K) increased significantly, especially the red area of FU. It shows that urbanization increased the night temperature. The prominent red area in the middle of Figure 3c is most noticeable, and this area indicates that the night temperature of FU increased very remarkably. Compared with NU, the temperature of CU and FU increased, while the temperature of FU increased the most. Therefore, the results mean that the temperature increased gradually from (a) to (c). In other words, with the development of urbanization, the night temperature of Jing-Jin-Ji District increased. This result is because (i) there are many man-made sources of heat in the city; (ii) there are more windshield buildings in the urban area, which decrease the wind speed and then reduce the heat of convective radiation; and (iii) there are more particulate pollutants in the urban atmosphere, which increase the downward atmospheric radiation at night, and form a layer of thermal insulation.
Therefore, compared with NU, the temperature of CU and FU increased, and the temperature of FU increased the most. And it could be concluded that urbanization increased the temperature during the night in Jing-Jin-Ji District. The order of night temperature was NU < CU < FU.
(3) Temperature difference between day and night
Figure 4 shows the effects of urbanization on the temperature difference between day and night, which is equivalent to the daytime temperature minus the night temperature. It can be seen from Figure 4 that the temperature difference between day and night is between 3 K and 6.5 K, and it is relatively larger in the southern area, where the distribution is the same as the red area in Figure 2. From (a) to (b) and from (b) to (c), as shown in Figure 4, the yellow, orange, and red regions became increasingly larger, which indicated that the temperature difference between day and night increased gradually. It can be concluded that the temperature difference between day and night under different land surfaces at 2 m was NU < CU < FU. Therefore, from (a) to (c), the temperature difference between day and night increased gradually. In other words, with the development of urbanization, the temperature difference between day and night in the center of the Jing-Jin-Ji District increased. According to the conclusions of Figure 2 and Figure 3, both the daytime temperature and the night temperature increased. However, the temperature difference between day and night still increased. Therefore, the main reason for the increase in the temperature difference between day and night is the larger increase in daytime temperature than in night temperature.
Compared with the daytime, the night temperature is approximately 4 degrees lower than that in the daytime, and the temperature difference among the three-night scenarios was smaller than that in the daytime. The surface temperature of NU is relatively close to the temperature of the underlying surface of the city, while the temperature of FU is 1 degree higher than that of CU and NU at night.
(4) Temperature difference among the three scenarios
To clearly contrast the effect of urbanization on temperature among these three scenarios, the temperature differences were analyzed among the three scenarios (Figure 5a,b), and shown in Figure 5 are the daytime temperatures of CU minus NU and FU minus CU, respectively; (c) and (d) shown in Figure 5 are the night temperatures of CU minus NU and FU minus CU, respectively.
From the map, we can see that the mean temperature difference in (a), (b), (c), and (d) are almost all positive values, except for a part of (a). It can be concluded that, whether during daytime or at night, the temperature increased from scenarios (a) to (b) and to (c). In other words, urbanization (NU-CU-FU) increased both daytime temperature and night temperature. Compared with (c) and (d), (a) and (b) had larger temperature differences, which indicated that urbanization more obviously increased daytime temperature.
Compared with (a) and (c), (b) and (d) had a larger temperature difference. This result demonstrated that the progression of urbanization from CU to FU increased the temperature more than did the progression of urbanization from NU to CU. Therefore, this method predicts that the future progression of urbanization in Jing-Jin-Ji District will result in higher temperatures than those seen in the past.

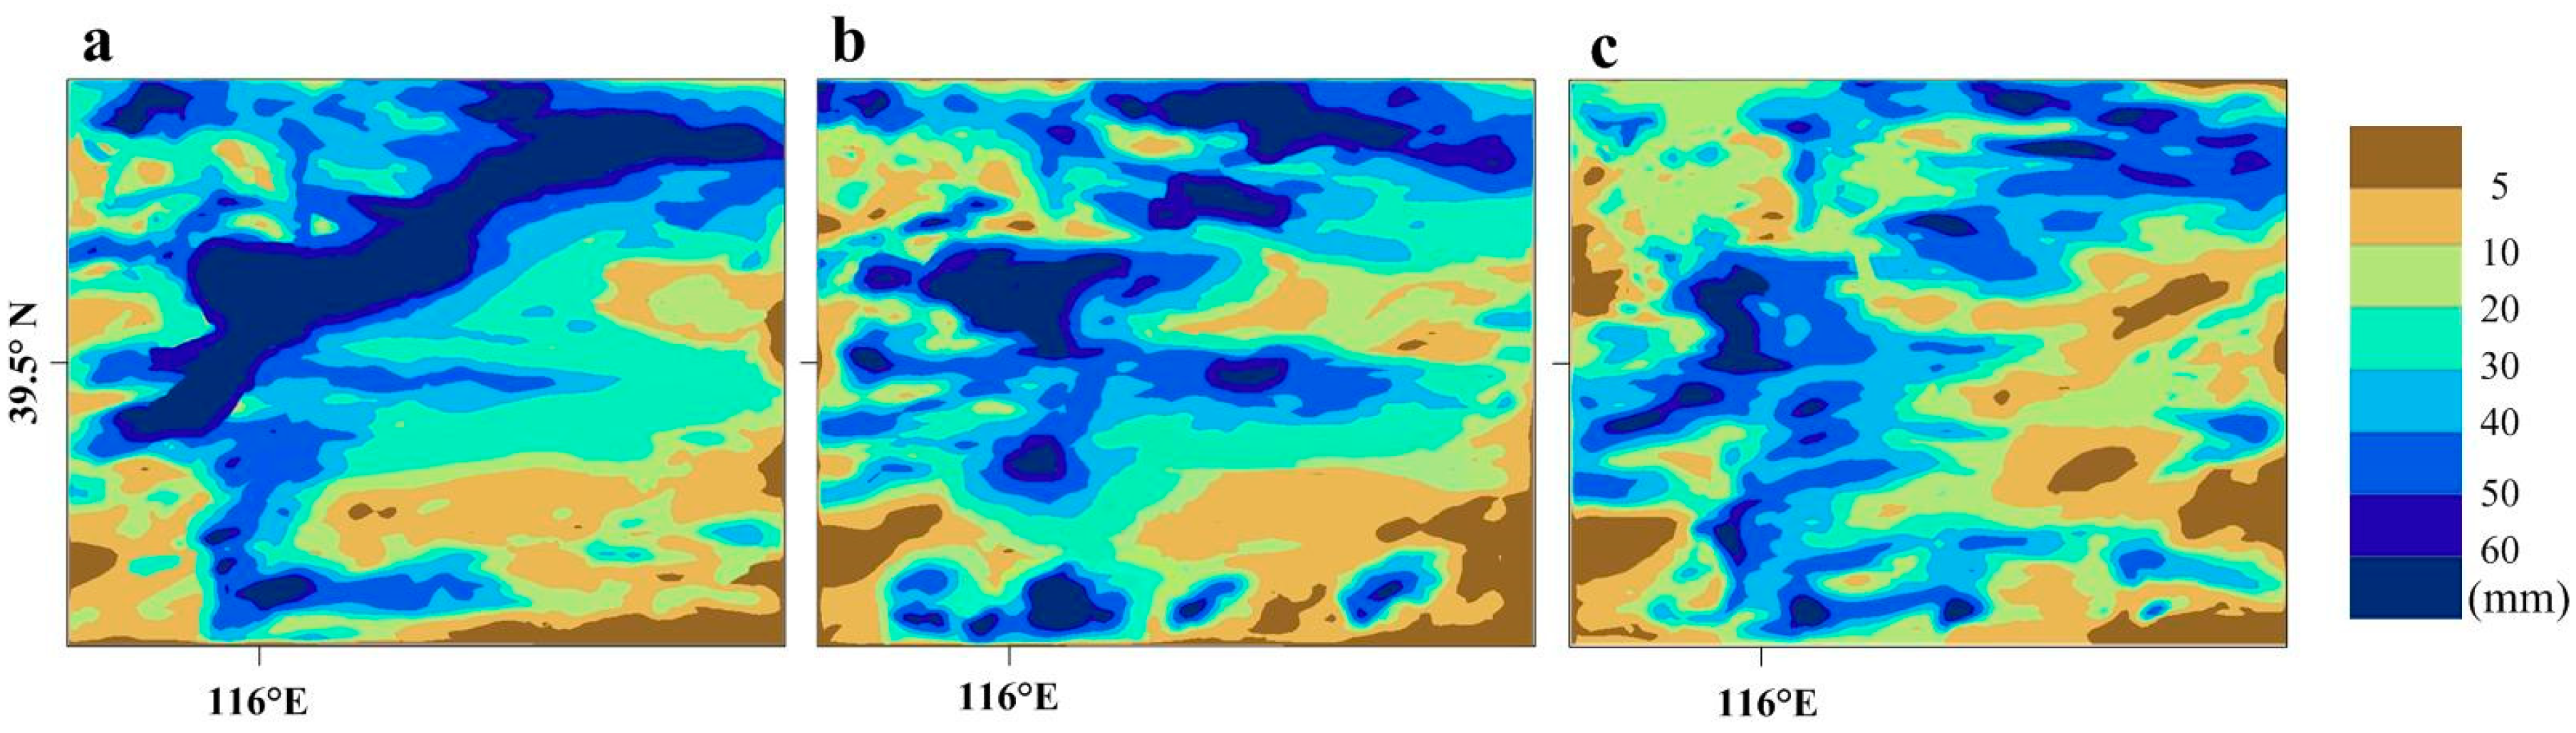
3.2. Influence of Urbanization on Rainfall

The comparison of the distribution of total precipitation under the three scenarios of NU, CU, and FU during two weeks (Figure 6). As shown in Figure 6, the total rainfall decreased with the development of urbanization. The precipitation distribution is very uneven in this area. The maximum amount of rainfall can reach more than 60 mm; however, the lowest rainfall region has areas of no rain. The major region of precipitation is concentrated from the northeast to the southwest.
We make comparison diagrams of the peak rainfall of two rainfalls in three scenarios (Figure 7). There are two rainfall events in the two weeks we simulated. One is a heavy rain (20–21 July), the other is light rain (25 July). As shown in Figure 7, both rainfall peaks decreased with the development of urbanization. Urbanization will increase impermeable areas and reduce natural vegetation areas, resulting in a reduction of surface evaporation and the local atmospheric water supply, thereby deepening the boundary layer height and enhancing atmospheric water mixing, which eventually reduces precipitation. Zhang, et al. [43] found that urbanization in Beijing reduced the amount of rainfall. The same results were found in coastal cities in China, including the Pearl River Delta [44], the Yangtze River Delta [45], and the Jing-Jin-Ji District [46]. These studies agreed well with these results of ours, and our study is more detailed in a short time scale.

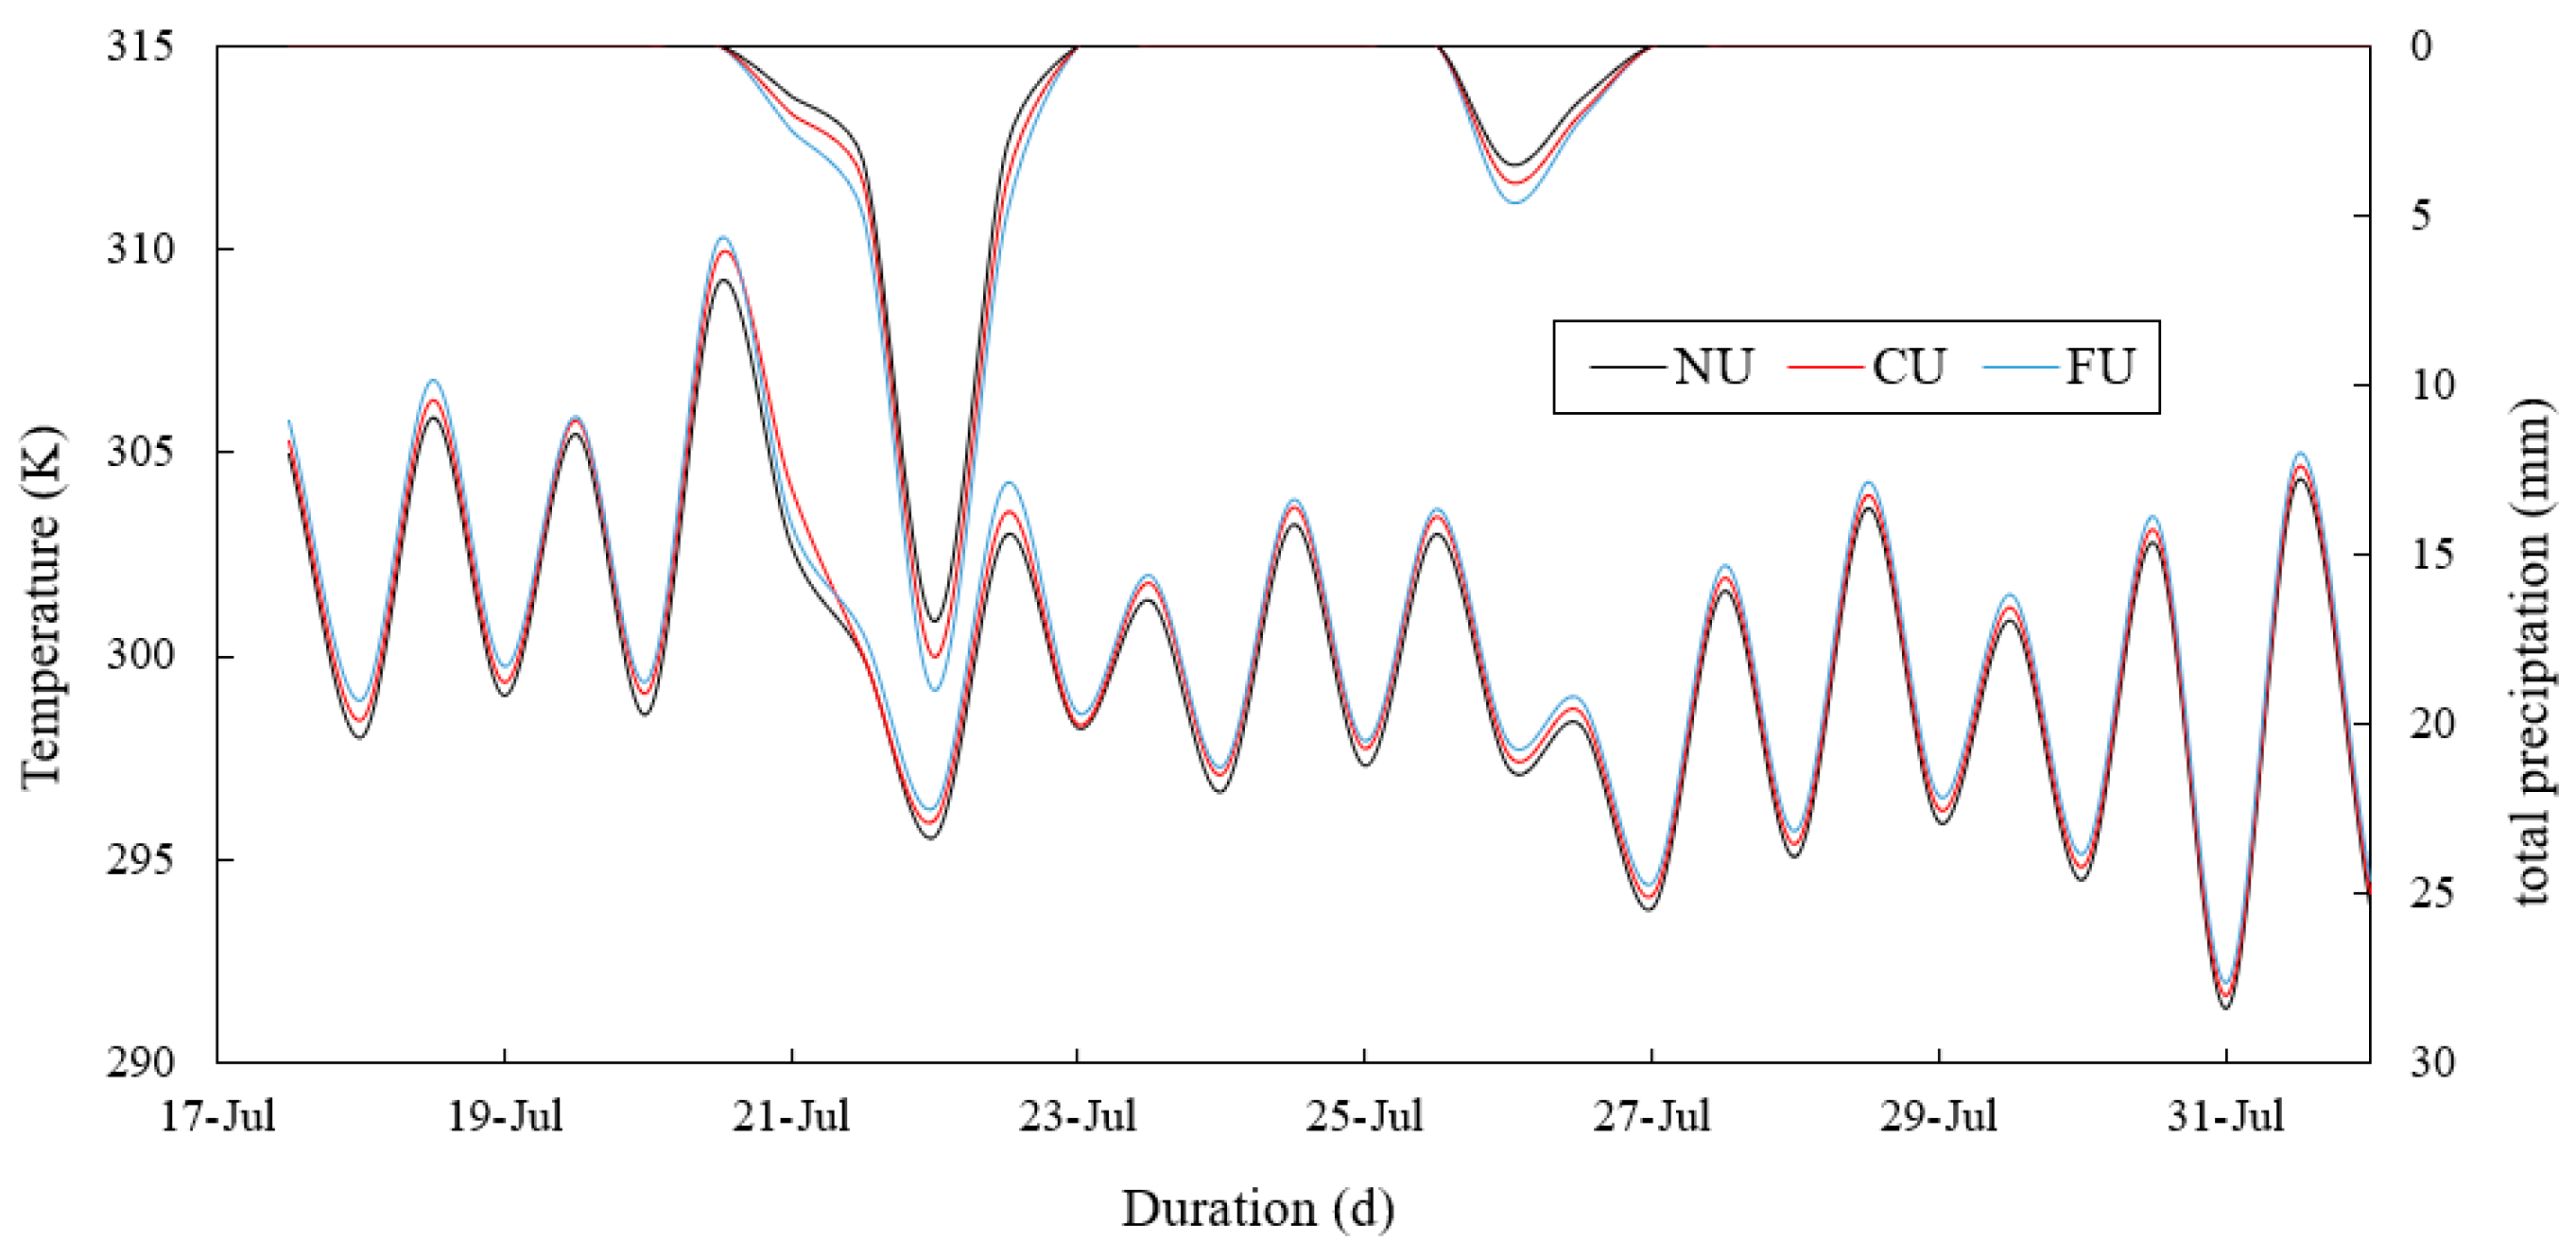
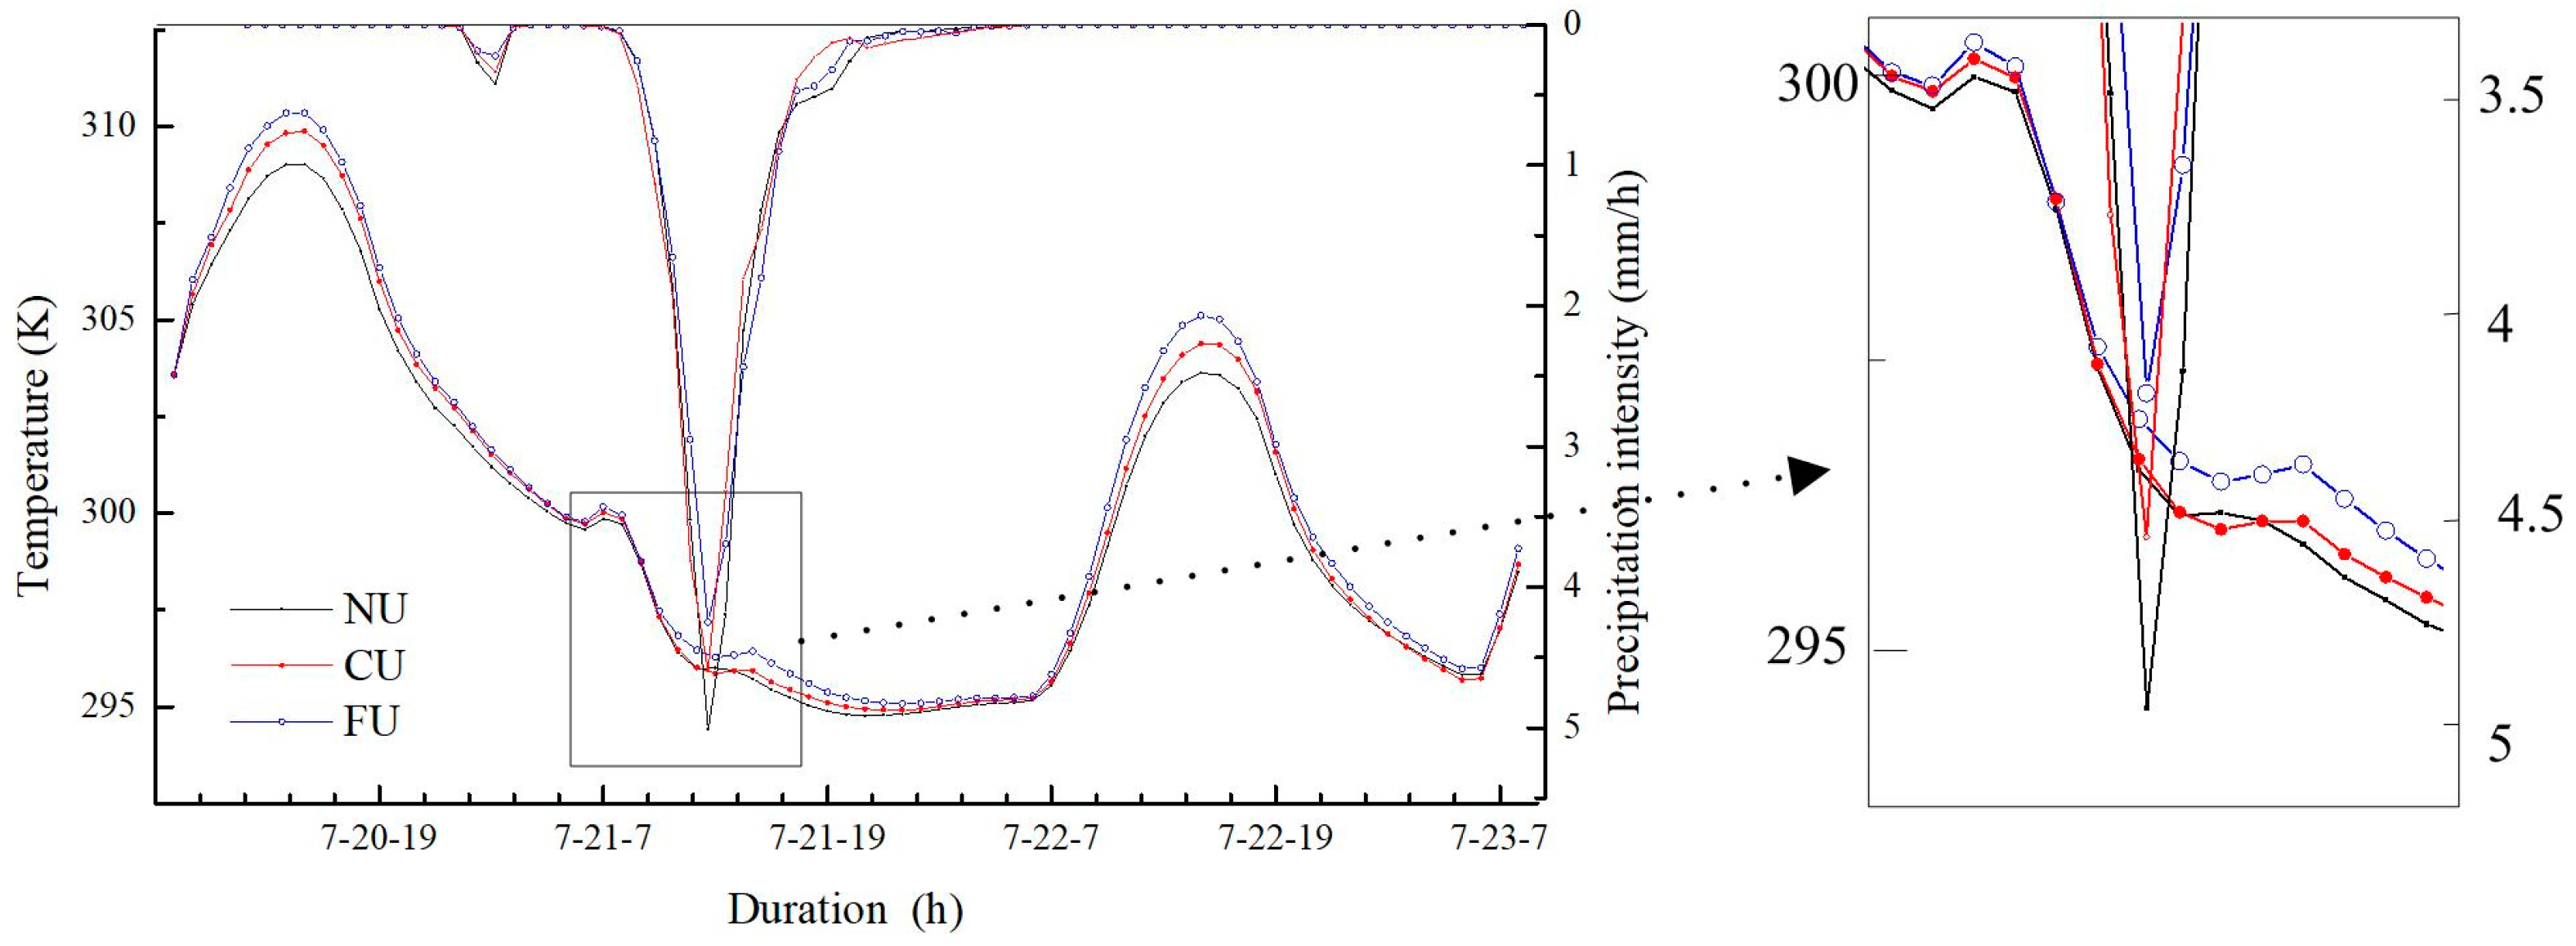
3.3. Rainfall and Temperature Duration Curves Simulated by the WRF Model

To conduct the consistent the impact of urbanization on precipitation and rainfall, we further analyze the entire two-week simulation period (Figure 8), and the heavier rainfall event for detail (Figure 9). Compared with NU, the mean temperature of CU and FU increased by approximately 0.3 K and 0.6 K, respectively. Compared with NU, the mean precipitation of CU and FU decreased by approximately 6% and 8.4%, respectively. The results showed that the trends of temperature variation and changing precipitation were basically the same in the three situations. The second day temperature was obviously smaller than the average temperature of the first day and the third day. The highest mean temperature was from FU, followed by CU, and finally NU. Therefore, the ordered mean temperature was NU < CU < FU. Similarly, the ordered mean rainfall was NU > CU > FU.
Based on the results of the three scenarios, the urbanization impacts on local weather in the Jing-Jin-Ji District increased the temperature and decreased the precipitation. Compared with NU, the mean temperature of CU and FU increased by 0.3 K and 0.6 K, respectively, and the mean precipitation decreased by approximately 6% and 8.4%, respectively. These research findings agreed with the research based on observational data analysis in Beijing. Zheng and Liu [33] used data from 13 meteorological stations in Beijing to analyze the effect of urbanization on surface air temperature and precipitation in the period of 1961–2000, and found that the annual temperatures of the urban and rural stations in the Beijing area obviously increased, and precipitation in the Beijing area obviously decreased.
Because the three scenarios have specific meanings, they (from NU to CU and from CU to FU) represent the past impacts of urbanization on weather, and the future impacts of continuous urbanization within the Jing-Jin-Ji District, respectively. Therefore, this study can predict the impact of future urbanization on the regional weather.
We can now summarize the previous analysis and suggest a possible mechanism to explain the local weather responses to changes in land use in the rainfall event. Locally, when the land use changes from ‘NU’ category to ‘CU’ and to ‘FU’, the natural vegetation decreases, while urban and built-up increases substantially, this leads to a decrease in evapotranspiration and air moisture. Ultimately, it causes a rise in surface air temperature and a decrease in precipitation. Liu [47] designed land cover from ‘bare or sparsely vegetated’ category to ‘grassland’, and investigated its climatic response and corresponding mechanism. Although the process of experimental design is just the opposite, the mechanism is basically the same as our research.

3.4. Model Validation

In this paper, the simulated surface air temperature and precipitation from the CU simulations were compared with observational data to validate the model’s ability to simulate the weather variables over the center Jing-Jin-Ji District. The precipitation and temperature data (hourly data) were provided by the National Climate Center of the China Meteorological Administration (http://www.nmic.gov.cn).
The daily observations of the average temperature (Tmean), maximum temperature (Tmax), minimum temperature (Tmin), and average precipitation (Pmean) were compared with the simulation outputs. The percent bias (PB, %) was calculated by Formula (1). The PB values between the observed meteorological station (OBS) and model-simulated (SIM) data are listed in Table 1.
P B = i = 1 N ( S i Q i ) i = 1 N Q i × 100 % ,
where PB is the percent bias, %; Si and Qi are the simulated and observed data, respectively.
Table 1 shows that the PB of temperature ranged from 3.6% to −5.3%, which represents a very small range. While the PB of precipitation was relatively larger, it was also good enough. Therefore, the WRF model performed well in the study area on the regional and 2-week scales in the CU scenarios in Beijing. Thus, the WRF model can be used to simulate urbanization impacts on weather in Jing-Jin-Ji District effectively.
This work was a preliminary study, and further investigation needs to be conducted. For example, in this study, only the influence of land use on weather was considered. However, the feedback of weather on land use was important as well, and the interactive feedback mechanisms between regional weather and land use/urbanization required further investigation.

4. Conclusions

The WRF model was used to simulate the urbanization impacts on local weather using three scenarios in Jing-Jin-Ji District. The following main conclusions were drawn: (1) The effects of urbanization in Jing-Jin-Ji District increased the daytime temperature, night temperature, and temperature difference between day and night, while urbanization decreased the total rainfall and peak rainfall. (2) Compared with no urban cover, the mean temperature of current urban cover and FU increased by 0.3 K and 0.6 K, respectively, and the mean precipitation of current urban cover and FU decreased by approximately 6% and 8.4%, respectively. (3) The order of the daytime temperature, night temperature, and temperature difference between day and night was no urban cover < current urban cover < full urban cover; and the order of total rainfall and peak rainfall peak was no urban cover > current urban cover > full urban cover. (4) The main influence of urbanization on weather was reflected by the impacts on the maximum temperature and peak rainfall, while the other impacts were relatively insignificant. Compared with no urban cover, the maximum temperature of current urban cover and full urban cover increased by 0.82 K and 1.35 K, respectively, and the peak rainfall of no urban cover and full urban cover decreased by approximately 9.5% and 19.0%, respectively; these results obviously varied.

Author Contributions

All the authors contributed to the conception and development of this manuscript. H.-D.S. and Y.-W.J. carried out the analysis and wrote the paper. X.C., J.W., and M.Z. used the methods for statistical analysis and mapping in the article. D.-C.W. designed the system framework and developed the project implementation plan. G.N. and C.N. collected data and participated in the results analysis.

Funding

This study is supported by the National Basic Research Program of China (973 Program) (2015CB452701), the Projects of the National Science Foundation of China (51379215, 51779272), and National Natural Science Foundation of China (NSFC. General Projects: (Grant No. 41471430).

Conflicts of Interest

The authors declare no conflict of interest.

References

  1. Jin, M.L.; Dickinson, R.E.; Zhang, D.L. The footprint of urban areas on global climate as characterized by MODIS. J. Clim. 2005, 18, 1551–1565. [Google Scholar] [CrossRef]
  2. Arnfield, A.J. Two decades of urban climate research: A review of turbulence, exchanges of energy and water, and the urban heat island. Int. J. Climatol. 2003, 23, 1–26. [Google Scholar] [CrossRef]
  3. Erell, E.; Williamson, T. Intra-urban differences in canopy layer air temperature at a mid-latitude city. Int. J. Climatol. 2007, 27, 1243–1255. [Google Scholar] [CrossRef] [Green Version]
  4. Müller, N.; Kuttler, W.; Barlag, A. Analysis of the subsurface urban heat island in Oberhausen, Germany. Clim. Res. 2014, 58, 247–256. [Google Scholar] [CrossRef] [Green Version]
  5. Rizwan, A.M.; Dennis, Y.C.L.; Liu, C.H. A review on the generation, determination and mitigation of urban heat island. J. Environ. Sci. China 2008, 20, 120–128. [Google Scholar] [CrossRef]
  6. Tomita, T.; Kusaka, H.; Akiyoshi, R.; Imasato, Y. Thermal and geometric controls on the rate of surface air temperature changes in a medium-sized, midlatitude city. J. Appl. Meteorol. 2007, 46, 241–247. [Google Scholar] [CrossRef]
  7. Wang, W. The influence of thermally-induced mesoscale circulations on turbulence statistics over an idealized urban area under a zero-background wind. Bound. Layer Meteorol. 2009, 131, 403–423. [Google Scholar] [CrossRef]
  8. Montávez, J.P.; Rodríguez, A.; Jiménez, J.I. A study of the urban heat island of Granada. Int. J. Climatol. 2015, 20, 899–911. [Google Scholar] [CrossRef]
  9. Kim, H.H. Urban heat island. Int. J. Remote Sens. 1991, 13, 2319–2336. [Google Scholar] [CrossRef]
  10. Parker, D.E. A demonstration that large-scale warming is not urban. J. Clim. 2006, 19, 2882–2895. [Google Scholar] [CrossRef]
  11. Kaufmann, R.K.; Seto, K.C.; Schneider, A.; Liu, Z.T.; Zhou, L.M.; Wang, W.L. Climate response to rapid urban growth: Evidence of a human-induced precipitation deficit. J. Clim. 2007, 20, 2299–2306. [Google Scholar] [CrossRef]
  12. Shepherd, J.M.; Pierce, H.; Negri, A.J. Rainfall modification by major urban areas: Observations from spaceborne rain radar on the TRMM satellite. J. Appl. Meteorol. 2002, 41, 689–701. [Google Scholar] [CrossRef]
  13. Wilhelm Kuttler, S.W.; Schonnefeld, J.; Hesselschwerdt, A. Urban/rural atmospheric water vapour pressure differences and urban moisture excess in Krefeld, Germany. Int. J. Climatol. 2007, 27, 2005–2015. [Google Scholar] [CrossRef] [Green Version]
  14. Karl, T.R.; Diaz, H.F.; Kukla, G. urbanization: Its detection and effect in the United States climate record. J. Clim. 1988, 1, 1099–1123. [Google Scholar] [CrossRef]
  15. Ren, G.Y.; Zhou, Y.Q.; Chu, Z.Y.; Zhou, J.X.; Zhang, A.Y.; Guo, J.; Liu, X.F. Urbanization effects on observed surface air temperature trends in north China. J. Clim. 2008, 21, 1333–1348. [Google Scholar] [CrossRef]
  16. Jones, P.D.; Lister, D.H.; Li, Q. Urbanization effects in large-scale temperature records, with an emphasis on China. J. Geophy. Res. Atmos. 2008, 113. [Google Scholar] [CrossRef] [Green Version]
  17. Kalnay, E.; Cai, M. Impact of urbanization and land-use change on climate. Nature 2003, 423, 528–531. [Google Scholar] [CrossRef]
  18. Baik, J.J.; Kim, Y.H.; Kim, J.J.; Han, J.-Y. Effects of boundary-layer stability on urban heat island-induced circulation. Theor. Appl. Climatol. 2007, 89, 73–81. [Google Scholar] [CrossRef]
  19. Changnon, S.A. Rainfall changes in summer caused by St. Louis. Science 1979, 205, 402–404. [Google Scholar] [CrossRef]
  20. Inamura, T.; Izumi, T.; Matsuyama, H. Diagnostic study of the effects of a large city on heavy rainfall as revealed by an ensemble simulation: A case study of central Tokyo, Japan. J. Appl. Meteorol. Climatol. 2011, 50, 713–728. [Google Scholar] [CrossRef]
  21. Souma, K.; Tanaka, K.; Suetsugi, T.; Sunada, K.; Tsuboki, K.; Shinoda, T.; Wang, Y.; Sakakibara, A.; Hasegawa, K.; Moteki, Q.; et al. A comparison between the effects of artificial land cover and anthropogenic heat on a localized heavy rain event in 2008 in Zoshigaya, Tokyo, Japan. J. Geophys. Res. Atmos. 2013, 118, 11600–11610. [Google Scholar] [CrossRef]
  22. Shem, W.; Shepherd, M. On the impact of urbanization on summertime thunderstorms in Atlanta: Two numerical model case studies. Atmos. Res. 2008, 92, 172–189. [Google Scholar] [CrossRef]
  23. Rosenfeld, D. Suppression of rain and snow by urban and industrial air pollution. Science 2000, 287, 1793–1796. [Google Scholar] [CrossRef]
  24. Fraser, R.S.; Kaufman, Y.J. The effect of smoke particles on clouds and climate forcing. Science 1997, 277, 1636–1639. [Google Scholar]
  25. Andreae, M.O.; Rosenfeld, D.; Artaxo, P.; Costa, A.A.; Frank, G.P.; Longo, K.M.; Silva-Dias, M.A. Smoking rain clouds over the Amazon. Science 2015, 303, 1337–1342. [Google Scholar] [CrossRef]
  26. Braham, R.R. Modification of Clouds and Weather by a Large Metropolitan Area; WMO Scientific Conference on Weather Modification: Boulder, CO, USA, 1976; pp. 435–442. [Google Scholar]
  27. Changnon, S.A., Jr. METROMEX: A Review and Summary; American Meteorological Society: Boston, MA, USA, 1981; p. 181. [Google Scholar]
  28. Bornstein, R.; Lin, Q. Urban heat islands and summertime convective thunderstorms in Atlanta: Three case studies. Atmos. Environ. 2000, 34, 507–516. [Google Scholar] [CrossRef]
  29. Landsberg, H.E. Man-made climate changes. Science 1970, 170, 1265–1274. [Google Scholar] [CrossRef]
  30. Changnon, S.A., Jr.; Shealy, R.T.; Scott, R.W. Precipitation changes in fall, winter, and spring caused by St. Louis. J. Appl. Meteorol. 1991, 30, 126–134. [Google Scholar] [CrossRef]
  31. Bornstein, R.; LeRoy, G.M. Urban Barrier Effects on Convective and Frontal Thunderstorms; American Meteorological Society: Boston, MA, USA, 1990; pp. 120–121. [Google Scholar]
  32. Jaurequi, E.; Romales, E. Urban effects on convective precipitation in Mexico City. Atmos. Environ. 1996, 30, 3383–3389. [Google Scholar] [CrossRef]
  33. Zheng, S.-Y.; Liu, S.-H. Urbanization effect on Climate in Beijing. Clim. Environ. Res. 2008, 13, 123–133. (In Chinese) [Google Scholar]
  34. Ning, Z.; Gao, Z.Q.; Wang, X.M.; Chen, Y. Modeling the impact of urbanization on the local and regional climate in Yangtze River Delta, China. Theor. Appl. Climatol. 2010, 102, 331–342. [Google Scholar]
  35. Hua, L.J.; Ma, Z.G.; Guo, W.D. The impact of urbanization on air temperature across China. Theor. Appl. Climatol. 2008, 93, 179–194. [Google Scholar] [CrossRef]
  36. Fast, J.D.; Torcolini, J.C.; Redman, R. Pseudovertical temperature profiles and the urban heat island measured by a temperature datalogger network in Phoenix, Arizona. J. Appl. Meteorol. 2005, 44, 3–13. [Google Scholar] [CrossRef]
  37. Zhang, S.; Huang, G.; Qi, Y.; Jia, G. Impact of urbanization on summer rainfall in Beijing–Tianjin–Hebei metropolis under different climate backgrounds. Theor. Appl. Climatol. 2018, 133, 1093–1106. [Google Scholar] [CrossRef]
  38. Li, Y. Impact of Drbanization in Different Regions of Eastern China on Precipitation and Its Simulation. Ph.D. Thesis, Nanjing University of Information Science & Technology, Nanjing, China, 2013. (In Chinese). [Google Scholar]
  39. Hong, S.Y.; Dudhia, J.; Chen, S.H. A revised approach to ice microphysical processes for the bulk parameterization of clouds and precipitation. Mon. Weather Rev. 2004, 132, 103–120. [Google Scholar] [CrossRef]
  40. Hong, S.Y.; Lim, J.O.J. The WRF single-moment 6-class microphysics scheme (WSM6). J. Korean Meteorol. Soc. 2006, 42, 129–151. [Google Scholar]
  41. Collins, W.; Rasch, P.; Boville, B.; Hack, J.; McCaa, J.; Williamson, D.; Kiehl, J.; Briegleb, B.; Bitz, C.; Lin, S. Description of the NCAR Community Atmosphere Model (CAM 3.0). NCAR Tech. Notes 2004, 226. [Google Scholar] [CrossRef]
  42. Chen, F.; Dudhia, J. Coupling an advanced land surface-hydrology model with the Penn State-NCAR MM5 modeling system. Part I: Model implementation and sensitivity. Mon. Weather Rev. 2001, 129, 569–585. [Google Scholar] [CrossRef]
  43. Zhang, C.L.; Chen, M.; Kuo, Y.H.; Fan, S.Y.; Zhong, J.Q. Numerical assessing experiments on the individual components impact of the meteorological observation network on the “00.7” torrential rain in Beijing. Acta Meteorol. Sin. 2005, 63, 922–932. (In Chinese) [Google Scholar]
  44. Zhou, L.; Jiang, Z.H.; Li, Z.X.; Yang, X.Q. Numerical simulation of urbanization climate effects in regions of east China. Chin. J. Atmos. Sci. 2015, 39, 596–610. (In Chinese) [Google Scholar]
  45. Wu, F.B.; Tang, J.P. The impact of urbanization in summer precipitation and temperature in the Yangtze River Delta. J. Trop. Meteorol. 2015, 31, 255–263. (In Chinese) [Google Scholar]
  46. Wang, J.; Feng, J.; Yan, Z.; Hu, Y.; Jia, G. Nested high-resolution modeling of the impact of urbanization on regional climate in three vast urban agglomerations in China. JGR Atmos. 2012, 117. [Google Scholar] [CrossRef] [Green Version]
  47. Entao, Y. Climatic response to changes in vegetation in the Northwest Hetao Plain as simulated by the WRF model. Int. J. Climatol. 2013, 33, 1470–1481. [Google Scholar]
Figure 1. Location of the study area and the land-use category distribution in the model domain.
Water 11 00797 g001
Figure 2. Average air temperature (k) at 2 m for different land cover during the daytime. (a) no urban cover (NU), (b) current urbanization cover (CU), and (c) full urban land cover (FU).
Water 11 00797 g002
Figure 3. Average night temperature (K) at 2 m for different land cover. (a) NU, (b) CU, (c) FU.
Water 11 00797 g003
Figure 4. The temperature (K) difference between day and night under different land surfaces at 2 m. (ac) are NU, CU, and FU, respectively.
Water 11 00797 g004
Figure 5. The temperature difference between different land cover during daytime and night. (a,b) are CU-NU and FU-CU during the daytime, respectively; (c,d) are CU-NU and FU-CU at night, respectively.
Water 11 00797 g005
Figure 6. (ac) Comparison of total precipitation distribution during two weeks.
Water 11 00797 g006
Figure 7. Comparison of peak rainfall. ((a1,b1,c1) are peak rainfall of NU, CU, and FU during the first rainfall event (20–21 July), respectively; (a2,b2,c2) are peak rainfall of NU, CU, and FU during the second rainfall event (July 25)).
Water 11 00797 g007
Figure 8. Diagram of mean rainfall and temperature variation with duration during the two weeks.
Water 11 00797 g008
Figure 9. Diagram of mean rainfall and temperature variation with duration during the heavier rainfall event (20–21 July).
Water 11 00797 g009
Table 1. The percent bias (PB, %) between the observed meteorological station (OBS) and model-simulated (SIM) data for the average temperature (Tmean), maximum temperature (Tmax), minimum temperature (Tmin), and average precipitation (Pmean).
Index20 July 201721 July 2017Two-Week Period
OBSSIMPBOBSSIMPBOBSSIMPB
Tmean/℃30.931.51.9%24.323.0−5.3%26.426.81.5%
Tmax/℃35.636.93.6%27.627.0−2.1%30.631.42.6%
Tmin/℃26.126.72.2%21.221.93.3%23.122.7−1.7%
Pmean/mm8.17.3−9.8%20.021.025.1%34.233.71.5%
Note: The time interval used is from 8 a.m. to 8 a.m. of the next day (the time we used is UTC+8).

