Sizing of Domestic Rainwater Harvesting Systems Using Economic Performance Indicators to Support Water Supply Systems


1
Natural and Built Environments Research Centre, University of South Australia, Adelaide 5095, Australia
2
Barbara Hardy Institute, University of South Australia, Adelaide 5095, Australia
3
Institute for Sustainable Industries & Liveable Cities, Victoria University, Melbourne 8001, Australia
*
Authors to whom correspondence should be addressed.
Water 2019, 11(4), 783; https://doi.org/10.3390/w11040783
Submission received: 20 March 2019
/
Revised: 10 April 2019
/
Accepted: 11 April 2019
/
Published: 15 April 2019
(This article belongs to the Special Issue Smart Technologies and Water Supply Planning)
Abstract
:This paper presents a monitoring-based investigation of rainwater collection systems using economic performance indicators in a group of households with nonconventional end-uses for rainwater that are not traditionally associated with rainwater supply. The monitored data for five household rainwater tank systems were analysed in two stages. For the first stage, the data was empirically analysed to develop a method to predict effective roof catchment areas. For the second stage, the effective roof catchment areas, together with roof area connection percentages, were analysed against different types of water demands in individual households. The individual systems were investigated for yield capacities, costs and water security using a modified Roof Runoff Harvesting Systems average annual yield model based on daily water balance procedures. The Life Cycle Costing analysis of the systems using the model was based on the Capital Recovery Method by taking into consideration the capital costs as well as ongoing costs for maintenance, replacement and operation of the systems. The analysis established the optimal sizing requirements for the studied rainwater tanks and their corresponding roof area connectivity.
1. Introduction
Over the past few decades, rainwater tanks have been commonly used in Australian households to mitigate the need for mains (potable) water supply, thereby contributing to the management of increasing demand on centralised water supply systems [1]. The South Australian State Government building rules require new dwellings and extensions or alterations greater than 50 m2 to have additional water supply to supplement mains water [2]. The Department of Environment, Water and Natural Resources (DEWNR) recommends that the most common way to meet the additional water supply requirement is to install plumbed rainwater tanks with a minimum storage capacity of 1000 L. Alternative ways to meet the additional water supply requirement include recycled water schemes, decentralised wastewater systems [3,4], connection to community rainwater storage tanks [2,5], using dual reticulated (fixed pipe) water supply systems or using licensed bore water. However, household rainwater tanks are by far the most commonly adopted choice. Additionally, more than 30,000 existing households in South Australia have utilised SA Water’s Stand Alone Rainwater Tank Rebate Scheme between 2011 and 2014 [6]. This scheme provides rebates of up to $200 to residents purchasing a rainwater tank of 1000 L or greater [6]. Rainwater tanks are commonly connected internally to non-potable end-uses such as toilet cisterns and cold water taps supplying washing machines. They are also often fitted to outdoor irrigation (garden) taps.
However, for the households in this study, which was based in the Adelaide suburb of Lochiel Park in South Australia (Figure 1), the setup of rainwater systems differed from the conventional configurations often adopted across the rest of Adelaide. The water saving guidelines designed for the Lochiel Park households [7,8] investigated in this research exceed the minimum standard under the current Building Code of Australia (BCA) and other legislation [9,10]. The households in this study were required to have rainwater tanks of a minimum size of 1500 L, in contrast to the minimum SA building requirement of 1000 L [11,12] per house to collect rainwater from a minimum of 80% of the roof surface area, plumbed into hot water systems. The minimum SA building requirement is 50 m2 of roof area [11]. Unlike conventional Australian households, the rainwater tanks in this study were plumbed into hot water systems supplying non-potable hot water to household end-uses such as showers and bathroom and kitchen taps. At Lochiel Park, typical end-uses associated with rainwater use (toilets, washing machines and outdoor irrigation taps) were instead connected to an on-site Aquifer Storage and Recharge (ASR) treatment plant designed to provide year-round recycled stormwater supply.
The implementation and the technology selection for roof runoff harvesting (RRH) systems are strongly influenced by economic constraints and local regulations emphasising the need for empirical research to allow improved modelling of these systems [14]. Many RRH systems are focused solely on water conservation without considering other potential benefits of these systems [14], such as their benefit to the environment in their role towards drought preparedness and flood mitigation [15]. There is also a lack of research involving non-traditional use of rainwater systems in urban residential environments. Additionally, there is limited empirical data to highlight the several possibilities of rainwater harvesting in households. Thereby, the rainwater-to-hot-water setup in the households in this study provides a unique opportunity to empirically analyse the economic performance of rainwater tanks in an alternative setup that involves atypical end-uses. The study was also able to explore hypothetical possibilities where water demands from the roof runoff harvesting (RRH) systems were modified to service end-uses that were allocated to water sources other than rainwater, such as the onsite ASR recycled water supply. The monitored data used in this study provided a unique opportunity to compare modelling-based results with the actual water consumption values in the studied households. Thereby, the study aims to present the outcomes to improve the overall economic and environmental viability of RWH depending on the varying contexts.
There have been various approaches to studying RRH systems in the past with several factors influencing their efficiency, such as catchment area, rainfall patterns, household demand, tank sizing and, accessories and configurations related to their setup of the systems. Most of these studies have been made based on deterministic approaches [16,17], while others have been probabilistic [18,19] or stochastic [20] in nature. However, this study was built with the intention of minimising the assumptions associated with the RRH systems’ configurations and characteristics by using empirical data obtained through auditing and monitoring methods. Although cost assumptions for components and accessories associated with such systems are highly variable, this research provides a baseline for future investigations involving cost sensitivities. Overall, the paper presents a methodology that contributes to improving the design of RRH sizing and costing by highlighting some limitations to existing methods.
Additionally, the study also demonstrates a novel method to determine the connected roof runoff catchment areas which may be used as a reference for future studies where catchment areas cannot be easily obtained. Several studies on rainwater tanks have previously made hypothesised assumptions for roof catchment areas that were generally based on the building guidelines relevant to the location of the households [21]. Sometimes, studies have relied upon map services to determine crude planar surface areas without taking the intricacies of roof angles, slopes and elevations into consideration. The method adopted in this study yielded results that were based on the change in runoff volumes collected in the systems and their associated rainfall intensities, eliminating the need to determine the influence of roof characteristics such as roof positioning, materials, shapes of gutters and downpipes and first flush devices.
2. Materials and Methods
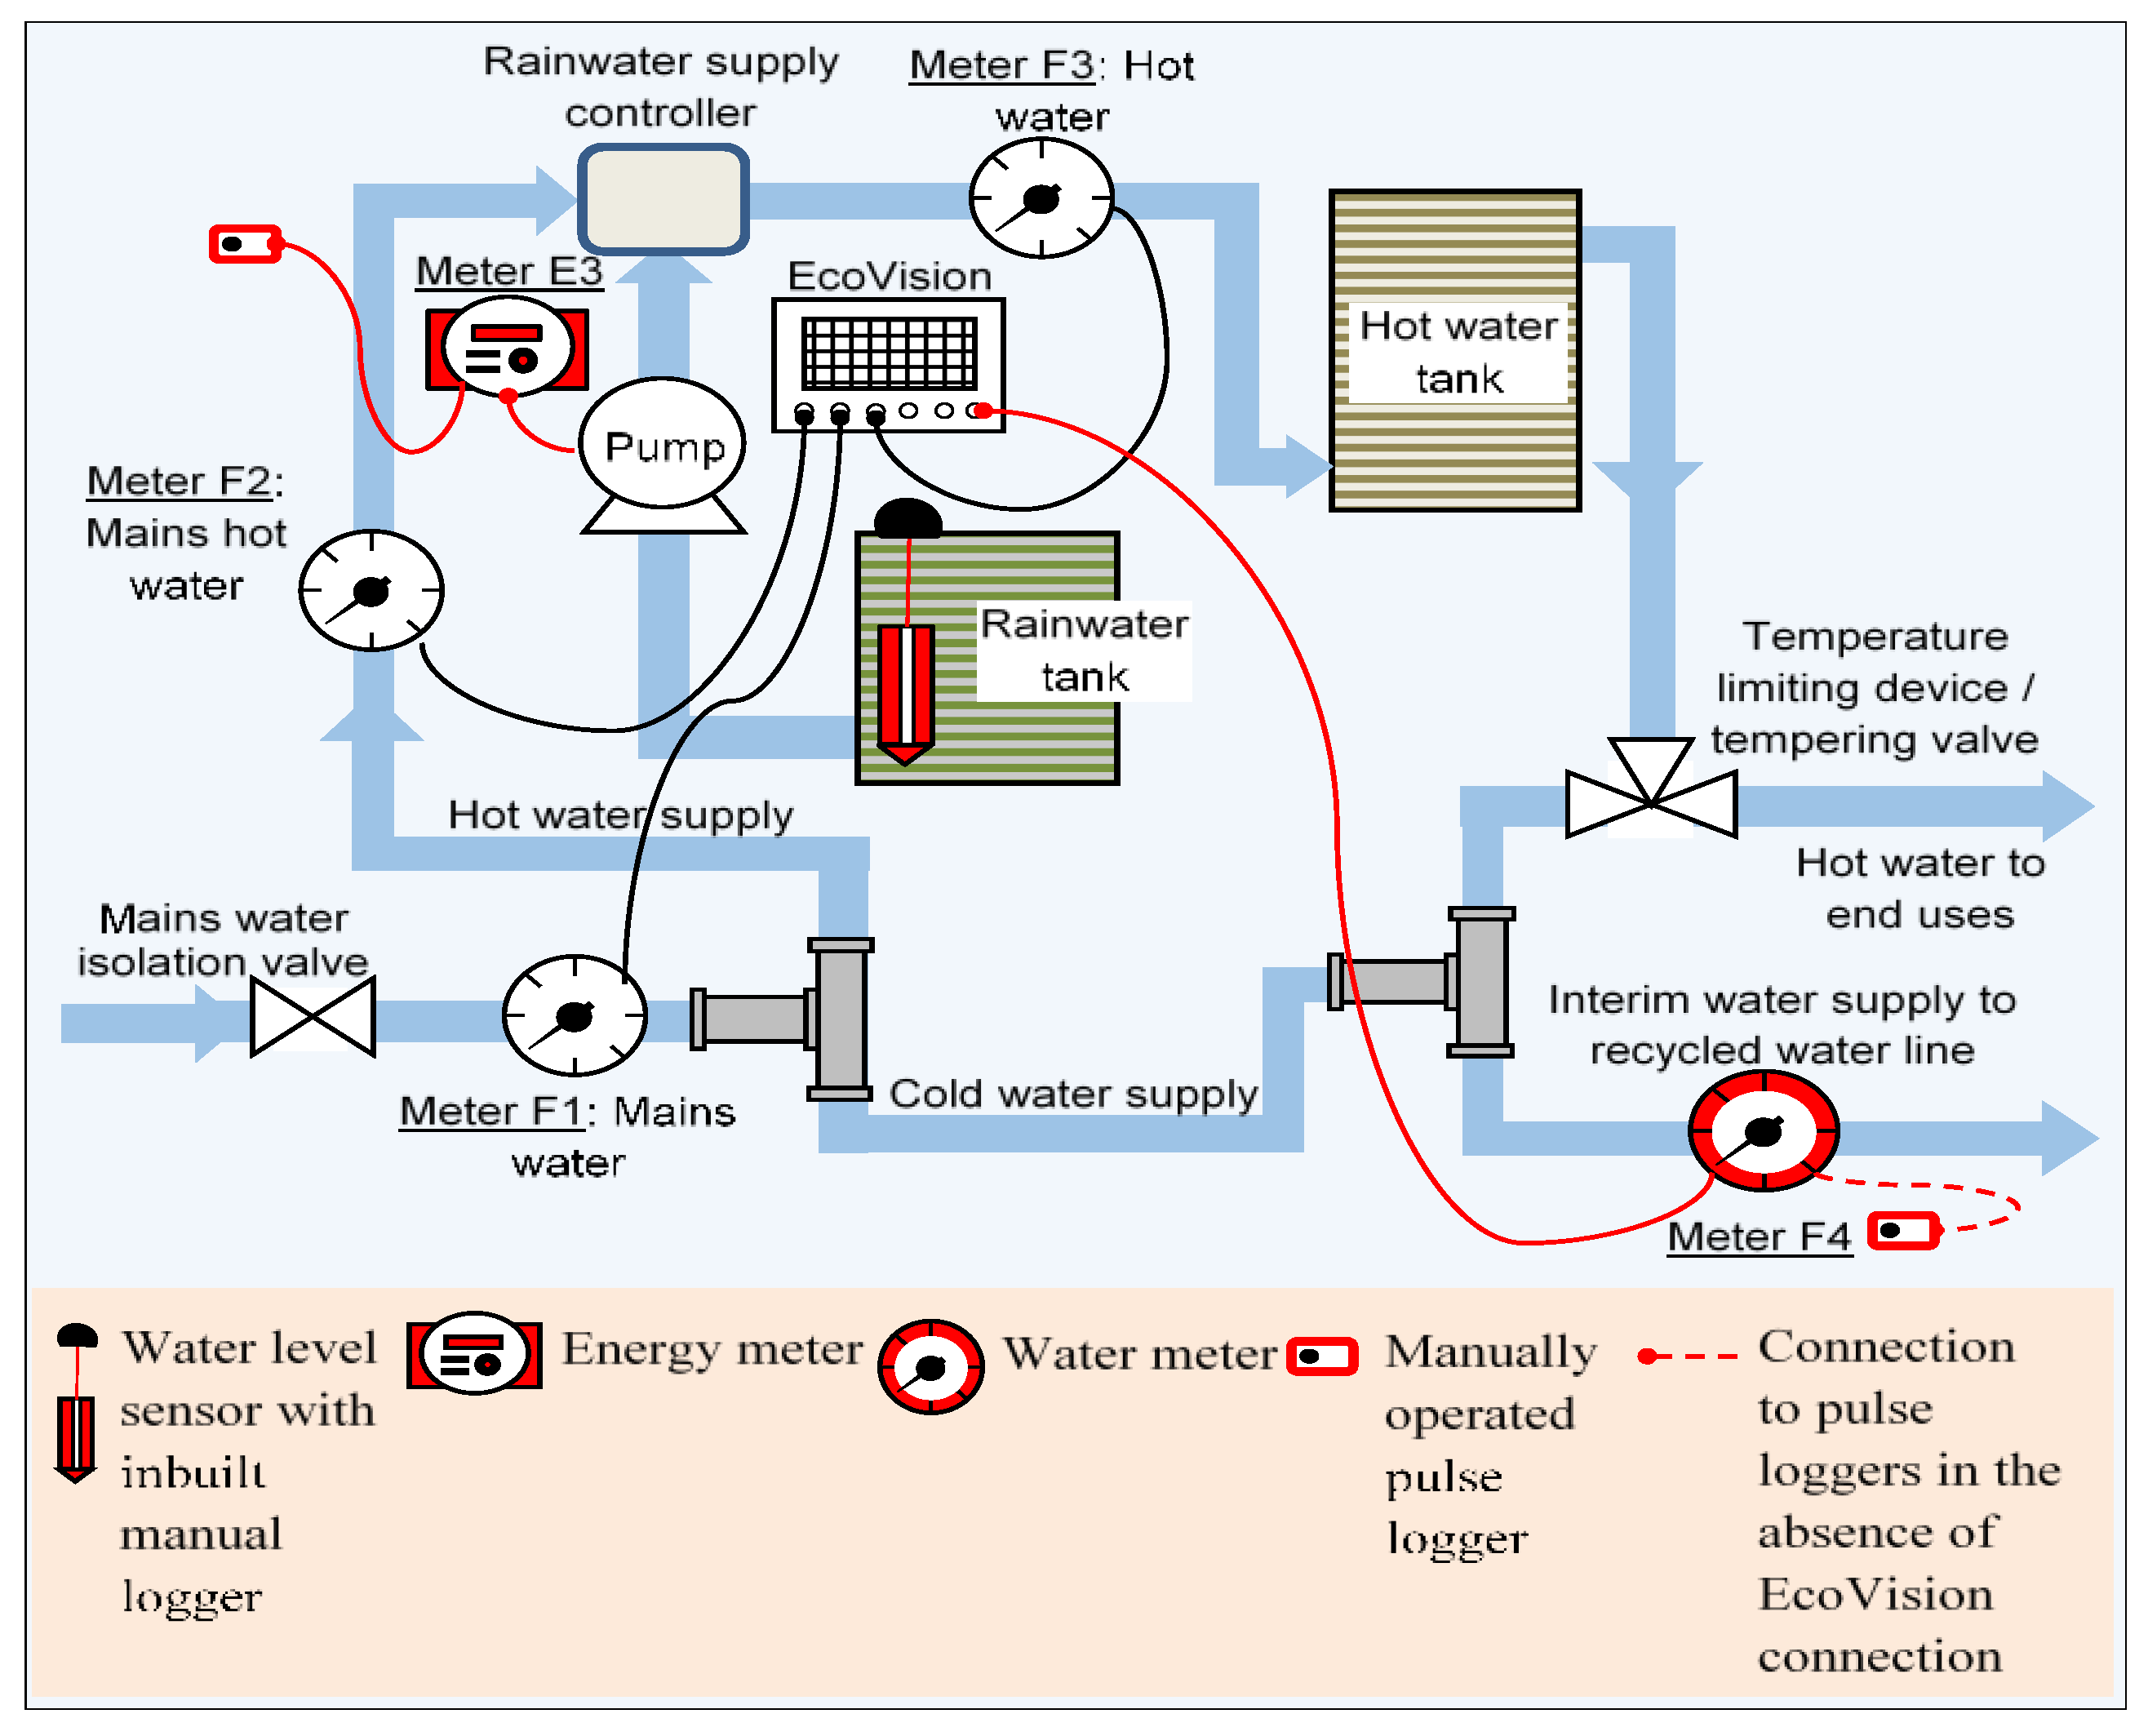
A group of five Lochiel Park households with RRH systems were chosen for this study. Unlike conventional Australian households, rainwater tanks in this study were plumbed to hot water systems supplying non-potable hot water to household end-uses such as showers and bathroom and kitchen taps. Typical end-uses associated with rainwater use (toilets, washing machines and outdoor irrigation taps) are instead connected to recycled water from the on-site recycled MAR water treatment plant designed to provide year-round supply. All five RRH systems were monitored for end-use water consumption, including rainwater (supplying all non-potable hot water taps and showers), recycled stormwater (supplying all outdoor/garden use and toilet flushing) and mains water (supplying all indoor potable water consumption and cold water supply to taps and showers). Meters were installed to record data at the rate of one pulse per litre of water flow in one-minute time intervals. The selected systems were also retrofitted with pressure-based water level sensors to monitor water level fluctuations in the rainwater tanks. A weather station was also installed onsite to record rainfall and outdoor temperature. The RRH systems were monitored for a 12-month period between June 2015 and May 2016. Figure 2 presents the water monitoring setup in a typical residence in this study.
Table 1 summarises the general system characteristics of each of the five RRH systems. The average occupancy in the households was 2.4 persons per household (p/hh) (median = 2 p/hh). Rainwater tank sizes ranged between 1500 L and 2500 L (median capacity = 1500 L). The minimum planar roof area was 133.9 m2 (in RRH2) and the maximum was 184.8 m2 (RRH5), while the average and median planar roof areas were 162.5 m2 and 164.5 m2, respectively. Based on the monitored data, the average and median daily water demands obtained using monitored data are also shown in Table 1.
2.1. Estimation of Effective Roof Catchment Areas
Although the planar roof areas were available for the study, the actual roof catchment areas connected to the rainwater tanks were difficult to assess. The “effective roof catchment areas” were estimated using monitored data including rainfall depths and runoff volumes collected in the tanks. This eliminated the need to determine first flush volumes and losses (such as surface depression and evaporative losses) associated with the RRH systems as the calculation method directly determined the ‘effective’ roof catchment area based on the actual volume of runoff collected in the tank.
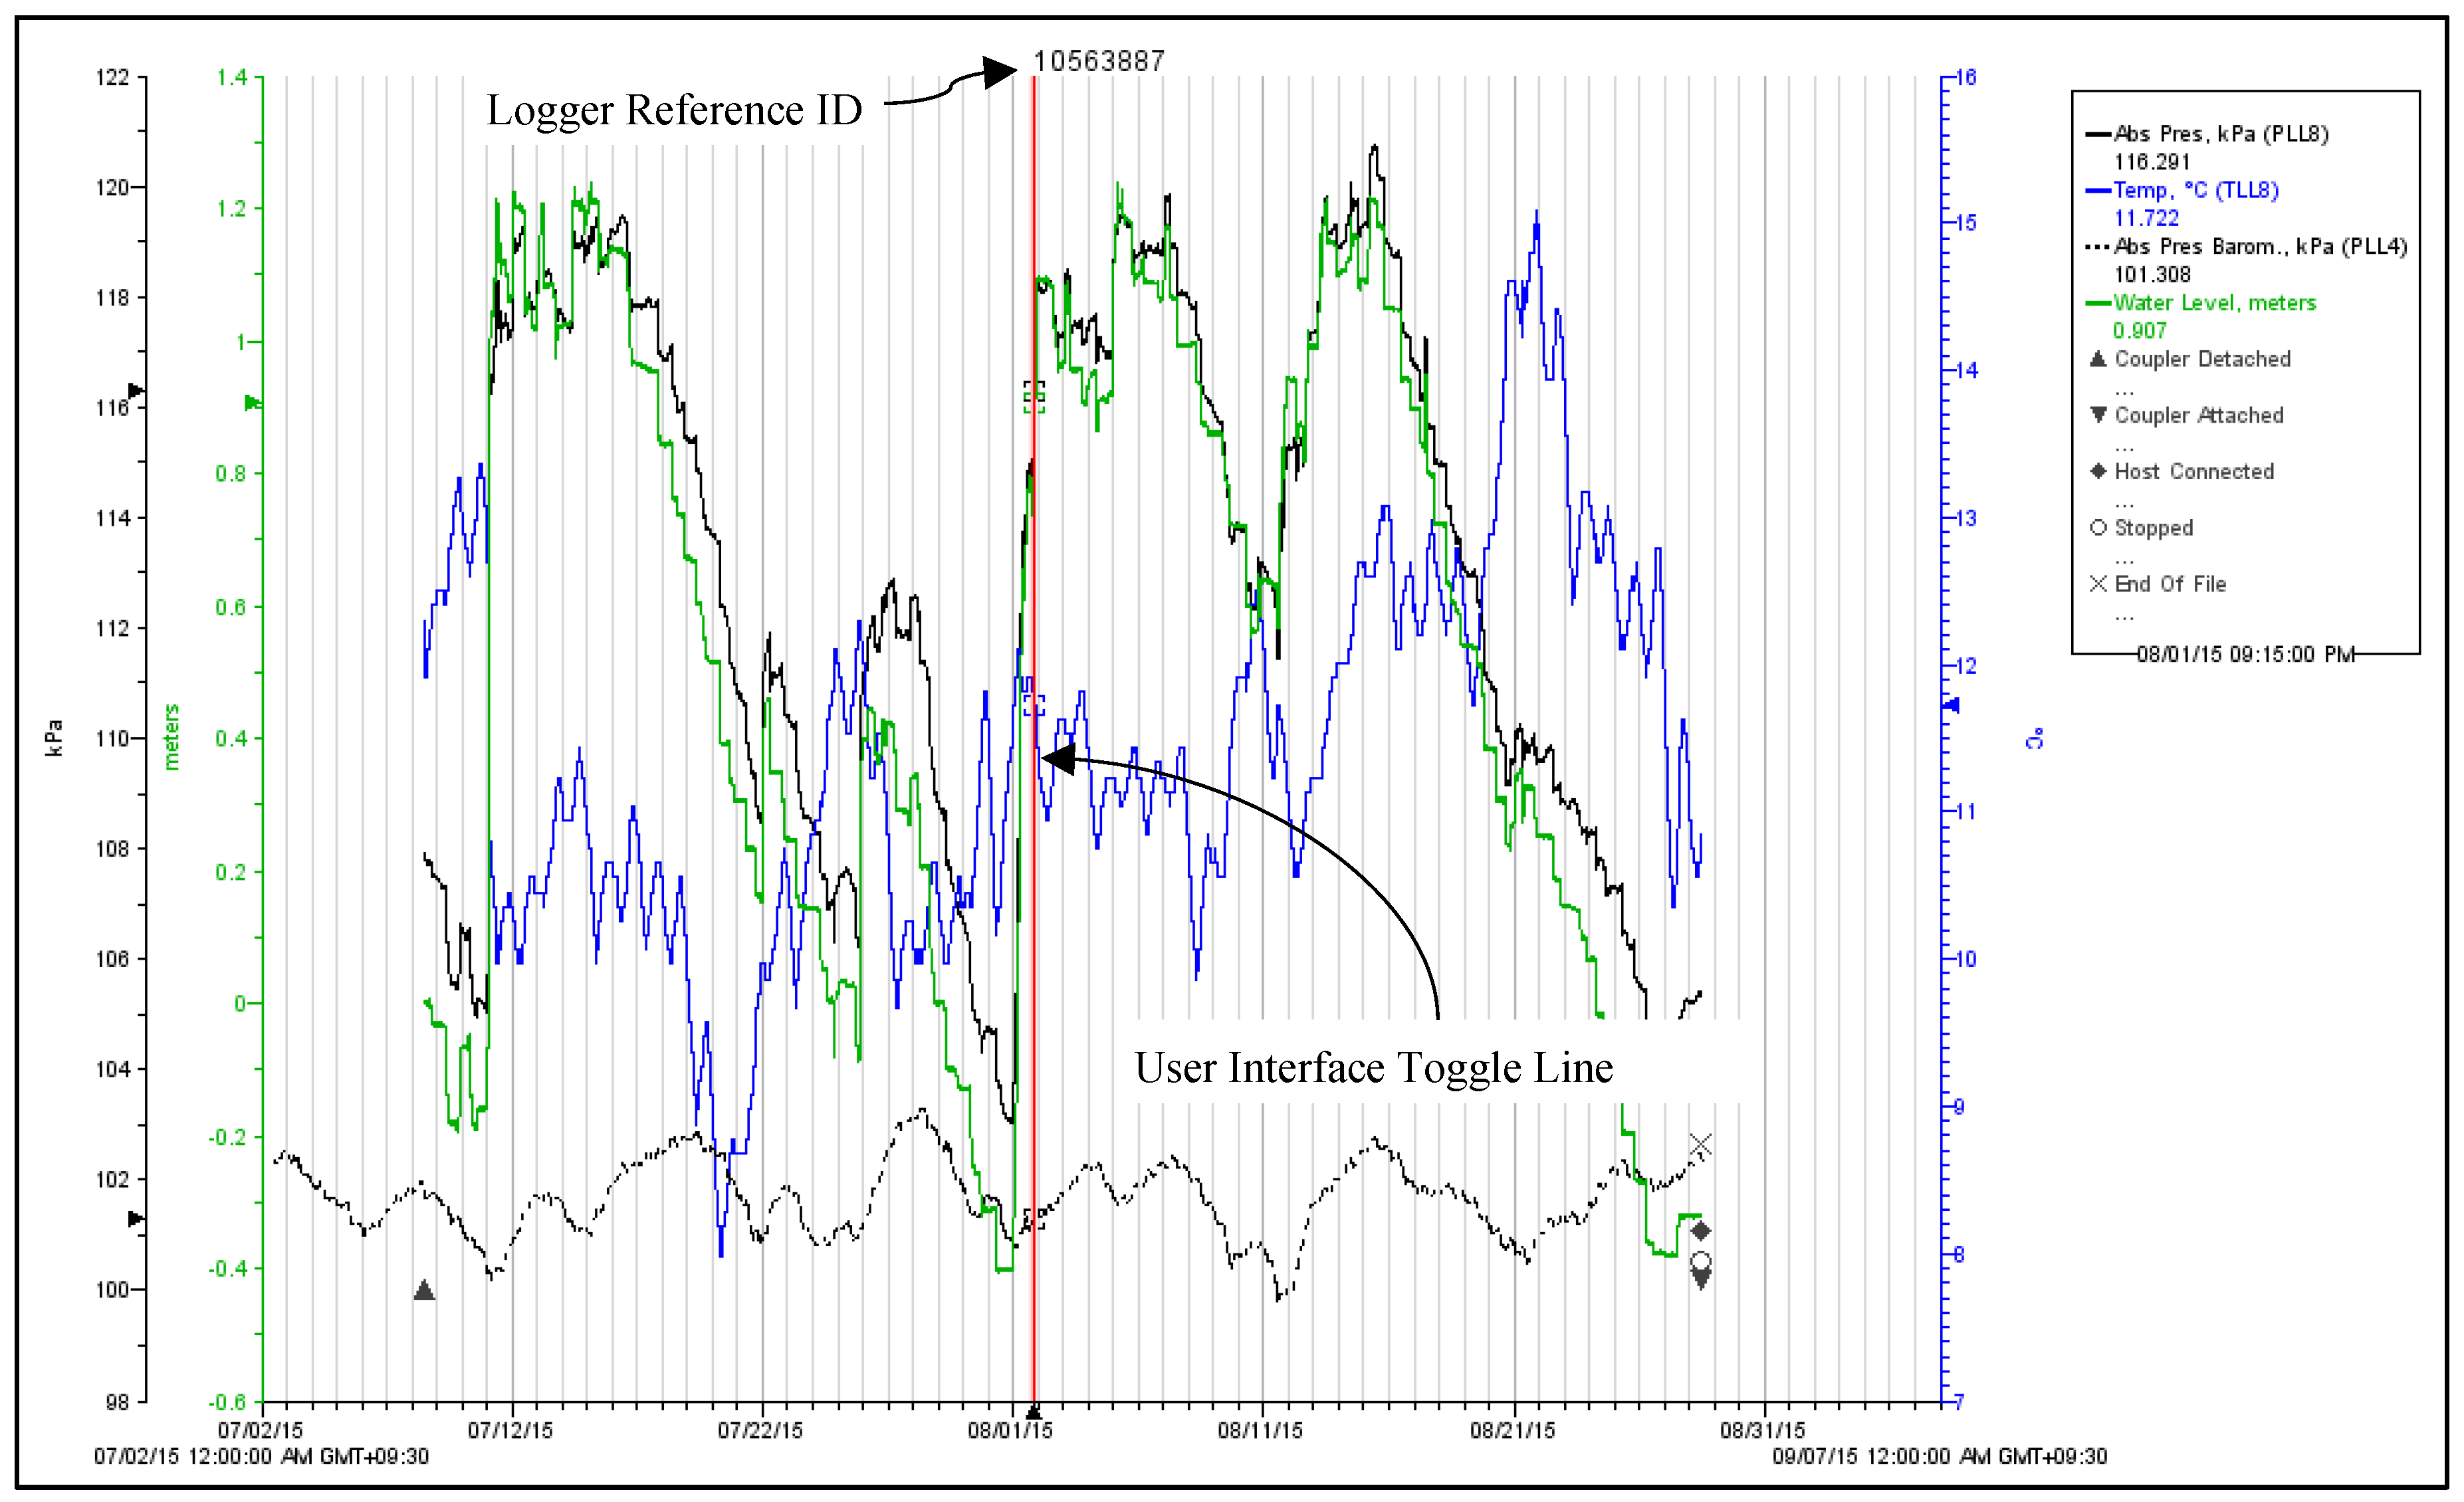
The changes in water levels within the rainwater tanks during isolated rainfall events were used to determine the corresponding runoff volumes. The runoff volumes were then used to determine the effective roof catchment areas for the individual households using corresponding rainfall data collected from an on-site rain gauge over a 12-month period. Over this period, an average of 14 rainfall events per RRH system of varying intensities was used in the analysis. Figure 3 shows typical water level changes in the tanks obtained from the recorded pressure readings for absolute and atmospheric pressure values. Sixty-nine tank level change events were used to estimate the effective roof catchment areas.
Daily rainfall (R) data from a weather station (Station number 23133, Greenacres, 34.87° S 138.64° E) in geographical proximity (1.36 km) to the study area was obtained from the Bureau of Meteorology (BOM) to validate the onsite 0.2 mm tipping bucket pluviographic raingauge that recorded in one-minute intervals. The daily rainfall data obtained from BOM and the aggregated daily rainfall data extracted from the onsite rainguage showed a high correlation of 0.99. The calculations involved in determining the roof runoff catchment areas eliminate the need to determine first flush volumes and losses (such as surface depression and evaporative losses) associated with the RRH systems as the calculation method directly determines the ‘effective’ roof catchment area based on the actual volume of runoff collected in the tank. Table 2 summarises the data characteristcs used to estimate the effictive roof catchment areas.
The effective roof catchment areas were calculated using monitored data (Table 2) as follows. First, days with recorded rainfall events (R > 0.2 mm) were shortlisted using daily rainfall data from the BOM rainguage. Rainfall events on the shortlisted days were then identified and isolated using the onsite raingauge data. All rainfall events (RI) were isolated in blocks of 1 h intervals (t = 60 min) to maintain unifomity in the data and to observe the influence of rainfall intensity on the runoff efficiency of the systems. Data were selected for rainfall events occurring between 10:00 PM and 7:00 AM to minimise the influence on tank water levels from indoor hot water usage by the householders. As the study also monitored the hot water consumption in households, any rainfall events occurring simultaneously with hot water usage events (within the household) were not taken into consideration to avoid data discrepancies that may occur from the varying rainwater level in the tanks.
For selected days where R > 0.2 mm, change in tank water level,
Collected runoff volume (VR) for given rainfall event,
Estimated effective roof catchment area (AC),
where RI is the recorded rainfall during any given rainfall event occuring in time t (where t = 60 min).
2.2. Roof Rainwater Harvesting Systems Modelling
The modelling-based Life Cycle Costing (LCC) for this study was undertaken using a modified Roof Runoff Harvesting Systems (RRHS) model (software) [22] based on the daily water balance procedures described by Allen and Argue [23]. Previous research by Mitchell [24] has shown that unless a high level of accuracy is required and the storage fraction (which is the ratio of storage capacity to the annual mean inflow ranged from 0.005 to 0.4) is less than 0.015, the additional effort of sub-daily analysis is not justified. The individual systems were analysed for yield capacities, costs, average annual yield and the system reliability on rainfall. The LCC analysis of the systems was based on a Capital Recovery Method (CRM) by taking into consideration the capital costs as well as ongoing costs for maintenance, replacement and operation of the systems. Historical daily rainfall data for a 12-year period from the Greenacres weather station were used in the model. The RRHS software is intended, primarily, for sizing rainwater tanks for domestic use of water, including indoor as well as optional outdoor use.
During the initial phases of the study, water balance models such as Aquacycle [25] were considered with the intention of comparing the different components of water demand involving the various water supply sources at Lochiel Park and eventually analysing them for their economic efficiencies outside of the model. However, the RRHS model was eventually chosen over other integrated urban water cycle models due to its ability to simultaneously assess the yield and economic performance of the systems. The RRHS model also allowed for researchers to make modifications to meet research needs such as the inclusion of additional cost parameters including costs associated with electricity usage for pump operations.
2.2.1. Model Assumptions
There are two types of losses that are broadly associated with roof harvesting rainwater systems, namely catchment losses and first flush losses. The model has recommended input values for first flush as well as ‘initial losses’ (or catchment losses) resulting from rainfall capture for different roof types (Iron, 0.5 mm; Terracotta, 1.0 mm; Concrete, 1.5 mm). However, any initial losses associated with catchment areas in this study were assumed to be zero as the effective roof runoff catchment area calculations are based on absolute volumes of rainwater collected in the tanks, hence eliminating the need to incorporate catchment losses or losses from first flush devices in the RRH systems.
2.2.2. Life Cycle Costing
Life cycle costing (LCC) can be used to estimate the total cost of a system over its entire life cycle or over the period during which its service is provided [26,27]. An LCC method takes into consideration all costs associated with the analysis period, including initial expenditure during the commencement of a project (capital costs), the ongoing costs for the operation and maintenance of a system and any replacement costs that would be incurred for purchase of components at the end of their useful life [26]. The analysis used in this study was based on the Capital Recovery Method wherein the Net Present Value (NPV) of the system having a life cycle of ‘n’ years can be expressed based on equations by Newnan et al. [28]:
where, P = capital cost, i = discount rate, and n = life span of a component.
The present and future costs of a system component are often considered to be the same due to uncertainties in predicting future costs. However, the future cost can be calculated considering predicted future annual inflation on the present cost. Generally, different system components have different life spans (n) requiring replacements at few times over an LCC analysis period m. In such cases, Equation (4) can be modified as follows
The capital recovery cost is the annual equivalent of the capital cost of the system. The Capital Recovery Factor (CRF) can be interpreted as a multiplicative factor which is used in determining the amount of equal annual expenditure to be incurred by the RRH system for ‘m’ number of years so that the total present value of all the expenses combined is equivalent to a payment of one dollar at present, at a given discount rate, ‘i’. The CRF can be determined as
where i = discount rate and m = analysis period (in years).
The value of equal annualised expenditure (A) for maintenance and operation, made in each of the n periods, is given by:
where NPV is the Net Present Value of the RRH system determined using Equation (4) or Equation (5).
The replacement time periods (life span) for different components considered in this study were based on previous studies [29], Hall [30] and Gurung and Sharma [26], plumbing costs from local businesses and retailers, as well as first-hand information received from the study participants on the performance of their RRH systems. The assumptions for replacement periods (life cycle) for all components are shown in Table 3.
The capital costs taken into consideration for the modelling analysis for each system included costs for the rainwater tank, pipe work and labour, plumbing, support structures for the tank and pump housing and rainwater pump (with float diverters). The ongoing cost inputs were maintenance costs and operational costs. Maintenance costs included periodic tank cleaning, sediment checking, gutter clearance, cleaning of leaf filters and first flush devices, and maintenance of pumps. Operational costs were those associated with energy for running the rainwater pumps.
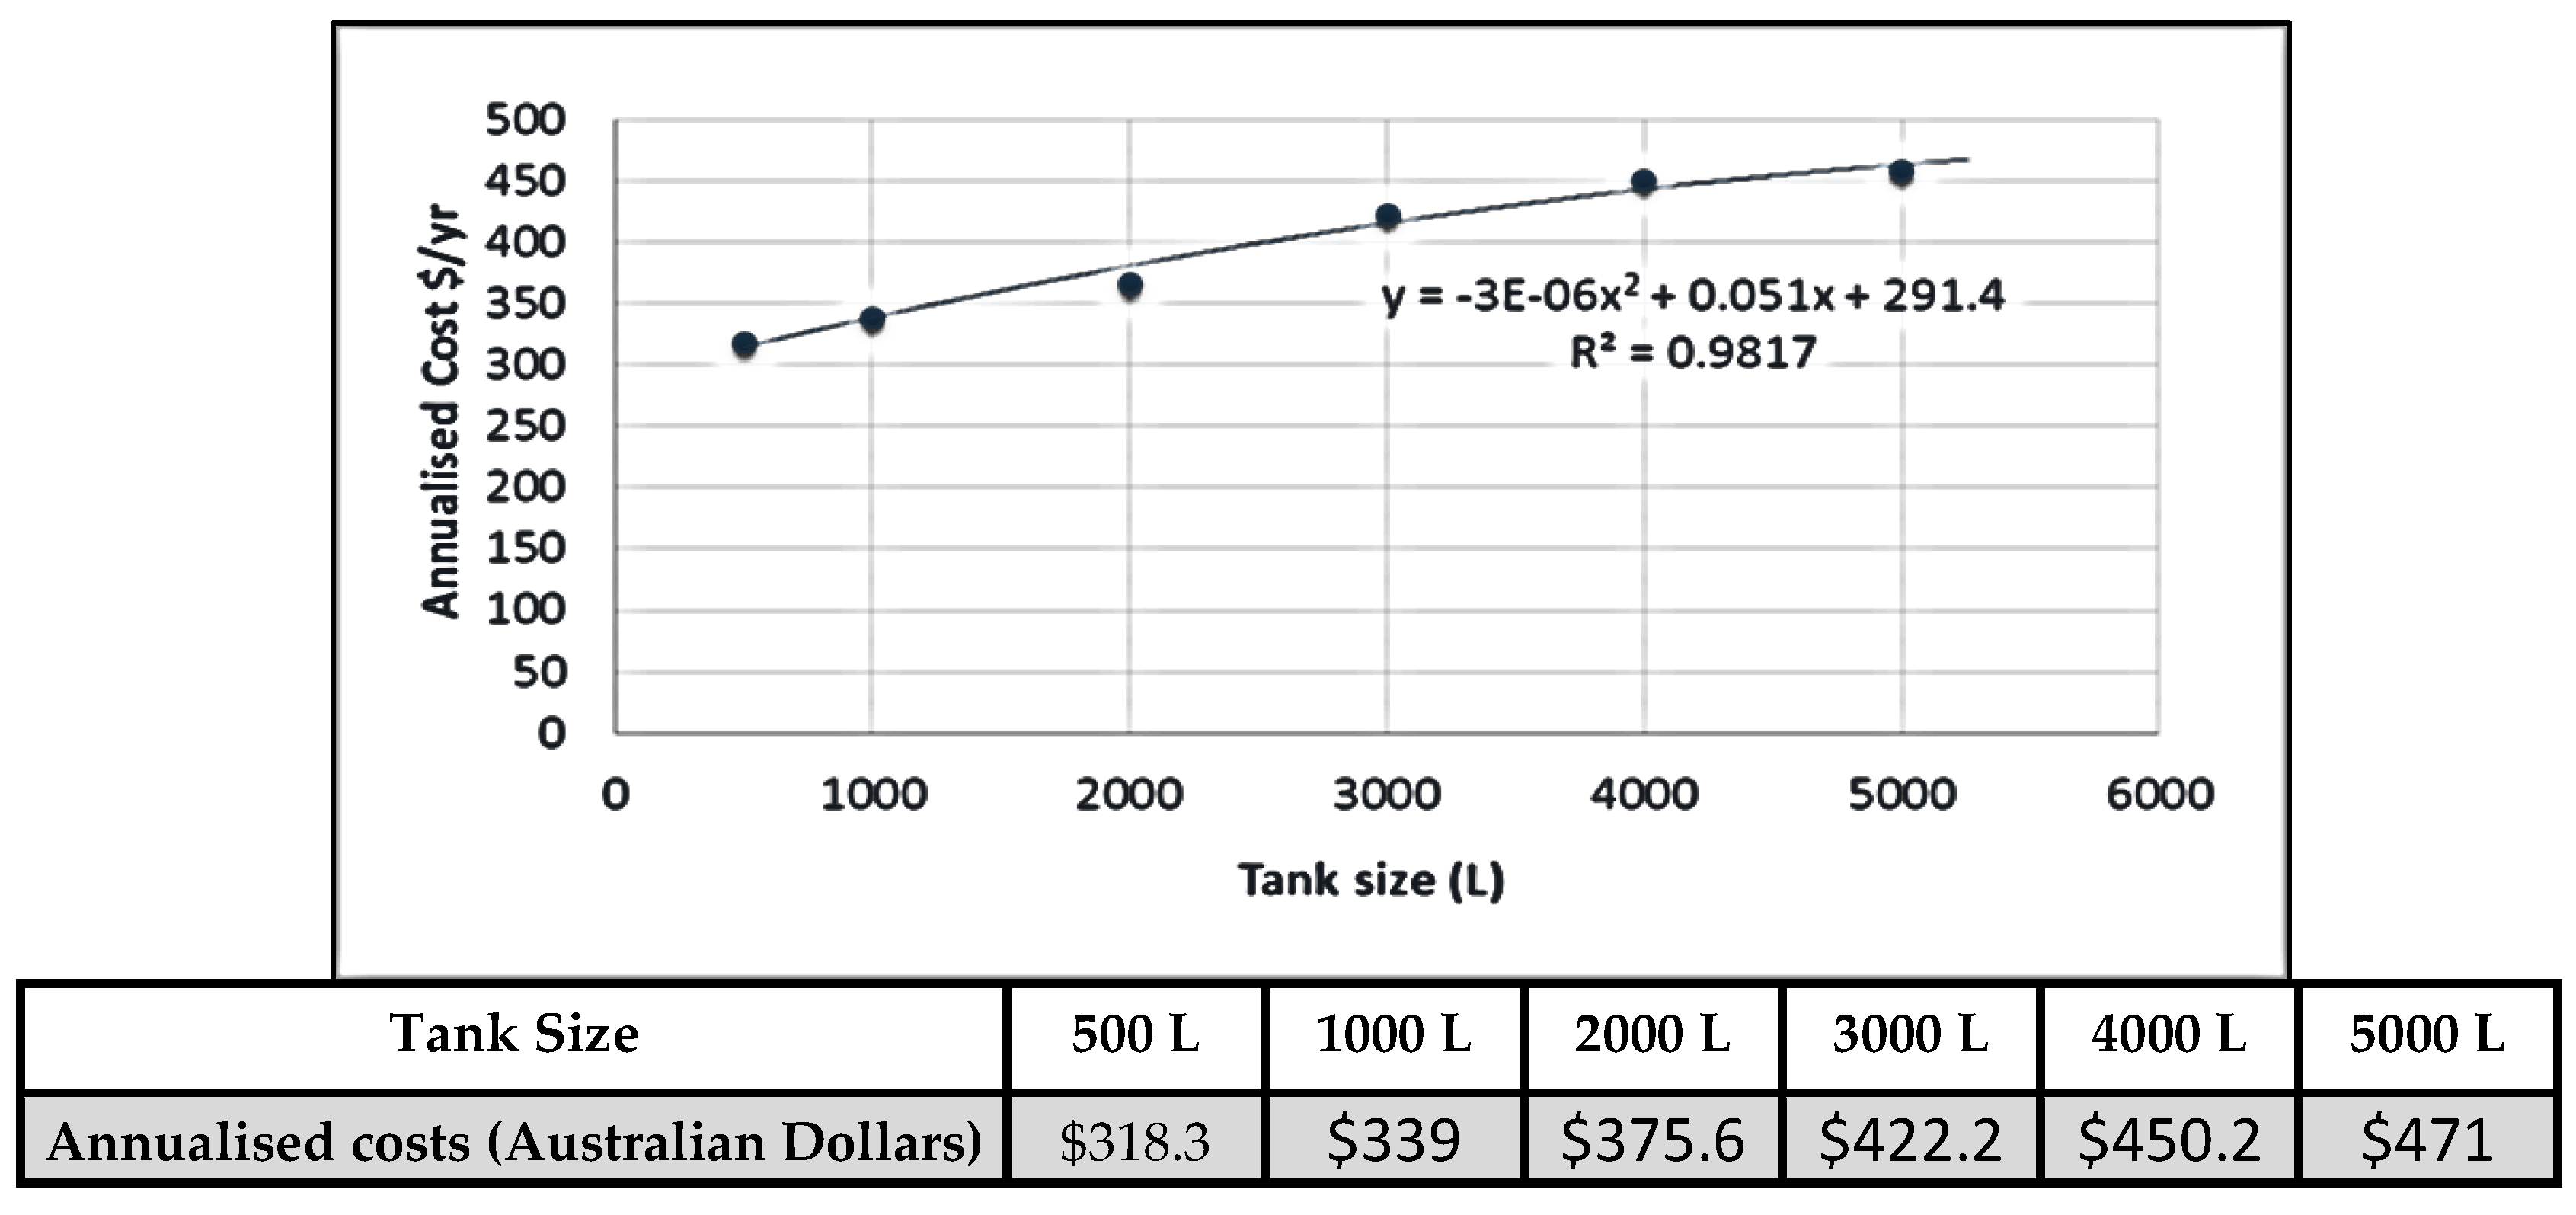
A discount rate (i) of 7% was applied to the model to calculate the CRF, NPV and the annualized costs for the systems based on the recommended Australian Government’s Best Practice Regulation Handbook [32]. The annualised costs were estimated for a 25-year tank replacement period and a 10-year pump replacement period. Since their installation in 2009, 40% (two out of five) of the households had replaced their rainwater pumps once while the rest have reported to have had no problem with their pumping systems. Hence, for this study, the pump replacement period was taken to be 10 years which is a commonly assumed service life for rainwater pumps. The annualized tank costs, which include the capital and operation/maintenance costs (Figure 4), were generally found to increase with increasing tank size. Although the capital costs and maintenance costs of the systems was the main determining factor in RRH systems design, the modelled outputs also included analysis of yield capacities, the average annual yield for the systems and their reliability on local rainfall.
2.2.3. Scenario Testing
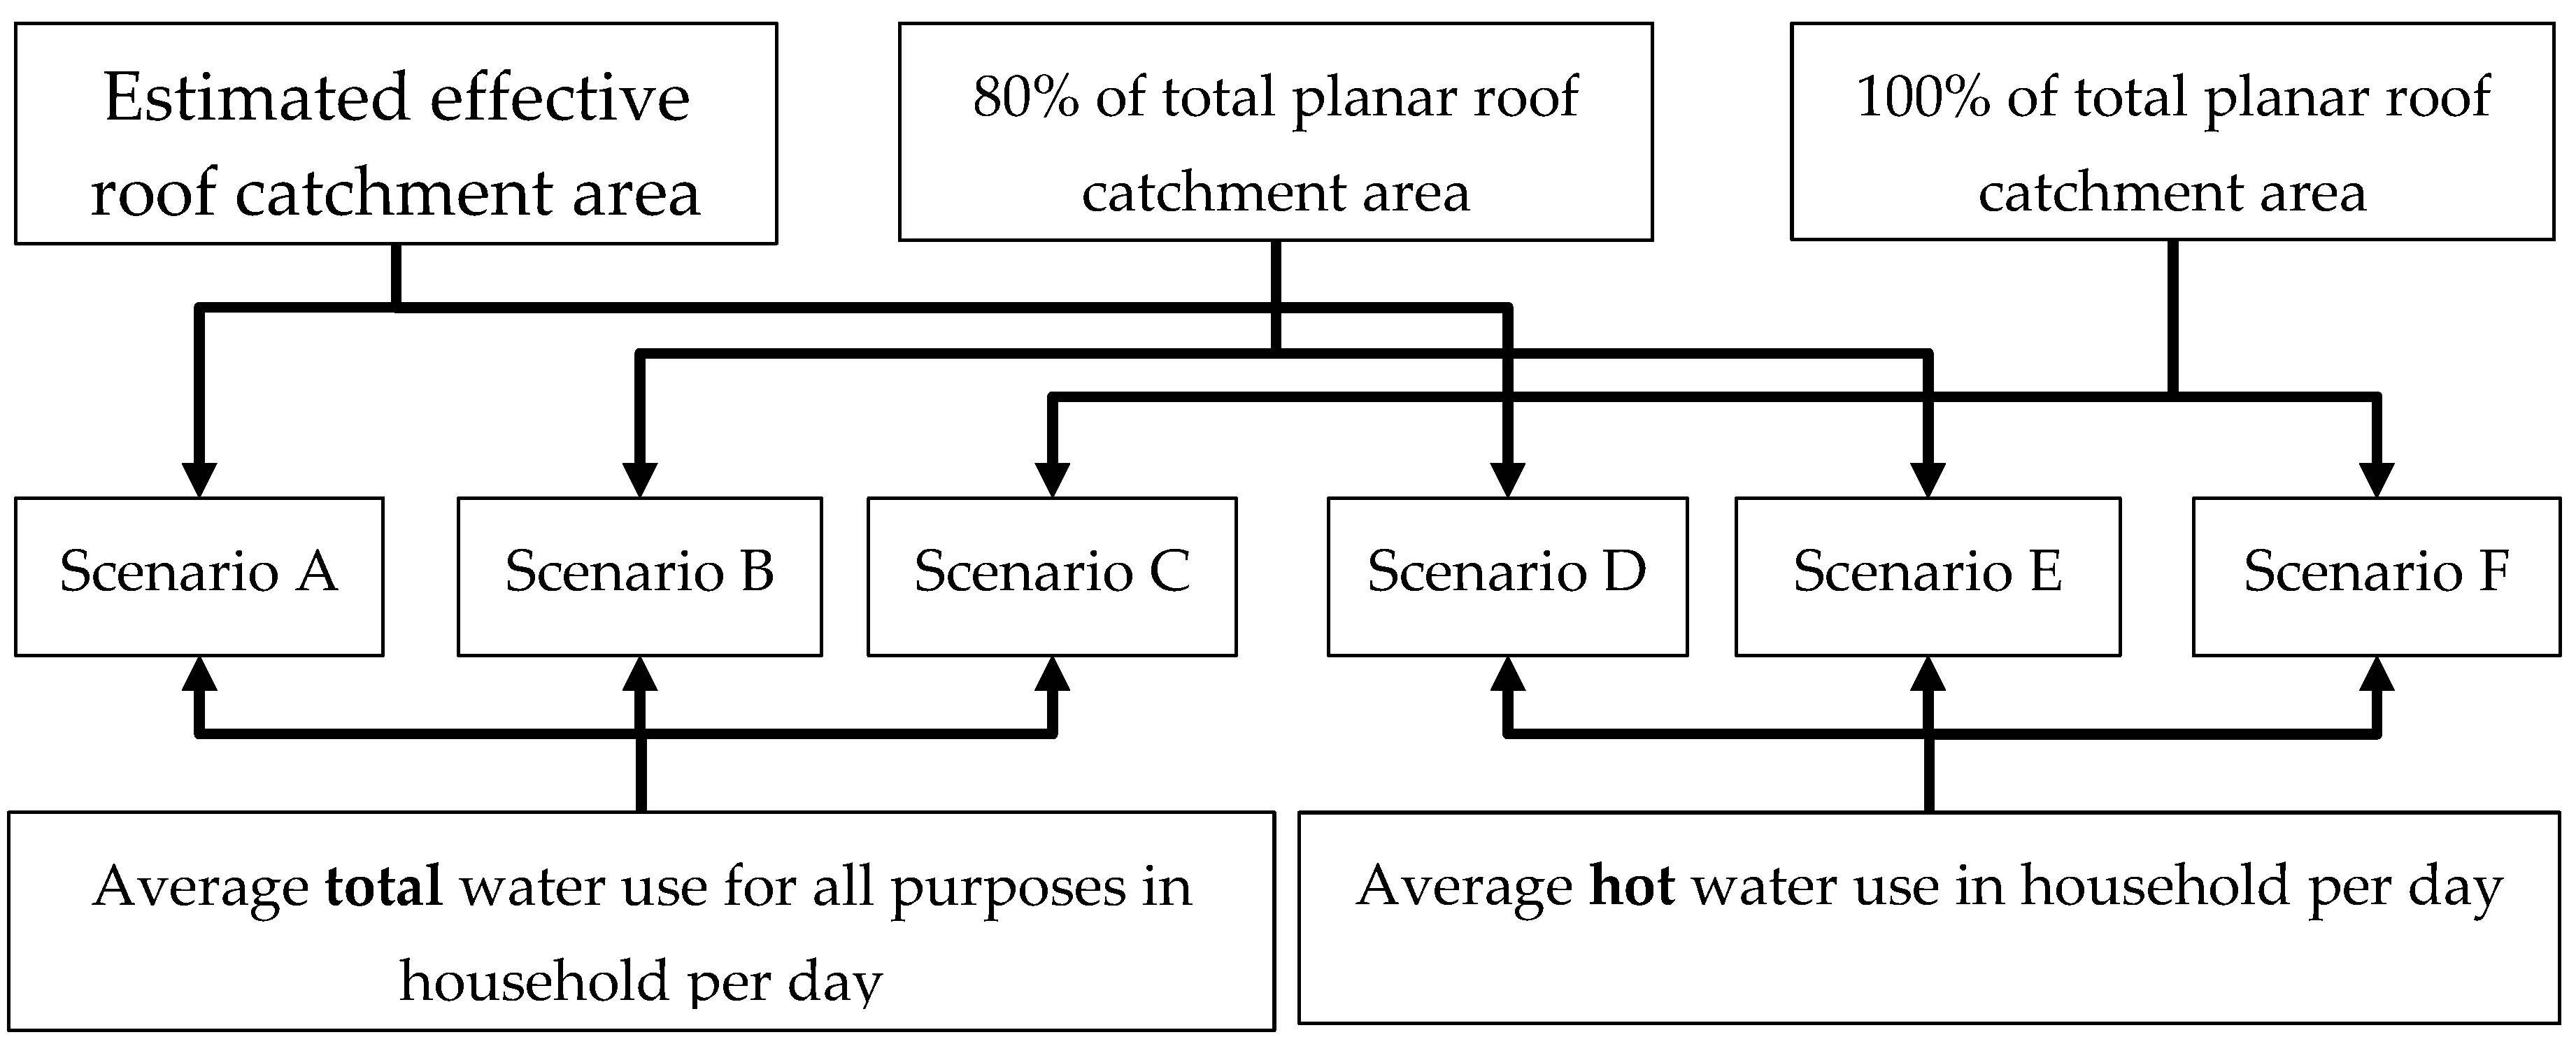
Six modelling scenarios (Scenario A to F) were developed for five RRH systems incorporating different combinations of roof catchment area size and household water usages (Figure 5). As depicted in Figure 5, for example, Scenario D is based on 80% of total planner roof catchment area for rainwater collection and the rainwater is used for hot water system.
The descriptions of all the six scenarios are provided in the following.
For scenarios A, B and C the model analysed the performance of RRH systems assuming that the collected rainwater would be used to meet all daily household end-use demands (potable and non-potable water demands including mains water demand) for three roof catchment area configurations (effective roof area, 80% planar roof area and 100% planar roof area). The remaining scenarios (Scenario D, E and F) analysed the performance of the RRH systems for the same three roof area configurations, assuming that the collected rainwater would be used to meet daily demands for hot water end-uses alone.
The results indicated a suitable tank capacity (based on the diminishing/increasing benefit of tank storage volume) for the corresponding input configurations of the RRH system being tested. Graphs for individual systems were generated for:
- Supply (‘Average annual yield’ and ‘Percentage of water supplied’ vs. ‘Tank size’)
- Cost (‘Average annual yield’ and ‘Cost per kilolitre supplied’ vs. ‘Tank size’)
- Security (‘Average annual yield’ and ‘Days with zero supply’ vs. ‘Tank Size’)
An example of these graphs can be viewed in the Supplementary Files (Figure S3). The tank sizes for optimized supply, cost and security correspond closely to each other, as shown by Outputs A, B and C in the Supplementary Files. A compilation of the results from the model for the different scenarios is shown in supplementary tables, Tables S4–S9.
The model was validated against recorded data obtained from water use monitoring. This was achieved by replacing the ‘daily household water demand’ by the monitored rainwater yield in the individual households (Table 4).
Six scenarios were executed for each of the five RRH systems. Table 4 shows the actual tank sizes in the RRH systems and their corresponding daily water demands (total, hot water and rainwater demands) obtained using monitored data. The table is used as a reference for comparison of actual consumptions with model-based predictions.
3. Results and Discussion
3.1. Effective Roof Area Calculations
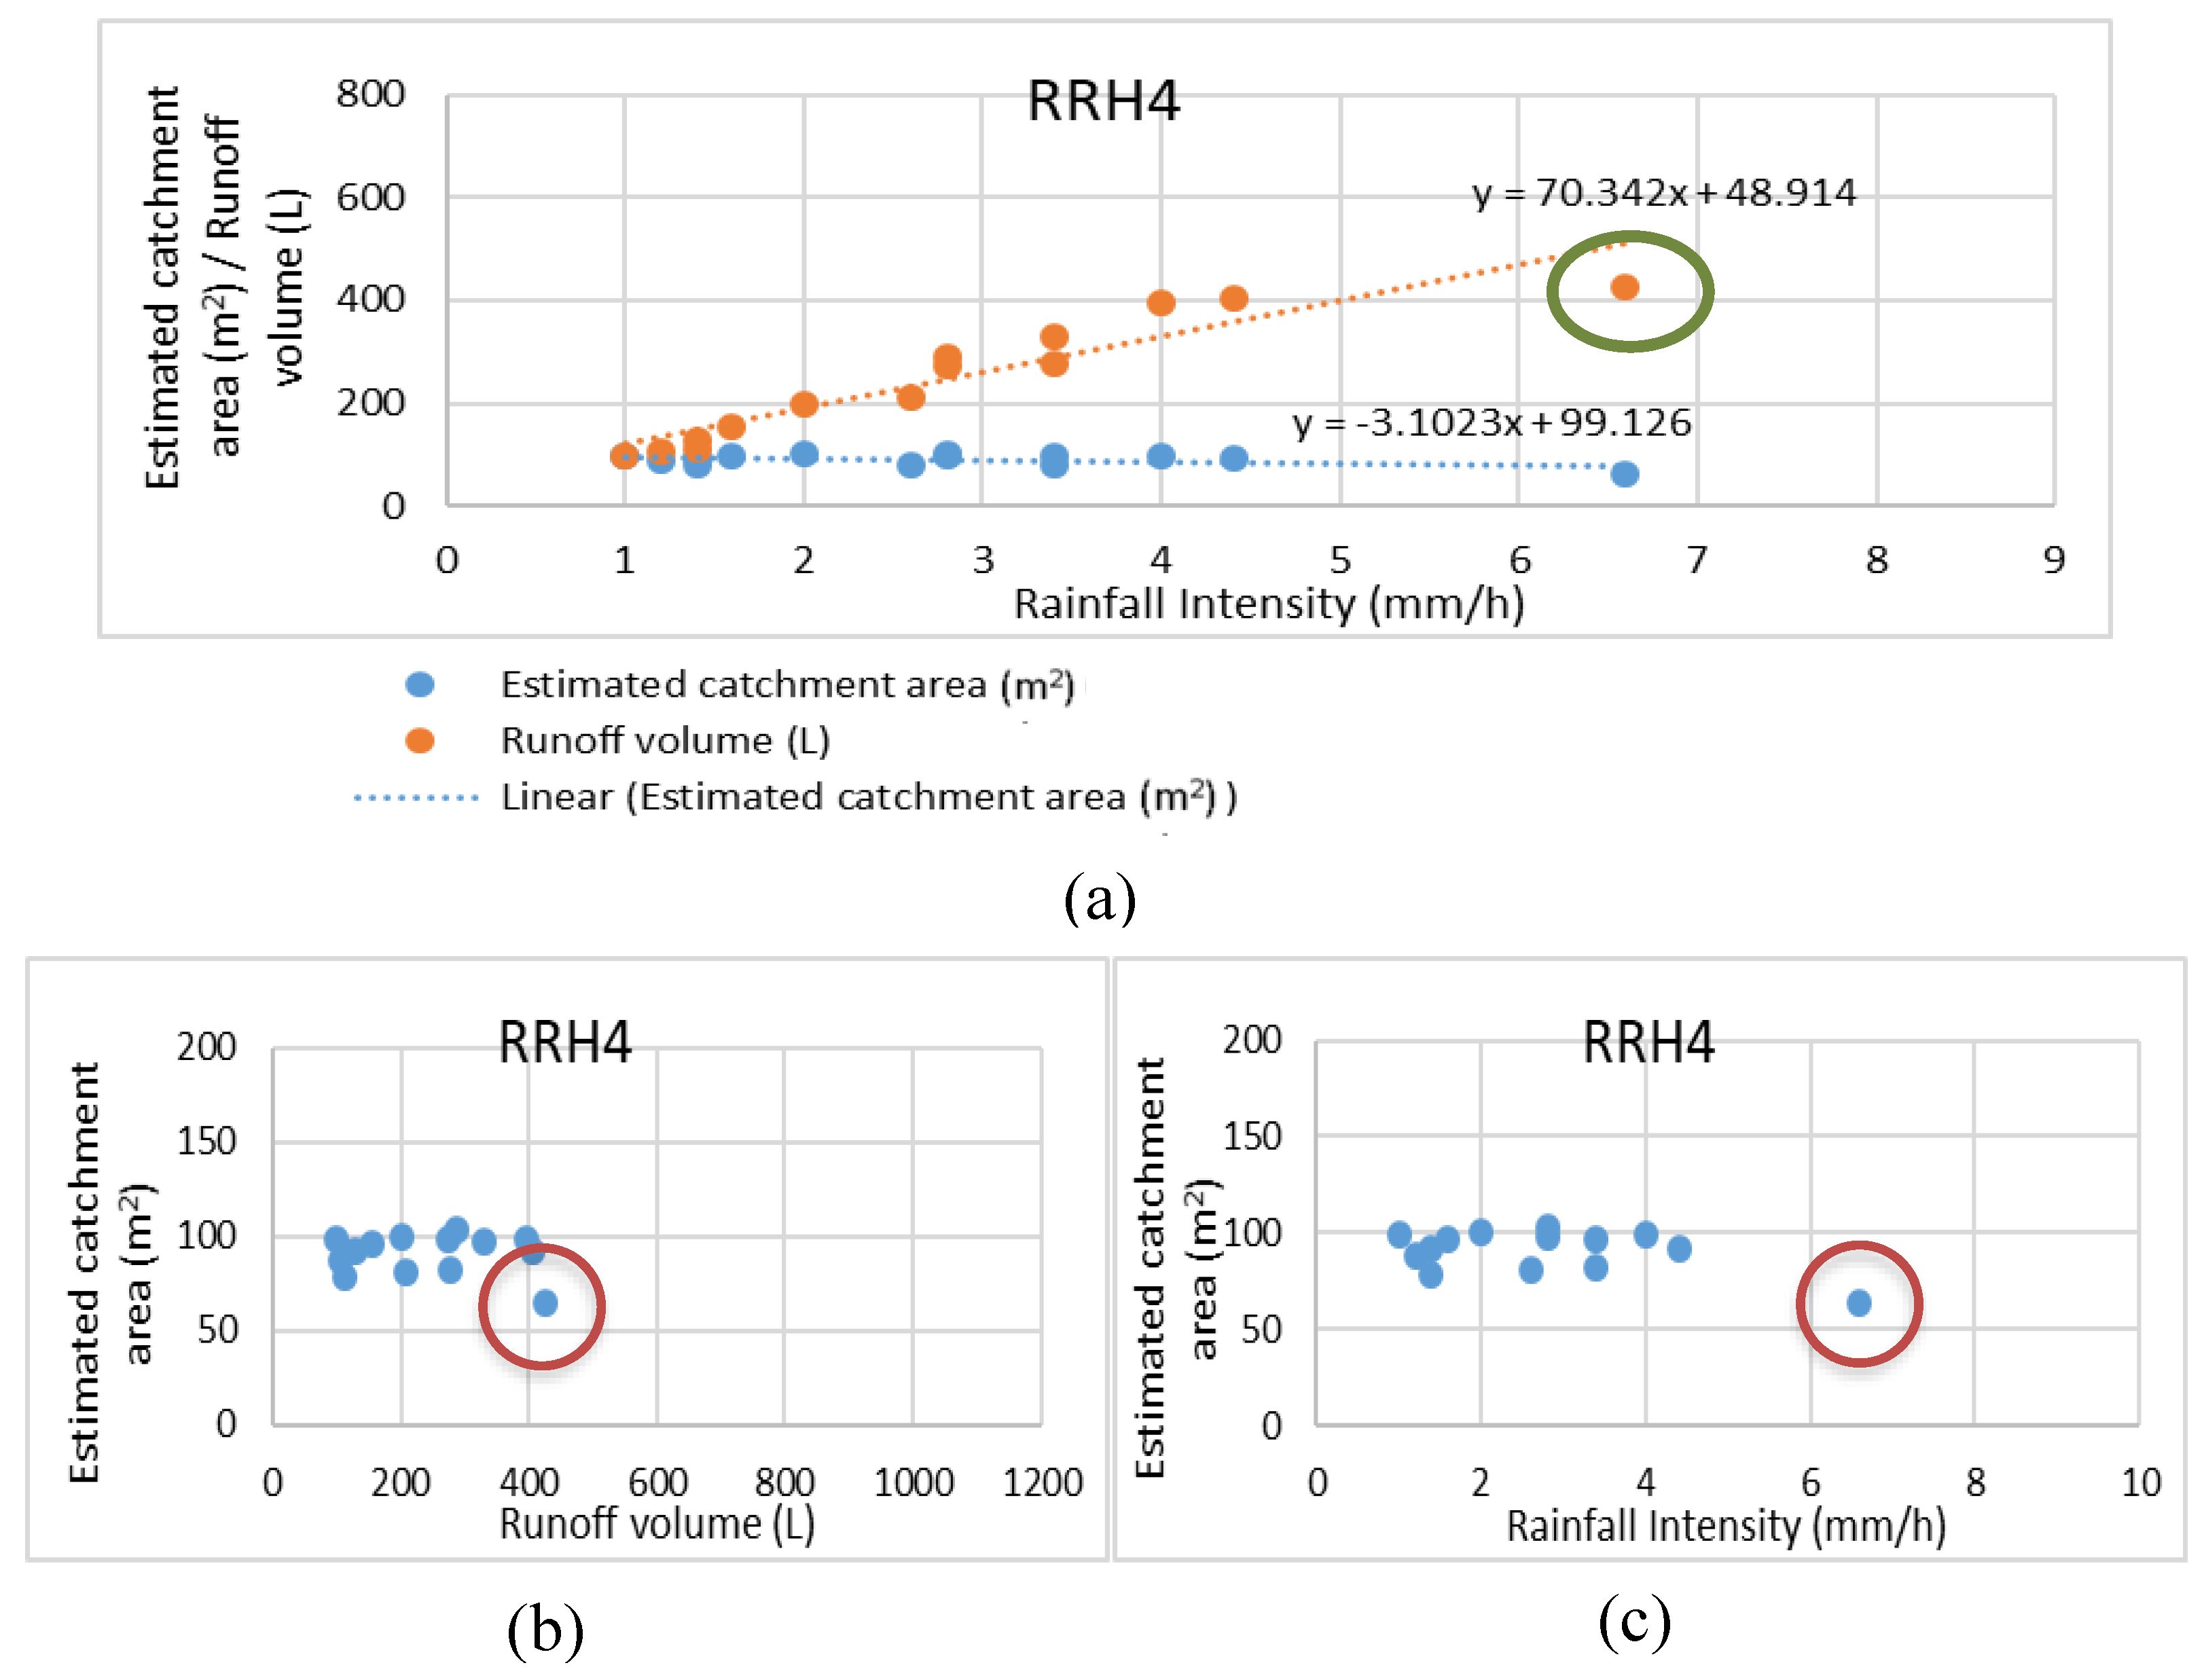
Evocative roof area calculations were based on the method described in Section 2.1. Roof runoff volumes were found to increase with higher rainfall intensities. The effective roof areas remained within a certain range unique to each system. The results show that higher rainfall intensities did not necessarily lead to higher volumes of rainwater collection. A closer look at the relationships between the effective catchment area values and their corresponding rainfall intensities showed that, in many cases, the collected runoff volumes did not exponentially increase when rainfall intensities exceeded 5 mm/h rainfall (event circled in green, Figure 6). The lower runoff volumes resulting from higher rainfall intensities also underestimated the calculated values for effective roof catchment areas, as shown in Figure 6b,c (events circled in red). An example of the estimated effective roof catchment area for one of the five RRH systems (RRH4) is shown in Figure 6a. The corresponding areas for the remaining systems can be viewed in the Supplementary Files (Figures S1 and S2).
A comparison of the derived effective roof catchment areas with the planar roof areas of the studied RRH systems is shown in Table 5. A total of 69 rainfall events were analysed (14 events per households on average) to predict the mean and median values for effective roof catchment areas. Table 5 also shows the percentage of connected roof areas in each system. Based on the median values for predicted roof catchment areas, the results showed that although the RRH systems met the minimum SA building requirement of 50 m2 of roof area allocated for rainwater collection, only RRH1 satisfied the design guidelines of the housing development, which required rainwater runoff catchment areas to cover a minimum of 80% of the roof surface area. This could be due to alterations in connected catchment areas, guttering or downpipe configurations during the construction of the households. The average connected roof catchment area was 68% for the five systems.
3.2. RRHS Modellling
3.2.1. Estimation of Annual Yield
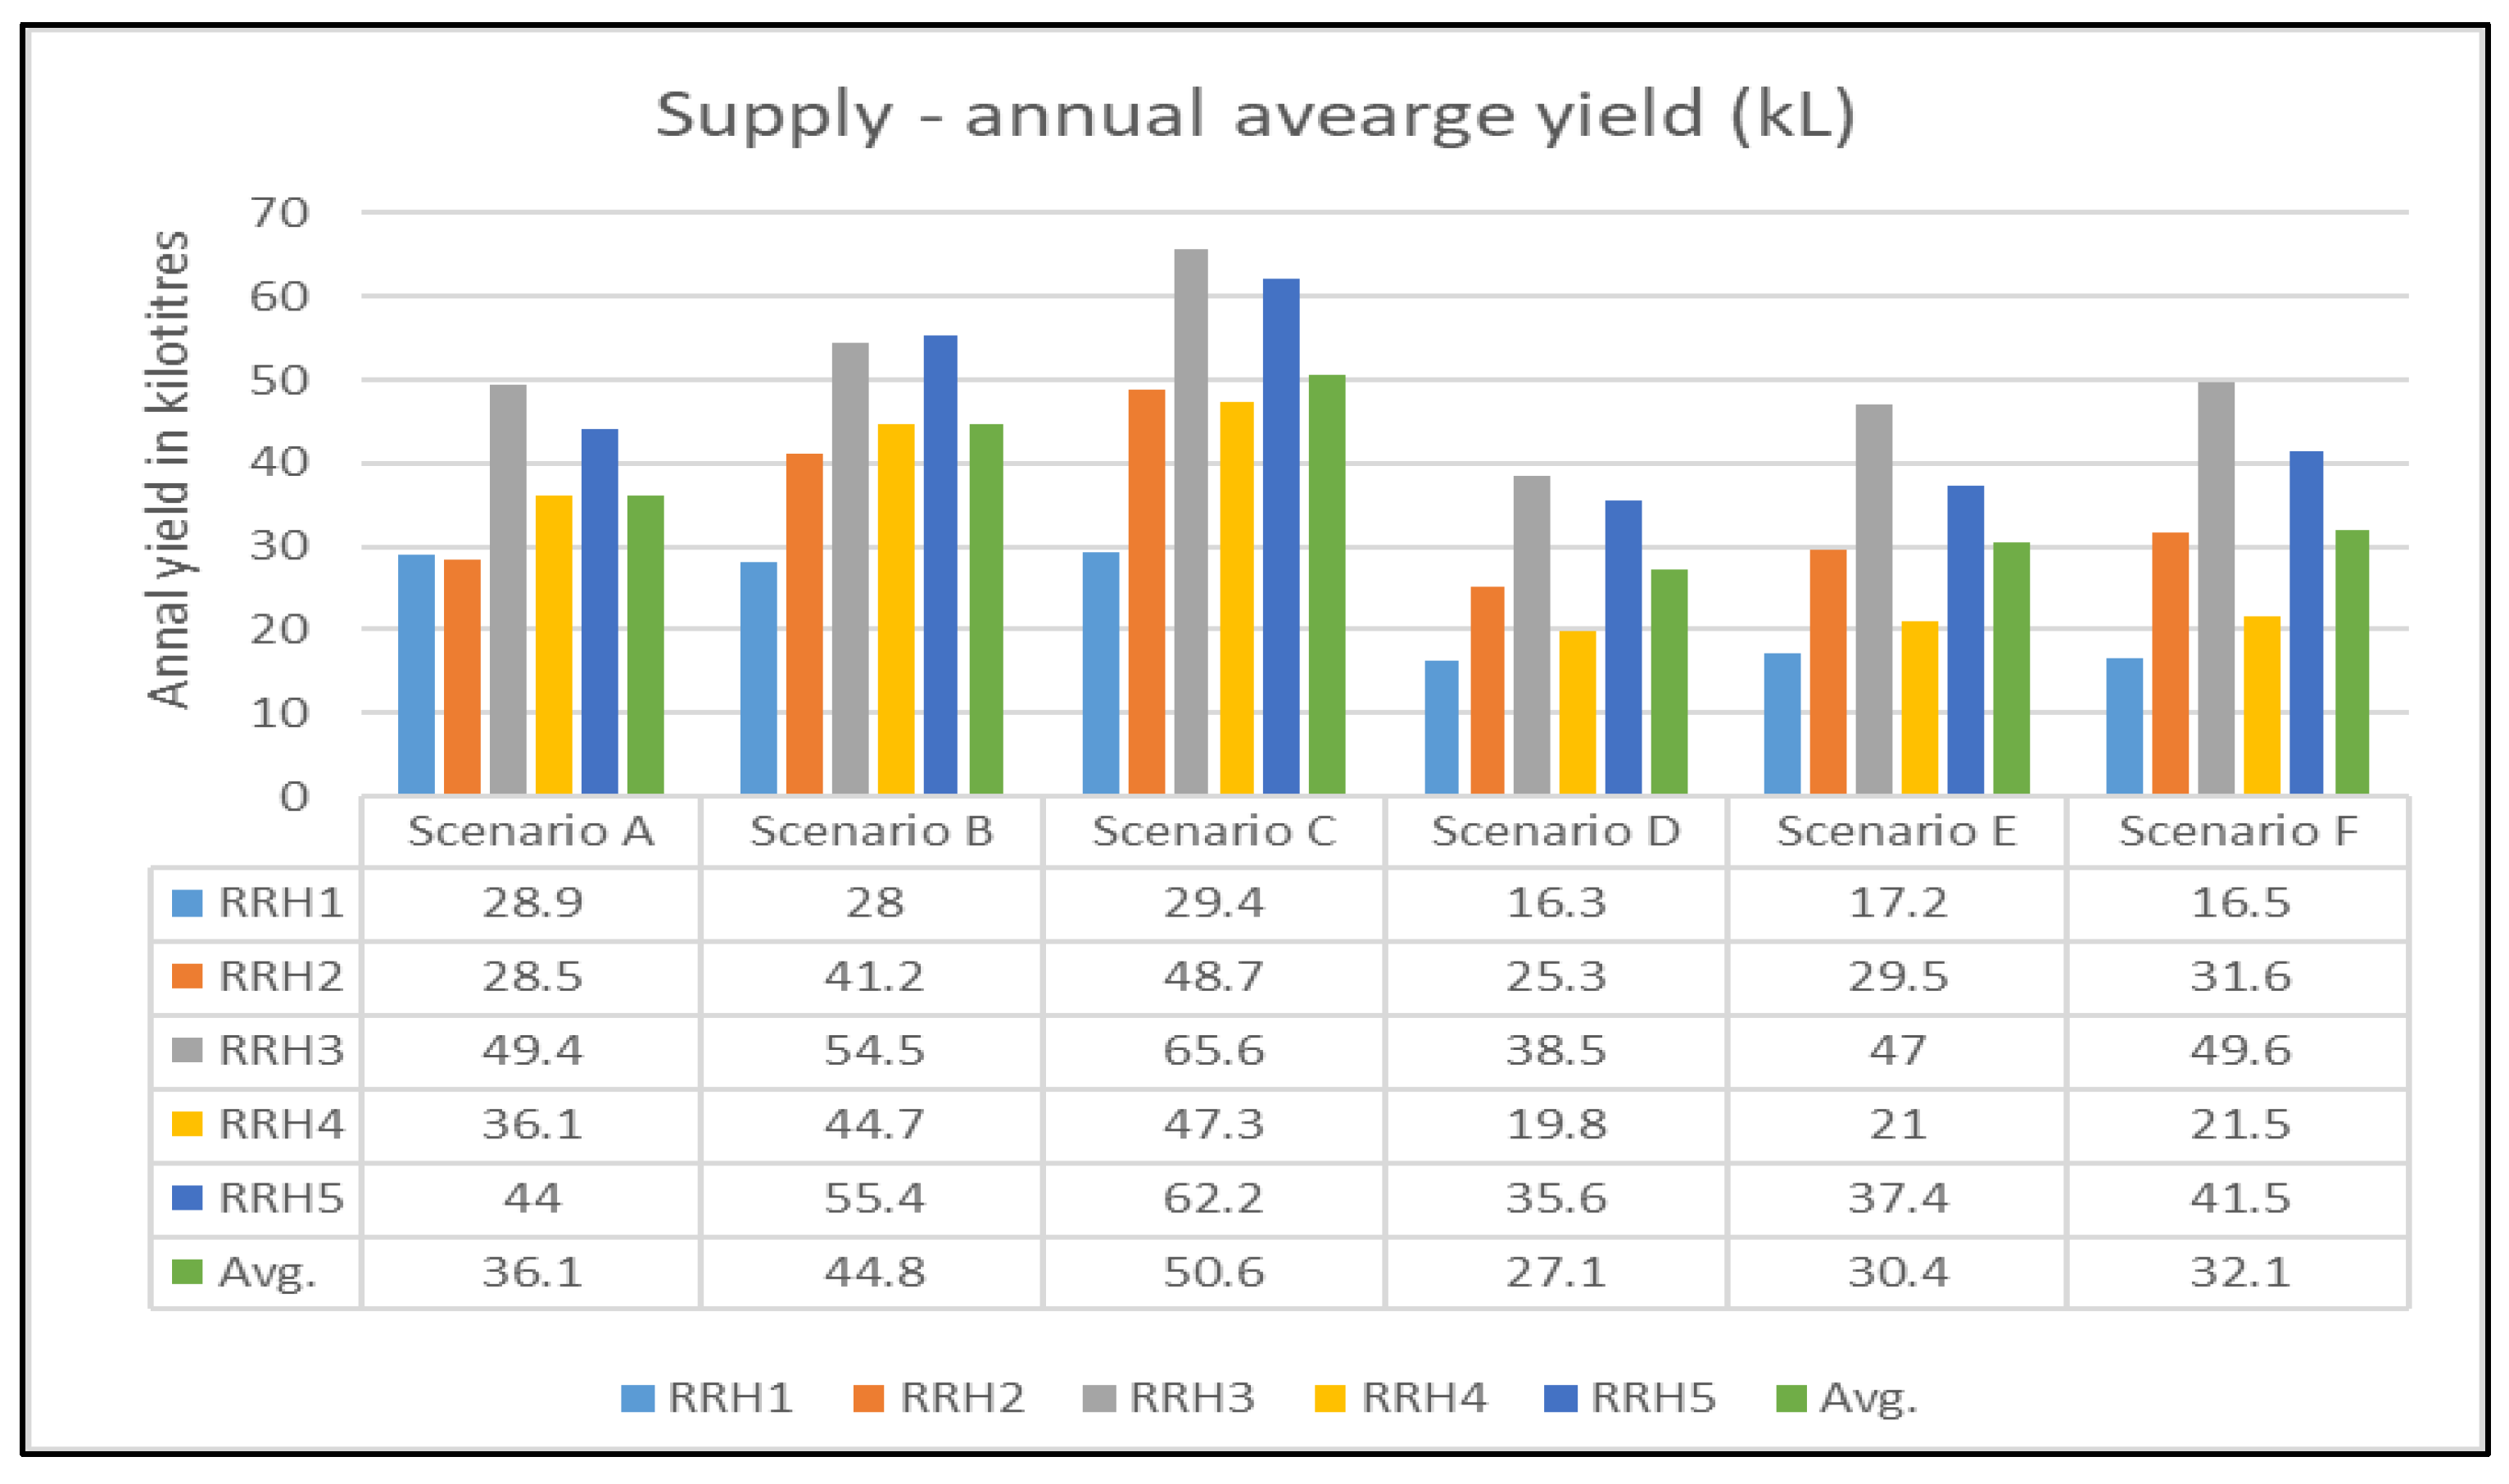
The annual yield capacities for the six modelling scenarios are shown in Figure 7. Scenario C produced the highest average annual rainwater yield, which was estimated to supply 50.6 kL per household. The higher yield from Scenario C is attributed to the larger roof catchment area (100% of planar roof area). However, the high efficiency arising from this scenario can only be supported by larger tank sizes (3000 kL on average) (refer to Table S5 for individual tank size recommendations). Additionally, the higher yield from the Scenario C tank configurations is mainly due to a higher household water demand. For the same RRH system configurations, Scenario F, with only hot water demands being met by the RRH systems, yielded 18.5 kL less rainwater than Scenario C, which equates to 36% lower yield than that of Scenario C.
The least efficient scenario for yield efficiency was found to be Scenario D, with an average annual yield of just 27.1 kL. Scenario D is closest in configuration to the actual setup in the studied RRH systems as the results are based on the calculated effective roof areas and the actual (monitored) hot water demand in the households. The recommended median tank size from the model was 1500 L (refer Table S6 for individual tank size recommendations), which equals the actual tank size (Table 1) in the systems. The results from Scenario D can be compared with those from Scenario A, which only differs from Scenario D in its daily water use, requiring the system to meet the total daily demand in the household, as opposed to just hot water use in Scenario D. This comparison shows that with a small increase in median tank size from 1500 L in Scenario D to 2000 L in Scenario A, the annual yield in the systems can increase from 27.1 kL to 36.1 kL. The results suggest that significant increases in yield can only be supported by an increase in daily water demands in the household. Hence, an augmentation of the current end-uses (meeting only hot water demands) to include additional uses, such as toilet flushing, laundry and outdoor irrigation, may in fact increase the yield in the systems by almost 25%.
In contrast, when scenarios with the same end-use demands but different roof connectivity were compared, it was found that increasing roof area increased the rainwater consumption (availability). The yield from the tanks for an average effective roof area of 109.9 m2 (Scenario A) was 19.5% lower than for an average planar roof area of 130 m2 (Scenario B). When the roof area was increased to 100% of the planar area (roof area of 162.5 m2, Scenario C) the yield increased by a further 11.5%, resulting in a total difference of 29.5% in yield between the effective roof area and 100% roof area connectivity. Details of the planar and effective roof areas can be viewed in Table 3. Scenarios A, B and C were all simulated to meet total daily household demands. Similarly, when meeting only hot water demands, their yields increased by 11% from Scenarios D (effective roof area = 109.9 m2) to E (80% planar roof area = 130 m2), and a further 5.3% increase in yield for Scenario F (100% planar roof area = 162.5 m2). The difference in yield between the effective roof area (Scenario D) and 100% roof area connectivity (Scenario F) was 15.5%. This contrasts with the percentage increase observed in scenarios designed for total household water consumption, which noticeably yielded almost double the rainwater savings for the same increase in roof areas. Scenario E only differs from Scenario D (being closest to the actual configurations in the studied households) in its increased roof runoff catchment area and the results indicate that if the RRH systems had 80% roof connection, they could be expected to yield an average of 3.3 kL of additional rainwater supply annually without having to increase their tank sizes and at the same time, maintaining their end-use supply to hot water connections alone.
3.2.2. Estimation of Annualised Costs
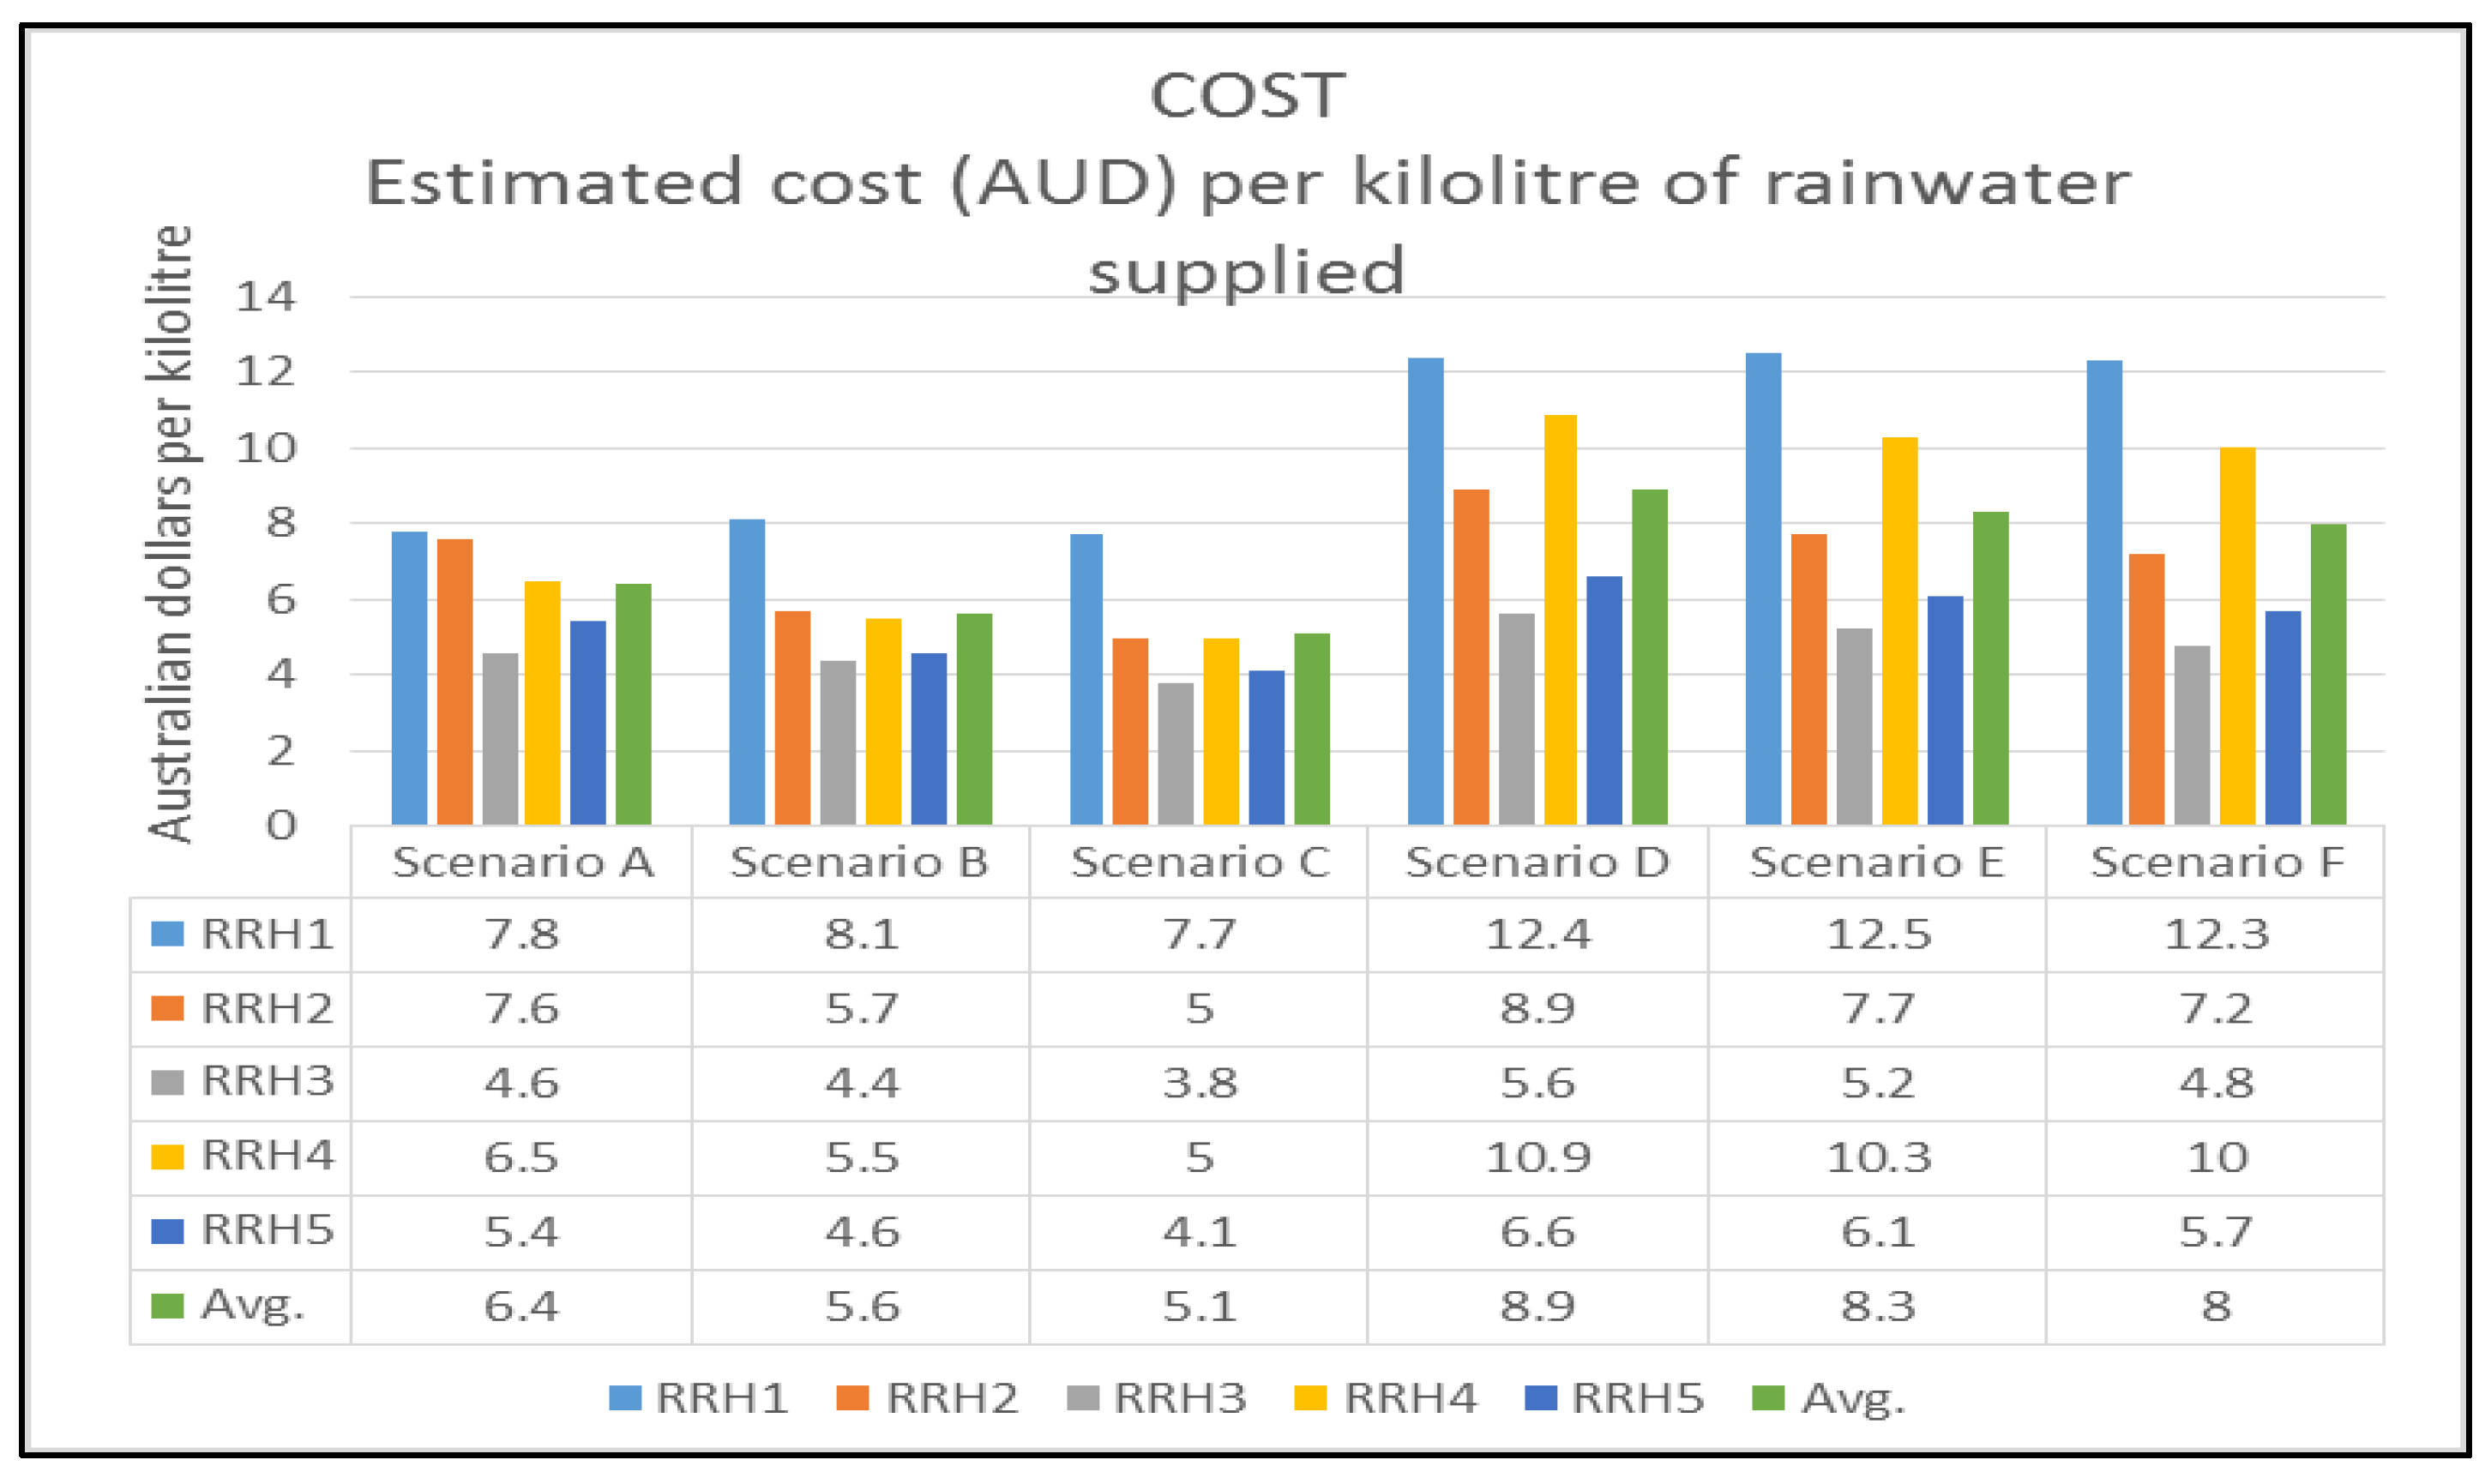
The annualised costs (Figure 8) for the six scenarios indicate that Scenario C is the most efficient in terms of cost per kilolitre of rainwater use, at an average of 5.1 AUD$/kL, with Scenario D being the least efficient (8.9 AUD$/kL). As discussed previously, the annualised costs associated with the modelled RRH systems showed high correlation to the yields from the systems. Hence, cost efficiency in RRH systems can be directly attributed to higher rainwater yield, which is not only dependent on the roof and tank sizing, but also on the end-use demand in the households. However, even the most cost-efficient scenario (C) has higher costs than centralized mains water use, which is currently 2.32 AUD$/kL in Adelaide. For Scenario D (Figure 8), which is similar to the installed setup in the studied households, the average cost per kilolitre of rainwater was 8.9 AUD$/kL, which is 3.5 times greater than the cost of current mains water supply in Adelaide.
For all scenarios, the average yields were found to have strong inverse linear correlation (0.96) to the NPV of installation and operation of the RRH systems. Hence, an increase in the NPV of the systems did not indicate an improvement in yields. The effect of augmentation of end-uses on the NPV was evident from the scenario analyses. On average, increasing the end-use demands from daily hot water to total household water demands showed significant cost reductions of 28%, 32% and 36% when Scenarios A, B and C were augmented to Scenarios D, E and F, respectively (Figure 8).
Similarly, a mean cost reduction per kilolitre from an increase in roof area was also evident. Whilst maintaining the end-use demand (total household water) constant, an increase in roof area from Scenario A (average effective roof area of 109.9 m2) to Scenario B (80% roof connectivity with an average roof area of 130 m2) showed a cost reduction of 12.5%. Similarly, an increase of roof area from Scenario B to Scenario C (100% roof connectivity with an average area of 162.5 m2) showed a 9% decrease in cost per kL. For scenarios with hot water end-use only, increases in roof area showed only moderate cost reductions. For example, moving from Scenario D to E showed a reduction of 6.7%, while moving from Scenario E to F showed a reduction of 3.6% due to lower water demand.
3.2.3. Security of Supply
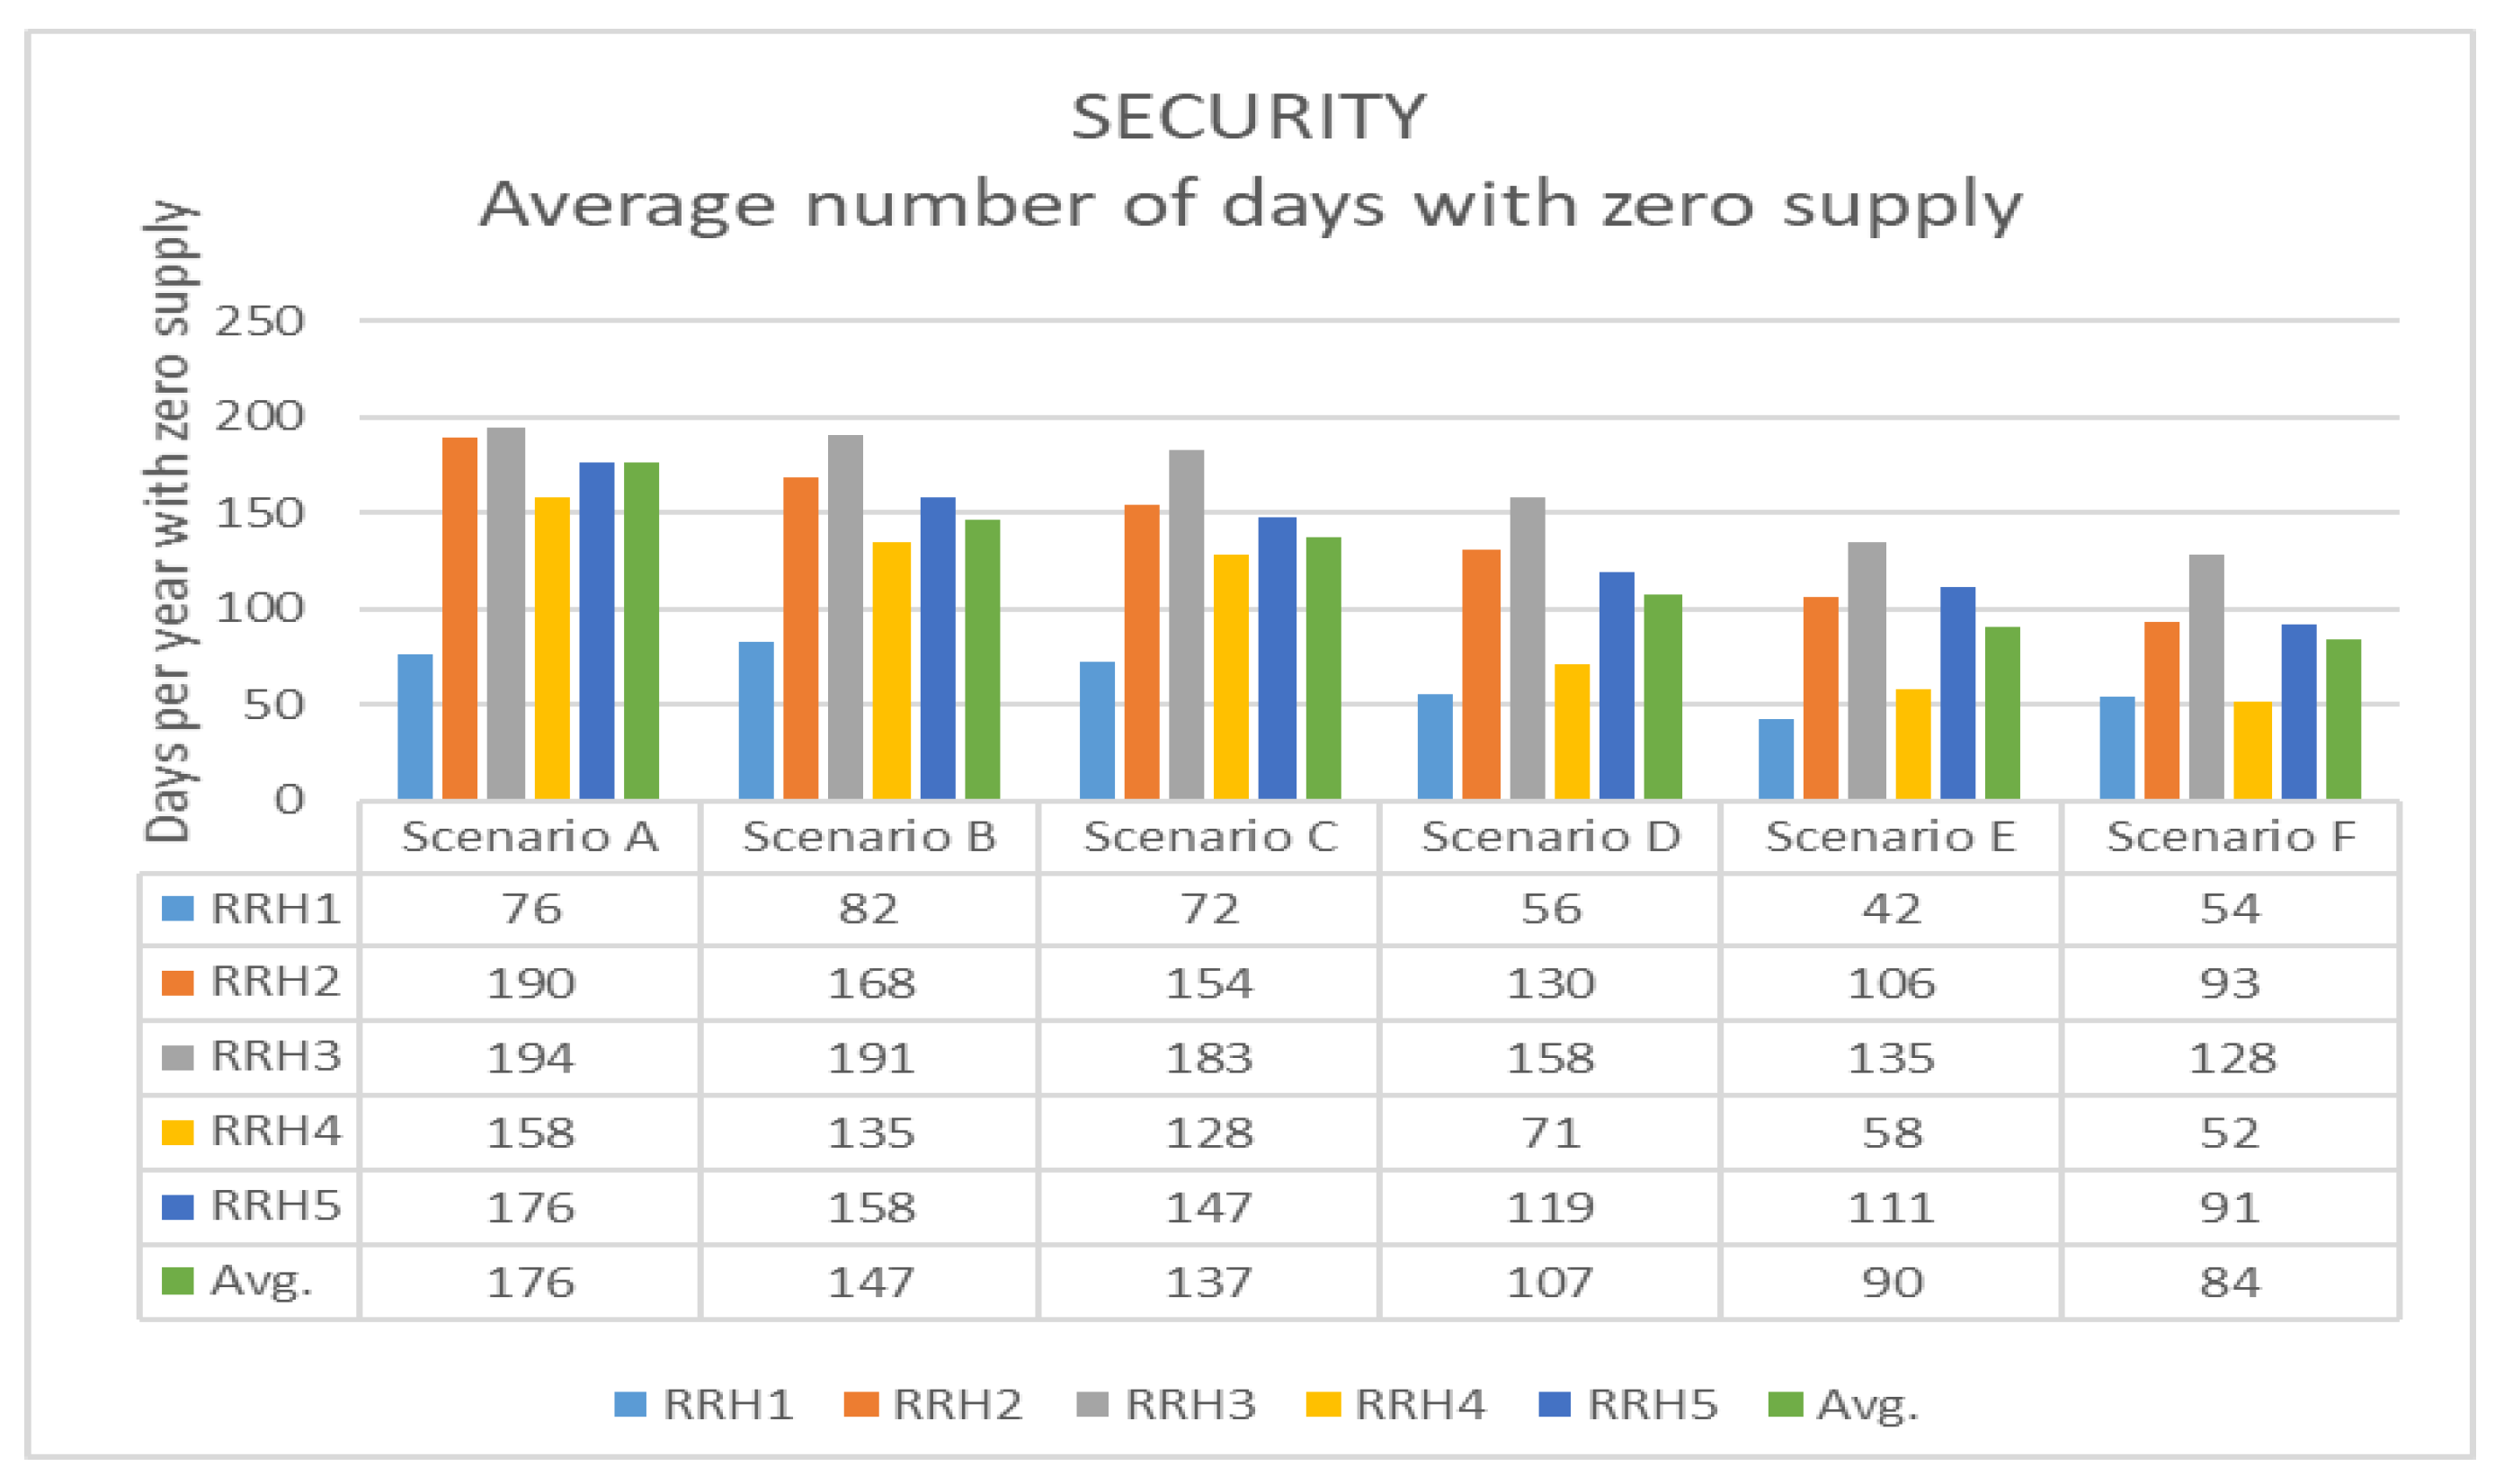
For this study, water security of the systems is defined in terms of the number of days with no rainwater supply. Figure 9 shows that because of its smaller roof catchment area and higher daily household water demand, Scenario A had the lowest security of supply, despite its high cost efficiency and relatively higher yield capacity, with an average of 176 days in a year with zero rainwater supply. However, Scenario F is less susceptible to failure days due to lower demand, where the average number of days with zero supply was 83.5 days. The modelling generally showed that the smaller roof runoff catchment areas decreased the reliability of the systems in terms of continuous year-round water supply.
4. Conclusions
Several RRH studies in the past have based their research on historical rainfall records to estimate water savings and economic efficiencies [33,34,35]. The findings from this study highlight the influence of intensity of rainfall events in determining the realistic efficiency of RRH systems. In summary, the study found that higher rainfall intensities did not necessarily lead to higher volumes of rainfall collection in the rainwater tanks due to limitations of the catchment configurations in the systems, such as limited gutter capacities. When rainfall intensities exceeded 5 mm/h, most cases showed a reduced (collected) runoff volume. Thus, a rainfall intensity upper limit may be beneficial in calculations and modelling based analyses where recorded rainfall values over a short time period are involved in order to avoid overestimating the volume of roof runoff. Further research to improve the estimation methods for roof catchment area predications is also recommended.
The modelling results showed that by maintaining the current RRH configurations (68% roof connectivity) and augmenting the end-uses to meet additional water demands in the household, the annual yield in the systems can be increased by 25% with a reduction in annualised cost of 28%, albeit with an increase in median tank size from 1500 L to 2000 L. Hence, an augmentation of the current end-uses (meeting only hot water demands) to additional uses such as toilet flushing, laundry and outdoor irrigation may significantly increase the yield in the systems. An increase in roof catchment area to 80% connectivity together with end-use augmentation to meet more household end-uses could further increase yield by 39.5% and decrease annualised costs by 37%. Similarly, an increase in roof catchment to 100% of the roof planar area together with end-use augmentation to meet additional household demands would increase the current yield by 46.4% and decrease costs by 42%. The results showed that although mains water supply is more economical than rainwater tank usage in Adelaide, the maximum benefit from rainwater tanks can be achieved not only by increasing roof area connectivity and tank sizes, but also by augmenting household demand to include additional fit-for-purpose end-uses. Greater consideration needs to be given to developing and testing different household RRH systems’ configurations aiming towards improve economic and environmental efficiency.
Over the years, studies have shown that although rainwater harvesting is one of the most promising alternative water sources, their economic viability is not always assured owing to variability in user habits, climactic regions and local regulations [36,37]. Nevertheless, the environmental benefits of domestic rainwater tanks are enormous. Existing RWH systems are commonly focussed on the objective of conserving water without considering other potential benefits associated with them [14]. RRH systems no only assist in reducing the dependence on main water supply but also contribute towards drought preparedness in urban environments that are susceptible to dry climatic conditions. RRH systems also eliminate the need for water treatment at the end-use level by adopting a fit-for-purpose approach to water use, where the need for high quality water is not necessary for low health risk end-uses such as toilet flushing and gardening [38]. Urban development has dramatically changed the course of stormwater runoff during rainfall events. Urban domestic rainwater tank systems significantly reduce the stormwater runoff into nearby waterways [39], thereby moderating stormwater runoff impacts such as erosion of creeks and pollution of waterways. Further research based on other RRH system scenarios (with combinations of different end-use demands, roof area connectivity and tank sizes) may be beneficial for optimizing their configurations in future applications. This study has attempted to contribute towards improving the lack of high quality datasets associated with the multiple objectives of RRH systems, including water saving, stormwater management, energy consumption and greenhouse gas emissions that were identified by Campisano et al. [14] as needing further improved modelling studies.
Supplementary Materials
The following are available online at https://www.mdpi.com/2073-4441/11/4/783/s1, Figure S1: Rainfall intensity vs. estimated catchment area and runoff volume, Figure S2: (a) Estimated catchment area vs. runoff volume (b) estimated catchment area vs. rainfall intensity, Figure S3: Output graphs example, Table S1: Scenario A results summary (Estimated effective roof catchment area vs. daily total water use in household), Table S2: Scenario B results summary (80% planar roof area vs. daily total water use in household), Table S3: Scenario C results summary (100% planar roof area vs. daily total water use in household), Table S4: Scenario D results summary (Effective roof catchment area vs. daily hot water use in household), Table S5: Scenario E results summary (80% planar roof area vs. daily hot water use in household), Table S6: Scenario F results summary (100% roof area vs. daily hot water use in household).
Author Contributions
Conceptualization, S.U. and D.P.; Methodology, S.U.; Software, S.U. and D.P.; Validation, S.U.; Formal Analysis, S.U.; Investigation, S.U.; Resources, S.U., S.B., D.P., D.W. and A.S.; Data Curation, D.W. and S.U.; Writing—Original Draft Preparation, S.U.; Writing—Review and Editing, S.U., A.S., S.B., D.P. and D.W.; Supervision, S.B., D.P., D.W. and A.S.; Project Administration, S.U.; Funding Acquisition, D.P., A.S. and S.B.
Funding
This research was funded by the Australian Government Research Training Program Scholarship (formerly the Australian Postgraduate Award (APA)) and the University of South Australia. Additional top-up funding was also provided by the Water for a Healthy Country Flagship (now Land and Water Flagship) (CSIRO) and the Goyder Institute for Water Research, Adelaide.
Acknowledgments
I want to express my gratitude to the admin staff and technical officers at UniSA for their assistance during this research. I am very grateful for the support and interest of all the participants at the Lochiel Park development who were never weary of my frequent visits to their backyards for equipment checks and data collection during the audits and monitoring period. This research project would not have been possible without them. I am also thankful to the CSIRO Land and Water department for the provision of additional monitoring equipment.
Conflicts of Interest
The authors declare no conflicts of interest.
References
- Umapathi, S.; Chong, M.N.; Sharma, A.K. Evaluation of plumbed rainwater tanks in households for sustainable water resource management: A real-time monitoring study. J. Clean. Prod. 2013, 42, 204–214. [Google Scholar] [CrossRef]
- Department of Environment Water and Natural Resources: Rainwater Tanks. Available online: https://www.sa.gov.au/topics/energy-and-environment/water/rainwater-tanks (accessed on 27 December 2018).
- Sharma, A.K.; Tjandraatmadja, G.; Cook, S.; Gardner, T. Decentralised systems–definition and drivers in the current context. Water Sci. Technol. 2013, 67, 2091–2101. [Google Scholar] [CrossRef] [PubMed]
- Sharma, A.; Cook, S.; Chong, M. Monitoring and validation of decentralised water and wastewater systems for increased uptake. Water Sci. Technol. 2013, 67, 2576–2581. [Google Scholar] [CrossRef] [PubMed]
- Cook, S.; Sharma, A.; Chong, M. Performance analysis of a communal residential rainwater system for potable supply: A case study in brisbane, australia. Water Resour. Manag. 2013, 27, 4865–4876. [Google Scholar] [CrossRef]
- Sa Water—Final Tanks Rolled out in Rebate Scheme. Available online: https://www.sawater.com.au/news/final-tanks-rolled-out-in-rebate-scheme (accessed on 16 July 2017).
- Land Management Corporation—Lochiel Park: Living with Nature. Available online: http://www.lochielpark.com.au/lochielpark/water.htm (accessed on 6 August 2013).
- Blaess, J.; Rix, S.; Bishop, A.; Donaldson, P. Lochiel park-a nation leading green village. In Proceedings of the State of Australian Cities Conference, Adelaide, Australia, 28–30 November 2007; pp. 28–30. [Google Scholar]
- Interim Water-Sensitive Urban Design Targets for Greater Adelaide. Available online: http://www.goyderinstitute.org/_r99/media/system/attrib/file/90/WSUD_Targets_Final_updated.pdf (accessed on 12 November 2018).
- Chao, P.R.; Umapathi, S.; Saman, W. Water consumption characteristics at a sustainable residential development with rainwater-sourced hot water supply. J. Clean. Prod. 2015, 109, 190–202. [Google Scholar] [CrossRef]
- ABCB. Building code of Australia. In Appendix A Additions: South Australia Additions; Australian Building Codes Board: Canberra, Australia, 2012. [Google Scholar]
- Water Sensitive Urban Design Technical Manual for the Greater Adelaide Region. Available online: http://www.lga.sa.gov.au/webdata/resources/project/Institutionalising_Water_Sensitive_Urban_Design_-_Technical_Manual-1.pdf (accessed on 12 January 2019).
- Google Maps Inc. Available online: https://www.google.com.au/maps (accessed on 12 May 2018).
- Campisano, A.; Butler, D.; Ward, S.; Burns, M.J.; Friedler, E.; DeBusk, K.; Fisher-Jeffes, L.N.; Ghisi, E.; Rahman, A.; Furumai, H. Urban rainwater harvesting systems: Research, implementation and future perspectives. Water Res. 2017, 115, 195–209. [Google Scholar] [CrossRef] [PubMed]
- Burns, M.J.; Fletcher, T.D.; Duncan, H.P.; Hatt, B.E.; Ladson, A.R.; Walsh, C.J. The performance of rainwater tanks for stormwater retention and water supply at the household scale: An empirical study. Hydrol. Process. 2015, 29, 152–160. [Google Scholar] [CrossRef]
- Rahman, A.; Keane, J.; Imteaz, M.A. Rainwater harvesting in greater sydney: Water savings, reliability and economic benefits. Resour. Conserv. Recycl. 2012, 61, 16–21. [Google Scholar] [CrossRef]
- Ward, S.; Memon, F.; Butler, D. Rainwater harvesting: Model-based design evaluation. Water Sci. Technol. 2010, 61, 85–96. [Google Scholar] [CrossRef]
- Youn, S.; Chung, E.; Kang, W.G.; Sung, J.H. Probabilistic estimation of the storage capacity of a rainwater harvesting system considering climate change. Resour. Conserv. Recycl. 2012, 65, 136–144. [Google Scholar] [CrossRef]
- Su, M.; Lin, C.; Chang, L.; Kang, J.; Lin, M. A probabilistic approach to rainwater harvesting systems design and evaluation. Resour. Conserv. Recycl. 2009, 53, 393–399. [Google Scholar] [CrossRef]
- Lopes, V.A.; Marques, G.F.; Dornelles, F.; Medellin-Azuara, J. Performance of rainwater harvesting systems under scenarios of non-potable water demand and roof area typologies using a stochastic approach. J. Clean. Prod. 2017, 148, 304–313. [Google Scholar] [CrossRef]
- Okoye, C.O.; Solyalı, O.; Akıntuğ, B. Optimal sizing of storage tanks in domestic rainwater harvesting systems: A linear programming approach. Resour. Conserv. Recycl. 2015, 104, 131–140. [Google Scholar] [CrossRef]
- Allen, M.D.; Argue, J.R.; Geiger, W.F.; Johnston, L.; Pezzaniti, D.; Scott, P. Water Sensitive Urban Design: Basic Procedures for Source Control of Stormwater—A Handbook for Australian Practice; University of South Australia: Adelaide, Australia, 2004. [Google Scholar]
- Allen, M.D.; Argue, J.R. Stormwater Management and Rainwater Use in Adelaide Households; Urban Water Resources Centre, University of South Australia: Adelaide, Australia, 1998. [Google Scholar]
- Mitchell, V.G. How important is the selection of computational analysis method to the accuracy of rainwater tank behaviour modelling? Hydrol. Process. 2007, 21, 2850–2861. [Google Scholar] [CrossRef]
- Mitchell, V.G.; Mein, R.G.; McMahon, T.A. Modelling the urban water cycle. Environ. Model. Softw. 2001, 16, 615–629. [Google Scholar] [CrossRef]
- Gurung, T.R.; Sharma, A. Communal rainwater tank systems design and economies of scale. J. Clean. Prod. 2014, 67, 26–36. [Google Scholar] [CrossRef]
- Swamee, P.K.; Sharma, A.K. Design of Water Supply Pipe Networks; John Wiley & Sons: Hoboken, NJ, USA, 2008. [Google Scholar]
- Newnan, D.G.; Eschenbach, T.; Lavelle, J.P. Engineering Economic Analysis; Oxford University Press: Oxford, UK, 2004; Volume 2. [Google Scholar]
- National Water Comission—The Cost-Effectiveness of Rainwater Tanks in Urban Australia. Available online: http://archive.nwc.gov.au/library/waterlines/1 (accessed on 5 June 2013).
- Hall, M.R. Review of Rainwater Tank Cost-Effectiveness in South East Queensland. Available online: http://www.urbanwateralliance.org.au/publications/UWSRA-tr105.pdf (accessed on 5 June 2018).
- Marchi, A.; Dandy, G.; Maier, H. Financial Costs, Energy Consumption and Greenhouse Gas Emissions for Major Supply Water Sources and Demand Management Options for Metropolitan Adelaide. Available online: http://www.goyderinstitute.org/_r111/media/system/attrib/file/102/EnergyCostsReport_Marchietal_Final_web.pdf (accessed on 14 December 2015).
- Office of Best Practice Regulation—Best Practice Regulation Handbook. Available online: https://www.pmc.gov.au/regulation/best-practice-regulation (accessed on 11 January 2011).
- Santos, C.; Taveira-Pinto, F. Analysis of different criteria to size rainwater storage tanks using detailed methods. Resour. Conserv. Recycl. 2013, 71, 1–6. [Google Scholar] [CrossRef]
- Hajani, E.; Rahman, A. Rainwater utilization from roof catchments in arid regions: A case study for Australia. J. Arid Environ. 2014, 111, 35–41. [Google Scholar] [CrossRef]
- Karim, M.R.; Bashar, M.Z.I.; Imteaz, M.A. Reliability and economic analysis of urban rainwater harvesting in a megacity in bangladesh. Resour. Conserv. Recycl. 2015, 104, 61–67. [Google Scholar] [CrossRef]
- Silva, C.M.; Sousa, V.; Carvalho, N.V. Evaluation of rainwater harvesting in portugal: Application to single-family residences. Resour. Conserv. Recycl. 2015, 94, 21–34. [Google Scholar] [CrossRef]
- Jing, X.; Zhang, S.; Zhang, J.; Wang, Y.; Wang, Y. Assessing efficiency and economic viability of rainwater harvesting systems for meeting non-potable water demands in four climatic zones of china. Resour. Conserv. Recycl. 2017, 126, 74–85. [Google Scholar] [CrossRef]
- Umapathi, S.; Butler, R.; Ferguson, M.; Pezzaniti, D. Monitoring of rainwater tank systems at households for rainwater usage. In Rainwater Tank Systems for Urban Water Supply; Design, Yield, Energy, Health Risks, Economics and Social Perceptions; Sharma, A., Begbie, D., Grardner, T., Eds.; International Water Association: London, UK, 2015. [Google Scholar]
- Cook, S.; Ashok, K.; Gardner, T. Rainwater harvesting systems for urban developments. In Rainwater Tank Systems for Urban Water Supply; Design, Yield, Energy, Health Risks, Economics and Social Perceptions; Sharma, A., Begbie, D., Grardner, T., Eds.; International Water Association: London, UK, 2015. [Google Scholar]
Figure 1.
Lochiel Park, South Australia, Australia (Source: Google Maps Inc. [13]).
Figure 1.
Lochiel Park, South Australia, Australia (Source: Google Maps Inc. [13]).

Figure 2.
Diagram of final water monitoring setup in a typical Lochiel Park residence installed specifically for this research.
Figure 2.
Diagram of final water monitoring setup in a typical Lochiel Park residence installed specifically for this research.

Figure 3.
Water level variation within RRH4 during rainfall events.

Figure 4.
Annualised cost as a function of tank size.

Figure 5.
Scenarios for RRHS modelling.

Figure 6.
Performance of tank RRH4 (a) Rainfall Intensity vs. estimated catchment area and runoff volume. (b) Estimated catchment area vs. runoff volume. (c) Estimated catchment area vs. rainfall intensity.
Figure 6.
Performance of tank RRH4 (a) Rainfall Intensity vs. estimated catchment area and runoff volume. (b) Estimated catchment area vs. runoff volume. (c) Estimated catchment area vs. rainfall intensity.

Figure 7.
Comparison of RRHS modelling results: Annual yield.

Figure 8.
Comparison of RRHS modelling results—Cost per kilolitre.

Figure 9.
Comparison of RRHS modelling results—Security of supply.


Table 1.
Roof runoff harvesting (RR system characteristics.
| System No. | Occupancy (p/hh) | Tank Size (L) | Planar Roof Area (m2) | Average Household Daily Water Demand (L/day) | Median Daily Household Water Demand (L/day) |
|---|---|---|---|---|---|
| RRH1 | 2 | 1500 | 151.7 | 98 | 103 |
| RRH2 | 2 | 1500 | 133.9 | 273 | 289 |
| RRH3 | 4 | 1500 | 177.5 | 554 | 566 |
| RRH4 | 2 | 2500 | 164.5 | 208 | 223 |
| RRH5 | 2 | 2000 | 184.8 | 340 | 343 |
Table 2.
Characteristics used to estimate effective roof catchment area.
| Characteristics | Source |
|---|---|
| R (daily rainfall data) | Bureau of Meteorology (BOM) |
| RI (rainfall intensity per event recorded in one-minute intervals over a 1-h period) | Monitored data |
| h1 (water level in tank before rainfall event) | Monitored data |
| h2 (water level in tank after rainfall event) | Monitored data |
| Δh (change in water level in tank) | Calculated |
| V (tank volume) | Tank audit |
| h (tank height) | Tank audit |
| A (aerial planar roof area or Indoor floor area of house) | Household audit |
Table 3.
Components and input assumptions for life cycle costing using the capital recovery method (all costs in Australian Dollars).
Table 3.
Components and input assumptions for life cycle costing using the capital recovery method (all costs in Australian Dollars).
| Tank Size | |||||||
|---|---|---|---|---|---|---|---|
| Component | Replacement Period (Life Cycle in Years) | 500 L | 1000 L | 2000 L | 3000 L | 4000 L | 5000 L |
| Cost in Australian Dollars | |||||||
| Rainwater tank | 25 | $600 | $800 | $1000 | $1500 | $1600 | $1800 |
| Pipework and labour | 50 | $200 | $200 | $250 | $250 | $300 | $300 |
| Plumbing to house | 50 | $900 | |||||
| Support structure | 50 | $100 | $150 | $200 | $250 | $300 | $350 |
| Pump and float diverters | 10 | $1000 | |||||
| Maintenance (per 5-year period) | 5 | $150 | $150 | $200 | $200 | $250 | $250 |
| Pump operation costs * | n/a | $0.36 per kL of water pumped (energy cost) | |||||
* Research on Adelaide’s water supply related energy use and greenhouse gas emissions reported that for a 2 kL rainwater tank storing and supplying 22 kL/year for indoor and outdoor uses, the operational cost was $0.36/kL for an operational energy intensity of 1.45 Wh/L [31].
Table 4.
Actual tank sizes and average water demand characteristics based on monitored data.
| System No. | Tank Size (L) | Daily Water Demand (L/day) | Hot Water Demand (L/day) | Rainwater Available (L/day) | Percentage of Water Demand to Be Met by RRH (%) | Percentage of Water Demand Actually Met by RRH (%) |
|---|---|---|---|---|---|---|
| RRH1 | 1500 | 103 | 53.3 | 36.5 | 51.7% | 35.4% |
| RRH2 | 1500 | 289 | 122.2 | 42.7 | 42.3% | 15.8% |
| RRH3 | 1500 | 566 | 233.6 | 75.4 | 41.3% | 13.3% |
| RRH4 | 2500 | 223 | 69.3 | 67.5 | 31.1% | 30.3% |
| RRH5 | 2000 | 343 | 159.4 | 132.7 | 46.5% | 39.7% |
Table 5.
Planar and estimated roof areas.
| System No. | Planar Roof Area (m2) | 80% of Planar Roof Area (m2) | Estimated Catchment Area (m2) | Percentage of Planar Roof Area (%) | ||
|---|---|---|---|---|---|---|
| Mean | Median | Based on Mean Values | Based on Median Values | |||
| RRH1 | 151.7 | 121.3 | 127.7 | 138.6 | 84% | 91% |
| RRH2 | 133.9 | 107.1 | 71.5 | 72.2 | 53% | 54% |
| RRH3 | 177.5 | 142 | 126.1 | 130.5 | 71% | 74% |
| RRH4 | 164.5 | 131.6 | 90.6 | 94.1 | 55% | 57% |
| RRH5 | 184.8 | 147.8 | 106.9 | 113.8 | 58% | 62% |
| Mean | 162.5 | 130.0 | 104.6 | 109.9 | 64% | 68% |
© 2019 by the authors. Licensee MDPI, Basel, Switzerland. This article is an open access article distributed under the terms and conditions of the Creative Commons Attribution (CC BY) license (http://creativecommons.org/licenses/by/4.0/).
Share and Cite
MDPI and ACS Style
Umapathi, S.; Pezzaniti, D.; Beecham, S.; Whaley, D.; Sharma, A. Sizing of Domestic Rainwater Harvesting Systems Using Economic Performance Indicators to Support Water Supply Systems. Water 2019, 11, 783. https://doi.org/10.3390/w11040783
AMA Style
Umapathi S, Pezzaniti D, Beecham S, Whaley D, Sharma A. Sizing of Domestic Rainwater Harvesting Systems Using Economic Performance Indicators to Support Water Supply Systems. Water. 2019; 11(4):783. https://doi.org/10.3390/w11040783
Chicago/Turabian StyleUmapathi, Shivanita, David Pezzaniti, Simon Beecham, David Whaley, and Ashok Sharma. 2019. "Sizing of Domestic Rainwater Harvesting Systems Using Economic Performance Indicators to Support Water Supply Systems" Water 11, no. 4: 783. https://doi.org/10.3390/w11040783
Note that from the first issue of 2016, this journal uses article numbers instead of page numbers. See further details here.