Removal Efficiency and Mechanism of Cr(VI) from Aqueous Solution by Maize Straw Biochars Derived at Different Pyrolysis Temperatures


1
School of Water Conservancy and Environment, University of Jinan, Jinan 250022, China
2
Shandong Provincial Engineering Technology Research Center for Ecological Carbon Sink and Capture Utilization, Jinan 250022, China
*
Author to whom correspondence should be addressed.
Water 2019, 11(4), 781; https://doi.org/10.3390/w11040781
Submission received: 14 February 2019
/
Revised: 9 April 2019
/
Accepted: 11 April 2019
/
Published: 15 April 2019
(This article belongs to the Special Issue Removal of Heavy Metals from Wastewater)
Abstract
:The removal efficiency and mechanism of Cr(VI) removal from aqueous solution on semi-decomposed maize straw biochars pyrolyzed at 300 to 600 °C were investigated. The removal of Cr(VI) by the biochars decreased with pyrolysis temperature increasing from 300 to 600 °C, and the maximum removal capacity of Cr(VI) for maize straw biochar pyrolyzed at 300 °C was 91 mg/g at pH 2.0. The percentage removal of Cr(VI) rapidly decreased with pH increasing from 2.0 to 8.0, with the maximum (>99.9%) at pH 2.0. The variation of Cr(VI) and Cr(III) concentrations in the solution after reaction showed that Cr(VI) concentration decreased while Cr(III) increased and the equilibrium was reached after 48 h, while the redox potential after reaction decreased due to Cr(VI) reduction. X-ray photoelectron spectroscopy (XPS) semi-quantitative analysis showed that Cr(III) accounted for 75.7% of the total Cr bound to maize straw biochar, which indicated reductive adsorption was responsible for Cr(VI) removal by the biochars. Cr(VI) was firstly adsorbed onto the positively charged biochar surface and reduced to Cr(III) by electrons provided by oxygen-containing functional groups (e.g., C=O), and subsequently part of the converted Cr(III) remained on the biochar surface and the rest released into solution. Fourier transform infrared (FTIR) data indicated the participation of C=O, Si–O, –CH2 and –CH3 groups in Cr(VI) removal by the biochars. This study showed that maize straw biochar pyrolyzed at 300 °C for 2 h was one low-cost and efficient adsorbent for Cr(VI) removal from aqueous solution.
1. Introduction
Hexavalent chromium (Cr(VI)) is identified as a priority hazardous pollutant that mainly discharges from metallurgy, metal processing, leather tannery, dyeing, electroplating, etc. [1]. Due to its highly toxic effect, it is essential to remove Cr(VI) from wastewater for the protection of environmental safety and public health [2]. For many decades, various methods (such as reduction, adsorption, precipitation, membrane separation) have been applied for Cr(VI) removal from wastewater. Among these methods, adsorption is considered as a low-cost and high-efficiency method that uses absorbents derived from solid waste [3].
Biochar is a carbon-rich, porous, and stable solid residue, which is usually prepared by direct thermal decomposition of biomass feedstock under an N2 environment below 900 °C [4]. Due to its properties (e.g., high specific surface area, porous, abundant functional groups), biochar has been widely used to remove heavy metals and organic contaminants in recent years [1,5,6,7]. Many biochars derived from different biomass (agriculture waste, sewage sludge, wood waste, etc.) have been used as absorbents for Cr(VI) removal from aqueous solution and were found to have favorable properties for applications [8,9]. However, various feedstock biochars showed huge differences in adsorption capacity, due to the differences in the properties of the biochars [10,11,12]. Dong et al. (2011) prepared sugar beet tailing biochar pyrolyzed at 300 °C and it was effective on Cr(VI) adsorption with maximum adsorption of 123 mg/g at pH 2.0 [13]. Mohan et al. (2011) reported oak bark biochar pyrolyzed at 400 to 450 °C with a maximum capacity of 7.5 mg/g [14]. The physical and chemical properties of biochar are not only dependent on feedstock, but also on pyrolysis temperature [11]. It is essential to reveal the relationship between biochar characteristics and pyrolysis temperature. Many studies have explored the effect of pyrolysis temperature on the physical, chemical, and functional properties of biochar as soil amendment, natural fertilizer, or environmental adsorbent. Zhang et al. (2017) reported the effect of feedstock characteristics and temperature on biochar properties (elemental composition, pH, electrical conductivity, functional groups, etc.) and established their relationships with biochar potential for soil amendments [12]. Chen et al. (2014) investigated systematically the effect of pyrolysis temperature on municipal sludge biochar properties (elemental composition, pH, functional groups, thermal stability, micro morphology, and surface characters, etc.) and heavy metal removal efficiency for biochars pyrolyzed at temperatures varying from 500 °C to 900 °C [15]. Shen et al. (2012) observed that Cr(VI) adsorption capacity decreased from 31.1 to 4.1 mg/g with the pyrolysis temperature increasing from 250 to 600 °C, meanwhile acidic functional groups decreased from 1.78 to 0.12 mmol/g [16]. Zhou et al. (2016) reported that surface carboxyl and hydroxyl groups were responsible for Cr(VI) removal, and the richer groups were obtained at lower pyrolysis temperatures (300 °C) [1]. Zhang et al. (2013) investigated the characteristics (element components, stability, surface area, pore size distribution, functional groups, etc.) of the municipal wastewater sludge biochar derived from different pyrolysis conditions for heavy metal adsorption [17]. However, very few studies have focused on establishing the relationship between adsorption characteristics of Cr(VI) and biochar properties at different pyrolysis temperatures [1]. Moreover, the mechanisms of Cr(VI) adsorption on biochar pyrolyzed at different pyrolysis temperatures should be further revealed.
Most biochars are prepared under an oxygen-free environment with nitrogen gas flow [2]. Compared with oxygen-free pyrolysis, the biochar yield, ash content, and functional groups can be affected by the presence of oxygen in the pyrolysis environment [11]. It has been reported that pyrolysis under a weakly oxidizing atmosphere might produce more oxygen-containing functional groups (OFGs) [12]. However, the effects of oxygen-limited pyrolysis on the formation of functional groups and the performance of Cr(VI) by biochar have not been intensively studied [1]. Thus, pyrolysis under an anoxic environment (oxygen-limited) without additional nitrogen gas flow was tested in this study.
Maize straw was used to prepare biochars using a muffle furnace at 300, 400, 500, and 600 °C in an anoxic environment, and their properties were characterized. The objectives of this study were (i) to systematically investigate the effect of the pyrolysis temperature on the physio-chemical properties of maize straw biochars, and the relationship between the pyrolysis temperature and Cr(VI) removal efficiency, (ii) to investigate the adsorption characteristics of Cr(VI) by maize straw biochars, and (iii) to reveal the mechanisms of Cr(VI) removal by maize straw biochars.
2. Materials and Methods
2.1. Maize Straw Biochar Preparation
Maize straw samples were semi-decomposed in the field on a farm in Shandong province, China. The samples were air-dried at room temperature and ground to pass through a 1 mm sieve. The crushed samples were pyrolyzed at 300, 400, 500, and 600 °C for 2 h in an anoxic environment using a muffle furnace, and then left to cool in an anoxic environment. After cooling, the biochars were washed with deionized water, and then dried in an air drying oven overnight at 105 °C. According to the respective pyrolysis temperature, the dried maize straw biochars (MSB) were named as MSB300, MSB400, MSB500, and MSB600, respectively.
2.2. Physical and Chemical Characterization
The elemental composition (C, H, N, S, and O) of the biochars was determined using an elemental analyzer (Vario MACRO cube, Elementar, Langenselbold, Hesse, Germany). The pH, redox potential, and electrical conductivity (EC) of the biochars were measured with a pH meter (Leici PHS-3C, Shanghai, China), a redox potential composite electrode (Leici 501, China), and a conductivity meter (Leici DDS 307, China) using a biochar-to-water ratio of 1:20 after mixing for 24 h (GB/T 12496.7-1999) (http://www.gb688.cn/bzgk/gb/index), and the measurement temperature was 18 to 20 °C. The point of zero charge of each biochar pH (pHpzc) was determined according to Mahmood et al. (2011) [18] and Karunanayake et al. (2018) [19]. The ash content was determined using a standard test method for chemical analysis of a wood charcoal method (ASTM D1762-84) (https://www.astm.org/Standards/D1762.htm). To compare the surface morphology of MSB pyrolyzed at different temperatures, MSB300 and MSB500 were examined using a scanning electron microscope (SEM, Hitachi SU8010, Tokyo, Japan and Quanta FEG 250, Hillsboro, OR, USA). Specific surface area and pore parameters were measured via nitrogen adsorption using an ASAP 2020 surface area and porosity analyzer (Micromeritics, Norcross, GA, USA). The surface functional groups of the biochars were investigated by a Nicolet 380 FTIR spectrometer (Thermo Scientific, Waltham, MA, USA).
2.3. Batch Removal Experiments
2.3.1. Effect of Pyrolysis Temperature on Cr(VI) Removal
A stock solution (Cr(VI) or Cr(III) 1000 mg/L) was prepared by dissolving K2Cr2O7 or Cr(NO3)3·9H2O (analytical reagent grade) in deionized water. All solutions for the following adsorption experiments were prepared by diluting the stock solution with deionized water. In order to investigate Cr(VI) removal efficiency by the biochars from different pyrolytic temperatures (300, 400, 500, and 600 °C), 0.1 g biochar sample and 25 mL Cr(VI) solution (100, 200, and 400 mg/L) were mixed in plastic bottles at room temperature at pH 2.0 for 48 h.
2.3.2. Adsorption Isotherm and Capacity
Biochar sample weighing 0.1 g and 25 mL Cr(VI) solution with different concentrations were mixed in plastic bottles at room temperature at pH 2.0 for 48 h. Then, the mixtures were filtered through 0.45 μm filter paper for Cr(VI) concentration analysis. The amounts of the adsorbed Cr(VI) were calculated from the difference between the initial and equilibrium concentrations in the filtrates.
2.3.3. Effect of pH, Temperature, and Co-Existing Anions
Based on the observed effects of the pyrolytic temperature on Cr(VI) removal, MSB300, with the highest removal efficiency of Cr(VI), was selected for another series of experiments. To reveal the effect of pH on Cr (VI) removal, 0.1 g MSB300 and 25 mL Cr(VI) solution (25 mg/L) were mixed for 48 h. The solution pH was adjusted between 2.0 and 8.0 with NaOH or HNO3 solution, meanwhile, the effect of Cr(III) removal was studied (0.1 g of MSB300 and 25 mL of Cr(III) solution (25 mg/L) mixed for 48 h). In order to study the effect of temperature, 0.1 g of sample and 25 mL of Cr(VI) solution (100 mg/L) were mixed and placed at different temperatures (5, 10, 20, and 40 °C) at pH 2.0, respectively. Considering wastewaters from tannery, dyeing, or electroplating with high salinity, the effect of high salinity on Cr(VI) removal was also investigated: 0.1 g of biochar and 25 mL of solution of 100 mg/L Cr(VI) containing Na2SO4 (5 mM (0.7 g/L), 35mM (5 g/L), and 70 mM (10 g/L) Na2SO4) were mixed at pH 2.0, respectively.
2.3.4. Kinetics of Cr(VI) Removal
For the kinetic experiments of Cr(VI) removal by MSB300, a mass of 2 g sample was added into 500 mL Cr(VI) solutions (25 mg/L and 50 mg/L). The solution pH was adjusted to 2.0 with HNO3 solution. Samples were withdrawn at defined intervals of time for the concentration analysis of Cr(VI) and total Cr.
The initial and equilibrium Cr(VI) concentrations were determined by a UV–vis spectrophotometer (UV-2550, Shimadzu, Kyoto, Japan) at 540 nm using the standard colorimetric method with 1, 5-diphenylcarbazide (GB 7467-87, China) (http://www.gb688.cn/bzgk/gb/index). The detection limit of Cr(VI) was 0.004 mg/L. The concentration of total Cr was determined by atomic absorption spectroscopy (AAS) (AA-7000 model spectrometer, Shimadzu, Kyoto, Japan). The concentration of Cr(III) was calculated from the difference between total Cr and Cr(VI) [1,7,14,15].
2.4. Removal Mechanism
The surface micromorphology and elemental composition of the MSB300 before and after Cr(VI) removal were characterized by SEM coupled with Energy dispersive X-ray (EDX). FTIR spectra were recorded to analyze the difference in functional groups on the surfaces of MSB before and after Cr(VI) removal, in order to reveal the functional groups involved in Cr(VI) removal. The mass balance was calculated to determine the Cr(III) and Cr(VI) fraction in the solution after reaction, and the valence state of the Cr bound to the biochars were determined by XPS analysis to reveal the conversion of Cr(VI) and Cr(III) during the reaction.
3. Results and Discussion
3.1. Effect of Pyrolysis Temperature on Biochar Characterization
The physicochemical properties of the biochars derived at different pyrolysis temperatures are shown in Table 1. The produced biochars had high ash contents (50.5–67.9%) and low relative carbon contents (24.14–26.44%) probably because maize straw samples were semi-decomposed in one farm field. When the temperature was increased from 300 to 600 °C, the relative carbon content of MSB increased from 24.14% to 26.44%, while the content of hydrogen, oxygen, and nitrogen decreased, indicating the increasing pyrolysis temperature resulted in accelerated carbonization, deoxygenation, and dehydrogenation reactions during the pyrolysis process [1]. Atomic ratios were calculated to evaluate the aromaticity and polarity of the biochars [10]. A significant decrease in the atomic ratios of H/C, O/C, and (O + N)/C with an increasing pyrolysis temperature was observed, indicating pronounced aromaticity and decreased polarity at higher temperatures. When the pyrolysis temperature was increased from 300 to 600 °C, the atomic ratios of H/C, O/C, and (O + N)/C for MSB decreased from 1.12, 0.81, and 0.65 to 0.31, 0.37, and 0.27, respectively. The atomic O/C ratio of the MSB was higher than that of activated carbon and the biochars derived from some other feedstocks [1,15,20]. This result indicated that MSB had more OFGs and higher polarity than some commercial activated carbon and biochars [15,20]. Among the biochar samples, the highest atomic H/C, O/C, and (O + N)/C ratios were found at 300 °C, suggesting that partially carbonized MSB300 contained more organic material and polar functional groups than others [1]. The ash content significantly increased when the pyrolysis temperatures was increased from 300 °C to 600 °C, mainly due to the minerals forming ash, which remained after biochar carbonization.
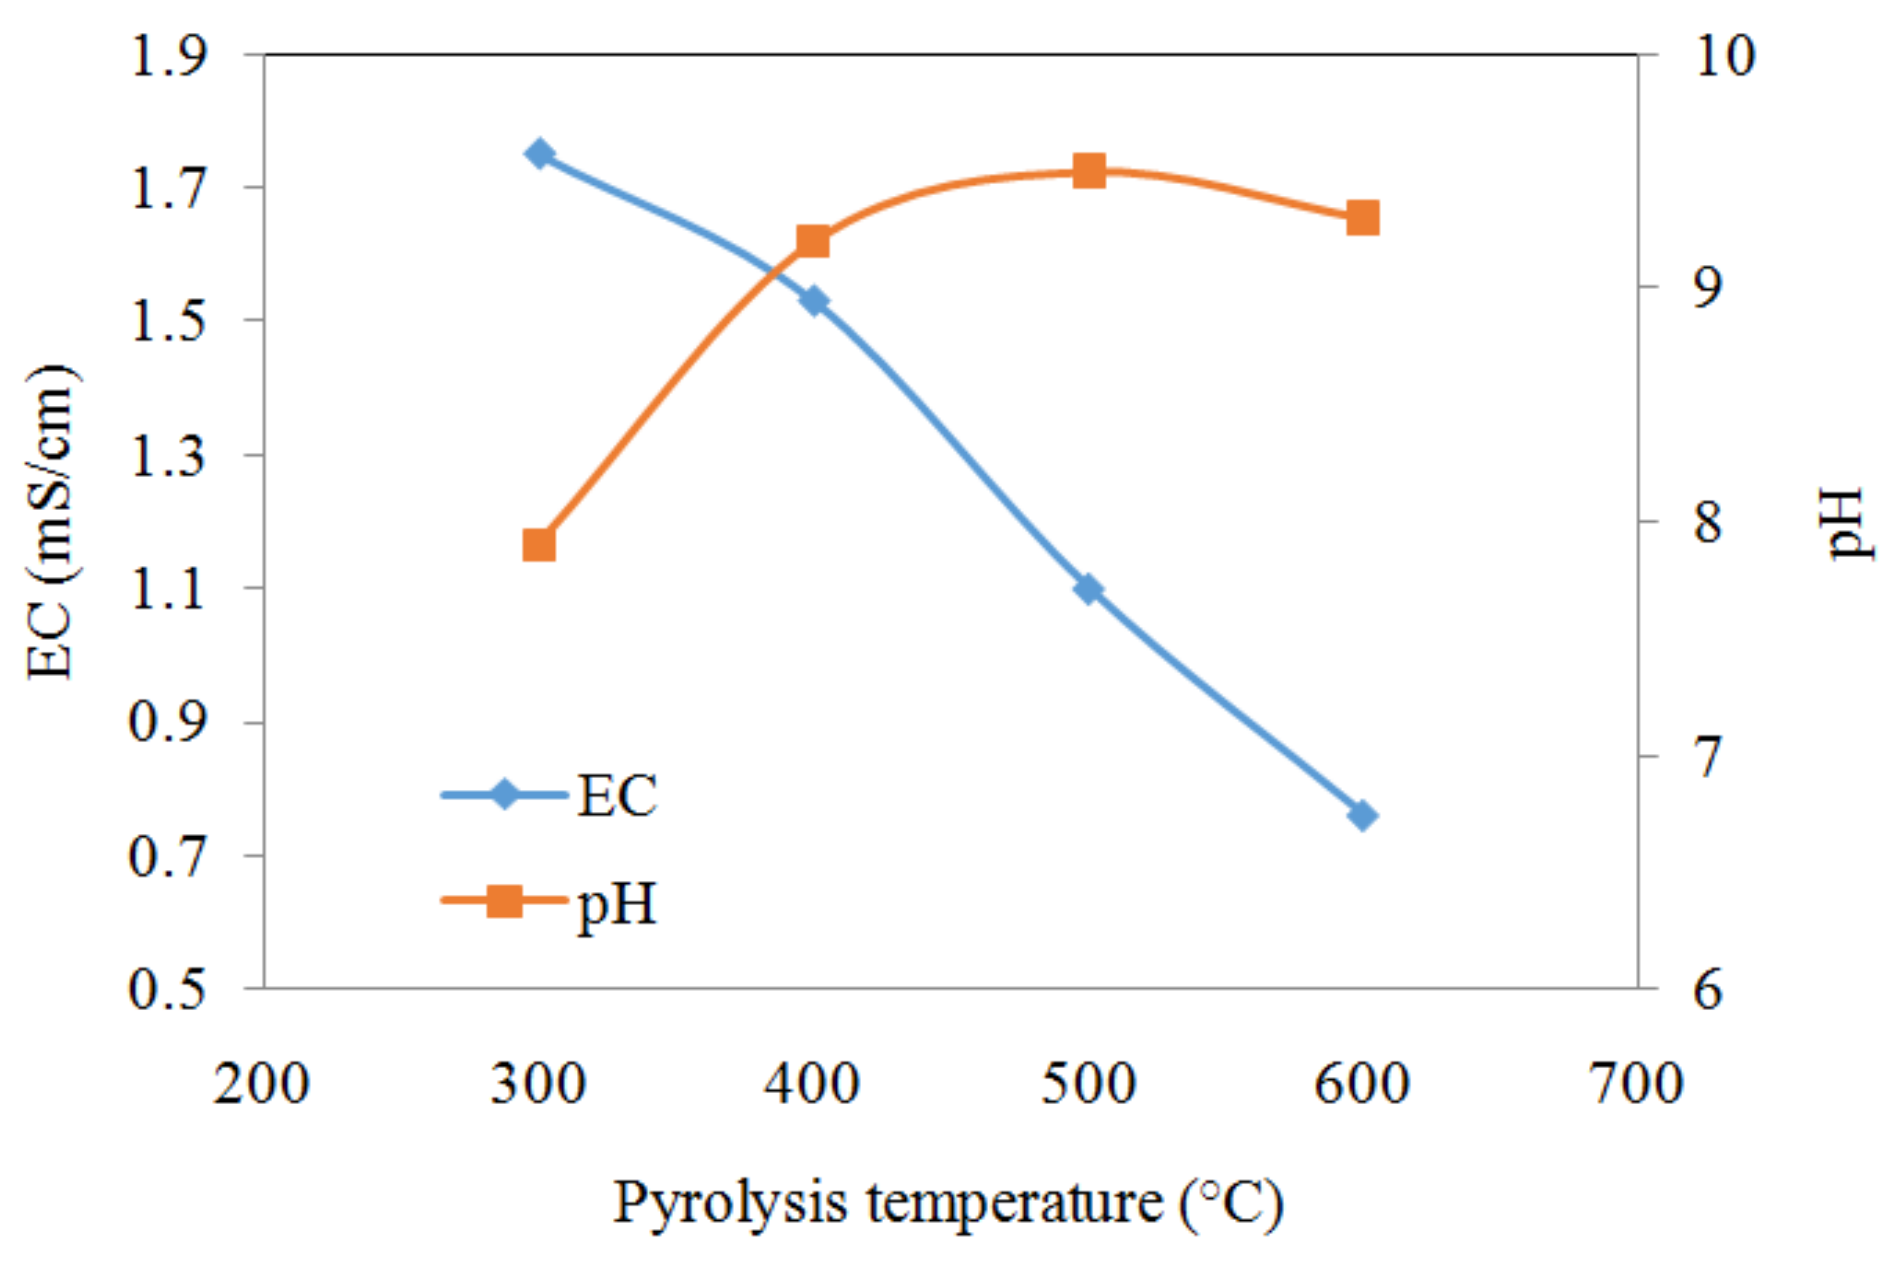
The EC decreased from 1.75 mS/cm to 0.76 mS/cm when the pyrolysis temperature increased from 300 °C to 600 °C presumably due to the decrease of soluble ions and more mineral formation (Figure 1). The pH of the biochar suspensions increased from 7.4 to 10.1 when the pyrolysis temperature was increased from 300 °C to 600 °C, because increasing pyrolysis temperature can promote the formation of biochar containing alkaline minerals and produce lower amounts of acidic functional groups (e.g., carboxylic groups) as evidenced by FTIR spectra (Figure 2) [21].
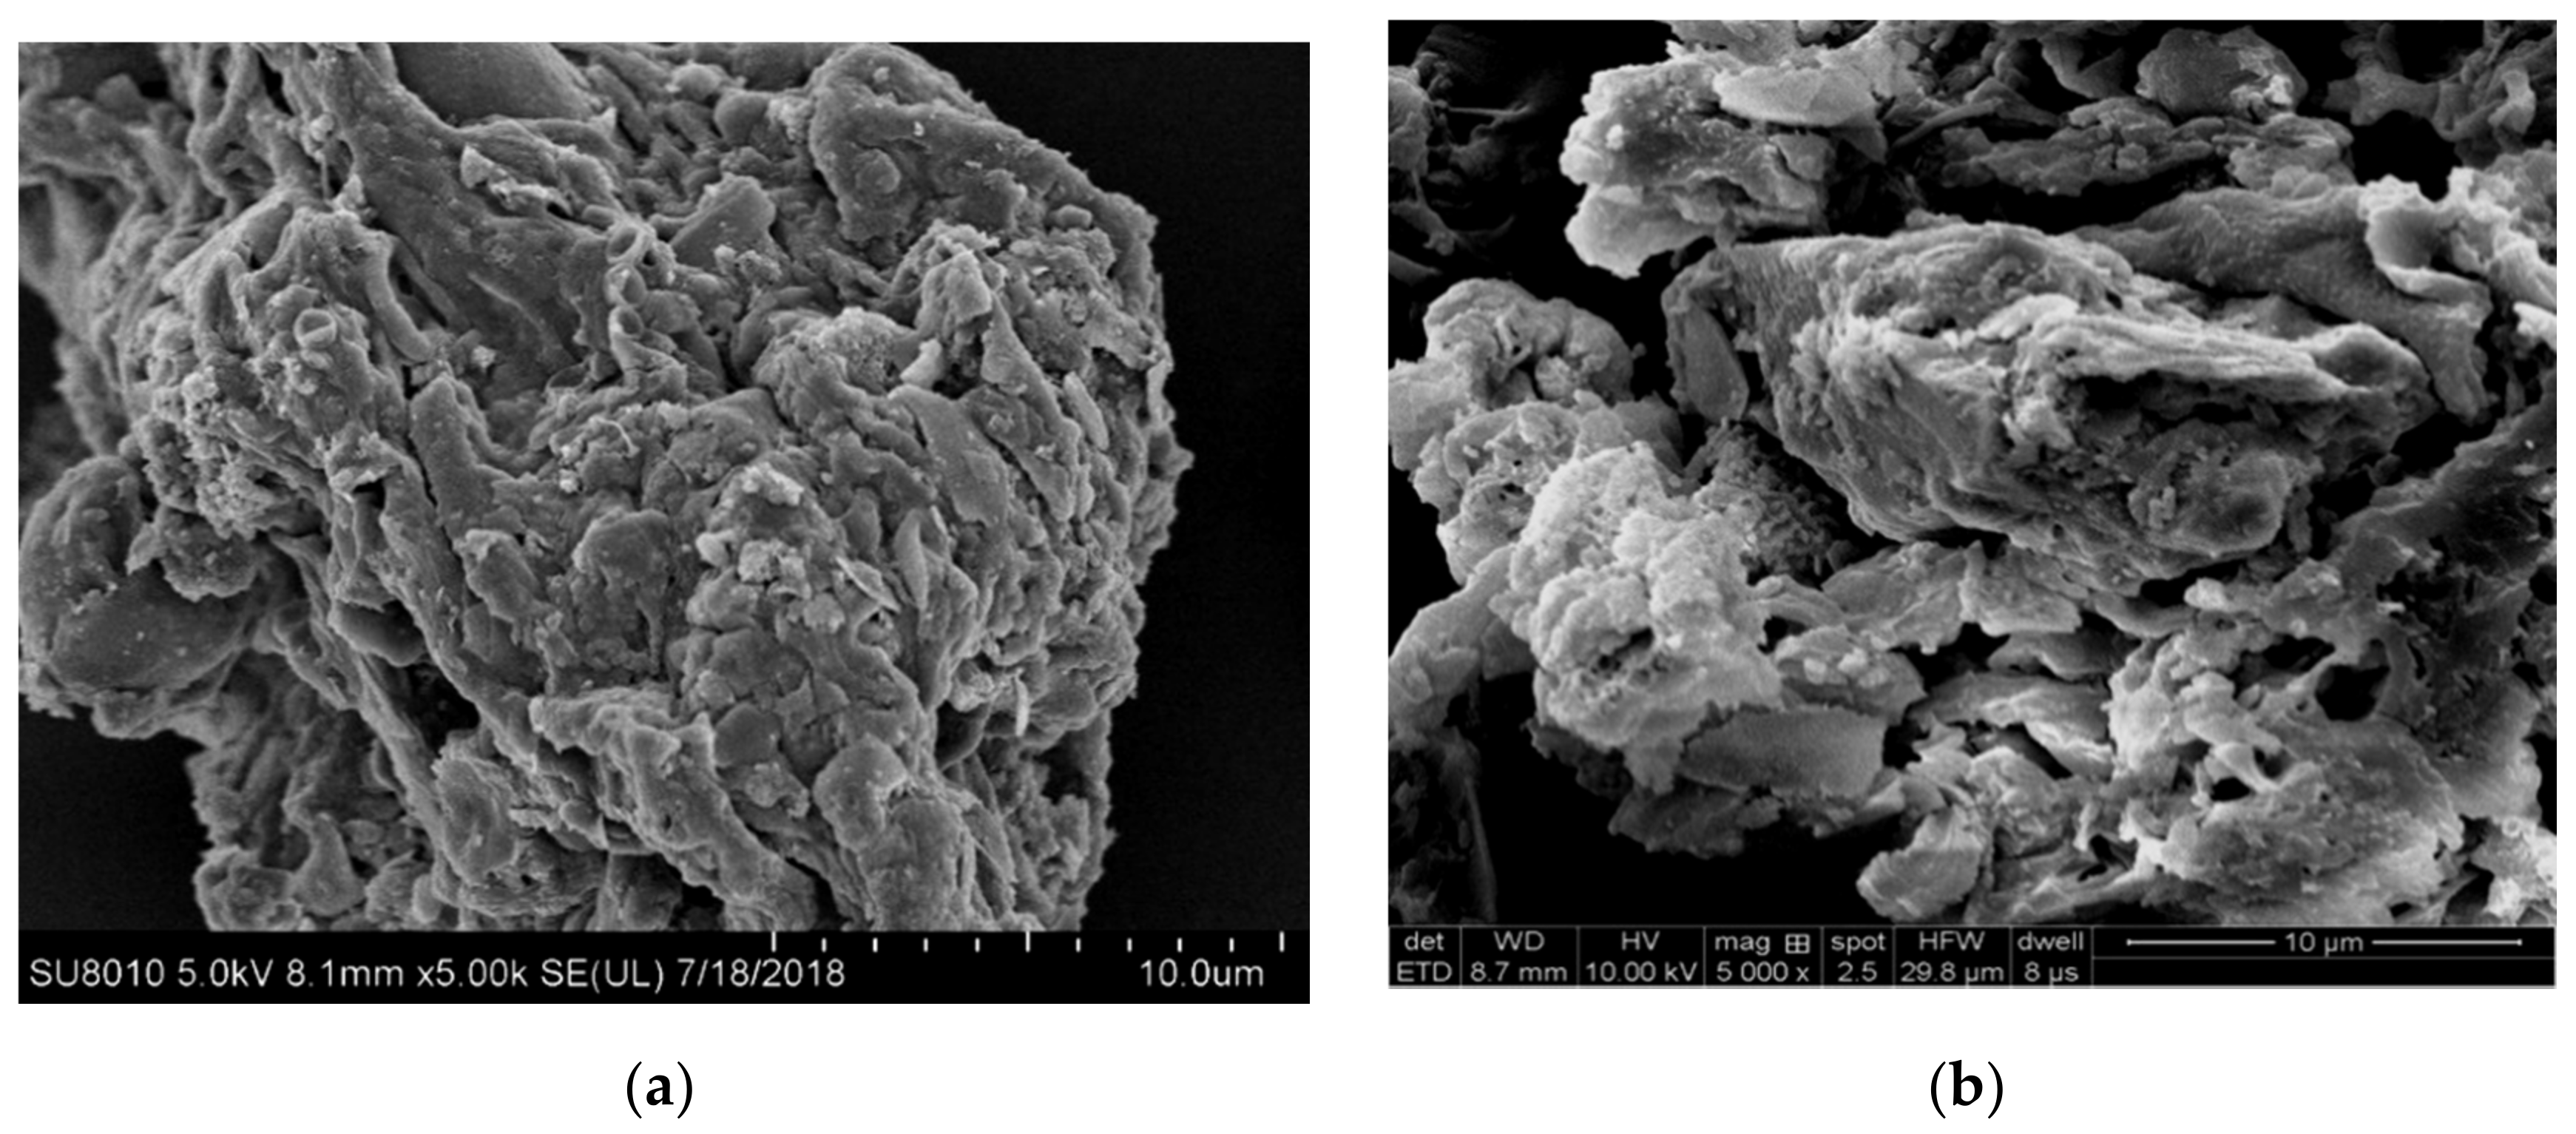
As shown in Figure 2a,b, the micromorphological structure of biochars was strongly affected by the pyrolysis temperature. MSB300 appeared as a rough and compact surface containing very few pores, while MSB500 appeared as a loose and porous structure. The specific surface area and pore volume of the biochars pyrolyzed at high temperatures were accordingly relatively large (Table 1). With the pyrolysis temperature increasing from 300 to 600 °C, the specific surface area increased from 10.3 m2/g to 31.1 m2/g, and the pore volume increased from 0.034 cm3/g to 0.062 cm3/g. The increase in specific surface area is mainly due to the destruction of organic functional groups and the formation of micro-pores in the biochars at high temperature pyrolysis.
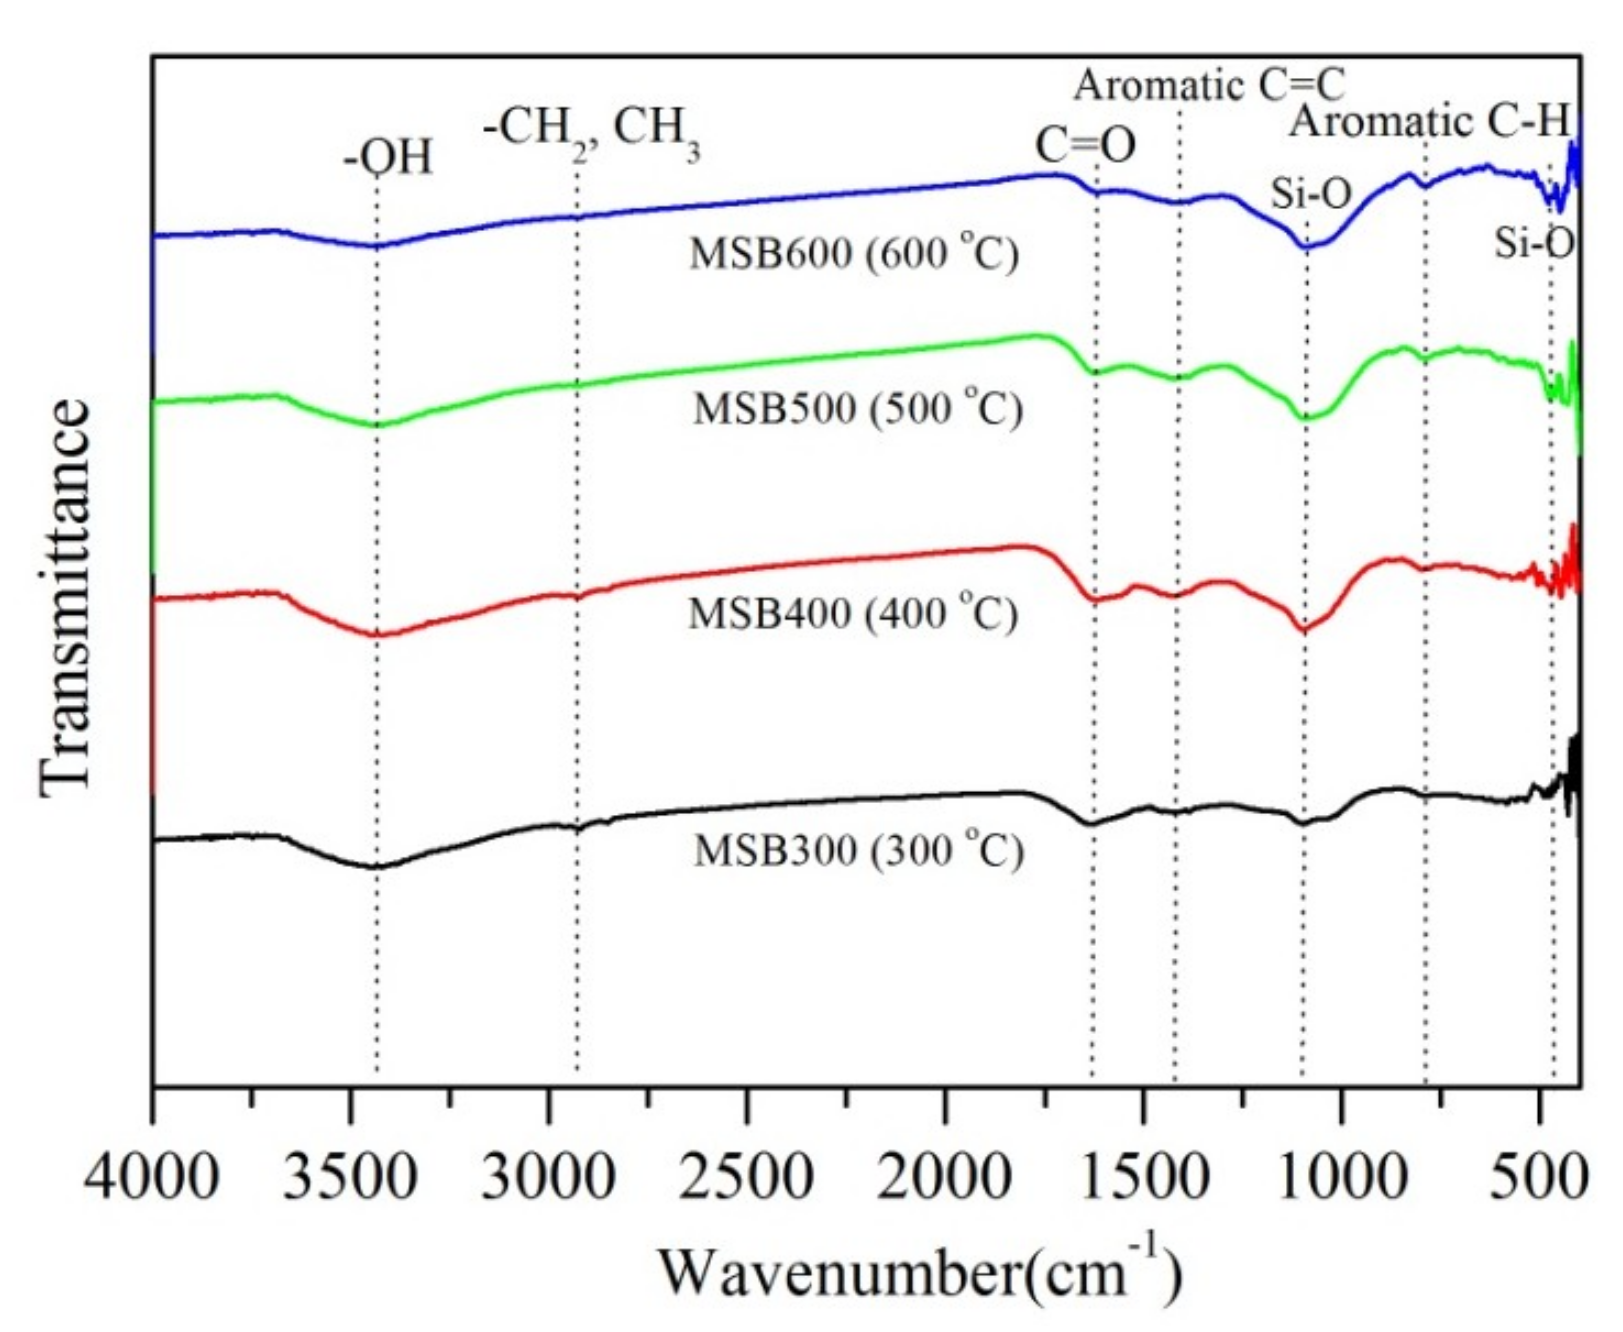
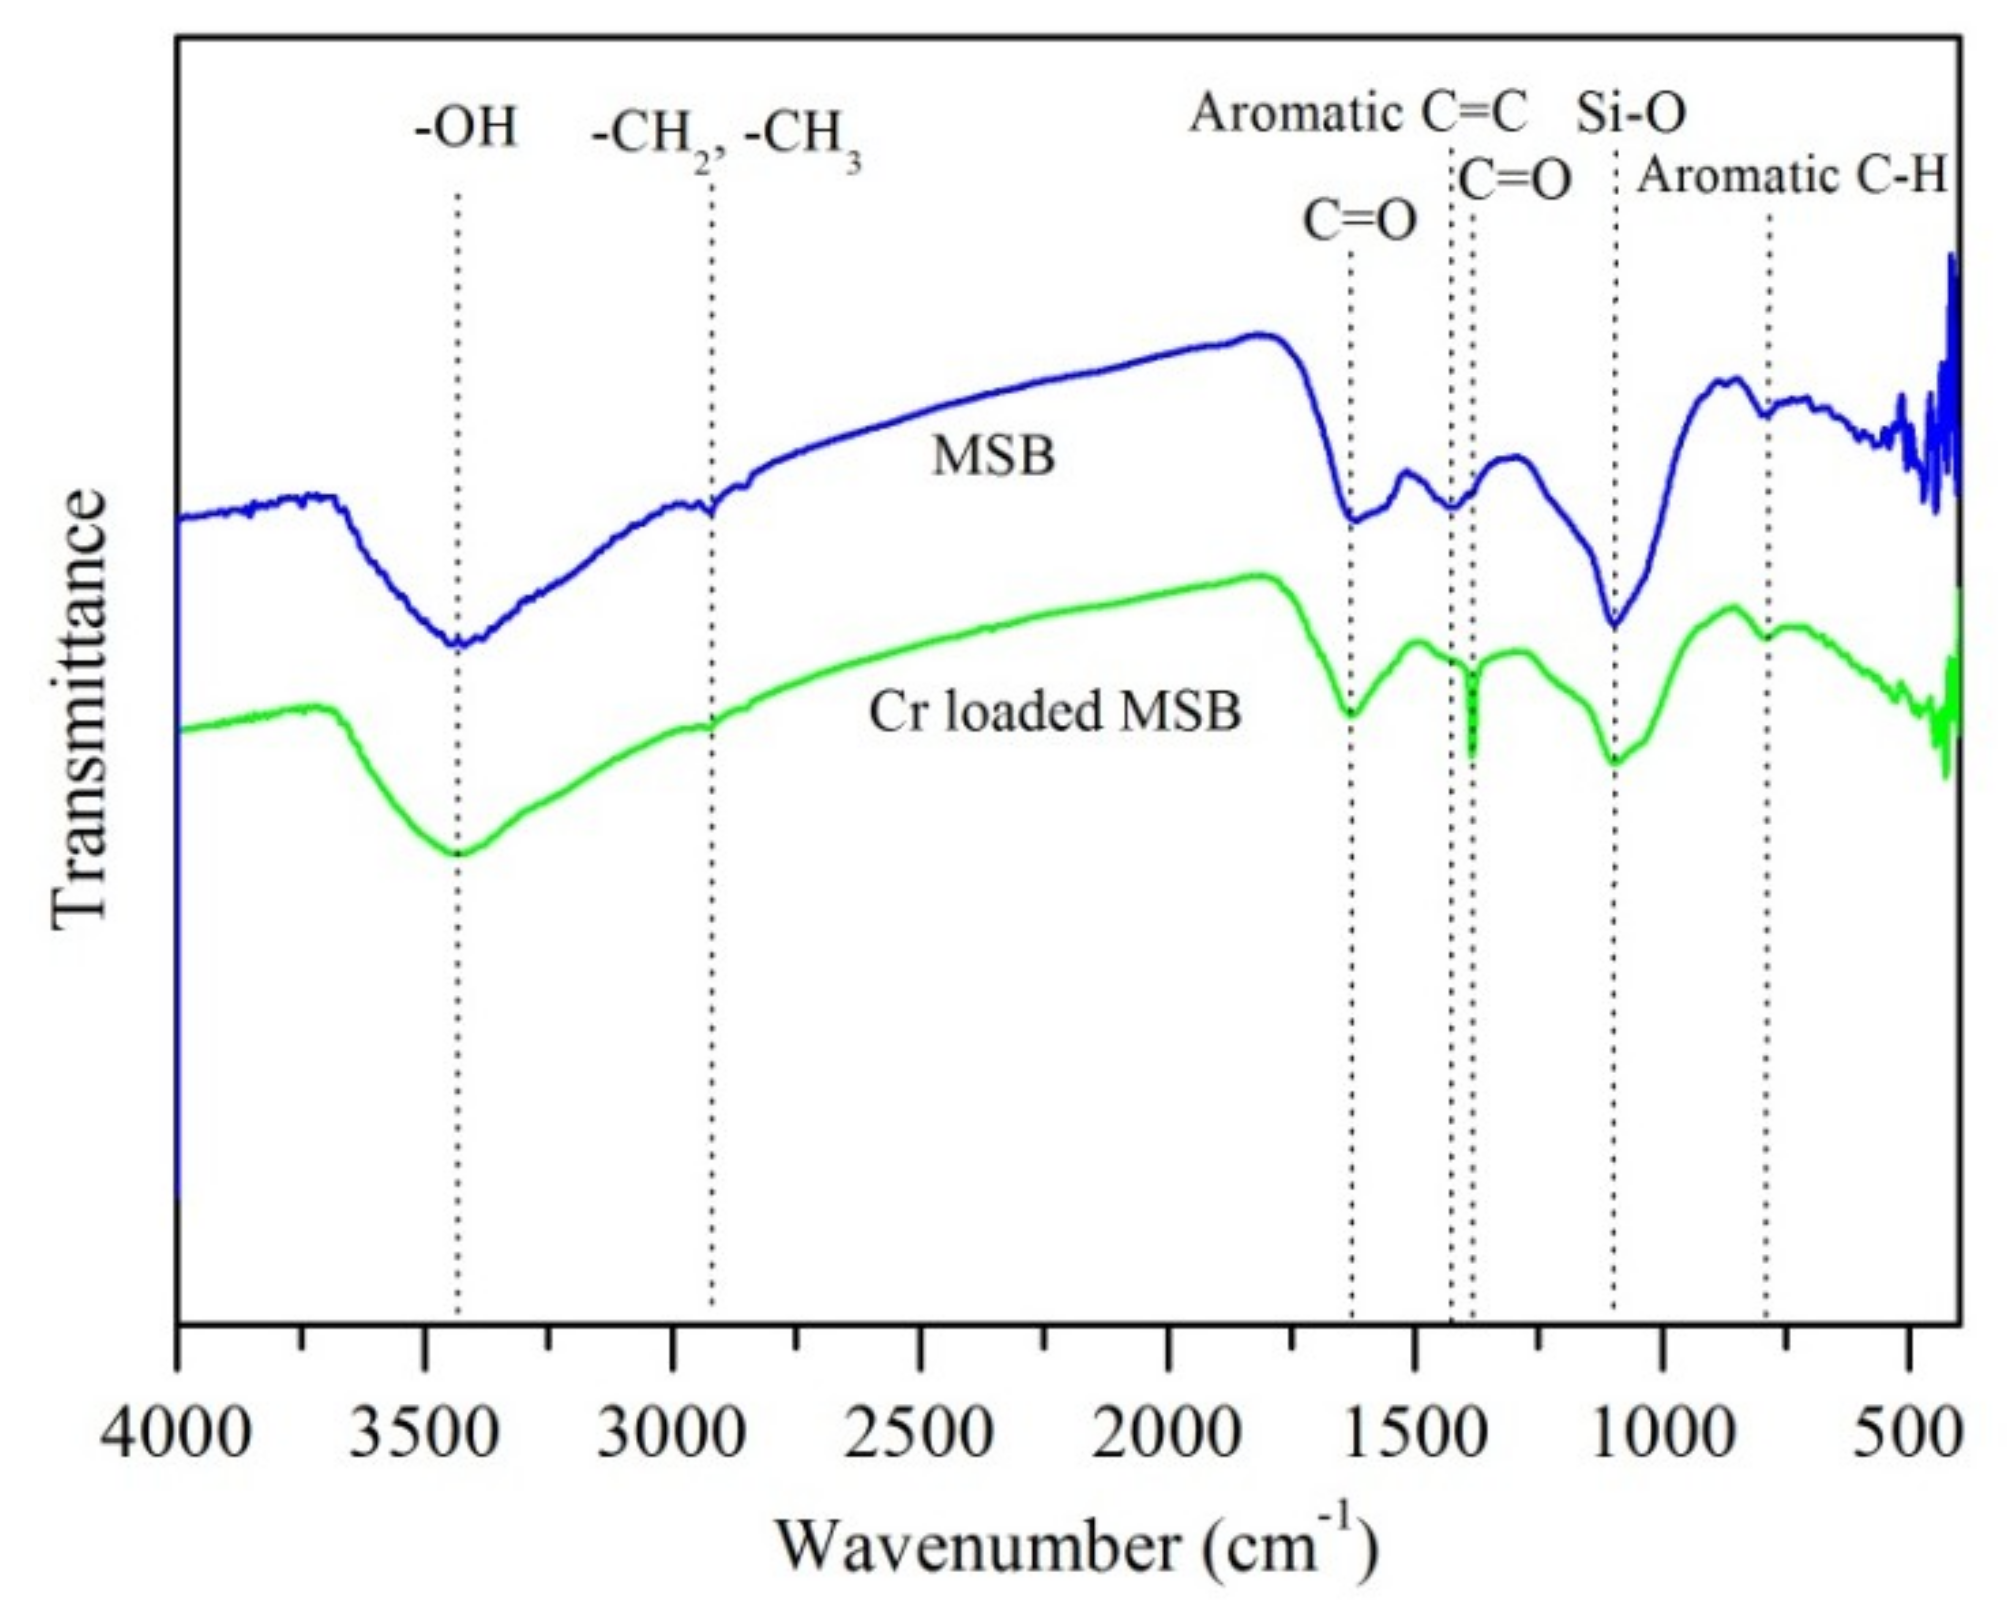
The FTIR spectra in the range of 400 to 4000 cm−1 of the biochars are shown in Figure 3. The broad band around 3421 cm−1 corresponds to the –OH vibration or H2O. The bands around 2923 cm−1 were assigned to the −CH2 and –CH3 group’s long-chain aliphatic components [13,14,15,16,17]. The characteristic band at 1620 cm−1 was mainly related to C=O stretching vibrations in ketones, anhydrides, esters, and carboxylic acid groups. These bands decreased or disappeared with increasing pyrolysis temperature, suggesting a decrease of the biochar surface polarity and that the dehydrogenation reaction strengthened at high pyrolysis temperatures [16,22]. Meanwhile, high pyrolysis temperatures promoted the formation of the aromatic structure, which was evidenced by the intensified bands at around 781 cm−1 (aromatic compounds) and 1480 cm−1 (aromatic C=C structure) for MSB. Thus, the pyrolysis temperature significantly affected the surface functional groups, resulting in a decrease OFGs and the formation of an aromatic structure, which would impact Cr(VI) removal [1].
3.2. Comparison of Cr(VI) Removal by the Biochars from Different Pyrolysis Temperatures
As shown in Figure 4, the removal efficiency of Cr(VI) by MSB300 was 99.5%, 94.4%, and 74.5% for the initial Cr(VI) concentration of 100 mg/L, 200 mg/L, and 400 mg/L, respectively. The biochars derived from lower pyrolytic temperatures exhibited a higher removal efficiency of Cr(VI) in the order of MSB300 > MSB400 > MSB500 > MSB600. The difference became more significant when the Cr(VI) concentration was increased from 100 to 400 mg/L.
One-way ANOVA analysis showed that the removal efficiency of 400 mg/L Cr(VI) by MSB300 was significantly higher than those of MSB400, MSB500, and MSB600 (p < 0.05). At the initial concentration of 400 mg/L, the removal efficiency of Cr(VI) was 74.5%, 62.5%, 32.5%, and 12.9% for MSB300, MSB400, MSB500, and MSB600, respectively. Thus, MSB300 had a higher capacity for Cr(VI) removal by the biochars. However, the specific surface area and pore volume of MSB increased from 10.3 to 31.1 m2/g, 0.034 to 0.062 cm3/g with the pyrolytic temperature increasing from 300 to 600 °C, respectively (Table 1), indicating the removal efficiency not only depended on the specific surface area or pore volume. The order of Cr(VI) maximum removal (mmol/g, from Table 2, calculated by the Langmuir isotherm model in Section 3.4) per surface area was MSB300 (0.17 mmol/m2) > MSB300 (0.07 mmol/m2) > MSB300 (0.03 mmol/m2) > MSB300 (0.02 mmol/m2). Among these biochars, MSB300 had the highest H/C and O/C ratios and considerable quantities of polar functional groups as shown by FTIR spectra analyses, suggesting that Cr(VI) removal efficiency may have been mainly influenced by surface functional groups.
3.3. The Effect of pH on Cr(VI) Removal
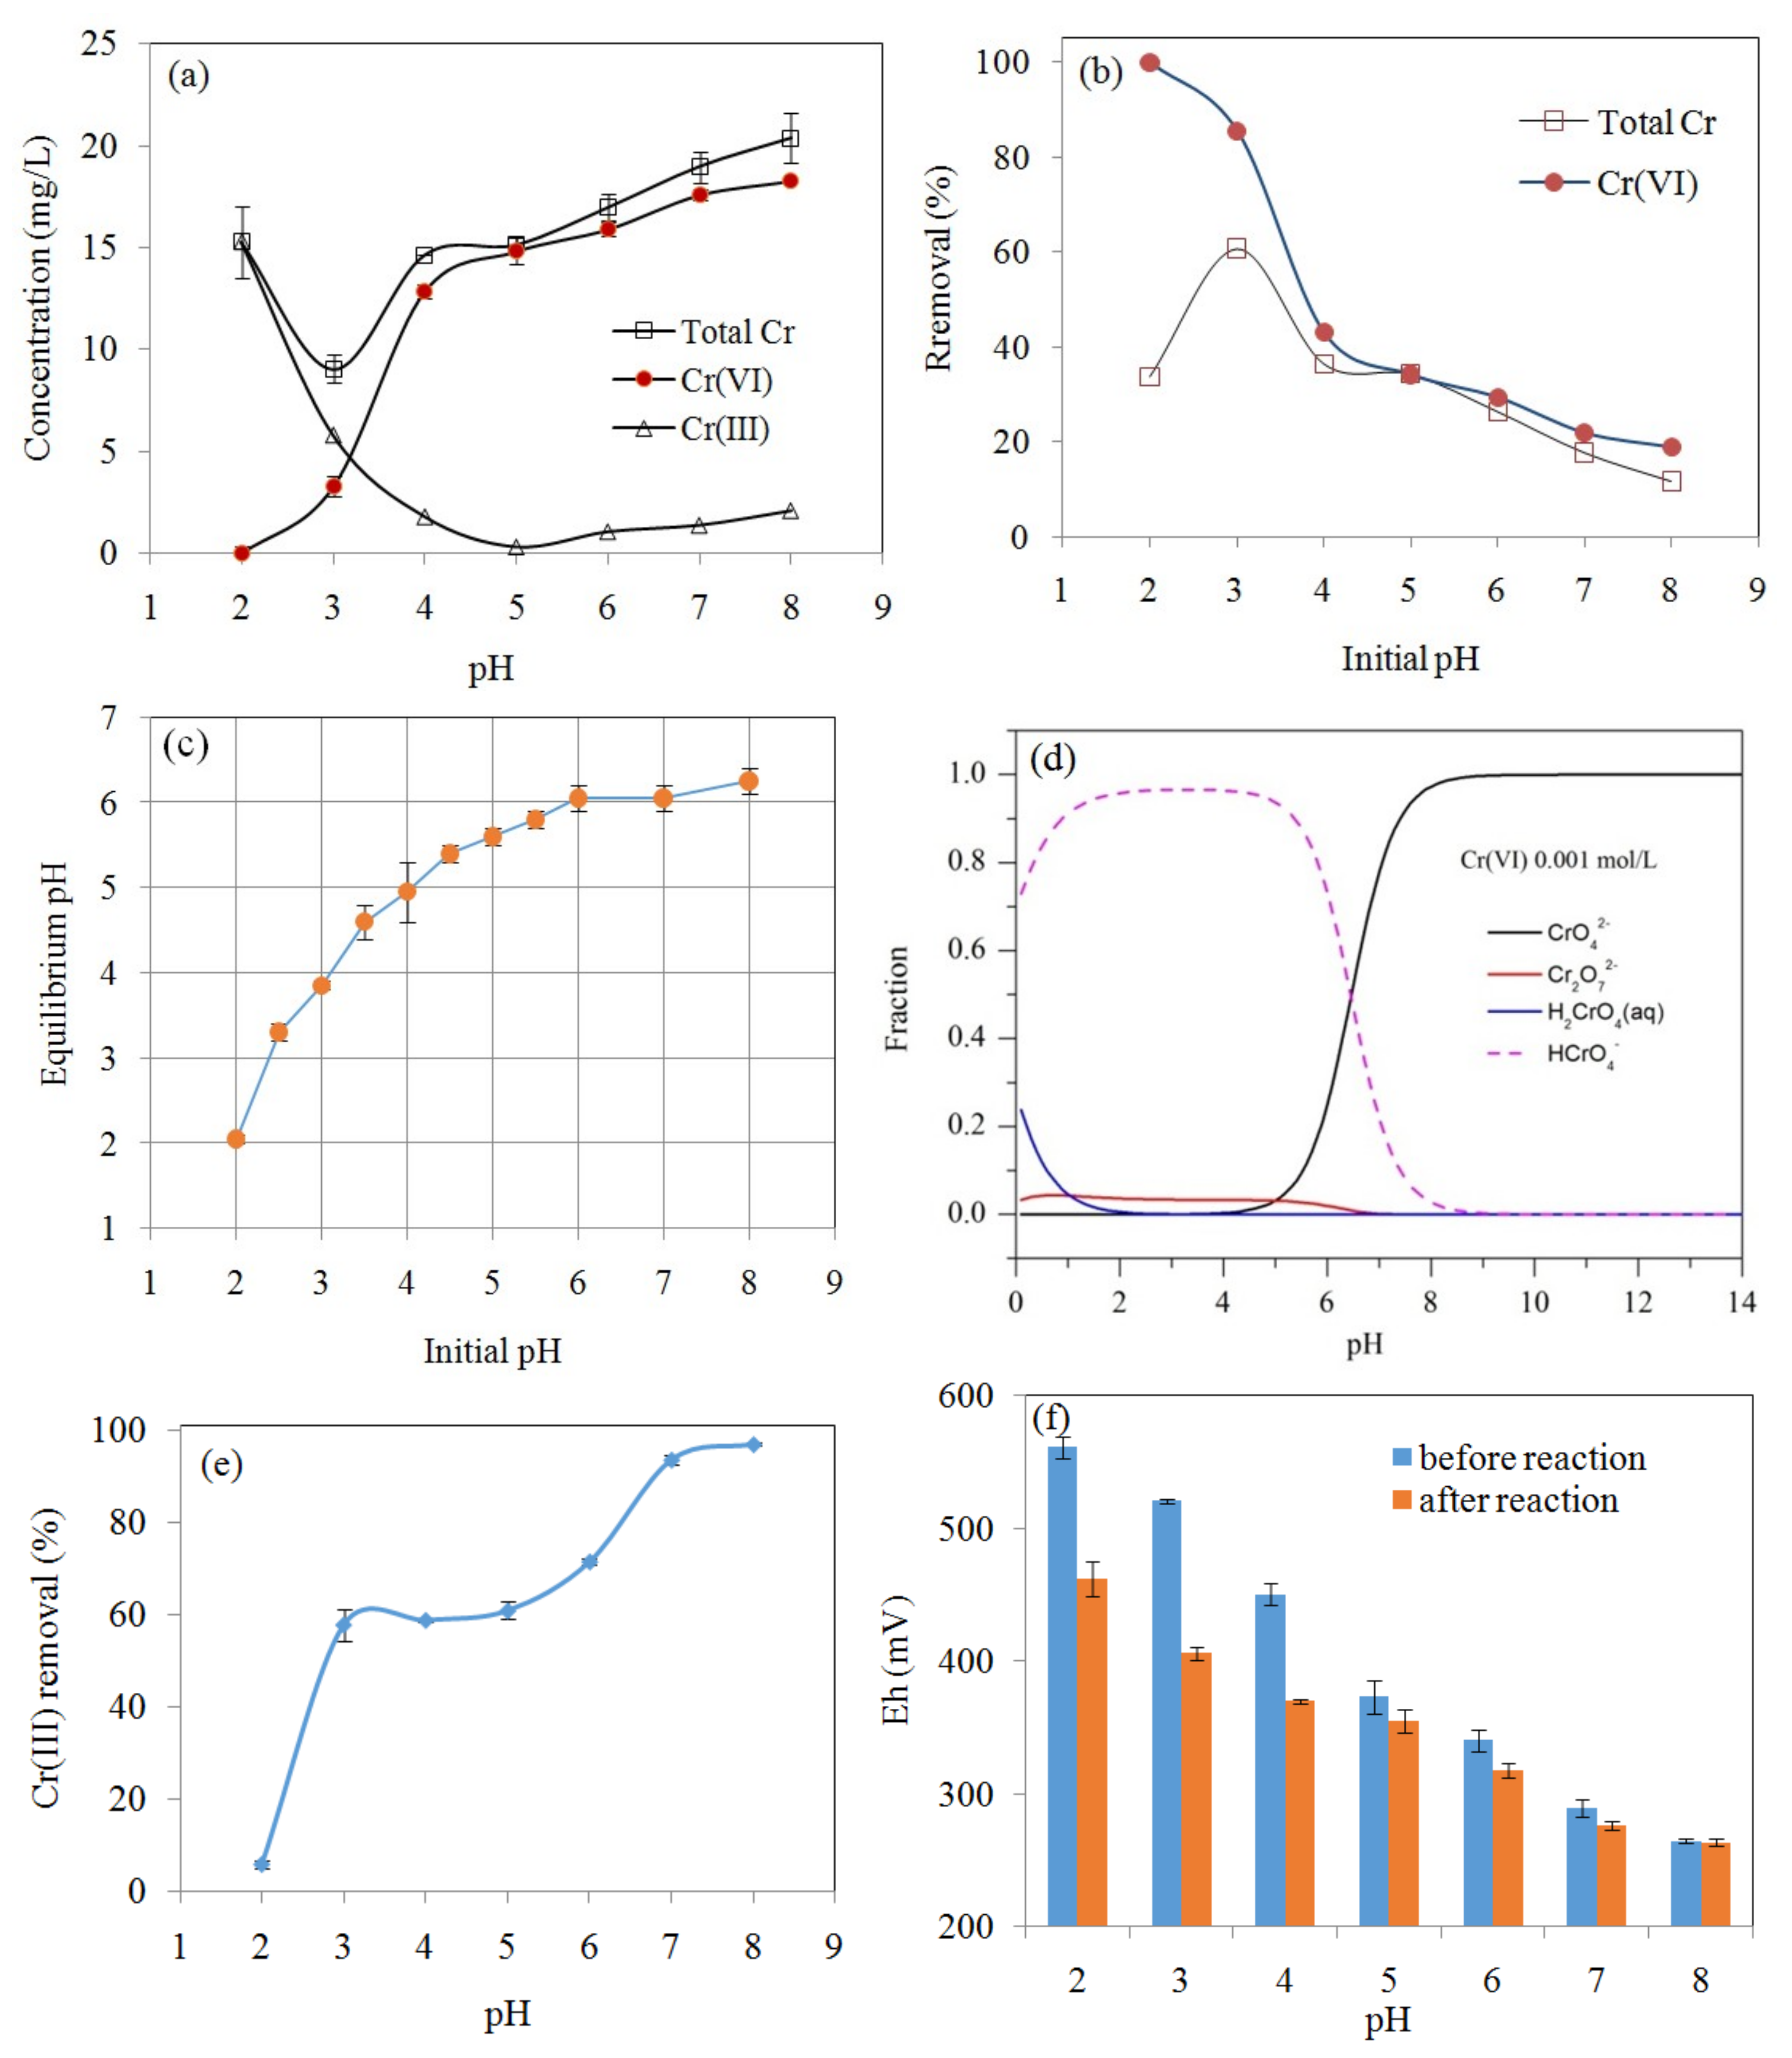
The effect of pH on the concentrations of Cr(VI), Cr(III), and total Cr is shown in Figure 5a, demonstrating that solution pH was an important factor affecting Cr(VI) removal. The percentage removal of Cr(VI) by MSB300 rapidly decreased with pH increasing from 2.0 to 8.0, with maximum removal efficiency (>99.9%) observed at pH 2 and minimum (18.9%) at pH 8 (Figure 5b). For example, the Cr(VI) concentration was below the detection limit (0.004 mg/L) for the initial Cr(VI) concentration of 25 mg/L by MSB300 (4 g/L) at pH 2. Meanwhile, the concentration of Cr(III) increased as a result of the Cr(VI) reduction (Figure 5a). It indicated that it would be favorable for Cr(VI) reduction into Cr(III) by the biochars at acidic solution, leading to the high pH-dependency of Cr(VI) removal. The effect of pH on only Cr(III) removal by MSB300 (Cr(III) 25 mg/L) is shown in Figure 5e. The removal of Cr(III) increased from 5.8% to 97.1% with pH increasing from 2.0 to 8.0. The pHpzc of silica in the biochar is about 2.0, so at low pH (~2.0), the silica surface (Si–OH) is negatively charged and can promote the adsorption of Cr(III). Cr(III) is mainly present as Cr3+ at pH 2.0 and carboxylic acid sites could be appreciably deprotonated to form chemical bonds with Cr3+. When the pH was increased, the dissociation of the acidic functional groups increased, which enhanced the complexation between Cr(III) and the anionic functional groups and thus increased the specific adsorption of Cr(III) [23]. The surface charge of the biochar and the distribution of Cr(VI) species are highly dependent on the pH of the aqueous solution. The main species of Cr(VI) in aqueous solution include CrO42−, Cr2O72−, HCrO4−, and H2CrO4. The distribution of Cr(VI) species as function of pH simulated by Visual MINTEQ 3.1 software (maintained by Jon Petter Gustafsson at KTH, Sweden) (available at http://hem.bredband.net/b108693/) is shown in Figure 5d. At low pH, the main species of Cr(VI) are HCrO4−, Cr2O72−, and H2CrO4, which can be reduced to Cr(III) by e− provided by the biochar surface groups (Equations (1)–(5)). The decrease in Cr(VI) removal with increasing pH could be caused by the electrostatic repulsion between Cr(VI) ions and negatively charged biochar surface [1,3,8]. The pH of solution increased after the reaction due to the consumption of H+ during the reduction of Cr(VI) and the release of alkaline materials in the biochars (Figure 5c) [2,10,12]. The redox potential (Eh) decreased after reaction mainly due to Cr(VI) reduction to Cr(III), especially at low pH (Figure 5f).
3.4. Adsorption Isotherm and Capacity Comparison
The Langmuir (Equation (6)) and Freundlich (Equation (7)) isotherm models were used to simulate Cr(VI) adsorption isotherm by the biochars.
where qe is the capacity of Cr(VI) adsorbed at equilibrium (mg/g), ce is the equilibrium concentration of Cr(VI) (mg/L), qmax is the maximum adsorption capacity (mg/g), and b (L/mg) is the Langmuir adsorption constant. kf (mg1−n·Ln/g) and 1/n are the Freundlich constants related to the adsorption capacity and adsorption intensity, respectively. The model parameters for the adsorption isotherms of Cr(VI) onto MSB are shown in Table 2. The experimental data indicated that the adsorption isotherms were better described by the Langmuir isotherm model with a higher R2 (0.98–0.99), indicating that monolayer adsorption played a dominant role in Cr(VI) removal. The maximum adsorption based on the Langmuir model for MSB300, MSB400, MSB500, and MSB600 was 91 mg/g (1.8 mmol/g), 63 mg/g (1.2 mmol/g), 42 mg/g (0.8 mmol/g), and 27 mg/g (0.5 mmol/g), respectively. The Cr(VI) removal capacity followed the order of MSB300 > MSB400 > MSB500 > MSB600, indicating that the biochars derived from lower pyrolytic temperatures exhibited a higher removal capacity of Cr(VI). A comparison of the maximum adsorption capacity of Cr(VI) on MSB300 with other low-cost absorbents is shown in Table 3.
According to the Langmuir model, a dimensionless constant separation factor (RL) can be used to analyze whether an adsorption system is favorable or unfavorable [2]:
The value of RL indicates the type of isotherm: Unfavorable (RL > 1), linear (RL = 1), favorable (0 < RL < 1), or irreversible (RL = 0). co is the initial concentration of Cr(VI) (mg/L), and b is the Langmuir constant. The RL values ranged from 0 to 1, which further indicated that the Cr(VI) adsorption by the biochars was Langmuir isotherm favorable.
3.5. Cr(VI) Removal Kinetics
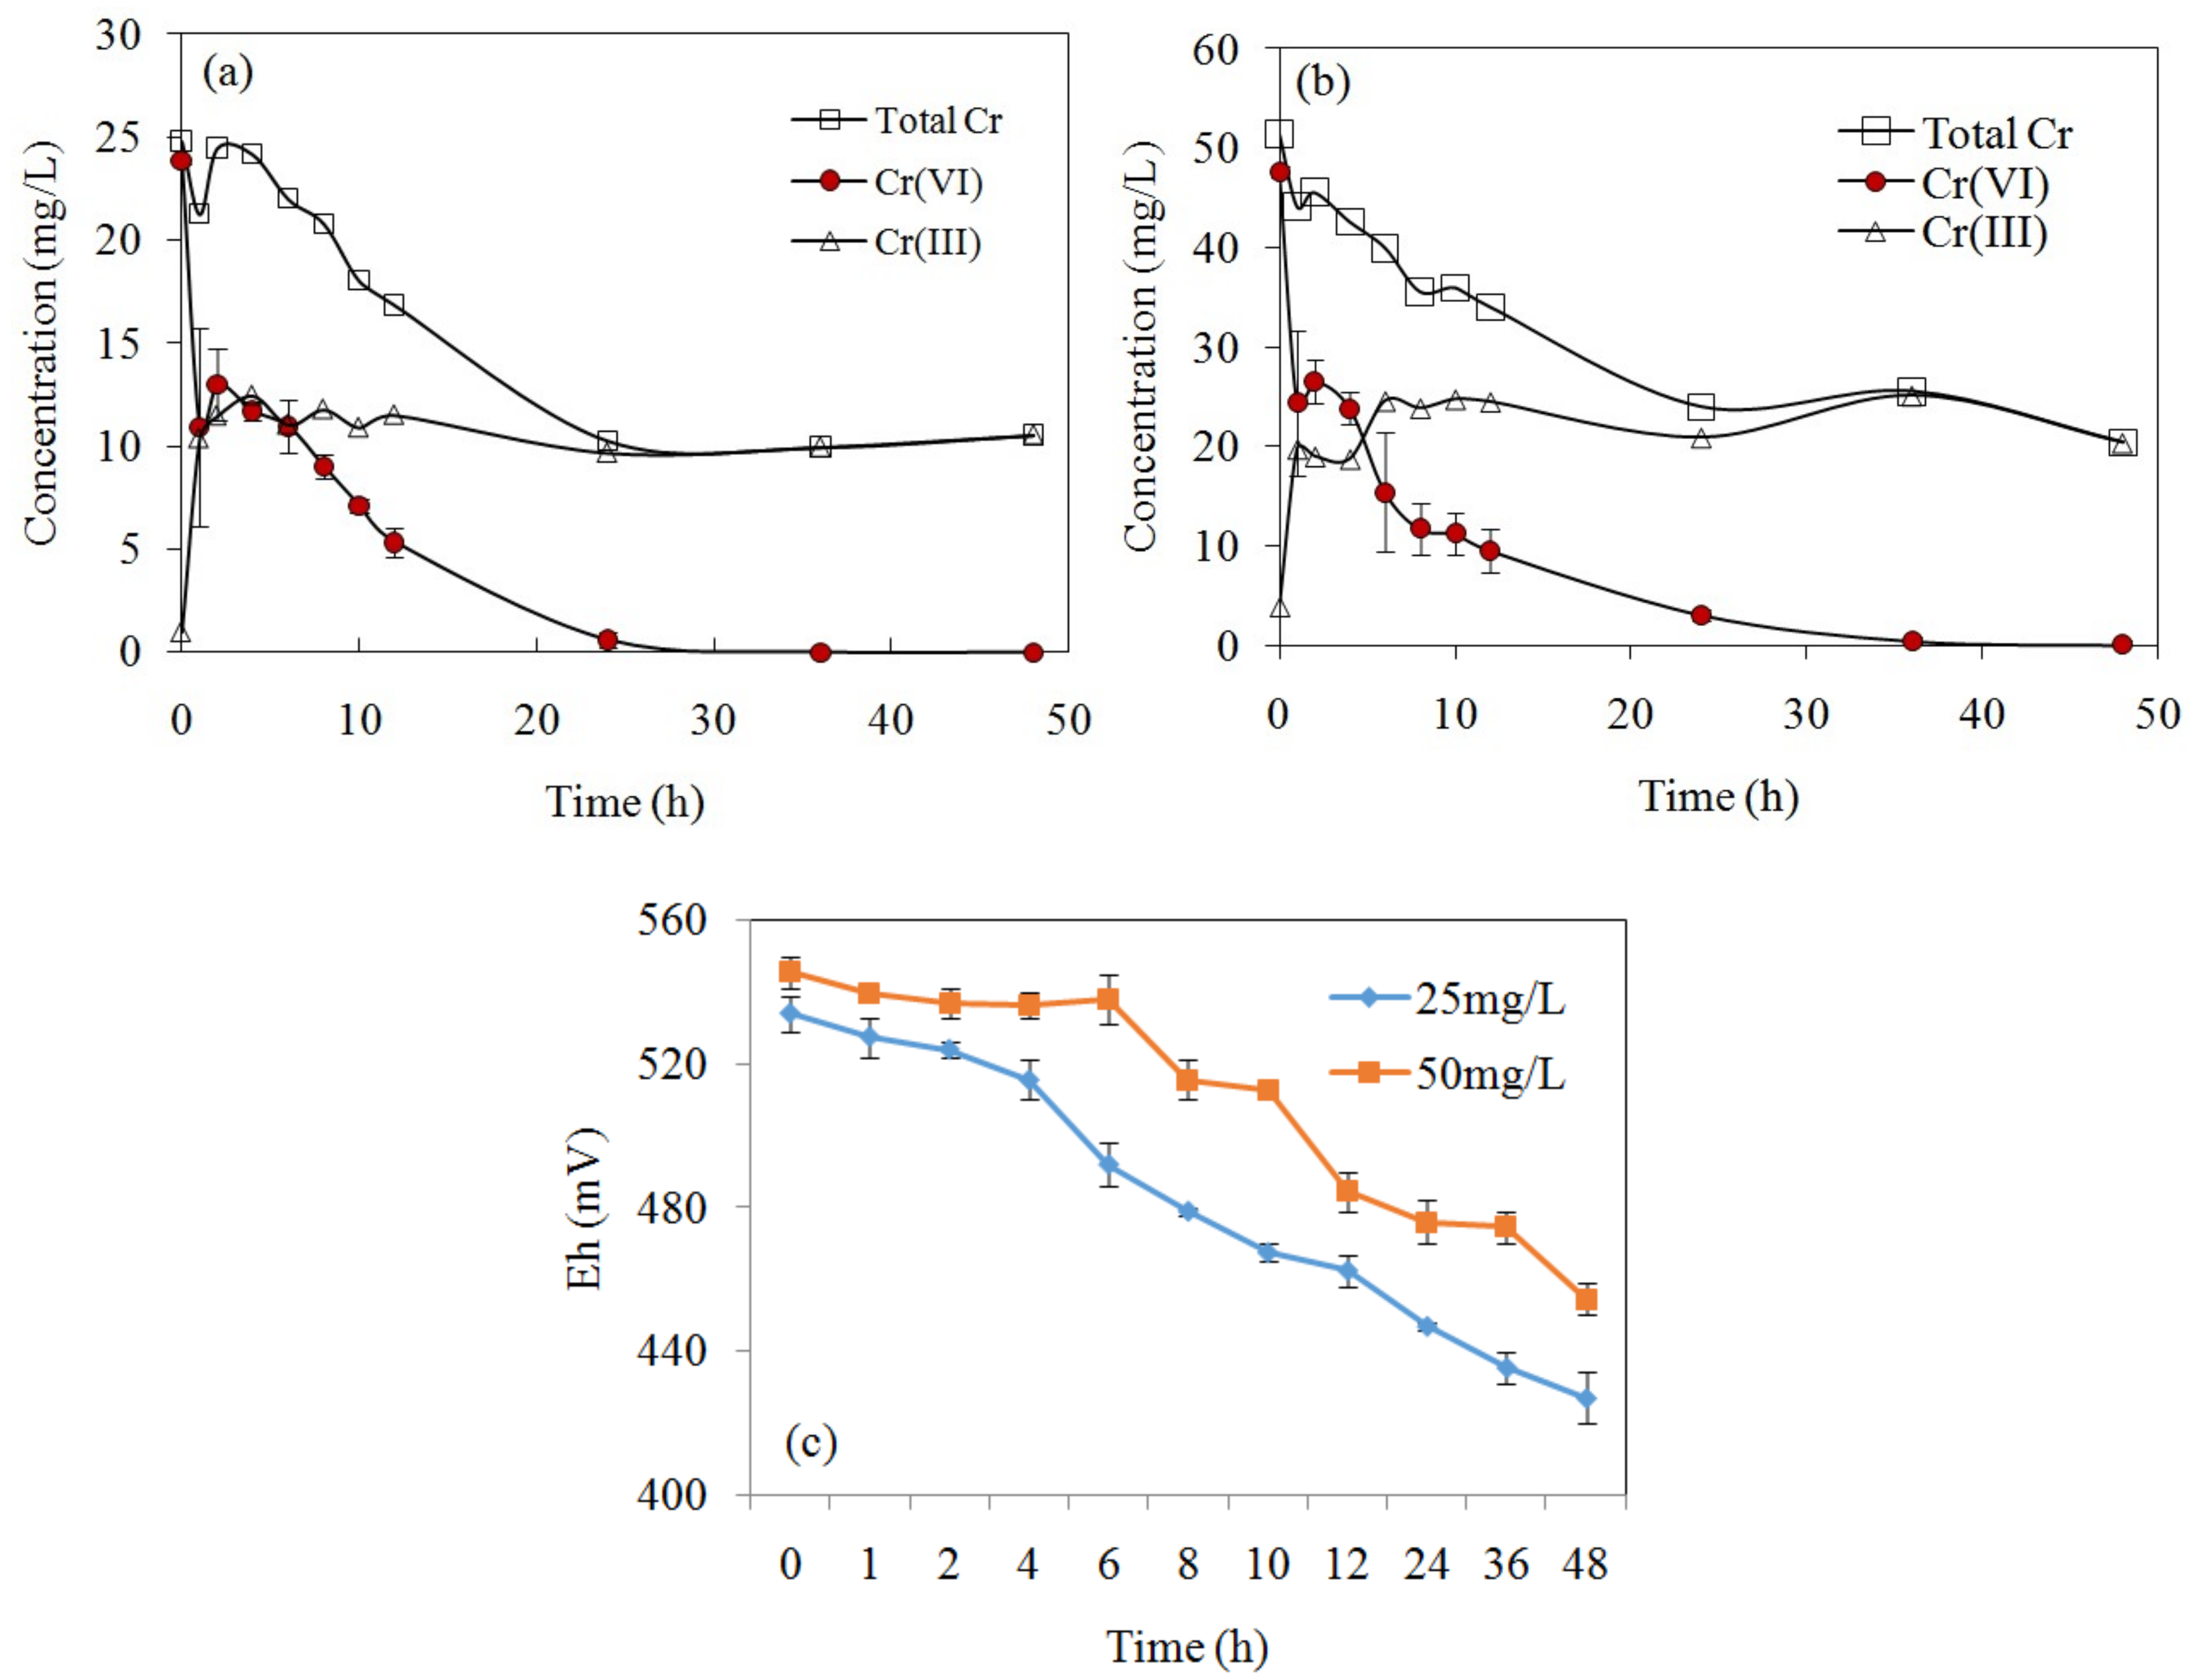
The variation of Cr(VI), Cr(III), and total Cr concentrations in the solution after reaction is shown in Figure 6. The concentration of Cr(VI) dramatically decreased with time and equilibrium was reached after 48 h, when 100% and 99.9% of Cr(VI) was removed for an initial concentration of 25 mg/L and 50 mg/L, respectively. Meanwhile, Cr(III) concentration increased as a result of Cr(VI) reduction, and the generated amount of Cr(III) in the solution was less than the reduced amount of Cr(VI), which indicated part of the converted Cr(III) had bound to the biochar. For MSB300, Cr(VI) concentration decreased by 25 mg/L at 48 h, while Cr(III) concentration increased to 10.5 mg/L (Figure 6). Based on the mass balance, Cr(VI) adsorbed onto the biochar surface could be reduced to Cr(III) by electrons provided by biochar surface groups, and part of the converted Cr(III) was retained on the biochar and the rest was released into the solution, as Cr(III) is not easily adsorbed under the extremely acidic conditions (pH 2.0).
The removal kinetics were evaluated with the pseudo-first-order and pseudo-second-order. The kinetic parameters are shown in Table 4 and suggest that the pseudo-second-order model described the experimental data better than the pseudo first-order model, evidenced by the higher correlation coefficients (R2) as well as the theoretical values of qe being closer to the experimental qe values.
3.6. The Effect of Temperature and Coexisting Anions
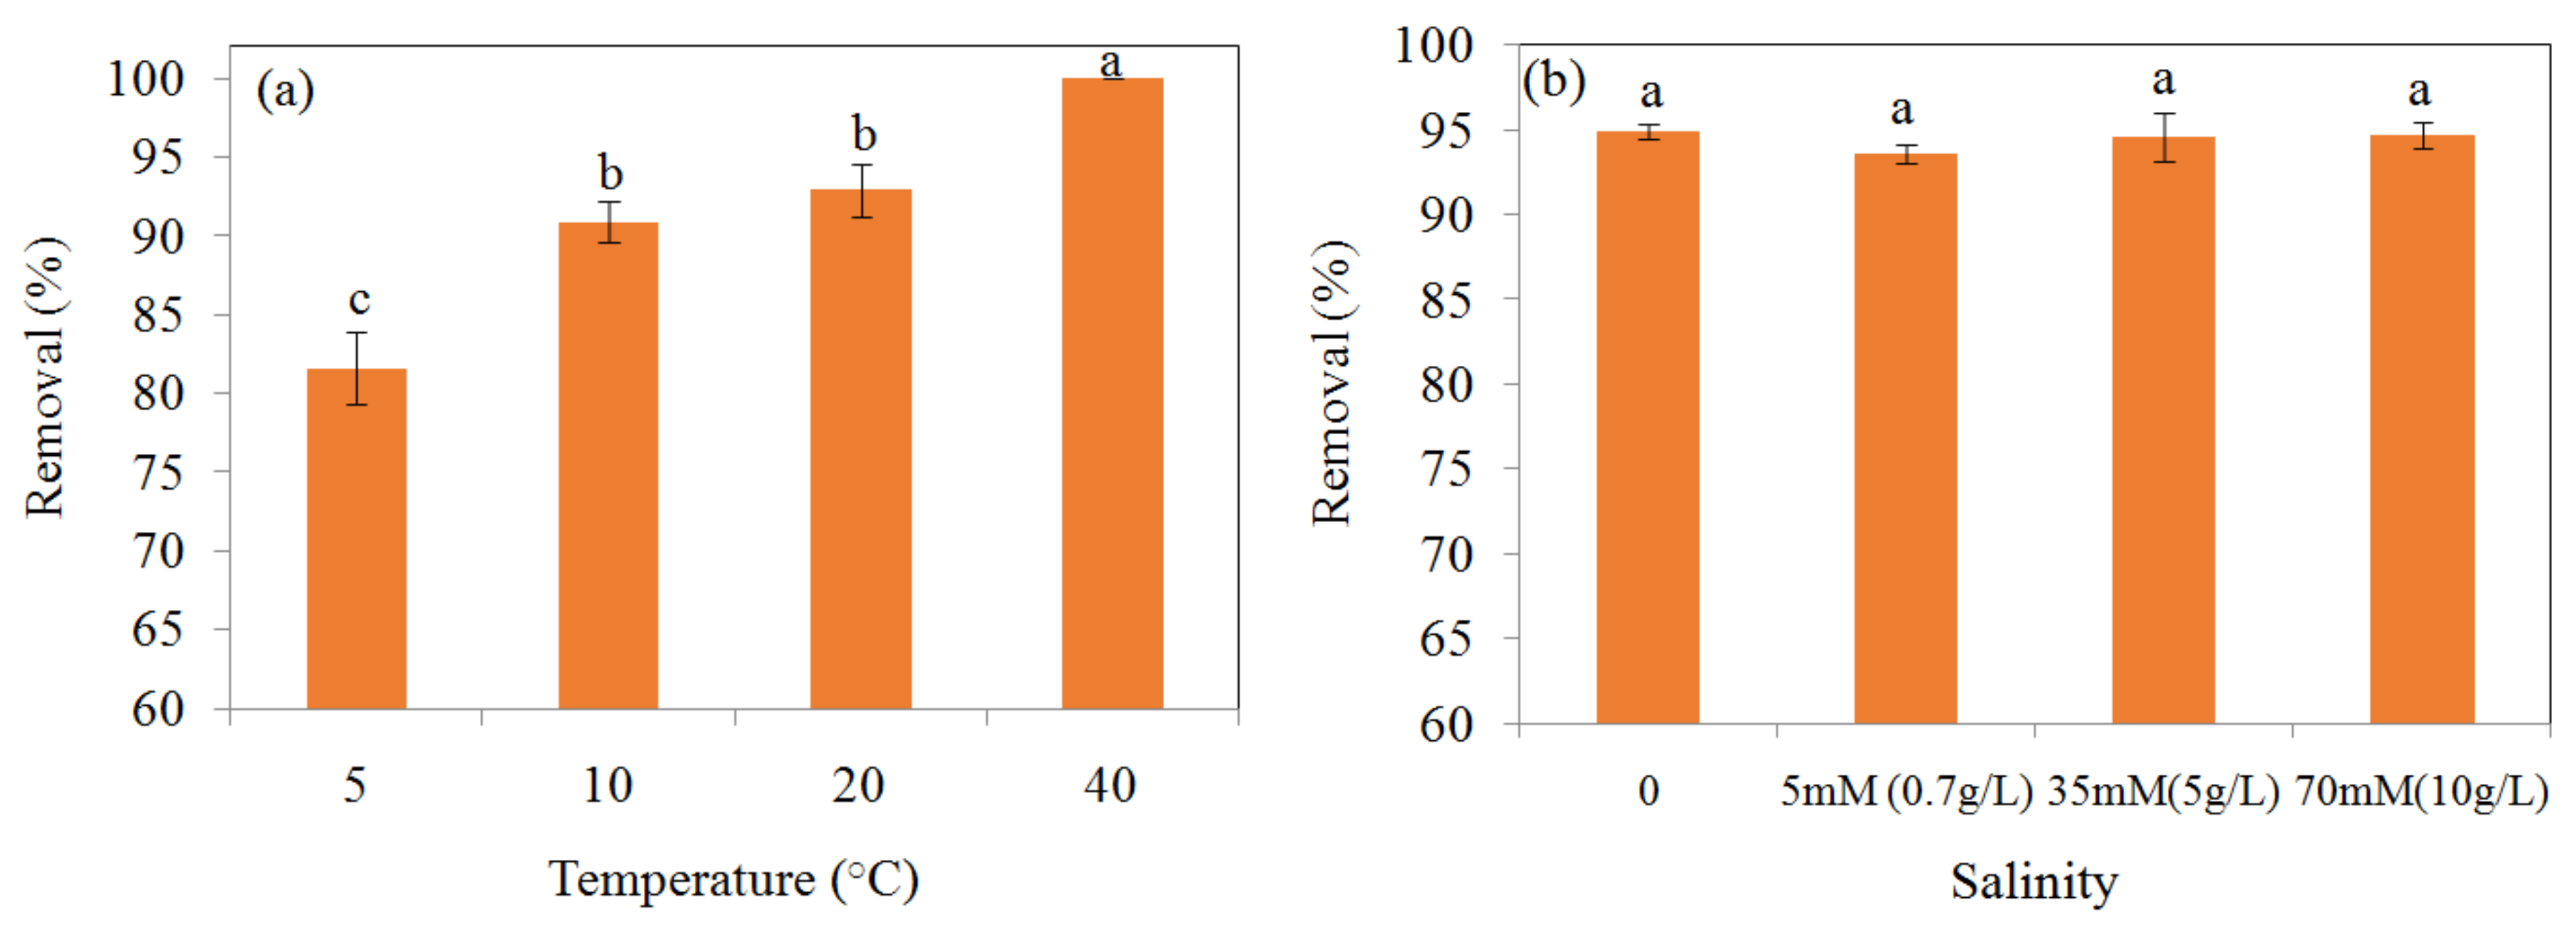
The effect of temperature on the removal of Cr(VI) 100 mg/L by MSB300 at pH 2.0 is shown in Figure 7a. The removal efficiency of Cr(VI) 100 mg/L was 81.6% ± 2.3%, 90.9% ± 1.3%, 92.9% ± 1.6%, and 100% by MSB300 at temperatures of 5, 10, 20, and 40 °C, respectively (p < 0.05). Correspondingly, the Eh decreased from 541 to 498 mV for Cr(VI) 100 mg/L removal by MSB at 5 °C, 540 to 480 mV for 10 °C, 543 to 446 mV for 20 °C, and 542 to 363 for 40 °C, which showed a greater decrease for treatment at 40 °C. It showed the removal efficiency of Cr(VI) increased with temperature increasing from 5 to 40 °C.
The effect of high salinity (5 mM (0.7 g/L), 35 mM (5 g/L), and 70 mM (10 g/L) Na2SO4) on Cr(VI) 100 mg/L (1.9 mM) removal is shown in Figure 7b. For MSB300, the removal of Cr(VI) was 94.9% ± 0.4%, 93.6% ± 0.6%, 94.6% ± 1.4%, and 94.7% ± 0.8% when the concentration (Na2SO4) of solution was 0 mM, 5 mM (0.7 g/L), 35mM (5 g/L), and 70 mM (10 g/L), respectively. The effect of high salinity on Cr(VI) 100 mg/L removal by MSB300 were insignificant (p > 0.05).
3.7. Cr(VI) Removal Mechanisms
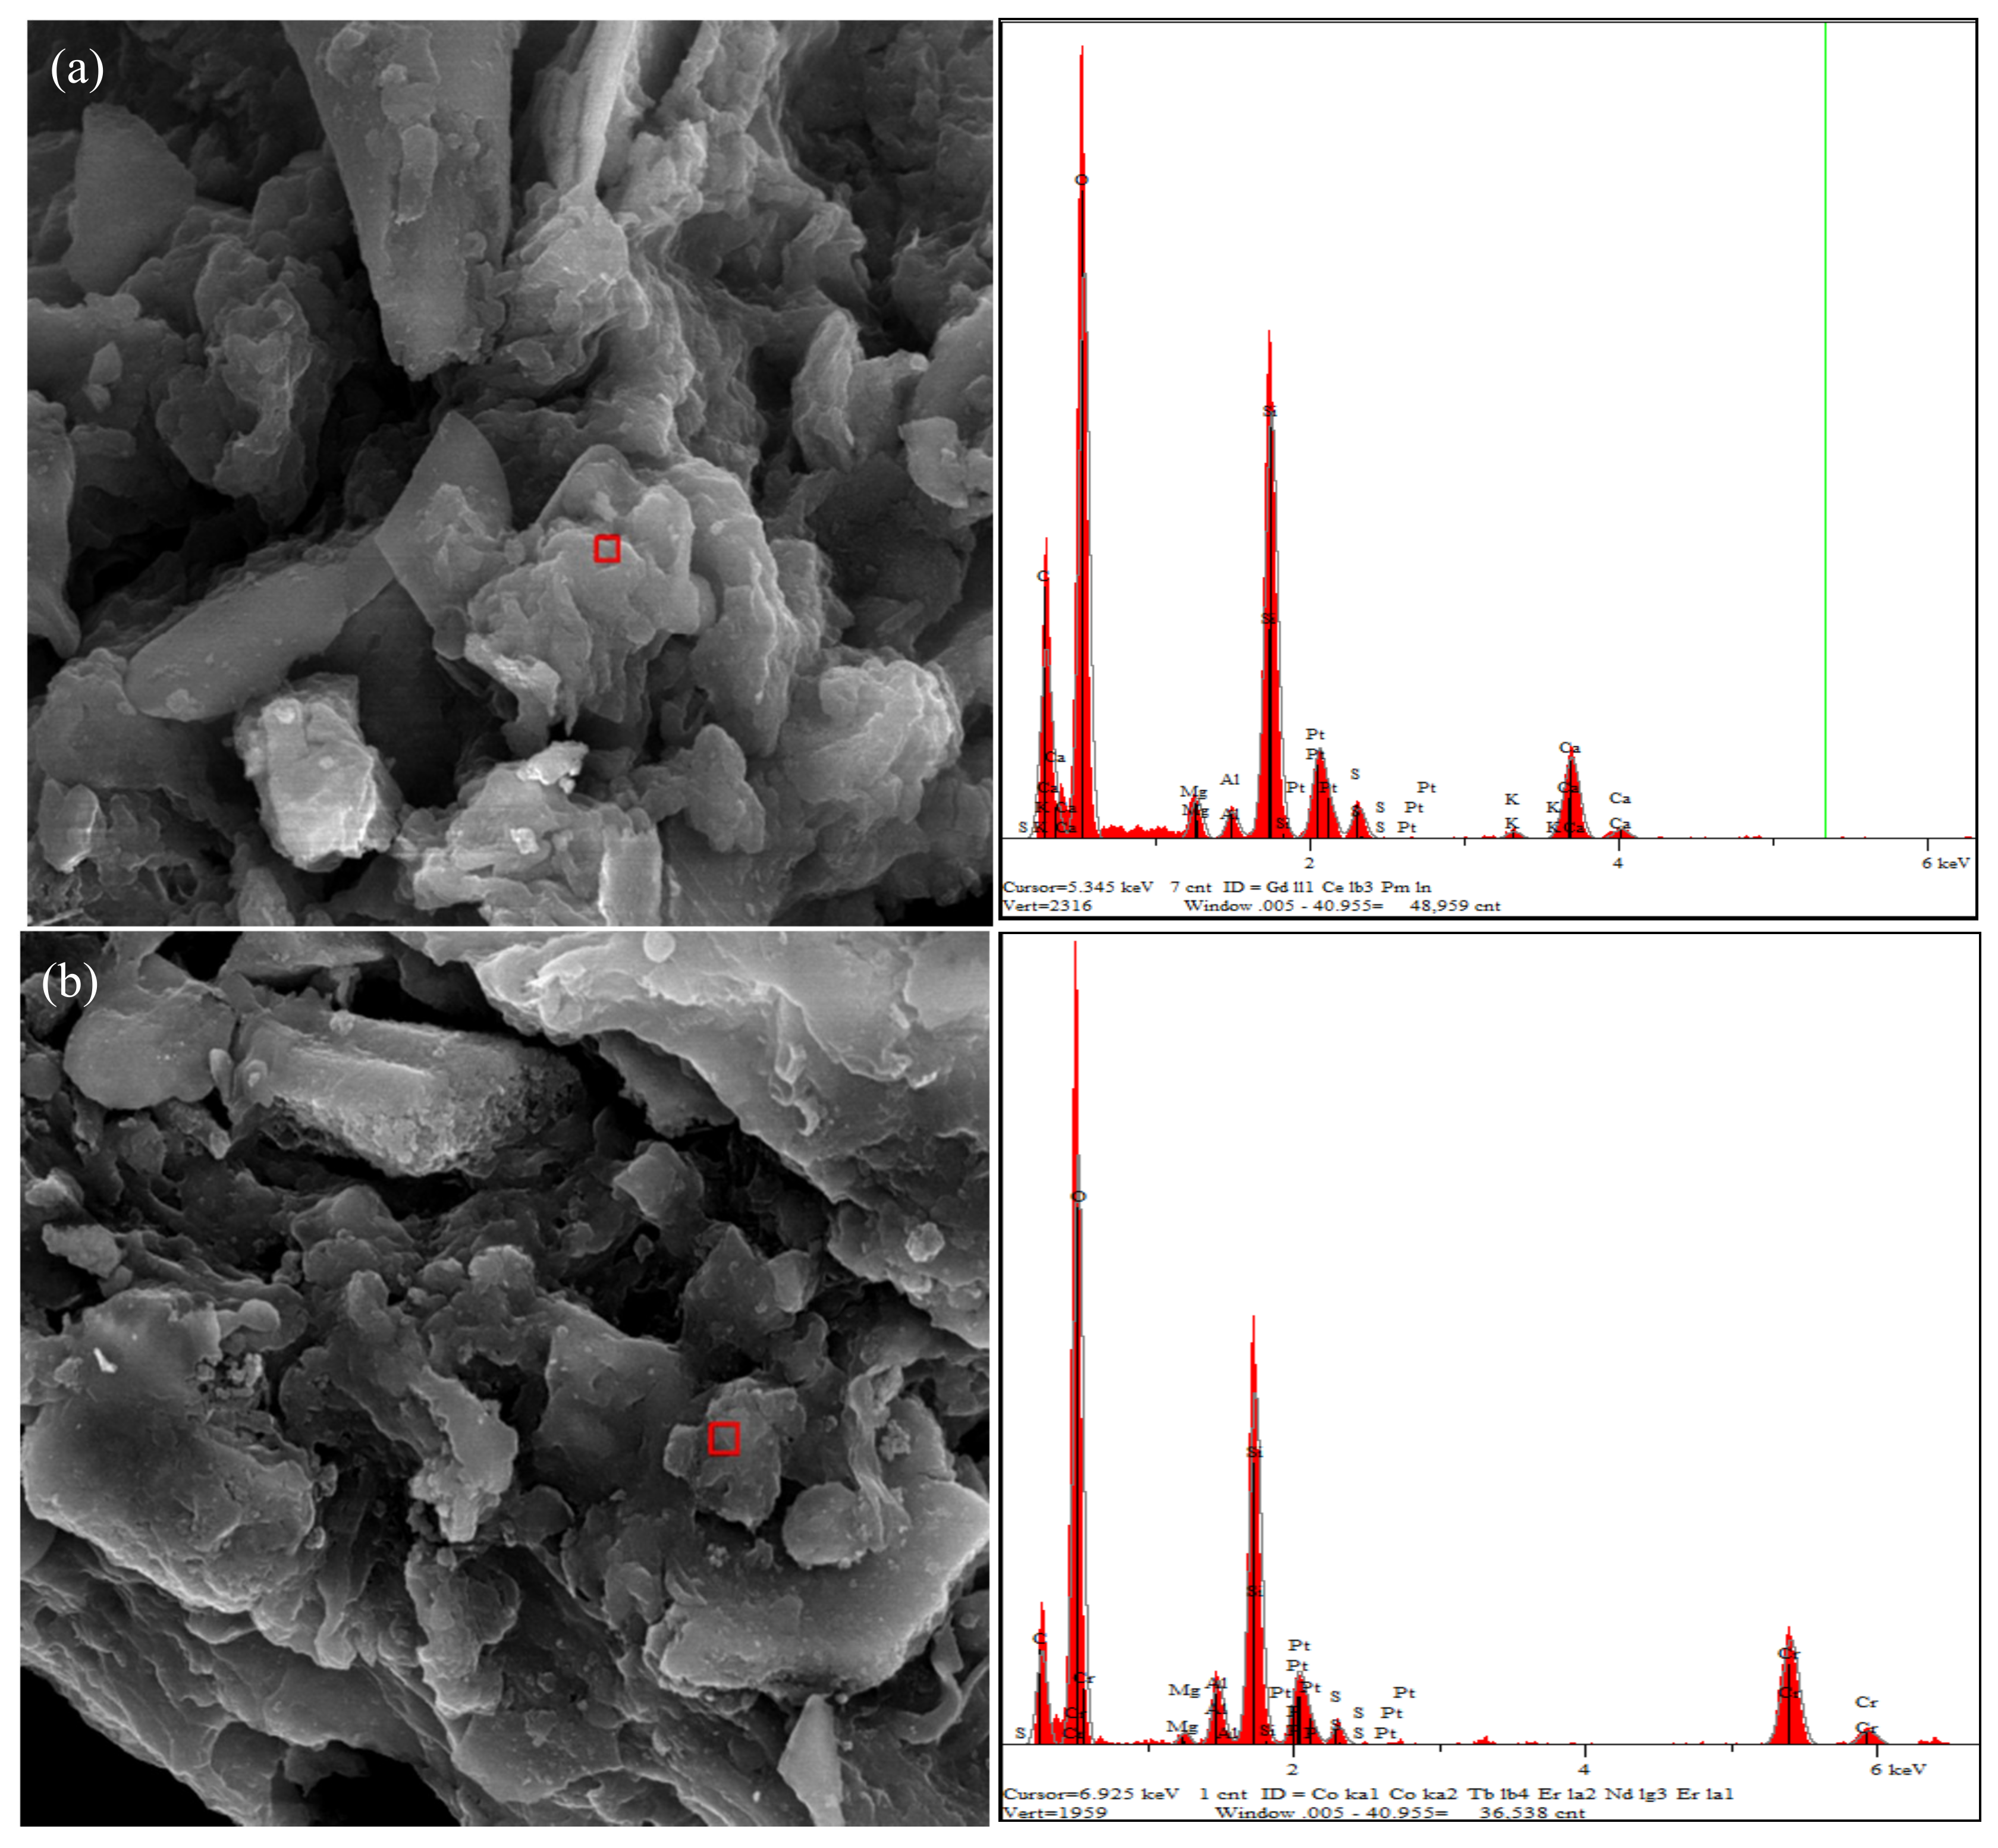
The surface characteristics of the biochars before and after Cr(VI) removal was examined with SEM-EDX and FTIR. The EDX spectra indicated substantial amounts of C, O, Si, Ca, Al, Mg, and K in the raw MSB300, and a clear signal of the presence of Cr was observed on the surface of MSB300 after Cr(VI) adsorption (Figure 8).
The FTIR spectra of MSB400 before and after Cr(VI) adsorption are shown in Figure 9. The vibrational intensity at 2923 cm−1, 1620 cm−1, and 1097 cm−1 decreased, and a peak at 1380 cm−1 (C=O stretch of carboxylate ions) appeared after adsorption. These changes indicated the involvement of aliphatic –CH2, CH3, C=O, and Si–O groups in chromium adsorption and the occurrence of surface complexation. The results are in line with previous studies, which showed many groups, including carboxyl, hydroxyl, –CH2, and CH3 groups, were responsible for Cr(VI) removal [1,2,13].
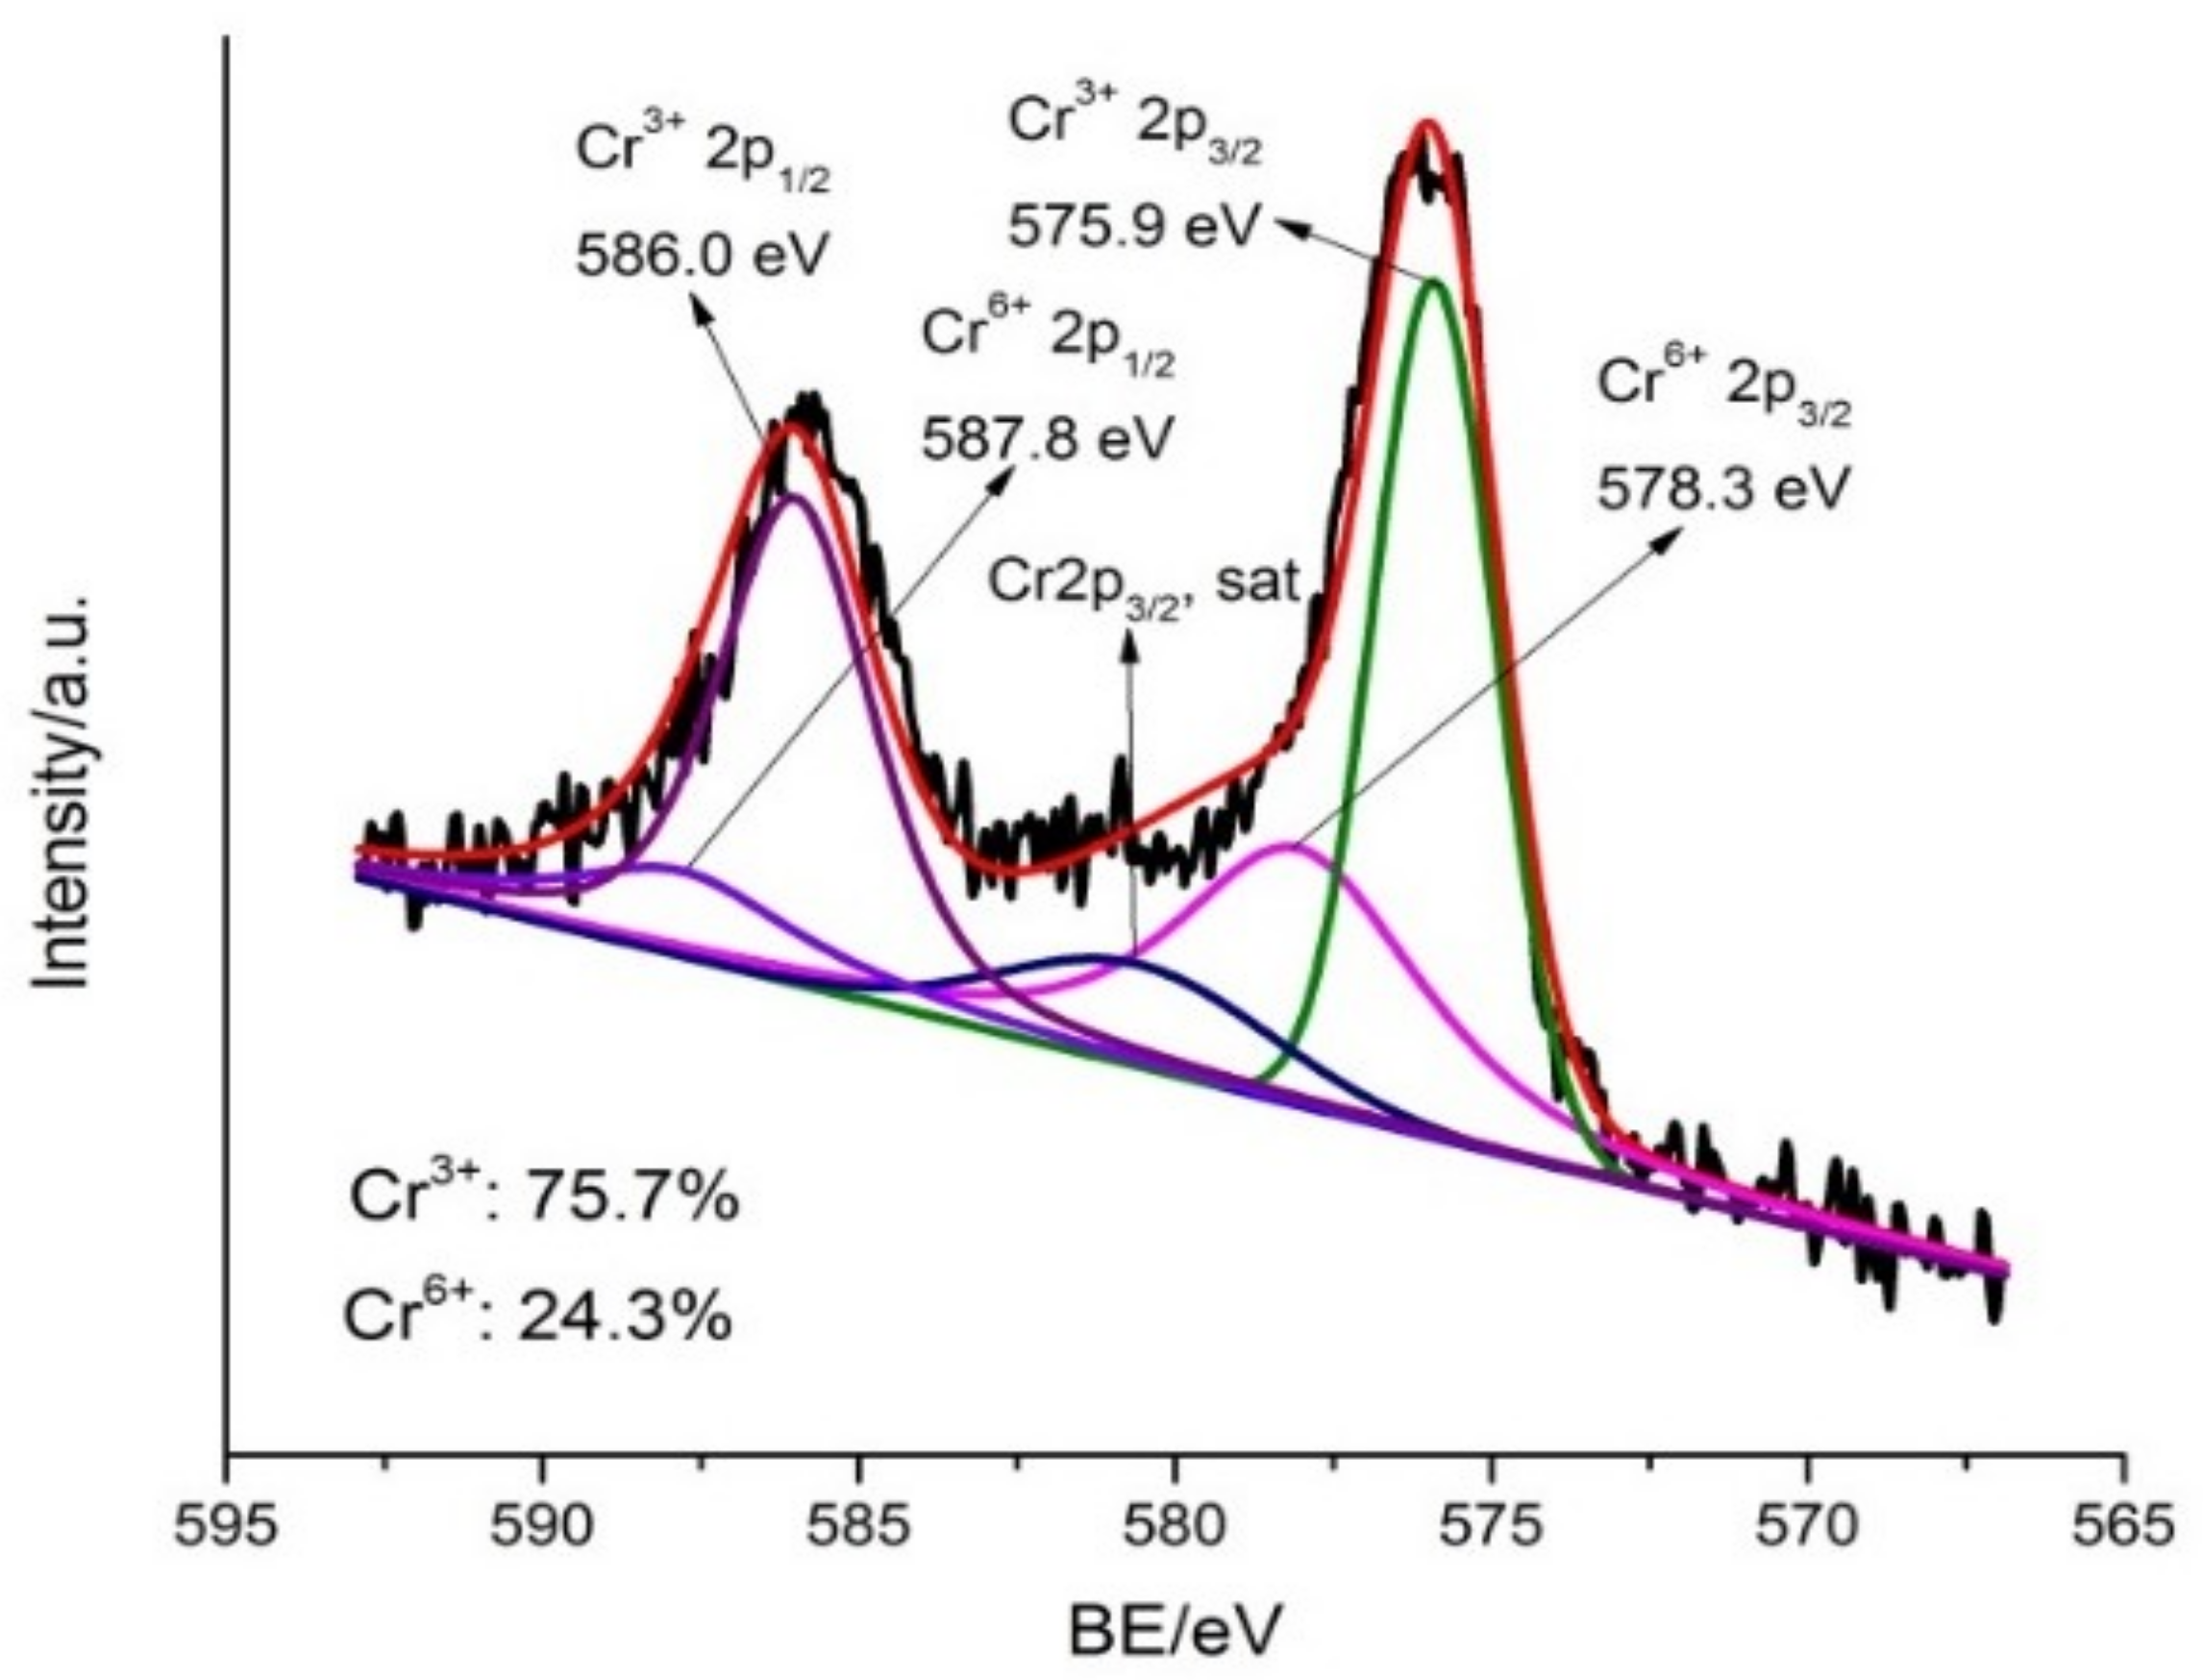
Furthermore, XPS analysis was performed to reveal the valence state of Cr bound on MSB300 after reaction with Cr(VI) at pH 2.0 (Figure 10). The peaks at binding energies of 586.0 eV (Cr 2p1/2) and 575.9 eV (Cr 2p3/2) can be assigned to Cr(III), and the peaks at 587.8 eV (Cr 2p1/2) and 578.3 eV (Cr 2p3/2) correspond to Cr(VI). The reduction of Cr(VI) to Cr(III) was confirmed according to XPS spectra analysis of the MSB300 surface where Cr(III) and Cr(VI) co-existed, with Cr(III) being the main (75.7%) species of adsorbed Cr for MSB300 after reaction with Cr(VI), respectively. The presence of Cr(III) was attributed to the reduction of Cr(VI) as described in Equations (1) to (4). Based on the mass balance analysis in combination with SEM-EDX, FTIR, and XPS data, Cr(VI) removal mechanisms from acidic aqueous solution by MSB300 could include three processes: (i) Cr(VI) adsorption by the positively charged biochar, (ii) Cr(VI) reduction to Cr(III) by electrons provided by biochar, and (iii) part of the converted Cr(III) complexation with functional groups and the rest released into the solution.
4. Conclusions
The removal efficiency of Cr(VI) by maize straw biochars decreased when the pyrolysis temperature increased from 300 to 600 °C. FTIR data suggested that C=O, Si–O, –CH2, and –CH3 groups may be mainly involved in Cr(VI) removal. The biochar pyrolyzed at low temperatures with a large number of oxygen-containing functional groups facilitated Cr(VI) removal. XPS analysis showed that most of the Cr bound to the biochars was Cr(III). The reductive adsorption process was responsible for Cr(VI) removal, including electrostatic attraction of Cr(VI), Cr(VI) reduction, and subsequent Cr(III) complexation with surface functional groups. The maximum adsorption capacity was 91 mg/g at pH 2.0 for MSB300. Maize straw biochars pyrolyzed at 300 °C for 2 h could be a low-cost and efficient adsorbent for Cr(VI) removal in acidic environments.
Author Contributions
Conceptualization, H.W. and M.Z.; methodology, M.Z.; software, H.W.; validation, H.W. and M.Z.; formal analysis, M.Z. and Q.L.; investigation, M.Z. and Q.L.; resources, M.Z.; data curation, M.Z.; writing—original draft preparation, H.W. and Q.L.; writing—review and editing, H.W. Q.L. and M.Z.; visualization, M.Z.; supervision, M.Z.; project administration, M.Z.; funding acquisition, M.Z.
Funding
This research was funded by Natural Science Foundation of Shandong Province, China (ZR2018MEE007).
Conflicts of Interest
The authors declare no conflict of interest.
References
- Zhou, L.; Liu, Y.G.; Liu, S.B.; Yin, Y.C.; Zeng, G.G.; Tan, X.F.; Hu, X.; Hu, X.G.; Jiang, L.H.; Ding, Y.; et al. Investigation of the adsorption-reduction mechanisms of hexavalent chromium by ramie biochars of different pyrolytic temperatures. Bioresour. Technol. 2016, 218, 351–359. [Google Scholar] [CrossRef]
- Zhang, X.; Fu, W.J.; Yin, Y.X.; Chen, Z.H.; Qiu, R.L.; Simonnot, M.O.; Wang, X.F. Adsorption-reduction removal of Cr(VI) by tobacco petiole pyrolytic biochar: Batch experiment, kinetic and mechanism studies. Bioresour. Technol. 2018, 268, 149–157. [Google Scholar] [CrossRef] [PubMed]
- Cibati, A.; Foereid, B.; Bissessur, A.; Hapca, S. Assessment of Miscanthus × giganteus derived biochar as copper and zinc adsorbent: Study of the effect of pyrolysis temperature, pH and hydrogen peroxide modification. J. Clean. Prod. 2017, 162, 1285–1296. [Google Scholar] [CrossRef]
- Li, H.B.; Dong, X.L.; da Silva, E.B.; de Oliveira, L.M.; Chen, Y.S.; Ma, L.Q. Mechanisms of metal sorption by biochars: Biochar characteristics and modifications. Chemosphere 2017, 178, 466–478. [Google Scholar] [CrossRef] [PubMed]
- Dawood, S.; Sen, T.K.; Phan, C. Synthesis and characterization of slow pyrolysis pine cone bio-char in the removal of organic and inorganic pollutants from aqueous solution by adsorption: Kinetic, equilibrium, mechanism and thermodynamic. Bioresour. Technol. 2017, 246, 76–81. [Google Scholar] [CrossRef]
- Kah, M.; Sigmund, G.; Xiao, F.; Hofmann, T. Sorption of ionizable and ionic organic compounds to biochar, activated carbon and other carbonaceous materials. Water Res. 2017, 124, 673–692. [Google Scholar] [CrossRef]
- Pan, J.; Jiang, J.; Xu, R. Removal of Cr (VI) from aqueous solutions by Na2SO3/FeSO4 combined with peanut straw biochar. Chemosphere 2014, 101, 71–76. [Google Scholar] [CrossRef]
- Chen, Y.Y.; Wang, B.Y.; Xin, J.; Sun, P.; Wu, D. Adsorption behavior and mechanism of Cr(VI) by modified biochar derived from Enteromorpha prolifera. Ecotoxicol. Environ. Saf. 2018, 164, 440–447. [Google Scholar] [CrossRef] [PubMed]
- Zhao, N.; Yin, Z.; Liu, F.; Zhang, M.; Lv, Y.; Hao, Z.; Pan, G.; Zhang, J. Environmentally persistent free radicals mediated removal of Cr(VI) from highly saline water by corn straw biochars. Bioresour. Technol. 2018, 260, 294–301. [Google Scholar] [CrossRef]
- Jung, K.W.; Kim, K.; Jeong, T.U.; Ahn, K.H. Influence of pyrolysis temperature on characteristics and phosphate adsorption capability of biochar derived from waste-marine macroalgae (Undaria pinnatifida roots). Bioresour. Technol. 2016, 20, 1024–1028. [Google Scholar] [CrossRef]
- Luo, L.; Xu, C.; Chen, Z.; Zhang, S. Properties of biomass-derived biochars: Combined effects of operating conditions and biomass types. Bioresour. Technol. 2015, 192, 83–89. [Google Scholar] [CrossRef] [PubMed]
- Zhang, C.; Shan, B.Q.; Tang, W.Z.; Zhu, Y.Y. Comparison of cadmium and lead sorption by Phyllostachys pubescens biochar produced under a low-oxygen pyrolysis atmosphere. Bioresour. Technol. 2017, 238, 352–360. [Google Scholar] [CrossRef] [PubMed]
- Dong, X.L.; Ma, L.Q.; Li, Y.C. Characteristics and mechanisms of hexavalent chromium removal by biochar from sugar beet tailing. J. Hazard. Mater. 2011, 190, 909–915. [Google Scholar] [CrossRef] [PubMed]
- Mohan, D.; Rajput, S.; Singh, V.K.; Steele, P.H.; Pittman, C.U., Jr. Modeling and evaluation of chromium remediation from water using low cost bio-char, a green adsorbent. J. Hazard. Mater. 2011, 188, 319–333. [Google Scholar] [CrossRef]
- Chen, T.; Zhang, Y.X.; Wang, H.T.; Lu, W.J.; Zhou, Z.Y.; Zhang, Y.C.; Ren, L.L. Influence of pyrolysis temperature on characteristics and heavy metal adsorptive performance of biochar derived from municipal sewage sludge. Bioresour. Technol. 2014, 164, 47–54. [Google Scholar] [CrossRef]
- Shen, Y.S.; Wang, S.L.; Tzou, Y.M.; Yan, Y.Y.; Kuan, W.H. Removal of hexavalent Cr by coconut coir and derived chars-The effect of surface functionality. Bioresour. Technol. 2012, 104, 165–172. [Google Scholar] [CrossRef]
- Zhang, W.; Mao, S.; Chen, H.; Huang, L.; Qiu, R. Pb(II) and Cr(VI) sorption by biochars pyrolyzed from the municipal wastewater sludge under different heating conditions. Bioresour. Technol. 2013, 147, 545–552. [Google Scholar] [CrossRef] [PubMed]
- Mahmood, T.; Saddique, M.T.; Naeem, A.; Westerhoff, P.; Mustafa, S.; Alum, A. Comparison of different methods for the point of zero charge determination of NiO. Ind. Eng. Chem. Res. 2011, 50, 10017–10023. [Google Scholar] [CrossRef]
- Karunanayake, A.G.; Todd, O.A.; Crowley, M.; Ricchetti, L.; Pittman, C.U., Jr.; Anderson, R.; Mohan, D.; Mlsna, T. Lead and cadmium remediation using magnetized and nonmagnetized biochar from Douglas fir. Chem. Eng. J. 2018, 331, 480–491. [Google Scholar] [CrossRef]
- Chun, Y.; Sheng, G.Y.; Chiou, C.T.; Xing, B.S. Compositions and sorptive properties of crop residue-derived chars. Environ. Sci. Technol. 2004, 38, 4649–4655. [Google Scholar] [CrossRef]
- Zhao, B.; O’Connor, D.; Zhang, J.; Peng, T.; Shen, Z.; Tsang, D.C.W.; Hou, D. Effect of pyrolysis temperature, heating rate, and residence time on rapeseed stem derived biochar. J. Clean. Prod. 2018, 174, 977–987. [Google Scholar] [CrossRef]
- Elangovan, R.; Philip, L.; Chandraraj, K. Biosorption of hexavalent and trivalent chromium by palm flower (Borassus aethiopum). Chem. Eng. J. 2008, 141, 99–111. [Google Scholar] [CrossRef]
- Pan, J.; Jiang, J.; Xu, R. Adsorption of Cr (III) from acidic solutions by crop straw derived biochars. J. Environ. Sci. 2013, 25, 1957–1965. [Google Scholar] [CrossRef]
- Agrafioti, E.; Kalderis, D.; Diamadopoulos, E. Arsenic and chromium removal from water using biochars derived from rice husk, organic solid wastes and sewage sludge. J. Environ. Manag. 2014, 133, 309–314. [Google Scholar] [CrossRef] [PubMed]
- Tytlak, A.; Oleszczuk, P.; Dobrowolski, R. Sorption and desorption of Cr (VI) ions from water by biochars in different environmental conditions. Environ. Sci. Pollut. Res. Int. 2015, 22, 5985–5994. [Google Scholar] [CrossRef] [PubMed]
Figure 1.
pH and EC variation of the biochars when the pyrolysis temperature was increased from 300 to 600 °C.
Figure 1.
pH and EC variation of the biochars when the pyrolysis temperature was increased from 300 to 600 °C.

Figure 2.
SEM images of MSB300 (a) and MSB500 (b).

Figure 3.
FTIR spectra of MSB pyrolyzed at 300 to 600 °C.

Figure 4.
Comparisons of Cr(VI) 100, 200, and 400 mg/L removal by MSB from different pyrolytic temperatures at pH 2.0. The error bars marked with different letters (a, b, c, and d) indicate significant differences (p < 0.05).
Figure 4.
Comparisons of Cr(VI) 100, 200, and 400 mg/L removal by MSB from different pyrolytic temperatures at pH 2.0. The error bars marked with different letters (a, b, c, and d) indicate significant differences (p < 0.05).

Figure 5.
Effect of pH on the concentrations of Cr(VI), Cr(III), and total Cr remaining in the solution after Cr(VI) adsorption on MSB300 (initial Cr(VI) 25mg/L, 48 h reaction) (a), Cr(VI) and total Cr removal efficiency in different initial pH (b), comparison between the initial and equilibrium pH after the reaction (c), simulated result of the distribution of Cr(VI) species by Visual MINTEQ 3.1 software (d). The effect of pH on Cr(III) removal by MSB300 (initial Cr(III) 25 mg/L) (e). The redox potential (Eh) before and after reaction with Cr(VI) (initial Cr(VI) 25mg/L) (f).

Figure 6.
The concentrations variation of Cr(VI), Cr(III), and total Cr by MSB300 with initial concentration of Cr(VI) of 25 mg/L (a) and 50mg/L (b) at pH 2.0. The redox potential (Eh) variation during Cr(VI) removal by MSB300 (c).
Figure 6.
The concentrations variation of Cr(VI), Cr(III), and total Cr by MSB300 with initial concentration of Cr(VI) of 25 mg/L (a) and 50mg/L (b) at pH 2.0. The redox potential (Eh) variation during Cr(VI) removal by MSB300 (c).

Figure 7.
Effect of temperature on removal efficiency of Cr(VI) 100 mg/L by MSB300 (a), and effect of high salinity on removal efficiency of Cr(VI) 100 mg/L by MSB300 (b).
Figure 7.
Effect of temperature on removal efficiency of Cr(VI) 100 mg/L by MSB300 (a), and effect of high salinity on removal efficiency of Cr(VI) 100 mg/L by MSB300 (b).

Figure 8.
Energy dispersive X-ray (EDX) analysis of MSB300 before (a) and after reaction (b).

Figure 9.
FTIR spectra of MSB before and after reaction with 200 mg/L Cr(VI) for 48 h at pH 2.0.

Figure 10.
XPS spectra of Cr 2p for MSB300 after Cr(VI) reaction.


Table 1.
Physio-chemical properties of maize straw biochars (MSB) pyrolyzed at 300, 400, 500, and 600 °C.
Table 1.
Physio-chemical properties of maize straw biochars (MSB) pyrolyzed at 300, 400, 500, and 600 °C.
| Biochar | pH | EC (mS/cm) | Redox Potential (mV) | pHpzc | Ash (%) | Elemental Composition | Atomic Ratio | Surface Area (m2/g) | Pore Size (nm) | Pore Volume (cm3/g) | ||||||
|---|---|---|---|---|---|---|---|---|---|---|---|---|---|---|---|---|
| C (%) | H (%) | O (%) | N (%) | S (%) | H/C | (O + N)/C | O/C | |||||||||
| MSB300 | 7.4 | 1.75 | 47 | 7.9 | 50.5 | 24.14 | 2.25 | 20.93 | 2.19 | 0.96 | 1.12 | 0.81 | 0.65 | 10.3 | 13.7 | 0.034 |
| MSB400 | 9.1 | 1.53 | 34 | 9.2 | 57.9 | 25.85 | 1.68 | 14.83 | 1.91 | 1.16 | 0.78 | 0.56 | 0.43 | 17.1 | 11.5 | 0.047 |
| MSB500 | 9.4 | 1.10 | 33 | 9.5 | 63.4 | 22.08 | 0.99 | 12.94 | 1.41 | 0.97 | 0.54 | 0.55 | 0.44 | 24.5 | 13.9 | 0.065 |
| MSB600 | 10.1 | 0.76 | 53 | 9.3 | 67.9 | 26.44 | 0.68 | 9.54 | 1.46 | 0.99 | 0.31 | 0.37 | 0.27 | 31.1 | 9.0 | 0.062 |
Table 2.
The parameters of the Langmuir and Freundlich models of Cr(VI) adsorption.
| Absorbents | Langmuir | Freundlich | |||||
|---|---|---|---|---|---|---|---|
| qmax (mg/g) | qmax (mmol/g) | b (L/mg) | R2 | kf (mg1−n·Ln/g) | 1/n | R2 | |
| MSB300 | 91 ± 6 | 1.8 | 0.24 | 0.98 | 29.53 | 0.23 | 0.93 |
| MSB400 | 63 ± 3 | 1.2 | 0.73 | 0.99 | 30.22 | 0.16 | 0.83 |
| MSB500 | 42 ± 1 | 0.8 | 0.26 | 0.98 | 16.09 | 0.16 | 0.95 |
| MSB600 | 27 ± 3 | 0.5 | 0.12 | 0.99 | 0.14 | 0.82 | 0.96 |
Table 3.
Comparison of the maximum adsorption capacities of Cr(VI) on MSB300 with other biochars.
| Absorbents | Maximum Adsorption Capacity (mg/g) | Best Fit Isotherm | Reference |
|---|---|---|---|
| sugar beet tailing biochar | 123 | Langmuir | Dong et al., 2011 [13] |
| Enteromorpha prolifera biochar | 88.17 | Langmuir | Chen et al., 2018 [8] |
| ramie residue biochar | 82.23 | Langmuir | Zhou et al., 2016 [1] |
| sewage sludge biochar | 64.1 | Langmuir | Agrafioti et al., 2014 [24] |
| coconut coir biochar | 31.1 | Langmuir | Shen et al., 2012 [16] |
| wood biochar | 25.27 | Langmuir | Zhang et al., 2018 [2] |
| wheat straw biochar | 24.6 | Langmuir | Tytlak et al., 2015 [25] |
| wicker biochar | 23.6 | Langmuir | Tytlak et al., 2015 [25] |
| MSB300 | 91 | Langmuir | This study |
Table 4.
The parameters of pseudo-first-order and pseudo-second-order (k1 and k2 are the rate constants for the pseudo-first-order and pseudo-second-order).
Table 4.
The parameters of pseudo-first-order and pseudo-second-order (k1 and k2 are the rate constants for the pseudo-first-order and pseudo-second-order).
| Initial Concentration (mg/L) | Pseudo-Second Order | Pseudo-First Order | ||||
|---|---|---|---|---|---|---|
| qe (mg/g) | k2 (g/mg·h) | R2 | qe (mg/g) | k1 (1/h) | R2 | |
| 25 | 6.5 | 0.04 | 0.99 | 5.0 | 0.1 | 0.91 |
| 50 | 12.7 | 0.02 | 0.99 | 8.3 | 0.1 | 0.98 |
© 2019 by the authors. Licensee MDPI, Basel, Switzerland. This article is an open access article distributed under the terms and conditions of the Creative Commons Attribution (CC BY) license (http://creativecommons.org/licenses/by/4.0/).
Share and Cite
MDPI and ACS Style
Wang, H.; Zhang, M.; Lv, Q. Removal Efficiency and Mechanism of Cr(VI) from Aqueous Solution by Maize Straw Biochars Derived at Different Pyrolysis Temperatures. Water 2019, 11, 781. https://doi.org/10.3390/w11040781
AMA Style
Wang H, Zhang M, Lv Q. Removal Efficiency and Mechanism of Cr(VI) from Aqueous Solution by Maize Straw Biochars Derived at Different Pyrolysis Temperatures. Water. 2019; 11(4):781. https://doi.org/10.3390/w11040781
Chicago/Turabian StyleWang, Haixia, Mingliang Zhang, and Qi Lv. 2019. "Removal Efficiency and Mechanism of Cr(VI) from Aqueous Solution by Maize Straw Biochars Derived at Different Pyrolysis Temperatures" Water 11, no. 4: 781. https://doi.org/10.3390/w11040781
Note that from the first issue of 2016, this journal uses article numbers instead of page numbers. See further details here.