Optimised Triangular Weir Design for Assessing the Full-Scale Performance of Green Infrastructure


1
Department of Civil and Environmental Engineering, Imperial College London, London SW7 2AZ, UK
2
Thames Water Utilities Limited, Reading RG2 0RP, UK
*
Author to whom correspondence should be addressed.
Water 2019, 11(4), 773; https://doi.org/10.3390/w11040773
Submission received: 12 March 2019
/
Revised: 10 April 2019
/
Accepted: 12 April 2019
/
Published: 14 April 2019
(This article belongs to the Section Urban Water Management)
Abstract
:Conventional triangular weirs have been originally developed to measure, divert, and control surface water. However, a special application of these weirs, such as for low flow measurements in full-scale monitoring of Green Infrastructure (GI), is not well investigated. Available head-discharge relationships for triangular sharp-crested weirs are only valid under a free-flow regime. Literature focusing on the V-notch weir usage for GI assessment suggests that it is necessary to calibrate the head-discharge relationship before its use. This study focuses on understanding the effects of site constraints on the measurement performance of a V-notch weir at low flow rates, and the validity of equations derived for similar applications that can be found in the literature. The variation of discharge coefficient in various flow regimes was investigated experimentally based on calibration runs covering flow rates between 0.054 l/s and 7 l/s. The results show that for 30° and 45° V-notch weirs, three flow regimes can be identified. It was observed that literature equations to calculate the discharge coefficient are valid for partially-contracted triangular weirs only at heads greater than vertex distance from the channel. However, for low flows that are expected to occur when estimating the full-scale performance of GI, the equations available from the literature for similar site conditions underestimated the flow rate between 85% and 17%. This emphasises the need for accurate calibration of a V-notch device under the site conditions to achieve the necessary level of accuracy in GI performance estimation. The procedure outlined in this work can be easily replicated to determine the optimal monitoring system configuration. Alternatively, if the site conditions would match those described in this study, the computed discharge using the proposed relations, in combination with the general V-notch weir equation, provides a significant improvement in the accuracy of measurements, expands the head applicability range of V-notch weirs, and enables better understanding of GI performance at the full scale.
1. Introduction
Most of the urban areas in the world are drained through an old combined sewerage system constructed more than 50 years ago, with some water infrastructure being more than 100 years old, such as the combined sewerage system draining central London [1]. This type of system proved to be adequate in the past; however, due to the more rapid urbanisation in the last few decades and greater interest in managing stormwater flows to maintain environmental quality [2], the standards of performance expected to be delivered by the conventional drainage systems have become much higher than when they were first built [3]. Contemporary surface water management systems need to simultaneously deliver flood risk control, pollution control and dynamic urban area enhancements [4]. To meet the quality of life expectations of citizens and to cope with climate change and urban growth pressures, new interventions in the drainage systems are being implemented. Such interventions are based on maximising the opportunities and benefits that can be obtained from mimicking the natural drainage processes of an area [5].
Green Infrastructure (GI) technologies have gained popularity as a cost-effective and multi-beneficial alternative to stormwater management in new developments [6]. However, to achieve the level of water storage comparable to pipe systems, GI have to be implemented at a wider scale by retrofitting existing urban environments through cross-sectoral partnerships [7]. To enable that, it is necessary to assess the full-scale performance of GI retrofits, for which the data are very scarce due to resource limitation and the amount of effort needed to set a monitoring campaign [8,9]. Another limitation related to the hydrological monitoring programs of GI components is site constraints, for which conventional monitoring instruments become inapplicable [10].
To address the need of decision makers for the full-scale performance evaluation of GI to promote their uptake, the aim of this study is to highlight the importance of calibrating the hydrological monitoring devices whenever deployed in site-specific applications to evaluate the full-scale performance of GI technologies retrofitted into existing highly congested urban areas.
2. Materials and Methods
2.1. GI Monitoring: State of the Art
The number of literature studies that focused on the successful full-scale monitoring of GI technologies is rather limited. By evaluating 25 selected publications, it was possible to classify GI monitoring programs into three clusters (Table 1) according to the type of monitoring method used.
The V-notch weir was used in 14 out of the 19 case studies that implemented rating curves of hydraulic control structures to calculate the outflow from GI devices. Flow meters were not commonly used in such application due to the low range of the outflow rate that falls outside the performance polygons of common flowmeters, which impacts the accuracy of measurements [26]. Developing models to determine the outflow rating curve was commonly used on large scale projects, but this method requires more expertise and data to calibrate and validate the model.
LeFevre et al. [33] evaluated different flow measuring techniques for the application in GI performance monitoring where they found that the depth measurement associated with a rating curve is the best method to apply. However, in most cases, manufacturer rating curves of weirs and flumes were used without checking their validity for the conditions of the project where they have been implemented. Only two out of the 25 studies listed in Table 1 calibrated the apparatus before use. Collins et al. [12] calibrated a 30° V-notch weir, where they found that the rating curve determined (Flow range: 0.023 l/s to 6.536 l/s) was significantly different from the standard rating curve at head values less than 60 mm, so they used their rating curve for the GI performance assessment at such low heads. In another study, Cording et al. [26] had to customise and calibrate a weir box to measure small flow rates out of a bioretention cell. Therefore, in any site-specific application of measuring instruments, such as in GI retrofit projects, it is highly important to check the calibration of the prospective equipment before its use.
2.2. Weir Design for GI Full-Scale Performance Assessment
Weirs have long been known for their adequacy to measure, divert and control the flow in open channels [36]. Characterisation of the water flow over weirs can be found in many studies in the literature, such as Kindsvater and Carter [37], Ackers et al. [38], Bos [39], Montes [40], Finnemore and Franzini [41], and Chanson [36]. Regarding the specifications and installation guidelines of weirs for flow measurement, thorough and full explanation can be found in international standards, such as the British Standards Institution [42], the International Organization for Standardization [43], the American Society for Testing Materials [44], and the United States Bureau of Reclamation [45].
The V-notch or triangular sharp-crested weir is one of the most suitable flow measurement devices, especially when accurate measurements of low flow rates are needed [46,47]. Its accuracy generally improves as the difference between head loss values for given flows increases. Hence, sharper V-notch angles result in more accurate measurements of a flow rate. However, as demonstrated by Aydin et al. [47], the V-notch weir is not the best option when measuring extremely low flow rates. The silt weir was found to be more sensitive to flow changes than V-notch weir [47], but it is not suitable for application in GI performance assessment due to its narrow weir width, which increases the risk of blocking and limits the maximum discharge that can be measured. Therefore, in this study the V-notch sharp-crested weir is considered to be the best option to monitor outflows from GI over a wide range of discharges.
Flow equations for sharp-crested weirs are derived from mathematical integration of element flow strips over the nappe [39]. For triangular weirs, the flow equation is as follows [48]:
where Q is the discharge (m3/s); Cd is the discharge coefficient; g is the gravitational acceleration, 9.81 m/s2; θ is the notch angle (degrees); and h is the head over the weir (m). In this equation, the discharge coefficient (Cd) accounts for the geometric, viscosity, and surface tension effects. The latter two become negligible at high head values or for fully contracted V-notch weirs (i.e., when the approach channel bed and sides are sufficiently far from the edges of the V-notch); therefore, Cd becomes only dependent on the notch angle. However, for h values less than 60 mm [49] or when the V-notch weir is partially contracted, Cd is not constant. Zhang et al. [50] listed some of the classical formulas used to determine Cd and their limitations; they also stated that for clinging flow conditions, such formulas become inapplicable. Although the V-notch sharp-crested weir is often recommended in low flow measurement [50], Kumar et al. [51] showed that even this type of weir may suffer from clinging flow at low heads. The behaviour of sharp-crested weirs at low heads was extensively investigated by Zhang et al. [50], Crookstone and Tullis [52], Swamee et al. [53], and Bagheri et al. [54]. They found that the effects of surface tension and fluid viscosity on the weir performance at low heads can be compensated by correcting the head measurement or the discharge coefficient.
Lenz [55] proposed Cd values for V-notch weirs ranging from 0.577 to 0.617, where he found that the discharge coefficient depends mainly on the notch angle. Other studies discussed in BSI 380: Part 4A [56] and ISO/TC 113/GT2 [57] considered the effects of viscosity and surface tension on Cd values of 90° V-notch weirs. They found that Cd can be expressed as a function of the head over the weir divided by the distance from the bottom of the channel to the notch vertex (h/P).
The Reynolds number (R) is a measure of the relative influence of fluid viscosity expressed as , in which V is the fluid velocity, L is a length, ρ is the mass density and μ is the dynamic viscosity. The Weber number (W) is a measure of the relative influence of surface tension expressed as W = , in which is the coefficient of surface tension of the liquid. In this experiment, R and W can be related to the absolute magnitude of h alone because only one liquid over a limited temperature range is considered. Thus, both Reynold’s number (R) and Weber number (W) can be replaced by h [58].
Rehbock [59] proposed a linear relationship between Cd and h/P as follows:
where a and b are the constants of the linear regression.
Other experimental studies in the literature found that the lower the head over the weir is, the higher the discharge coefficient is [60]. The V-notch weir was extensively investigated by Cone [61], who related Cd to h and the notch side slopes (S); in his equation S = 0.268 for 30° notch. King [62] also performed tests on different notch angles and expressed Cd as a function of h. Later, Greve [63] conducted one of the most extensive investigations of different notch angles and proposed an equation of Cd as a function of notch angle and h. The effect of viscosity and surface tension on weir coefficients were objectives of the experiments made by Lenz [55], who used different fluids at different temperatures. For the purpose of this research, the equation reported is for experiments using only water; for the 30° weir, N = 0.0306, and λ = 0.575 where N and λ are empirical constants dependent on the notch angle only. Table 2 summarises the equations of discharge coefficient along with the related reference, and their head applicability range; the reported equations are extracted from experiments conducted on different notch angles—30° specifically.
Given the increased usage of such weir configuration in the monitoring of urban drainage systems (Table 1) and considering the anticipated low head values to be measured (below the ranges listed in Table 2), it is, therefore, necessary to evaluate the performance of a partially-contracted sharp-crested V-notch weir with acute vertex angle at such heads and propose formulas to compute Cd at different flow regimes. This will expand the lower bound of the measurement range of the V-notch weir and broaden its applications.
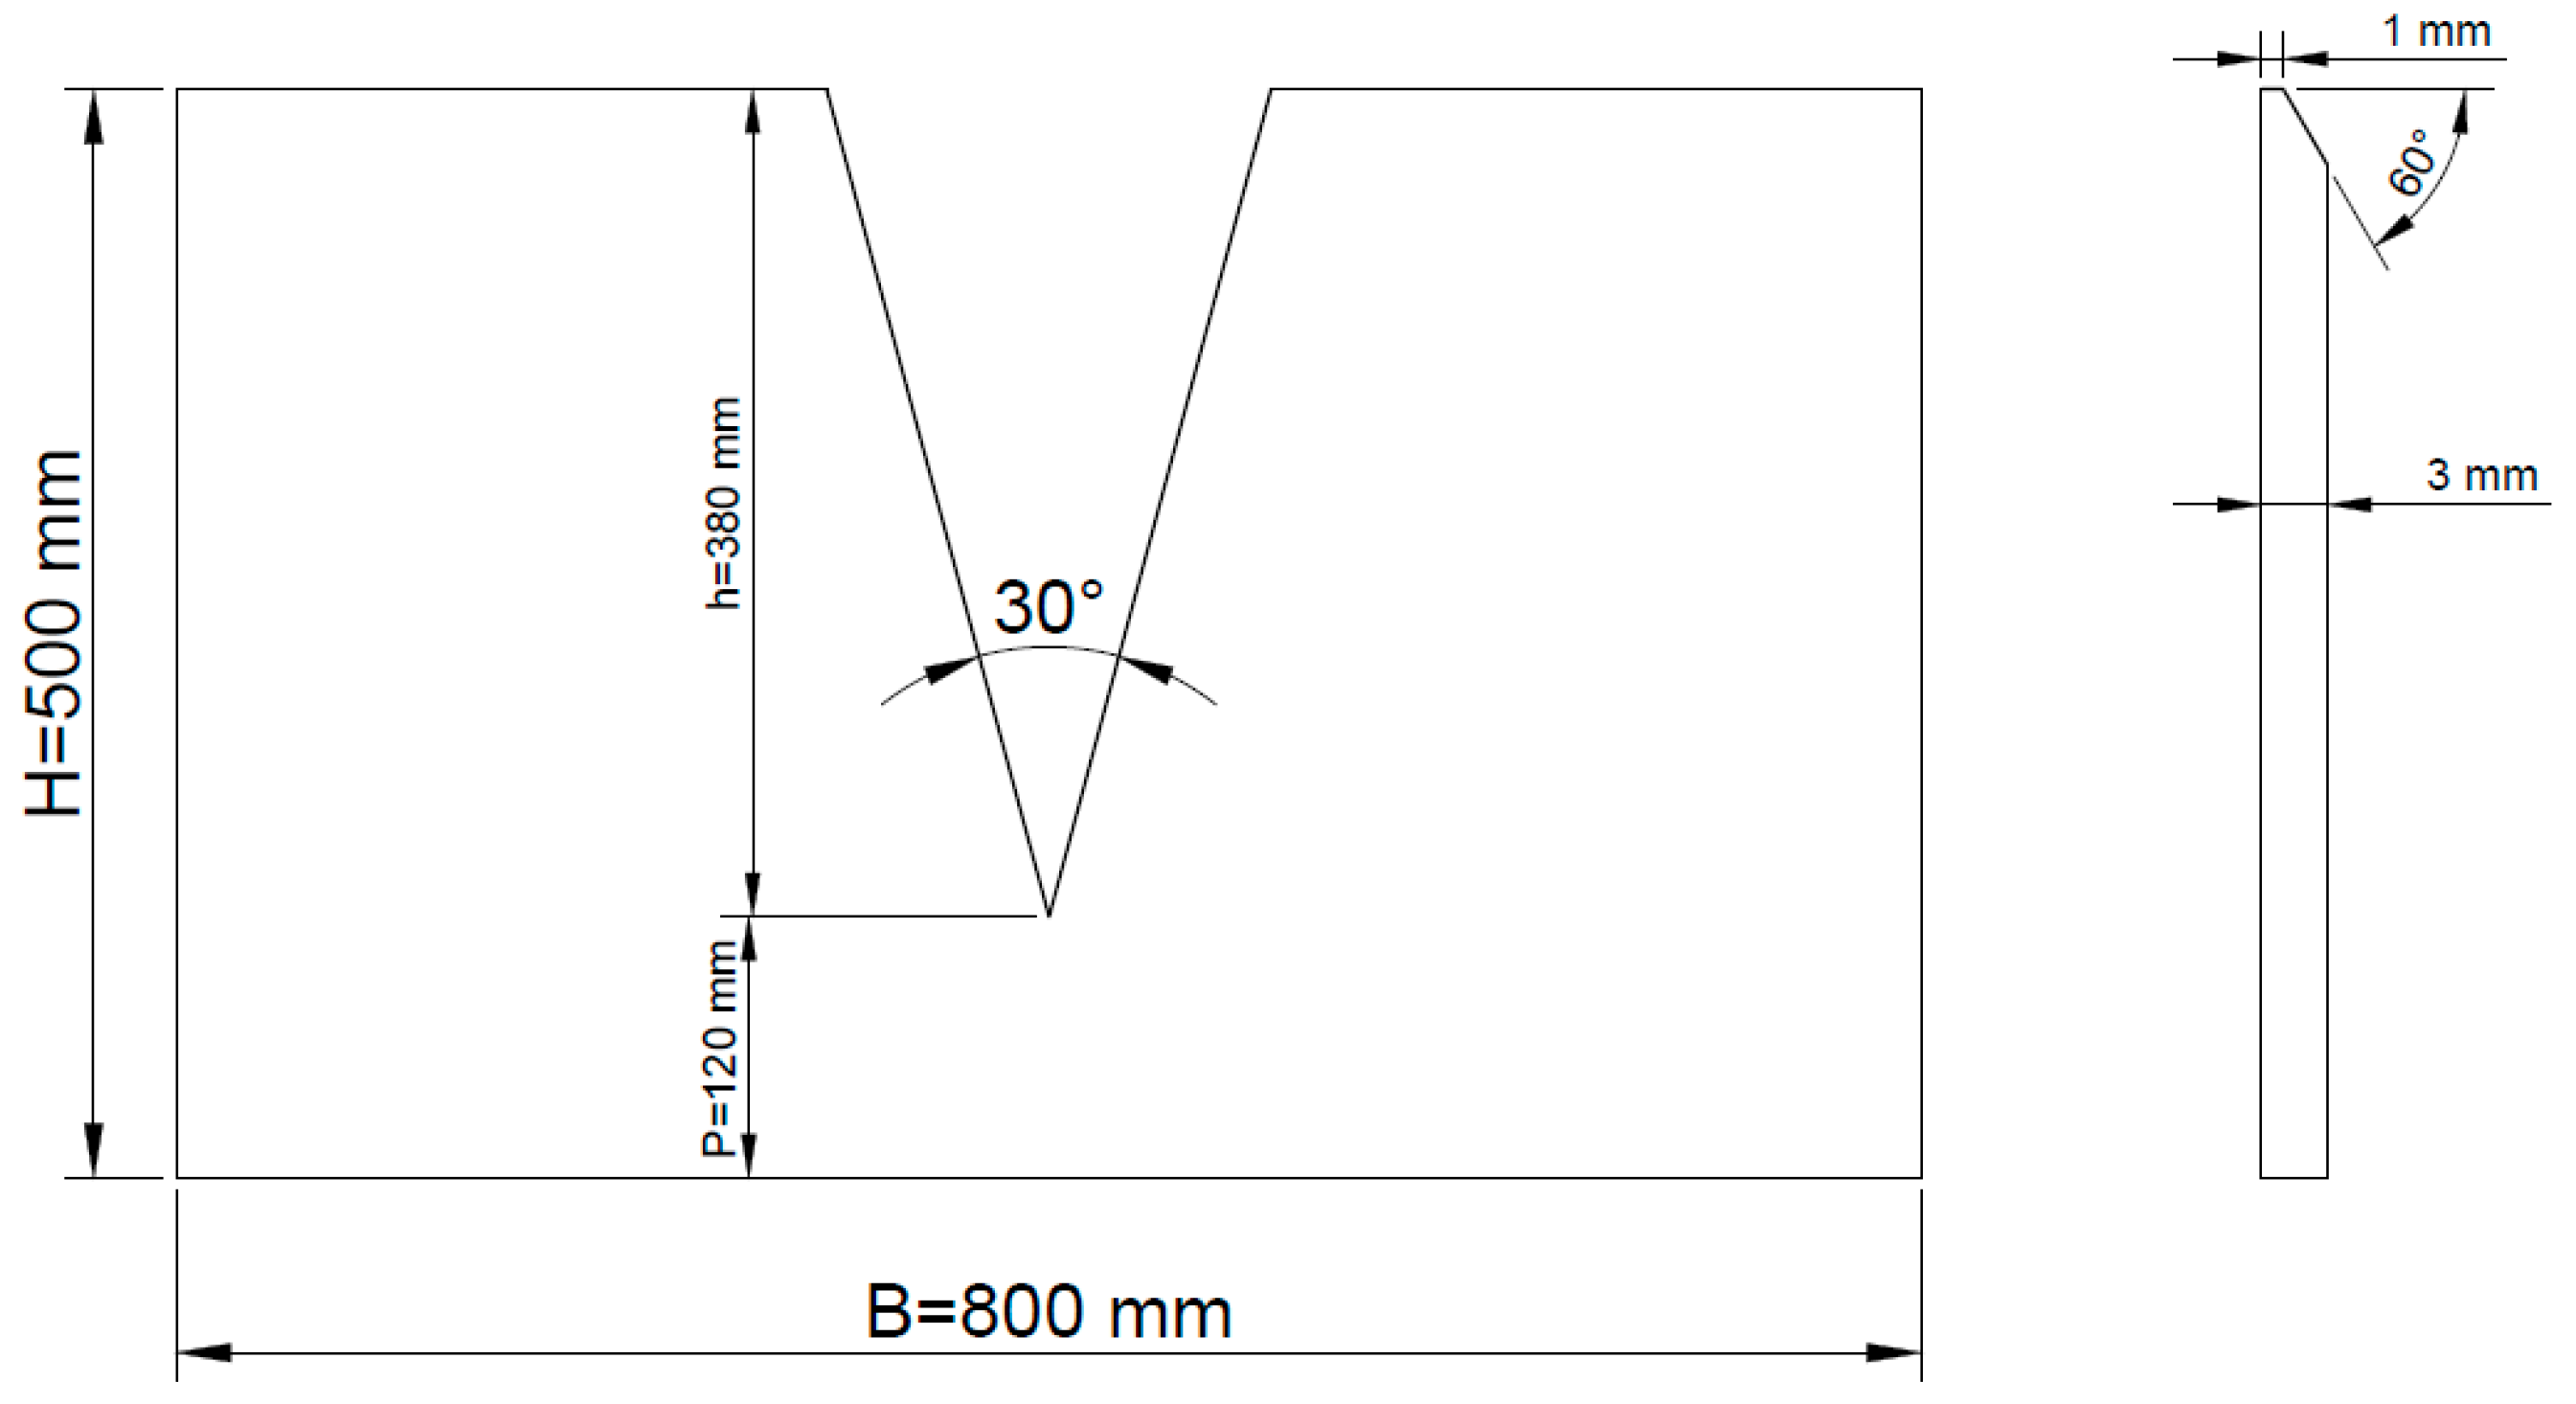
The V-notch weir considered in this study is designed to be installed in confined spaces, such as underground chambers, to measure the outflow from GI devices. Typical underground chambers cover the range from 1200 mm to 1850 mm in diameter, and the distance from the inlet pipe invert to the chamber floor level is smaller than the dimension required to develop fully-contracted conditions, as detailed in Figure 1.
2.3. Experimental Facility
Since the underground chamber in which the V-notch weir will be located does not meet the conditions on which the literature equations of the head-discharge relationships were derived, and knowing that the sensitivity of the weir would greatly depend on the approach channel conditions [64], it was, therefore, necessary to calibrate the designed weir before use.
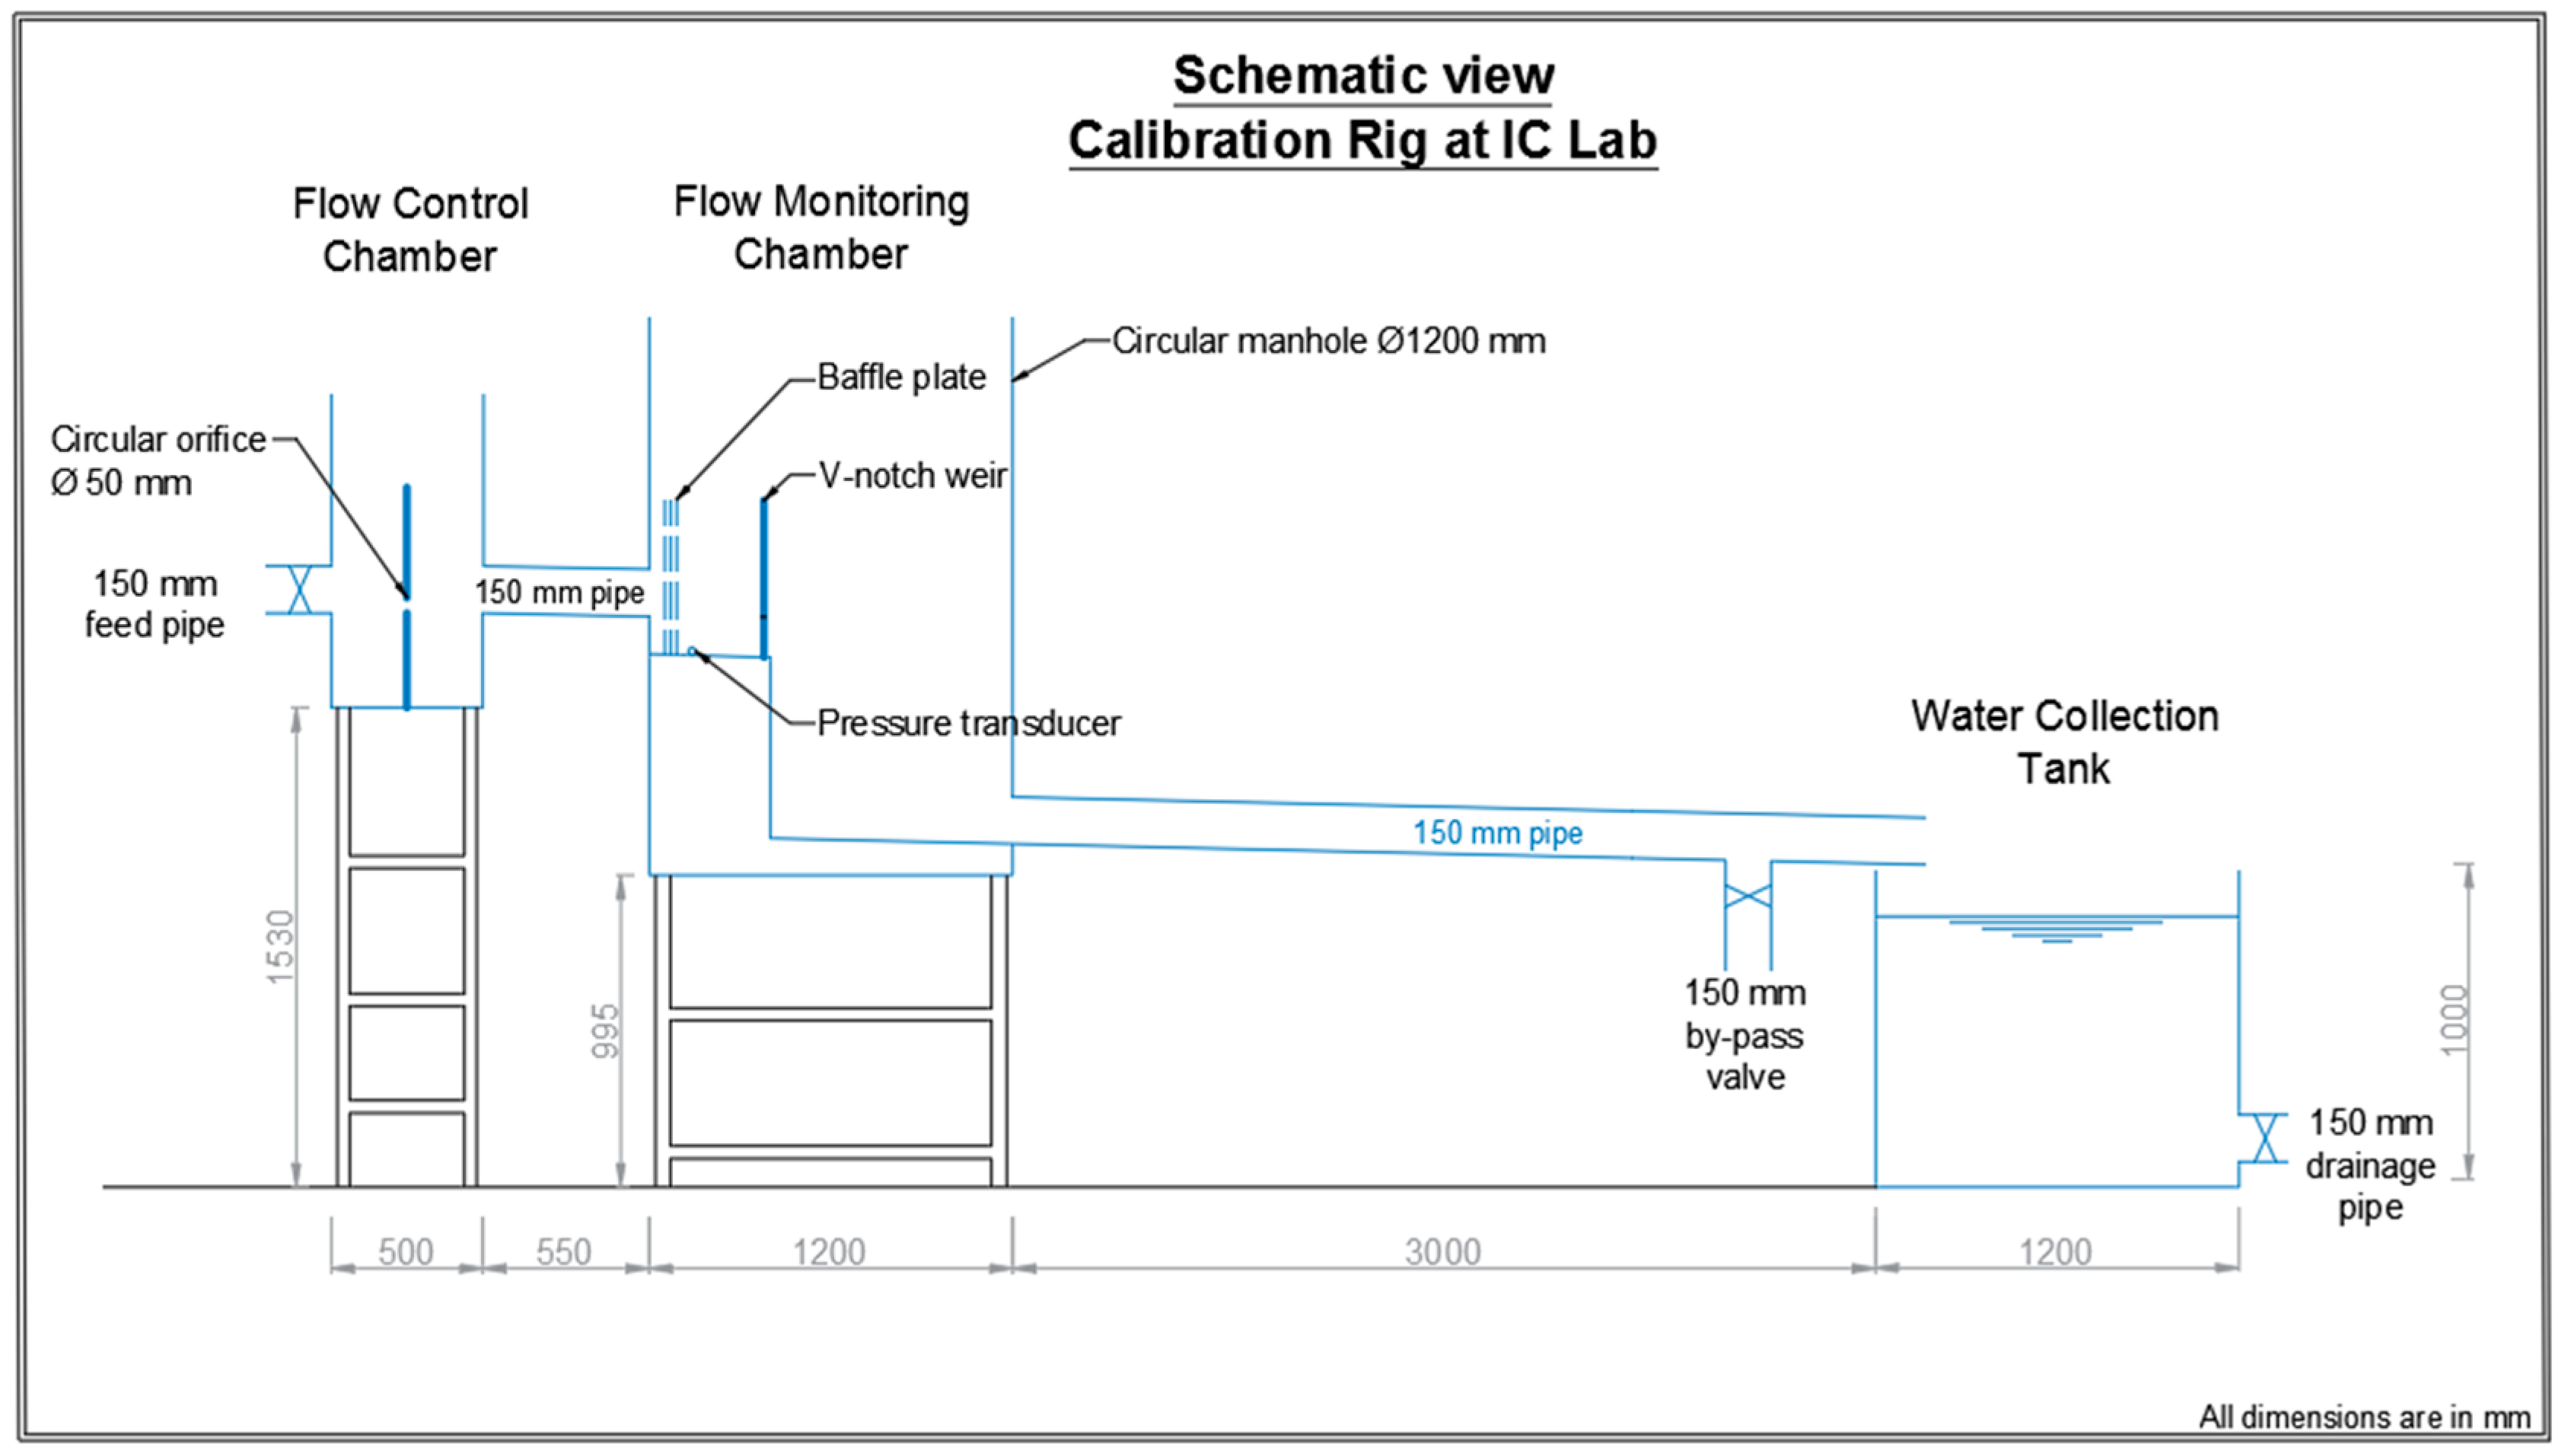
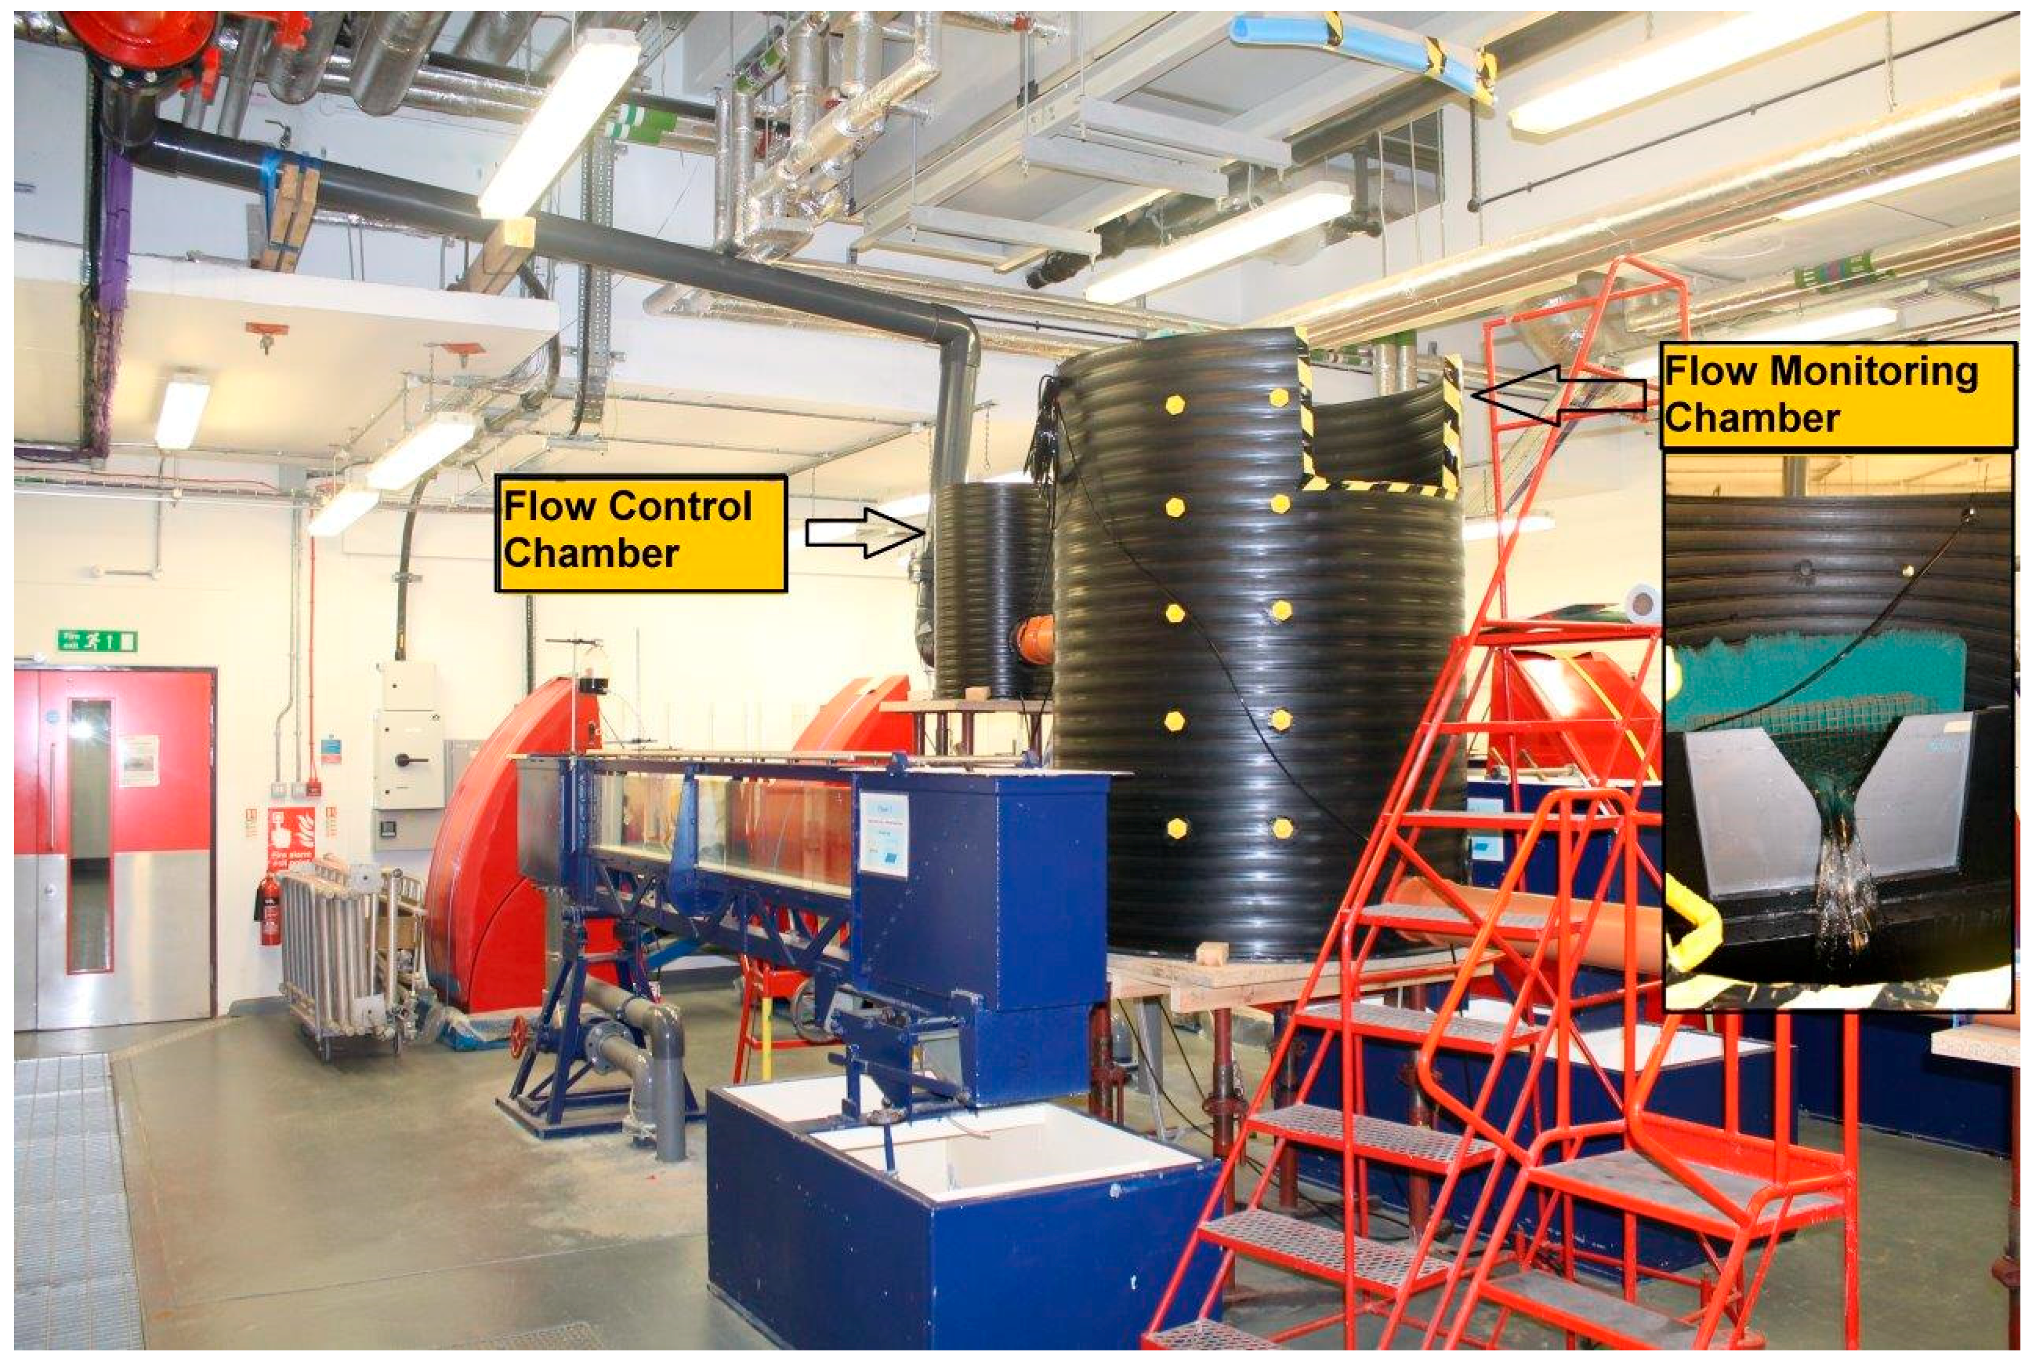
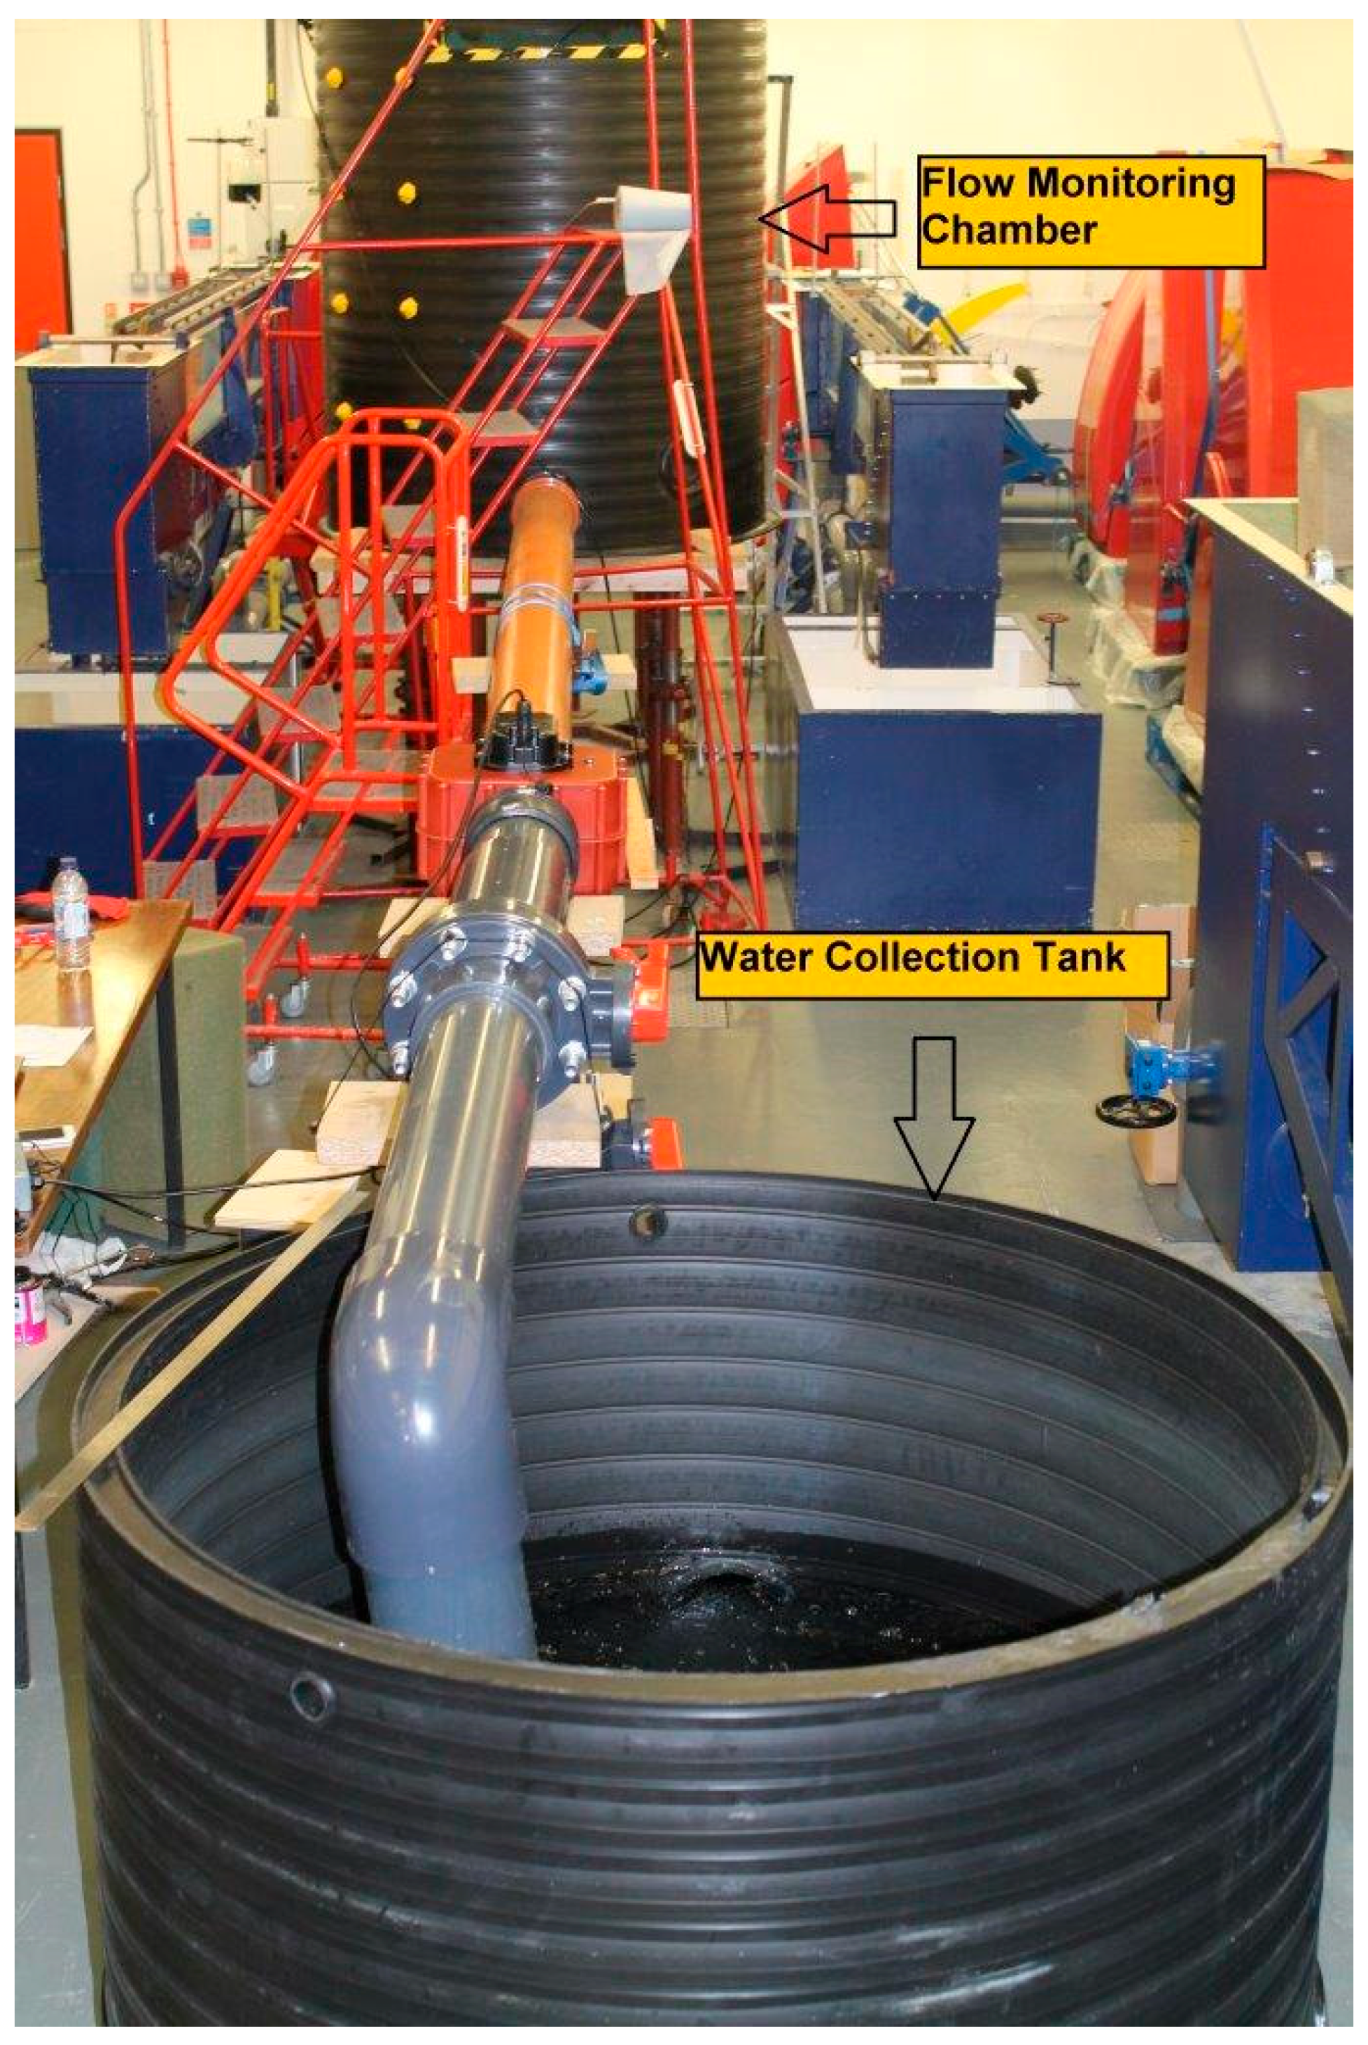
A calibration rig (Figure 2) mimicking the exact site scale and conditions was set-up in the Fluid Mechanics Laboratory of the Department of Civil and Environmental Engineering at Imperial College London, South Kensington campus [65]. The weir was made of a 3 mm-thick stainless steel (Grade 304 L) plate with a crest thickness of 1 mm, and the downstream edge bevelled to a 60° angle to avoid the overflow nappe clinging to the downstream face of the weir plate [39]. The V-notch weir was installed perpendicular to the sides and bottom on a plinth inside a plastic 1200 mm diameter chamber (Figure 3). The water supply was controlled by a manual gate valve in the inlet pipe. This valve allowed one to finely change the flow rate from low to high and vice versa. The header tank supplying water to the calibration rig was always overflowing through a sump pump (40 HP) with a capacity of 141 l/s. The volumetric flow was measured using a chronometer and a graduated tank (±0.5 mm) with a capacity of 1350 litres and diameter of 1.2 m (Figure 4). A bypass valve was installed in the pipe section connecting the weir chamber and the graduated tank to allow diversion of flow at the end of each calibration run.
The head of water upstream of the weir was measured at four different spots by a GE UNIK 5000 pressure transducer (Range: 0 to 70 mbar; accuracy: ±0.04%). The calibration of the pressure transducer was checked prior to its use, and several times during the calibration runs by cross-checking with tape-measurements.
After the first calibration runs and due to flow turbulence, it was observed that the flow entering the weir chamber must be baffled to maintain a laminar flow regime and a stable water surface to minimise the error in head measurement. Accordingly, three layers of perforated stainless-steel meshes were installed in a staggered manner to reduce pulsations and wave actions upstream of the weir.
2.4. Experimental Procedure
Calibration runs were performed in both increasing and decreasing free flow conditions. At least 35 runs were done over the range of flow 0.05 l/s to 7 l/s, with about 20 runs at flow rates less than 1 l/s. The flow was initially set at the minimum possible rate controlled by the inlet gate valve, so that clinging flow was fully developed, and then the flow was gradually increased in a manner that the head over the weir was incremented by 3 to 4 mm in each run. For each calibration run, the water was allowed to flow for a sufficient time to allow a steady-state conditions to be established while the discharge valve was open. Then, the discharge valve in the graduated tank was shut-off and time recording started. Once the water reached the maximum level in the graduated tank, the bypass valve was opened, and time recording stopped. A short time was then allowed for the water level in the graduated tank to stabilise and the collected volume was calculated afterwards. Having the volume of water and the time it took for collecting it; the volumetric flow rate was calculated. The entire procedure was repeated three times for each calibration run, and the mean value of volumetric flow and head were obtained by averaging the three readings.
3. Results and Discussions
3.1. Head–Discharge relationship
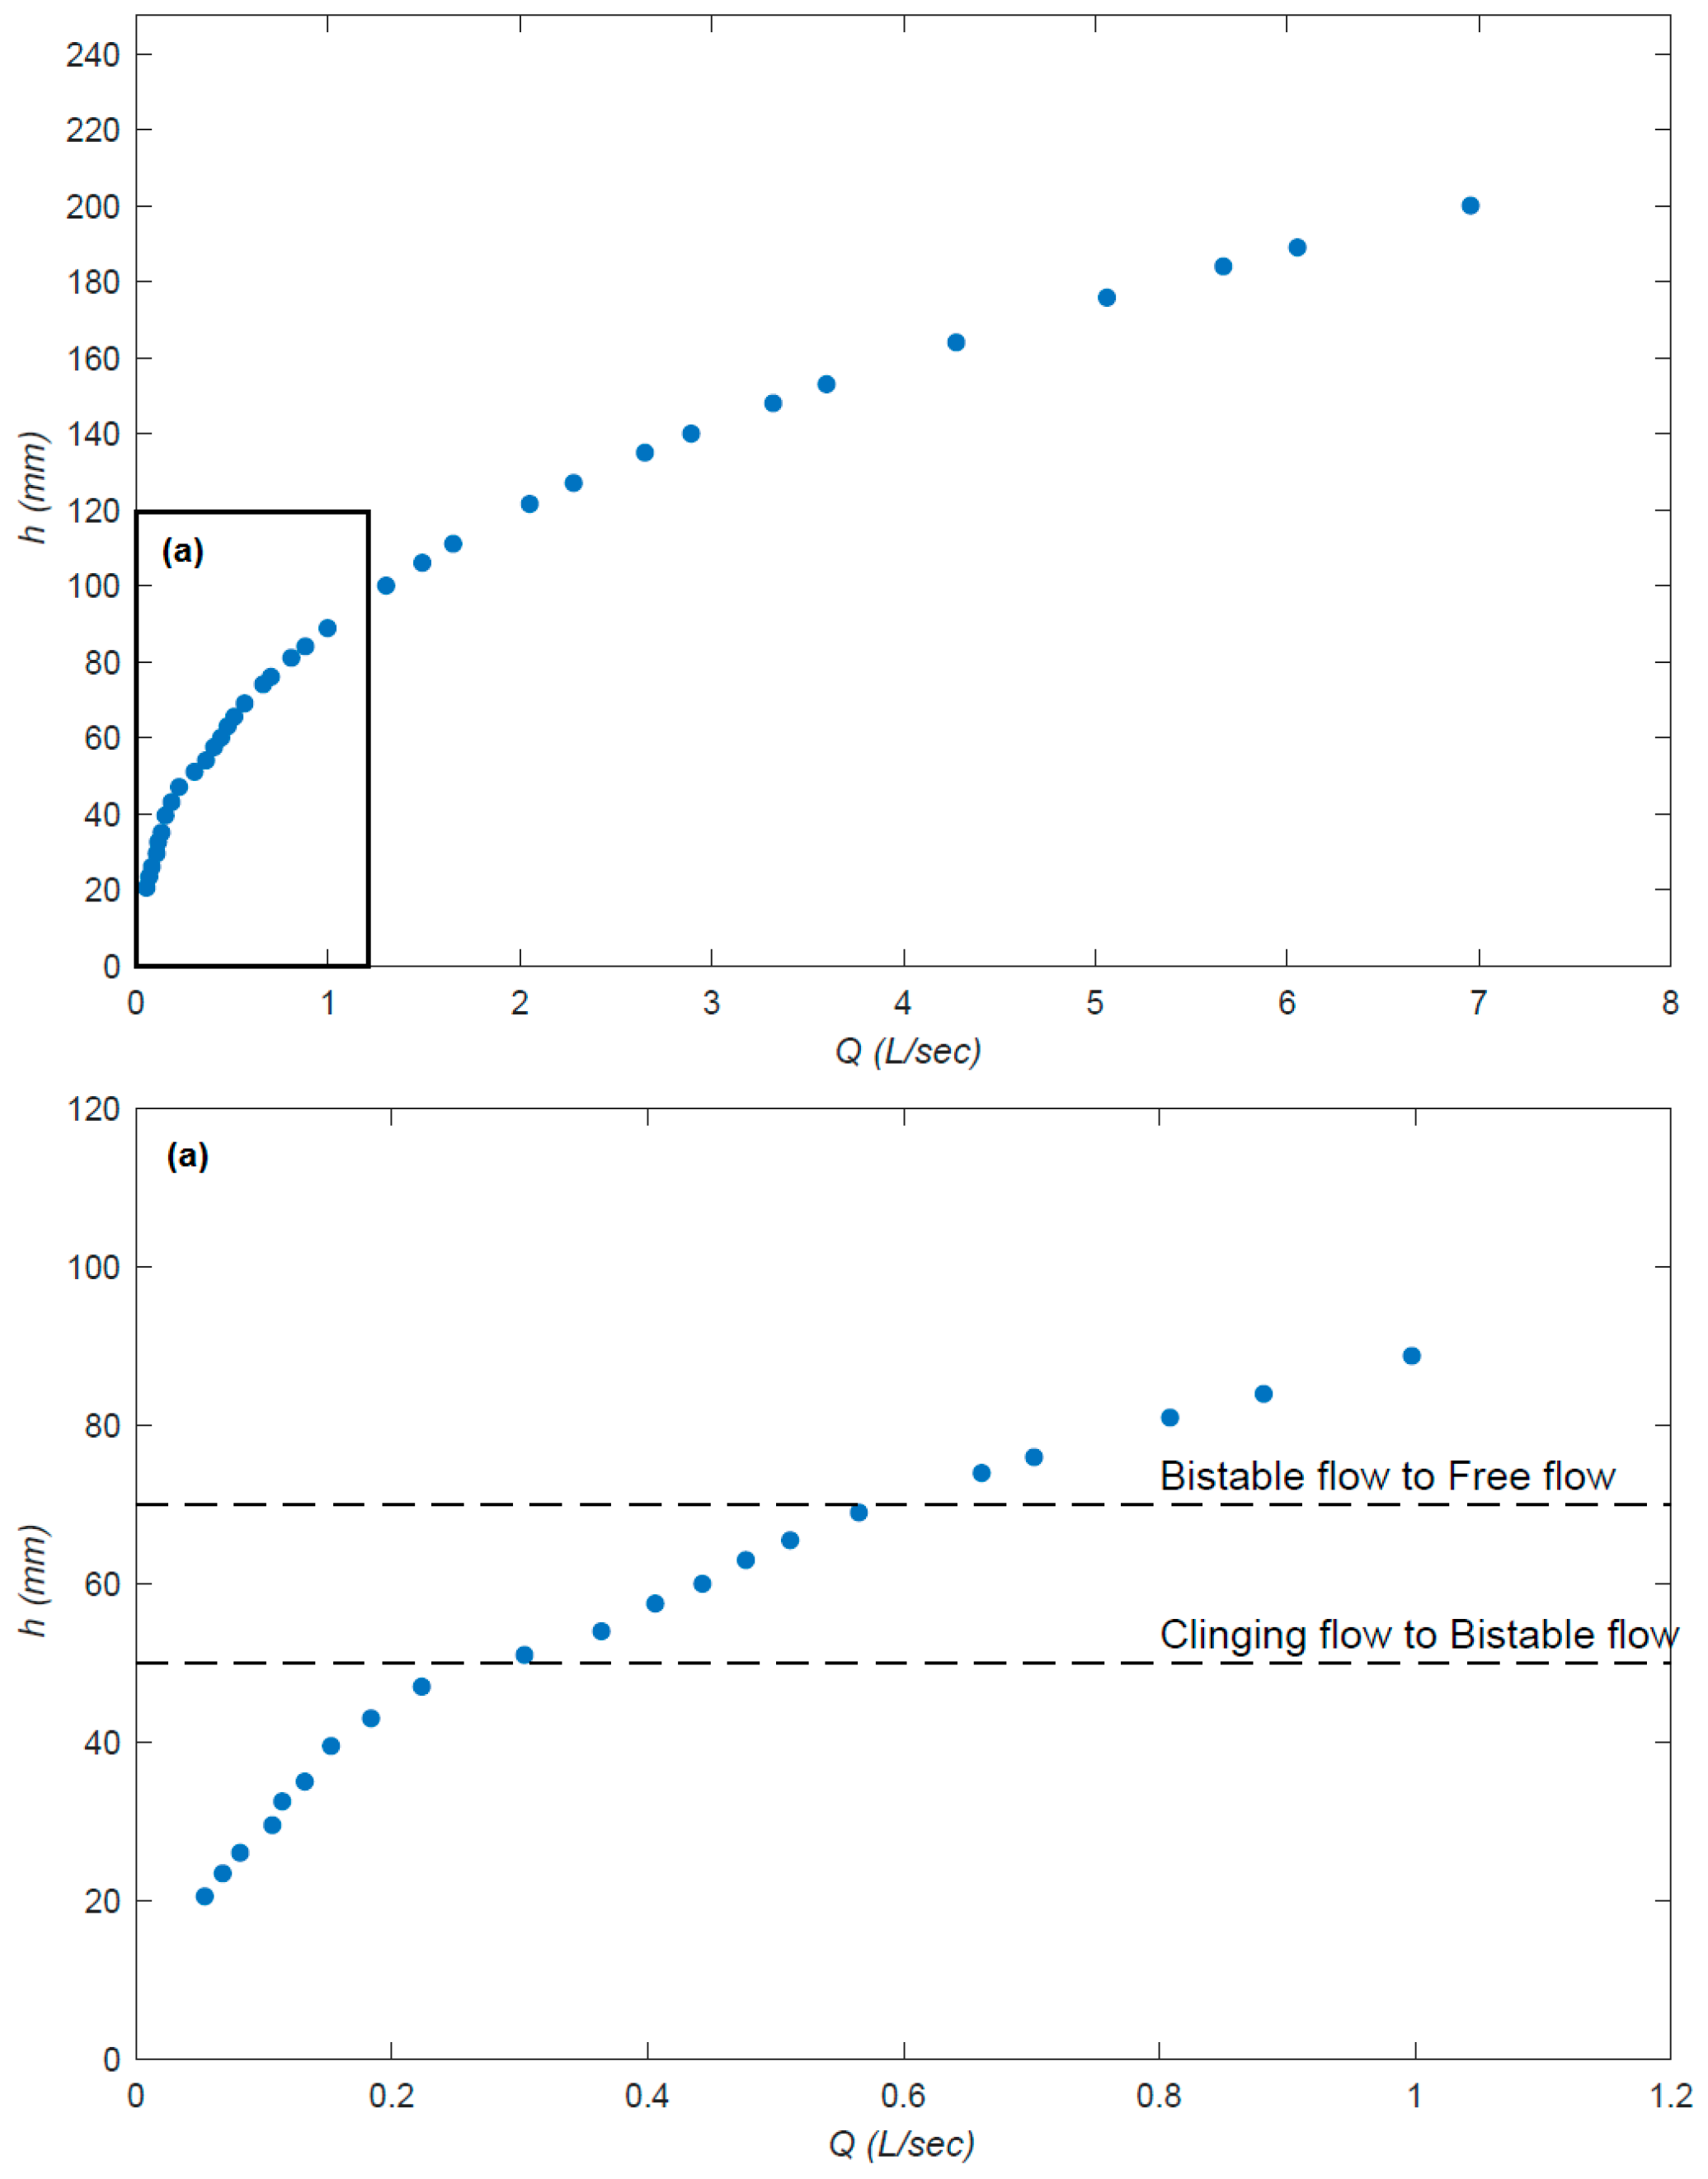
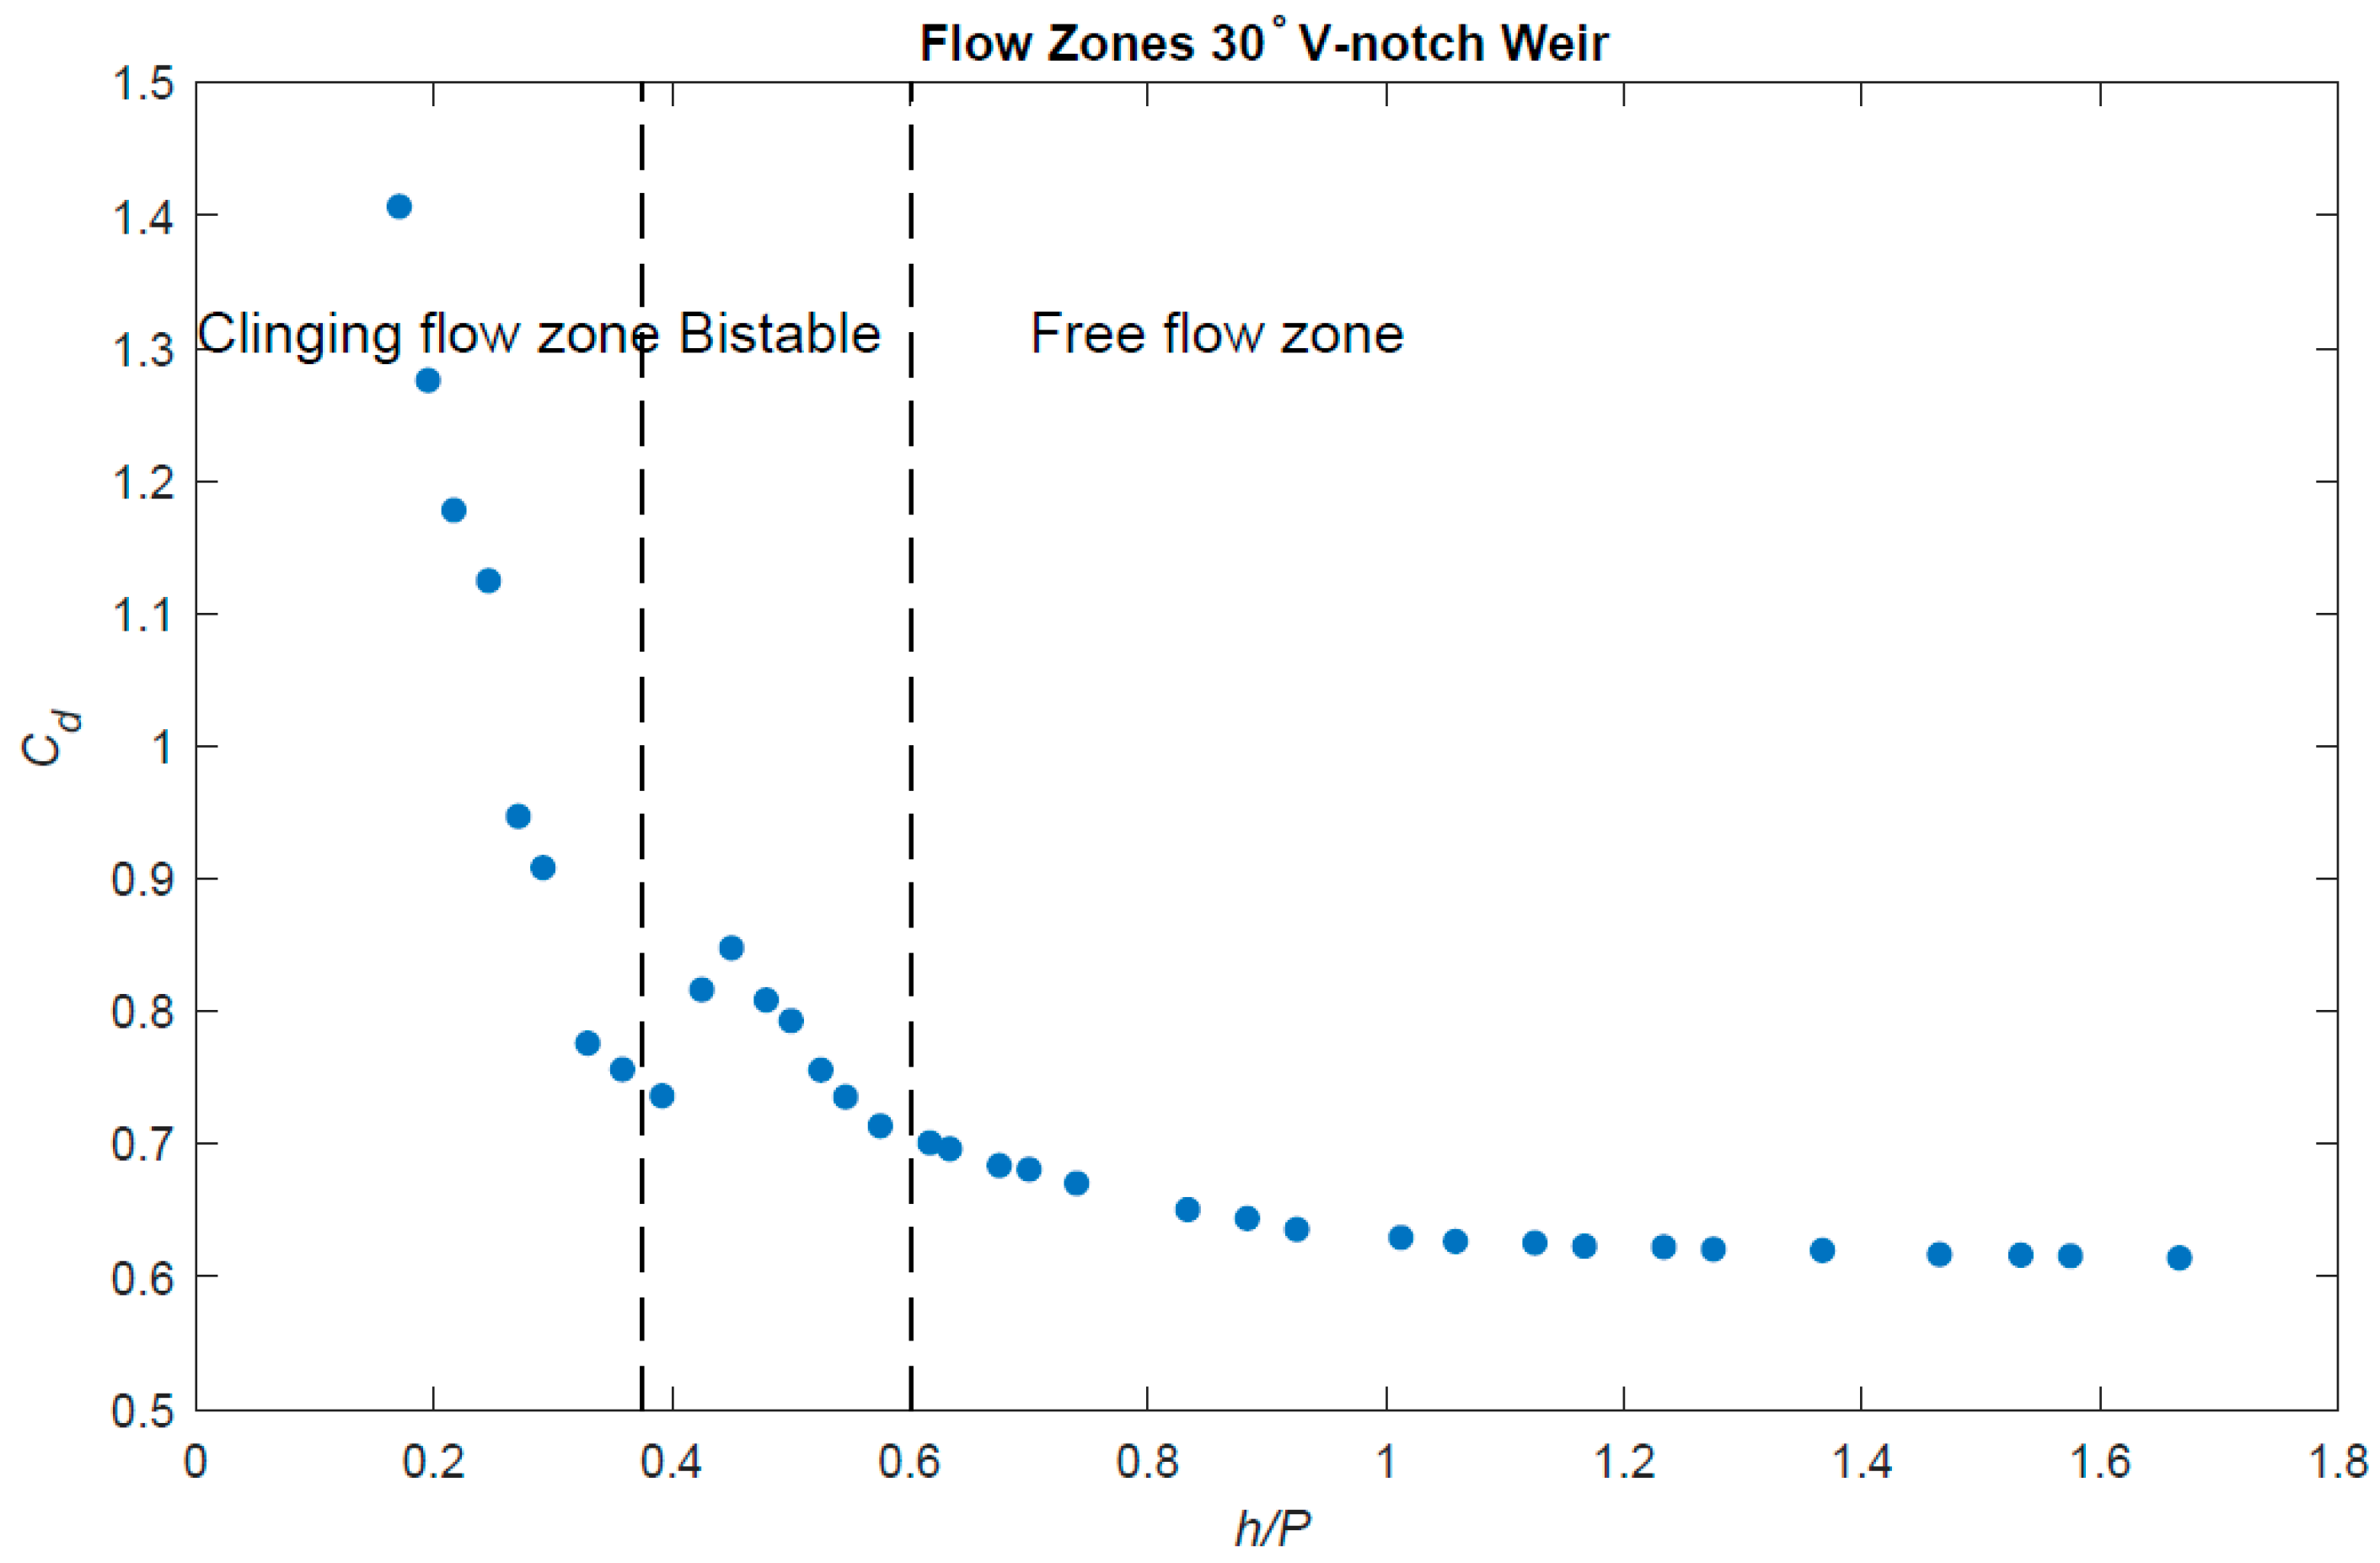
Data collected from the present study was analysed to develop an accurate head–discharge relationship for the partially-contracted sharp-crested triangular weir over a wide range of flow rates. A total of 35 head–discharge observations are shown in Figure 5. Discontinuity is observed in the curve, especially at discharge values less than 1 l/s. To better illustrate this discontinuity, the discharge coefficient (Cd) was calculated using Equation (1) for each pair of head and discharge values and plotted against the ratio h/P [59] in Figure 6.
By analysing the results shown in Figure 6, three different zones can be identified. Cd values exhibit a gradual decrease from around 1.410 at h/P = 0.170 (corresponding to Q = 0.053 l/s) to 0.750 at h/P = 0.358 (corresponding to Q = 0.184 l/s). The rate of decline of Cd with h/P decreases towards the end of the first stage before abruptly increasing to a peak of Cd = 0.856 at h/P = 0.450 (corresponding to Q = 0.363 l/s). The discharge coefficient then decreases at a smaller rate than the decrease rate in the first stage. When the head was further increased, Cd flattened at a value between 0.615 and 0.620 for h/P larger than 1. Therefore, the three flow stages may be classified as shown in Table 3.
The clinging flow regime is when the nappe of water flowing over the weir crest is fully sticking to the downstream side of the weir; the bistable flow regime is when the nappe springs from the weir, like normal free flow, but only some water remains clinging to the weir plate. The free-flow regime is when the water jets over the weir with only a line contact at the crest.
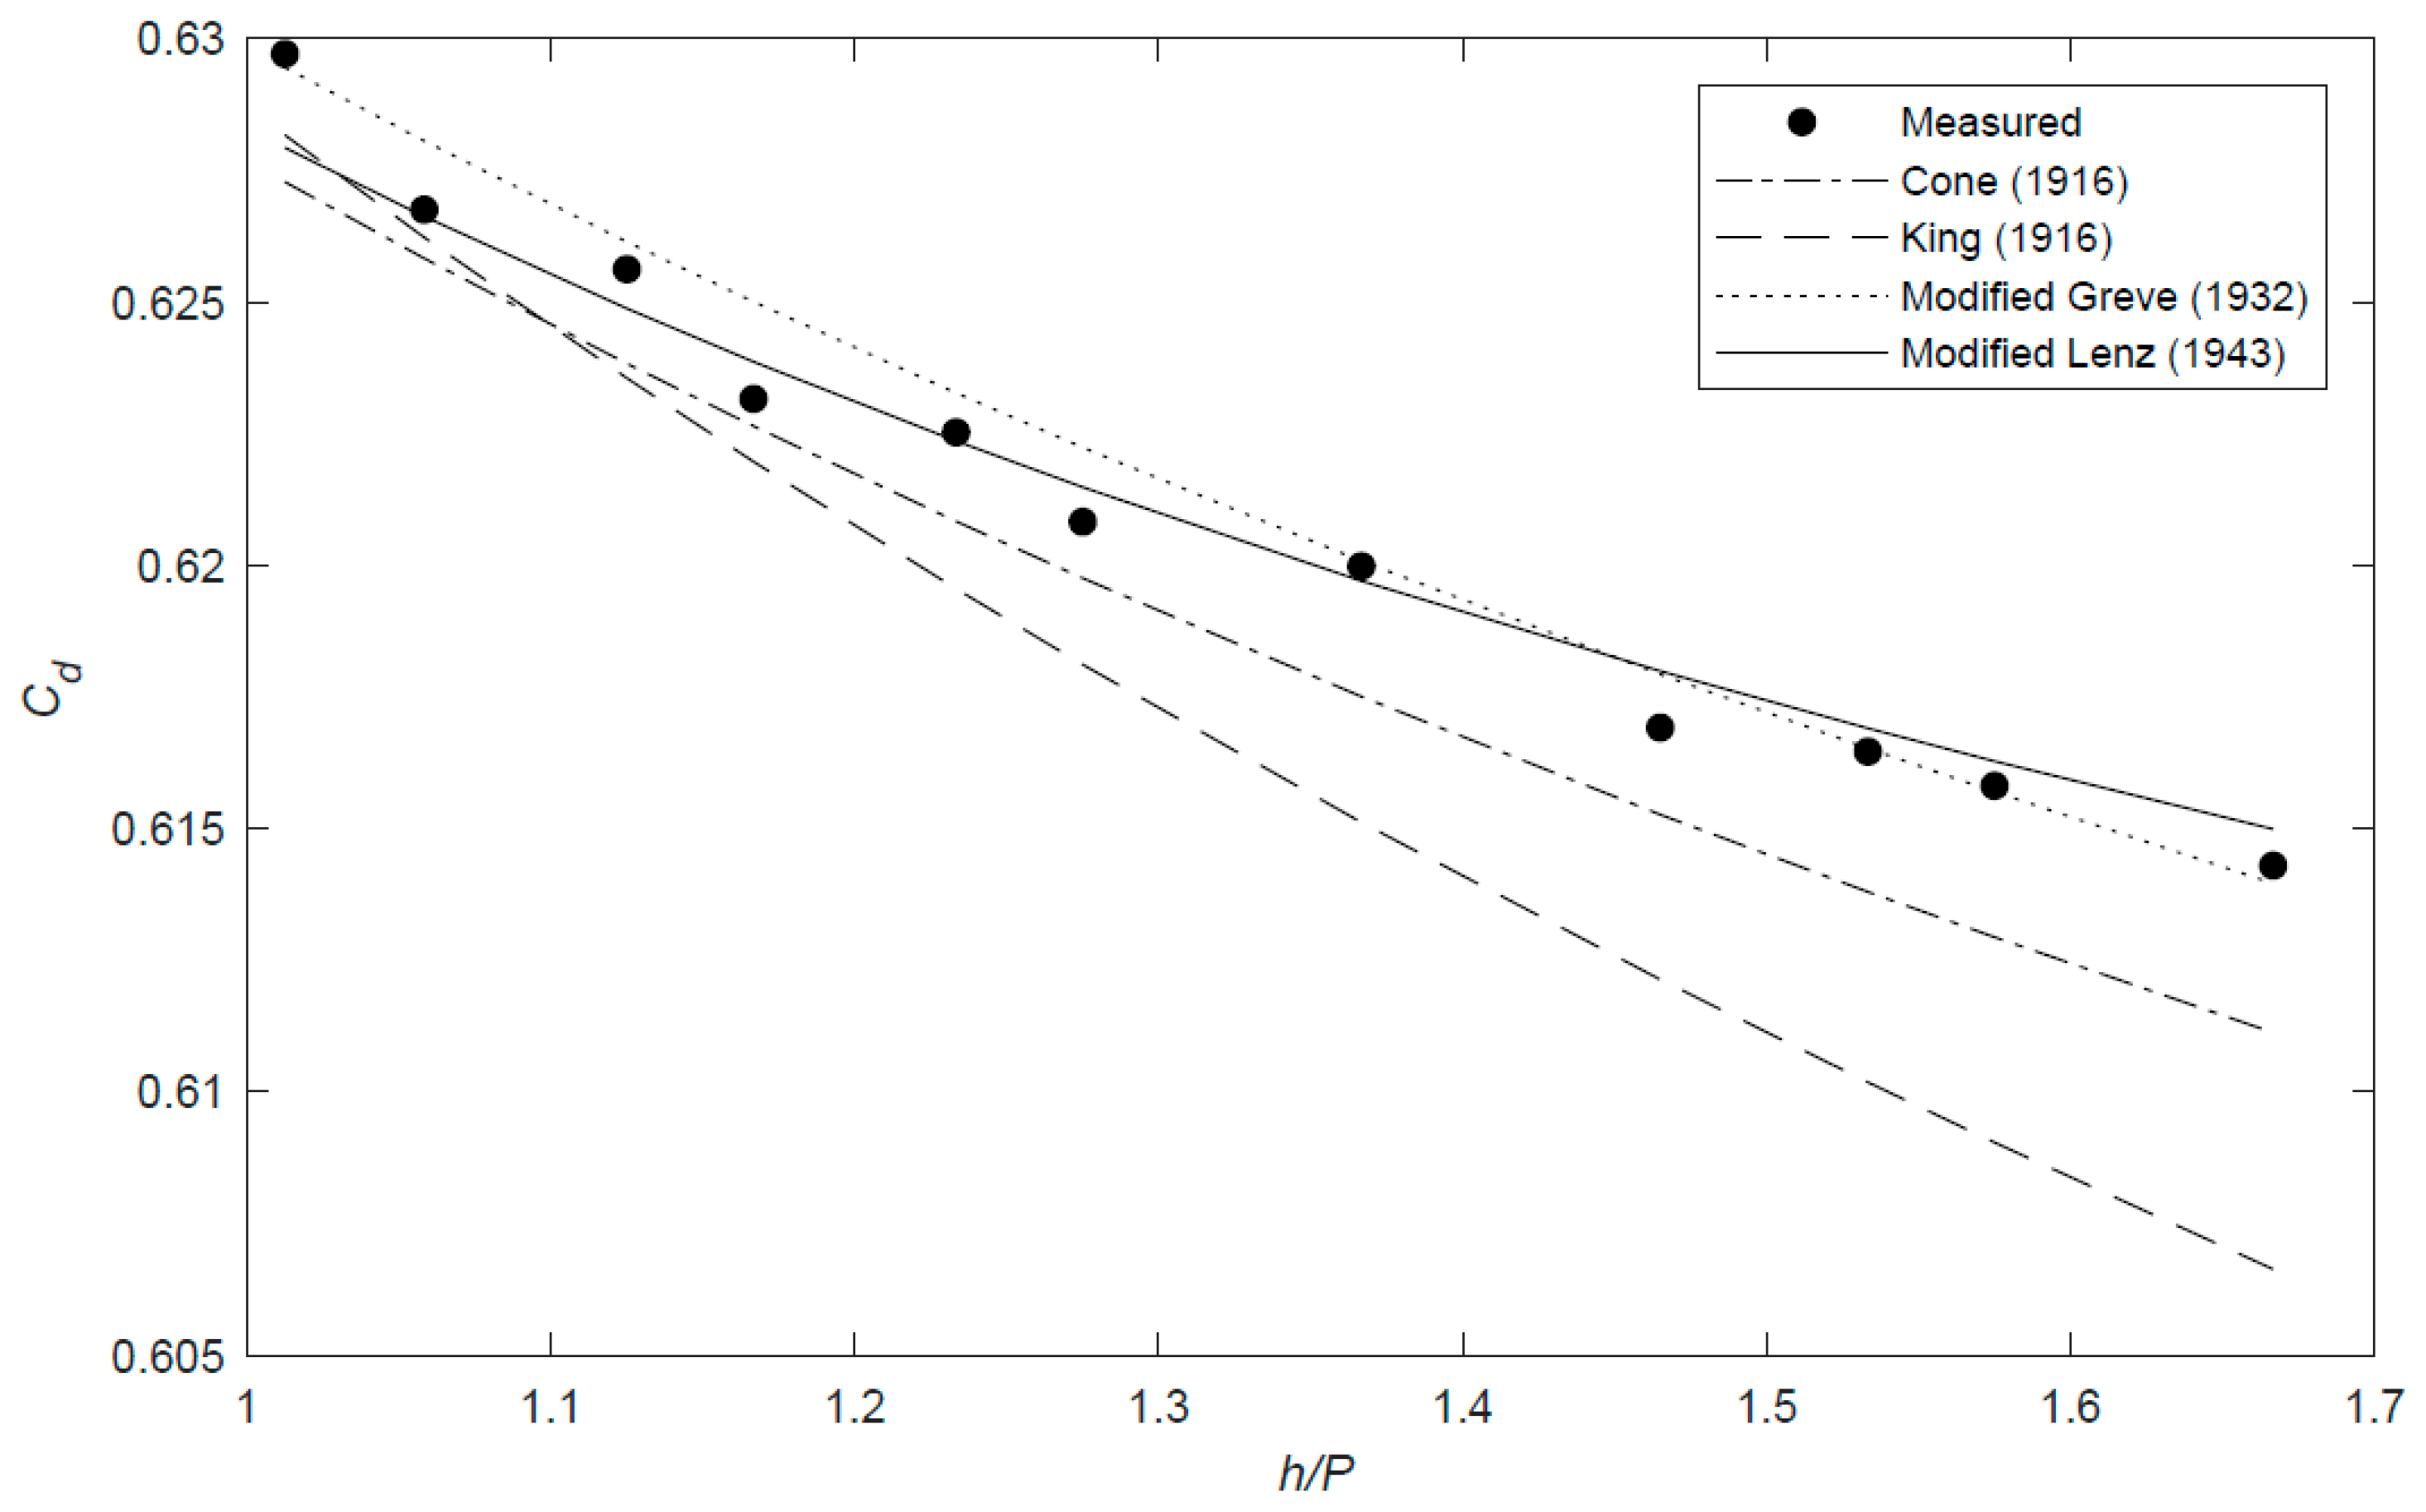
The Cd values in the clinging flow phase are higher than those in the free-flow phase because of surface tension and viscosity, which take place as the pressure underneath the nappe drops below atmospheric pressure. In the bistable zone, Cd values oscillate due to the disturbance of the water surface affecting the proportion of clinging nappe to free-flow. As the flow becomes fully free, Cd values stabilise, and the effect of surface tension and viscosity becomes negligible. Plotting Cd against h/P for the free-flow phase and superimposing that with the discharge coefficients determined from the equations in Table 2 showed that the best models fitting the observed data are those of Cone and King, with the former being the best. Lenz and Greve’s models show a good trend, but they are offset from the observed data. In fact, using a starting coefficient of 0.576, as in Cone’s equation, to modify Lenz’s model, gives a rather better fit than Cone’s model. This may be attributed to the fact that Lenz’s experiment focused on the effect of viscosity and surface tension on the weir equation, which is the case in this study. As for Greve’s model, a modified version of its equation along with the other ones are presented in Table 4 and the results are shown in Figure 7. The proposed modifications enable expansion of the head applicability range of the 30° V-notch weir to as low as 20 mm compared to what it used to be (Table 2).
The results obtained showed that most literature models are valid for h/P greater than 1; Cd exhibits a steeper decreasing slope for values below 1. Thus, the free flow phase was split into two sections. In the first one, between the bistable phase and before reaching h/P of 1, the discharge coefficient is calculated from a linear regression of the observed data. The second section is for h/P greater than 1, where the discharge coefficient is calculated using the modified Lenz equation.
3.2. Calibrated Rating Curve
Figure 5 revealed that considering a single head-discharge relationship over the full range of the flow would result in large errors in estimating the flow rate, especially at low values. Based on the results plotted in Figure 6 and using Equation (2), three linear relationships between head and discharge are determined for the three different flow phases along with an expression for high flows as follows:
where N = 0.0306, λ = 0.575, and P = 120 mm. For the weir studied, a and b in Equation (2) are not constant, they exhibit an indirect relationship where a decreases as h increases, while b increases as h increases. Combining Equation (3) above with Equation (1), the discharge over the 30° partially-contracted sharp-crested triangular weir can be computed for the full range of flow. The discontinuity between two consecutive flow phases is attributed to the different physical behaviour of the water streamlines when spilling over the weir. This induces that for each critical head, two discharge coefficients are calculated, one for each of the two flow phases separated by that critical head.
3.3. Uncertainty of the Proposed Discharge Equation
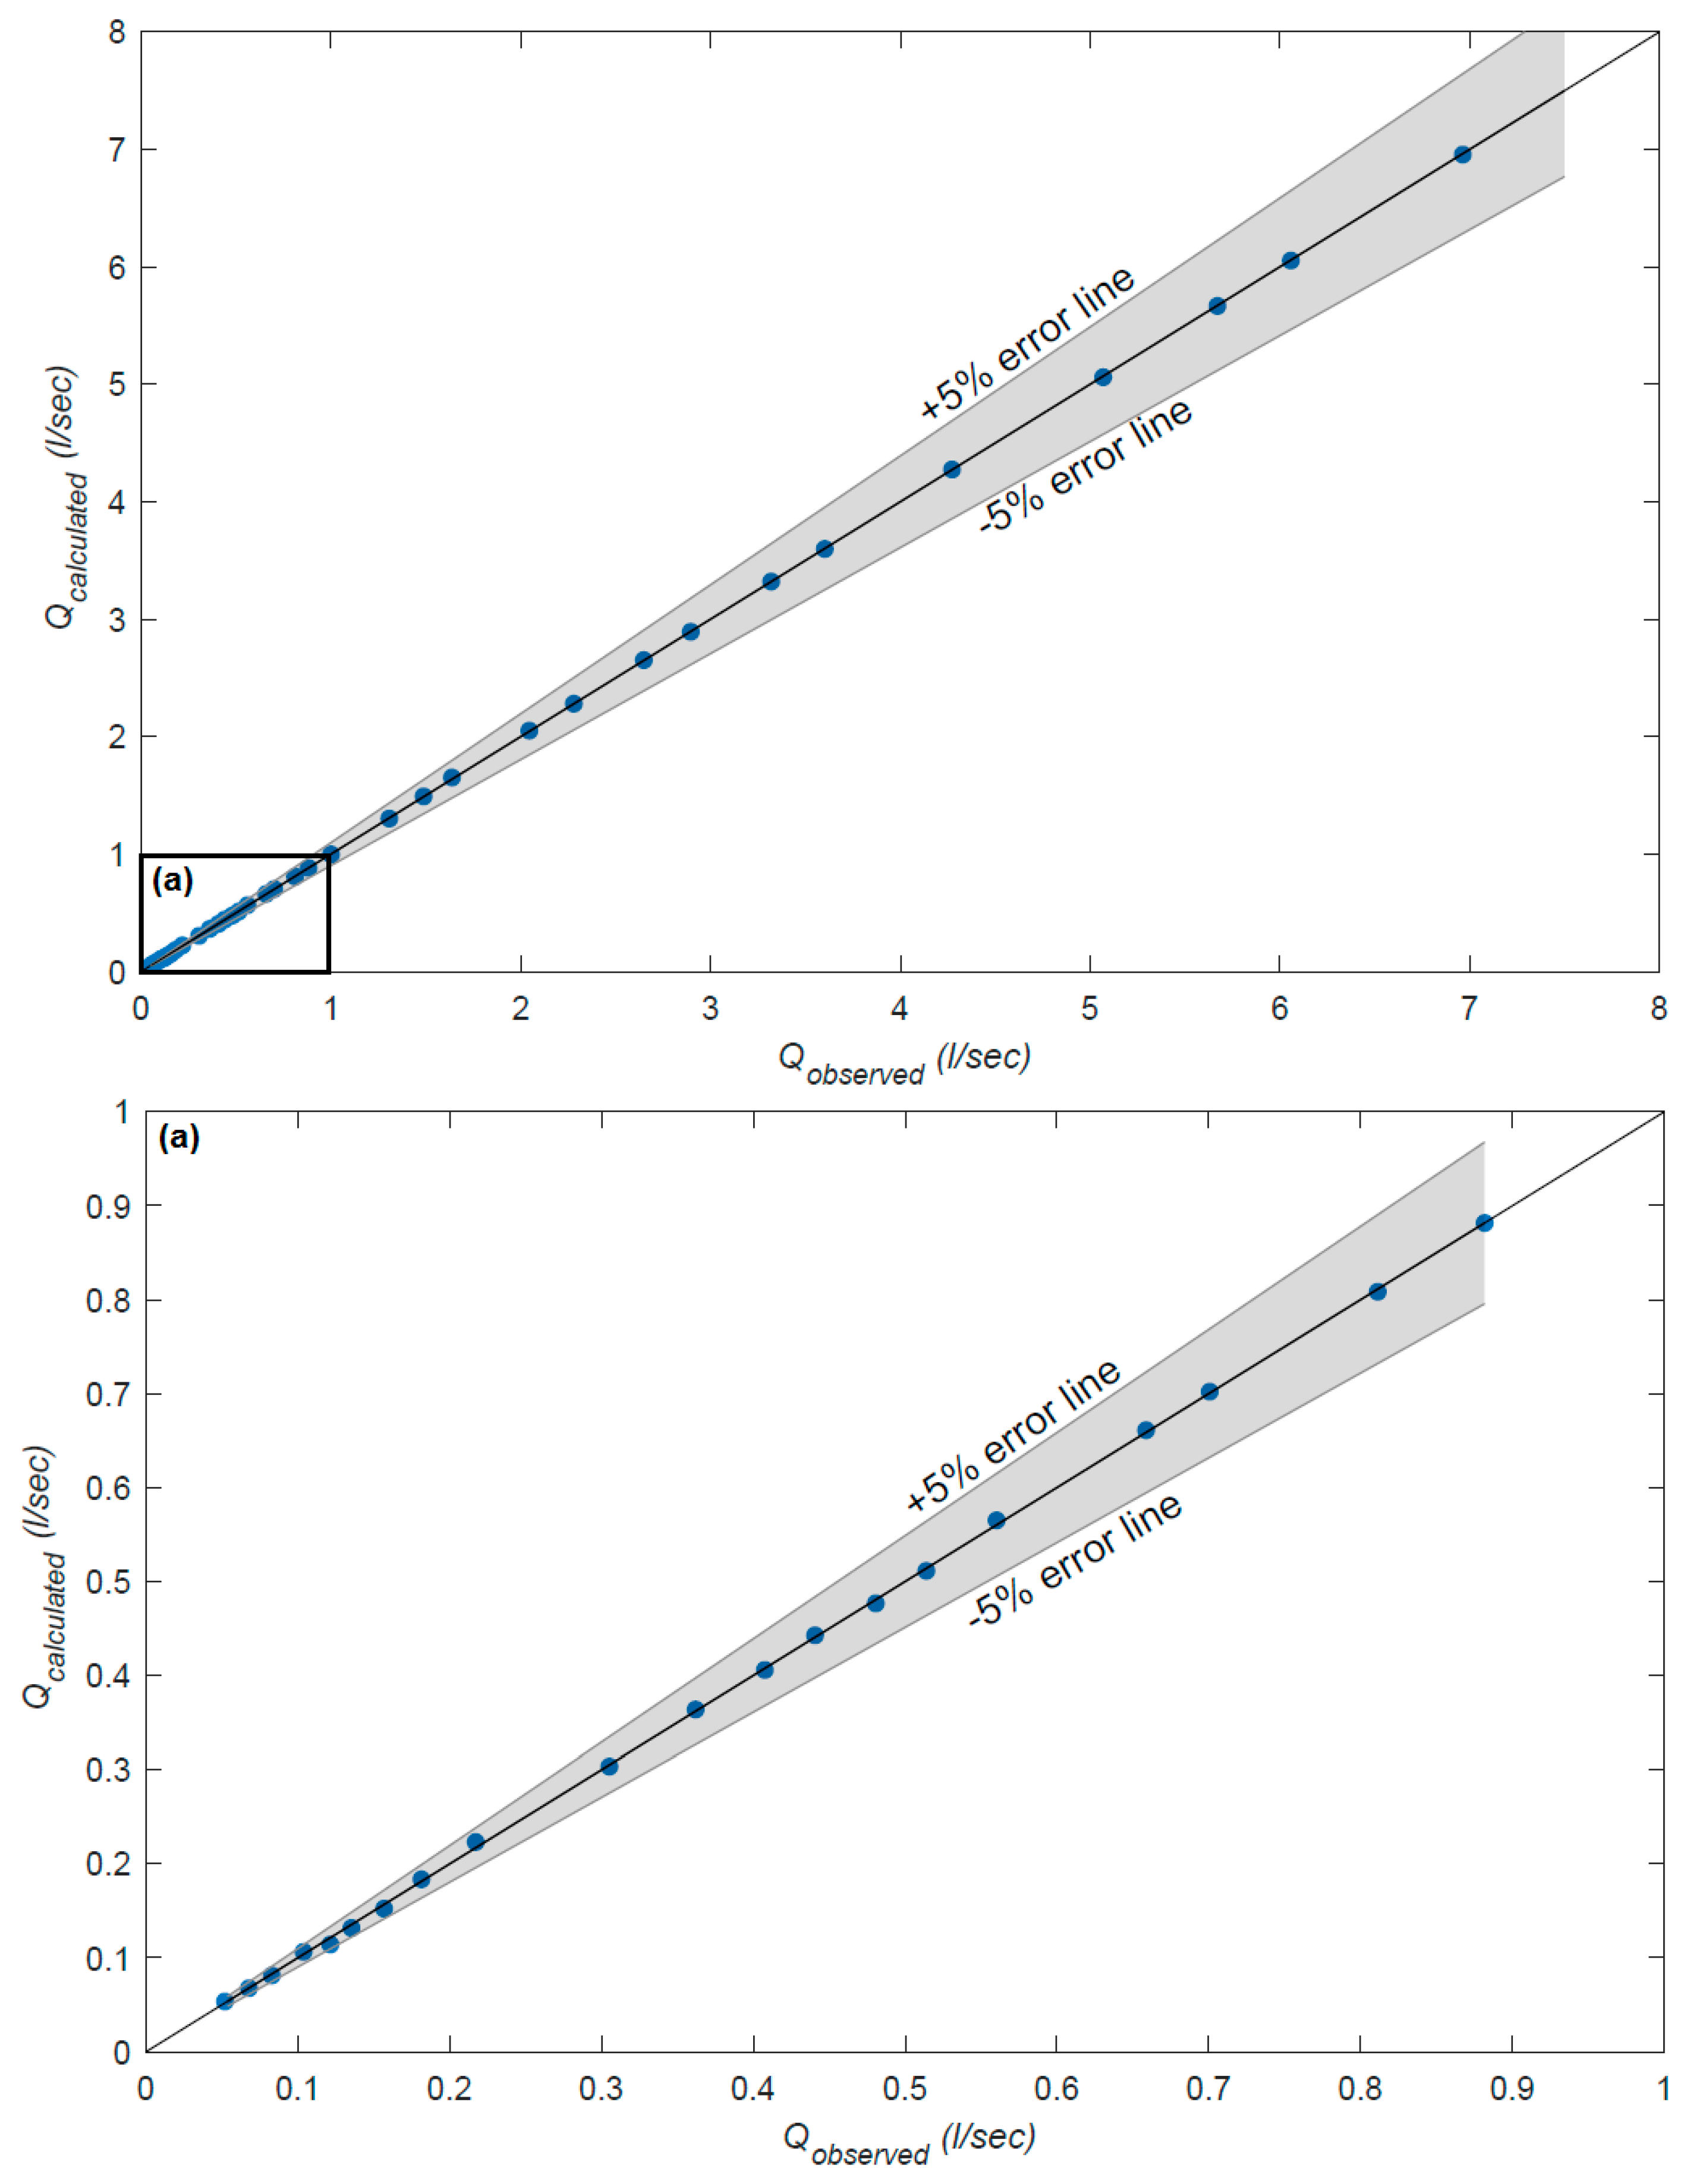
The proposed head-discharge relationship is checked for its accuracy by comparing the calculated discharge and the observed ones (Figure 8), this showed that the calculated discharge is within 5% of the observed discharge for the full range of flow rates (0.054 l/s to 6.96 l/s). The average percentage error between the observed and the computed discharges is less than 1.4%.
3.4. Transferability of the Observed Flow Behaviour
To validate the observations drawn from this study, the same calibration procedure was repeated for a 45° V-notch weir. This weir exhibits similar performance (Figure 9) to the 30° weir with three distinguishable flow zones; although the bistable zone is not very easily identified, which can then be called an intermediate zone. The end of the clinging flow zone happens at heads lower than when it happens in the 30° weir case, which is expected since the surface tension in the former are smaller than those in the latter.
Given the range of flow needed to be measured from single GI devices, it is important to select a weir geometry that can provide the necessary sensitivity to small flow changes in order to enable the pressure transducer to capture these small variations. Selecting wider triangular weir geometries would compromise the level of accuracy desired and may render the weir inappropriate for low flow measurement.
The proposed Equation (3) was derived for the monitoring of discharge out of single GI units retrofitted into dense urban environments, where space and existing underground utilities are often very restricting with respect to the design of the monitoring system. This implies that the smaller the chamber that can be used, the more appropriate it is for monitoring GI retrofits. In this study, the underground chamber housing the V-notch weir is 1200 mm in diameter, which is the smallest size used in common practice allowing a proper entry into confined spaces. On the other hand, given the small flow rates expected out of individual GI units, it is not advisable to have a large storage space upstream from the V-notch weir. In other words, if P is increased, more volume would be stored before the weir without being recorded, which increases the chances to miss small storm events when the antecedent dry condition is long enough. Hence, the smaller the P, the higher the ability of the V-notch weir to capture low flows relevant for GI performance assessment. Therefore, the proposed monitoring scheme in this study is an optimal design with respect to highly likely site constraints and required level of monitoring accuracy that can be adopted for any GI monitoring scheme, and in retrofit type of projects more specifically.
3.5. Significance of Obtained Results
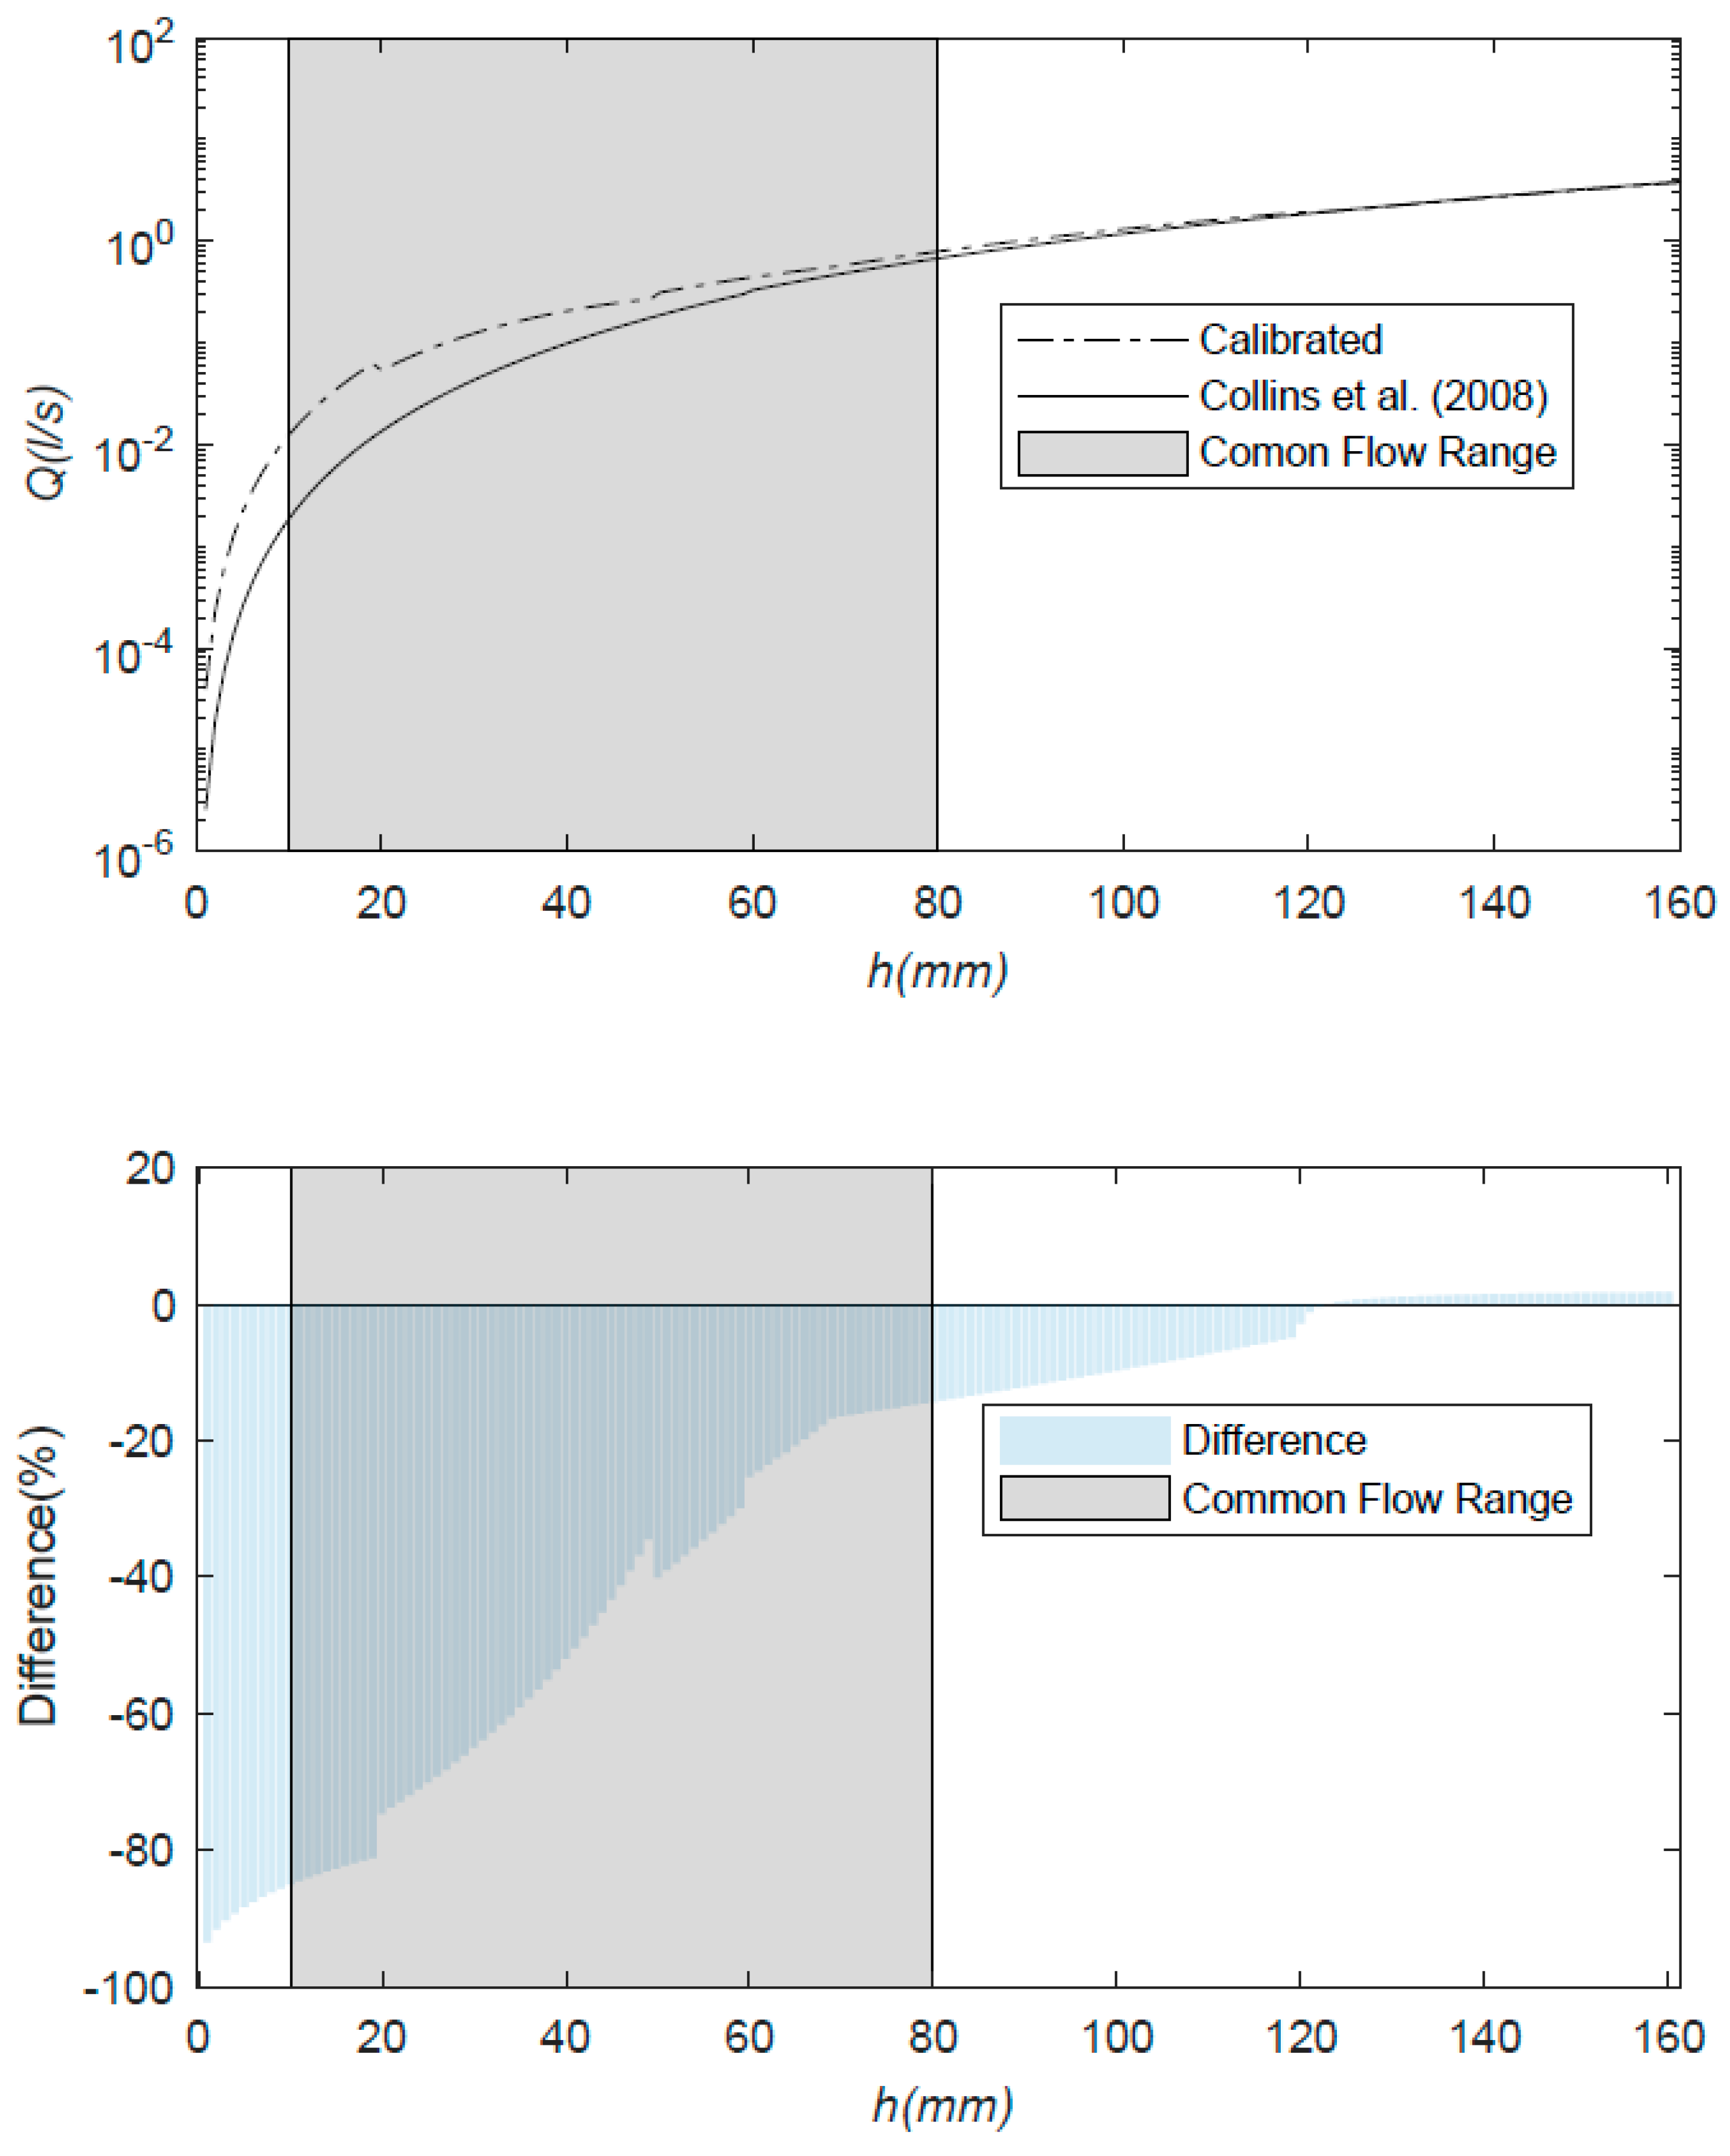
As aforementioned, many previous researchers have used the literature calibration equations in the assessment of GI performance. Since the V-notch weir considered in this study is used in a very specific application, the obtained results were tested against literature rating curve formulations. The most similar application was found in Collins et al. [12], who calibrated a triangular weir for the GI assessment in a laboratory rig mimicking its exact site scale and conditions. To test the transferability of a calibrated rating curve, the discharge through the 30° V-notch weir was calculated using the equation determined by Collins et al. and superimposed by the results from this study, as shown in Figure 10. Collins et al.’s equation, combined with the standard weir equation, underpredicted the discharge rate by 85% to 17% for a typical GI range of flows from 0.01 l/s to 0.79 l/s, respectively. Such big differences may be attributed to the differences in approach channel conditions, where the h/P and h/B ratios are the two main factors affecting the magnitude of velocity upstream from the V-notch weir. The distance upstream from the weir to the chamber wall is larger in Collins et al.’s experiment than the current experiment, which explains why Cd values computed by Collins et al.’s expression are smaller than those computed by Equation (3). Consequently, the flow rate would be lower. Differences in velocity directly affect the Reynolds and Weber numbers which measure the influence of fluid viscosity and surface tension respectively. The effects of these two parameters become significant at low heads [59] and could be expressed in terms of the geometric parameters of the weir, which explain the big influence of approach channel conditions on weir measurements at very low heads.
The observed differences become negligible for flow rates higher than 2 l/s (corresponding to h = P = 120 mm). However, in small scale projects where a V-notch weir monitors a single GI device, the estimations obtained using Collins et al.’s [12] expression would produce significant errors, which would affect the interpretation of the GI performance.
4. Conclusions
This study focused on the calibration process for a V-notch weir when the device is used for the assessment of the GI full-scale performance. Experimental data indicate that even very sharp V-notch weirs intended to measure low flow rates may suffer from clinging flow regime. Therefore, thorough investigation of weir discharge at low heads needed to be carried out. In this study, three flow regimes were identified for a 30° V-notch weir: (i) clinging flow at ≤ 0.358; (ii) bistable flow at 0.358 < ≤ 0.600; and (iii) free-flow at ≥ 0.600. Extensive investigation of the 30° V-notch weir behaviour at low heads enabled the extension of its applicability range to head values as low as 20 mm.
The discharge coefficient in all three stages and for different triangular weir geometries may be linearly related to the ratio of the head of water crossing the weir over the distance of the weir vertex from the channel (h/P), which resulted in three relationships to calculate the discharge coefficient (Cd) at the three different flow phases. The coefficients of the linear relationships are inversely proportional, where for low h/P values, Cd is large, and for high h/P values, Cd decreases until flattening to a value between 0.615 and 0.620 for the 30° V-notch weir. Combining the three linear relationships along with a modified version of Lenz’s equation to predict the discharge over the full range of flow showed a very good agreement between the predicted and observed flow values within 5% accuracy.
The observations drawn from analysing the 30° V-notch weir were checked against a 45° V-notch weir, which showed a similar behaviour. The triangular sharp-crested weir exhibited a reliable performance in measuring very low flow rates out of GI technologies. This adds to its wide applications and opens new opportunities for usage in different urban water measurement applications.
Finally, the results showed that generalising the literature head–discharge relationships of a triangular sharp-crested weir for application in confined conditions, such as the measurement of outflows from GI, may result in significant errors, especially at low flow rates. Although many literature studies have used the V-notch weir in such applications, the results showed that even for a similar weir that has been calibrated for a comparable application, the errors produced are very high. This can vary between 85% and 17% for the typical GI outflow range (0.054 l/s to 6.96 l/s). It can be concluded that the approach channel geometry significantly affects the hydraulics of the weir, and therefore, the calibration of an equipment before use is a necessary step to ensure the reliable measurement and interpretation of the Green Infrastructure full-scale performance.
Author Contributions
M.H.E.H. conceived, designed, and performed the experiments, analyzed the data, and wrote the paper. A.M. reviewed the analysis and edited the paper. D.V. helped with the design of the experiment, sourcing of material, and equipment and editing the paper.
Funding
This research was funded by the Center for Doctoral Training (CDT) in Sustainable Civil Engineering at Imperial College London and Thames Water Utilities Limited through a grant from the Engineering and Physical Sciences Research Council (EPSRC), grant number EP/L016826/1.
Acknowledgments
The authors would like to thank Cedo Maksimovic, from Imperial College London, David Balmforth, from MWH global now part of Stantec, Zorica Todorovic, from Atkins member of the SNC-Lavalin Group, and Boris Ochoa-Tocachi from Imperial College London for their guidance and support. Also, the authors would like to thank the anonymous reviewers whose feedback helped improve the manuscript.
Conflicts of Interest
The authors declare no conflict of interest.
Abbreviations
| B | width of the weir |
| Cd | discharge coefficient |
| g | gravitational acceleration |
| h | head of water over the weir |
| N | empirical constant in Lenz’s [55] equation |
| P | distance from channel bed to weir vertex |
| Q | discharge |
| θ | notch angle of the weir |
| R | Reynolds number |
| W | Weber number |
| ρ | mass density |
| σ | surface tension of liquid |
| μ | dynamic viscosity |
| λ | empirical constant in Lenz’s [55] equation |
References
- Halliday, S. The Great Stink of London: Sir Joseph Bazalgette and the Cleansing of the Victorian Metropolis; The History Press: Stroud, UK, 2001. [Google Scholar]
- Milly, P.C.D.; Betancourt, J.; Falkenmark, M.; Hirsch, R.M.; Zbigniew, W.; Lettenmaier, D.P.; Stouffer, R.J. Stationarity Is Dead: Whither Water Management? Science 2008, 319, 573–574. [Google Scholar] [CrossRef] [PubMed]
- Brown, R.R. Local Institutional Development and Organizational Change for Advancing Sustainable Urban Water Futures. Environ. Manag. 2008, 41, 221–233. [Google Scholar] [CrossRef]
- Ashley, R.M.; Digman, C.; Stovin, V.R.; Balmforth, D.; Glerum, J.; Shaffer, P. Retrofitting Surface Water Management Measures: Delivering Multiple Value. In Proceedings of the 12th International Conference on Urban Drainage, Porto Alegre, Brazil, 10−15 September 2011; pp. 10–15. [Google Scholar]
- Woods-Ballard, B.; Kellagher, R.; Martin, P.; Jefferies, C.; Bray, R.; Shaffer, P. The SUDS Manual; Construction Industry Research & Information Association (CIRIA): London, UK, 2015. [Google Scholar]
- Wright, T.J.; Liu, Y.; Carroll, N.J.; Ahiablame, L.M.; Engel, B.A. Retrofitting LID Practices into Existing Neighborhoods: Is It Worth It? Environ. Manag. 2016, 57, 856–867. [Google Scholar] [CrossRef] [PubMed] [Green Version]
- Ellis, J.B.; Lundy, L. Implementing Sustainable Drainage Systems for Urban Surface Water Management within the Regulatory Framework in England and Wales. J. Environ. Manag. 2016, 183, 630–636. [Google Scholar] [CrossRef]
- Jia, H.; Wang, X.; Ti, C.; Zhai, Y.; Field, R.; Tafuri, A.N.; Cai, H.; Yu, S.L. Field Monitoring of a LID-BMP Treatment Train System in China. Environ. Monit. Assess. 2015, 187, 373. [Google Scholar] [CrossRef] [PubMed]
- Eckart, K.; Mcphee, Z.; Bolisetti, T. Performance and Implementation of Low Impact Development—A Review. Sci. Total Environ. 2017, 607–608, 413–432. [Google Scholar] [CrossRef]
- Maheepala, U.K.; Takyi, A.K.; Perera, B.J.C. Hydrological Data Monitoring for Urban Stormwater Drainage Systems. J. Hydrol. 2001, 245, 32–47. [Google Scholar] [CrossRef]
- Hunt, W.F.; Jarrett, A.R.; Smith, J.T.; Sharkey, L.J. Evaluating Bioretention Hydrology and Nutrient Removal at Three Field Sites in North Carolina. J. Irrig. Drain. Eng. 2006, 132, 600–608. [Google Scholar] [CrossRef] [Green Version]
- Collins, K.A.; Hunt, W.F.; Hathaway, J.M. Hydrologic Comparison of Four Types of Permeable Pavement and Standard Asphalt in Eastern North Carolina. J. Hydrol. Eng. 2008, 13, 1146–1157. [Google Scholar] [CrossRef]
- Davis, A.P. Field Performance of Bioretention: Hydrology Impacts. J. Hydrol. Eng. 2008, 13, 90–95. [Google Scholar] [CrossRef] [Green Version]
- Dietz, M.E.; Clausen, J.C. Stormwater Runoff and Export Changes with Development in a Traditional and Low Impact Subdivision. J. Environ. Manag. 2008, 87, 560–566. [Google Scholar] [CrossRef]
- Hunt, W.F.; Smith, J.T.; Jadlocki, S.J.; Hathaway, J.M.; Eubanks, P.R. Pollutant Removal and Peak Flow Mitigation by a Bioretention Cell in Urban Charlotte, N.C. J. Environ. Eng. 2008, 134, 403–408. [Google Scholar] [CrossRef]
- Li, H.; Sharkey, L.J.; Hunt, W.F.; Davis, A.P. Mitigation of Impervious Surface Hydrology Using Bioretention in North Carolina and Maryland. J. Hydrol. Eng. 2009, 14, 407–415. [Google Scholar] [CrossRef]
- Aravena, J.; Dussaillant, A. Storm-Water Infiltration and Focused Recharge Modeling with Finite-Volume Two-Dimensional Richards Equation: Application to an Experimental Rain Garden. J. Hydraul. Eng. 2009, 135, 1073–1080. [Google Scholar] [CrossRef] [Green Version]
- Roseen, R.M.; Ballestero, T.P.; Houle, J.J.; Avellaneda, P.; Briggs, J.; Fowler, G.; Wildey, R. Seasonal Performance Variations for Storm-Water Management Systems in Cold Climate Conditions. J. Environ. Eng. 2009, 135, 128–137. [Google Scholar] [CrossRef]
- Debusk, K.M.; Wynn, T.M. Storm-Water Bioretention for Runoff Quality and Quantity Mitigation. J. Environ. Eng. 2011, 137, 800–808. [Google Scholar] [CrossRef]
- Lenhart, H.A.; Hunt, W.F., III. Evaluating Four Storm-Water Performance Metrics with a North Carolina Coastal Plain Storm-Water Wetland. J. Environ. Eng. 2011, 137, 155–162. [Google Scholar] [CrossRef]
- Brown, R.A.; Hunt, W.F.H., III. Impacts of Media Depth on Effluent Water Quality and Hydrologic Performance of Undersized Bioretention Cells. J. Irrig. Drain. Eng. 2011, 137, 132–143. [Google Scholar] [CrossRef]
- Central Kitsap Community Campus Low Impact Development Flow Monitoring Project; Final Project Report, Prepared for Kitsap County Public Works (Surface and Stormwater Management Program), Port Orchard, Washington; Herrera Environmental Consultants, Inc.: Seattle, WA, USA, 2013.
- Perales-Momparler, S.; Hernández-Crespo, C.; Vallés-Morán, F.; Martín, M.; Andrés-Doménech, I.; Andreu Álvarez, J.; Jefferies, C. SuDS Efficiency during the Start-up Period under Mediterranean Climatic Conditions. Clean Soil Air Water 2014, 42, 178–186. [Google Scholar] [CrossRef]
- Wilson, C.E.; Hunt, W.F.; Winston, R.J.; Smith, P. Comparison of Runoff Quality and Quantity from a Commercial Low-Impact and Conventional Development in Raleigh, North Carolina. J. Environ. Eng. 2015, 141, 1–10. [Google Scholar] [CrossRef]
- Winston, R.J.; Dorsey, J.D.; Hunt, W.F. Quantifying Volume Reduction and Peak Flow Mitigation for Three Bioretention Cells in Clay Soils in Northeast Ohio. Sci. Total Environ. 2016, 553, 83–95. [Google Scholar] [CrossRef]
- Cording, A.; Hurley, S.; Whitney, D. Monitoring Methods and Designs for Evaluating Bioretention Performance. J. Environ. Eng. 2017, 143, 1–10. [Google Scholar] [CrossRef]
- Braswell, A.S.; Anderson, A.R.; Hunt, W.F., III. Hydrologic and Water Quality Evaluation of a Permeable Pavement and Biofiltration Device in Series. Water 2018, 10, 33. [Google Scholar] [CrossRef]
- Winston, R.J.; Dorsey, J.D.; Smolek, A.P.; Hunt, W.F. Hydrologic Performance of Four Permeable Pavement Systems Constructed over Low-Permeability Soils in Northeast Ohio. J. Hydrol. Eng. 2018, 23, 1–13. [Google Scholar] [CrossRef]
- Brown, R.A.; Line, D.E.; Hunt, W.F. Case Study LID Treatment Train: Pervious Concrete with Subsurface Storage in Series with Bioretention and Care with Seasonal High Water Tables. J. Environ. Eng. 2012, 138, 689–697. [Google Scholar] [CrossRef]
- Jarden, K.M.; Jefferson, A.J.; Grieser, J.M. Assessing the Effects of Catchment-Scale Urban Green Infrastructure Retrofits on Hydrograph Characteristics. Hydrol. Process. 2016, 30, 1536–1550. [Google Scholar] [CrossRef]
- Rodriguez-Rojas, M.I.; Huertas-Fernandez, F.; Moreno, B.; Martínez, G.; Grindlay, A.L. A Study of the Application of Permeable Pavements as a Sustainable Technique for the Mitigation of Soil Sealing in Cities: A Case Study in the South of Spain. J. Environ. Manag. 2018, 205. [Google Scholar] [CrossRef] [PubMed]
- Drake, J.; Bradford, A.; Seters, T. Van. Stormwater Quality of Spring e Summer-Fall Effluent from Three Partial-in Filtration Permeable Pavement Systems and Conventional Asphalt Pavement. J. Environ. Manag. 2014, 139, 69–79. [Google Scholar] [CrossRef]
- LeFevre, N.-J.B.; Watkins, D.W.; Gierke, J.S.; Brophy-Price, J. Hydrologic Performance Monitoring of an Underdrained Low-Impact Development Storm-Water Management System. J. Irrig. Drain. Eng. 2010, 136, 333–339. [Google Scholar] [CrossRef]
- Jackisch, N.; Weiler, M. The Hydrologic Outcome of a Low Impact Development (LID) Site Including Superposition with Streamflow Peaks. Urban Water J. 2017, 14, 143–159. [Google Scholar] [CrossRef]
- Stewart, R.D.; Lee, J.G.; Shuster, W.D.; Darner, R.A. Modelling Hydrological Response to a Fully-Monitored Urban Bioretention Cell. Hydrol. Process. 2017, 31, 4626–4638. [Google Scholar] [CrossRef]
- Chanson, H. The Hydraulics of Open Channel Flow: An Introduction, 2nd ed.; Butterworth-Heinemann: Oxford, UK, 2004; ISBN 978-0750659789. [Google Scholar]
- Kindsvater, C.E.; Carter, R.W.C. Discharge characteristics of rectangular thin-plate weirs. J. Hydro. Div. 1957, 83, 1–36. [Google Scholar]
- Ackers, P.; White, W.R.; Perkins, J.A.; Harrison, A.J.M. Weirs and Flumes for Flow Measurement; Wiley: New York, NY, USA, 1978. [Google Scholar]
- Bos, M.G. Discharge Measurement Structures, 3rd ed.; International Institute for Land Reclamation and Improvement: Wageningen, The Netherlands, 1989; pp. 40–202. [Google Scholar]
- Montes, S. Hydraulics of Open Cannel Flow; American Society of Civil Engineers: Reston, VA, USA, 1998. [Google Scholar]
- Finnemore, J.E.; Franzini, J.B. Fluid Mechanics: With Engineering Applications, 10th ed.; McGraw-Hill Asia: Singapore, 2002; ISBN 9780-0712-7011-3. [Google Scholar]
- British Standards Institute. BS ISO 1438:2008: Hydrometry-Open Channel Flow Measurement Using Thin-Plate Weirs; BSI: London, UK, 2008. [Google Scholar]
- International Organization for Standardization. ISO 1438/1: Part 1: Water Flow Measurement in Open Channels Using Weirs and Venturi Flumes—Thin-Plate Weirs; ISO: Geneva, Switzerland, 1980. [Google Scholar]
- American Society for Testing and Materials. ASTM D5242: Standard Method for Open-Channel Flow Measurement of Water with Thin-Plate Weirs; ASTM: West Conshohocken, PA, USA, 1993. [Google Scholar]
- U.S. Bureau of Reclamation (USBR). Water Measurement Manual; U.S. Department of the Interior: Washington, WA, USA, 2001.
- Martínez, J.; Reca, J.; Morillas, M.T.; López, J.G. Design and Calibration of a Compound Sharp-Crested Weir. J. Hydraul. Eng. 2005, 131, 112–116. [Google Scholar] [CrossRef]
- Aydin, I.; Ger, A.M.; Hincal, O. Measurement of Small Discharges in Open Channels by Slit Weir. J. Hydraul. Eng. 2002, 3, 234–237. [Google Scholar] [CrossRef]
- Henderson, F.M. Open Channel Flow, 1st ed.; Prentice–Hall: Upper Saddle River, NJ, USA, 1966; ISBN 9780-0235-3510-9. [Google Scholar]
- Grant, D.M.; Dawson, B.D. Isco Open Channel Flow Measurement Handbook, 5th ed.; Isco: Lincoln, NE, USA, 2001; ISBN 9780-9622-7572-2. [Google Scholar]
- Zhang, X.; Yuan, L.; Peng, R.; Chen, Z. Hydraulic Relations for Clinging Flow of Sharp-Crested Weir. J. Hydraul. Eng. 2010, 136, 385–390. [Google Scholar] [CrossRef]
- Kumar, S.; Ahmad, Z.; Mansoor, T. A New Approach to Improve the Discharging Capacity of Sharp-Crested Triangular Plan Form Weirs. Flow Meas. Instrum. 2011, 22, 175–180. [Google Scholar] [CrossRef]
- Crookston, B.M.; Tullis, B.P. Hydraulic Design and Analysis of Labyrinth Weirs. II: Nappe Aeration, Instability, and Vibration. J. Irrig. Drain. Eng. 2013, 139, 371–377. [Google Scholar] [CrossRef]
- Swamee, P.K.; Pathak, S.K.; Ghodsian, M. Viscosity and Surface Tension effects on Rectangular Weirs. ISH J. Hydraul. Eng. 2001, 7, 45–50. [Google Scholar] [CrossRef]
- Bagheri, S.; Kabiri-samani, A.R.; Heidarpour, M. Discharge Coefficient of Rectangular Sharp-Crested Side Weirs, Part I: Traditional Weir Equation. Flow Meas. Instrum. 2014, 35, 109–115. [Google Scholar] [CrossRef]
- Lenz, A.T. Viscosity and surface tension effects on V-notch weir coefficients. Trans. Am. Soc. Civ. Eng. 1943, 108, 759–782. [Google Scholar]
- British Standards Institute. BS 3680:1965: Methods of Measurement of Liquid Flow in Open Channels, Part 4A: Thin-Plate Weirs and Venturi Flumes; BSI: London, UK, 1965. [Google Scholar]
- L’Association Francaise de Normalisation. Mesure de débit de l’eau dans les Chenaux au Moyen de Déversoire en Mince Paroi; X 10-311. ISO/TC 113/GT2; ISO: Montpellier, France, 1971; p. 152. [Google Scholar]
- Shen, J. Discharge Characteristics of Triangular-Notch Thin-Plate Weirs (No. 1617); United States Department of the Interior, Geological Survey: Reston, VA, USA, 1981.
- Rehbock, T. Discussion of precise weir measurement, by K. B. Turner. Trans. Am. Soc. Civ. Eng. 1929, 93, 1143–1162. [Google Scholar]
- Barr, J. Experiments upon the flow of water over Triangular Notches. Engineering 1910, 89, 435. [Google Scholar]
- Cone, V.M. Flow through weir notches with thin edges and full contractions. J. Agric. Res. 1916, 5, 1051. [Google Scholar]
- King, H.W. Flow of water over right-angled V-notch weir. Univ. Michigan Technic 1916, 29, 189. [Google Scholar]
- Greve, F.W. Flow of Water through Circular, Parabolic, and Triangular Vertical Notch-Weirs. Purdue Univ. Eng. Bull. 1932, 16, 84. [Google Scholar]
- Milburn, P.; Burney, J. V-notch weir boxes for measurement of subsurface drainage system discharges. Can. Agric. Eng. 1988, 30, 209–212. [Google Scholar]
- Hattab, M.E.; Vernon, D.; Mijic, A. Performance Evaluation of Retrofitted Low Impact Development Practices in Urban Environments: A Case Study from London, UK. In Proceedings of the International Conference on Sustainable infrastructure: Technology, New York, NY, USA, 26–28 October 2017; pp. 282–294. [Google Scholar] [CrossRef]
Figure 1.
Weir cross-section for Green Infrastructure (GI) flow measurements.

Figure 2.
Calibration rig set-up for V-notch measurement of Green Infrastructure (GI) performance.

Figure 3.
Flow Control and Monitoring chambers arrangement and a close-up look of the V-notch weir placement inside the second chamber.
Figure 3.
Flow Control and Monitoring chambers arrangement and a close-up look of the V-notch weir placement inside the second chamber.

Figure 4.
Water Collection Tank installed downstream of the Flow Monitoring Chamber.

Figure 5.
Observed Head (h) plotted against discharge (Q), and a closer look into the low values where transition points are marked (a).
Figure 5.
Observed Head (h) plotted against discharge (Q), and a closer look into the low values where transition points are marked (a).

Figure 6.
Discharge coefficient (Cd) plotted against the ratio h/P for the data of the 30° weir observed.
Figure 6.
Discharge coefficient (Cd) plotted against the ratio h/P for the data of the 30° weir observed.

Figure 7.
Discharge coefficient (Cd) plotted against the ratio h/P for the data measured and literature formulas for free flow.
Figure 7.
Discharge coefficient (Cd) plotted against the ratio h/P for the data measured and literature formulas for free flow.

Figure 8.
Calculated discharge (Qcalculated) against observed ones (Qobserved) and a close-up look into low values (a).
Figure 8.
Calculated discharge (Qcalculated) against observed ones (Qobserved) and a close-up look into low values (a).

Figure 9.
Discharge coefficient (Cd) plotted against the ratio h/P for the data of the 45° weir observed.
Figure 9.
Discharge coefficient (Cd) plotted against the ratio h/P for the data of the 45° weir observed.

Figure 10.
Comparison of flow (in logarithmic scale) versus head, computed using Collins et al.’s [12] rating curve and Equation (3) from this study.
Figure 10.
Comparison of flow (in logarithmic scale) versus head, computed using Collins et al.’s [12] rating curve and Equation (3) from this study.


Table 1.
Summary of literature case studies involving full-scale Green Infrastructure (GI) hydrological monitoring.
Table 1.
Summary of literature case studies involving full-scale Green Infrastructure (GI) hydrological monitoring.
| Monitoring Type | Monitoring Instrument | GI Technology | Project Type (Retrofit/New Development) | Reference |
|---|---|---|---|---|
| Rating curve of hydraulic control structure | Pressure transducer + V-notch weir (30°) | Bioretention Cell | Retrofit | [11] |
| Pressure transducer + V-notch weir (30°) | Permeable Pavement, Porous Concrete | Retrofit | [12] | |
| Bubbler sampler + Flume | Bioretention Cell | Retrofit | [13] | |
| Bubbler sampler + Palmer-Bowlus flume | Swale, Rain Garden, Permeable Pavement, Bioretention Cell | Retrofit | [14] | |
| Bubbler sampler + V-notch weir (120°) | Bioretention Cell | Retrofit | [15] | |
| Pressure transducer + V-notch weir (30°, 45° and 60°) | Bioretention Cell | Retrofit | [16] | |
| Pressure transducer + V-notch weir | Rain Garden | Retrofit | [17] | |
| Bubbler sampler + Thel-Mar weir | Bioretention Cell, Sand Filter, Gravel Wetland, Street Tree, Porous Asphalt | Retrofit | [18] | |
| Bubbler sampler + Thel-Mar weir | Bioretention Cell | Retrofit | [19] | |
| Bubbler sampler + Compound V-notch/Rectangular Weir | Wetland | Retrofit | [20] | |
| Rating curve of hydraulic control structure | Bubbler sampler + V-notch weir (120°) | Pervious Concrete, Bioretention Cell | Retrofit | [21] |
| Pressure transducer + Thel-Mar weir + Palmer- Bowlus Flume | Bioretention Cell, Porous Pavement | Retrofit | [22] | |
| Pressure transducer + V-notch weir (90°) | Swale, Infiltration Pond | Site 1: RetrofitSite 2: New Development | [23] | |
| Bubbler sampler + V-notch weir (30°) | Bioretention Cell, Detention Pond, Swale, Infiltration Trench | New Development | [24] | |
| Pressure transducer + V-notch weir (45° and 60°) | Bioretention Cell | Retrofit | [25] | |
| Pressure transducer + V-notch weir (90°) | Bioretention Cell | Retrofit | [26] | |
| Bubbler sampler + V-notch weir (30°) | Permeable Pavement, Biofiltration | Retrofit | [27] | |
| Pressure transducer + V-notch weir (30°, and 60°) | Permeable Pavement | Retrofit | [28] | |
| Rating curve of hydraulic control structure | Bubbler sampler + V-notch weir (90°)and Flowmeter | Bioretention Cell | Retrofit | [29] |
| Flow meter | ||||
| Flow meter | Pressure transducer + Doppler ultrasonic velocity sensor | Bioretention Cell, Rain Garden | Retrofit | [30] |
| Flowmeter | Permeable Pavement | New Development | [31] | |
| Clamp-on ultrasonic flowmeter | Permeable Pavement | Retrofit | [32] | |
| Rating Curve determined by models | Pressure transducer + Manning’s equation | Rain Garden, Green Roof, Permeable Pavement, Bioswale, Detention Pond | New Development | [33] |
| Pressure transducer + HEC-RAS | Green Roof, Permeable Pavement, Swale | New Development | [34] | |
| Pressure transducer | Bioretention Cell | Retrofit | [35] |
Table 2.
Coefficient of discharge expressions for 30° triangular weirs and their head applicability range.
Table 2.
Coefficient of discharge expressions for 30° triangular weirs and their head applicability range.
| Expression for Cd | Reference | Application Range of the Head (mm) |
|---|---|---|
| Lenz [55] | 80–214 | |
| where | Cone [61] | 61–381 |
| a | King [62] | 50–450 |
| Greve [63] | 51–302 |
Note: a for 22.5°.
Table 3.
Flow phases identified from observed data as a function of h/P.
| Flow Phase | h/P |
|---|---|
| Clinging flow | Less than 0.358 |
| Bistable flow | 0.358 to 0.600 |
| Free-flow | Larger than 0.600 |
© 2019 by the authors. Licensee MDPI, Basel, Switzerland. This article is an open access article distributed under the terms and conditions of the Creative Commons Attribution (CC BY) license (http://creativecommons.org/licenses/by/4.0/).
Share and Cite
MDPI and ACS Style
El Hattab, M.H.; Mijic, A.; Vernon, D. Optimised Triangular Weir Design for Assessing the Full-Scale Performance of Green Infrastructure. Water 2019, 11, 773. https://doi.org/10.3390/w11040773
AMA Style
El Hattab MH, Mijic A, Vernon D. Optimised Triangular Weir Design for Assessing the Full-Scale Performance of Green Infrastructure. Water. 2019; 11(4):773. https://doi.org/10.3390/w11040773
Chicago/Turabian StyleEl Hattab, Mohamad H., Ana Mijic, and Dejan Vernon. 2019. "Optimised Triangular Weir Design for Assessing the Full-Scale Performance of Green Infrastructure" Water 11, no. 4: 773. https://doi.org/10.3390/w11040773
Note that from the first issue of 2016, this journal uses article numbers instead of page numbers. See further details here.