Experimental Investigation of Lateral Subsurface Flow Depending on Land Use and Soil Cultivation


1
Hydrology and River Basin Management, TUM Department of Civil, Geo and Environmental Engineering, Technical University of Munich, Arcisstraße 21, 80333 München, Germany
2
Flood Protection and Alpine Natural Hazards, Bavarian Environment Agency, Bürgermeister-Ulrich-Str. 160, 86179 Augsburg, Germany
*
Author to whom correspondence should be addressed.
Water 2019, 11(4), 766; https://doi.org/10.3390/w11040766
Submission received: 19 March 2019
/
Revised: 4 April 2019
/
Accepted: 5 April 2019
/
Published: 13 April 2019
(This article belongs to the Special Issue Hillslope Hydrology: Towards Improved Process Understanding Using Modeling and/or Field Observations)
Abstract
:The magnitude and timing of flood events are influenced by surface and subsurface flow generation as well as by present land use distribution. An integrated understanding of the interactions of soil properties, land use and flow generation is still missing. Therefore, field experiments are required to gain further knowledge about land use dependencies of discharge generation and concentration processes. In our research, we built an experimental setup consisting of three sites with similar soil and topographic conditions and different land use types (cropland, grassland, forest). The applied multimethod approach includes meteorological parameters, soil moisture, soil moisture tension, surface runoff, lateral subsurface flow, and stream discharge observations. The results show that low subsurface flow discharges more often occur at the cropland site, while large flow volumes were mainly observed at the grassland site. A correlation of the horizontal distribution of subsurface flow volumes and the accumulation areas of the surface topography has been found (r² = 0.76). The observed average response times for advective events increase from the forest site (6.0 h) to the grassland site (12.4 h) to the cropland site (20.9 h). Response times of convective events were shorter than 1 h at all sites.
1. Introduction
Subsurface flow is significant in catchment hydrology [1] and has a large contribution to peak flow at saturation conditions [2,3,4]. Therefore, its representation in process-based hydrological models is important for a variety of purposes. The amount and reactivity of surface and subsurface flows are controlled by the soil characteristics at the respective sites [5,6]. Soil properties like texture, bulk density, organic matter content, and average soil moisture conditions affect the predominant land use. On the other hand, soil hydraulic properties and moisture conditions are also altered by vegetation by litter, interception, root penetration, soil fauna, and management methods. We therefore hypothesize that the land use type has a distinct effect on the magnitude, distribution and timing of lateral subsurface flow, referred to as subsurface flow in the following text. The available data for the analyses is scarce as study sites with similar soil characteristics are needed. Nevertheless, this data is required to understand the influence of land use on subsurface flow characteristics as well as to qualitatively validate land use scenarios in hydrological models.
The suitability of methods for measuring subsurface flow depends on the particular process and the spatial scale [7]. A combination of multiple methods leads to a diversity of perspectives and a better process understanding [3,8]. In contrast, a separate consideration of measurements can result in conflicting interpretations of the observed processes [9]. Subsurface flow can be measured directly and continuously in trenches. A subdivision in horizontal or vertical trench segments gives further information about the subsurface flow distribution and preferential flow paths. Several studies have shown a large heterogeneity of the subsurface flow regarding its horizontal distribution [3,10,11,12] and the vertical response [2,13]. Bedrock topography is often adduced to explain the subsurface flow distribution [2,14]. The formation of a plow layer at a defined depth at tilled sites can lead to an accordance of surface flow paths and subsurface flow paths [15]. The saturated hydraulic conductivity, the storage capacity of the soil matrix and the occurrence of macropores affect the subsurface flow distribution, magnitude and timing. The observed combination of a fast response of macropore flow and a slow matrix flow illustrates the separate reaction of the two subsurface flow components [16,17,18,19]. Land use has a significant impact on the organic matter content, the bulk density of the topsoil and consequently on the water retention curve [20,21]. Root depth and distribution affect infiltration and transpiration and subsequently the vertical soil moisture distribution and direct flow characteristics. Beach sites with deep roots are likely to have faster and higher subsurface flow response while spruce stands with shallow root systems are prone to surface runoff [22]. Subsurface flow was mostly investigated on forested sites. The influence of soil management practices in agricultural fields on flow generation was measured in the scope of surface runoff and erosion processes. Soil cultivation practices lead to changing soil properties during the year, which influence infiltration [23,24,25]. Numerous erosion studies on soil tillage showed a correlation between tillage intensity and surface runoff, resulting in increased amounts of infiltration for less intense tillage [26,27,28]. The occurrence of subsurface flow depends on hillslope-specific threshold values which vary in-between hillslopes and land uses [11,14,29]. Influencing factors include rainfall conditions, soil depth, slope position, antecedent soil moisture conditions, and subsurface saturation connectivity [17,29,30]. Furthermore, a comparison of subsurface flow lag times in different land uses showed an increasing response time from coniferous forest to mixed forest and grassland [3]. Even though multimethod approaches are generally favored, long-term study sites in which a larger number of approaches were applied are relatively scarce and mostly covered by forest. Some progress has been made in the process understanding of macropore and preferential flows, but an integrated physical theory has not yet been established [1]. Consequently, field experiments remain important for the development of modeling concepts.
The novelty of this study derives from the characteristics of the study site, which combines three land use types with long-term observations of soil hydrophysical, hydrological and meteorological parameters. As soil types, topography and exposure of the measurement plots are similar, it provides exceptional opportunities to focus on land use dependencies of soil hydrological processes. Therefore, the scope of the field experiments and the analysis was to investigate (1) framework conditions of subsurface flow events including soil hydraulic properties, soil moisture and suction; (2) the differences of subsurface flow volumes, flow shares and response times regarding their horizontal and vertical distribution; and (3) the influence of land use and soil cultivation on water movement in the soil.
2. Materials and Methods
2.1. Site Selection and Description
The measurement site is in the southern part of the Glonn catchment (gage Odelzhausen) and has a total area of 0.125 km² and an upstream drainage area of 0.938 km² (Figure 1). Geologically, the hillslope is located on the southern edge of the Upper Freshwater Molasse [31]. The upper aquifer comprises siliceous and carbonate unconsolidated sediments [32]. It is a porous aquifer with conductivities ranging from 10−5 to 10−7 m/s. The site is situated in southern Bavaria, which is located in the transient region of maritime and continental climate and is therefore characterized by a warm temperate climate [33]. The average annual temperature in the region is 7.9 °C; the annual precipitation sum is 701.5 mm. The statistical measurements were determined from collected data of a nearby weather station from 1961 to 1990 [34].
The three land use types grassland, cropland and forest are represented on one hillslope. It drains into the Rambach and subsequently enables an integrated water balance. The positioning of the three measurement plots results in a comparable topography with moderately steep slopes, equal northwestern-faced aspects, and similar elevations and accumulation areas (Figure 1, Table 1). The largest differences of elevation, slope and accumulation area can be found in comparison to the forest site. The average slope angles of the three sites range from 11.4 to 18.5%; the values are sufficiently large to determine a distinct flow direction. The surface elevation difference of 8 to 17 m is considerably larger than the distance to the Ap- or the C-horizon (<1.2 m). Consequently, it can be assumed to be the dominant influence on the subsurface flow paths [15]. The single fields have a concave to straight curvature perpendicular to the main gradient, which leads to a confluence of flow pathways at the bottom of the fields. Thus, it allows to capture a large share of the field area with a relatively short trench (Figure 1). The curvature in the direction of the main gradient changes with the slope length from convex at the top to concave at the bottom of the fields.
The respective land use distributions of the three accumulation areas are homogeneous and thus include only one land use type each. All sites are used for agriculture or silviculture. The grassland is cultivated as meadow for hay and silage and is mown two to three times during the vegetation period. The cropland field is tilled conventionally once or twice a year. The crop rotation contains corn (2016), winter wheat (2017) and winter barley. Green manure is used as a cover crop before sowing of corn. The spruce forest is used as timber forest with cutting areas. According to the soil map of the region, the soil types and textures of the three fields are very similar [35]. Consequently, differences of the storage capacity, discharge generation and concentration at the fields can more likely be attributed to the different land use types. At the lower part of the measurement sites, the soil type is a Cambisol on a clayey cover that changes to a Cambisol on loess loam [35].
2.2. Experimental Setup
The developed measurement concept is novel because it is a multimethod approach to observe direct flow components and their influencing factors depending on the land use type. Besides direct measurements of surface runoff and subsurface flow in two levels, the total runoff of the hillslope was determined in the adjacent stream (Figure 1) with two weirs and pressure sensors (Orpheus Mini, OTT Hydromet GmbH (Kempten, Germany) [36]). The meteorological parameters temperature, relative humidity, precipitation, global radiation, wind speed, and direction were monitored in the open area and within the forest with DAVIS VantagePro2 [37,38,39,40] weather stations (Davis Instruments, Hayward, USA) to determine the factors influencing discharge concentration. Additionally, soil moisture and suction measurements (soil moisture: SMT-100, UGT [41], 5TE and 5TM, METER Group (Pullman, WA, USA) [42,43]; suction: Tensio152, UGT (Müncheberg, Germany) [44]) were performed in the trenches as well as in transects above them. Field and laboratory analyses for soil texture and soil hydraulic properties were performed on different dates, positions and depths.
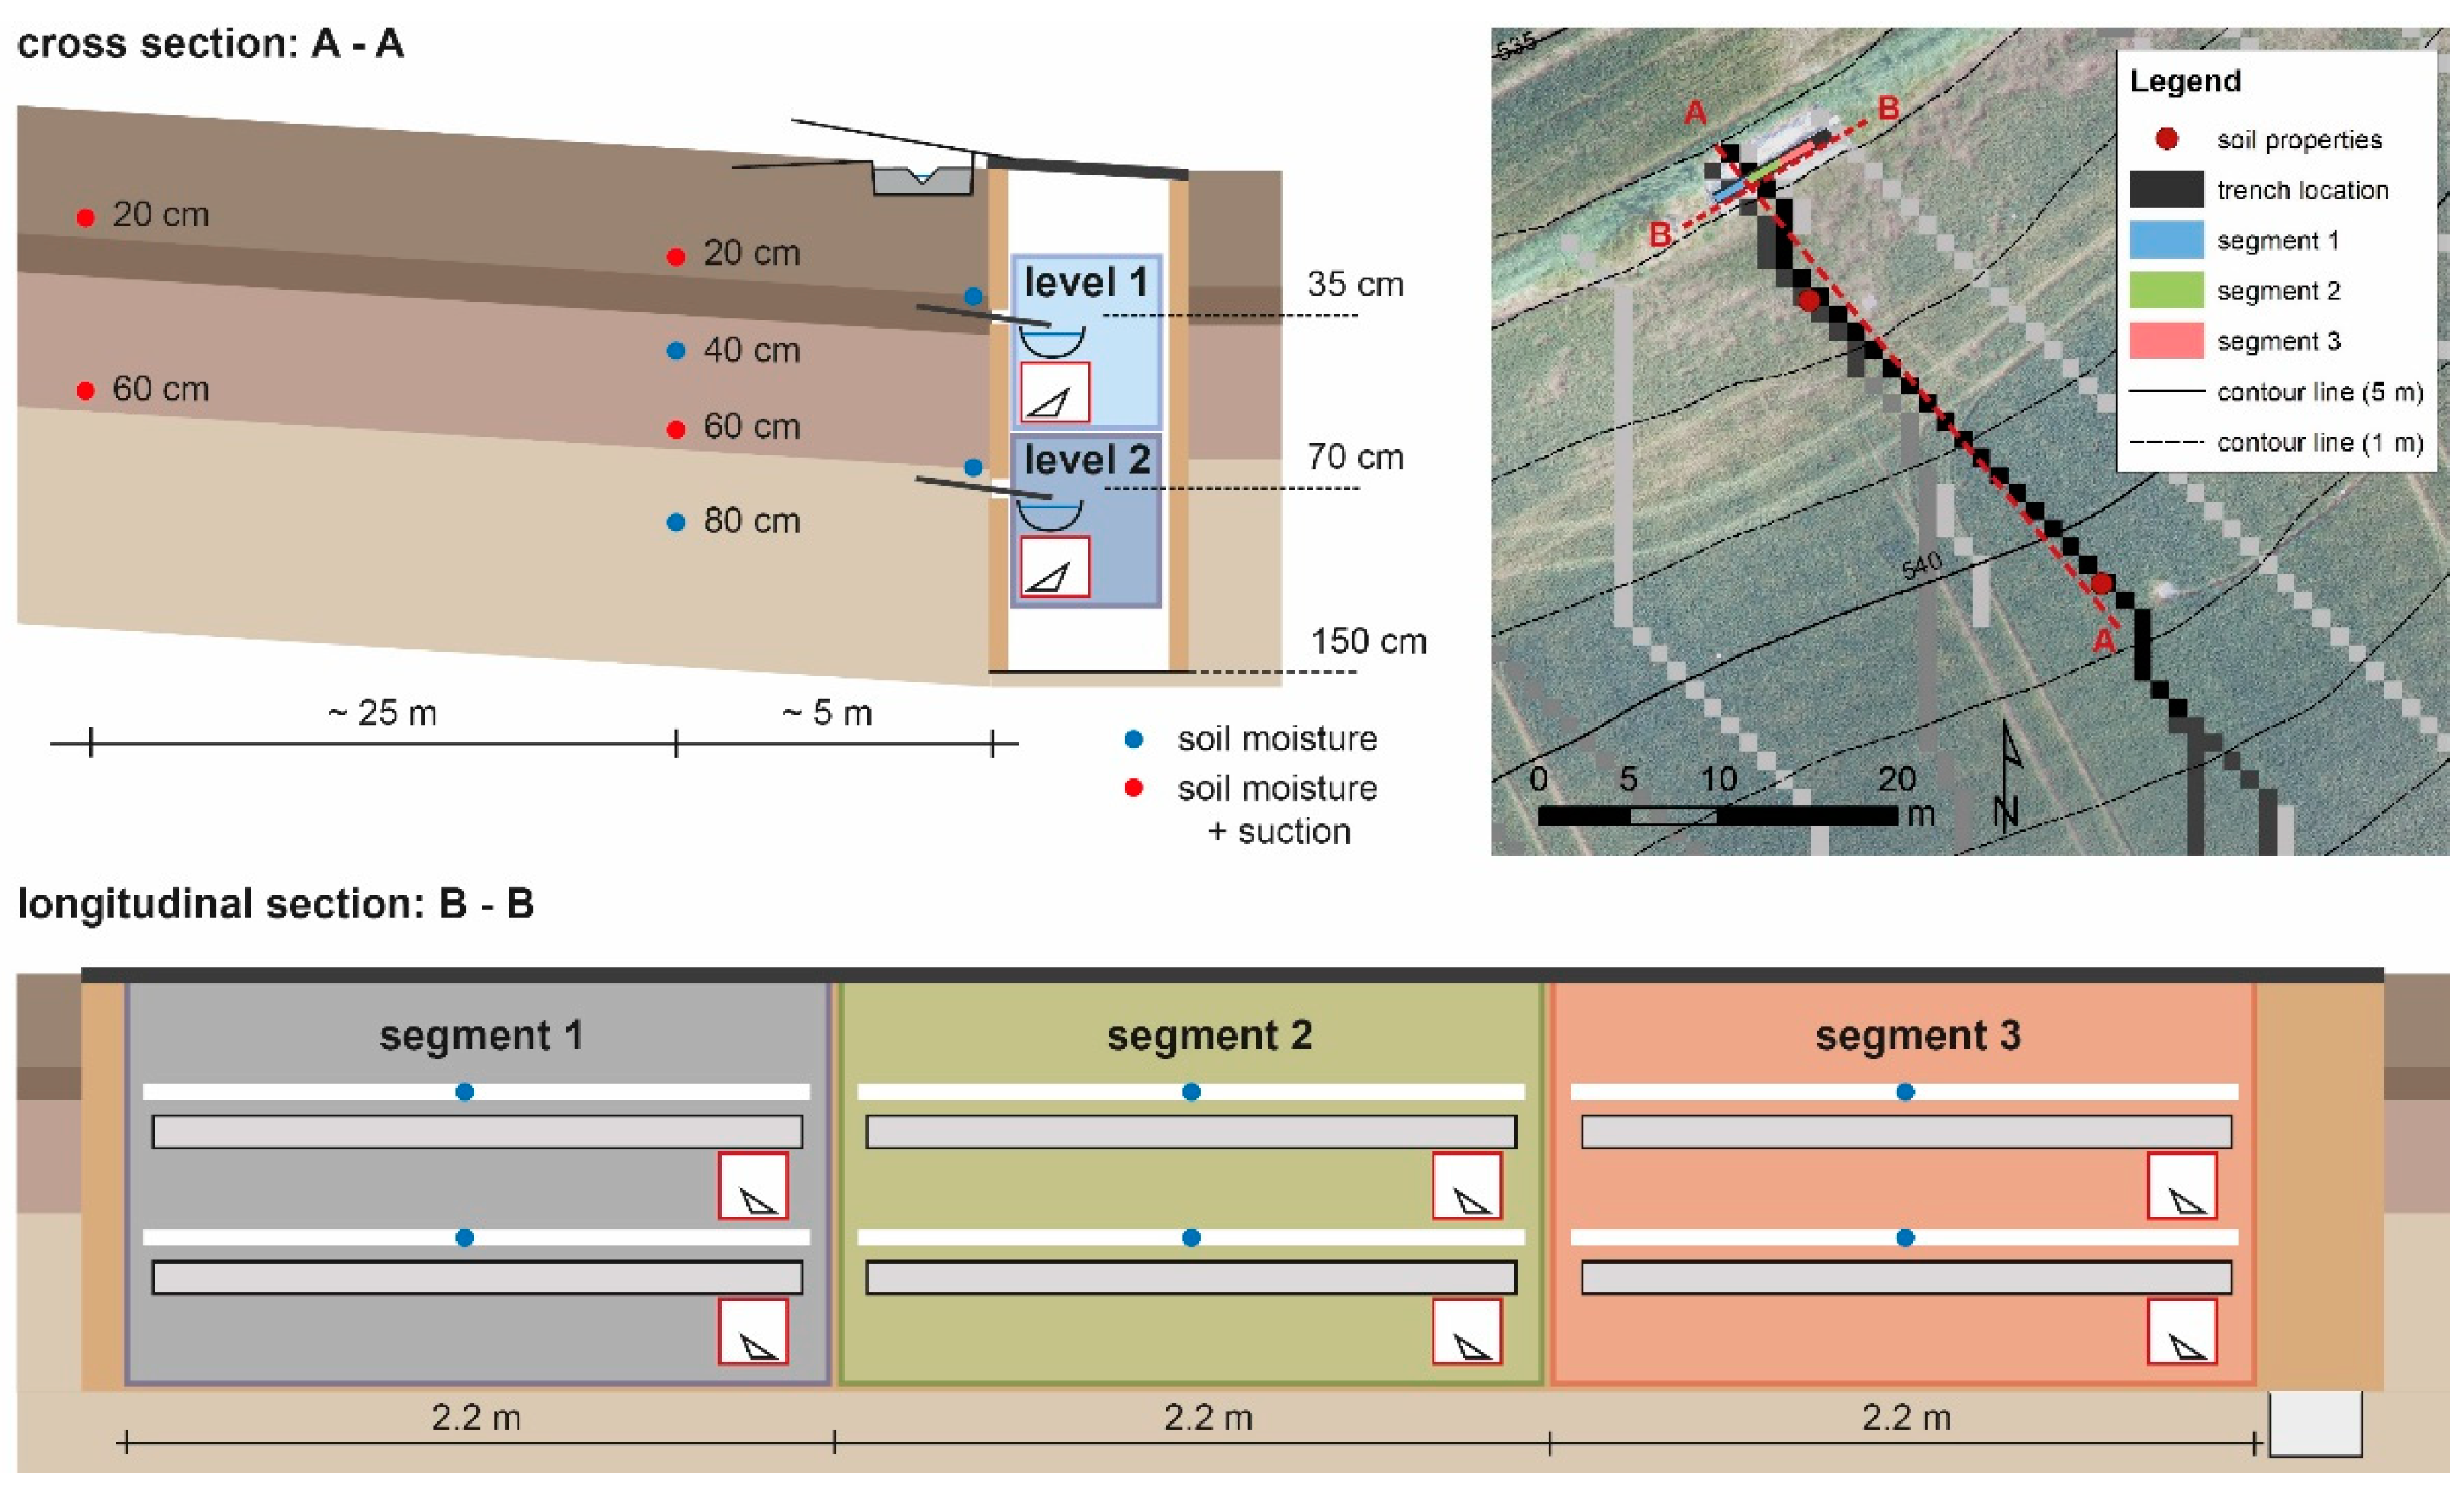
The trench locations in the respective fields were selected so that they capture the largest possible homogeneous accumulation area. We determined their positions based on a GIS analysis of the topography. Surface runoff was measured as one segment across the entire measuring length of 6.6 m using a Thomson weir outside the trench (Figure 2) and discharge measurements via ultrasonic and temperature sensors (HC-SR04 [45], DS18B20 [46]). The interflow was collected and recorded with metal sheets, roof gutters and DAVIS rain tipping buckets with a spatial resolution of 0.2 mm [37] in six sections. The trenches were subdivided into three 2.2-m-long segments to analyze the horizontal heterogeneities. An approximate subdivision of the total accumulation area is given in Table 1. The vertical differences were determined by measurements made at two levels (35 cm, 70 cm) with similar depths at all sites. The depth of the upper level was chosen to capture the saturation flow expected to occur on the cropland’s plow pan. As the soils in the catchment are thick and without an impermeable bedrock underneath, the trenches would not be able to capture the total lateral flow; however, a slow subsurface flow below the trenches would exist. The experiment was focused on monitoring the influence of land use on fast subsurface flow. Thus, only the upper part of the soil profile, where we expected to see the largest impact of different land uses, was captured.
The soil moisture and matrix potential measurement plots were set on surface flow paths in the accumulation areas of the respective trenches. The positioning allowed a comparison of multiple sloping sites and distances to the trenches. The sensors were installed at the depths where saturation layers were to be expected according to Weiler and Naef [47]. The upper sensor was placed 20 cm below ground just above the plow pan; the lower sensor was at a depth of 60 cm in the transition area to a horizon with higher clay content. Both depths were comparable to the levels of the subsurface flow measurements. Additionally, there were soil moisture probes located at 40 and 80 cm depth in the plot next to the trench to retrieve information about the temporal course of the saturation front and the vertical water movement.
2.3. Data Collection and Analysis
The data analysis was based on records of trench flow, soil moisture and suction measurements, stream flow as well as on point measurements of soil properties (Figure 3). The time periods of the individual measurements vary due to logger and instrument failures and different installation times of the measurement equipment starting 16 June 2016.
The time series of the trench flow, surface runoff and meteorology were recorded with a temporal resolution of 1-min. Data logging was made possible using a Raspberry Pi-based recording and data transmission system [48]. It combines cost-efficient components for data logging with modern IoT (internet of things) technologies and professional data storage facilities. Tipping bucket signals in the trench were converted into discharge using field calibration with different flow rates. The maximum discharge is limited by the largest possible number of tips per minute (0.6–1.0 L/min). The soil moisture and suction measurements were taken in 5- to 15-min intervals. Short data gaps were interpolated by linear interpolation. Longer periods of questionable data were externally checked for consistency and treated as missing data (e.g., subsurface flow during dry conditions without precipitation). Stream runoff was recorded in 5-min intervals. Detailed analyses were performed on soil samples from three plots per field. These included laboratory analyses on soil texture, bulk density and organic content by loss on ignition. Additionally, the water retention curve was determined in a range from pF = 1.8 to 3.0 using the ku-pF-apparatus of UGT (Müncheberg, Germany) [49]. Points with higher suction were determined with a membrane press. The saturated hydraulic conductivity before and after harvesting was measured at different depths using a compact constant head permeameter [50].
The datasets of continuous time series and point soil measurements are presented to give information about the general field characteristics as well as the comparability of the fields. Continuous data of different time steps were aggregated to daily values. The aggregated data were used to describe and analyze the framework conditions of the subsurface flow events. The precipitation and subsurface flow time series were divided into single events. The aim was to find similarities and differences among the sites and the framework conditions. The following parameters were determined to characterize the respective events:
- Beginning, end, duration, and sum of the precipitation event
- Beginning, end, duration, and volume of the individual subsurface flow sections
- Duration between start of precipitation and start of subsurface flow (= response time)
- Precipitation sum and maximum precipitation intensity during the response time
- Shares of flow volumes of sections, segments and levels
For the statistical analysis, the flow events were grouped depending on the time of year (winter, summer), the precipitation characteristics (advective, convective) and the genesis of the events (rain-induced, thawing).
3. Results
3.1. Soil Hydraulic Properties
An overview of the soil properties at the measurement site is given in Table 2. The data are divided into the three land use types and different depth categories. The textures of the three land use types are similar and include loam, clay loam and silt clay loam soils. The soil hydraulic properties show larger variations among the land use types, especially in the upper soil layers.
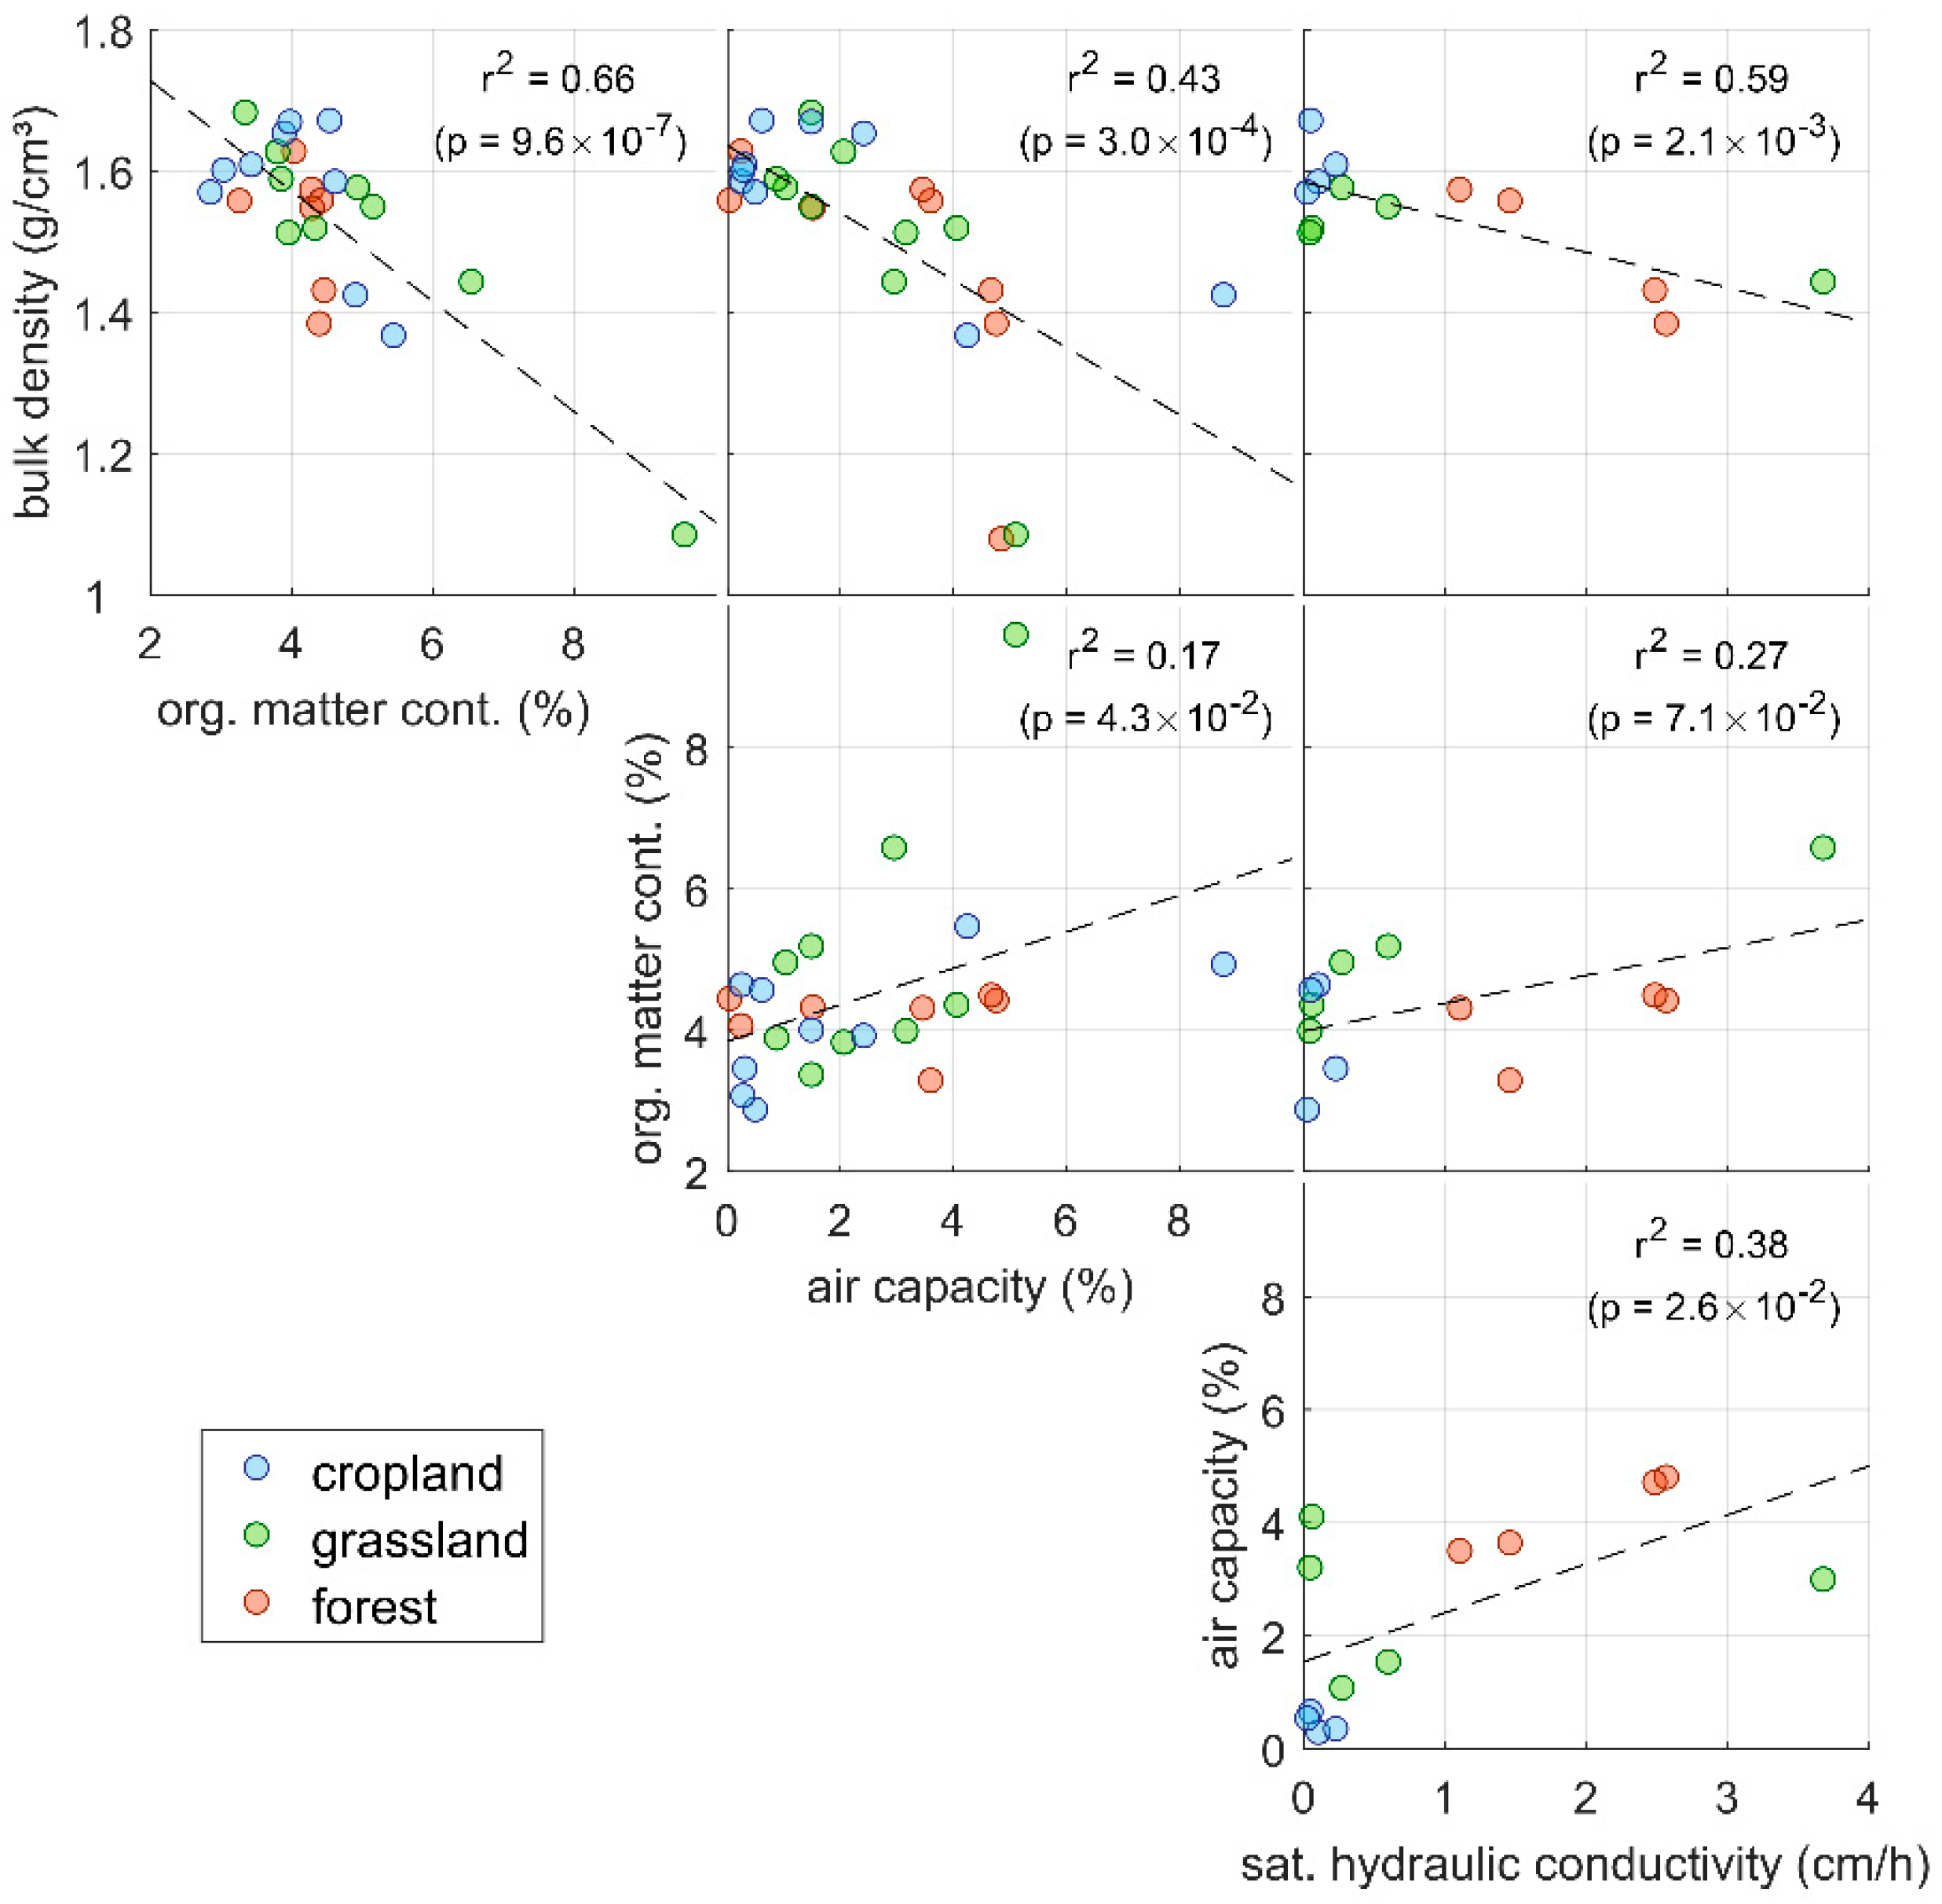
The depth profiles of bulk density, organic matter content and saturated hydraulic conductivity display similar tendencies with distinct land use differences. While bulk density generally increases with depth, the other parameters decrease. The cropland site has the highest bulk densities and shows the largest differences to the other land uses near the surface. The organic matter content is highest in the top layers of the grassland site and decreases with depth. While the organic matter content of the cropland is generally about 1% lower than the one of the grassland site, the depth distribution in the forest is almost constant. The highest saturated hydraulic conductivity was measured in the top layer of the grassland site. On average, the forest site shows the highest values. The conductivities in the cropland site are largely influenced by the soil management practices: The conductivities before harvesting are 4 to 18 times higher than afterwards (Table 2). Correlations among the soil properties were observed across the three sites (Figure 4). The p-values indicate that all correlations except one (org. matter content and sat. hydraulic conductivity) can be considered significant (p < 0.05).
The depth profiles of the plant-available water content and the air capacity show a contrasting behavior among the land uses. The air capacity of the cropland site is high at the top but decreases rapidly to its minimum at the plow layer (20–40 cm), while the plant-available water content is highest at 20–40 cm depth. The grassland site has a relatively constant plant-available water content and air capacity, which decreases slightly with depth. On the forest site, air capacity and available water capacity react in opposite ways. The air capacity is high in the top layer and decreases to very low values at about 40–60 cm depth. The plant-available water content is maximum at this depth range.
3.2. Framework Conditions of Subsurface Flow Events
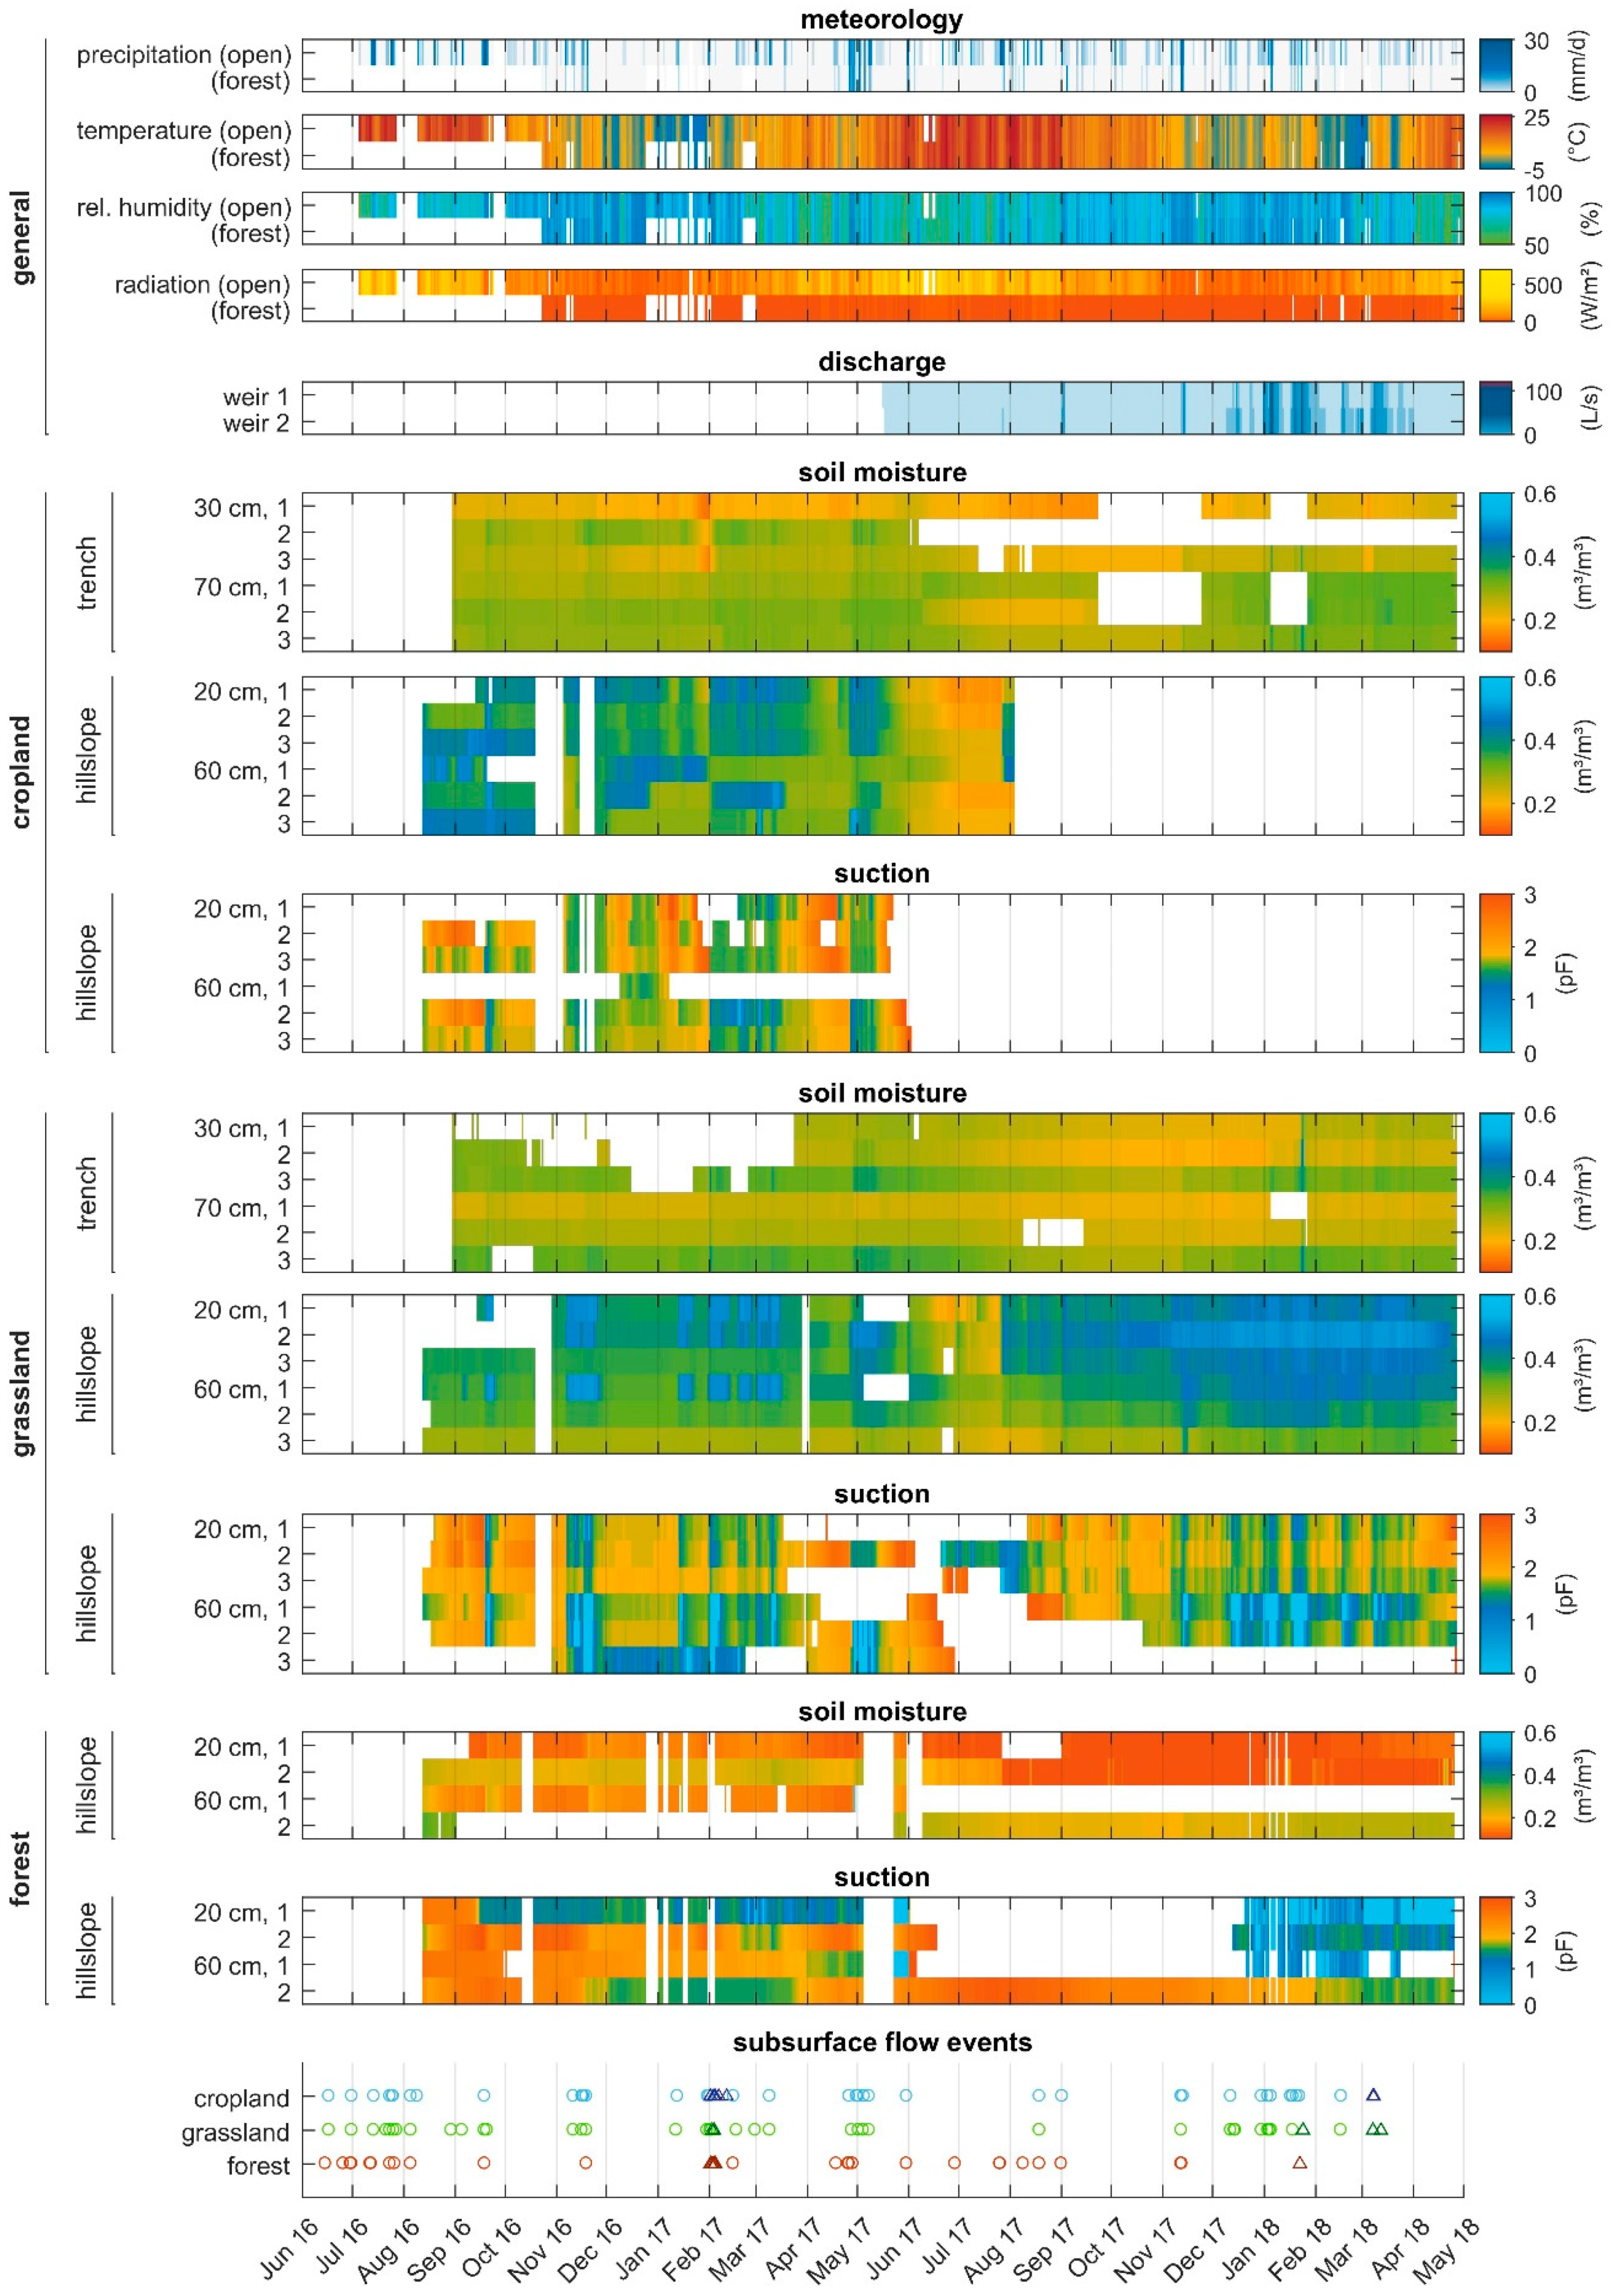
Subsurface flow events are induced by meteorological conditions, which also affect the soil water budget. Figure 3 shows an overview of the data that were measured at the study site from June 2016 to May 2018. The data include the meteorological conditions of the open area and the forest. Additionally, the resulting effects on the discharges at the two weirs in the Rambach and on soil moisture and suction for different land use types, positions and depths are displayed.
3.2.1. Annual Soil Water Budget
The soil moisture measurements within the trenches are generally lower than at the three positions upstream of the trench and only show a distinct reaction to large rainfall events. The grassland site has the highest soil moisture status, which increases towards the bottom of the slope. The soil moisture in the forest is considerably lower. In the cropland field, a similar behavior of the soil moisture variations can be found for the individual measurement depths. The soil moisture differences between the measurement depths become smaller during the vegetation period.
The depth dependency of the suction in the cropland field changes during the vegetation period. During periods with little vegetation and shallow roots, the suction at 20 cm is higher than at 60 cm. From the middle of May onward, this dependency is reversed. Generally, periods with low suction start earlier and have a longer duration at the bottom of the hillslope compared to the top. On the grassland site, the suction is generally lower at 60 cm than 20 cm depth, but no clear tendencies of the positioning on the hillslope can be found. On the forest site, suction often reacts independently or contradictory to the soil moisture measurements.
The discharge in the Rambach shows little reaction to precipitation events during the vegetation period (April–October, , ), which is also characterized by comparatively low soil moisture conditions ( Vol.-%). Larger events usually occur during the winter season (November–March, , , soil moist.: Vol.-%).
3.2.2. Occurrence and Types of Subsurface Flow Events
The occurrence of subsurface flow is heterogeneous regarding the different land use types and the trench sections. The subsurface flow is generally fast reacting and events have a relatively short duration of several hours (quartiles: approx. 2.5 h and 27.5 h, median: approx. 10.6 h, mean: approx. 22 h). A comparison of the three sites results in about 40 to 45 registered events at the grassland and the cropland sites, which usually take place at the same time (Figure 3). Only 30 events were registered in the forest.
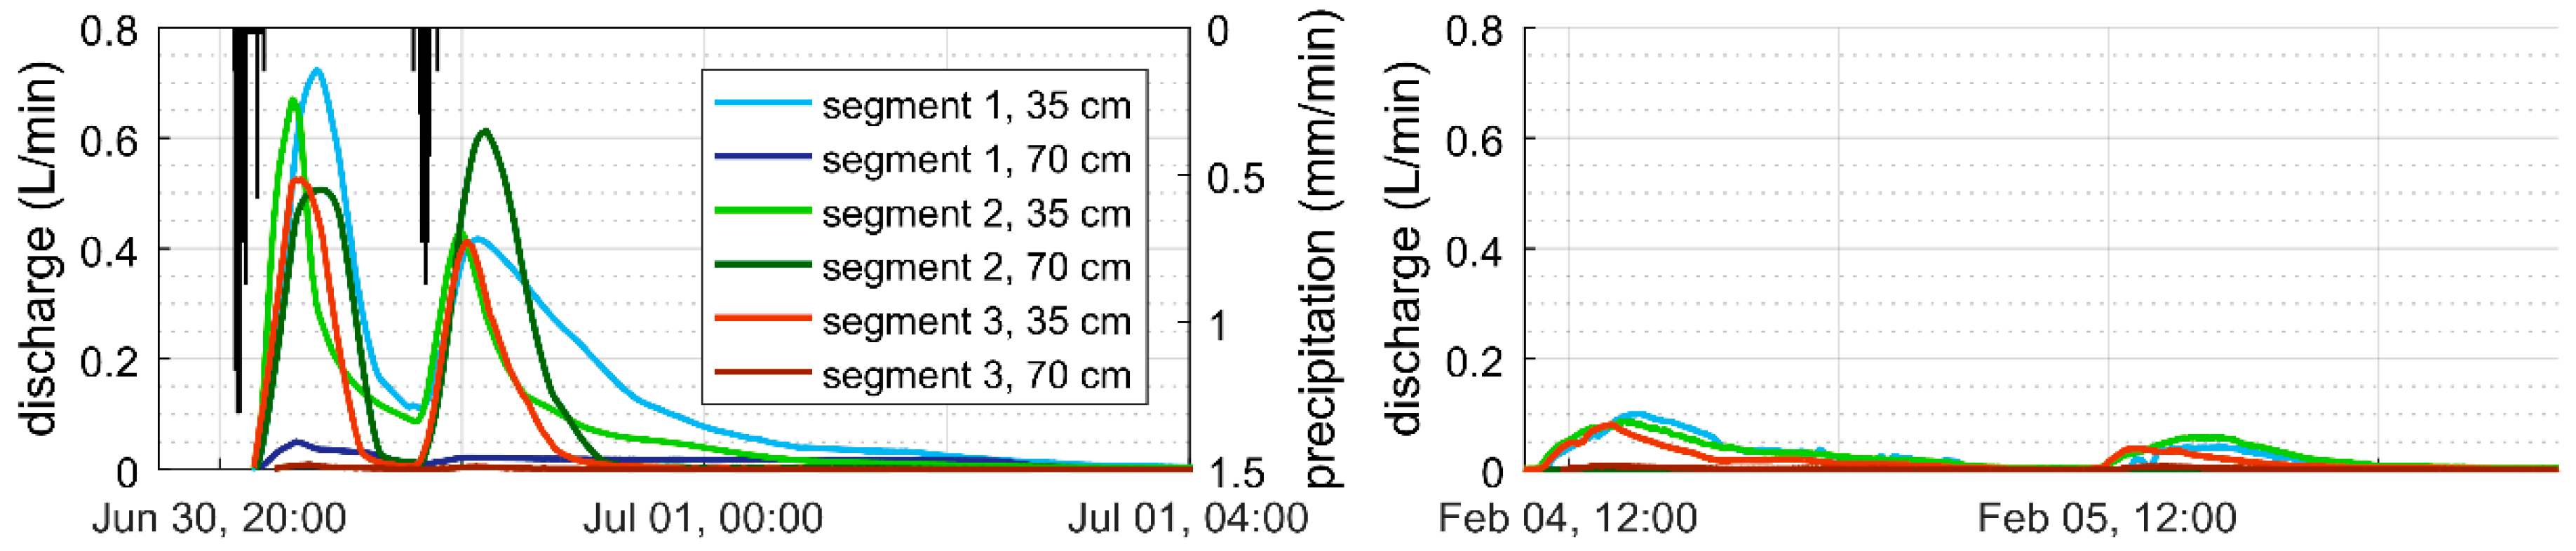
The recorded subsurface flow events can generally be subdivided into rain-induced events and thawing events, which occur when the soil begins to thaw following a freezing period (Figure 5). Due to the differing characteristics of the two types, they are analyzed separately. Events due to thawing soil usually start around noon after several hours of elevated air temperatures and have a duration of less than 1 day. The amount of water is low compared to rain-induced events. Rain-induced events show more heterogeneous characteristics concerning the share of flow volumes, the total flow volumes and the response times. The differences among rain-induced events are quantified in the following sections.
3.2.3. Impact of Land Use and Topography on Soil Moisture Profiles
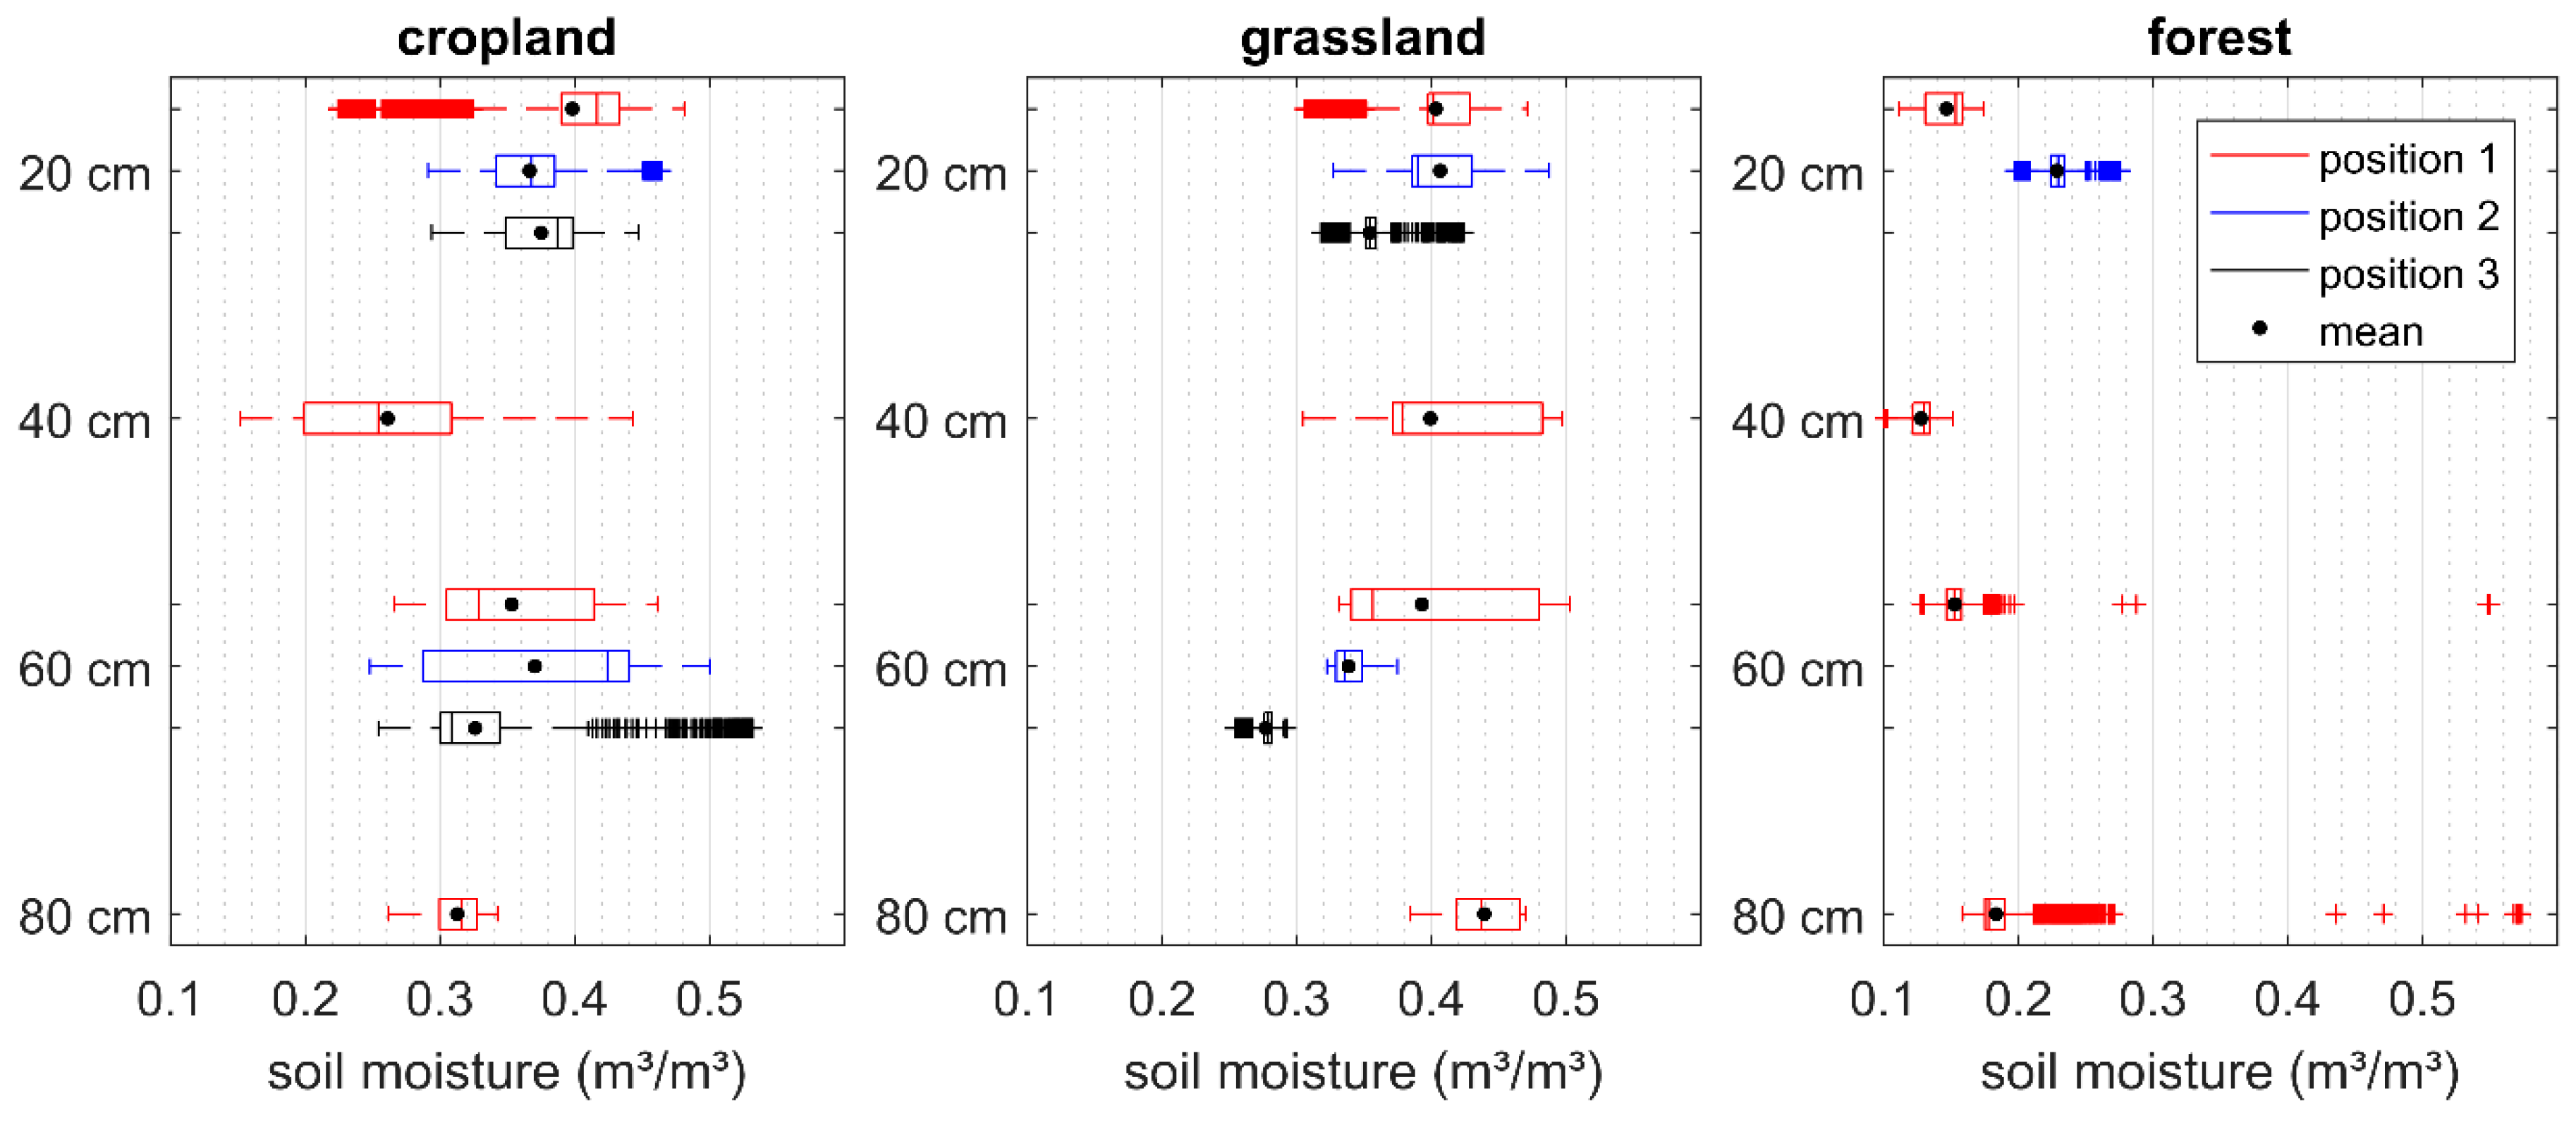
Figure 6 shows a comparison of the depth-dependent soil moisture distribution for the three land uses. Only periods that have valid measurements for all instruments are included, resulting in 9552 data points, which equal a duration of about 3 months and consist of data from September 2016 to May 2017.
The characteristics of the depth-dependent soil moisture distribution of the three land uses show distinct differences. The quartiles of the soil moisture in the forest are narrow with many outliers at a depth of 60 and 80 cm. The mean soil moisture increases with depth from 15 Vol.-% at 20 cm to 18 Vol.-% at 80 cm depth. The soil moisture conditions upslope are considerably higher ( Vol.-%), but still on a low level when compared to the cropland and grassland sites. The plot positioning has a clear dependency in the grassland site. With increasing distance to the bottom of the hillslope, the average soil moisture as well as the width of the quartiles decrease. The soil moisture at position 1 is almost depth-independent with a mean value of about 40 Vol.-%. In contrast, the average soil moisture at position 3 is notably lower with 35 Vol.-% (20 cm) and 28 Vol.-% (60 cm). The cropland field shows the largest range of different soil moisture values without considering outliers but does not show any distinct differences in the positions. The soil moisture at a depth of 40 cm has an average of 26 Vol.-%, a value considerably lower than the measurements above ( Vol.-%) and below ( Vol.-%).
3.3. Subsurface Flow Volumes
3.3.1. Impact of the Land Use Type and Topography on Subsurface Flow Volumes
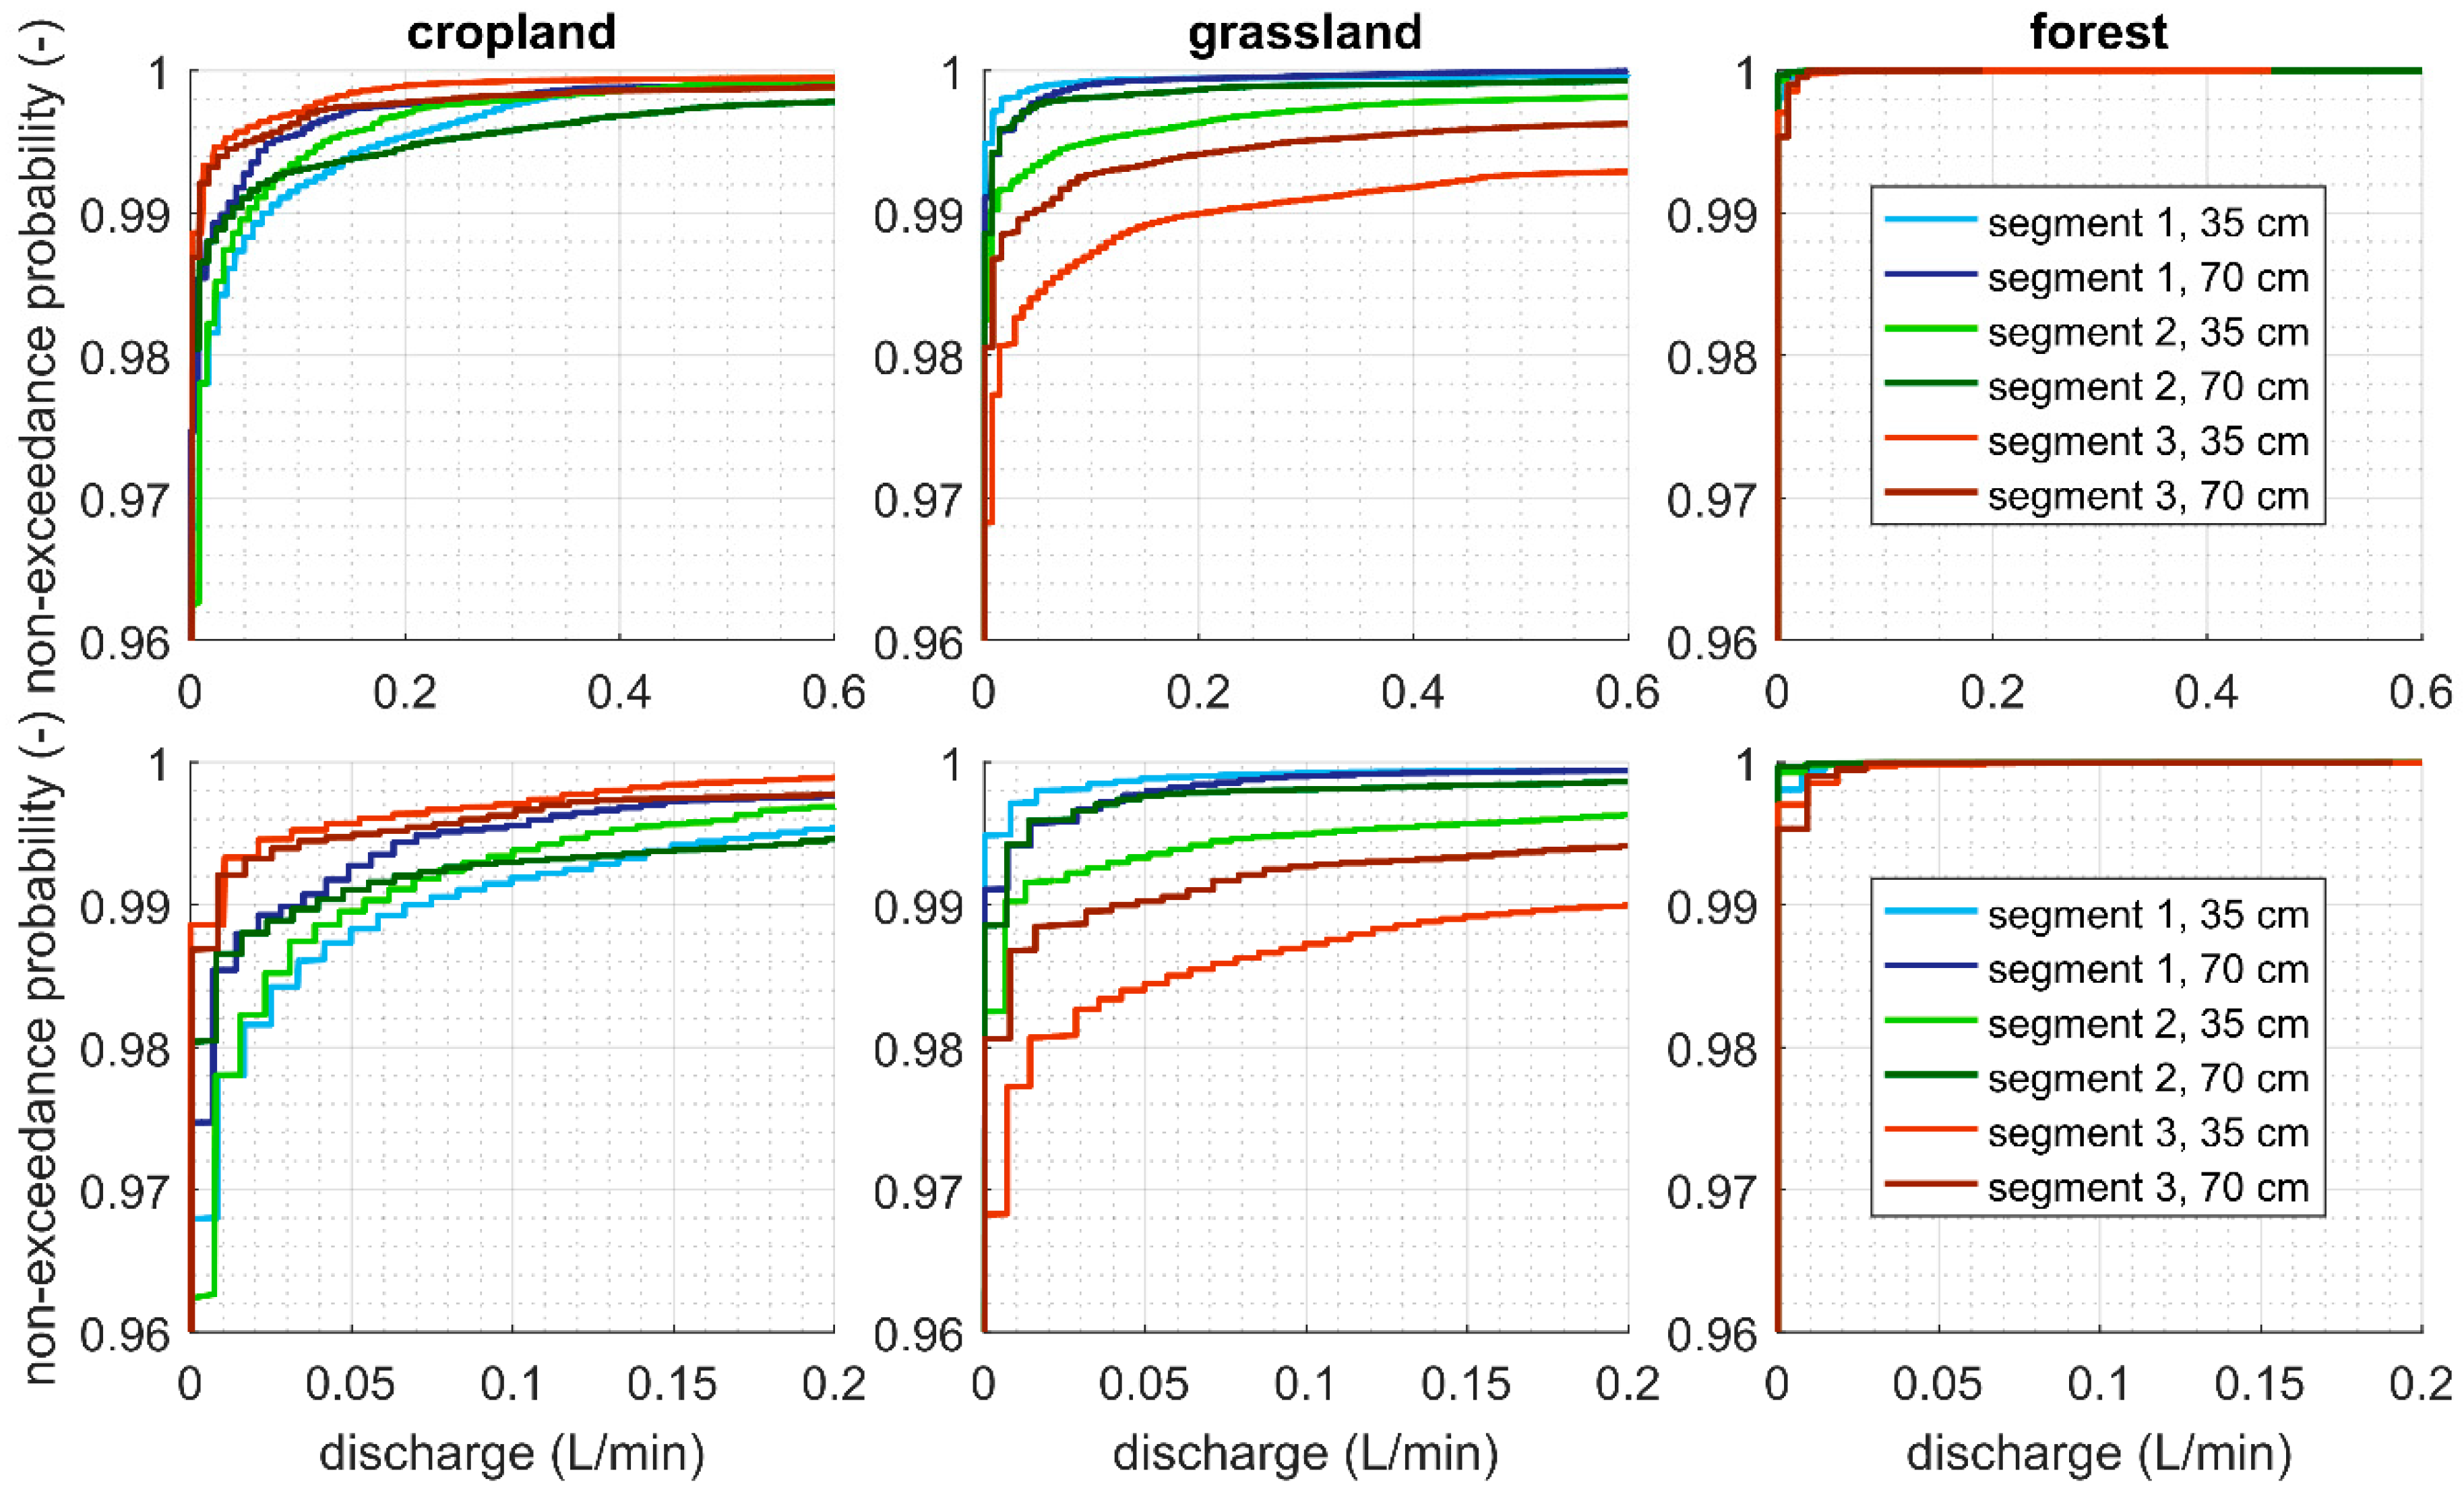
The magnitude and frequency of occurrence of lateral subsurface flow varies strongly among the three sites (Figure 7). The difference indicates the influence of the local topography, the respective accumulation areas (Table 1), and the effects of the different land use types. The non-exceedance probabilities of the subsurface flow in Figure 7 are limited to 0.6 L/min, which is within the range of reliable data for the used tipping buckets.
The effects of the topography as well as the heterogeneity of the soil hydraulic properties result in variation of the six trench sections per land use type. The longest duration of subsurface flow was recorded in segment 2 of the cropland site. While low discharges occurred more often in the upper level, larger discharges were more frequent in the lower level. The distribution of flow volumes in the grassland site is predominately separated by segments rather than by depth levels. The magnitude of flow volumes increased from segment 1 to segment 3. While discharge rates below 0.14 L/min occurred more often at the cropland site, larger discharges dominated in the grassland site. Discharge rates above 0.6 L/min were observed 2.2 times more often at the grassland site than at the cropland site. The volume differences among the sections of the grassland site were larger than those between grassland and cropland. The durations as well as total subsurface flow volumes in the forest were distinctly lower than those of the other land use types.
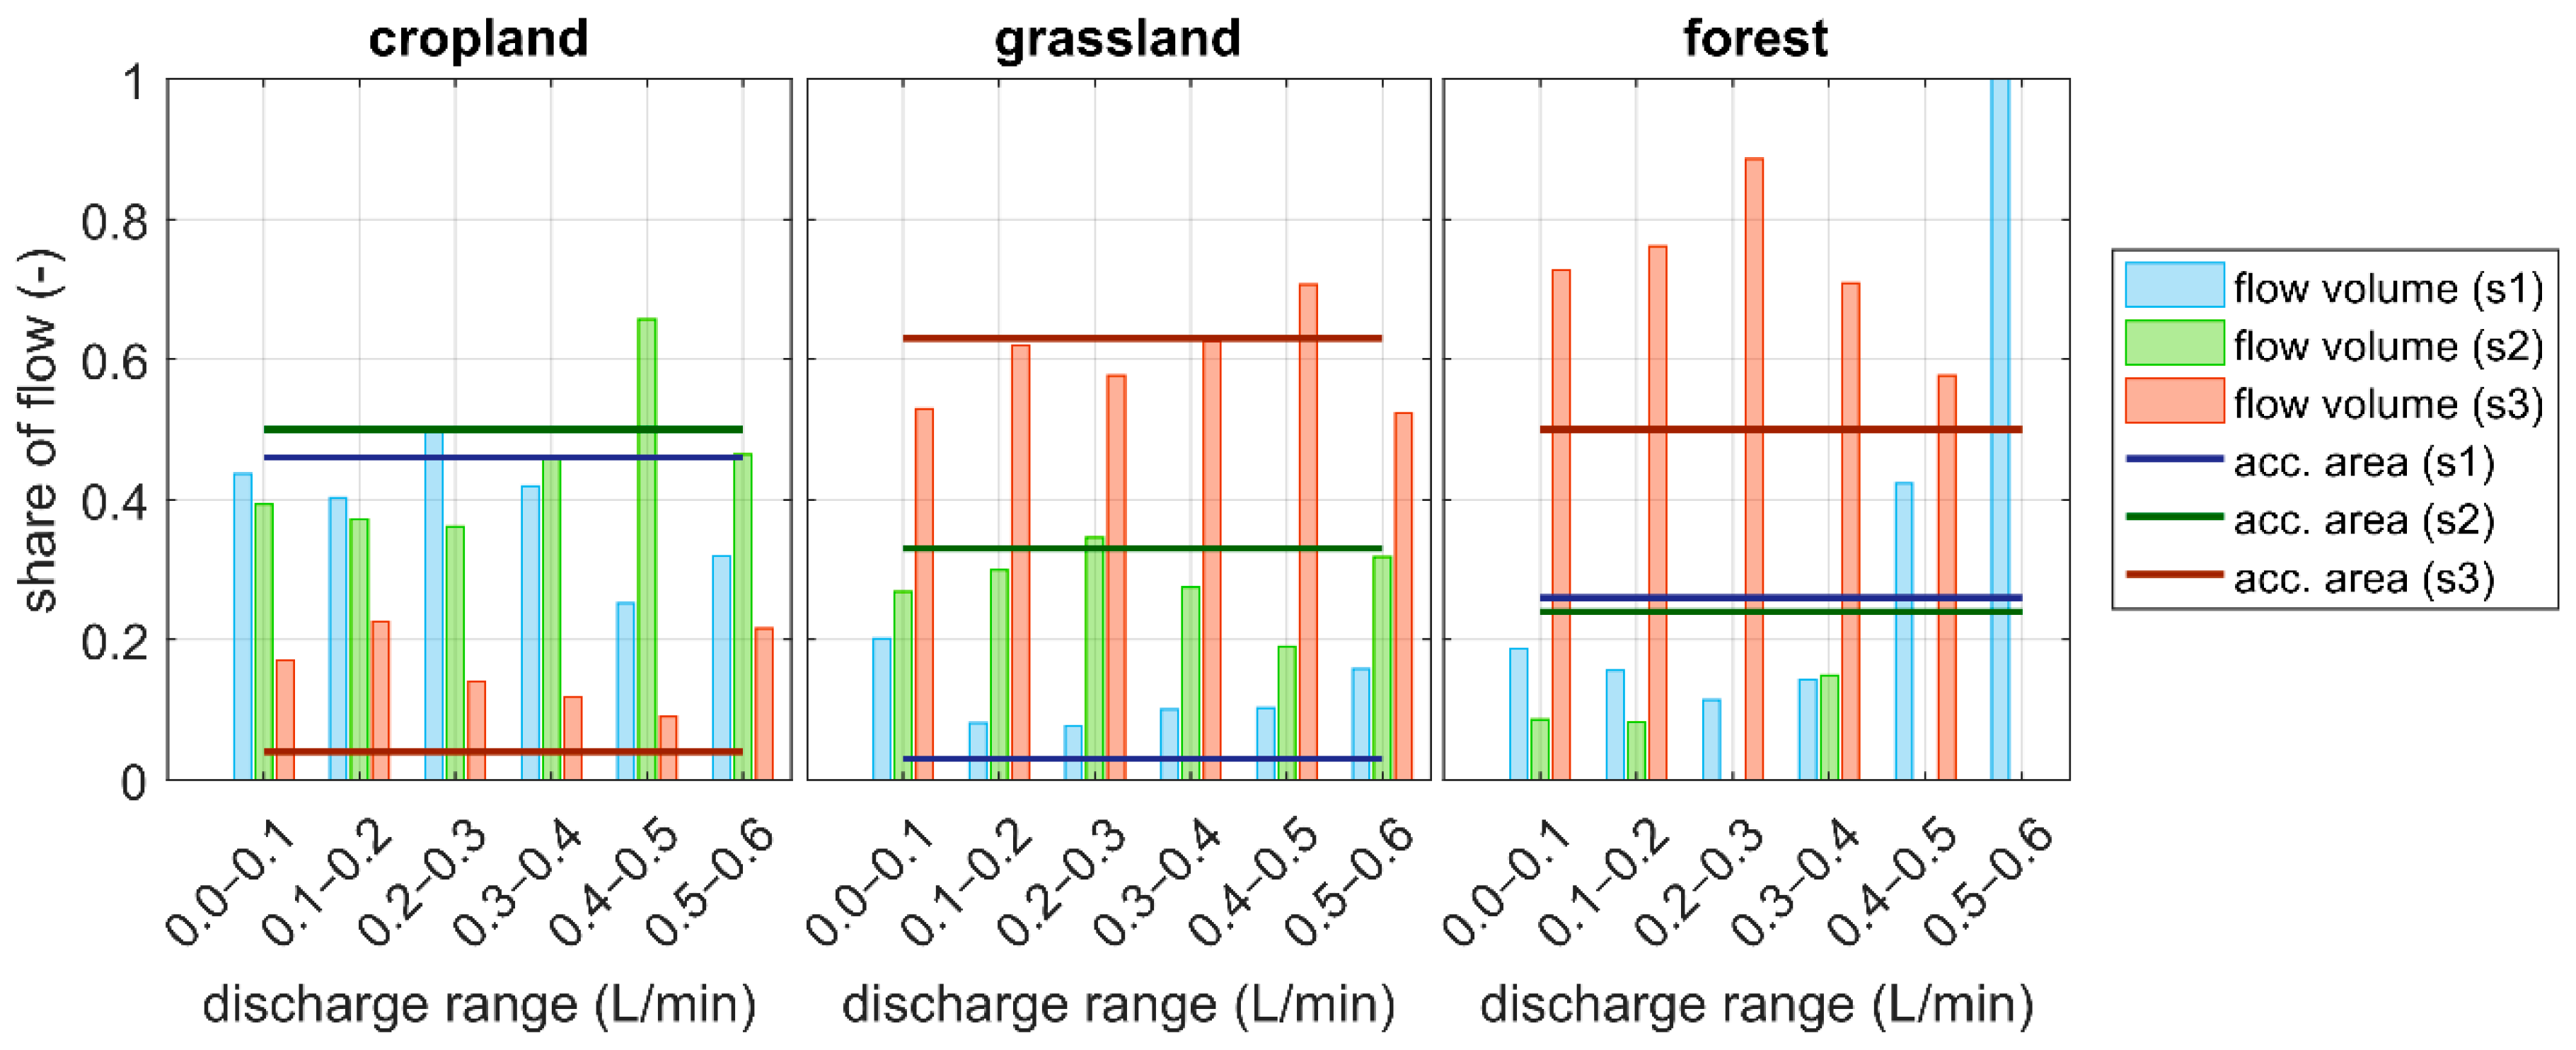
The relative horizontal distribution of subsurface flow volumes at different discharge ranges (Figure 7) and accumulation areas of the respective flow pathways of the surface topography (Table 1) show similar magnitudes (Figure 8). The dependency is more distinctive at the cropland and grassland sites than in the forest. The flow shares vary among the discharge ranges for each land use type. The largest horizontal differences can be found for discharges from 0.4–0.5 L/min in the grassland and the cropland field. In general, the differences between the three segments are very diverse for the three sites but show a distinct correlation to the respective topography. The correlation coefficient of the mean segment shares the overall discharge ranges, and the shares of the accumulation areas for the three sites is r² = 0.76.
3.3.2. Impact of Season and Soil Cultivation on Subsurface Flow Variability
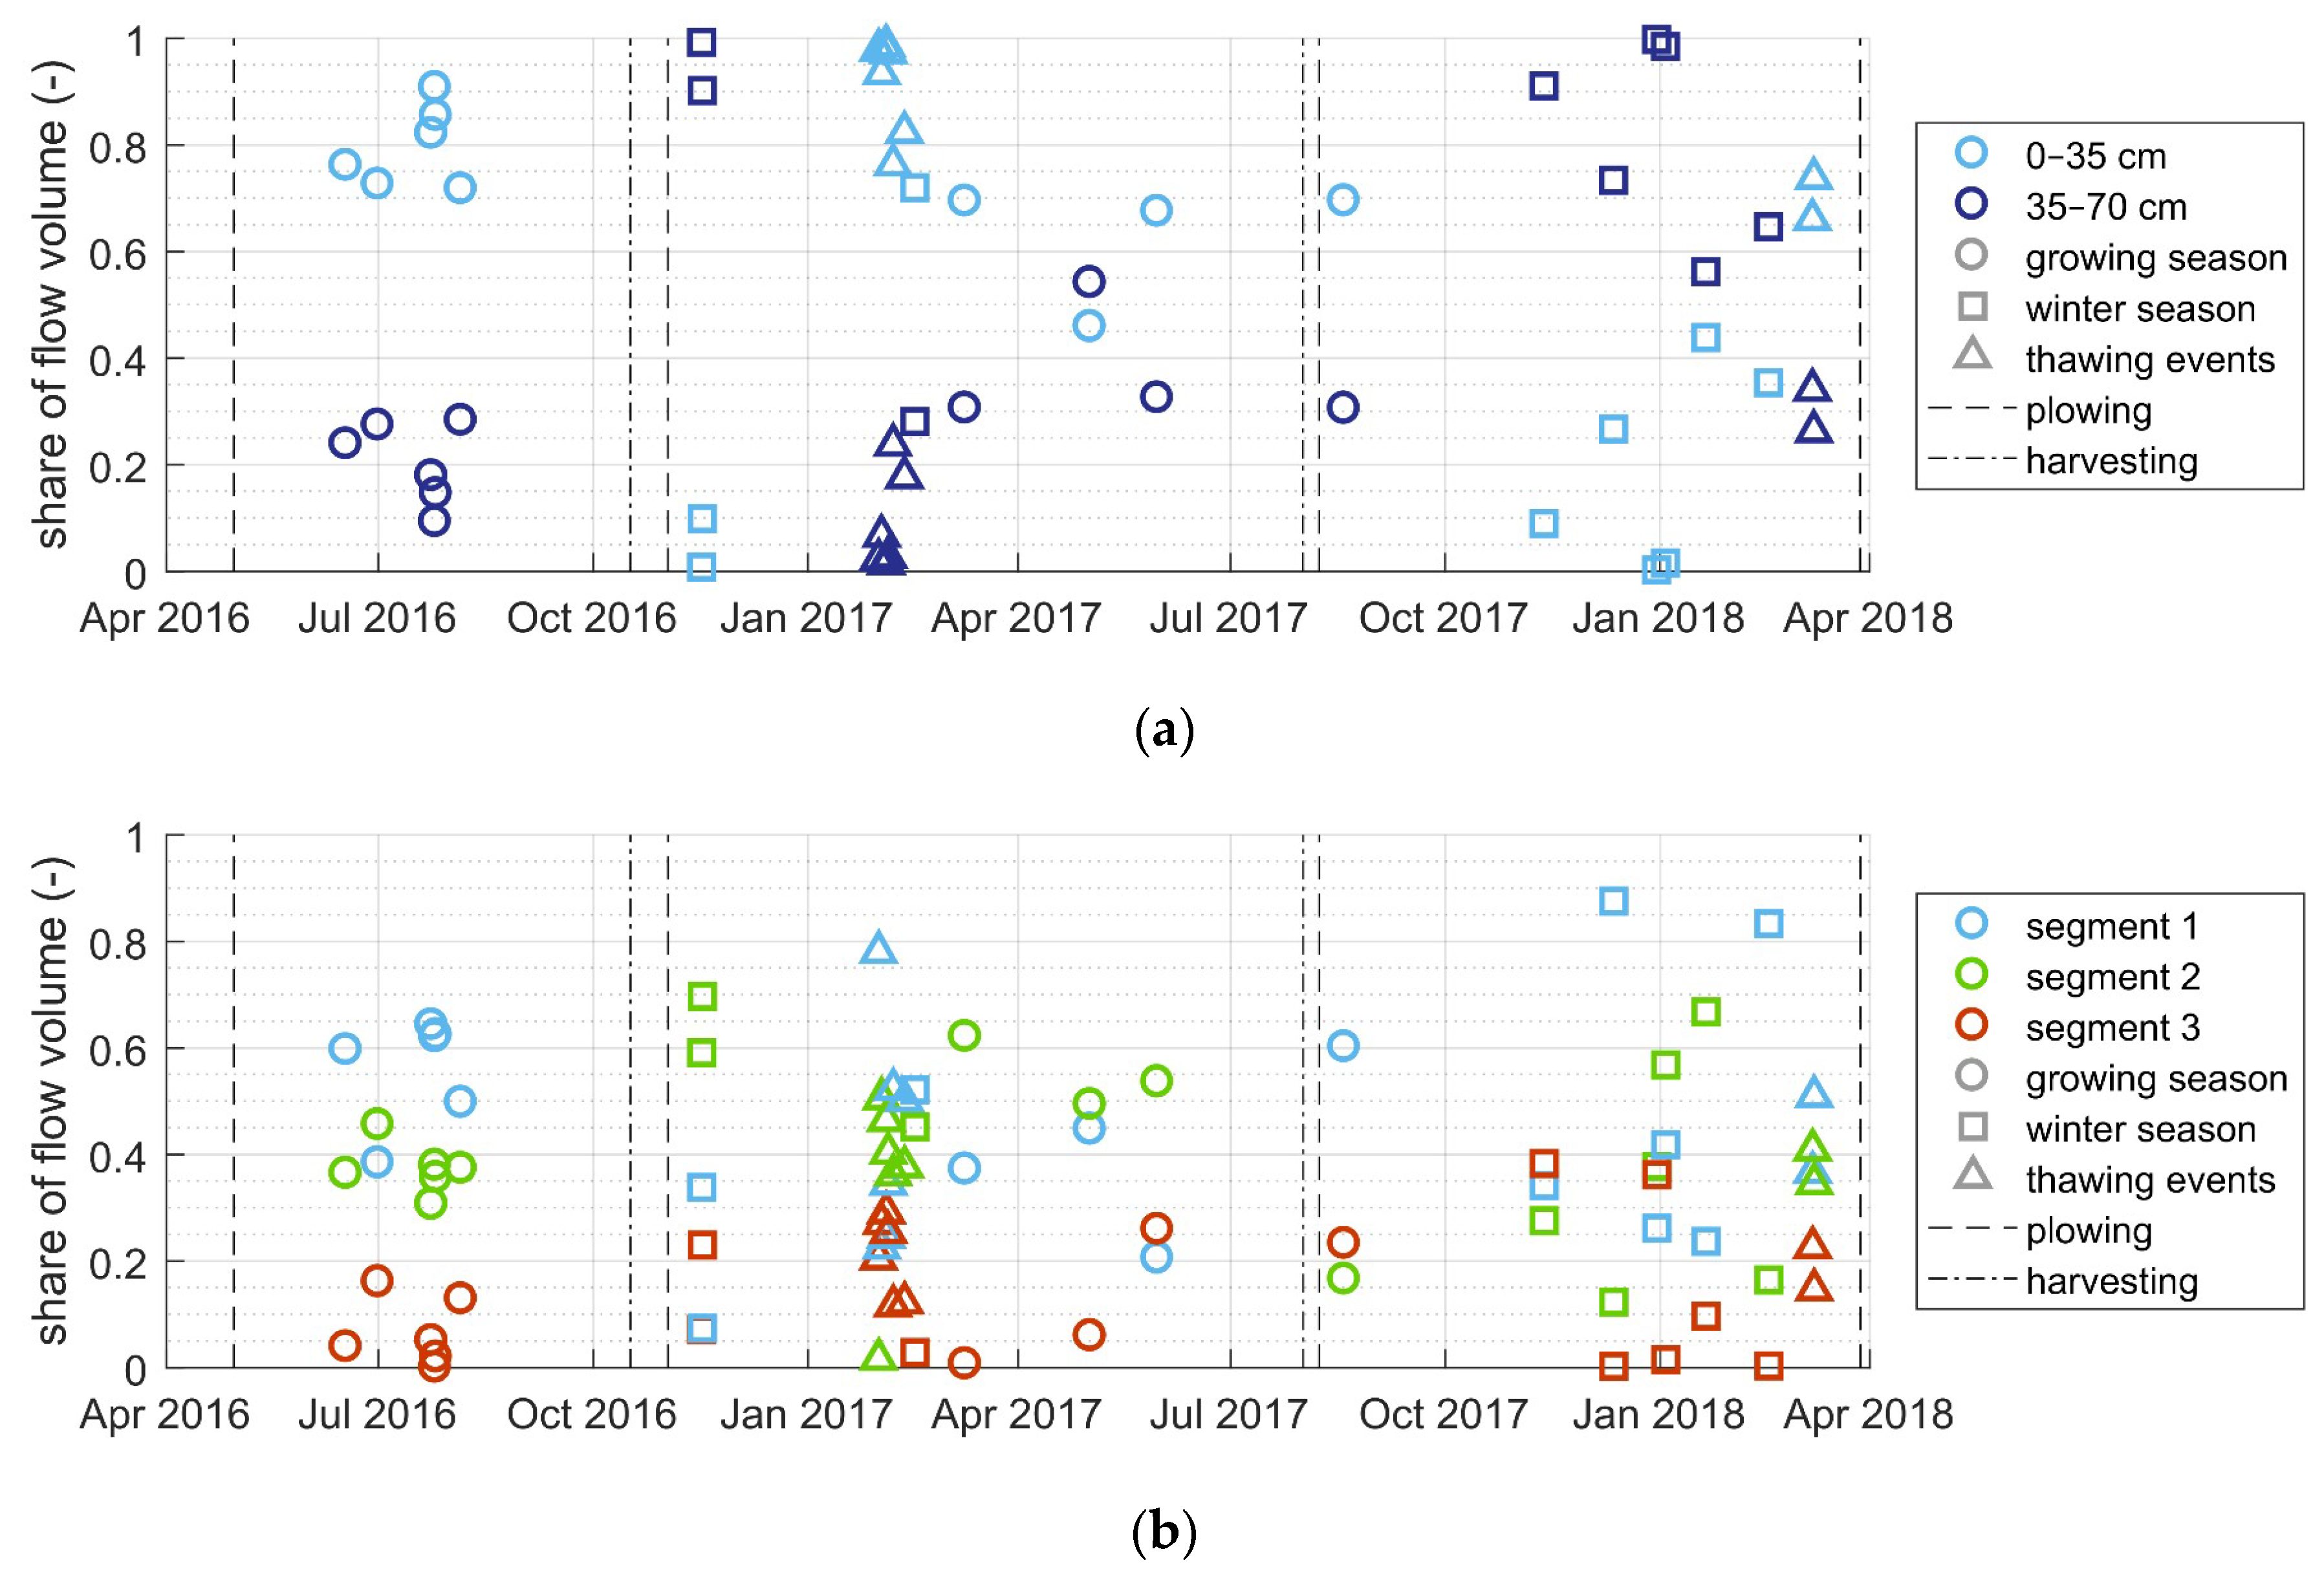
The characteristics of subsurface flow events at the cropland site change throughout a year (Figure 9). The share of flow volumes is shown in the vertical direction (Figure 2: level 1, level 2; Figure 9a) and the horizontal direction (Figure 2: segment 1 to segment 3; Figure 9b). Furthermore, the dates of harvesting and tilling are included. Events are separated into two typical periods (growing and winter season) and two different characteristics (rain-induced events and thawing events).
Subsurface flow events during the growing season have a similar share of vertical subsurface flow volumes with an average of 73% flow from the upper layer (Figure 9a). Wet preconditions usually result in higher shares. The largest vertical differences were found for events with high precipitation intensities and short precipitation durations. Thawing events usually have an even higher share of flow from the upper soil layer (). Winter events after plowing with a low vegetation coverage show a very diverse behavior and an opposing distribution of shares compared to the vegetation season (upper level: . The events at the end of the winter season, which include thawing events, alternate to a similar vertical distribution as during the vegetation period. During the growing season, segments 1 and 2 have dominating flow shares in the horizontal direction (Figure 9b; , , ). Winter events show a higher heterogeneity among the three segments, but no characteristic distribution of flow volumes could be found. The horizontal shares during thawing events are generally more similar (, , ). The temporal variations of the other two sites are less pronounced and do not show any distinct dependencies to the season of the year.
3.3.3. Impact of Land Use Type on Subsurface Flow Variability
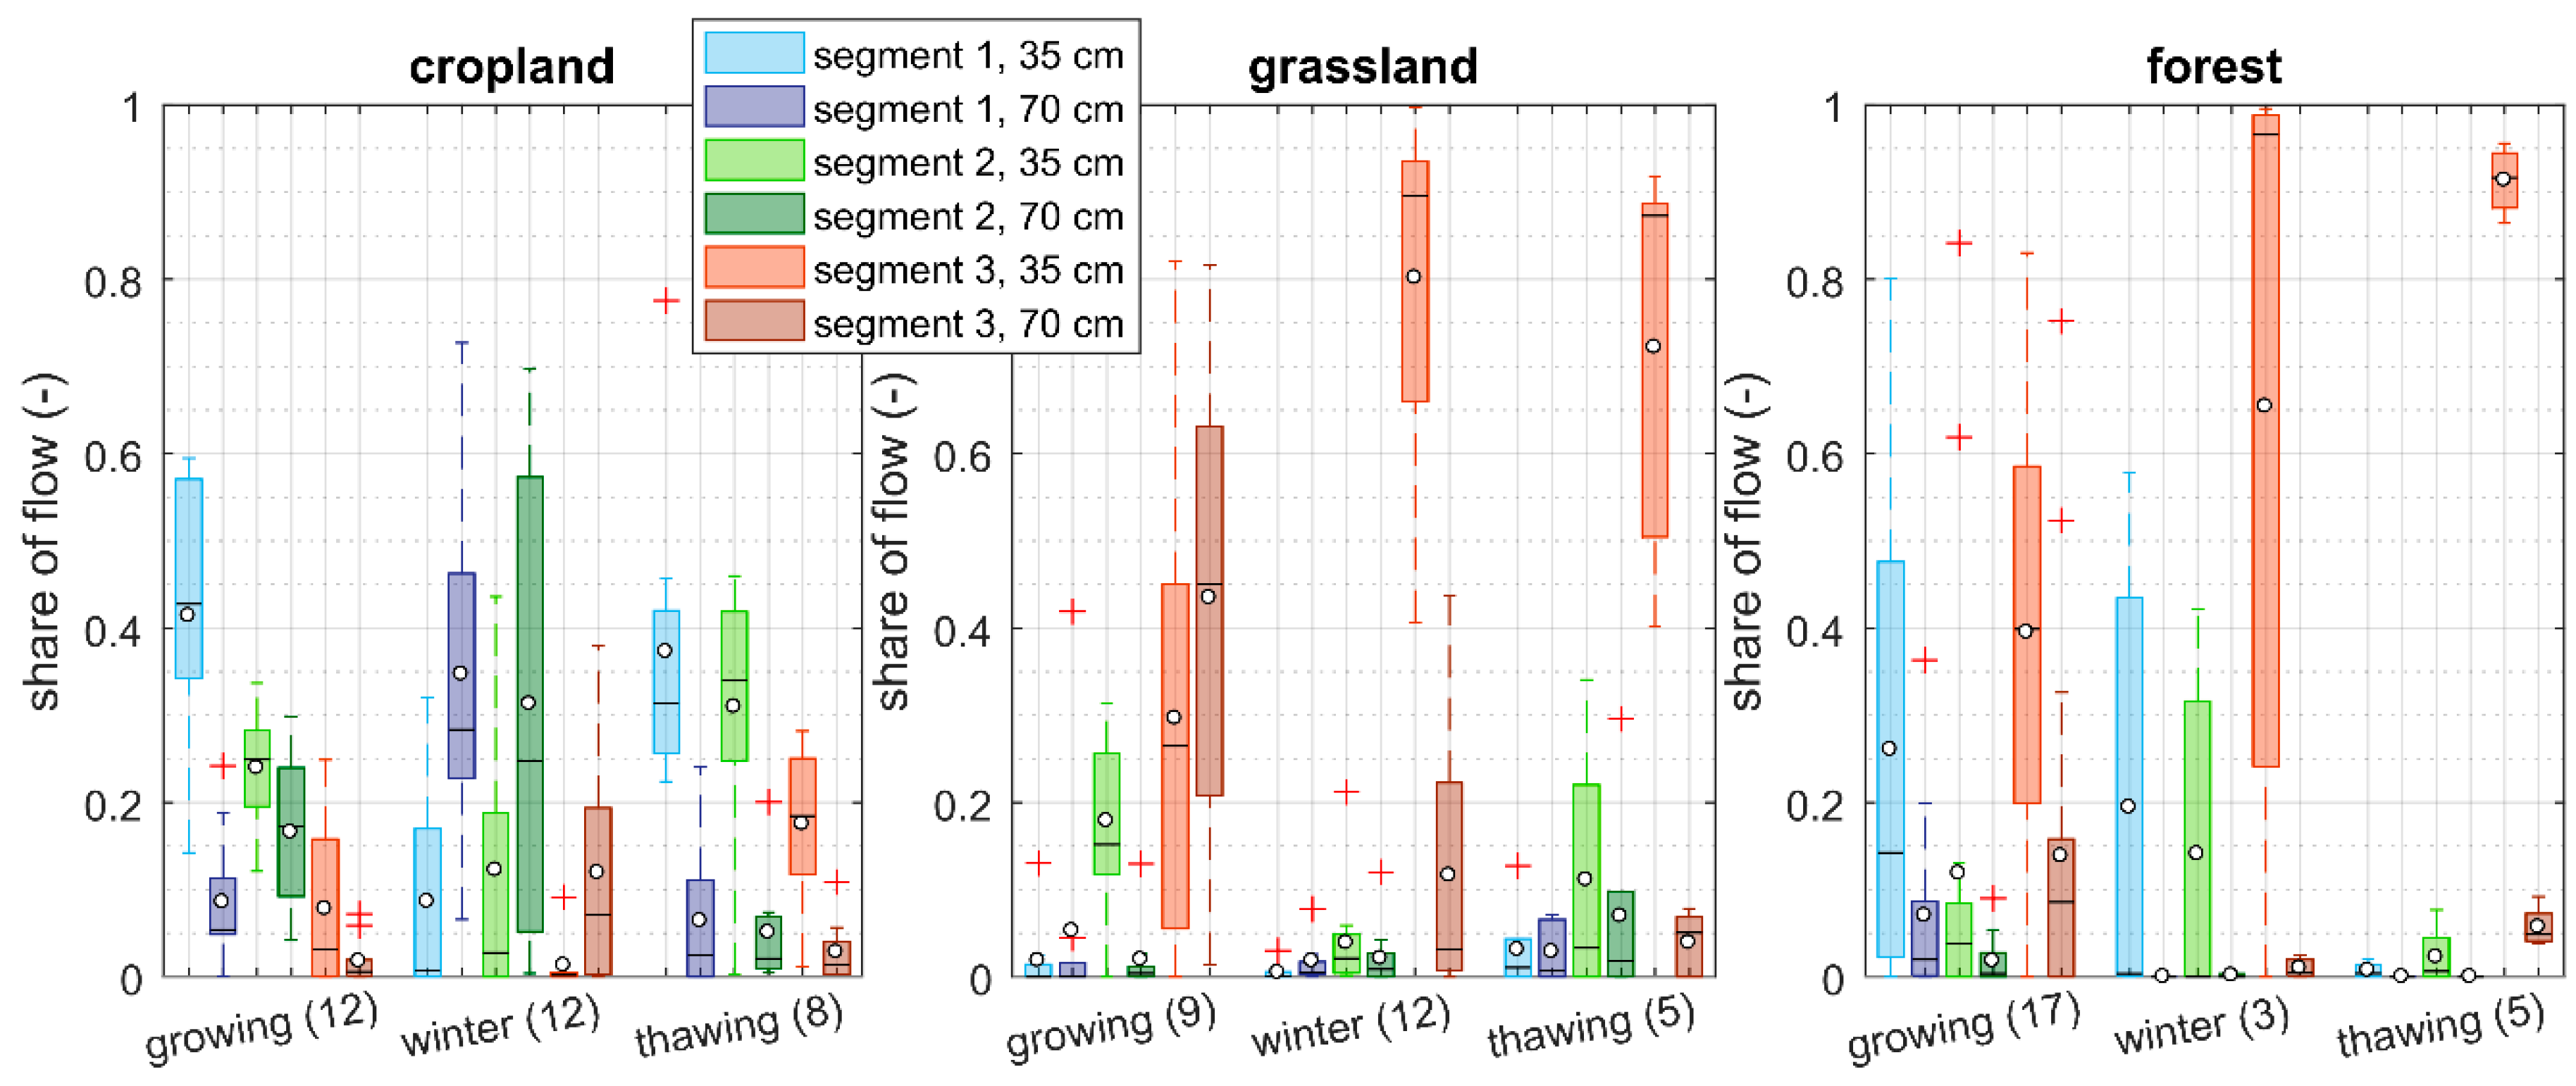
Figure 10 displays the horizontal and vertical distribution of lateral subsurface flow volumes for the three land use types. The volumes of each section are presented as shares of the total trench flow. The rain-induced subsurface flow events are separated according to the time of occurrence (growing and winter season). The third category is thawing events, which have no precipitation input.
The observed differences of the horizontal and vertical subsurface flow volume shares indicate the influence of land use on the flow characteristics. The distribution of the discharge volumes in the cropland shows the lowest heterogeneities. There is a distinct difference between the upper and lower level for all three event classifications. The flow volumes of the upper level are larger for events during the growing season and for thawing events. Rain events in the winter have on average larger flow volumes below 35 cm depth. We observed a constant decrease from segment 1 to segment 3 in the upper level. Segment 2 has the largest flow share below 35 cm depth. Generally, the difference between the levels is more distinct than between the segments.
The distribution at the grassland site shows larger variations than at the cropland site. We found that the variation of the horizontal distribution is more pronounced than the vertical differences. The volume shares increase from segment 1 to segment 3. The upper level of segment 3 has the main contribution during winter and thawing events with on average 80% and 72%, respectively. There is no continuous change of flow volume shares in the horizontal direction at the forest site. We observed maximum discharge shares in the upper level of segment 3 and segment 1 for events during the growing season. Rain events in the winter season are almost entirely contained in the upper level. Thawing events in the forest have the largest heterogeneity among all event classes and land uses with an average flow share of more than 90% from the upper level of segment 3.
Generally, we observed the largest vertical differences at the forest site with shares from the upper level of 75% during the growing season, 83% during the winter season, and 98% for thawing events. The values are averaged mean shares from the three segments per site. The smallest vertical differences were measured at the grassland site with shares from the upper level of 54% during the growing season, 63% during the winter season and 68% for thawing events. The shares in the cropland are similar as stated in the previous section (71%, 24% and 82%, respectively).
3.4. Response Times of Subsurface Flow Events
We defined the response time as the duration from the start of the precipitation event until subsurface flow starts. Thus, it corresponds to the required time for a change in the preconditions to affect subsurface flow. The characteristics of the precipitation event are thus one of the main factors of influence. The rain-induced events of the three land use types were separated into three groups for the analyses. Summer events were divided into advective and convective precipitation events. The third group includes advective events which occurred from November to February.
3.4.1. Impact of Precipitation Characteristics on Response Times
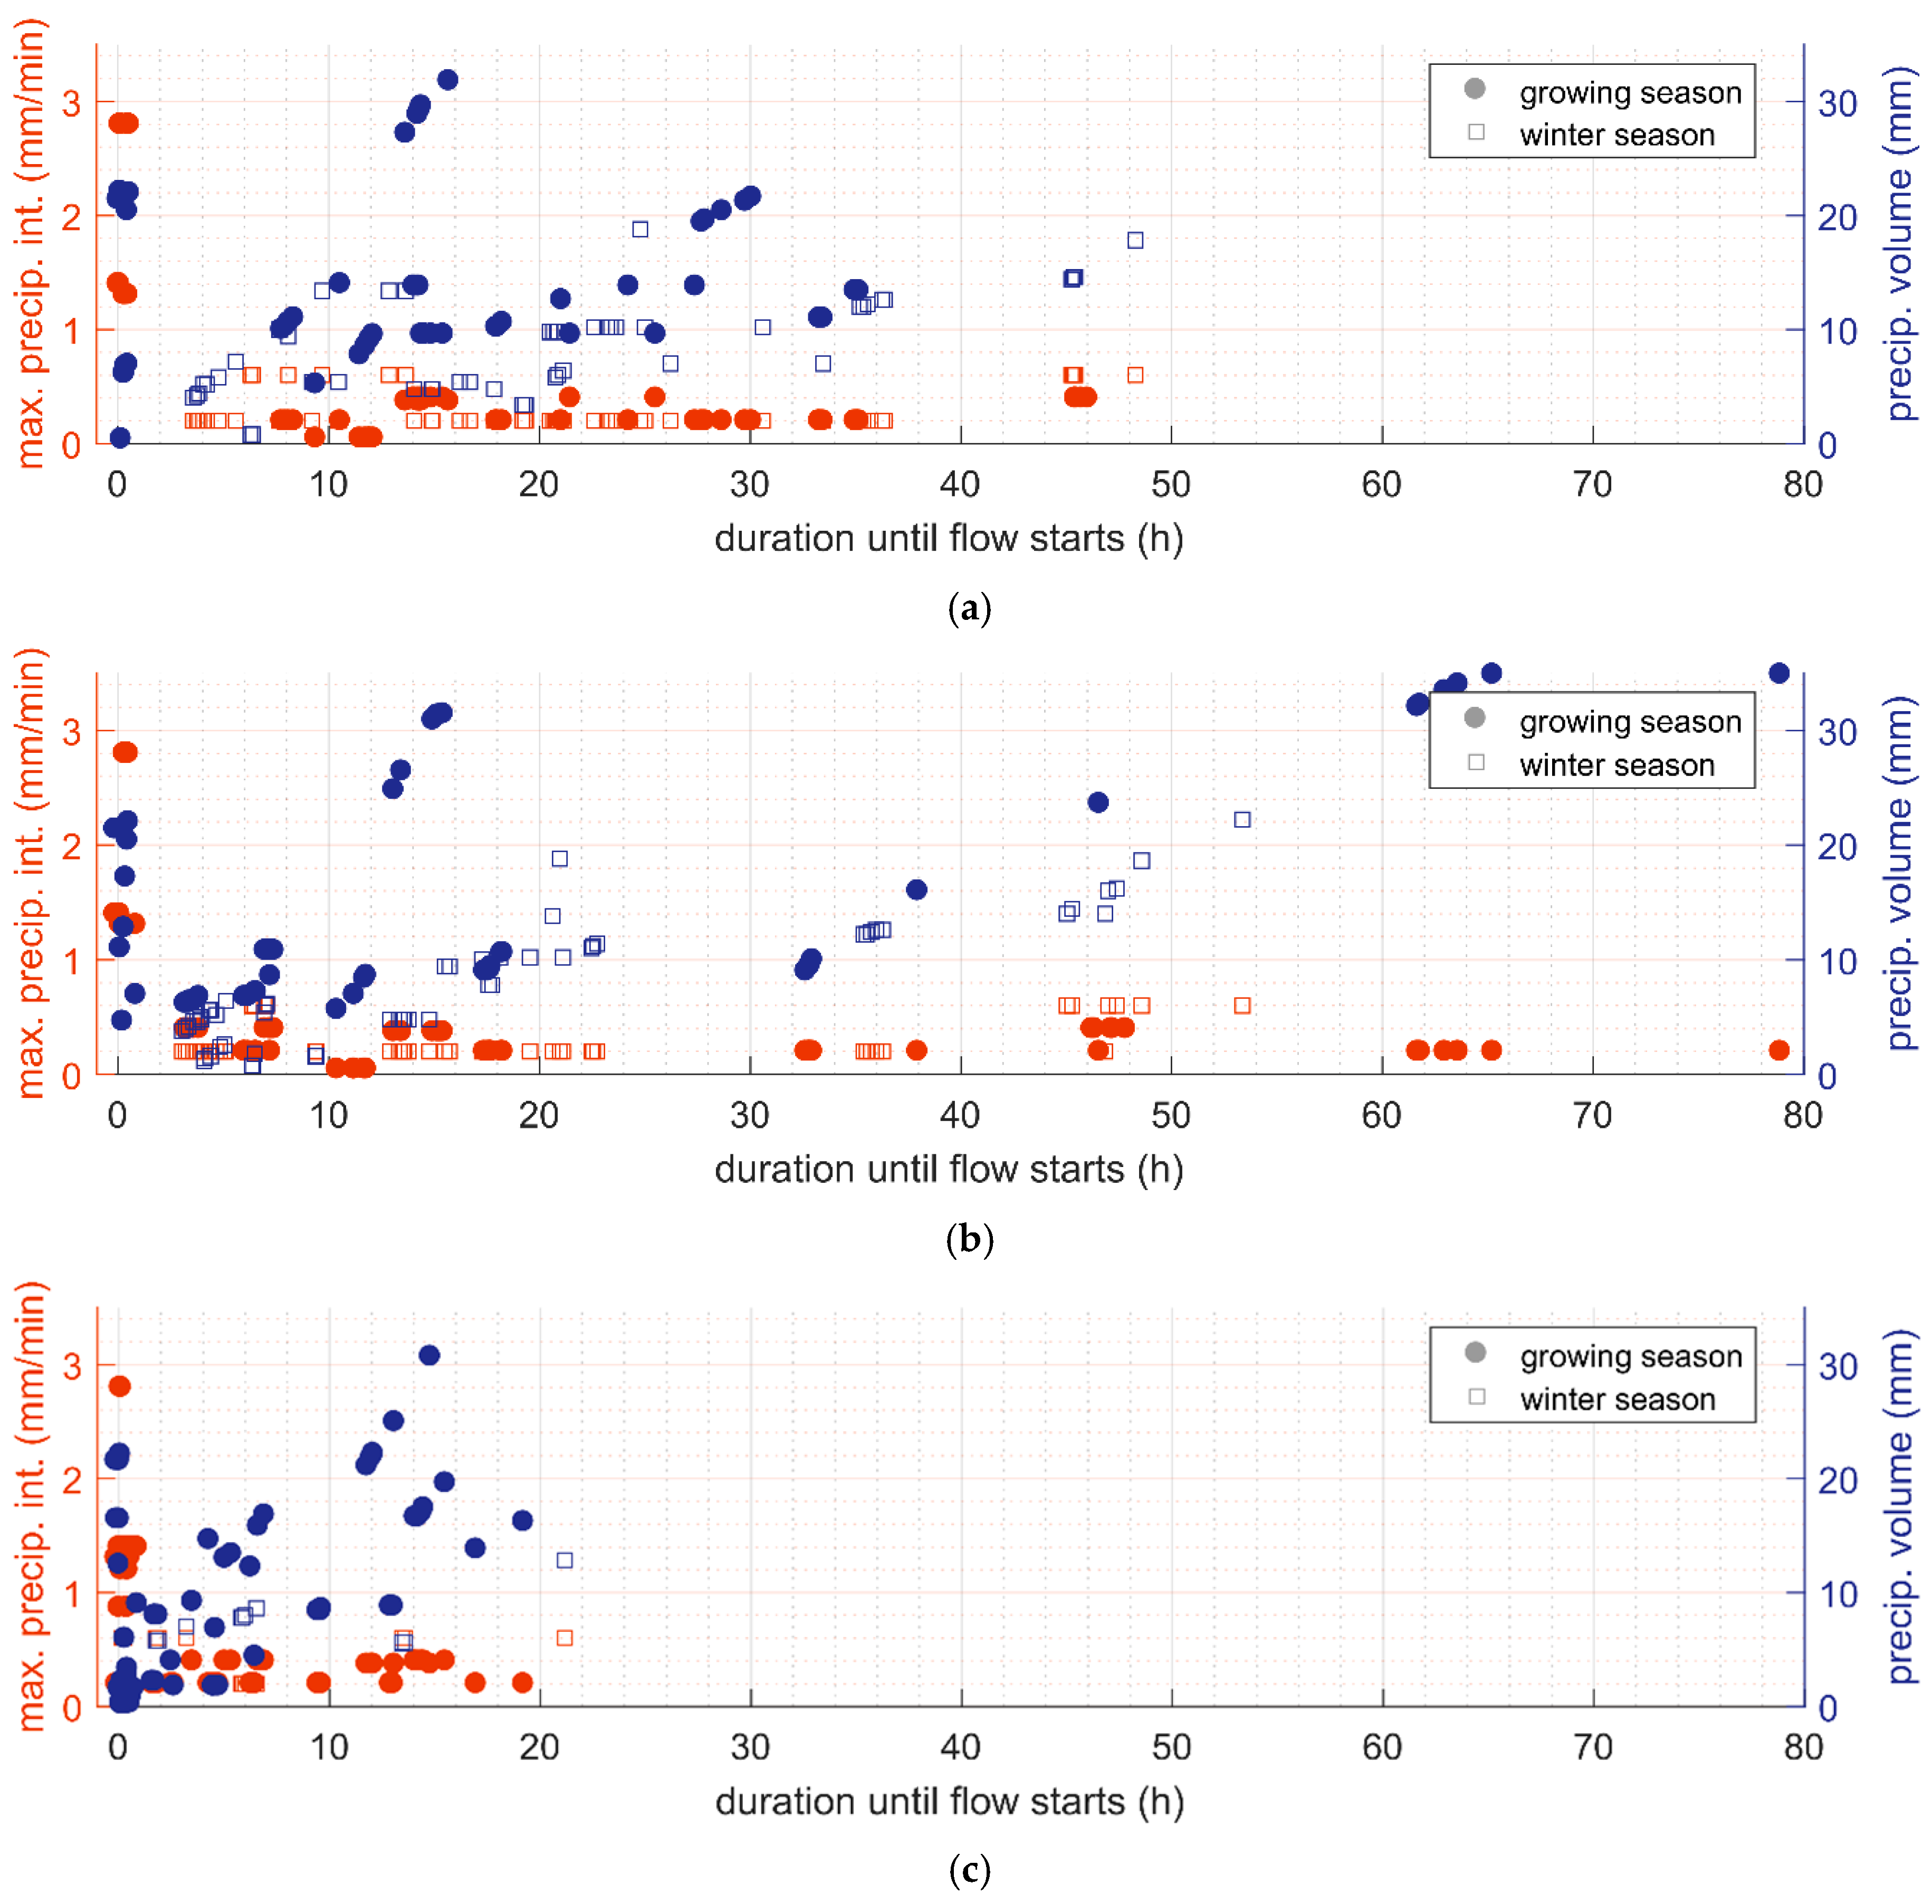
Figure 11 shows the dependency of the response time on the maximum precipitation intensity and the precipitation volume before subsurface flow started. We determined a major difference in the response time for advective (defined when maximum precipitation intensity < 0.7 mm/min) and convective precipitation events (defined when maximum precipitation intensity > 0.7 mm/min). The response time was similar for convective events at all three land use types and did not exceed 1 h. The response times for advective events generally correlate with the precipitation volume. Therefore, we were not able to determine a precipitation volume threshold at which subsurface flow will start. The response times at the cropland site have a narrower range for the growing season than for the winter season. Furthermore, the lateral subsurface flow starts at lower precipitation volumes for a specific response time during the winter season. The comparison of the response times among the sites shows that the cropland response times are on average twice the duration of the grassland site for events which started after less than 26 h of precipitation. For longer response times, this relation is reversed to an average factor of 0.85. The required precipitation volume for advective events is higher in the forest site compared to the other sites. We did not observe any significant dependency of response times on antecedent moisture conditions.
3.4.2. Heterogeneity of Response Times
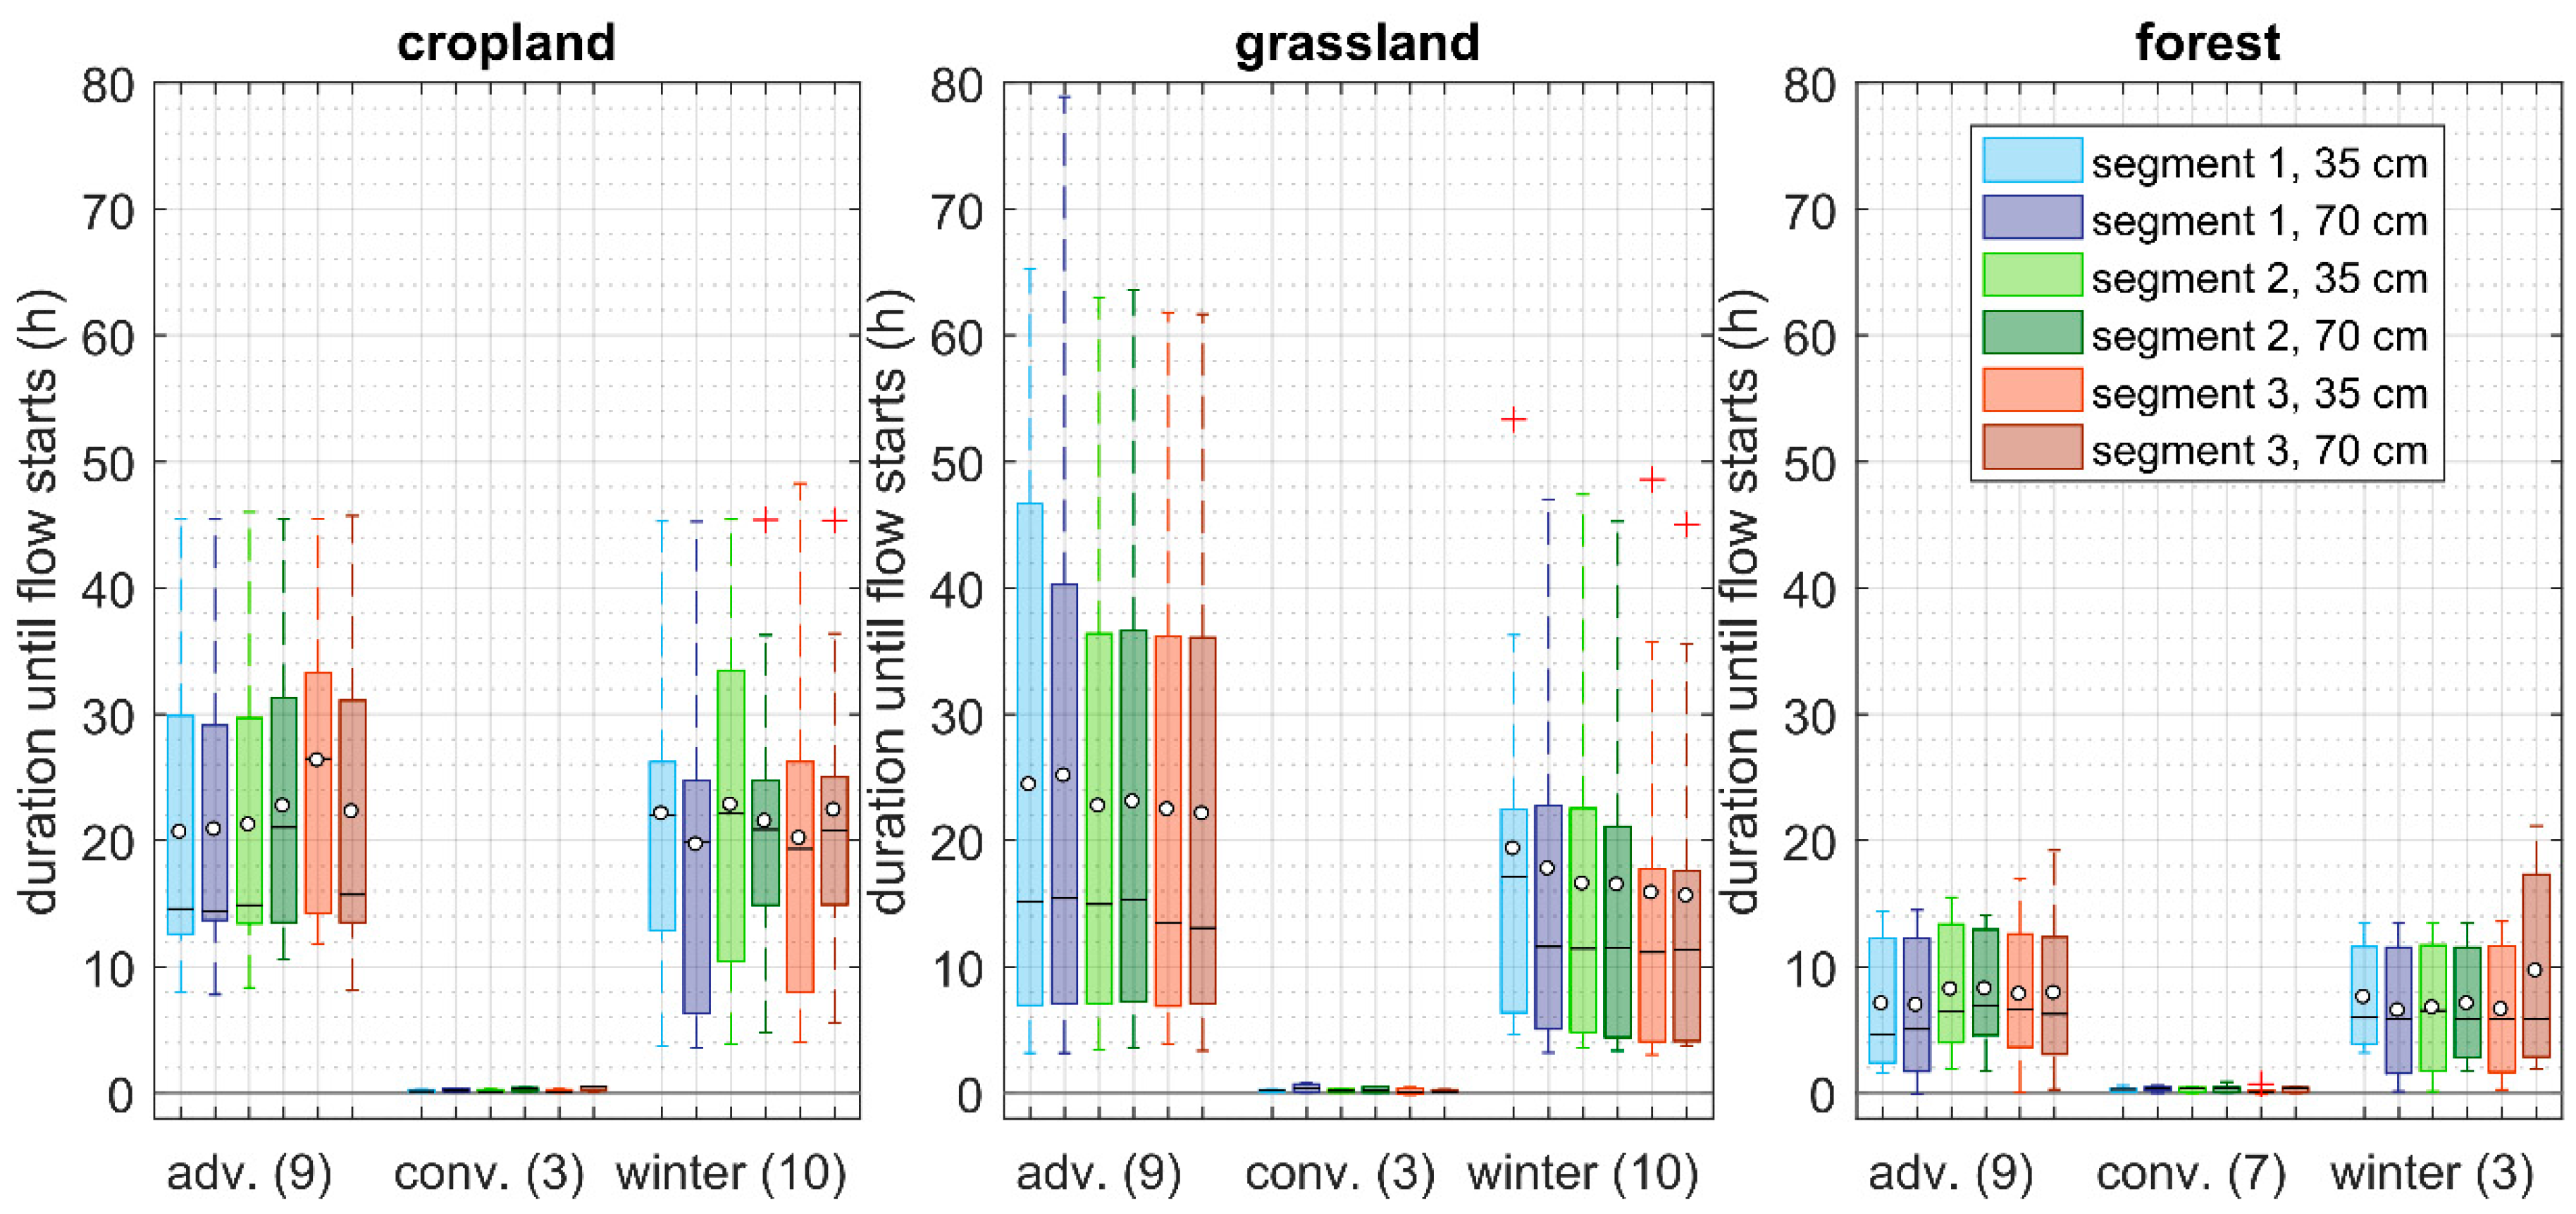
The spatial distribution of the response times of the three sites show characteristic differences (Figure 12). Average median response times of advective events increase from the forest (6.0 h) to the grassland (12.4 h) to the cropland site (20.9 h). Summer and winter events show a different behavior depending on the respective land use. The difference of mean and median response times is largest at the grassland site and for summer events at the cropland site.
The mean response times of the sections in the cropland site during advective events range from 20.6 h to 26.3 h during summer events and from 19.6 h to 22.8 h hours during winter events. On average, the mean response times are similar for advective events during summer (21.4 h) and winter (22.3 h). In contrast, the average median response times are shorter during advective summer events (17.9 h) compared to advective winter events (20.9 h). The difference of mean and median response times is considerably larger for summer events (4.4 h) compared to winter events (0.5 h). The interquartile ranges of the sections have a larger variation for the winter events than for the summer events (Figure 12, left). The average median response times at the grassland site are slightly higher during advective summer events (14.6 h) than during advective winter events (12.4 h). We observed that trench sections with larger flow shares (Figure 10) also show shorter response times. The largest overall response times were observed at the grassland site. Consequently, the differences of mean and median response times are larger than at the other sites (summer events: 8.7 h, winter events: 4.5 h). The interquartile range of the sections for the summer events is very large compared to the winter events and to the other sites (Figure 12). The forest site has the shortest mean and median response times for all sections, which show only minor differences among advective summer and winter events. Furthermore, the differences of the average mean and median response times (1.7 h and 1.3 h, respectively) and the mean interquartile ranges are small when compared to the other two sites.
4. Discussion
4.1. Impact of Land Use and Soil Management on Soil Hydraulic Properties
The observed textures classes of the three sites were similar. Therefore, the variation in the soil hydraulic properties can mainly be accredited to the influence of land use and soil management. However, some variations in the texture were observed. Therefore, the respective effect may not be neglected. We observed correlations among the soil properties and found differences between the three land use types, but generally the number of soil samples was not sufficiently large to show clear dependencies.
The observed differences in the depth profiles of bulk density, organic matter content and saturated hydraulic conductivity among the three sites (Table 2) indicate the impact of the overlying land use type and management strategies. The differences in the three land use types are lower for depths below 60 cm, which implies that land use impacts are less important at that depth. The comparably high bulk density and the more constant distribution of the organic matter content at the cropland site may be caused by the tilling practice [51]. It destroys the soil structure and leads to loosening of the topsoil and an increased bulk density below the Ap horizon. Furthermore, plant residuals are removed, which reduces the accumulation of organic matter content. The impact of soil tillage is further supported by the distinct reduction of the saturated hydraulic conductivity after harvesting. The missing undergrowth of vegetation and the acidic conditions of the spruce monoculture cause the observed low organic matter content of the forest site. The method of measuring the saturated hydraulic conductivity makes a distinction between matrix and macropore flow impossible. Therefore, the observed high conductivities in the forest, in the first 20 cm of the grassland site and the cropland site before harvesting can be attributed to a dense and active root system and large air capacities (Table 2).
4.2. Characteristics of the Framework Conditions of Subsurface Flow Events
The different timing of the events at the three sites (Figure 3) shows the importance of land use-dependent factors. The observed mismatch between the soil moisture in the trench and at the upstream positions emerge due to different measurement equipment being used and their positioning. The instruments in the trench were covered by the surface runoff collection area and the metal blades (Figure 2), which stop vertical infiltration. The observation of rapidly increasing soil moisture at the trenches is therefore caused by lateral subsurface flow. The differences in the hillslope soil moisture characteristics at 20 and 60 cm depth at the cropland site may be caused by the occurrence of a plow layer, which acts as a barrier for infiltrating water. This assumption is supported by the stated assimilation of the soil moisture characteristics during the growing season. During the growing season, the root depth and density increases, and thus, results in a more effective macropore system. The rapidly increasing suction within the root zone of the respective fields originated from evaporation and plant uptake of water. We therefore presume that the depth differences among the sites were a result of the root distribution and density of the vegetation. The observed inversion of the suction gradients at 20 cm and 60 cm at the cropland site supports this theory.
The very low average soil moisture conditions at the forest site (Figure 6) can be explained by the interception loss of precipitation and by high evapotranspiration rates. The narrow quartiles of the forest site in combination with the number of outliers indicate a high proportion of macropore flow during heavy rain events with only a minor impact of matrix flow. The observed characteristic differences of the soil moisture at the cropland and the grassland sites indicate a considerable influence of vegetation and soil management on vertical and lateral subsurface flow. The increasing soil moisture towards the bottom of the hillslope at the grassland site implies a distinct amount of lateral subsurface flow and longer periods of saturation at the bottom of the hillslope. The tilling practice at the cropland site regularly destroys the vertical and horizontal macropore system of the upper soil layer. In consequence, lateral subsurface flow is interrupted, which may cause the observation of independent soil moisture profiles at the cropland site.
We did not find the occurrence of subsurface flow events to clearly depend on single parameters (Figure 3). Neither specific precipitation characteristics, nor soil moisture or suction ranges generally lead to the occurrence of subsurface flow. This observation contrasts with the stated threshold values for precipitation volumes by Graham and McDonnell [52] and Du et al. [11] but agrees with Saffarpour et al. [29], who argued that multiple thresholds must be considered.
4.3. Influencing Factors of Subsurface Flow Magnitudes, Distributions and Response Times
Limiting discharge to values from 0.6 to 1.0 L/min is a constraint in evaluating subsurface flow event volumes. Nevertheless, the data can still be included with cumulative distributions functions as the amount of larger values can be quantified. We could not determine event-specific contribution areas. Additionally, subsurface flow distances on impeding layers are mostly much shorter than the slope length [53]. Therefore, the discharges were not normalized, but considered as absolute values.
The low total subsurface flow volumes in the forest (Figure 7) are in accordance to the low soil moisture conditions (Figure 6), which are caused by interception and evapotranspiration losses. Additionally, the large air capacity and total storage capacity of the site require higher precipitation sums to reach saturation. The observed subsurface flow might therefore be mostly caused by preferential flow. The larger storage capacity of the grassland site and the high saturated hydraulic conductivity of the topsoil layer prolong the time to develop saturation at dry preconditions. Subsequently, the total duration of subsurface flow is shorter than at the cropland site. Additionally, the larger air capacity of the grassland site (Table 2) implies an increased water volume at the fast flow domain of the water retention curve. The higher water volume at this domain supports the observed higher maximum subsurface flow rates for saturated conditions at the grassland site (Figure 7). The correlation of the distribution of subsurface flow and the respective accumulation areas determined in this study (Figure 8) agree with the findings of Zhu and Lin [15]. The correlation coefficient of 0.76 implies that topography has a major impact on the distribution of subsurface flow volumes. However, the resolution of the accumulation areas (1 m) leads to uncertainties of the correlation. Since the occurrence of flow volumes at the cropland site are within the ranges of the segments in the grassland site (Figure 7), the potential for subsurface flow might be more influenced by topographic effects than by land use influences. Nevertheless, the differences in the curve characteristics among upper and lower levels can be allocated to the different land use types or the existence of a plow layer.
The opposing distribution of vertical subsurface flow volumes during summer and winter events (Figure 9) shows the influence of season on subsurface flow variability. The dominant flow volume in the soil above 35 cm depth during the growing season can be explained by the slow propagation of the saturation zone through the plow layer and by water accumulation and flow on the plow layer. The observed lower horizontal variabilities for events with dry preconditions or high precipitation intensities suggests that flow pathways are less important during these conditions. This might be caused by smaller or differently distributed contribution areas. This behavior is in contrast to the observations made by Bracken et al. [9] in a forested catchment, where differences decreased for larger storm events and wetter antecedent conditions. At the same time, it highlights the importance of site and land use characteristics. During the winter season, soil moisture conditions are generally wetter due to less vegetation coverage and lower evapotranspiration rates. In consequence, infiltration rates have less influence on the subsurface flow distribution and more flow can occur at greater depths. During thawing events, the water is released as the water holding capacity changes with increasing temperatures. Therefore, flow paths have a lower influence than during rain-induced events. The large flow share in the upper level is caused by freezing depths which do not reach the lower level.
The distinct differences of subsurface flow volume variabilities (Figure 10) indicate the importance of the respective land use type. As stated above, horizontal variations can mainly be attributed to the topography. In contrast, the vertical differences as well as the characteristic differences of summer, winter and thawing events can only be explained by parameters with a seasonal variability. These include soil hydraulic properties and preferential flow in macropores, which are affected by vegetation. The soil structure in the upper level of the cropland site is destroyed once or twice per year. This results in a disconnection of preferential flow paths to the lower level and the observed separate reaction of the two layers. In contrast, preferential flow paths can form over several years at the other two sites. The soil fauna and the continuous root system of the grassland site lead to small macropores and larger preferential flow paths. These may explain both the very large contribution of one section and the relative homogeneous shares of the others. In the forest, larger roots result in fewer but larger macropores for preferential flow that superpose matrix flow.
The missing threshold value for the required precipitation volume (Figure 11) indicates the importance of other preconditions for predicting subsurface flow. The selected events of the cropland and the grassland have the same date of occurrence and allow a direct comparison. In contrast, the selected events at the forest site took place at different dates. The large difference in the response times of convective precipitation events (1 h) compared to advective events (6.0–20.9 h) indicates a variation in the subsurface flow genesis, which depends on the precipitation characteristics. The faster response of the grassland site compared to the cropland site for fast reacting advective events (<2 h) agrees with the larger saturated hydraulic conductivity and subsequent higher infiltration rates and large air capacity. For advective events with dry preconditions and longer response times, the reaction of the grassland site is delayed compared to the cropland site. This may be caused by the larger storage capacities of the grassland site (Table 2). The fast reactivity and the low variability between the events of the forest site can be explained by the distinct macropore system and the necessity for intense or large precipitation events to cause subsurface flow. The faster response time compared to the grassland site agrees with the observations made by Bachmair and Weiler [3].
The impact of soil hydraulic properties and land use on lateral subsurface flow characteristics is considered to be a regulating ecosystem service. It can be attributed to the category of moderation of extreme events, which is less represented in recent literature than other categories [54]. Generally, trade-offs among ecosystem services occur by different mechanisms like the competition for land, end-products or an interference in ecological processes [55]. In the scope of the impact of land use on soil hydraulic properties and subsurface flow characteristics, a competition of regulating services (moderation of extreme events, erosion prevention) and provisional services (food production) could be determined. Thus, besides the above stated results, the observed data are valuable for a combined analysis of different ecosystem services, which may influence management decisions.
5. Conclusions
The measurement site established for the study was well suited to determine land use impacts on subsurface flow and its framework conditions. The devices were newly set up and designed as a multimethod approach in order to allow different perspectives on flow processes. The measured parameters included meteorological conditions in the forest and open area, soil moisture, soil moisture tension, surface runoff and subsurface flow at the three sites and streamflow at the adjacent creek. From June 2016 to May 2018, about 30 to 45 subsurface flow events were recorded per site.
The framework conditions of subsurface flow events such as soil hydraulic properties, soil moisture and suction measurements showed distinct differences among the three sites. These land use-specific parameters were related to the respective subsurface flow events. The occurrence of subsurface flow could not be associated to single preconditions like meteorological conditions or soil moisture and suction. Thus, we suggest an additional analysis to determine if combinations of parameter ranges exist, which favor the occurrence of subsurface flow.
Our hypotheses that the magnitude, the distribution and the timing of subsurface flow is affected by the land use type could be proven. The most frequent occurrence of subsurface flow was observed at the cropland site. Discharge rates above 0.14 L/min occurred more often at the grassland site, whereby discharges above 0.6 L/min were observed 2.2 times more often at the grassland site than at the cropland site. The differences of flow volumes among the trench segments show a good correlation with the surface accumulation areas of the sites (r² = 0.76). Differences are larger at the forest site compared to the cropland and grassland sites. The distribution of flow volume shares among the sections of a trench is dependent on the land use type and the event characteristics. The horizontal heterogeneity of subsurface flow at the grassland site is larger than at the other sites. The largest vertical and overall heterogeneity was observed in the forest. The lowest vertical variability was observed at the grassland site. All sites showed larger vertical differences for thawing events compared to rain-induced events. The distribution of subsurface flow volumes at the cropland site was influenced by vegetation and soil management changes and resulted in opposing vertical flow shares. No major change in the characteristics during the year was found for the other two sites. The average response times show distinct differences depending on land use type and precipitation characteristics. Response times increase from the forest site (6.0 h) to the grassland site (12.4 h) to the cropland site (20.9 h) for advective rain events. For convective rain events, the response times did not exceed 1 h at all three land use types.
The observations enable the conclusion that the dominant subsurface flow-generation processes differ among the three land use types. The subsurface flow at the forest site is dominated by macropore flow, which is supported by short response times at intensive rain events and a large spatial variability. The subsurface flow at the cropland site is largely driven by matrix flow, which is caused by the regular soil tillage. Therefore, flow volumes are moderate, and the characteristics of the sections are similar. The flow process of the grassland site is a combination of matrix and macropore flow, whereby the dominant flow process depends on the respective event characteristics. The assumption is based on the substantial differences observed in the response times as well as on the large flow volumes. However, an insufficient amount of data inhibits generalized conclusions to be made. Therefore, an extension of the database is recommended. This can be achieved by a longer measurement period and subsequently more registered events or by the inclusion of other measurement sites’ data. Nevertheless, the analyses of this study show clear differentiations among the land use types and therefore highlights the importance of a realistic representation of subsurface flow in hydrological models for the evaluation of land use scenarios and their influence on flood-generation processes.
Author Contributions
Conceptualization, S.T. and W.R.; Data curation, S.T.; Formal analysis, S.T.; Funding acquisition, W.R. and M.D.; Investigation, S.T.; Methodology, S.T.; Project administration, S.T. and W.R.; Supervision, W.R. and M.D.; Visualization, S.T.; Writing—original draft, S.T.; Writing—review & editing, S.T., W.R. and M.D.
Funding
The study was funded by the Bavarian Water Authority and the DHG research fellowship for field studies. This work was supported by the German Research Foundation (DFG) and the Technical University of Munich (TUM) in the framework of the Open Access Publishing Program.
Acknowledgments
Our special thanks go to the people helping with the field work, Michael Tarantik, Andrea Eberle, Christiane Frank, Lisa Balke, Alexandra Geist, Helmut Heller, Ronja Wolf, Eva Jetzlsperger, Sophia Demmel and Mario Gramm, and to the land owners providing the field sites. We also would like to thank Daniel Bittner, Gabriele Chiogna and Shane Cunneff for their support and the reviewers for their constructive feedback. We gratefully acknowledge the compute and data resources provided by the Leibniz Supercomputing Centre (www.lrz.de).
Conflicts of Interest
The authors declare no conflict of interest. The funders had no role in the design of the study; in the collection, analyses, or interpretation of data; in the writing of the manuscript, or in the decision to publish the results.
References
- Beven, K.; Germann, P. Macropores and water flow in soils revisited. Water Resour. Res. 2013, 49, 3071–3092. [Google Scholar] [CrossRef] [Green Version]
- Šanda, M.; Císlerová, M. Transforming Hydrographs in the Hillslope Subsurface. J. Hydrol. Hydromech. 2009, 57. [Google Scholar] [CrossRef]
- Bachmair, S.; Weiler, M. Interactions and connectivity between runoff generation processes of different spatial scales. Hydrol. Process. 2014, 28, 1916–1930. [Google Scholar] [CrossRef]
- Bishop, K.; Seibert, J.; Nyberg, L.; Rodhe, A. Water storage in a till catchment. II: Implications of transmissivity feedback for flow paths and turnover times. Hydrol. Process. 2011, 25, 3950–3959. [Google Scholar] [CrossRef]
- Badoux, A.; Witzig, J.; Germann, P.F.; Kienholz, H.; Lüscher, P.; Weingartner, R.; Hegg, C. Investigations on the runoff generation at the profile and plot scales, Swiss Emmental. Hydrol. Process. 2006, 20, 377–394. [Google Scholar] [CrossRef]
- Burke, A.R.; Kasahara, T. Subsurface lateral flow generation in aspen and conifer-dominated hillslopes of a first order catchment in northern Utah. Hydrol. Process. 2011, 25, 1407–1417. [Google Scholar] [CrossRef]
- Blume, T.; van Meerveld, H.I. From hillslope to stream: Methods to investigate subsurface connectivity. WIREs Water 2015, 2, 177–198. [Google Scholar] [CrossRef]
- Bracken, L.J.; Wainwright, J.; Ali, G.A.; Tetzlaff, D.; Smith, M.W.; Reaney, S.M.; Roy, A.G. Concepts of hydrological connectivity: Research approaches, pathways and future agendas. Earth-Sci. Rev. 2013, 119, 17–34. [Google Scholar] [CrossRef] [Green Version]
- McGlynn, B.L.; McDonnel, J.J.; Brammer, D.D. A review of the evolving perceptual model of hillslope flowpaths at the Maimai catchments, New Zealand. J. Hydrol. 2002, 257, 1–26. [Google Scholar] [CrossRef]
- Woods, R.; Rowe, L. The changing spatial variability of subsurface flow across a hillside. J. Hydrol. 1996, 35, 49–84. [Google Scholar]
- Du, E.; Rhett Jackson, C.; Klaus, J.; McDonnell, J.J.; Griffiths, N.A.; Williamson, M.F.; Greco, J.L.; Bitew, M. Interflow dynamics on a low relief forested hillslope: Lots of fill, little spill. J. Hydrol. 2016, 534, 648–658. [Google Scholar] [CrossRef] [Green Version]
- Freer, J.; McDonnell, J.J.; Beven, K.J.; Peters, N.E.; Burns, D.A.; Hooper, R.P.; Aulenbach, B.; Kendall, C. The role of bedrock topography on subsurface storm flow. Water Resour. Res. 2002, 38. [Google Scholar] [CrossRef]
- Whipkey, R.Z. Subsurface Stormflow on Forested Slopes. Int. Assoc. Sci. Hydrol. Bull. 1965, 10, 74–85. [Google Scholar] [CrossRef]
- Graham, C.B.; Woods, R.A.; McDonnell, J.J. Hillslope threshold response to rainfall: (1) A field based forensic approach. J. Hydrol. 2010, 393, 65–76. [Google Scholar] [CrossRef]
- Zhu, Q.; Lin, H.S. Simulation and validation of concentrated subsurface lateral flow paths in an agricultural landscape. Hydrol. Earth Syst. Sci. 2009, 13, 1503–1518. [Google Scholar] [CrossRef] [Green Version]
- van Schaik, N.; Schnabel, S.; Jetten, V.G. The influence of preferential flow on hillslope hydrology in a semi-arid watershed (in the Spanish Dehesas). Hydrol. Process. 2008, 22, 3844–3855. [Google Scholar] [CrossRef]
- Anderson, A.E.; Weiler, M.; Alila, Y.; Hudson, R.O. Subsurface flow velocities in a hillslope with lateral preferential flow. Water Resour. Res. 2009, 45. [Google Scholar] [CrossRef] [Green Version]
- Noguchi, S.; Tsuboyama, Y.; Sidle, R.C.; Hosoda, I. Subsurface runoff characteristics from a forest hillslope soil profile including macropores, Hitachi Ohta, Japan. Hydrol. Process. 2001, 15, 2131–2149. [Google Scholar] [CrossRef]
- McDonnell, J.J. A rationale for old water discharge through macropores in a steep, humid catchment. Water Resour. Res. 1990, 26, 2821–2832. [Google Scholar] [CrossRef]
- Gonzalez-Sosa, E.; Braud, I.; Dehotin, J.; Lassabatère, L.; Angulo-Jaramillo, R.; Lagouy, M.; Branger, F.; Jacqueminet, C.; Kermadi, S.; Michel, K. Impact of land use on the hydraulic properties of the topsoil in a small French catchment. Hydrol. Process. 2010, 18. [Google Scholar] [CrossRef]
- Rieger, W. Prozessorientierte Modellierung Dezentraler Hochwasserschutzmaßnahmen. Ph.D. Thesis, Universität der Bundeswehr, Neubiberg, Germany, 2012. [Google Scholar]
- Jost, G.; Schume, H.; Hager, H.; Markart, G.; Kohl, B. A hillslope scale comparison of tree species influence on soil moisture dynamics and runoff processes during intense rainfall. J. Hydrol. 2012, 420–421, 112–124. [Google Scholar] [CrossRef]
- Fiener, P.; Auerswald, K.; van Oost, K. Spatio-temporal patterns in land use and management affecting surface runoff response of agricultural catchments—A review. Earth-Sci. Rev. 2011, 106, 92–104. [Google Scholar] [CrossRef] [Green Version]
- Bodner, G.; Scholl, P.; Loiskandl, W.; Kaul, H.-P. Environmental and management influences on temporal variability of near saturated soil hydraulic properties. Geoderma 2013, 204–205, 120–129. [Google Scholar] [CrossRef] [PubMed]
- Kargas, G.; Kerkides, P.; Sotirakoglou, K.; Poulovassilis, A. Temporal variability of surface soil hydraulic properties under various tillage systems. Soil Till. Res. 2016, 158, 22–31. [Google Scholar] [CrossRef]
- Holland, J.M. The environmental consequences of adopting conservation tillage in Europe: Reviewing the evidence. Agric. Ecosyst. Environ. 2004, 103, 1–25. [Google Scholar] [CrossRef]
- Tebrügge, F.; Düring, R.-A. Reducing tillage intensity—A review of results from a long-term study in Germany. Soil Till. Res. 1999, 53, 15–28. [Google Scholar] [CrossRef]
- Leys, A.; Govers, G.; Gillijns, K.; Berckmoes, E.; Takken, I. Scale effects on runoff and erosion losses from arable land under conservation and conventional tillage: The role of residue cover. J. Hydrol. 2010, 390, 143–154. [Google Scholar] [CrossRef]
- Saffarpour, S.; Western, A.W.; Adams, R.; McDonnell, J.J. Multiple runoff processes and multiple thresholds control agricultural runoff generation. Hydrol. Earth Syst. Sci. 2016, 20, 4525–4545. [Google Scholar] [CrossRef]
- Hopp, L.; McDonnell, J.J. Connectivity at the hillslope scale: Identifying interactions between storm size, bedrock permeability, slope angle and soil depth. J. Hydrol. 2009, 376, 378–391. [Google Scholar] [CrossRef]
- BGL. Geologische Übersichtskarte 1:500.000 Bayern, 4th ed.; Bayerisches Geologisches Landesamt: München, Germany, 1996. (In German) [Google Scholar]
- BGR. Hydrogeologische Übersichtskarte 1:200000 von Deutschland (HÜK200). Oberer Grundwasserleiter—CC 8734 Rosenheim; Bundesanstalt für Geowissenschaften und Rohstoffe: Hannover, Germany, 2011. (In German) [Google Scholar]
- LfU. Weiß-blaues Klima. Available online: http://www.lfu.bayern.de/wasser/klima_wandel/bayern/index.htm (accessed on 9 March 2015). (In German).
- LfL. Wetterstation Dürabuch (LfL): Vieljähriges Mittel DWD Maisach. Available online: http://www.am.rlp.de/Internet/AM/NotesBAM.nsf/bamweb/286b2f1c437d83b3c1257392004329af?OpenDocument (accessed on 22 December 2018). (In German).
- LfU. Digitale Übersichtsbodenkarte von Bayern im Maßstab 1:25000. ÜBK25; Bayerisches Landesamt für Umwelt: Augsburg, Germany, 2013. (In German) [Google Scholar]
- OTT Hydromet GmbH. Orpeus Mini. Technische Daten. 2019. Available online: https://www.ott.com/de-de/produkte/wasserstand-49/ott-orpheus-mini-61/productAction/outputAsPdf/ (accessed on 13 January 2019).
- Davis Instruments. Rain Collector Data Sheet. 2013. Available online: https://www.davisinstruments.com/product_documents/weather/spec_sheets/7857-7852_SS.pdf (accessed on 12 March 2019).
- Davis Instruments. Anemometer Data Sheet. 2013. Available online: https://www.davisinstruments.com/product_documents/weather/spec_sheets/6410_SS.pdf (accessed on 12 March 2019).
- Davis Instruments. Solar Radiation Sensor Data Sheet. 2010. Available online: https://www.davisinstruments.com/product_documents/weather/spec_sheets/6450_SS.pdf (accessed on 12 March 2019).
- Davis Instruments. External Temperature/Humidity Data Sheet. 2006. Available online: https://www.davisinstruments.com/product_documents/weather/spec_sheets/7859_spec_Rev_D.pdf (accessed on 12 March 2019).
- UGT. SMT-100 Datenblatt. Messung des Volumetrischen Wassergehaltes. 2015. Available online: https://www.ugt-online.de/fileadmin/Public/downloads/Produkte/Bodenkunde/Bodenfeuchte/SMT-100_Datenblatt_de.pdf (accessed on 12 March 2019).
- DECAGON. 5TE—Water Content, EC and Temperature Sensor; Data Sheet; Decagon Devices: Pullman, WA, USA, 2016. [Google Scholar]
- DECAGON. 5TM—Water Content and Temperature Sensors; Data Sheet; Decagon Devices: Pullman, WA, USA, 2016. [Google Scholar]
- UGT. Tensio 152 Datenblatt. 2014. Available online: https://www.ugt-online.de/fileadmin/Public/downloads/Produkte/Bodenkunde/Tensiometer/Tensio_152.pdf (accessed on 12 March 2019).
- Cytron Technologies. HC-SR04 Ultrasonic Sensor. User’s Manual. 2013. Available online: http://www.fonteniaud.fr/COURS/ELECTRONIQUE%20GMP2/TITRE%2000-COURS/01--THEORIE/prof/datasheet/HCSR04.2.pdf (accessed on 12 March 2019).
- Maxim Integrated. DS18B20. Programmable Resolution 1-Wire Digital Thermometer. 2018. Available online: https://datasheets.maximintegrated.com/en/ds/DS18B20.pdf (accessed on 13 January 2019).
- Weiler, M.; Naef, F. An experimental tracer study of the role of macropores in infiltration in grassland soils. Hydrol. Process. 2003, 17, 477–493. [Google Scholar] [CrossRef]
- Heller, H.; Teschemacher, S. Internet of Things: Moderne Technik für die Umweltdatenerfassung. In Workshop UIS; Arbeitskreis Umweltinformationssysteme: Nürnberg, Germany, 2018. [Google Scholar]
- UGT. ku-pf Apparatur. Bedienungsanleitung. Version: 19/08/11. 2011. Available online: https://www.ugt-online.de/fileadmin/Public/downloads/Produkte/Bodenkunde/Leitfaehigkeit/ku-pF.pdf (accessed on 12 March 2019).
- Amoozegar, A. A Compact Constant-Head Permeameter for Measuring Saturated Hydraulic Conductivity of the Vadose Zone. Soil Sci. Soc. Am. J. 1989, 53, 1356. [Google Scholar] [CrossRef]
- Schwartz, R.C.; Evett, S.R.; Unger, P.W. Soil hydraulic properties of cropland compared with reestablished and native grassland. Geoderma 2003, 116, 47–60. [Google Scholar] [CrossRef]
- Graham, C.B.; McDonnell, J.J. Hillslope threshold response to rainfall: (2) Development and use of a macroscale model. J. Hydrol. 2010, 393, 77–93. [Google Scholar] [CrossRef]
- Klaus, J.; Jackson, C.R. Interflow Is Not Binary: A Continuous Shallow Perched Layer Does Not Imply Continuous Connectivity. Water Resour. Res. 2018, 54, 5921–5932. [Google Scholar] [CrossRef]
- Adhikari, K.; Hartemink, A.E. Linking soils to ecosystem services—A global review. Geoderma 2016, 262, 101–111. [Google Scholar] [CrossRef]
- Gissi, E.; Gaglio, M.; Aschonitis, V.G.; Fano, E.A.; Reho, M. Soil-related ecosystem services trade-off analysis for sustainable biodiesel production. Biomass Bioenergy 2018, 114, 83–99. [Google Scholar] [CrossRef] [Green Version]
Figure 1.
Overview of the measurement setup: locations of the three trenches within the Rambach subcatchment, including positions of soil moisture measurements and accumulation areas; the zoom-in shows a detailed view of the trench, which is divided into three segments.
Figure 1.
Overview of the measurement setup: locations of the three trenches within the Rambach subcatchment, including positions of soil moisture measurements and accumulation areas; the zoom-in shows a detailed view of the trench, which is divided into three segments.

Figure 2.
Cross section and longitudinal section of the trench and the slope with derived surface pathways and soil measurement plots. The subsurface flow was measured in six sections and was subdivided into two levels and three segments.
Figure 2.
Cross section and longitudinal section of the trench and the slope with derived surface pathways and soil measurement plots. The subsurface flow was measured in six sections and was subdivided into two levels and three segments.

Figure 3.
Overview of the continuously measured parameters at the hillslope to characterize subsurface flow events: precipitation, temperature, relative humidity, radiation, hillslope discharge, soil moisture, and suction. Subsurface flow events are divided into rain-induced events (o) and thawing events (Δ). Meteorological conditions are given for the open area (upper line) and the forest (lower line). The lines of soil moisture and suction measurements indicate the segments (trench) and the positions (hillslope) according to Figure 1 and Figure 2.

Figure 4.
Dependencies between the soil properties bulk density, org. matter content, air capacity and saturated hydraulic conductivity separated by land use type.
Figure 4.
Dependencies between the soil properties bulk density, org. matter content, air capacity and saturated hydraulic conductivity separated by land use type.

Figure 5.
Characteristic subsurface flow event types. Left: rain-induced convective event (June 2016); right: thawing event (February 2017).
Figure 5.
Characteristic subsurface flow event types. Left: rain-induced convective event (June 2016); right: thawing event (February 2017).

Figure 6.
Comparison of the depth-dependent soil moisture distribution for the three land use types.
Figure 6.
Comparison of the depth-dependent soil moisture distribution for the three land use types.

Figure 7.
Cumulative distribution functions of subsurface flow at different segments of the three land use types; upper and lower figures differ in the scaling of the x-axis.
Figure 7.
Cumulative distribution functions of subsurface flow at different segments of the three land use types; upper and lower figures differ in the scaling of the x-axis.

Figure 8.
Correlations of horizontal subsurface flow shares for different discharge ranges and the accumulation areas of the trench segments (s1, s2, s3) for the three land use types.
Figure 8.
Correlations of horizontal subsurface flow shares for different discharge ranges and the accumulation areas of the trench segments (s1, s2, s3) for the three land use types.

Figure 9.
Temporal occurrence of subsurface flow shares for different events at the cropland site: (a) vertical subsurface flow volume shares; (b) horizontal subsurface flow volume shares.
Figure 9.
Temporal occurrence of subsurface flow shares for different events at the cropland site: (a) vertical subsurface flow volume shares; (b) horizontal subsurface flow volume shares.

Figure 10.
Differences of subsurface flow shares depending on land use and season (dot: mean, number of events: brackets).
Figure 10.
Differences of subsurface flow shares depending on land use and season (dot: mean, number of events: brackets).

Figure 11.
Dependency of response times on precipitation volumes and maximum precipitation until the occurrence of subsurface flow; (a) cropland; (b) grassland; (c) forest.
Figure 11.
Dependency of response times on precipitation volumes and maximum precipitation until the occurrence of subsurface flow; (a) cropland; (b) grassland; (c) forest.

Figure 12.
Horizontal and vertical heterogeneity of subsurface flow response times depending on land use, season and precipitation characteristics (adv: advective summer events, conv: convective summer events, winter: winter events; line: median, dot: mean, number of events: brackets).
Figure 12.
Horizontal and vertical heterogeneity of subsurface flow response times depending on land use, season and precipitation characteristics (adv: advective summer events, conv: convective summer events, winter: winter events; line: median, dot: mean, number of events: brackets).


Table 1.
Description of the three measurement sites.
| Land Use Type | Cropland | Grassland | Forest |
|---|---|---|---|
| Elevation | 537 m.a.s.l. | 537 m.a.s.l. | 547 m.a.s.l. |
| Slope angle (mean/max) | 11.4%/29.4% | 11.7%/20.0% | 18.7%/27.2% |
| Slope length | 146 m | 132 m | 46 m |
| Accumulation area | 6076 m² | 5133 m² | 273 m² |
| Accumulation in segment 1 | 0.46 (-) | 0.03 (-) | 0.26 (-) |
| Accumulation in segment 2 | 0.50 (-) | 0.33 (-) | 0.24 (-) |
| Accumulation in segment 3 | 0.04 (-) | 0.63 (-) | 0.50 (-) |
Table 2.
Soil properties of the measurement site divided into land use types and depth categories. Given values are the mean, the standard deviation and the number of analyzed probes (in brackets).
Table 2.
Soil properties of the measurement site divided into land use types and depth categories. Given values are the mean, the standard deviation and the number of analyzed probes (in brackets).
| Land Use | Depth | Sand Content | Silt Content | Clay Content | Bulk Density (g/cm³) | Org. Matter Content | Air Capacity | Available Water Capacity | Sat. Hydraulic Conductivity (cm/h) | |
|---|---|---|---|---|---|---|---|---|---|---|
| Before Harv. | After Harv. | |||||||||
| cropland | 0–20 | 25.77% ± 2.20% (3) | 45.48% ± 0.36% (3) | 28.74% ± 2.52% (3) | 1.39 ± 0.12 (21) | 5.28% ± 0.31% (6) | 2.49% ± 2.74% (9) | 26.71% ± 8.47% (9) | 0.84 (2) | - |
| 20–40 | 26.2% ± 2.77% (3) | 49.09% ± 1.09% (3) | 24.71% ± 3.85% (3) | 1.62 ± 0.09 (19) | 4.58% ± 0.33% (6) | 0.50% ± 0.04% (7) | 28.23% ± 5.10% (7) | 1.29 ± 0.52 (3) | 0.07 ± 0.04 (3) | |
| 40–60 | 22.17% (2) | 40.90% (2) | 36.93% (2) | 1.63 ± 0.06 (12) | 3.68% ± 0.29% (4) | 1.28% ± 1.71% (5) | 22.76% ± 5.97% (5) | 1.42 (2) | 0.23 (2) | |
| 60–100 | 29.15% (1) | 52.26% (1) | 18.59% (1) | 1.61 ± 0.08 (18) | 3.39% ± 0.55% (6) | 0.91% ± 0.81% (6) | 15.15% ± 2.22% (6) | 0.11 ± 0.18 (4) | 0.03 (1) | |
| grassland | 0–20 | 21.90% ± 2.04% (3) | 47.51% ± 4.63% (3) | 30.58% ± 2.80% (3) | 1.25 ± 0.21 (24) | 7.57% ± 1.64% (6) | 2.15% ± 1.30% (7) | 24.69% ± 4.02% (7) | 3.68 ± 2.84 (3) | |
| 20–40 | 18.68% (2) | 50.38% (2) | 30.94% (2) | 1.57 ± 0.08 (23) | 5.06% ± 0.25% (4) | 2.62% ± 1.58% (7) | 22.15% ± 6.20% (7) | 0.42 ± 0.33 (7) | ||
| 40–60 | 15.84% (2) | 50.05% (2) | 34.11% (2) | 1.54 ± 0.10 (15) | 4.11% ± 0.36% (4) | 2.27% ± 1.45% (5) | 21.24% ± 3.80% (5) | 0.07 (1) | ||
| 60–100 | 15.06% (1) | 51.45% (1) | 33.48% (1) | 1.61 ± 0.13 (27) | 3.71% ± 0.44% (6) | 1.74% ± 0.46% (5) | 17.36% ± 1.18% (5) | 0.05 ± 0.04 (3) | ||
| forest | 0–20 | 26.19% (2) | 48.21% (2) | 25.61% (2) | 1.24 ± 0.19 (21) | 4.41% ± 0.27% (4) | 4.74% ± 2.11% (7) | 20.81% ± 3.61% (7) | 2.57 (1) | |
| 20–40 | 26.67% ± 8.00% (3) | 41.89% ± 4.29% (3) | 31.44% ± 4.34% (3) | 1.48 ± 0.13 (20) | 3.68% ± 0.63% (6) | 3.56% ± 2.62% (7) | 20.22% ± 3.00% (7) | 1.81 ± 0.97 (3) | ||
| 40–60 | 26.23% (1) | 42.43% (1) | 31.34% (1) | 1.57 ± 0.04 (6) | 4.30% (2) | 0.26% ± 0.18% (3) | 27.26% ± 1.38% (3) | 0.89 ± 0.38 (3) | ||
| 60–100 | 23.88% (1) | 51.87% (1) | 24.25% (1) | 1.58 ± 0.05 (9) | 4.26% ± 0.24% (6) | 0.94% ± 0.97% (5) | 22.59% ± 3.26% (5) | - | ||
© 2019 by the authors. Licensee MDPI, Basel, Switzerland. This article is an open access article distributed under the terms and conditions of the Creative Commons Attribution (CC BY) license (http://creativecommons.org/licenses/by/4.0/).
Share and Cite
MDPI and ACS Style
Teschemacher, S.; Rieger, W.; Disse, M. Experimental Investigation of Lateral Subsurface Flow Depending on Land Use and Soil Cultivation. Water 2019, 11, 766. https://doi.org/10.3390/w11040766
AMA Style
Teschemacher S, Rieger W, Disse M. Experimental Investigation of Lateral Subsurface Flow Depending on Land Use and Soil Cultivation. Water. 2019; 11(4):766. https://doi.org/10.3390/w11040766
Chicago/Turabian StyleTeschemacher, Sonja, Wolfgang Rieger, and Markus Disse. 2019. "Experimental Investigation of Lateral Subsurface Flow Depending on Land Use and Soil Cultivation" Water 11, no. 4: 766. https://doi.org/10.3390/w11040766
Note that from the first issue of 2016, this journal uses article numbers instead of page numbers. See further details here.