Recharge Impulse Spreading in Western Carpathian’s Mountainous Fissure–Karst Aquifer


1
Štátny geologický ústav Dionýza Štúra—Geological Survey of Slovak Republic, 81704 Bratislava, Slovakia
2
CAD-ECO a.s., 82108 Bratislava, Slovakia
*
Author to whom correspondence should be addressed.
Water 2019, 11(4), 763; https://doi.org/10.3390/w11040763
Submission received: 13 March 2019
/
Revised: 3 April 2019
/
Accepted: 9 April 2019
/
Published: 12 April 2019
(This article belongs to the Special Issue Hydraulic Behavior of Karst Aquifers)
Abstract
:Foreseen construction of a highway tunnel in the northern part of the Veľká Fatra Mts. (Slovakia) triggered the need for extensive hydrogeological investigations. The projected tunnel axis would cut through a large body buildup of Middle Triassic carbonate rocks. Dolomites and limestones with fissure–karstic permeability are surrounded by less-permeable marls, so that all springs dewatering this uplifted plate of carbonates are found above the erosion base on its edges. Detailed, hourly-based discharge monitoring of all four major springs was performed during the spring and summer period of 2014. In the meantime, groundwater table observations in two boreholes, located in the center of the fissure–karst aquifer, were run in the same time interval. Based on air temperature and precipitation records, the 2013–2014 winter period was practically without snow cover. In the middle of March 2014, an intense rainfall event caused a sudden rise of the groundwater table in the TK-04 borehole located in the southern part of the carbonate plate. Spreading of this singular hydraulic impulse throughout the structure was differently registered at individual springs within the time shift span of 1.38 to 65.25 days. Groundwater level rise of 0.40 m in the TK-04 borehole was postponed in 5.33 days. The response time of spring discharge to sudden groundwater table rise within the structure occurred later at springs with a higher water temperature. Water temperature differences between individual springs were still within the 2.46 °C narrow interval (5.57–8.03 °C). The vertical component of groundwater flux should play an important role even in a relatively simple, plate-shaped mountainous karstic aquifer fully uplifted above the erosional base, as was the case of the investigated Kopa Mt. hydrogeological structure.
1. Introduction
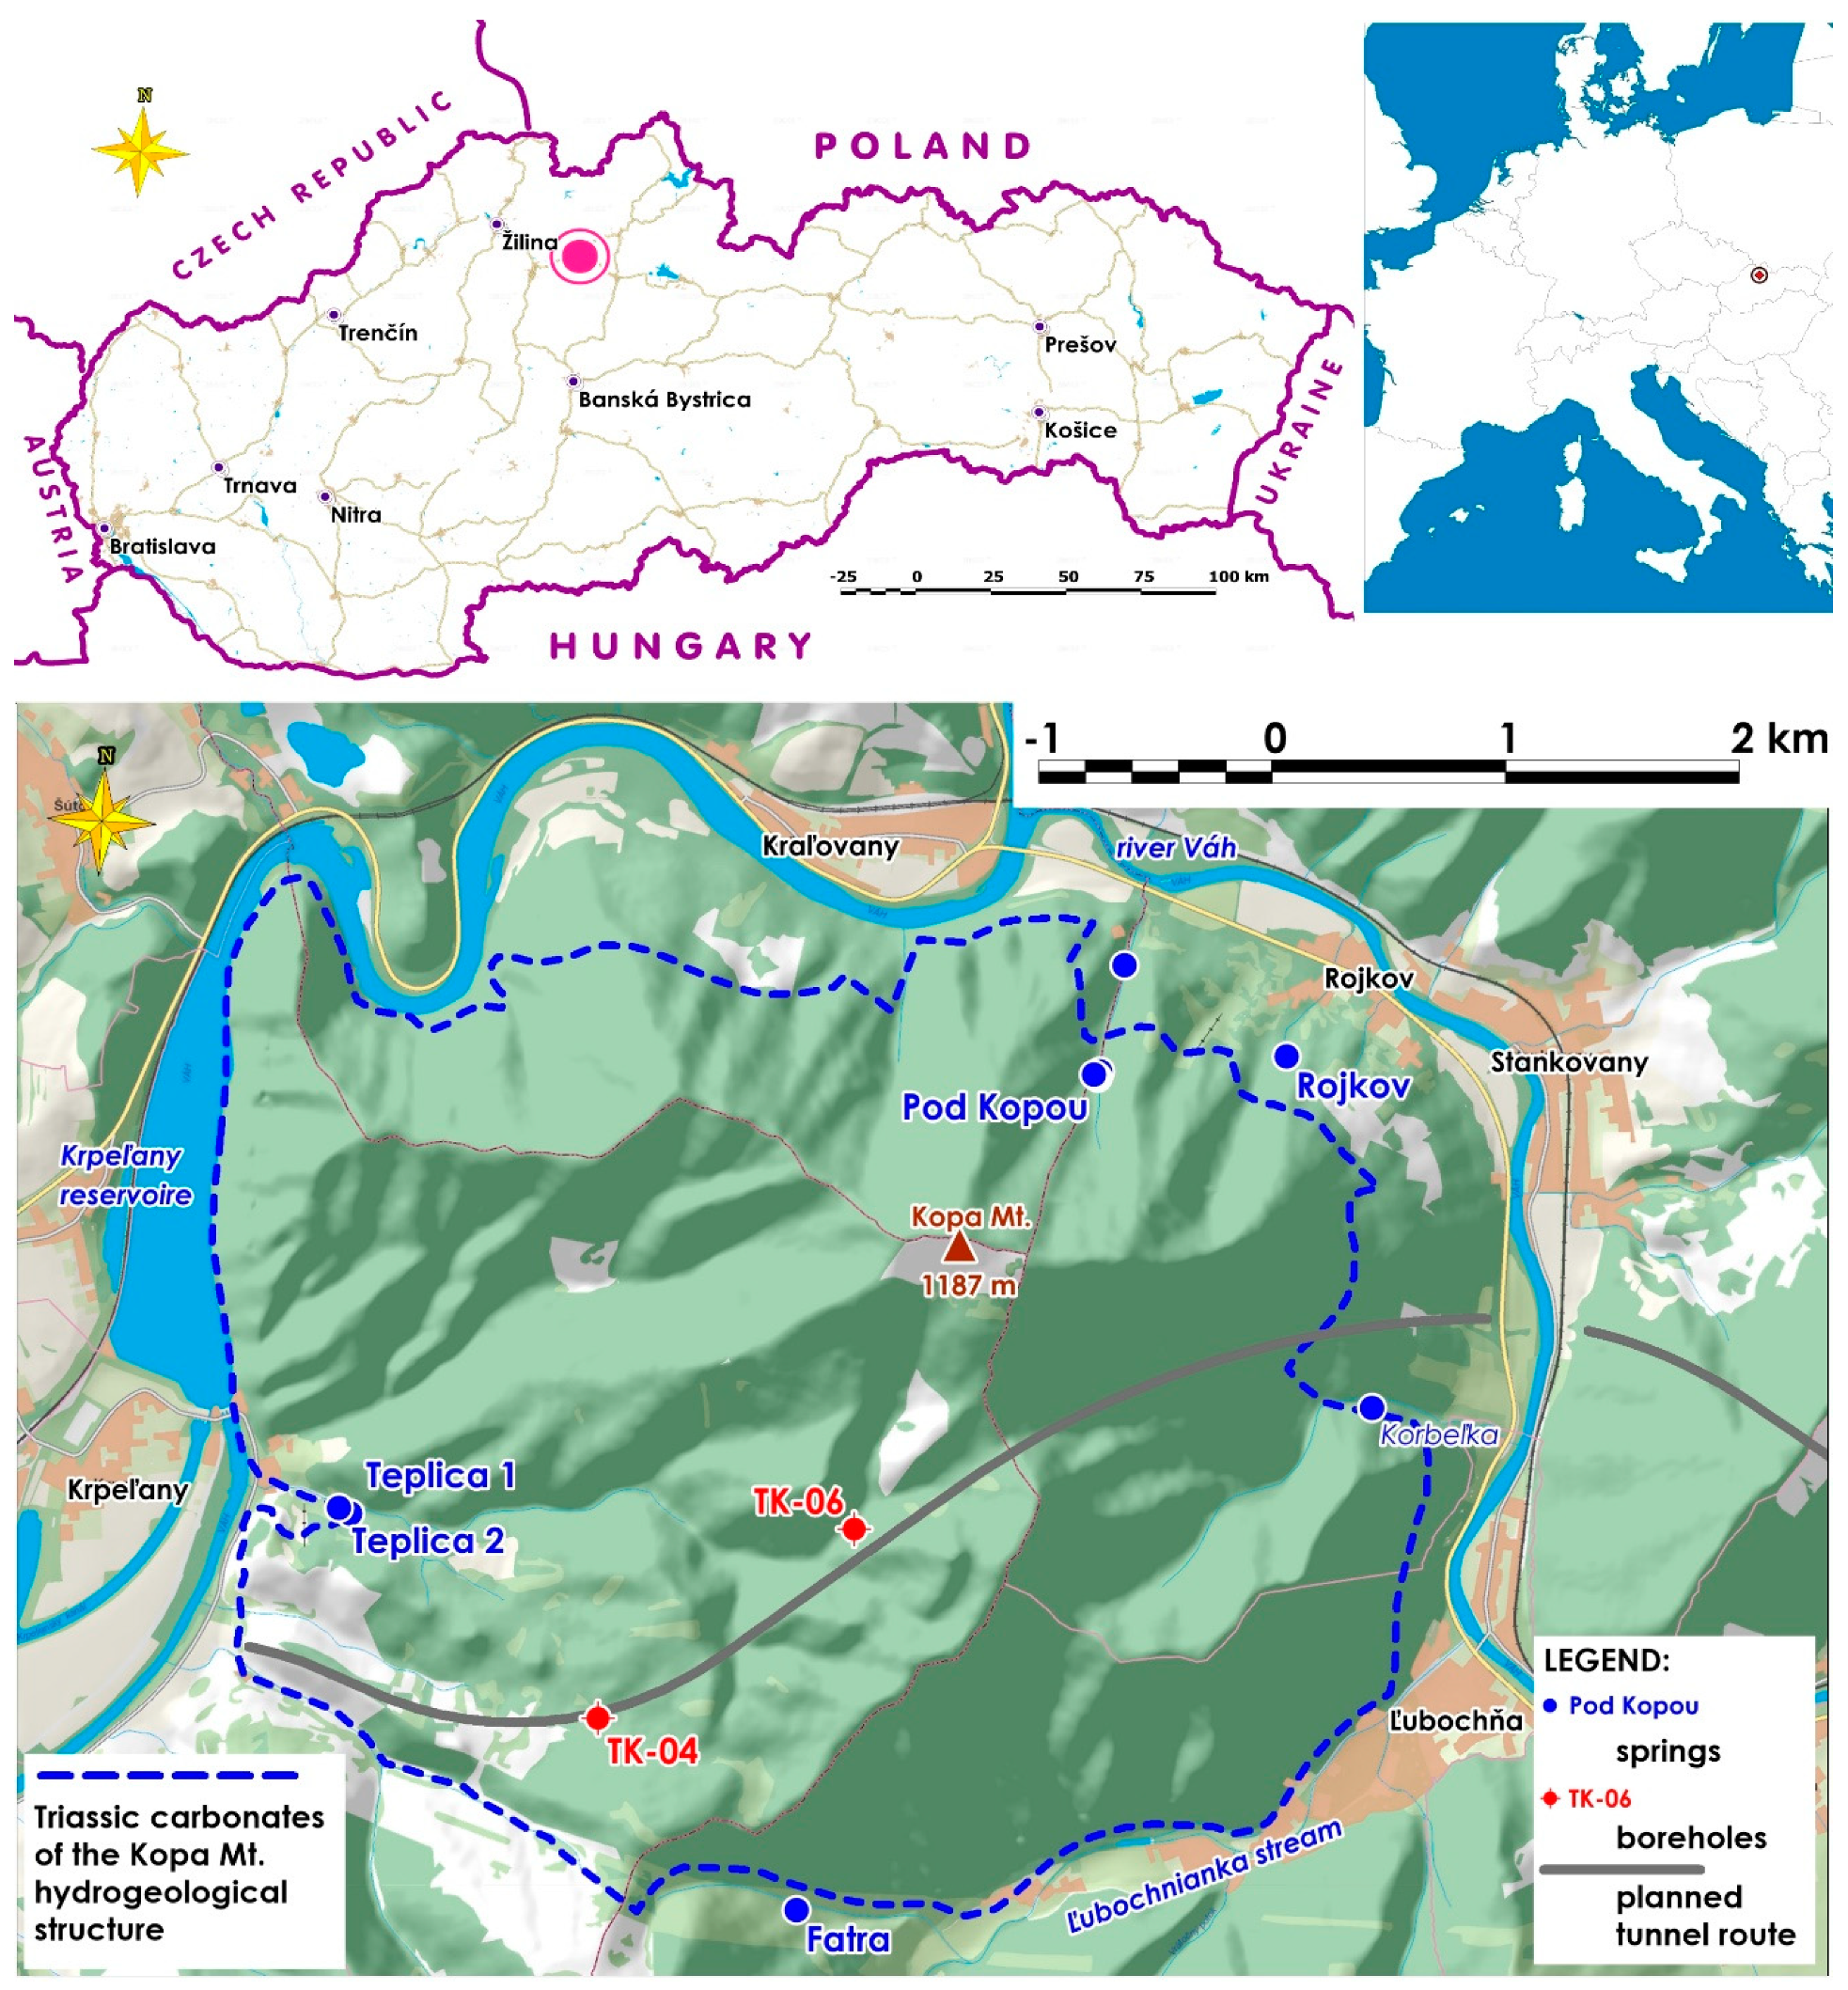
Karstic aquifers are promising and the often-preferred groundwater resource because of their ability to concentrate large discharging volumes into small numbers of extractable sources [1,2,3,4]. On the other hand, their heterogeneity caused by their genetic predisposition forces its users to apply appropriate water management methods, especially when facing droughts resulting from climate change [5,6] and to appropriately consider their extreme vulnerability [7,8]. The same karstified rock masses can also pose a high risk to engineering structures, both by possible destruction and sudden karst-water breakthroughs [9,10]. In our particular study, both exploited groundwater sources and engineering aspects of karst aquifers were under the scope of view. The planned highway route connecting the two biggest cities of the Slovak Republic-Košice on the east and Bratislava on the west—was for many years intended to follow the major valley of the River Váh (Figure 1). Emerging environmental threats posed by the highway traffic and the highway itself, especially to the protected wetlands in the River Váh valley, as well as the occurrence of slope deformations, gave rise to a broad discussion on the optimal highway routing, taking into consideration tunnel variants that should also cut a karstic aquifer. With continuing discussions in the first two decades of the third millennia, a particular highway section remained as the last section still unopened for construction work in the whole highway routing. Authorities should consider not only the higher costs of the highway tunnel compared to the surface variants, but also the value of the wetland ecosystems in comparison to the value of groundwater sources.
In this case, a karstic aquifer serves as a resource supplying the local communities with top-quality groundwater, and the respective waterworks infrastructure was built more than 50–70 years ago. Rerouting of the highway into a tunnel may pose a risk to substantial changes in groundwater flow patterns and the disappearance of springs exploited as drinking groundwater sources. This was the reason of starting intensive geological, engineering, and hydrogeological investigations in the area, including detailed monitoring of possibly endangered springs, drilling of deep boreholes along the planned tunnel route, and detailed monitoring of groundwater in these boreholes [11]. Due to lengthy pre-project administration caused by legal requirements on procurement in public tenders, mandatory detailed inspection of contractual terms, subsequent influence of seasonal changes in weather conditions, and final claims for a timely delivery of the report, only a part of the planned activities could be performed and completed. Nevertheless, these results still represent a good base for evaluation of particular karstic aquifer behavior, as well as interpretation of the broader context in the observed spreading of a strong recharge hydraulical impulse that was luckily recorded in the relatively short observation period.
2. Materials and Methods
2.1. Geographical, Geological and Hydrogeological Background
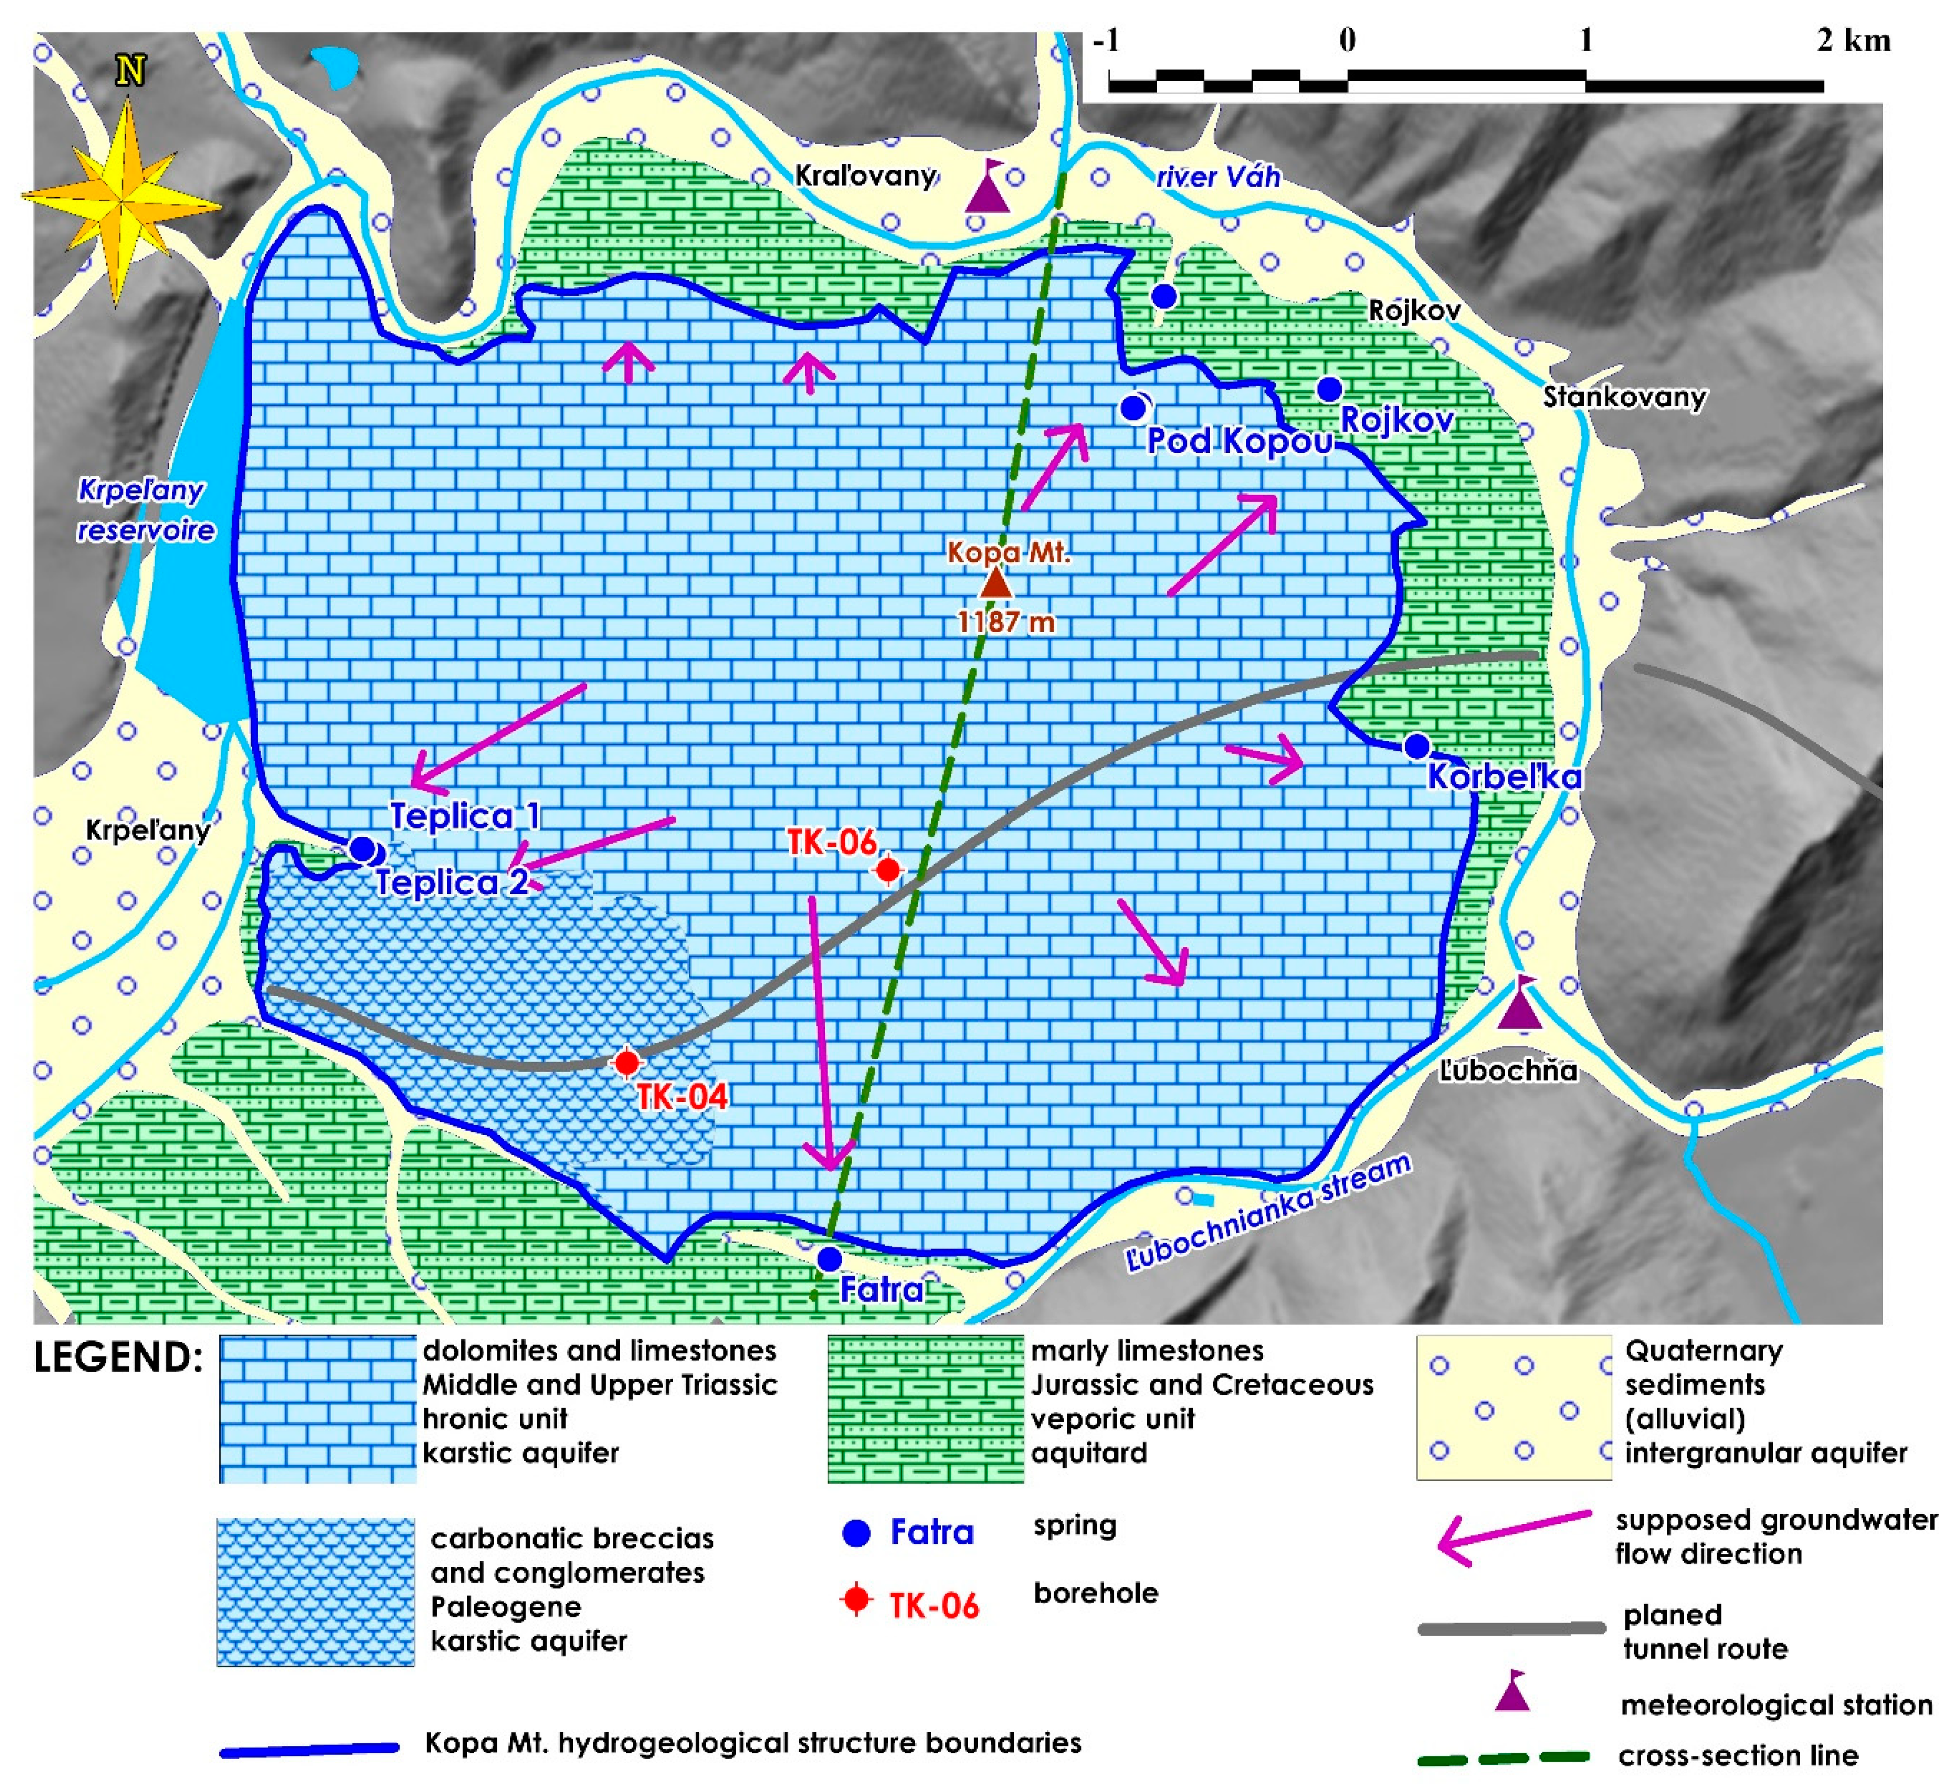
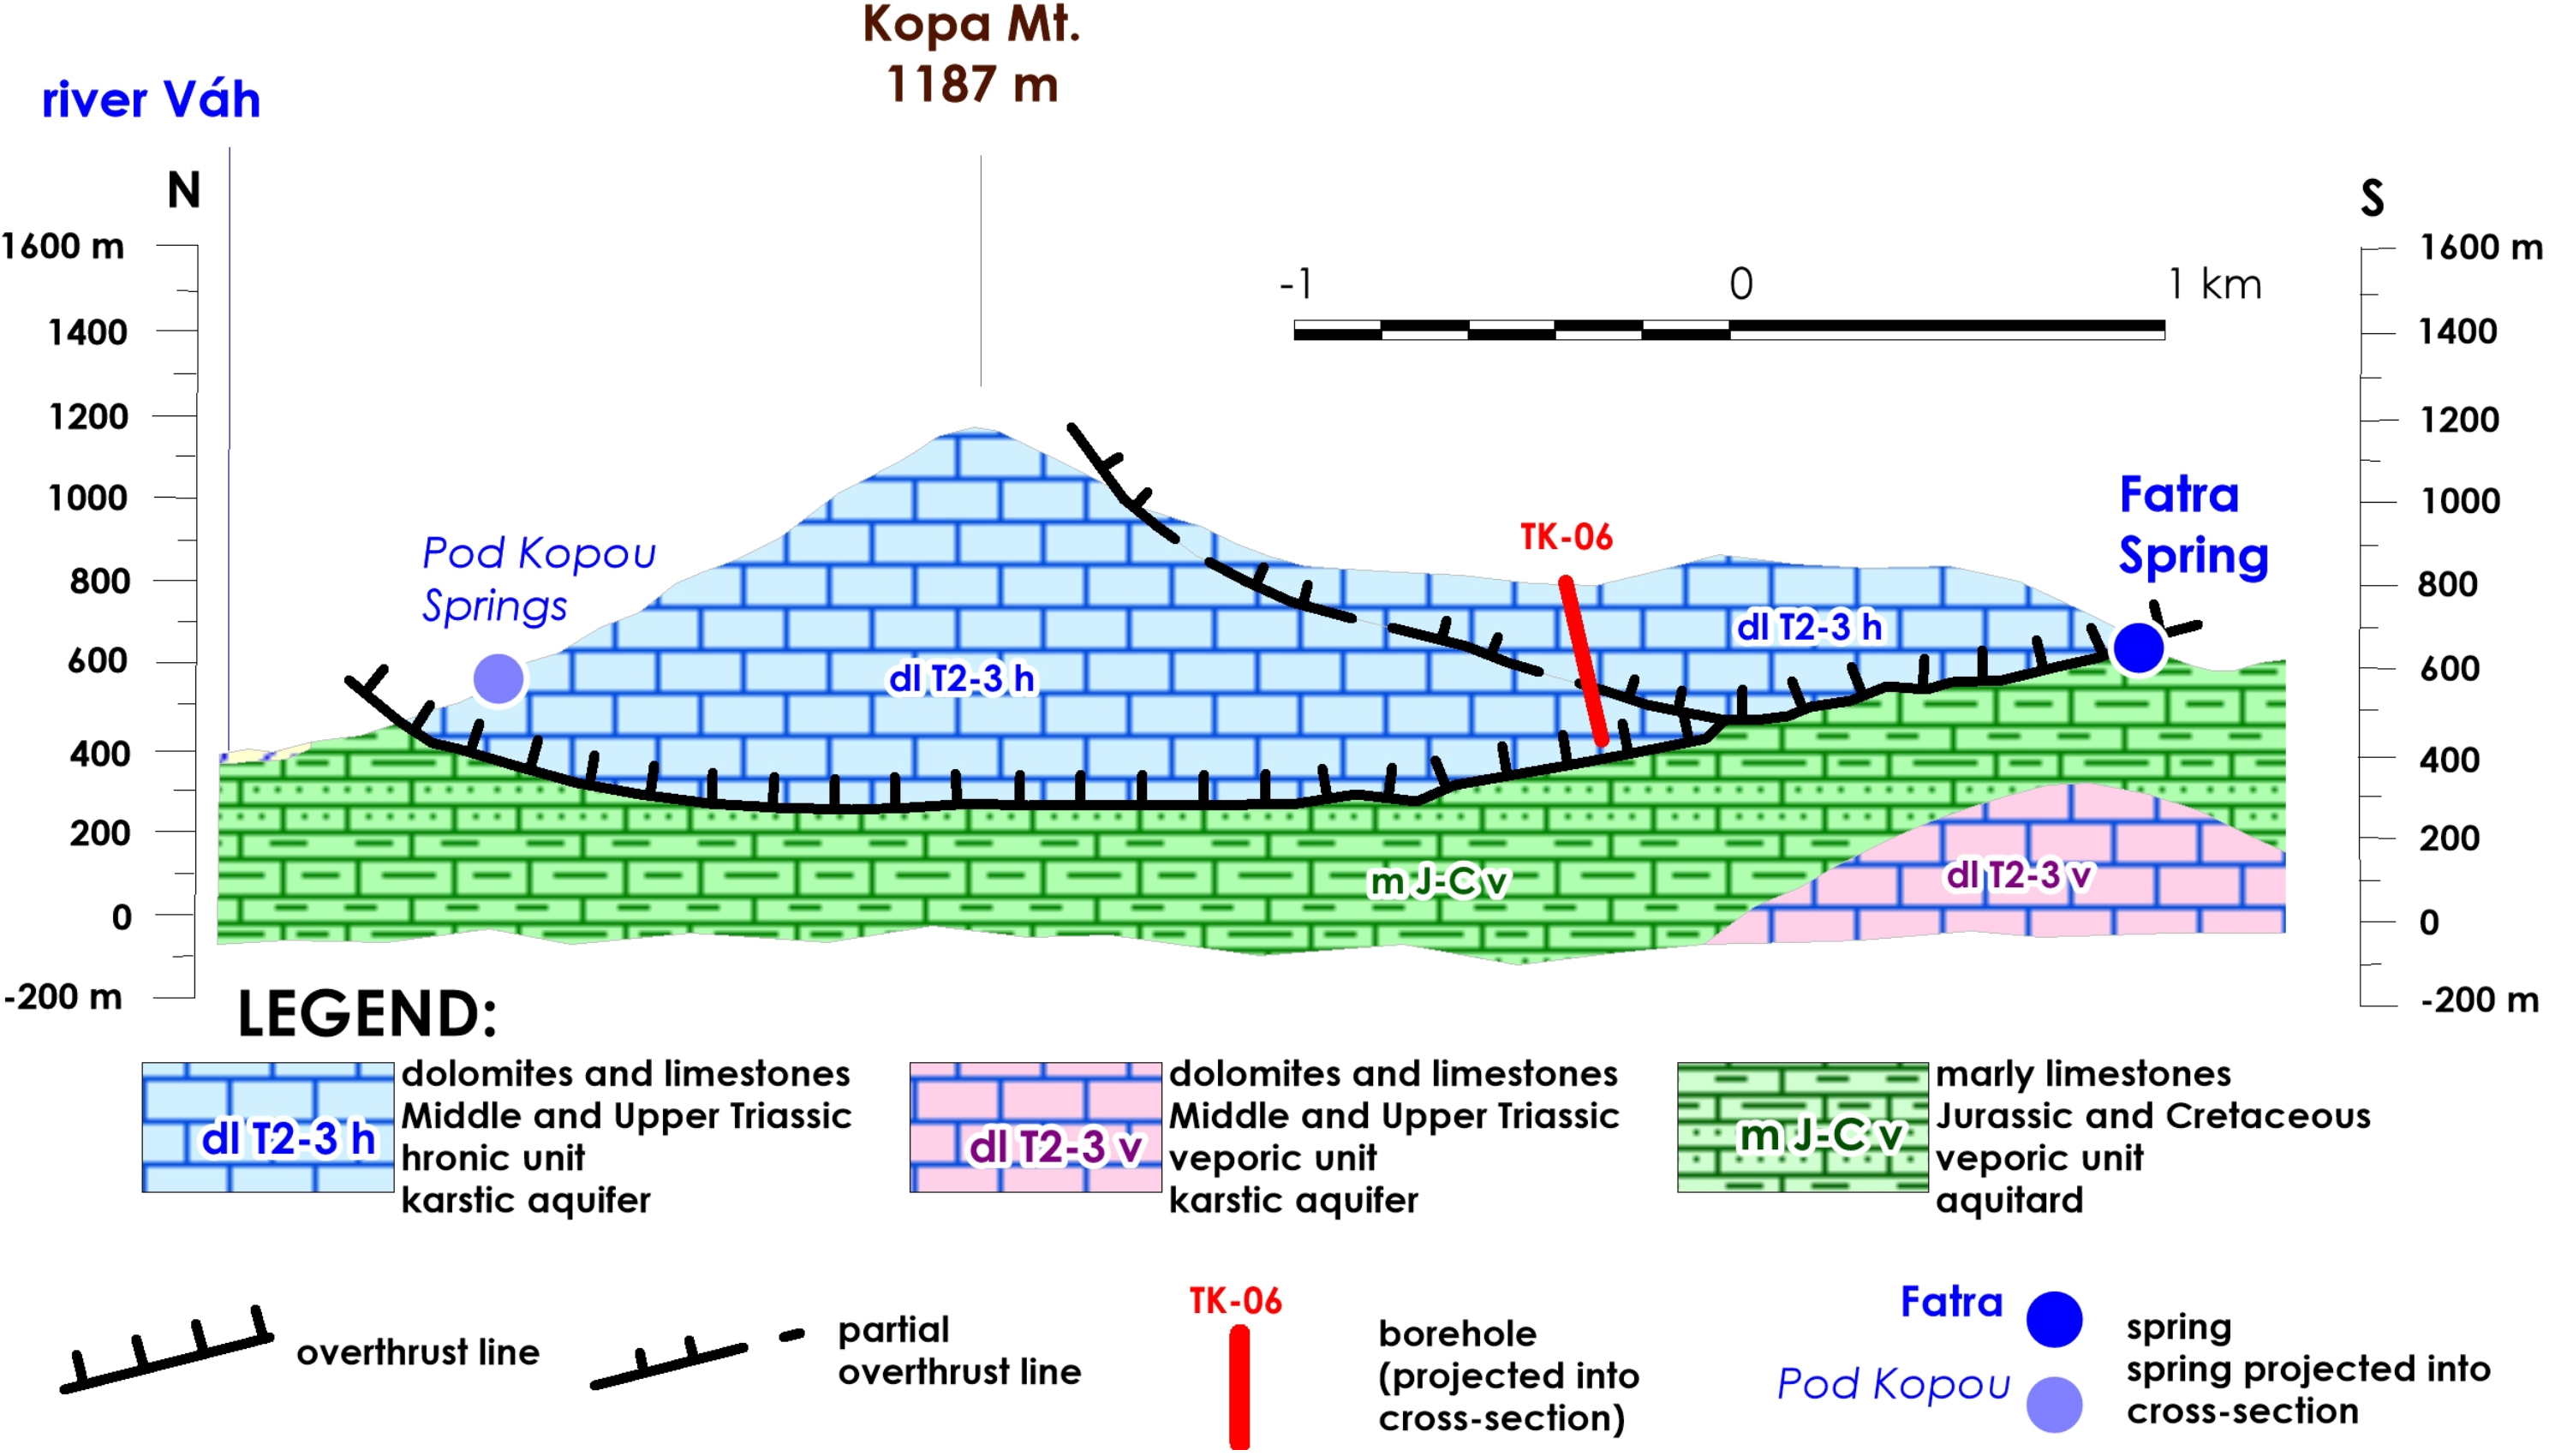
The investigated area covers the northern part of the Veľká Fatra Mts., an uplifted mountain range with an altitudinal range of 450–1,596 m above sea level (a.s.l.). By its geological structure, it belongs to the group of West Carpathians “core mountains”, with a Paleozoic granitic/crystalline “core” covered by a Mesozoic “envelope” (usually of Lower Triassic–Upper Cretaceous stratigraphical span) and series of overthrusted Mesozoic nappes; here the units of veporic and hronic [12,13] While the tectonically lower nappe of the veporic unit contains both karstifying carbonates and marly aquitards of the Middle Triassic to Lower Cretaceous, on the northern part of the Veľká Fatra Mts., the tectonically higher hronic unit comprises only dolomites and limestones of Middle and Upper Triassic. In the area considered for the highway route, hronic unit limestones and dolomites appear in the form of plate masses lying on the Lower Cretaceous marly limestones of the veporic unit. Such karstic aquifer plates are mostly uplifted above the erosional base, clearly separated by marly aquitards from below and dissected both by tectonic and erosion into more or less extensive continuous units. The direction of karstic groundwater flow is influenced by the dip of the underlying aquitard and the position of major springs is usually high enough above the erosional base level. This is also true in the case of the Kopa Mt. hydrogeological structure (Figure 2 and Figure 3), formed by karstified Triassic carbonates of hronic unit overthrusted on an aquitard of Lower Cretaceous marly limestones (veporic unit).
The regional karstification degree of carbonate rocks around Kopa Mt. is not so high, and corresponds to the prevailing dolomitic component present there. Only a small number of caves were registered there [14], and none of them were longer than a few tens of meters. In spite of this, in boreholes that were drilled there [11] karstification features could be frequently observed. These were mostly fractures enlarged by dissolution that were found in borehole logs and also documented by borehole camera inspection photos. In some cases, bigger open cavities were found (e.g., 1.3 m wide cavity in TK-06 borehole (documented in Table 2)).
Hronicum unit dolomites and limestones around the Kopa Mt. (1187 m a.s.l.) in the NW part of the Veľká Fatra Mts. occupy a surface area of 16.901 km2 and form a continuous karstic aquifer of the Kopa Mt. hydrogeological structure (Figure 1 and Figure 2). On a small area on the SW, Triassic carbonates are covered by Paleogene breccias and conglomerates of carbonatic material, hydraulically interconnected with underlying Triassic rocks. Groundwater recharge here is purely autogenic, by precipitation and snowmelt only, without any stream sinks. The average altitude of the outcropping carbonates is 735 m a.s.l., the mean annual air temperature is 5.8 °C, and the estimated mean annual precipitation [15] over the whole area is 869 mm. The outcropping surface of the karstic aquifer is without any surface streams, unevaporated precipitation directly recharges groundwater, and water reappears on the karst aquifer edges in the form of springs of different sizes. Together 61 springs were documented by detailed hydrogeological mapping at a scale of 1:10,000 [16], with a total documented discharge of 152.42 L∙s−1. The specific groundwater outflow (merely in the form of springs) from the whole area of the Kopa Mt. hydrogeological structure (16.901 km2) was calculated as 9.02 L∙s−1∙km−2 (284 mm). For decades, these major springs have been exploited as regional drinking water sources-Fatra Spring near Ľubochňa municipality (long-term mean discharge of 10.9 L∙s−1), Korbeľka Spring west of Ľubochňa (0.7 L∙s−1), five partial sources of Pod Kopou Spring near Kraľovany (together 16.4 L∙s−1), and two springs of Teplica (Teplica 1 and Teplica 2; sometimes also known as Teplička Springs) in Krpeľany (together 53.5 L∙s−1).
Although the hydrogeological structure of Kopa Mt. seems to be dewatered solely by springs located on its boundary, current meter measurements revealed smaller hidden groundwater surpluses that can appear at the Ľubochnianka stream on its eastern part [16]. As investigated by resistivimetry and thermometry, surface water of the Krpeľany water reservoir on the north possibly drains only very small groundwater amounts, not exceeding more than several L∙s−1 [17].
2.2. Groundwater Level and Discharge Observations
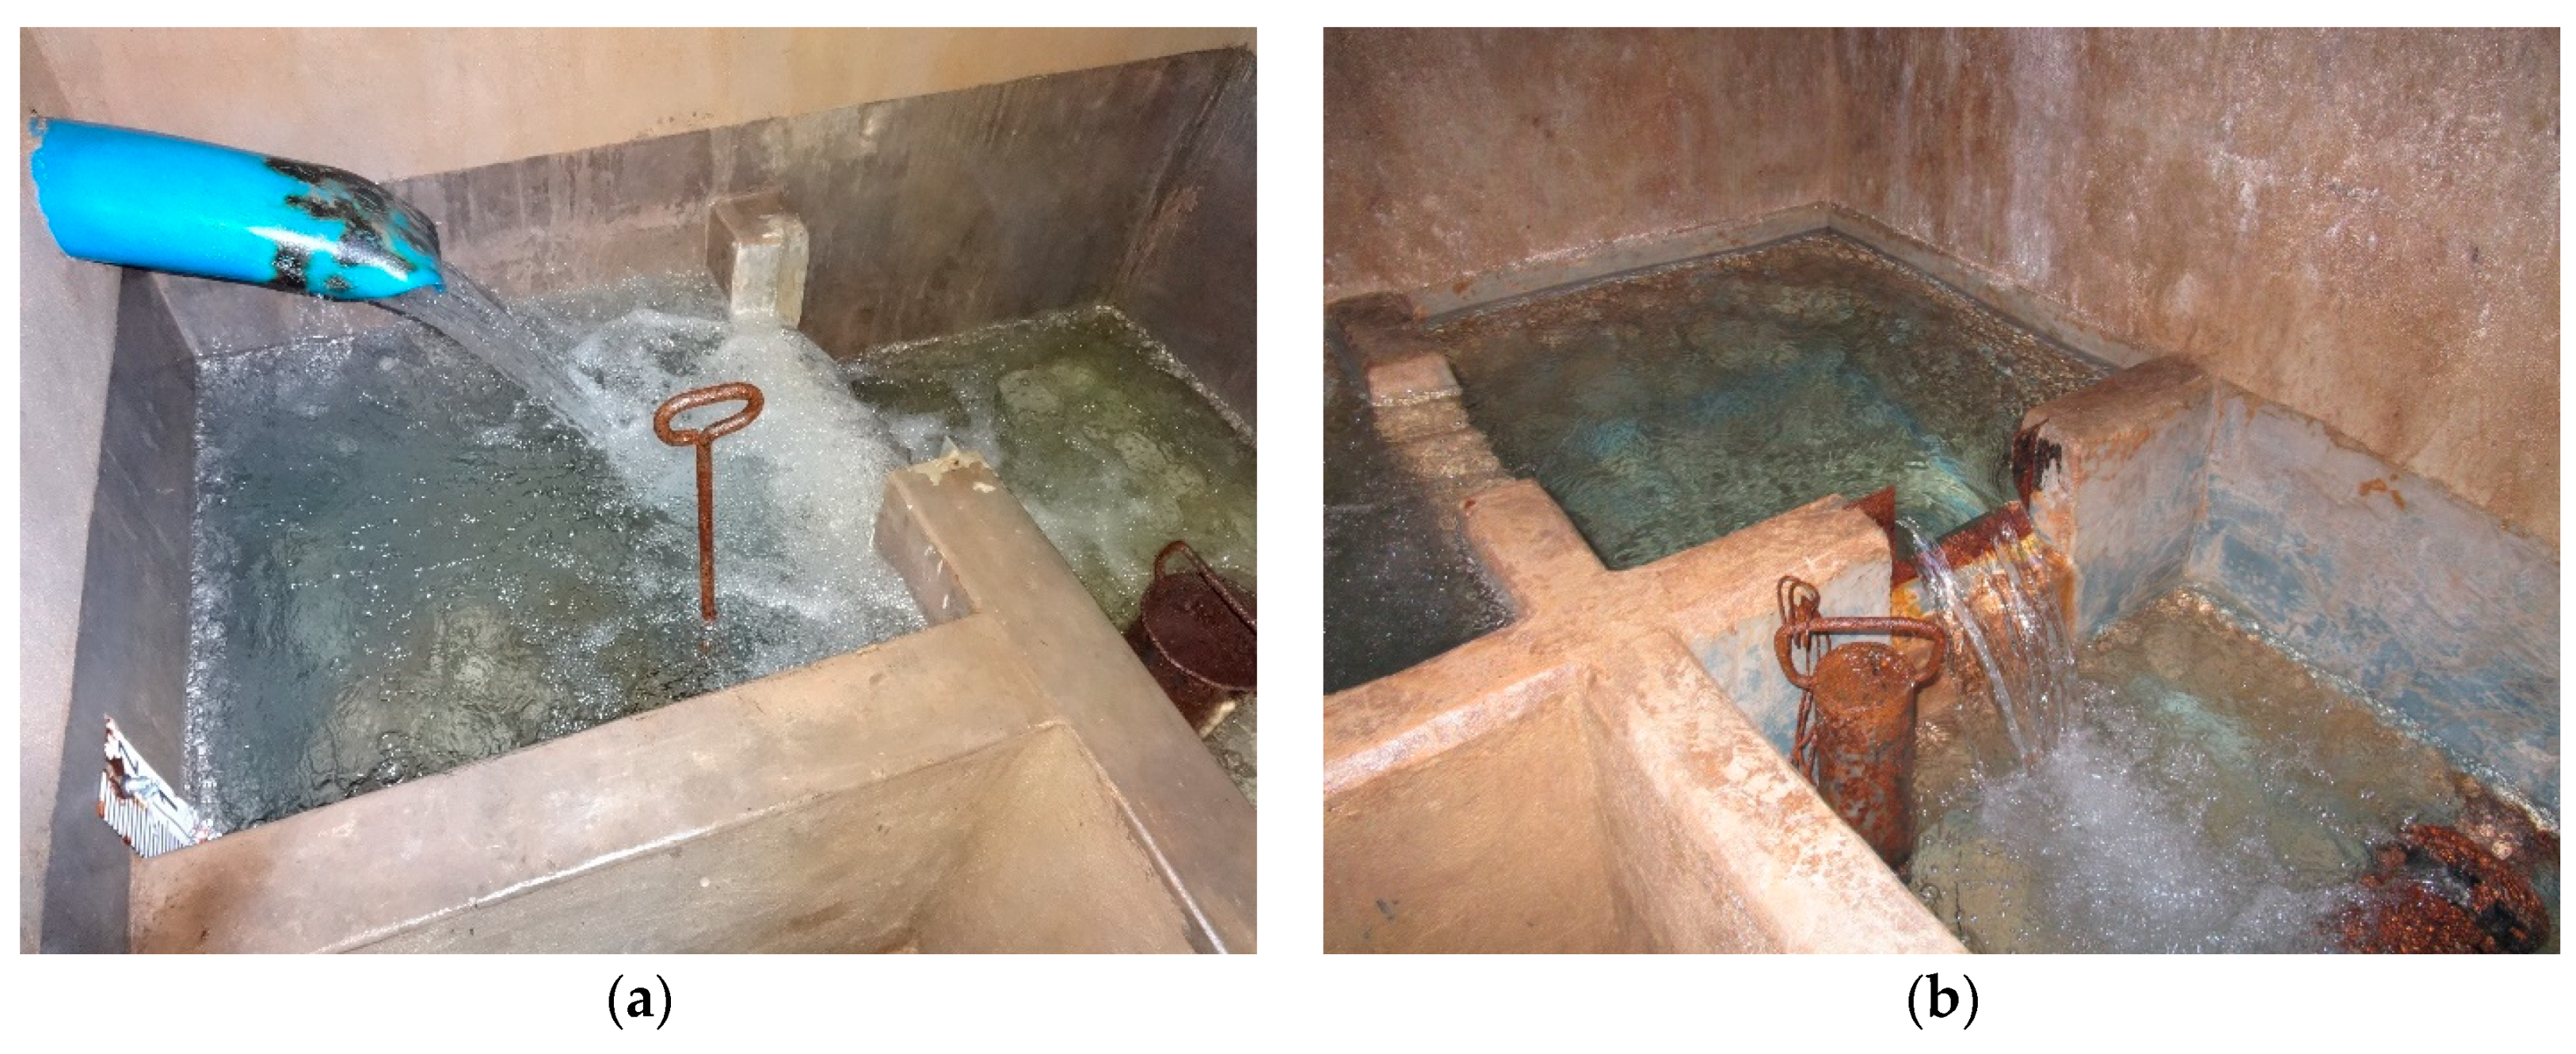
Regular discharge measurements on four major springs of the Kopa Mt. hydrogeological structure were gradually established at the end of February 2014. Karstic groundwater of all of the springs was abstracted for regional drinking water supply, and spring orifices were modified in the past to enable water abstraction, water pipeline manipulation, and source protection. Technical details of spring catchments and exploitation chambers were relatively similar: Water was collected underground by drainage pipes (mostly ceramic) leading to the closed concrete chamber (Figure 4). Here, water was running into a small retaining pool separated by a concrete wall from an additional pool with collecting piping, and equipped with a coarse iron basket filter. In the separating wall, some form of weir was installed (V-shaped or rectangular) enabling discharge measurements by reading the height of the water column above the weir basis. Here, Solinst Edge water pressure and temperature data loggers were installed and set to record the interval level once per hour. A pressure measurement accuracy of ±0.05% resulting in water level accuracy measurements of ±3 mm, temperature resolution of 0.003 °C, and temperature resolution ±0.05 °C was reported for this instrument. After reading of the data, recorded pressure values were re-calculated to discharge using the respective equations for particular weir type. For air pressure compensation, a Solinst barologger was placed into the space of the Fatra Spring exploitation chamber. Coordinates of the gauged springs, observation period, and additional gauging parameters are described in Table 1.
Boreholes aimed on engineering, geological, hydrogeological, and structural investigations in the area were gradually drilled since mid-January 2014. Various types of boreholes were drilled here, including numerous, but relatively shallow, boreholes in the alluvia and on the foot of the hill slopes, adjusted for various types of geotechnical testing. From a karstic hydrogeology point of view the most important were TK-04 and TK-06 structural geological boreholes. TK-04 borehole was drilled at the beginning of February 2014 to a depth of 230 m. Groundwater was found at the depth of 185 m below the ground level, and first 30 m below the Quaternary sediments were formed by Paleogene carbonatic breccias, sandstones, and conglomerates with visible dissolutional cavities. It is supposed, that although being of a different geological unit, Paleogene sediments are hydraulically well interconnected to underlying Middle Triassic dolomites, which were found down to a final depth of 230 m. TK-06 borehole, 370 m deep, was drilled during April 2014, catching only Middle Triassic dolomites and limestones in its bore log. At the beginning of March 2014, Solinst Edge data logger was installed to a depth around 200 m in TK-04 borehole, and set for hourly records of water pressure and water temperature. The same type of observations was established in TK-06 borehole, but only since the beginning of May 2014. These are therefore the only two piezometric level gauging objects situated directly in the Kopa Mt. hydrogeological structure, and observed at least for a couple of days parallel to the spring discharge observations. Observations in about ten of other boreholes were either situated outside of the karstic aquifer or had a late piezometric observation start, thus missing the period of spring observations. Selected important characteristics of TK-04 and TK-06 boreholes are shown in Table 2.
2.3. Climate Characteristic of the Area and Observations During the Investigated Period
Climate characteristics in the area have been regularly monitored by the Slovak Hydrometeorological Institute (SHMI) since the beginning of the twentieth century. In the respective area, there are located two precipitation stations: SHMI station 24020 Kraľovany (49.1501° N; 19.1333° E; 435 m a.s.l.) and station 21460 Ľubochňa (49.1167° N; 19.1667° E; 445 m a.s.l.). Air temperatures are monitored by SHMI 15 km SE from the Kopa Mt. at climatic station 11872 Ružomberok (49.07917° N; 19.30778° E; 482 m a.s.l.; not shown in Figure 1). Mean annual and monthly values for the period of 1981–2018 are listed in Table 3. The regional altitudinal air temperature gradient is approximately −0.5°C/100 m, as the mean altitude of the Kopa Mt. hydrogeological structure is 735 m. This should be taken into account to compare measurements at Ružomberok station (482 m a.s.l.) to those in the area (supposed to be 1.32 °C lower).
Although the period of common observations of spring discharges and piezometric levels at the site has been from February 2014 to June 2014, it was useful to have an overview of the meteorological situation preceding this period. In Table 4, the observed monthly precipitation totals and air temperatures are shown since July 2013, together with comparison to the long-term mean values of the 1981–2018 period, listed in Table 3.
According to Table 4, the period of July 2013–June 2014 in the investigated area can be characterized as slightly warmer (approximately 0.7 °C) and slightly dryer (approximately 9%), compared to similar periods between July and June of the years 1981–2018. Especially the winter period (December to February) was an average of 2.8 °C warmer, and traditional snow accumulation that usually appeared on the mountain ranges was practically missing. It is worth noting that snowmelt is the major source of groundwater replenishment in the area and was therefore very limited during this particular period.
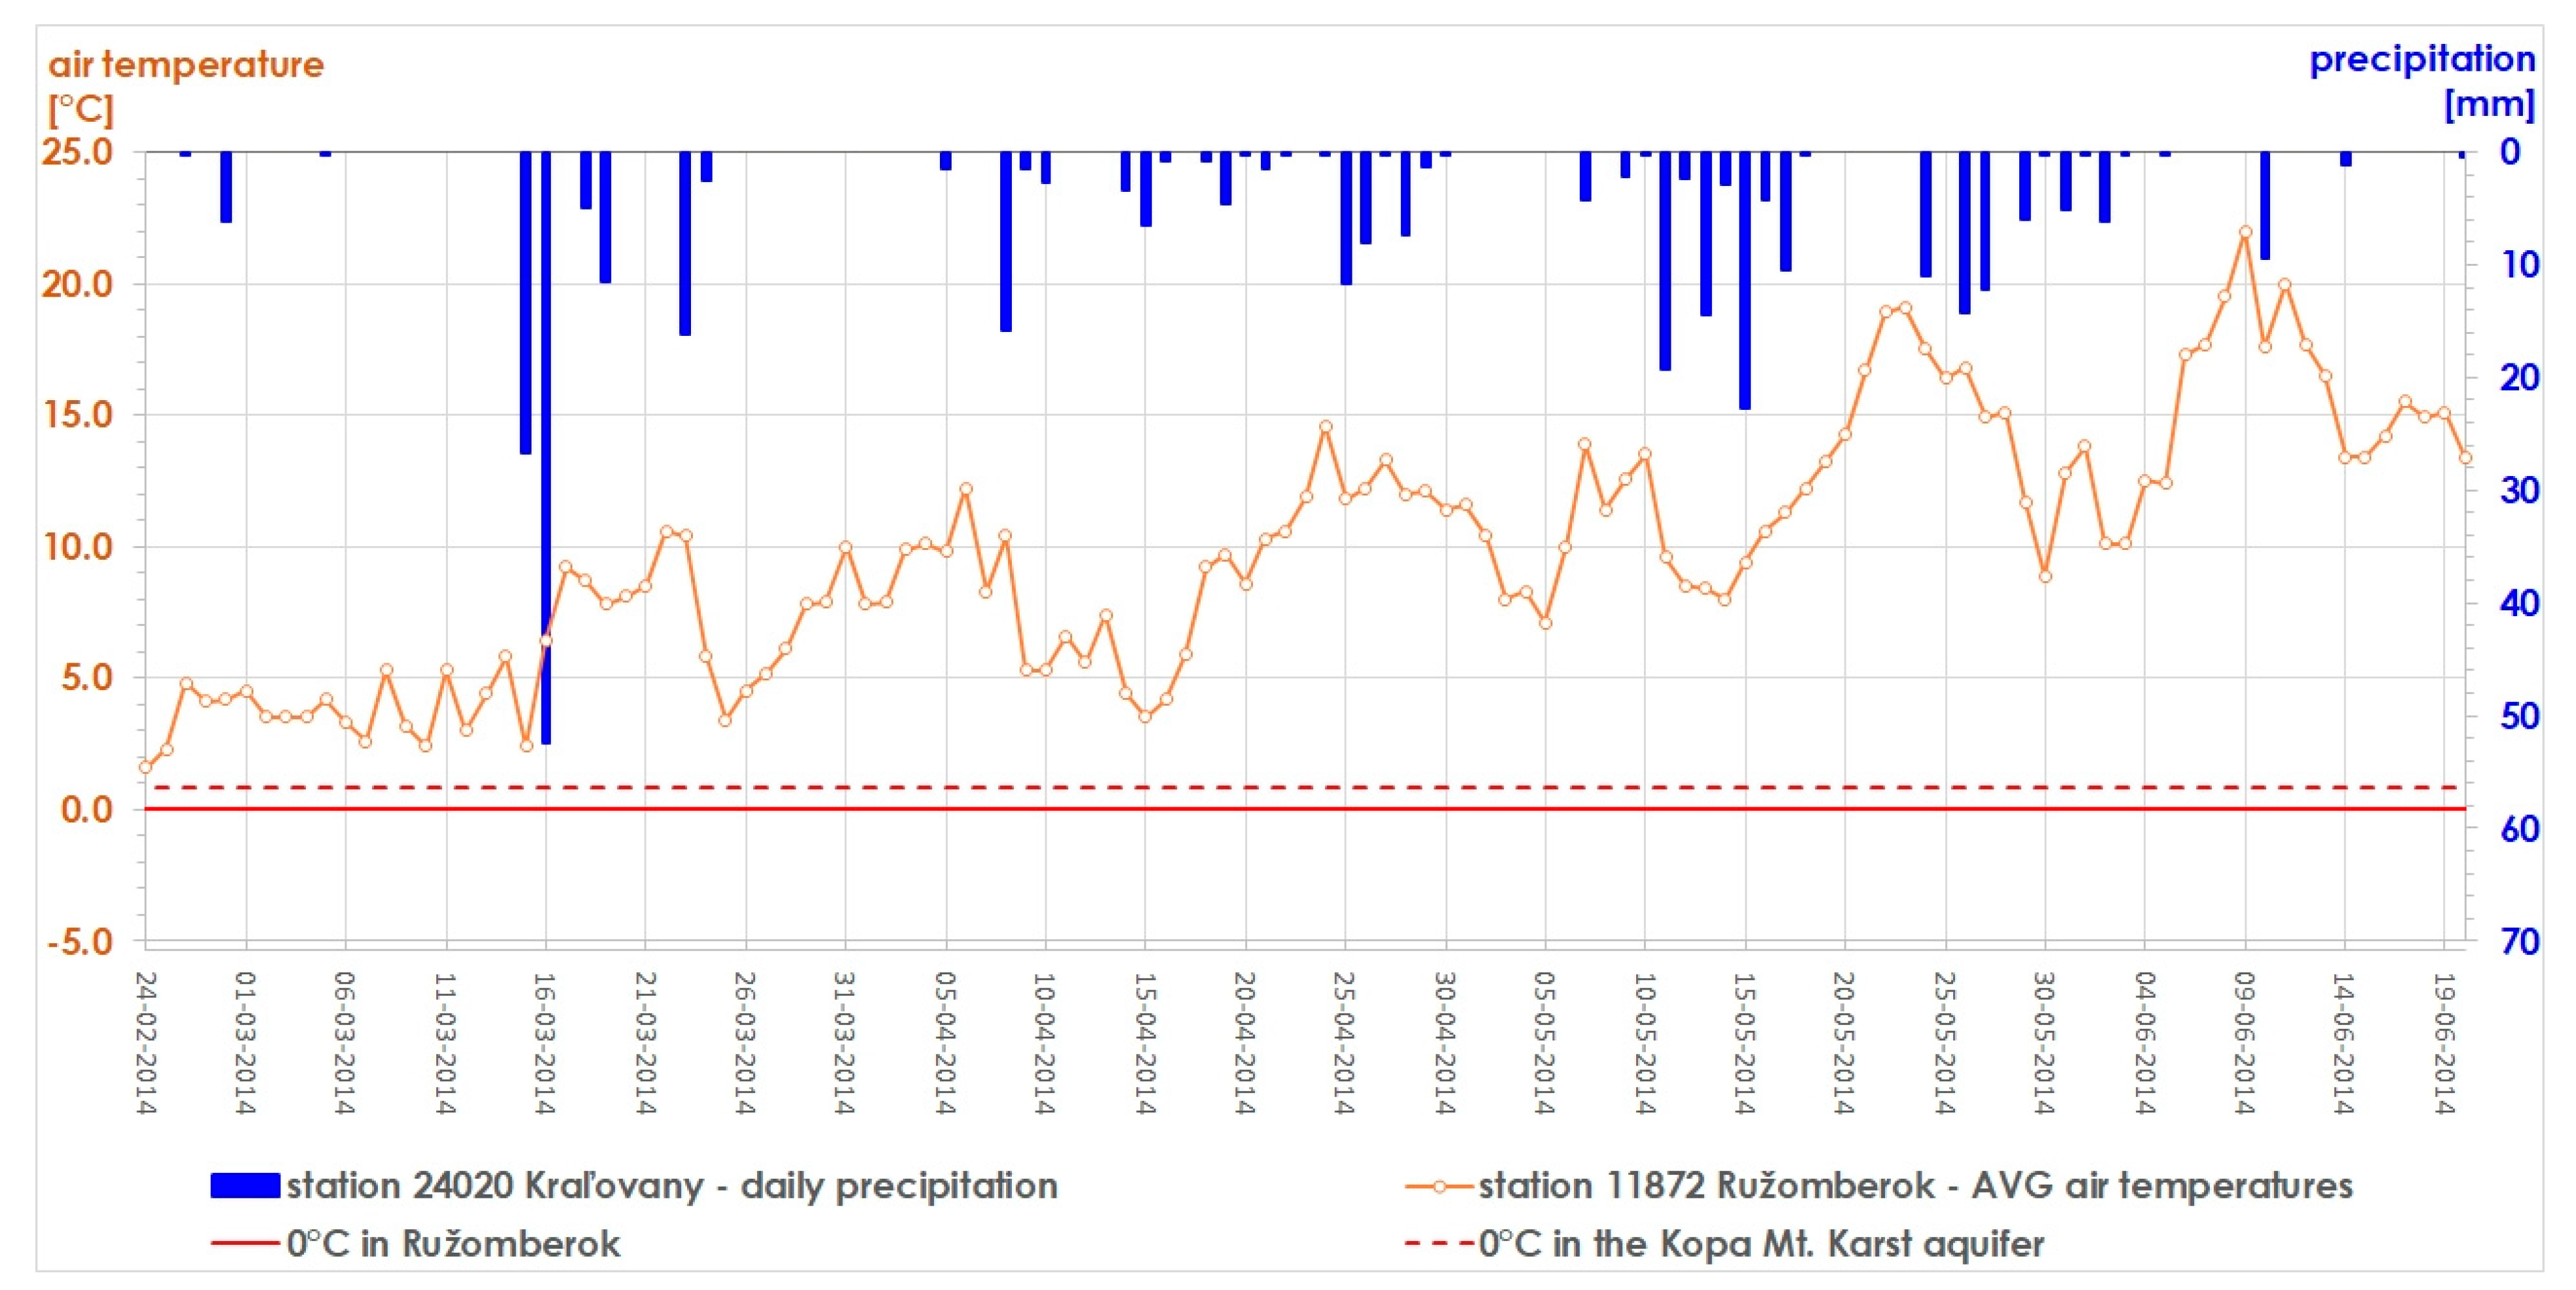
A more detailed view on the run of air temperatures and precipitation in the period between 24.02.2014 and 20.06.2014 (when the spring discharges were monitored) is in Figure 5. One can note that the air temperatures in the Ružomberok station were pretty much above zero for all of this period, as well as in the altitude of 735 m a.s.l. in the Kopa Mt. hydrogeological structure (marked by dashed line). Another important feature is the intense precipitation event of 52.3 mm that was registered on 16.03.2014 and preceded by 26.6 mm of rainfall one day before. In the following 55 days, until 11.05.2014, daily precipitation totals only exceeded 10 mm (11.4 mm on 19.03; 16.2 mm on 22.03; 15.8 mm on 08.04; 11.7 mm on 25.04.2014) four times.
3. Results
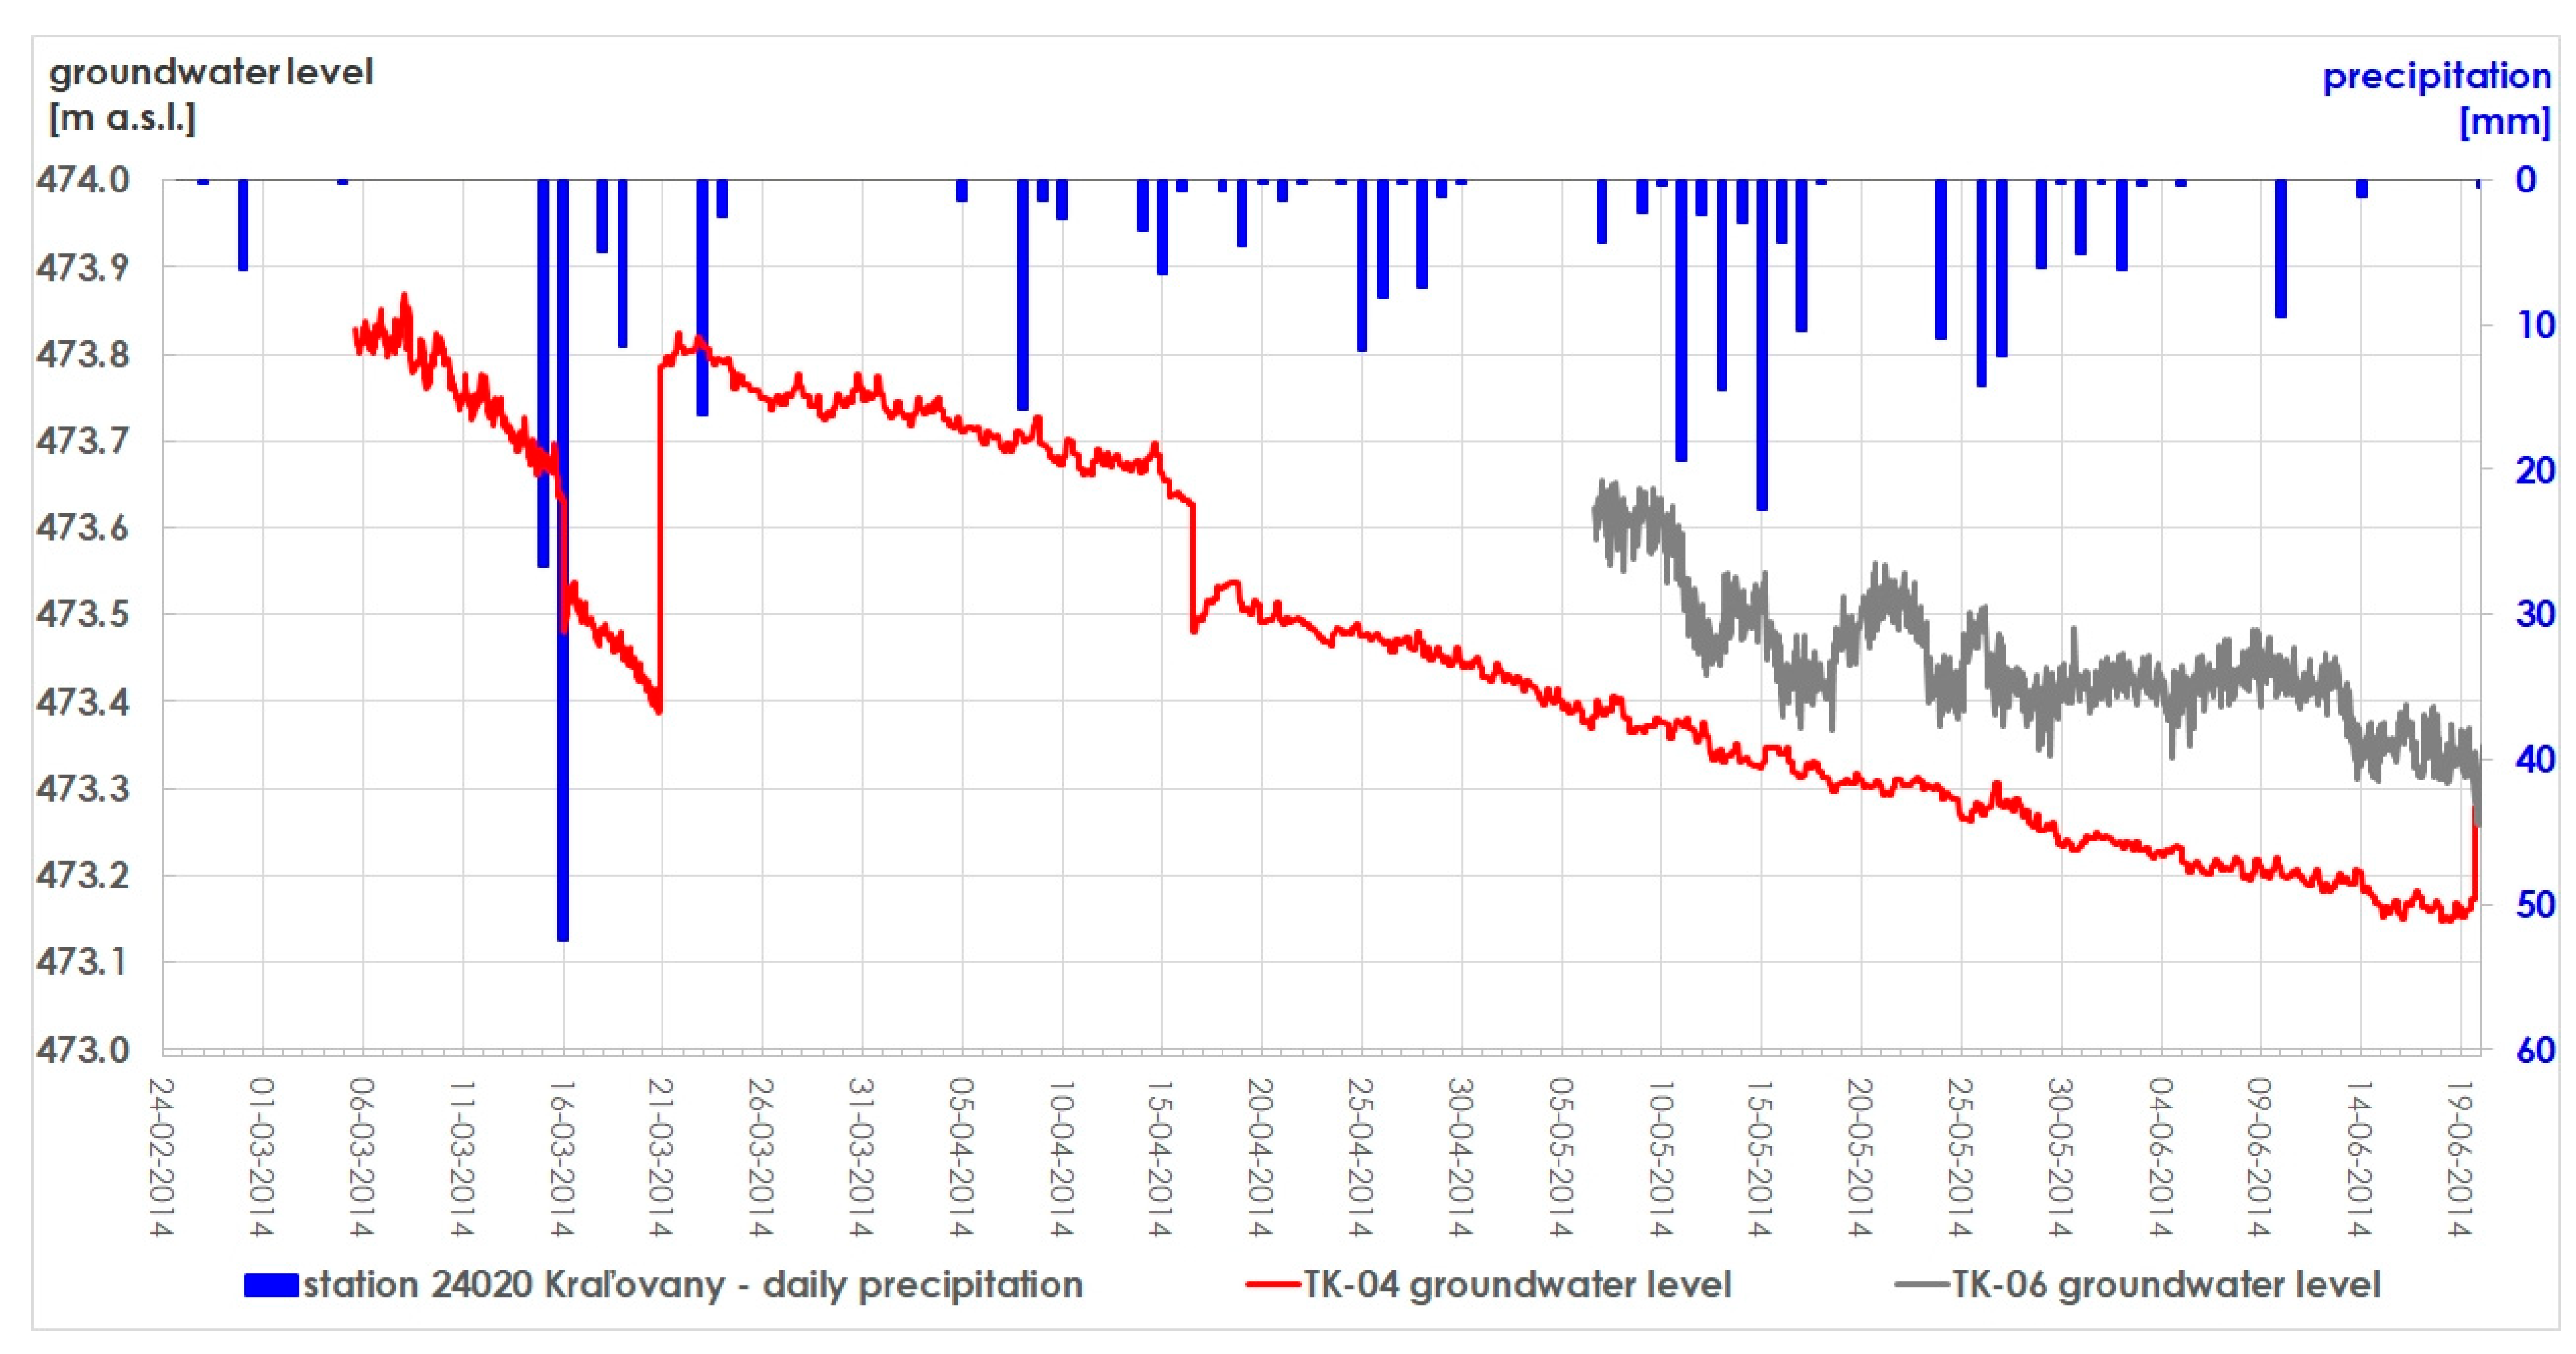
The observation of piezometric levels of groundwater registered in the two boreholes, TK-04 and TK-06, situated directly in the Kopa Mt. hydrogeological structure during the period from March to June 2014 (TK-04) and May to June 2014 (TK-06) have brought interesting results. Descriptive statistics of 2817 records taken in borehole TK-04 and 1329 records from TK-06 borehole is in Table 5. Free groundwater table was found deep in the karstic aquifer in both cases. In spite of their mutual distance of 1350 m, the level of groundwater table was practically at the same level (473.45/473.41 m a.s.l.). Respective to the altitudinal differences of their position (see Table 2), the average depth to groundwater was quite high: 188.88 m in TK-04 and 299.69 in TK-06 borehole. However, water level fluctuation measured in the reported period was only within a 0.72 m/0.47 m interval, and the water temperature record was also very stable with temperature differences not more than 0.03/0.02 °C. Water temperature difference between TK-04 and TK-06 was 1.08 °C with lower temperatures in TK-06 of a higher altitude. The course of groundwater levels and daily precipitation totals in the nearest Kraľovany station is in Figure 6, and values of groundwater levels depicted together with discharges of karstic springs is then shown in Figure 7.
Karstic springs occurring at the edges of the Kopa Mt. hydrogeological structure were all gauged parallel to their abstraction to the water supply system. Descriptive statistics of the observation results are listed in Table 6, and shown together with the results of groundwater level observations in boreholes in Figure 7. As shown in figure, it is clear that discharge measurements were strongly affected by water level fluctuation in the retaining chamber, which was collecting the water falling directly from the drainage pipes (Figure 4). Without having a possibility to calm in the additional pool, water floated through the weir directly to the water pipeline. These decades old construction details, with their limitations, did not allow us to perform ideal measurement procedures, but frequently taken readings on an hourly basis enabled the evaluation of discharge responses to the aforementioned recharge signal. A floating average of 24 readings was applied and will be discussed later.
In spite of high variation in spring discharge series, we can still follow the reaction of discharges in individual springs to the strong and single precipitation event that was registered on the Kraľovany precipitation station during two days, from 15.03.2014–16.03.2014 (78.9 mm). Both discharge culmination intensity and discharge culmination time shifts after this event were very different in individual springs and will be discussed later. In the case of groundwater levels, only one measurement point (TK-04 borehole) was available, and a sudden rise of groundwater table from 473.39 to 473.79 m a.s.l. was recorded within five days, culminating on 21.03.2014 at 20:00 (Figure 6 and Figure 7). This 40 cm step was a clear expression of recharge input to the karstic aquifer, but this was not the fastest response. This was registered at the Pod Kopou Spring, which reached its maximum on 17.03.2014 at 05:00 and perhaps also in the Teplica 1 Spring on 17.03.2014 at 13:00. Opposite behavior was found in the case of its neighboring Teplica 2 Spring, where it was not easy to identify a discharge culmination point in the time series recorded.
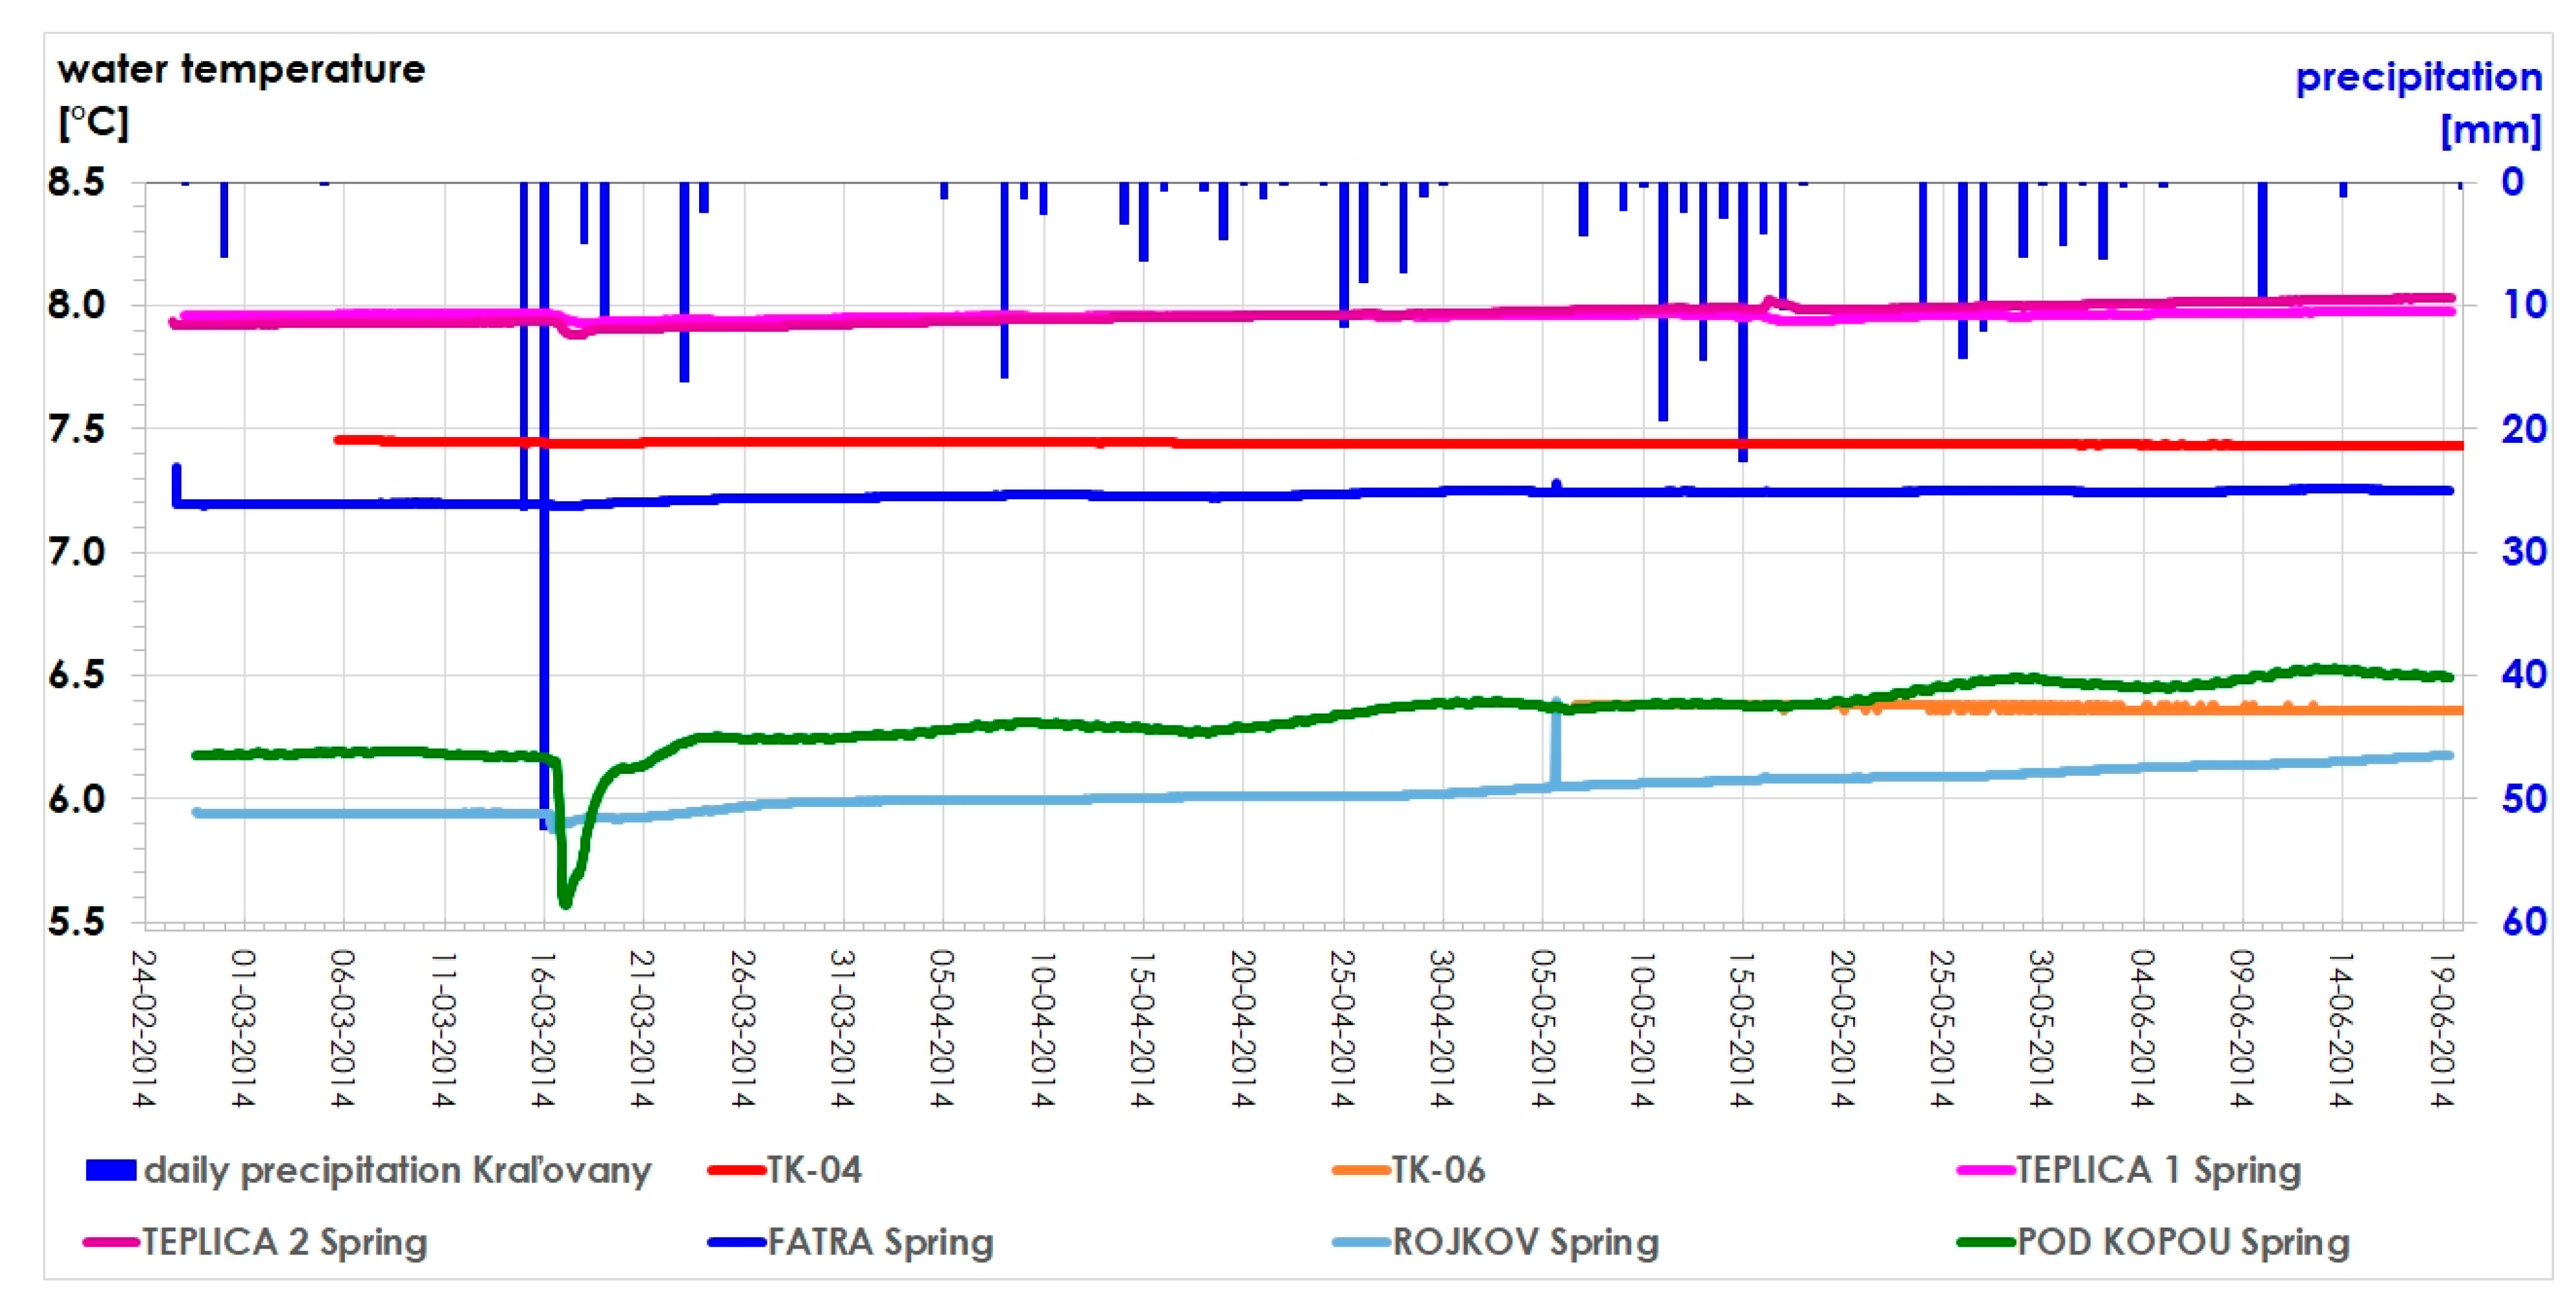
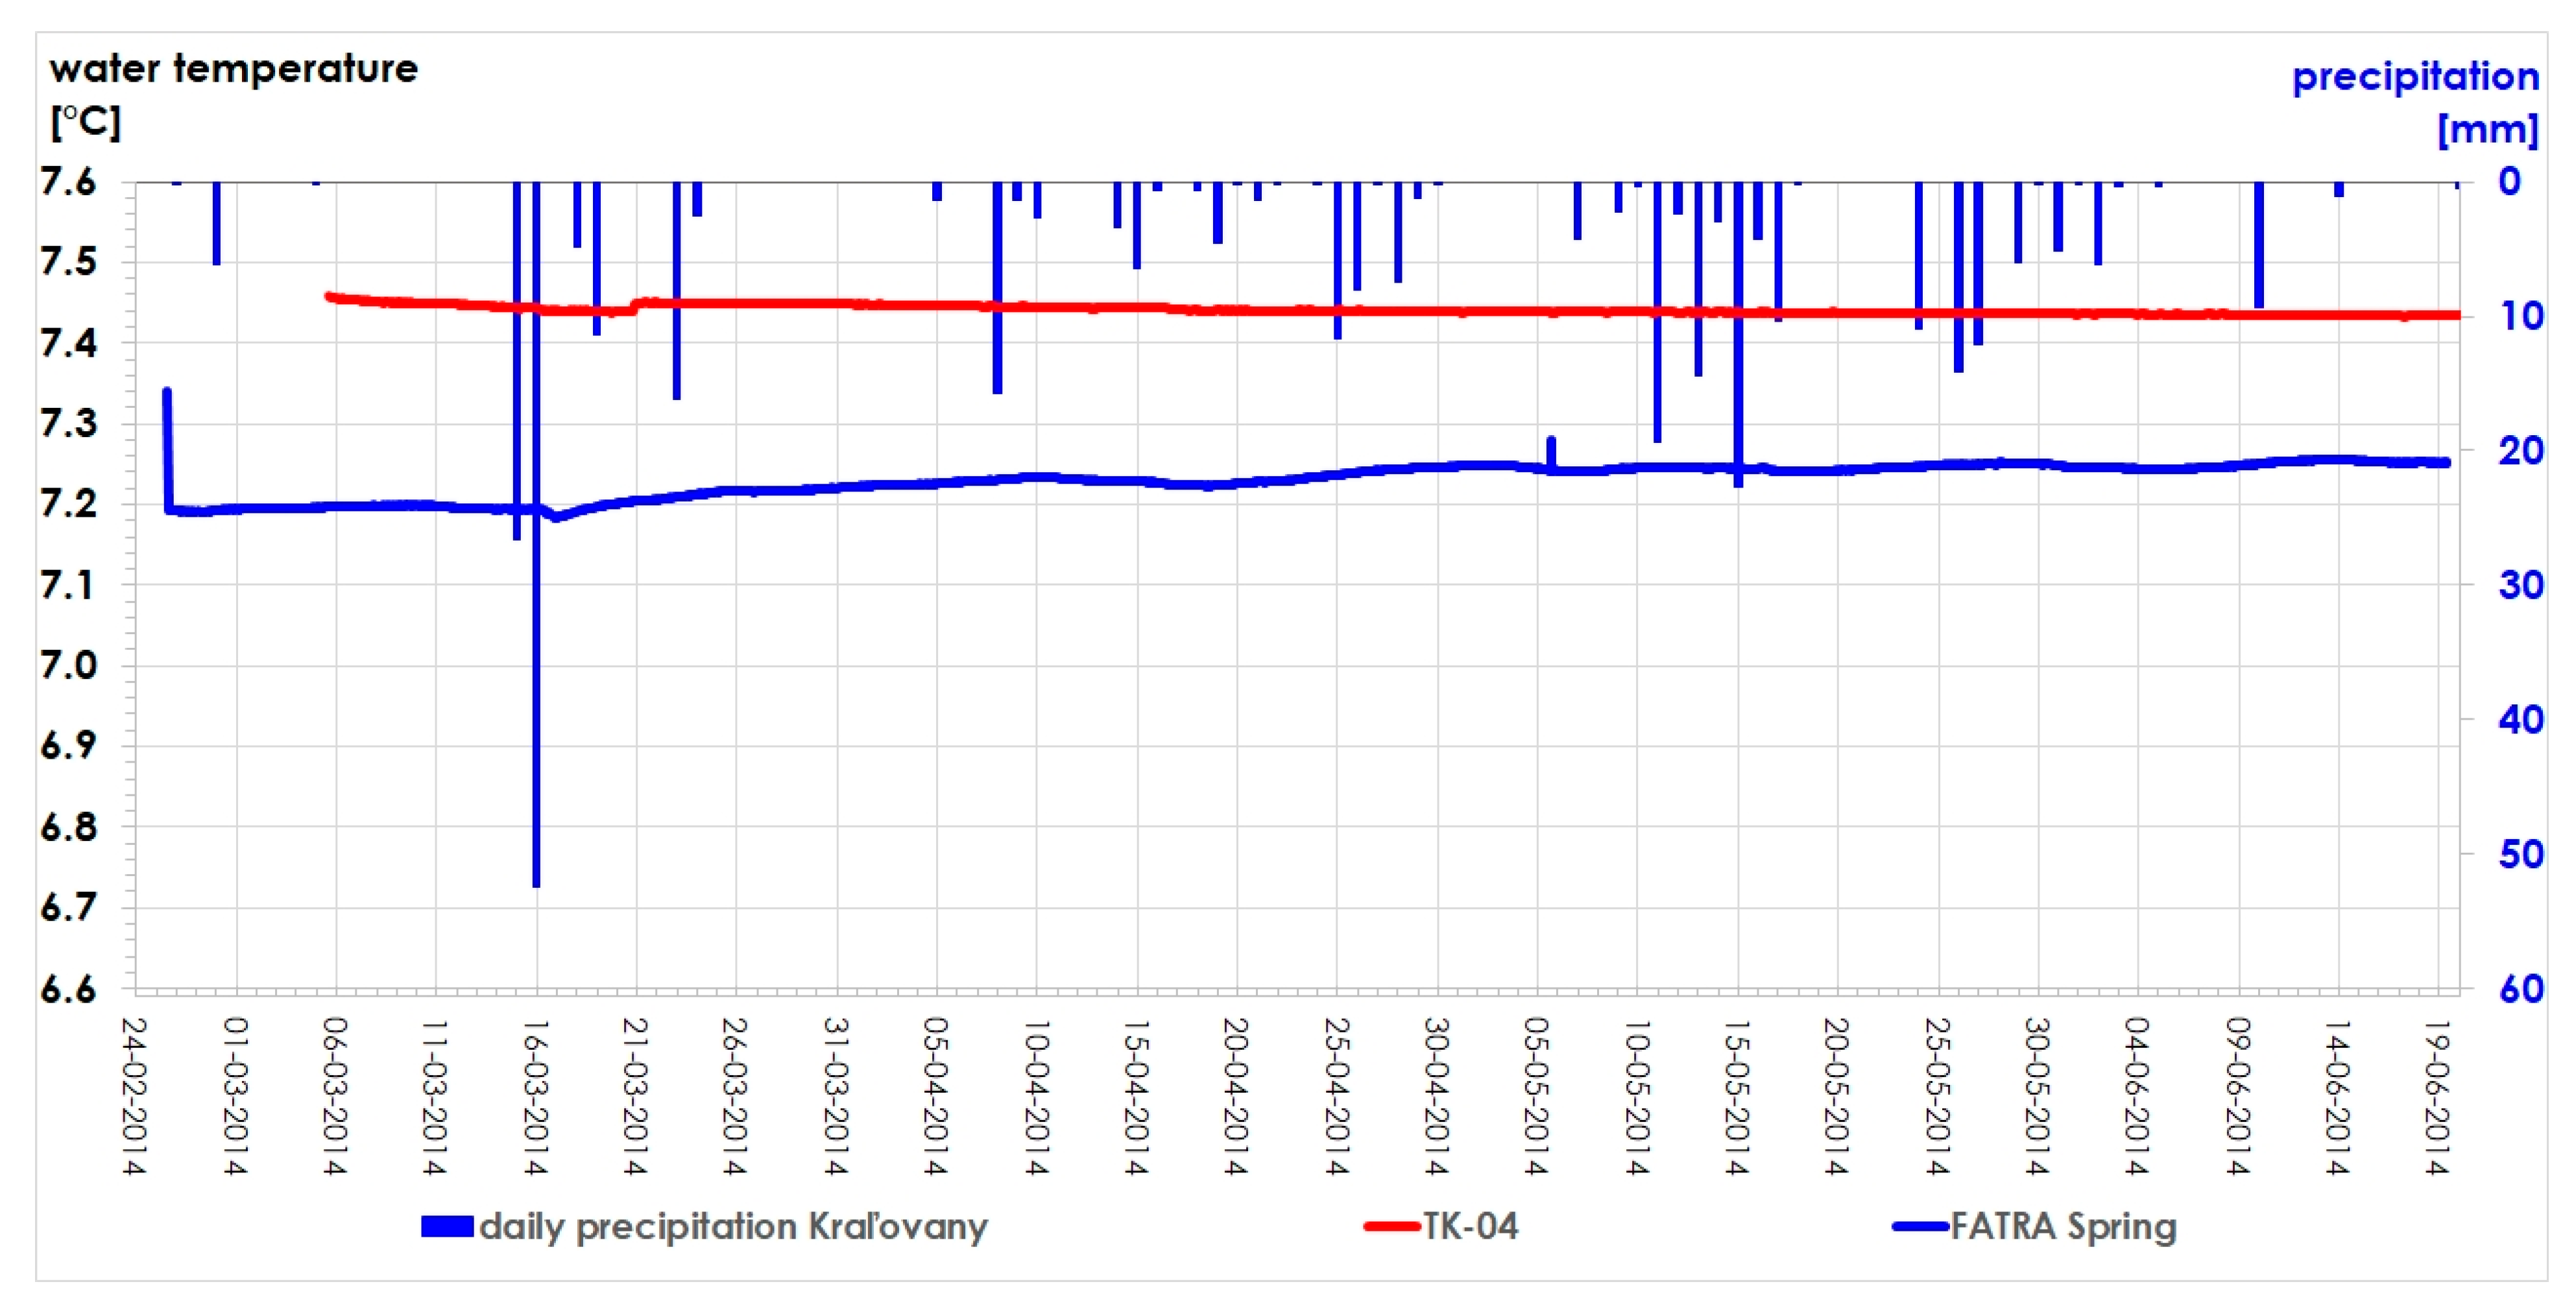
Contrary to the highly disturbed discharge data, groundwater temperature records showed great stability and clear time development (Table 5 and Table 6, Figure 8). When disturbed by manipulation with the instrument, single outliers in the time series are clearly visible as in the cases of water temperatures in Fatra Spring at the beginning of measurements (25.02.2014), or on data reading activity on 05.05.2014 (more visible on the Rojkov Spring time temperature series, see Figure 9 and Figure 10).
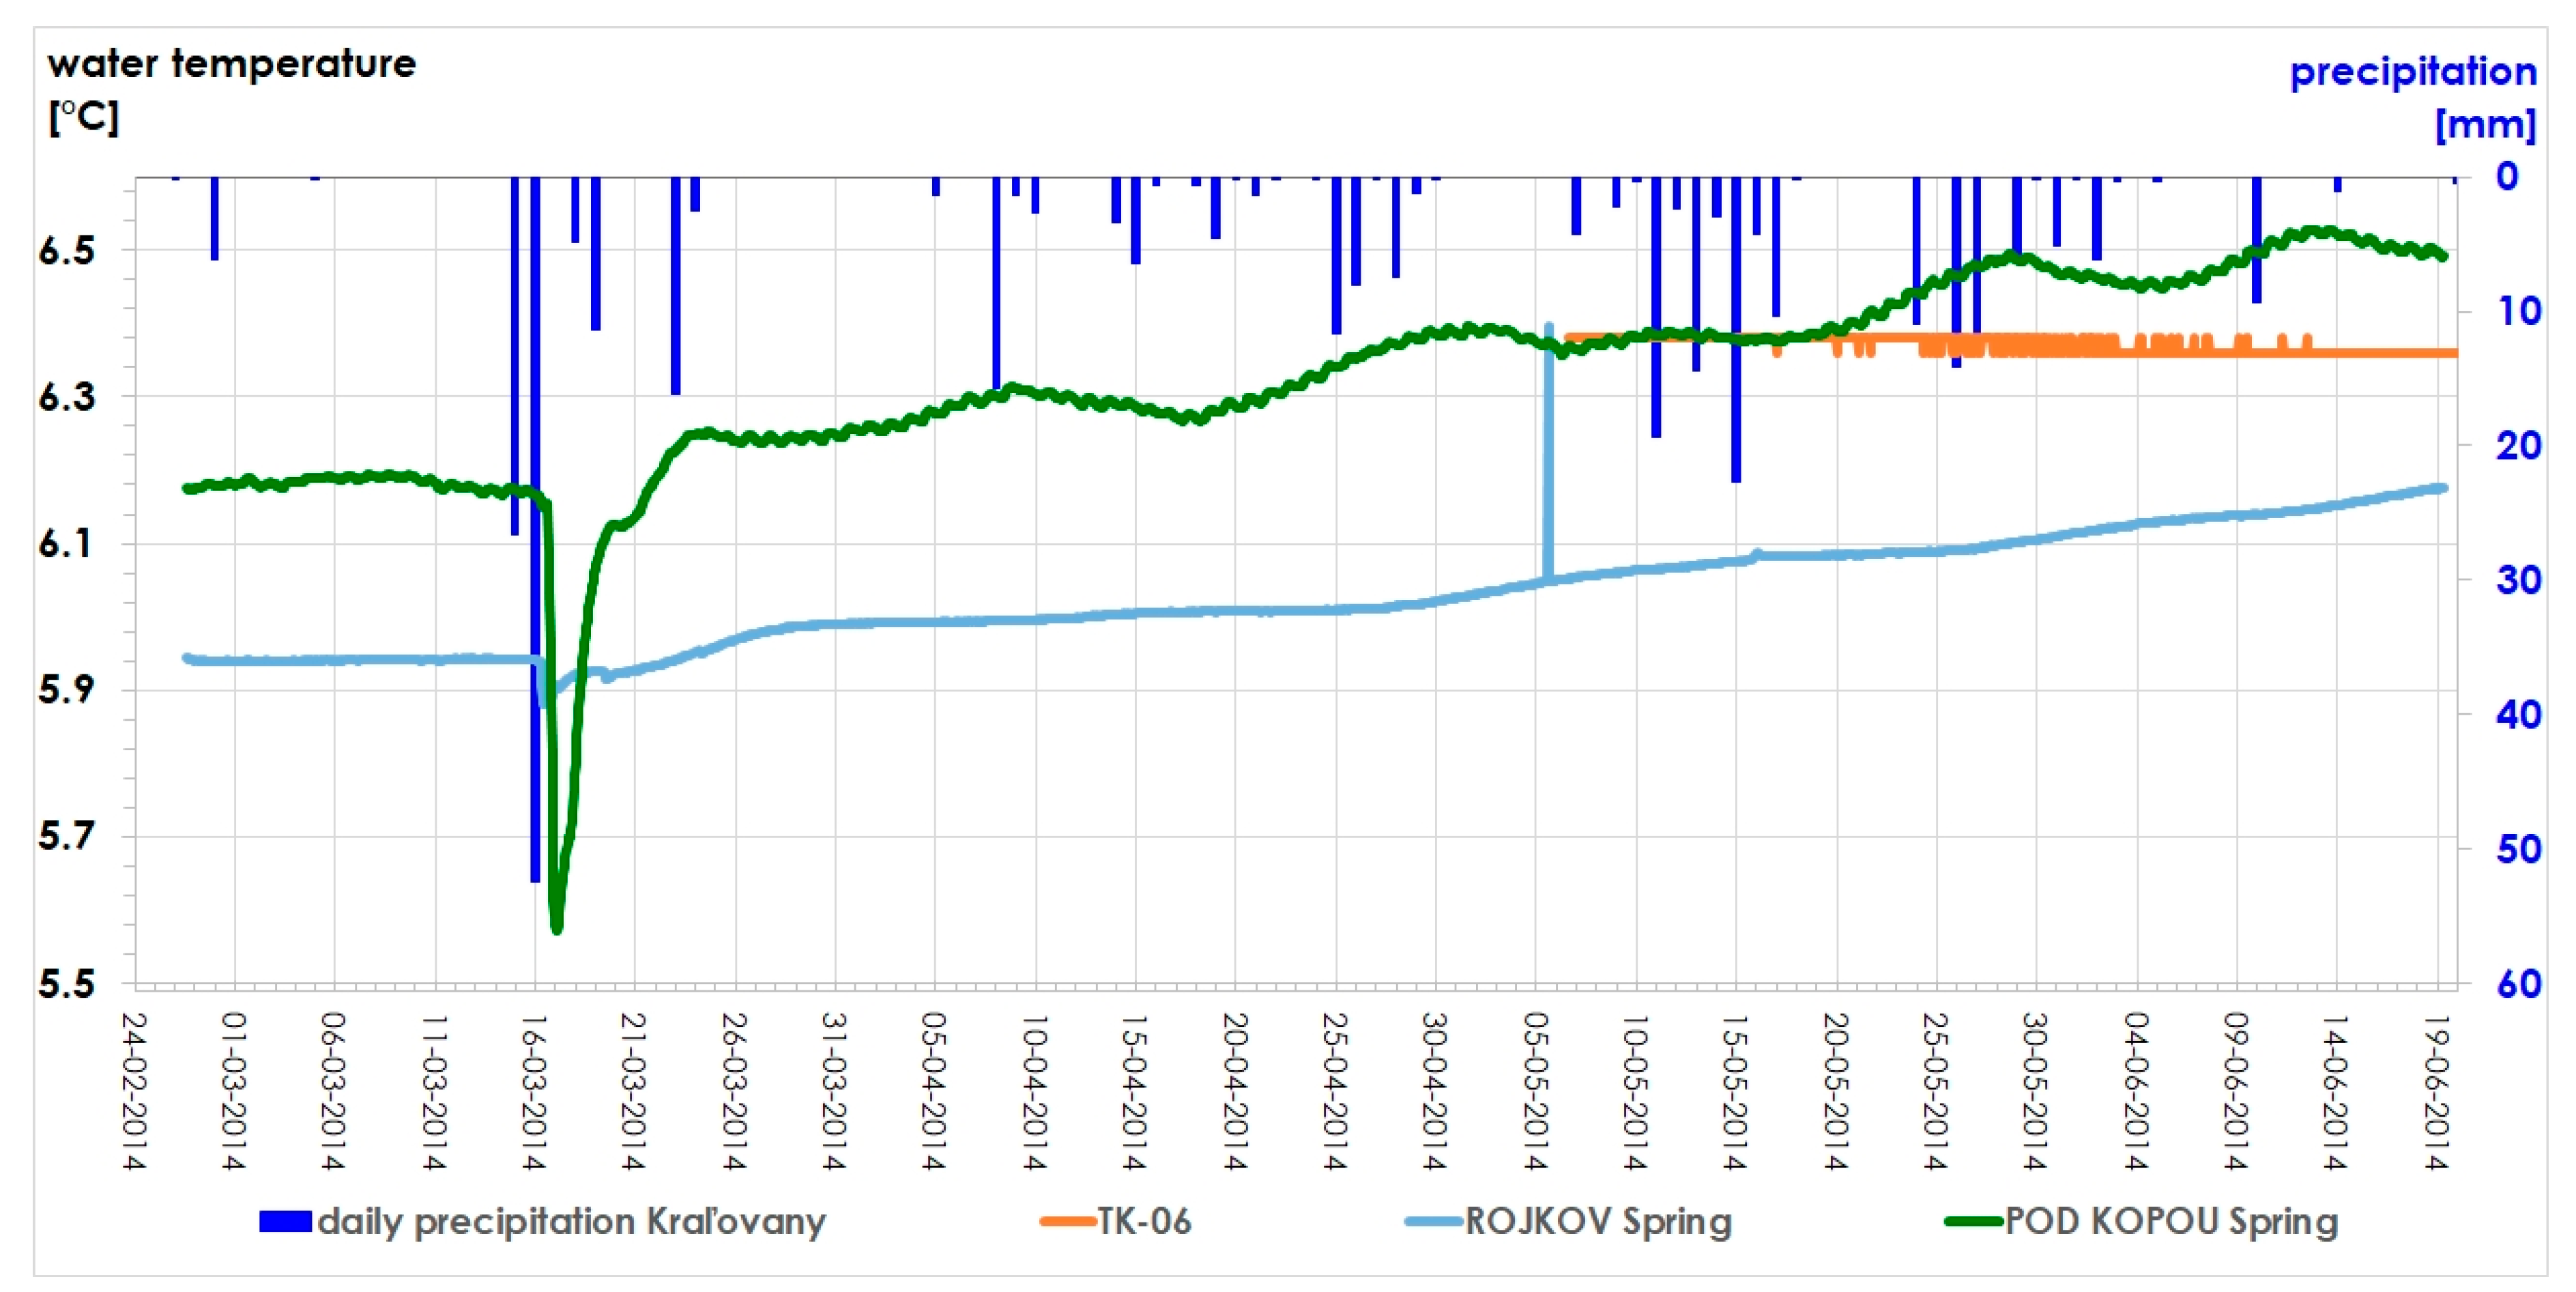
The 15.03.2014–16.03.2014 recharge impulse was immediately recorded in the Pod Kopou Spring by a 0.58 °C temperature drop from 6.16 °C to 5.57 °C that followed the rain event only in a couple of hours (minimum recorded on 17.03.2014 at 01:00). This is clearly visible in Figure 9, together with a less visible, but still recoded 0.05 °C drop at the Rojkov Spring. In the same figure, being in the same temperature interval, temperature records of the TK-06 borehole are shown—quite stable and taken only since 06.05.2014.
The groundwater table level in TK-04 borehole was quickly moved up practically within one step, from 20.03.2014 19:00 to 21.03.2014 04:00, but any impact on groundwater temperature was recorded as documented in Figure 10. Water temperature in the Fatra Spring, shown in the same graph, reacts similarly to Rojkov Spring, but only in 0.01 °C temperature lowering for a period of two hours (16.03.2014 readings at 22:00 and 23:00).
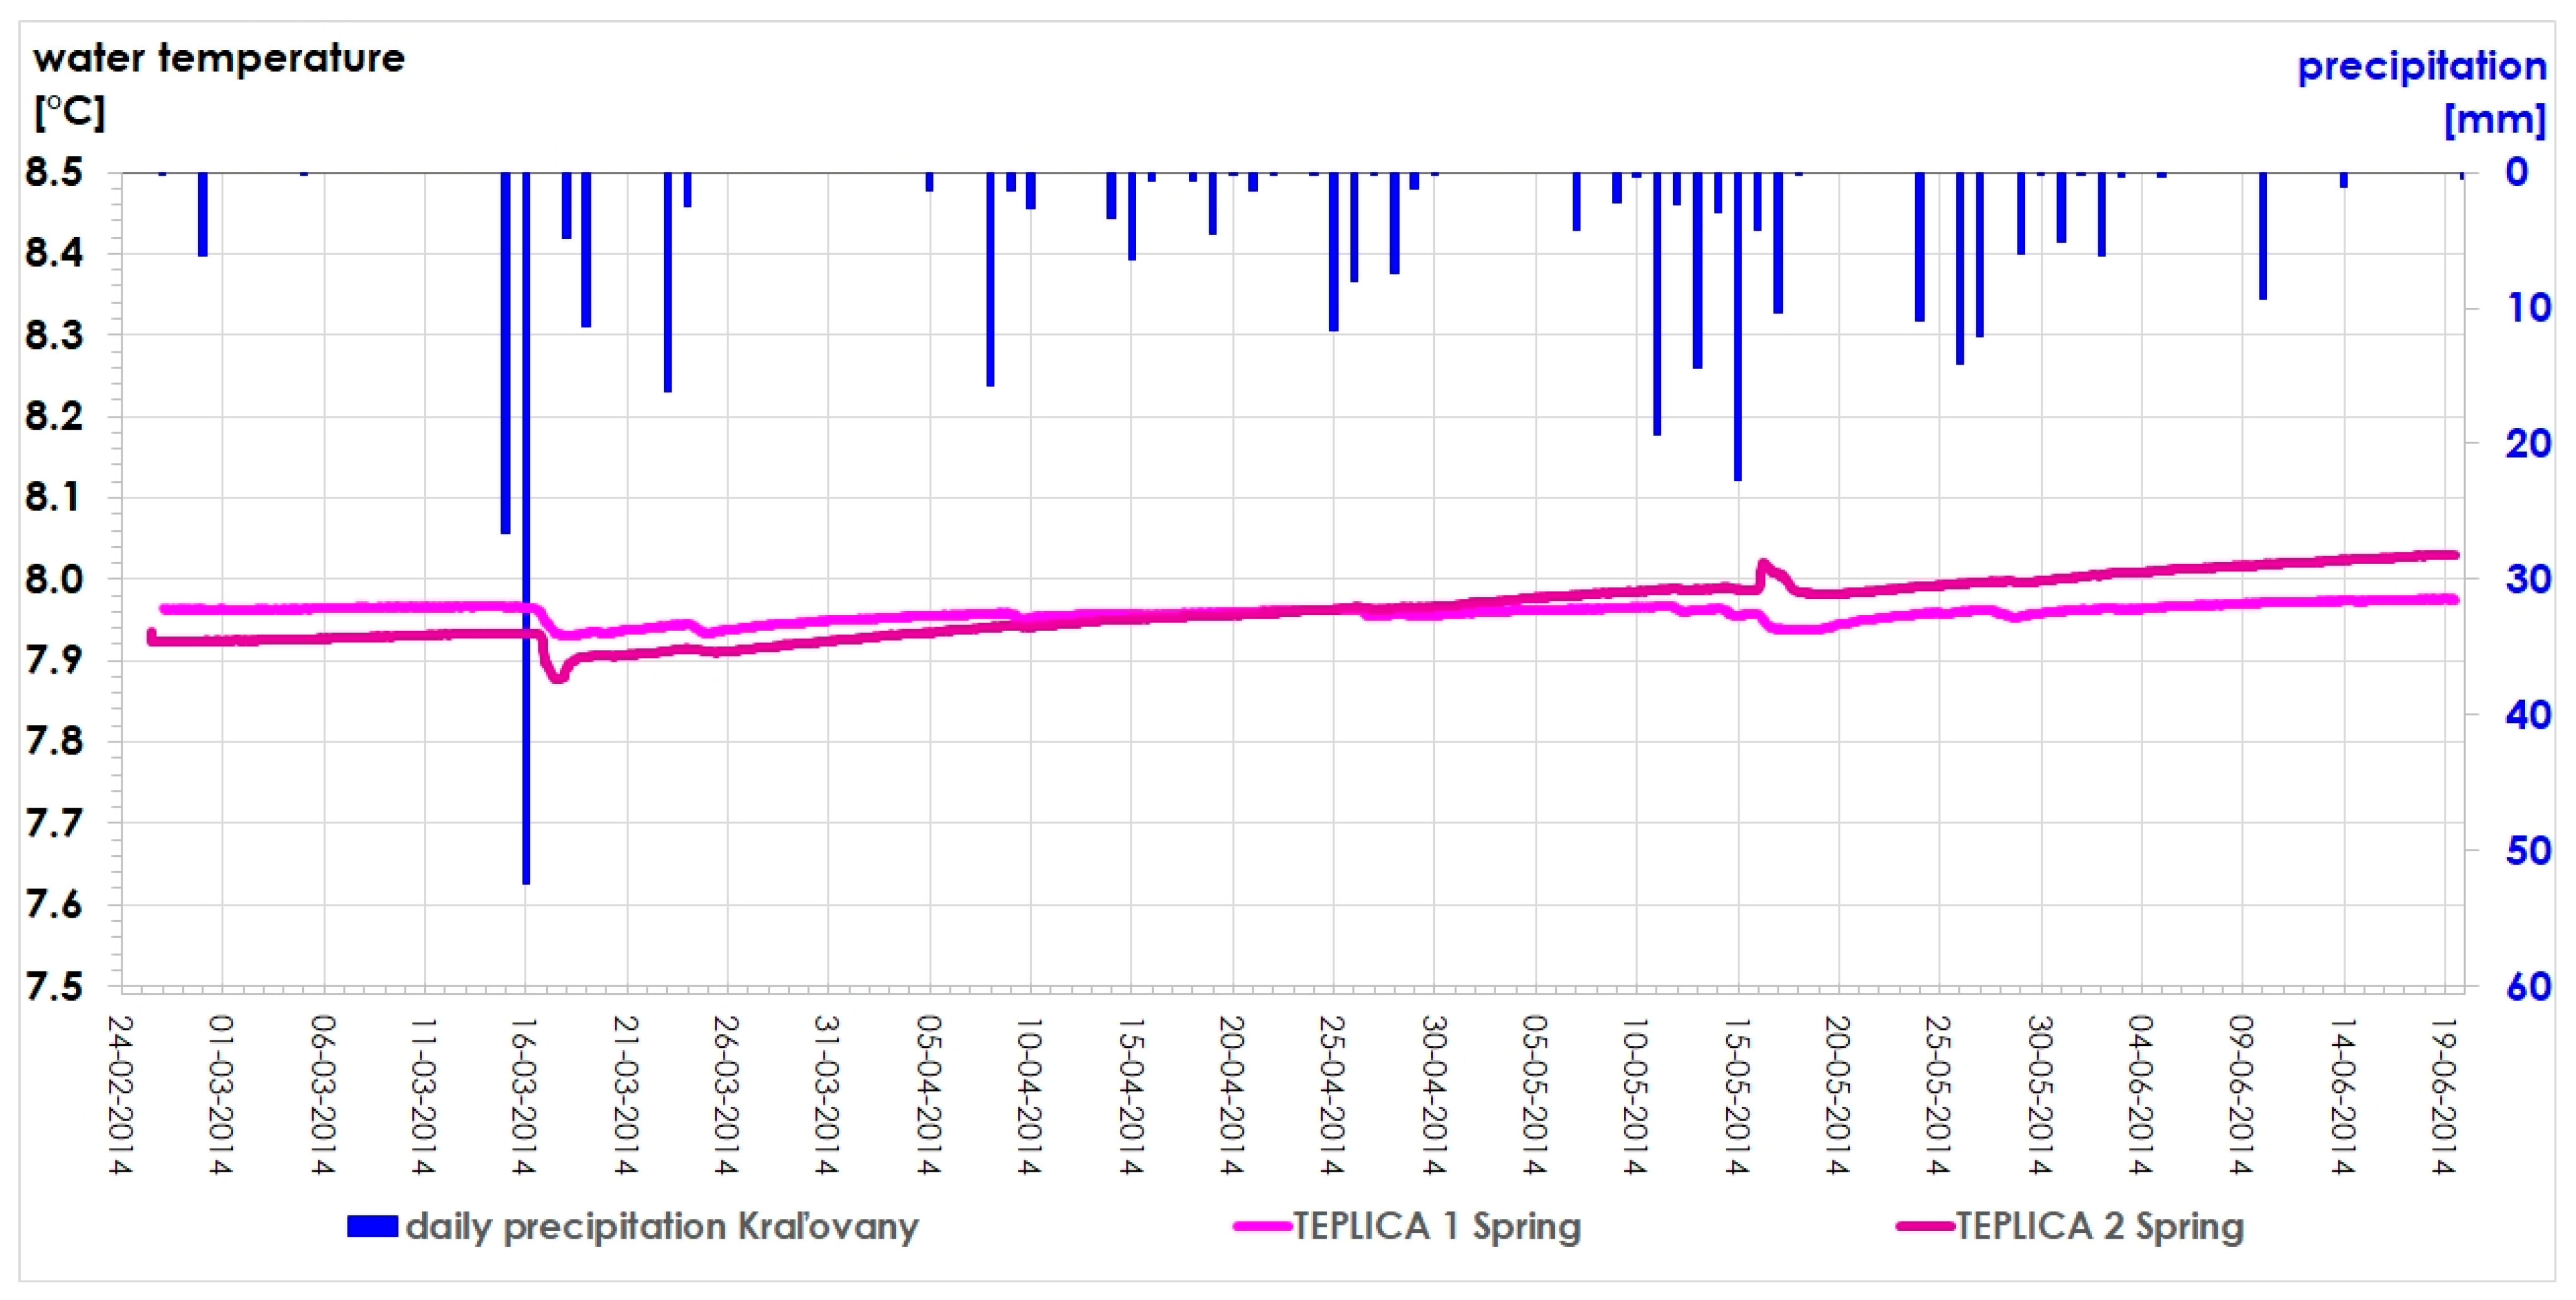
Relatively highest groundwater temperatures were systematically (and also symptomatically, as the term “teplica” means “warm spring” in Slovak) recorded in Teplica 1 and Teplica 2 Springs (see Table 6), but temperature lowering by recharge impulse was registered as well (Figure 11). In the case of Teplica 1, this drop was from 7.97 °C to 7.93 °C, and in Teplica 2 Spring from 7.93 °C to 7.88 °C, reached on 17.03.2014 at 11:00 and 17.03.2014 at 06:00, respectively. Contrary to the sudden drop, temperature recovery lasted for 17 and 14 days, respectively, in Teplica 1 and Teplica 2 groundwater. Another feature from Figure 11 that happened on 16.05.2014, and approximately lasting one day, was a sudden rise of Teplica 1 water temperature in max. 0.03 °C (7.99 °C to 8.02 °C) accompanied by parallel temperature lowering in Teplica 2 spring (from 7.96 °C to 7.94 °C); this remains unexplained. Evidence of similar features in temperature behavior in other groundwater sources is missing, as well as evidence of possible human interaction in these monitored objects.
Another interesting feature is the positive trend in groundwater temperature time series that was recorded in all five springs (from +0.014 °C from 26.02.2014 to 19.06.2014 in Teplica 1 Spring to +0.460 °C for the same period in Pod Kopou Spring), while slight temperature lowering was observed in the case of the boreholes (−0.018 °C in TK-04 and –0.065 °C in TK-06). It should be concluded here, that basic groundwater temperature differences between individual monitored points remain practically in the same level within the relatively wide (2.56 °C) span, in an interval between 5.57 °C and 8.03 °C (Figure 8).
4. Discussion
A precipitation event of 78.9 mm that happened from 15.03.2014–16.03.2014 was in the period of limited evapotranspiration (hydrological balance report in [11] and created an important singular recharge hydraulical impulse that was not followed by a similar event for a couple of weeks. The response of monitored spring discharges and groundwater levels to such a major recharge impulse is under the scope of view of this research. It was easier to follow it in the case of TK-04 borehole (Figure 6) than in the case of springs. Groundwater levels in the TK-06 borehole were observed only since 06.05.2014, and since that time until the end of springs’ observations on 20.06.2014, these followed a trend of general decrease of about 0.20 m for the whole period. As aforementioned, a sudden rise of groundwater table of 0.40 m was recorded on 21.03.2014 at 20:00 (Figure 6 and Figure 7). Discharge measurements at springs, mostly affected by strong water level fluctuation in the retaining chamber where the data loggers were placed, should be therefore smoothed by floating averages of 24 readings before being analyzed for discharge peak arrivals. Another tool used in this process was the calculation of the springs’ relative discharges Qrel using Equation (1).
where
- Qrel—relative discharge [%]
- Qt—measured discharge [L∙s−1]
- Qmax—maximal discharge in the evaluated dataset [L∙s−1]
- Qmin—minimal discharge in the evaluated dataset [L∙s−1]
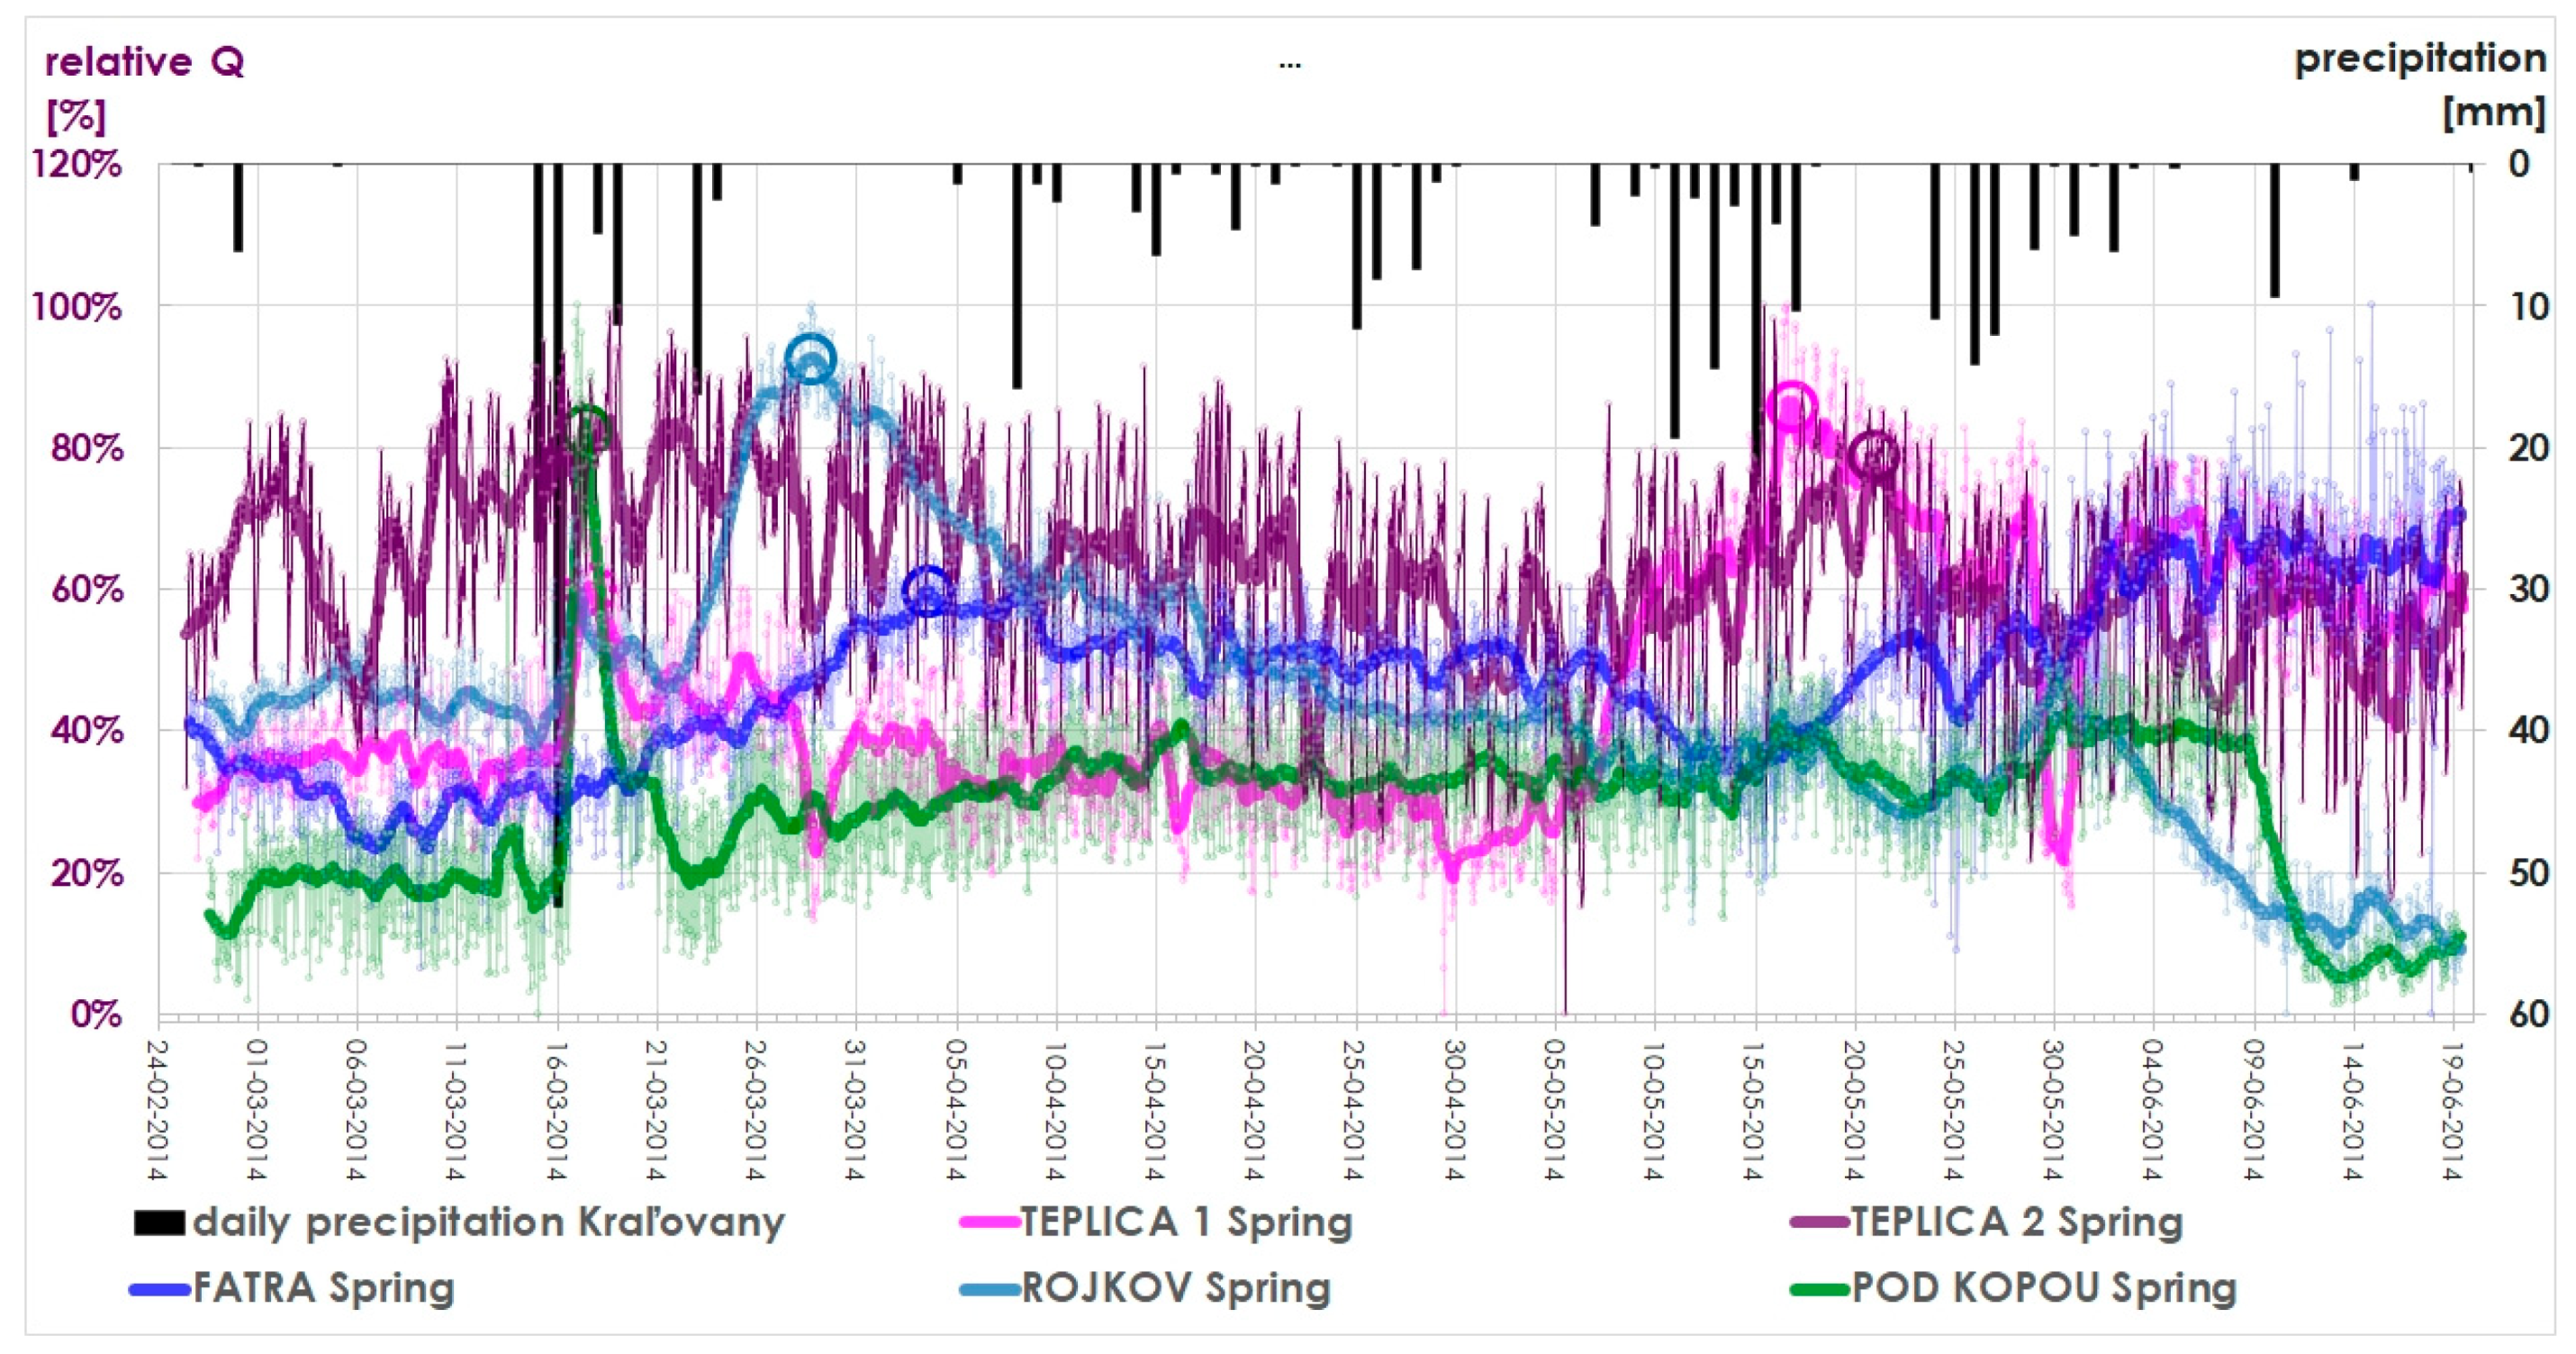
Relative discharges Qrel expressed in percent values of the discharge range in the selected time interval enable comparison of springs with highly different ranges of discharge values. In the same moment one should keep in mind that the Qrel value tends to supress highly variable manifestations of discharges, even of several orders of magnitude in some karstic springs, and enhances small changes in discharges in the case of springs with stable discharge behavior. Use of Qrel effect on the discharge plot appearance is evident in comparison of Figure 7 and Figure 12. In Figure 12, floating averages of 24 values are also applied for smoothing of individual relative discharge datasets. Dates and time shifts of discharge peaks arrivals after the 15.03.2014–16.03.2014 recharge event in individual springs are listed in Table 7.
Propagation of hydraulic impulse within an aquifer is governed by its hydraulic diffusivity D, a parameter specified by the ratio of transmissivity coefficient T and specific yield (storativity) S values. Spreading of the sudden rise of piezometric levels on a border condition can be described [18,19] by inverse complementary Gauss error function erfc (λ), as shown in Equations (2) and (3).
where
- ΔHx—piezometric level change in the x point as a response to level change at the boundary [m]
- ΔH0—piezometric level change at the boundary [m]
- erfc(λ)—inverse complementary Gauss error function [–]
- x—distance to the boundary condition [m]
- D—hydraulic diffusivity [m2∙s−1]
- t—time elapsed from the sudden change on the boundary condition [s]
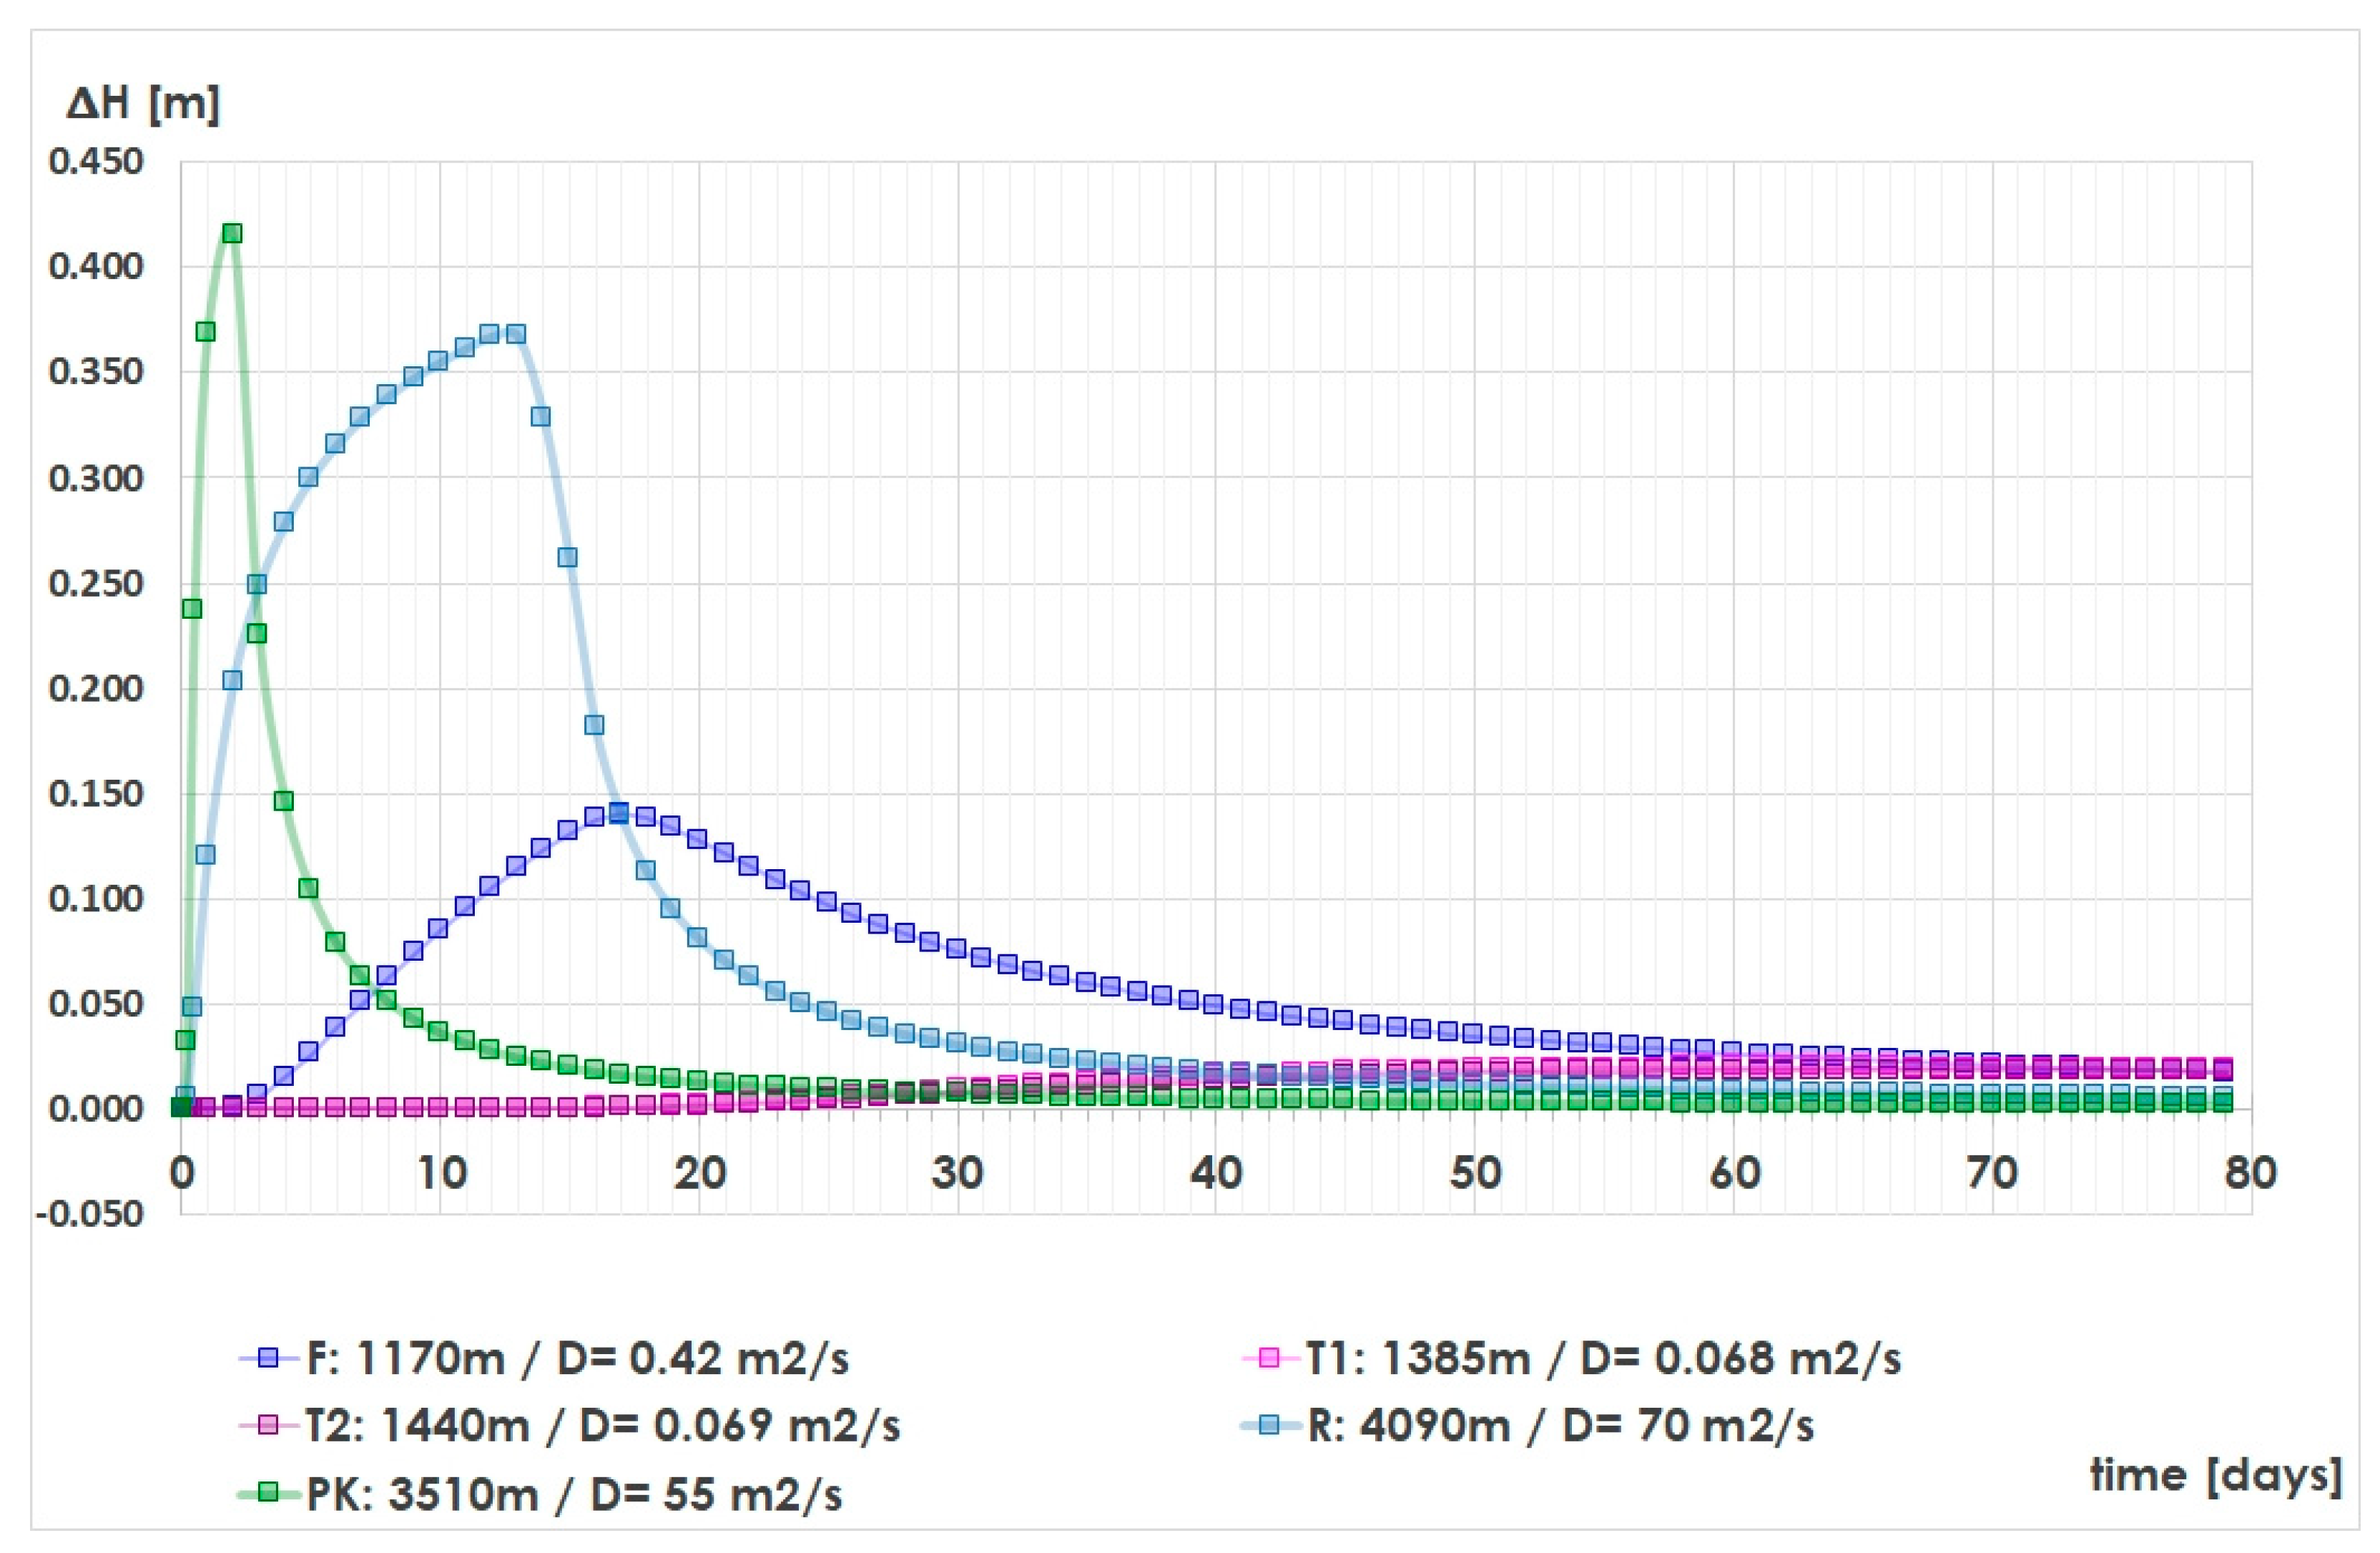
From Equation (3) it is clear that apart of hydraulic diffusivity, response to change in piezometric level is also a function of distance and time. Spreading of recharge impulse in a mountainous karstic aquifer is of course a more complex problem to be solved by such a simple approach as shown in Equations (2) and (3). However, with only a little information on groundwater level (in one point within the aquifer), a simple simulation of arrival times of discharge peaks in different springs was performed. Hydraulic impulse was simulated as a superposition of two erfc (λ) functions, one calculating the sudden 0.5 m level rise and the other the sudden 0.5 m drop in the point of TK-04 borehole. Distances x to individual springs are listed in Table 7, values of hydraulic diffusivity were gradually modified to reach the arrival of maximal piezometric head corresponding to peak arrival time shift in Table 7. Results of this simple simulation are shown in Figure 13.
Discharge peak arrival times in individual springs of the Kopa Mt. karstic aquifer (Figure 13) for spreading of hydraulic impulse of 0.5 m level rise from the TK-04 borehole can be simulated by the use of hydraulic diffusivities ranging from 0.068 to 70 m2∙s−1. It should be clear that approximations used in this comparison are too rough: First of all, there is no boundary condition at the edge of the aquifer and secondly, rise of piezometric head should be (somehow) distributed over the whole aquifer surface. Simulation that was performed therefore can serve as a source of approximate information in the case of necessary data missing. The most useful information that can be taken from these results is the three orders of magnitude difference in D values, while the difference in distance x, even for other points than the TK-04 borehole, is and should be within one order of magnitude. Especially peak arrival time shift to the Teplica 1 and Teplica 2 Springs should have its reason in either the less permeable part of the aquifer or much higher hydraulic distance from the source of recharge impulses. As these springs are the biggest groundwater sources in the area, the second possibility should be more probable.
Comparison of discharge culminations time shifts in individual monitored springs and mean groundwater temperature at the same sources, as shown in Figure 14, may provide an answer. The mean annual temperature at the surface of outcropping karstic aquifer is supposed to be 5.8 °C, taking into account the regional altitudinal air temperature gradient of −0.5 °C/100 m. Another (regional geothermal) temperature gradient of approximately +2.5 °C/100 m should also be taken into account in groundwater circulation studies. If the water in Teplica 1 and Teplica 2 Springs is approximately 2 °C warmer than in the most hydraulically responding Rojkov and Pod Kopou Springs, it probably should have deeper circulation, and thus, longer hydraulical distances from the recharge impulses appearing on the groundwater table surface. According to Equations (2) and (3), the arrival of a hydraulic impulse depends on both the distance and hydraulic diffusivity. Propagation of the same impulse with 3.5 times longer time for relatively the same distance in the case of Teplica 1 and 2 Springs, compared to the Fatra Spring should then require correspondingly lower diffusivity values or the assumed hydraulic distance is not so similar in reality. The vertical component of groundwater movement, if present, can prolong the hydraulic distance and also reduce values of hydraulic diffusivity as the vertical permeability component is usually much smaller than the horizontal one. Water temperatures of springs indicated vertical groundwater movement especially for Teplica 1 and Teplica 2 Springs (see Figure 14). Possible presence of longer hydraulic distances and lowered hydraulic diffusivity in their groundwater circulation patterns is therefore consistent with the observed results.
Vertical component of groundwater flux should therefore not be omitted even in simple plate-shaped karstic mountainous aquifer like the Kopa Mt. hydrogeological structure. Results presented in this study were incorporated into a 3D transient hydraulical model aimed on dewatering the planned highway tunnel [11] but were never used for regional groundwater circulation pattern considerations.
5. Conclusions
A precipitation total of 78.9 mm that was registered during 15.03.2014–16.03.2014 in Kraľovany station on the edge of the karstic aquifer of the Kopa Mt. (1187 m a.s.l.) hydrogeological structure appeared during a period lacking snow cover, and for the next 55 days was not followed by similar meteorological event. This intensive rainfall can be considered a source of strong singular recharge hydraulic impulse, influencing karstic groundwater circulation in the whole area.
In the same period, detailed observation of groundwater temperatures and discharges in hourly intervals were performed for several months as a part of engineering, geological, and hydrogeological investigations prior to highway tunnel construction. Five springs, already exploited as drinking groundwater sources were included: Fatra Spring, Rojkov Spring, Pod Kopou group of springs, Teplica 1 and Teplica 2 Springs. Within the framework of the same investigations, 230 m and 370 m deep TK-04 and TK-06 boreholes were drilled into the Middle Triassic dolomites and limestones of the same aquifer, and water level and temperature observations were introduced here, but for TK-06 only since May 2014.
Using the recorded data, spreading of the recharge impulse could be followed in springs’ discharges, groundwater temperatures, and levels with quite different time shifts. Spring discharges were from 1.38 to 65.25 days, and groundwater level rise of 0.40 m in the TK-04 borehole was postponed by 5.33 days.
Groundwater temperatures recorded across the Kopa Mt. karstic aquifer were in an interval between 5.57 °C and 8.03 °C, but were relatively stable in all monitoring points. Influence of the March 2014 precipitation event on groundwater temperature was visible, especially on springs with the lowest temperatures (Fatra and Rojkov Springs), but a small temperature drop immediately following the rainfall event was measurable in all springs, but not in the TK-04 borehole.
Spreading of recharge impulse within the aquifer is governed by aquifer hydraulic properties— namely the hydraulic diffusivity D, a parameter specified by the ratio of transmissivity coefficient T, and specific yield (storativity) S values. Simple simulations using superposition of two inverse complementary Gauss error functions erfc (λ) for spreading of hydraulic level rise impulse showed probable differences of D values in three orders of magnitude. Late arrival time of recharge impulse impact can be also explained by longer hydraulic distances, where a vertical groundwater circulation component should be considered. Deeper groundwater flow then influences not only the longer response time to recharge events, but also upraised groundwater temperature as in the case of Teplica 1 and Teplica 2 Springs, which was about 2 °C warmer than in the most hydraulically responding Rojkov and Pod Kopou Springs.
It should be concluded that also a relatively simple, plate-shaped mountainous karstic aquifer appearing above an erosional base, with supposed downward groundwater fluxes towards spring points on its edges, can have an important vertical component of groundwater flux, as was shown in the case of the Kopa Mt. hydrogeological structure in the Western Carpathian Mts. of Slovakia.
Author Contributions
Conceptualization, P.M. and M.C.; methodology, P.M.; investigation, M.C.; validation, M.C. and M.K. formal analysis, J.Š.; investigation, M.C.; resources, M.K. data curation, J.Š.; writing—original draft preparation, P.M.; writing—review and editing, P.M. and J.Š.; visualization, J.Š.; supervision, P.M.; project administration, M.K. funding acquisition, M.K.
Funding
The results of this study could be obtained thanks to the project support of European Union cohesion funds operational programme Research and Development, namely the project Integrated system of outflow processes simulation (ISSOP; ITMS code 26220220066), co-financed from the European fund of regional development, what is gratefully acknowledged by the authors.
Conflicts of Interest
The authors declare no conflicts of interest.
References
- Drew, D.; Hötzl, H. Karts Hydrogeology and Human Activities: Impacts, Consequences and Implications. International Contributions to Hydrogeology 20; A.A. Balkema: Rotterdam, The Netherlands, 1999; 322p. [Google Scholar]
- Bakalowicz, M. Karst groundwater: A challenge for new resources. Hydrogeol. J. 2005, 13, 148–160. [Google Scholar] [CrossRef]
- Goldscheider, N.; Drew, D. Methods in Karst Hydrogeology; International Contribution to Hydrogeology 26; Taylor and Francis: London, UK, 2007; 264p. [Google Scholar]
- Kresic, N.; Stevanović, Z. Groundwater Hydrology of Springs: Engineering, Theory, Management and Sustainability; Elsevier: Burlington, NJ, USA, 2010; 573p. [Google Scholar]
- Fiorillo, F. Spring hydrographs as indicators of droughts in a karst environment. J. Hydrol. 2009, 373, 290–301. [Google Scholar] [CrossRef]
- Fiorillo, F.; Revellino, P.; Ventafridda, G. Karst aquifer draining during dry periods. J. Cave Karst Stud. 2012, 74, 148–156. [Google Scholar] [CrossRef]
- Zwahlen, F. (Ed.) Vulnerability and Risk Mapping for the Protection of Carbonate (Karst) Aquifers; COST Action 620 Final Report; Office for Official Publications of the European Communities: Luxembourg, 2004; 297p. [Google Scholar]
- Stevanović, Z. (Ed.) Karst Aquifers: Characterization and Engineering; Professional Practice in Earth Sciences; Springer: Heidelberg, Germany, 2015; 687p. [Google Scholar]
- Milanovic, P.T. Karst Hydrogeology; Water Resources Publications: Littleton, CO, USA, 1981; 434p. [Google Scholar]
- Ford, D.C.; Williams, P. Karst Geomorphology and Hydrology; Wiley: Chichester, UK, 2007; 562p. [Google Scholar]
- Kuvik, M.; Grenčíková, A.; Bohyník, J.; Gažúr, J.; Sinak, M.; Stolárik, L.; Coplák, M.; Copláková, J.; Holeša, Š.; Kubiš, M.; et al. Diaľnica D1 Turany—Hubová, modifikovaný údolný variant V1 a subvariant V1a a variant V2 s tunelom Korbeľka, orientačný IGP; Manuscript—Geofond archive of ŠGÚDŠ Bratislava, No. 93904; CAD-ECO Bratislava: Bratislava, Slovakia, 2014; 136p. [Google Scholar]
- Polák, M.; Bujnovský, A.; Kohút, M.; Filo, I.; Pristaš, J.; Havrila, M.; Vozár, J.; Mello, J.; Rakús, M.; Buček, S.; et al. Geologická mapa Veľkej Fatry 1:50 000; map sheet; MŽP SR—GS SR Bratislava: Bratislava, Slovakia, 1997.
- Polák, M.; Bujnovský, A.; Kohút, M.; Pristaš, J.; Filo, I.; Havrila, M.; Vozárová, A.; Vozár, J.; Kováč, P.; Lexa, J.; et al. Vysvetlivky ku geologickej mape Veľkej Fatry v mierke 1:50 000; Vydavateľstvo Dionýza Štúra: Bratislava, Slovakia, 1997; 204p. [Google Scholar]
- Bella, P.; Hlaváčová, I.; Holúbek, P. (Eds.) Zoznam jaskýň Slovenskej republiky [Slovak Caves Register; in Slovak]. Slovenské múzeum ochrany prírody a jaskyniarstva, Správa slovenských jaskýň; Slovenská speleologická spoločnosť: Liptovský Mikuláš, Slovakia, 2007; 364p. [Google Scholar]
- Švasta, J.; Malík, P. Priestorové rozloženie priemerných efektívnych zrážok na území Slovenska. Podzemná voda XII/2006 č. 1; Slovenská asociácia hydrogeológov: Bratislava, Slovakia, 2006; pp. 65–77. [Google Scholar]
- Malík, P.; Kordík, J.; Bottlik, F.; Kováčová, E.; Polák, M. Vysvetlivky k základnej hydrogeologickej a hydrogeochemickej mape západnej časti Veľkej Fatry v mierke 1:50 000; Štátny geologický ústav Dionýza Štúra: Bratislava, Slovakia, 2014; 341p, ISBN 978-80-89343-94-2. [Google Scholar]
- Švasta, J.; Malík, P. Vzťah podzemných a povrchových vôd v oblasti hydrogeologickej štruktúry karbonátov hronika Kopy vo Veľkej Fatre. Podzemná voda XIV, 2/2008; Slovenská asociácia hydrogeológov: Bratislava, Slovakia, 2008; pp. 151–160. [Google Scholar]
- Mucha, I.; Šestakov, V. Hydraulika podzemných vôd; Alfa, SNTL: Bratislava, Slovakia, 1986; 342p. [Google Scholar]
- Bear, J. Hydraulics of Groundwater. Dover Books on Engineering; Dover Publications: New York, NY, USA, 2007; 592p. [Google Scholar]
Figure 1.
Karstic aquifer of the Kopa Mt. (49.137192° N, 19.138167° E) hydrogeological structure, NW part of the Veľká Fatra Mts., West Carpathians, Central Slovakia—topographical map, planned tunnel route, and monitored objects.
Figure 1.
Karstic aquifer of the Kopa Mt. (49.137192° N, 19.138167° E) hydrogeological structure, NW part of the Veľká Fatra Mts., West Carpathians, Central Slovakia—topographical map, planned tunnel route, and monitored objects.

Figure 2.
Aquifer of the Kopa Mt. hydrogeological structure in a simplified geological map.

Figure 3.
Simplified hydrogeological cross-section of the Kopa Mt. hydrogeological structure.

Figure 4.
Water sources of Fatra Spring near Ľubochňa municipality (a) and Pod Kopou Spring near Kraľovany (b). Technical details of the capture method.
Figure 4.
Water sources of Fatra Spring near Ľubochňa municipality (a) and Pod Kopou Spring near Kraľovany (b). Technical details of the capture method.

Figure 5.
Daily air temperatures on Ružomberok station and daily precipitation totals at Kraľovany station in the period between 24.02.2014 and 20.06.2014. Continuous red line is marking zero temperature at Ružomberok station, dashed red line signifies the temperature shift of the freezing point at the mean altitude of the Kopa Mt. karstic aquifer.

Figure 6.
Groundwater levels in TK-04 and TK-06 boreholes and daily precipitation totals at the SHMI 24020 station Kraľovany in the period of 24.02.2014–20.06.2014.
Figure 6.
Groundwater levels in TK-04 and TK-06 boreholes and daily precipitation totals at the SHMI 24020 station Kraľovany in the period of 24.02.2014–20.06.2014.

Figure 7.
Groundwater levels in TK-04 and TK-06 boreholes and discharges of the Kopa Mt. aquifer karstic springs in the period 24.02.2014–20.06.2014.
Figure 7.
Groundwater levels in TK-04 and TK-06 boreholes and discharges of the Kopa Mt. aquifer karstic springs in the period 24.02.2014–20.06.2014.

Figure 8.
Groundwater temperatures in TK-04 and TK-06 boreholes and springs of the Kopa Mt. aquifer karstic springs in the period 24.02.2014–20.06.2014, together with daily precipitation totals at the SHMI 24020 station Kraľovany in the same period.
Figure 8.
Groundwater temperatures in TK-04 and TK-06 boreholes and springs of the Kopa Mt. aquifer karstic springs in the period 24.02.2014–20.06.2014, together with daily precipitation totals at the SHMI 24020 station Kraľovany in the same period.

Figure 9.
Daily precipitation in Kraľovany and groundwater temperatures in the Rojkov and Pod Kopou Springs and the TK-06 borehole with visible influence of 15.03.2014–16.03.2014 precipitation event of water temperature in springs.
Figure 9.
Daily precipitation in Kraľovany and groundwater temperatures in the Rojkov and Pod Kopou Springs and the TK-06 borehole with visible influence of 15.03.2014–16.03.2014 precipitation event of water temperature in springs.

Figure 10.
Daily precipitation in Kraľovany and groundwater temperatures in the Fatra Spring and TK-04 borehole—very limited impact of 15.03.2014–16.03.2014 precipitation event.
Figure 10.
Daily precipitation in Kraľovany and groundwater temperatures in the Fatra Spring and TK-04 borehole—very limited impact of 15.03.2014–16.03.2014 precipitation event.

Figure 11.
Daily precipitation in Kraľovany and groundwater temperatures in the Teplica 1 and Teplica 2 Springs—impact of 15.03.2014–16.03.2014 precipitation event more visible in the case of Teplica 2 Spring.
Figure 11.
Daily precipitation in Kraľovany and groundwater temperatures in the Teplica 1 and Teplica 2 Springs—impact of 15.03.2014–16.03.2014 precipitation event more visible in the case of Teplica 2 Spring.

Figure 12.
Daily precipitation in Kraľovany and relative discharges of the Kopa Mt. aquifer karstic springs in the period 24.02.2014–20.06.2014. Simple moving average of 24 values is used to smooth out short-term fluctuations caused by turbulent water level in springs’ chambers. Culminating points after the 15.03.2014–16.03.2014 precipitation event are marked by circles. Note: for Teplica 1, two culminating points are marked as discussed in the text.

Figure 13.
Simulation of groundwater level culmination in various distances from the boundary condition with 10 days lasting water level rise of 0.5 m by superposition of two Gauss error functions. Time shifts of discharge culminations in individual springs were simulated taking into account their distance from the TK-04 borehole.

Figure 14.
Mean groundwater temperature vs. time shifts of discharge culminations in individual monitored springs of the Kopa Mt. karstic aquifer. The first number under the name of spring indicates groundwater temperature and the lower number marks peak arrival time shift in days.
Figure 14.
Mean groundwater temperature vs. time shifts of discharge culminations in individual monitored springs of the Kopa Mt. karstic aquifer. The first number under the name of spring indicates groundwater temperature and the lower number marks peak arrival time shift in days.


Table 1.
Gauged karstic springs of the Kopa Mt. hydrogeological structure and period of discharge hourly gauging.
Table 1.
Gauged karstic springs of the Kopa Mt. hydrogeological structure and period of discharge hourly gauging.
| Spring Name | Longitude [°E] | Latitude [°N] | Altitude [m a.s.l.] | Starting Date | End Date |
|---|---|---|---|---|---|
| Fatra | 19.131191 | 49.110930 | 568.75 | 25.02.2014 | 19.06.2014 |
| Teplica 1 | 19.103361 | 49.124837 | 449.96 | 26.02.2014 | 19.06.2014 |
| Teplica 2 | 19.102679 | 49.125027 | 445.87 | 25.02.2014 | 19.06.2014 |
| Rojkov | 19.156138 | 49.145005 | 515.14 | 26.02.2014 | 19.06.2014 |
| Pod Kopou | 19.145301 | 49.143916 | 593.23 | 26.02.2014 | 19.06.2014 |
Table 2.
Characteristics of TK-04 and TK-06 boreholes in the Kopa Mt. hydrogeological structure.
| Borehole/Characteristic | TK-04 | TK-06 |
|---|---|---|
| Longitude [°E] | 19.118790 | 19.132923 |
| Latitude [°N] | 49.117576 | 49.125552 |
| Altitude [m a.s.l.] | 568.75 | 773.10 |
| Borehole depth [m] | 230.0 | 370.0 |
| Average depth to groundwater table [m] | 180.88 | 299.69 |
| Schematized borehole log | 0.0–3.5 m Quaternary debris 3.5–33.0 m carbonatic breccias, sandstone, and conglomerates of Paleogene 33.0–230.0 m brecciated dolomites, Middle Triassic | 0.0–8.2 m eluvial Quaternary debris 8.2–46.5 m dolomites of Upper Triassic “hauptdolomites” 46.5–73.5 m Wetterstein limestones, Middle Triassic 73.5–100.5 Reifling limestones and dolomites, Middle Triassic 100.5–169.9 m Ramsau dolomites, Middle Triassic 169.9–173.7 m Gutenstein limestones, Middle Triassic (173–175.0 open cavity) 173.7–370.0 m dolomites, mostly brecciated, Middle Triassic |
| Starting date of observations | 05.03.2014 | 06.05.2014 |
| Observations end date | 10.11.2017 | 08.11.2017 |
Table 3.
Mean annual and monthly values of precipitation totals and mean air temperatures at precipitation stations Kraľovany and Ľubochňa, and climatic station Ružomberok for the period of 1981–2018.
Table 3.
Mean annual and monthly values of precipitation totals and mean air temperatures at precipitation stations Kraľovany and Ľubochňa, and climatic station Ružomberok for the period of 1981–2018.
| Period | Kraľovany Station —Precipitation [mm] | Ľubochňa Station —Precipitation [mm] | Ružomberok Station—Air Temperatures [°C] |
|---|---|---|---|
| January | 85.6 | 68.6 | –2.5 |
| February | 65.1 | 48.5 | –1.0 |
| March | 73.4 | 60.0 | 2.6 |
| April | 56.8 | 52.8 | 7.8 |
| May | 90.2 | 95.3 | 13.1 |
| June | 92.2 | 97.5 | 16.1 |
| July | 106.2 | 107.7 | 17.5 |
| August | 83.4 | 82.7 | 16.3 |
| September | 82.8 | 78.3 | 12.0 |
| October | 75.4 | 67.4 | 7.7 |
| November | 83.9 | 64.6 | 3.1 |
| December | 87.2 | 63.8 | –1.0 |
| YEAR | 982.3 | 887.1 | 8.2 |
Table 4.
Observed monthly precipitation totals and air temperatures in the period of July 2013–June 2014 at stations Kraľovany, Ľubochňa, and Ružomberok compared to the mean values of the 1981–2018 period.
Table 4.
Observed monthly precipitation totals and air temperatures in the period of July 2013–June 2014 at stations Kraľovany, Ľubochňa, and Ružomberok compared to the mean values of the 1981–2018 period.
| Period | Preci-Pitation Kraľovany Station [mm] | Comparison to Long-Term Data | Preci-Pitation Ľubochňa Station [mm] | Comparison to Long-Term Data | Air Temperatures Ružomberok Station [°C] | Comparison to Long-Term Data [°C] |
|---|---|---|---|---|---|---|
| July 2013 | 5.3 | 5% | 2.4 | 2% | 18.2 | 0.8 |
| August 2013 | 89.9 | 108% | 58.0 | 70% | 18.1 | 1.8 |
| September 2013 | 133.6 | 161% | 118.5 | 151% | 11.2 | –0.8 |
| October 2013 | 34.8 | 46% | 40.8 | 61% | 9.6 | 1.9 |
| November 2013 | 91.6 | 109% | 82.7 | 128% | 4.0 | 0.9 |
| December 2013 | 40.8 | 47% | 31.4 | 49% | 0.1 | 1.2 |
| January 2014 | 40.3 | 47% | 30.7 | 45% | 1.0 | 3.4 |
| February 2014 | 50.0 | 77% | 37.8 | 78% | 2.8 | 3.8 |
| March 2014 | 114.2 | 156% | 80.8 | 135% | 5.7 | 3.2 |
| April 2014 | 67.5 | 119% | 69.6 | 132% | 9.1 | 1.3 |
| May 2014 | 131.8 | 146% | 193.7 | 203% | 12.3 | –0.8 |
| June 2014 | 76.7 | 83% | 81.6 | 84% | 15.0 | –1.1 |
| July 2013–June 2014 | 876.5 | 89% | 828.0 | 93% | 8.9 | 0.7 |
Table 5.
Brief descriptive statistics of groundwater level and temperature measurements in the TK-04 and TK-06 boreholes.
Table 5.
Brief descriptive statistics of groundwater level and temperature measurements in the TK-04 and TK-06 boreholes.
| Characteristic | Borehole | Minimum | Maximum | Median | Average | Range | Standard Deviation |
|---|---|---|---|---|---|---|---|
| groundwater level [m a.s.l.] | TK-04 | 473.15 | 473.87 | 473.41 | 473.45 | 0.72 | 0.21 |
| TK-06 | 473.18 | 473.65 | 473.42 | 473.41 | 0.47 | 0.09 | |
| depth to groundwater [m] | TK-04 | 180.46 | 181.18 | 180.92 | 180.88 | 0.72 | 0.21 |
| TK-06 | 299.45 | 299.92 | 299.68 | 299.69 | 0.47 | 0.09 | |
| groundwater temperature [°C] | TK-04 | 7.43 | 7.46 | 7.44 | 7.44 | 0.03 | 0.01 |
| TK-06 | 6.36 | 6.38 | 6.36 | 6.37 | 0.02 | 0.01 |
Table 6.
Brief statistics of discharge and water temperature gauging results in karstic springs of the Kopa Mt. karstic aquifer.
Table 6.
Brief statistics of discharge and water temperature gauging results in karstic springs of the Kopa Mt. karstic aquifer.
| Spring Name | Minimum | Maximum | Median | Average | Range | Standard Deviation |
|---|---|---|---|---|---|---|
| Discharge [L∙s−1] | ||||||
| Fatra | 4.94 | 19.36 | 11.89 | 11.80 | 14.43 | 1.87 |
| Teplica 1 | 14.50 | 28.98 | 20.58 | 21.15 | 14.48 | 2.52 |
| Teplica 2 | 5.80 | 10.79 | 8.99 | 8.92 | 4.99 | 0.78 |
| Rojkov | 1.66 | 5.43 | 3.29 | 3.34 | 3.77 | 0.70 |
| Pod Kopou | 6.33 | 14.79 | 8.87 | 8.82 | 8.46 | 1.07 |
| Groundwater temperature [°C] | ||||||
| Fatra | 7.18 | 7.34 | 7.23 | 7.23 | 0.16 | 0.02 |
| Teplica 1 | 7.93 | 7.98 | 7.96 | 7.96 | 0.05 | 0.01 |
| Teplica 2 | 7.88 | 8.03 | 7.96 | 7.96 | 0.15 | 0.04 |
| Rojkov | 5.88 | 6.40 | 6.01 | 6.03 | 0.52 | 0.07 |
| Pod Kopou | 5.57 | 6.53 | 6.33 | 6.32 | 0.96 | 0.14 |
Table 7.
Discharge/groundwater level peak arrivals after the 15.03.2014–16.03.2014 recharge event in monitored objects in the Kopa Mt. hydrogeological structure and selected parameters of groundwater circulation.
Table 7.
Discharge/groundwater level peak arrivals after the 15.03.2014–16.03.2014 recharge event in monitored objects in the Kopa Mt. hydrogeological structure and selected parameters of groundwater circulation.
| Monitored Object | Peak Arrival Date | Peak Arrival Time Shift [days] | Distance to TK-04 Borehole [m] | Mean Groundwater Temperature [°C] | Groundwater Level Altitude [m a.s.l.] | Qmax/Qmin |
|---|---|---|---|---|---|---|
| Fatra Spring | 03.04.2014 06:00 | 17.75 | 1169 | 7.23 | 568.75 | 3.921 |
| Teplica 1 Spring | 16.05.2014 15:00 | 61.13 | 1386 | 7.96 | 449.96 | 1.999 |
| Teplica 2 Spring | 20.05.2014 18:00 | 65.25 | 1439 | 7.96 | 445.87 | 1.861 |
| Rojkov Spring | 28.03.2014 18:00 | 12.25 | 4090 | 6.03 | 515.14 | 3.268 |
| Pod Kopou Spring | 17.03.2014 21:00 | 1.38 | 3510 | 6.32 | 593.23 | 2.337 |
| TK-04 borehole | 21.03.2014 20:00 | 5.33 | – | 7.44 | 473.45 | – |
| TK-06 borehole | – | – | 1360 | 6.37 | 473.41 | – |
© 2019 by the authors. Licensee MDPI, Basel, Switzerland. This article is an open access article distributed under the terms and conditions of the Creative Commons Attribution (CC BY) license (http://creativecommons.org/licenses/by/4.0/).
Share and Cite
MDPI and ACS Style
Malík, P.; Coplák, M.; Kuvik, M.; Švasta, J. Recharge Impulse Spreading in Western Carpathian’s Mountainous Fissure–Karst Aquifer. Water 2019, 11, 763. https://doi.org/10.3390/w11040763
AMA Style
Malík P, Coplák M, Kuvik M, Švasta J. Recharge Impulse Spreading in Western Carpathian’s Mountainous Fissure–Karst Aquifer. Water. 2019; 11(4):763. https://doi.org/10.3390/w11040763
Chicago/Turabian StyleMalík, Peter, Marián Coplák, Marián Kuvik, and Jaromír Švasta. 2019. "Recharge Impulse Spreading in Western Carpathian’s Mountainous Fissure–Karst Aquifer" Water 11, no. 4: 763. https://doi.org/10.3390/w11040763
Note that from the first issue of 2016, this journal uses article numbers instead of page numbers. See further details here.