Groundwater Quality Assessment in a Volcanic Mountain Range (South of Gran Canaria Island, Spain)
by
 , , , and
A. Ruiz-García
1,* ,
,
M.D. Carrascosa-Chisvert
2, 
V. Mena
2,
R.M. Souto
3 ,
,
J.J. Santana
2 and
I. Nuez
4 1
Department of Mechanical Engineering, University of Las Palmas de Gran Canaria, 35017 Las Palmas de Gran Canaria, Gran Canaria, Spain
2
Department of Process Engineering, University of Las Palmas de Gran Canaria, 35017 Las Palmas de Gran Canaria, Gran Canaria, Spain
3
Department of Chemistry, University of La Laguna, P.O. Box 456, 38200 La Laguna, Tenerife, Spain
4
Department of Electronic and Automatic Engineering, University of Las Palmas de Gran Canaria, 35017 Las Palmas de Gran Canaria, Spain
*
Author to whom correspondence should be addressed.
Water 2019, 11(4), 754; https://doi.org/10.3390/w11040754
Submission received: 24 January 2019
/
Revised: 2 April 2019
/
Accepted: 9 April 2019
/
Published: 11 April 2019
(This article belongs to the Special Issue Environmental Chemistry of Water Quality Monitoring)
Abstract
:The lack of rainfall in the Canary Islands′ Archipelago is leading to the depletion of the existing aquifers throughout the islands, above all in the easternmost isles (Gran Canaria, Lanzarote and Fuerteventura). Due to the increasing water demand in the southern area of the Island of Gran Canaria, appropriate planning has become necessary in order to avoid the depletion of the phreatic water resources that can be found there. One of the most affected areas is the Amurga Mountain Range, where the existing aquifers are depleted, as shown in the Hydrological Plan of Gran Canaria. The aim of this study was to characterize the hydrochemistry of the above-mentioned groundwater bodies. Water quality monitoring was carried out over a period of five years, involving the survey of a total of 288 samples (over 4300 tests). The water from those aquifers has the characteristic of being fairly mineralized, with a prevalence of Cl−, Ca2+ and Na+ ions, salinity levels reaching 8646 mg/L, and chloride levels up to 4200 mg/L. The waters of these aquifers can be divided into two basic types, i.e., those containing high levels of sodium chloride, which can be found around the Tirajana Gorge; and the waters rich in magnesium chloride and sodium sulfate in the Arguineguín Gorge, as well as in the Amurga Massif itself.
1. Introduction
Groundwater plays an important role in arid and semi-arid regions as the Canary Islands. There are two main factors that affect groundwater use, the quantity and the quality (hydrochemistry). The variation of the abovementioned factors depends (among other things) on the overexploitation [1,2], saltwater intrusion [3,4,5] and climate [6,7,8,9]. When water treatment is required, hydrochemistry is key in the performance of technologies such as reverse osmosis [10].
As a result of the huge economic and population changes experienced by the Canary Islands during the last three decades of the 20th Century, mainly in relation to the development of tourism, the use of underground water resources has been intensified [11,12,13]. This phenomenon has been aggravated in the southern area of the Island of Gran Canaria, where considerable activities related to tourism and intensive cultivation are taking place, which has led to a major increase in water demand in the area. The search for new water resources has met positive results when carrying out drill tests in the phonolitic mountain range of Amurga (south of Gran Canaria). Gran Canaria Island maintains a resident population of 845,195 inhabitants according to the advance results of the 2016 census [14], which amounts to 40.2% of the total population of the archipelago, with an average population density of 552 inhabitants/km2, despite a fluctuating population of 4 million tourists per annum.
The Canary Islands are made up of seven main volcanic islands, which are situated in an oceanic environment, in the NW sector of the African Continental Shelf. The Canary Islands′ Archipelago lies 115 km off the West Coast of Africa, at a latitude ranging between 27° and 30° North, and a longitude between 13° and 17° West. It consists of seven main islands (Tenerife, Fuerteventura, Gran Canaria, Lanzarote, La Palma, La Gomera and El Hierro) and 11 small islands and reefs, covering a total area of approximately 7520 km2. With an area of 1532 km2 Gran Canaria is the third largest island in the archipelago, and features the highest peak, the Pico de las Nieves, which rises at 1949 m above sea level (a.s.l.) in its central area. Each island is an independent volcanic structure (with the exception of Fuerteventura and Lanzarote), lying on the seabed at a depth of some 3000 m. All the islands are on the oceanic crust.
The archipelago′s magmatic history is quite long-drawn-out throughout times, with the first underwater volcanic manifestations starting some 35 million years ago. Since then various geological processes have taken place, involving those phenomena resulting from underwater volcanism and those from sedimentation, in different environments [11,15]. The formation period of the part of the island above sea level stretches from the Upper Miocene almost up to the present time. During those 14 million years, there has been a succession of various igneous occurrences alternating with erosive periods. The formations presenting a hydrogeological interest that constitute the area under review are characterized by a high silica content (≈60%) and a clear predominance of alkalies (Na, K) [16,17].
The bedrock is very dense, and it is obvious that the water only circulates through cracks associated with phonolites. Water may accumulate in the areas of rock not properly jointed and maybe in the breach areas between lava flows. These waters rich in Na, Cl and Ca, are not unique to the Canary Islands, and have also been found in other countries. In the scientific literature there are numerous studies of underground water resources with conductivity rates ranging from natural to brackish waters from the Americas [18], Finland [19], Israel [20], Saudi Arabia [21,22], Kuwait [23], Italy [24], China [25], Pakistan [26], Nepal and India [27], etc.
One of the main climatic characteristics of the Island of Gran Canaria, and more specifically in the south of the island, is the shortage of rainfall [28,29]. The rain discharge is scarce on the islands, characterized by the occurrence of sporadic torrential rains that do not succeed in percolating sufficiently into the ground. The average rainfall values for the island are nearly always below 350 mm/annum, always dropping below 200 mm/annum in the area under consideration [30], with temperatures ranging between 15 and 20 °C in the winter and between 20 and 32 °C in the summer [17]. In addition, the volcanic background of Gran Canaria, similarly to that of the rest of the archipelago, plays a part in increasing the complexity of the problems encountered in obtaining and storing water.
The main water sources for supply and irrigation in Gran Canaria are the groundwater sources and seawater. The seawater has to be desalinated before using due to high ions concentration and the groundwater sometimes has to be desalinated depending on the purpose (drinking, irrigation). Desalinating groundwater (brackish water) is more efficient than seawater due to osmotic pressure. The efficiency of the mentioned process depends, among other things, on the composition of the feedwater [31]. This is why the evolution of the hydrochemistry of groundwater bodies is a relevant issue in Gran Canaria.
2. Materials and Methods
2.1. Study Area
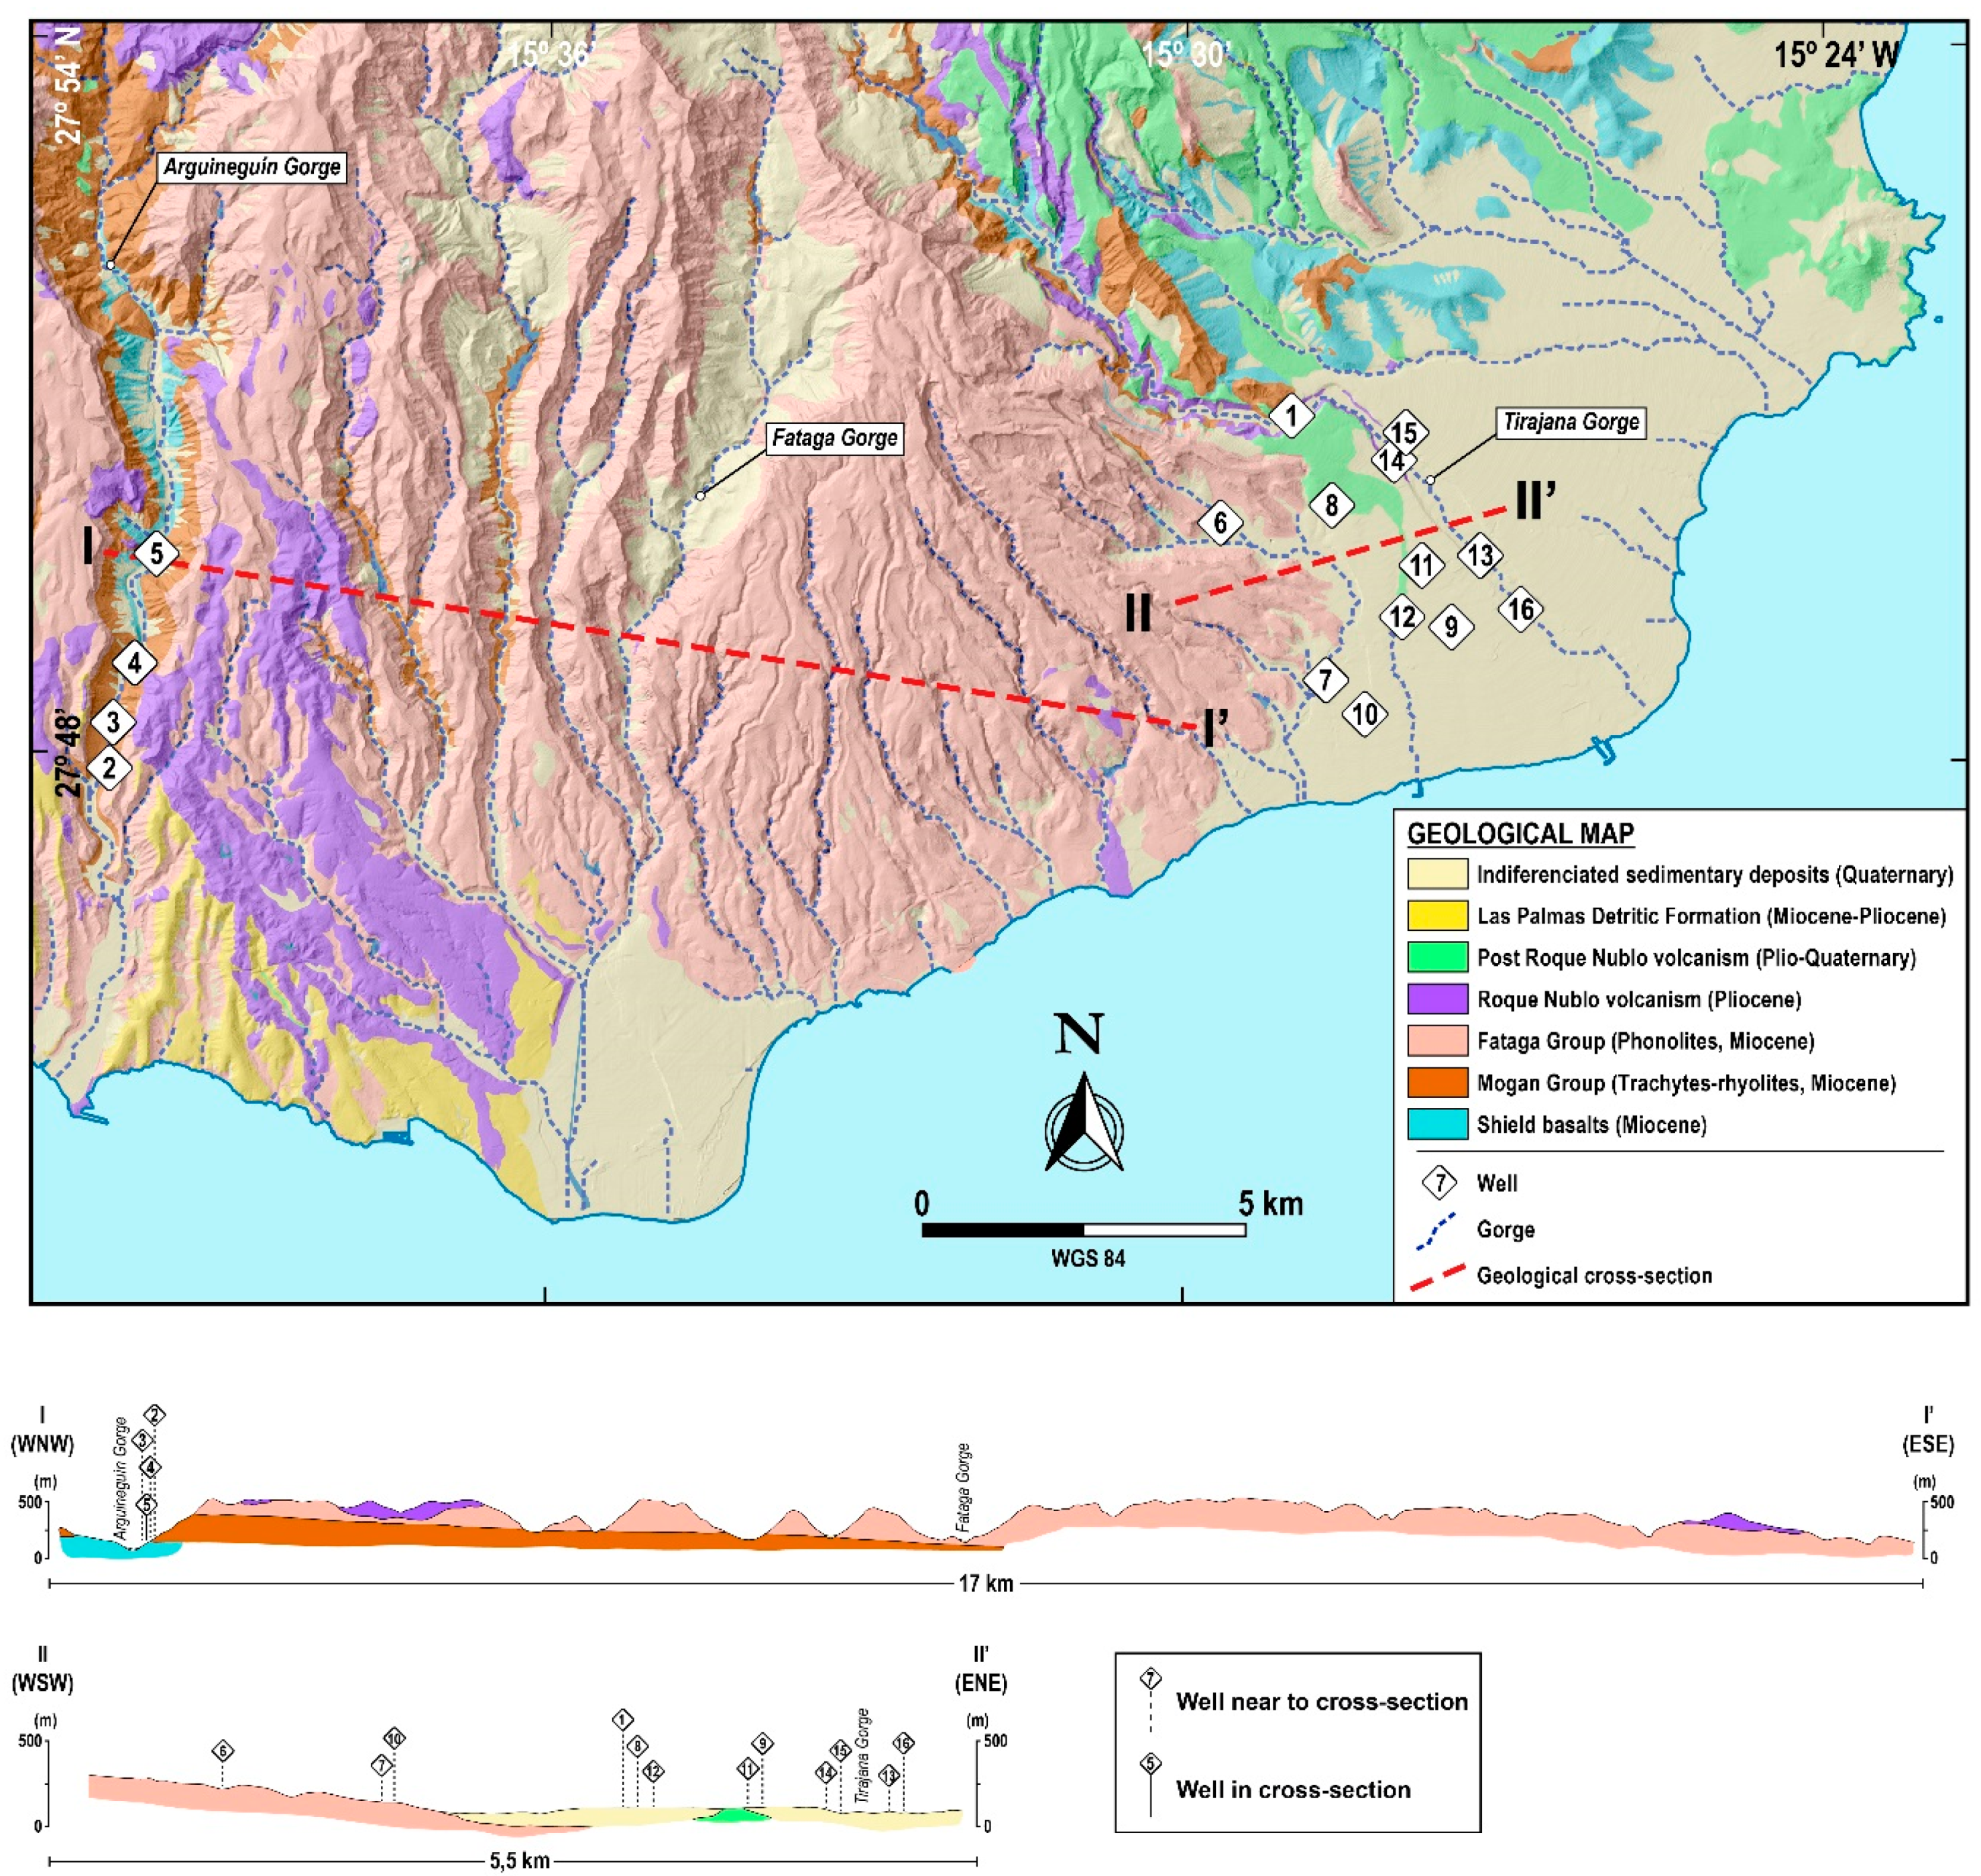
The issue of the scarcity of rainfall has led us to typify the water extracted from 16 drained wells located in the Amurga Mountain Range (Figure 1). It is a large and circular region reaching 1191 m a.s.l. at its summit, which slopes down towards the coast with an average incline of 8.6%. It is bordered by two of the major gorges of southern Gran Canaria: in the West, by the Arguineguín Gorge and in the East, by the Tirajana Gorge.
One of the first surveys carried out in the Amurga Range was a study of its pluviometry and the quality of its waters [32,33]. The chemical data in this study is scarce and there is also data on wells that do not belong to the area we are studying. Other studies, which took place between 1990 and 1993, are reports offering an interpretation of the pumping tests that were carried out during the boring tests and of the chemical tests that were performed [34]. Later, [35] carried out a study aimed at dating the underground water resources in the south of the island, reaching the conclusion that there are different water types, all characterized by a high level of salinity. The temperature of the water in the wells is relatively high [36]. In the Amurga Massif itself, it usually ranges between 30 and 32 °C, and in the less elevated areas of the low section of the Tirajana Gorge, from 20 to 25 °C. This can be explained through the geothermal gradient [37]. In the lower area of the Tirajana Gorge, where wells are shallower, the lower temperature would be compatible with a higher replenishment. In the mid area of the Tirajana Gorge, the temperatures are high, from 32 to 35 °C, due to the higher depth of the wells and possibly to the scarcity of water circulation [32,38]. Isotopic studies on water samples from the wells in the south of Gran Canaria, carried out by [32], have shown that these waters have a tendency to evaporate. It also demonstrates (through tritium- and carbon-14 dating) that the water resources in this area are 10,000 years old at least.
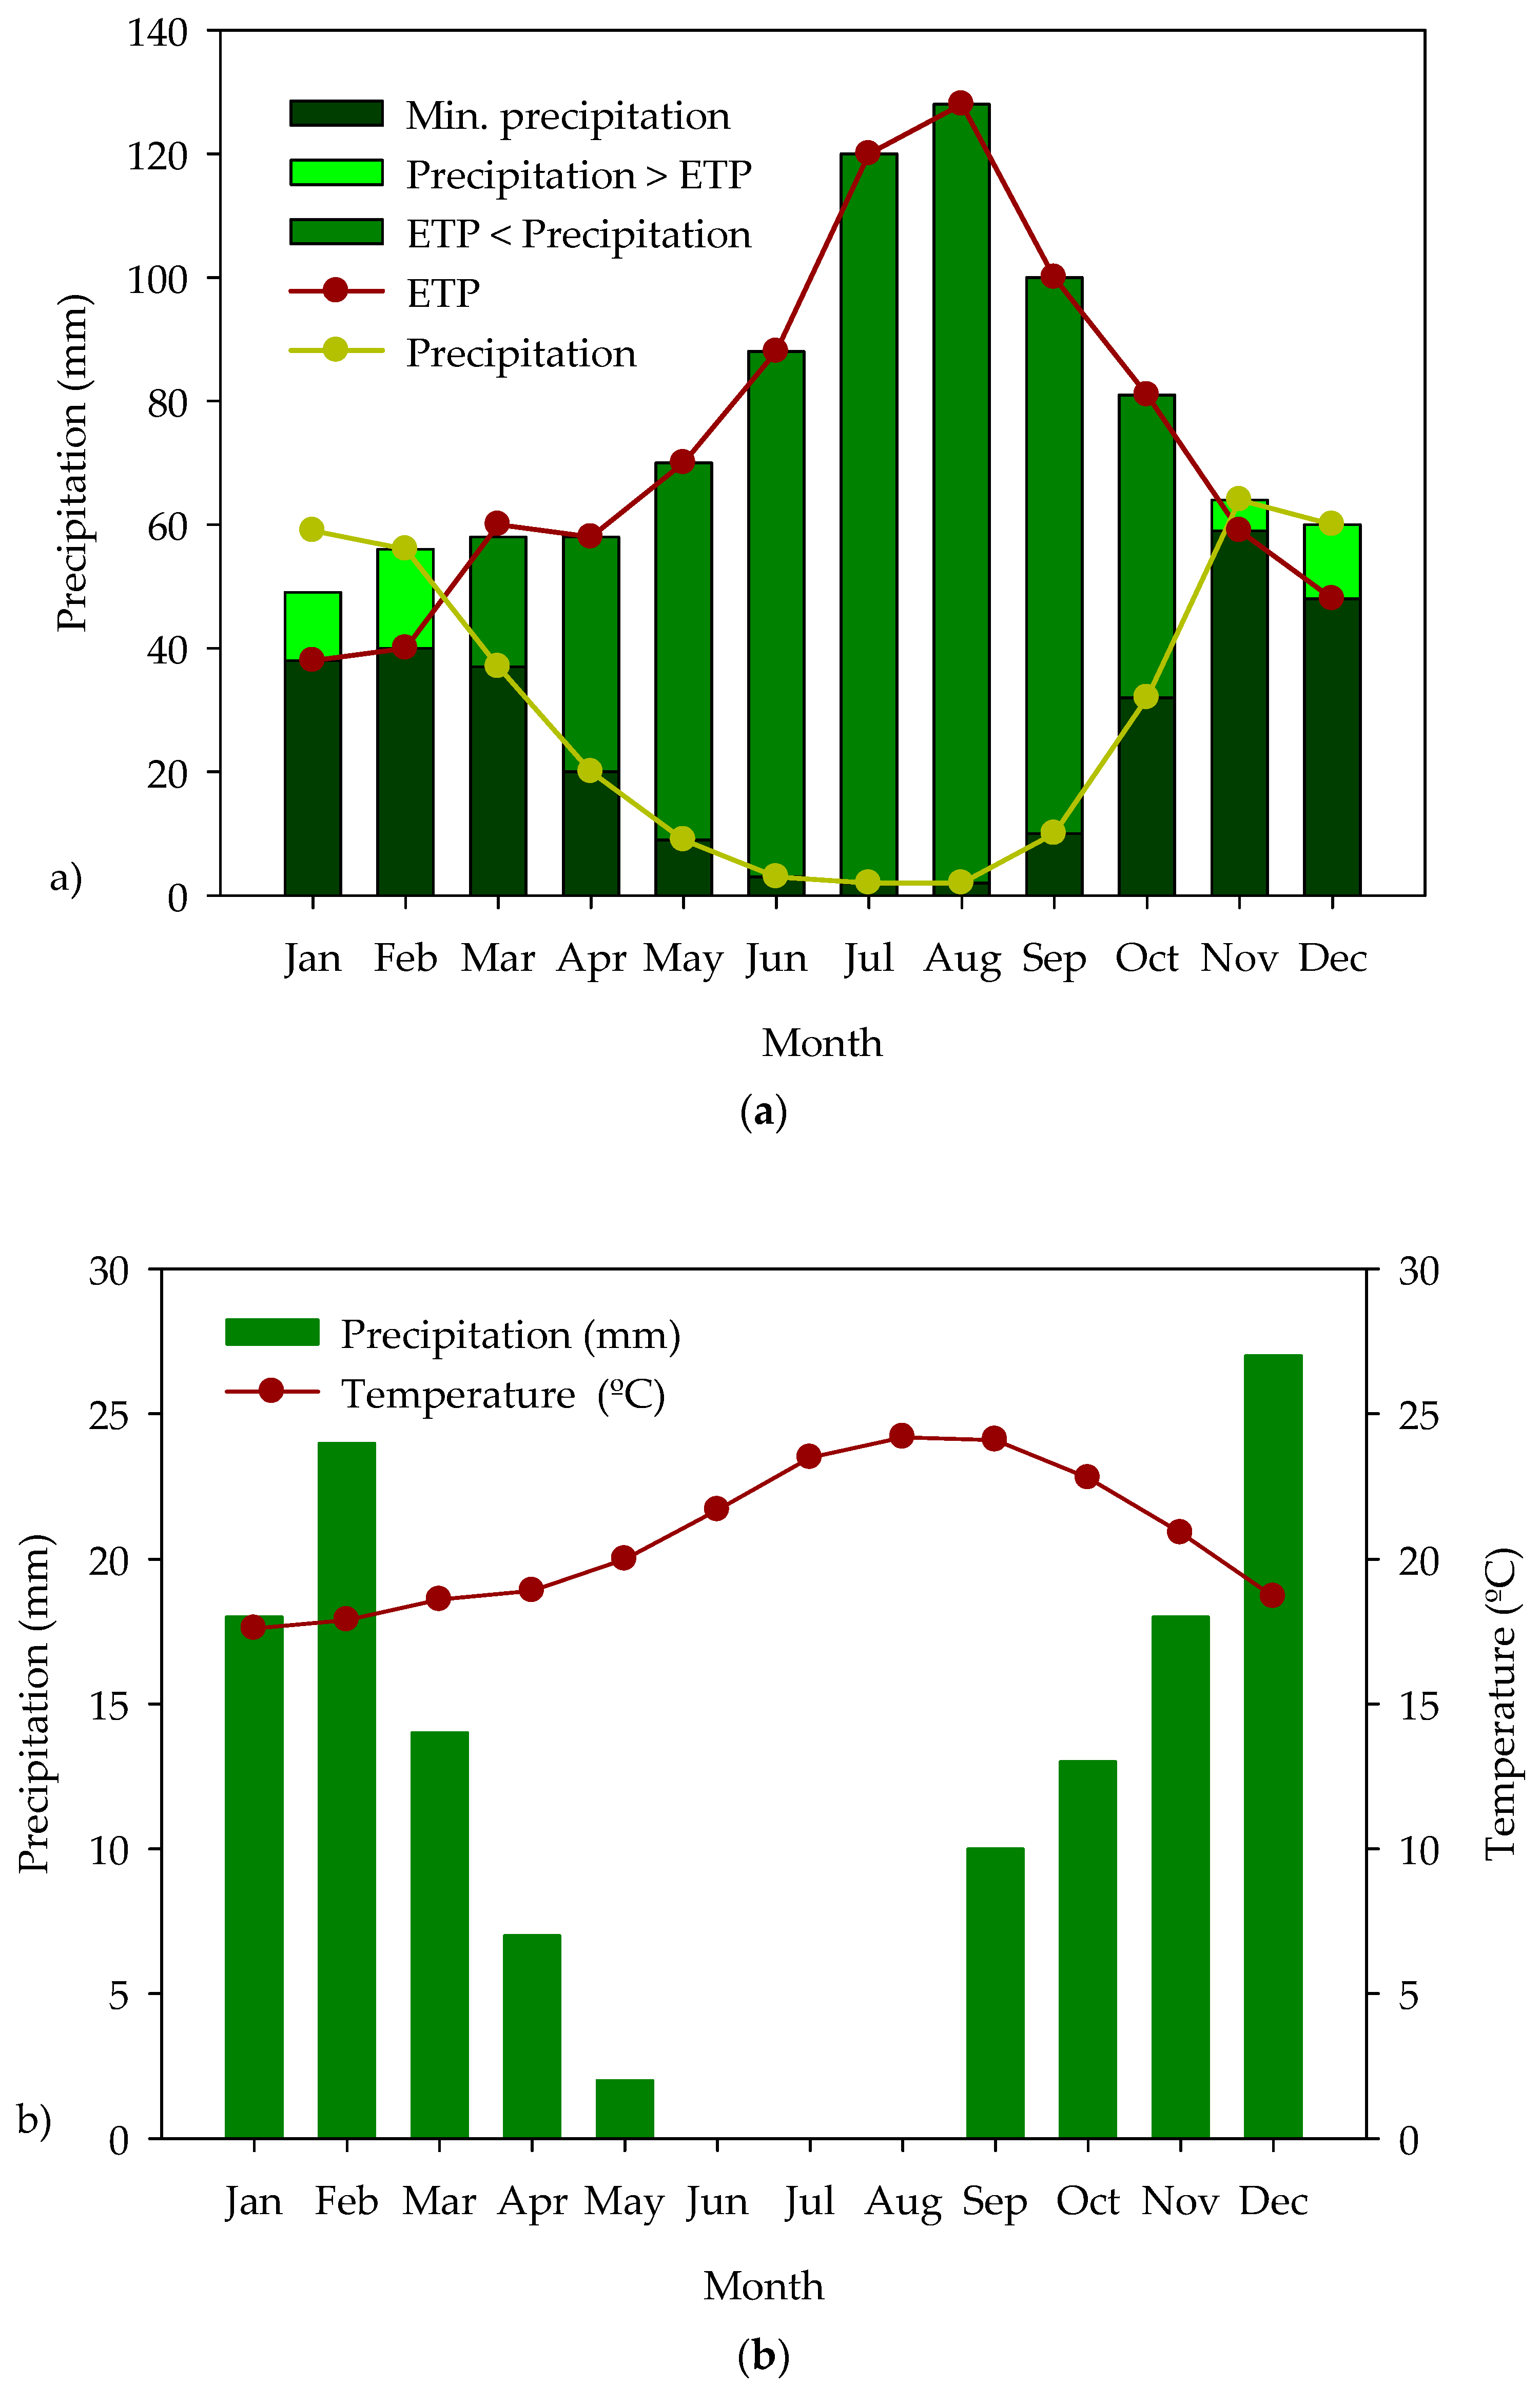
The climatology of the area under consideration is characterized by scarce rainfall and a temperate mean temperature that remains constant for much of the year. This fact will have an impact on the replenishment levels of the aquifers located in the area studied. The mean temperature over a 30-year period was almost constant [39], at some 20 °C, with the minimum temperature falling to 17.6 °C in January and the maximum rising to 24.2 °C in August, as illustrated in Figure 2b [39]. Temperatures remained fairly mild throughout the year. There were no acute peaks or lows. As for precipitations, these were rather limited. There was no rainfall over three months, i.e., June, July and August, whereas rain did fall during the other months, but in rather small amounts. The winter months, i.e., November, December, January and February, experienced the most rainfall with an average of 22 mm. The months of March, April, May, September and October did not reach 15 mm. The wettest month was December, with an average rainfall level of 27 mm. Based on the graph reflecting the variation in annual precipitation (Figure 2a), it can be noted in that there was not a repetition of defined cycles, although the number of years showing rainfall levels below average was indeed greater than that of years presenting levels of precipitations higher than the average. As a result of the limited amount of rainfall and, above all, of its discontinuity, the gullies remained dry for most of the year. The analysis of the evaporation graph showed that the season characterized by the most evaporation was, precisely, the dry season. This can lead to the evaporation of part of the underground waters. As a result of this fact, combined with the steep orography of the terrain, as can be appreciated in the cross sections shown in Figure 3, the little rainfall that occurs in this area flows quickly towards the sea along the catchment areas of the gorges, whilst the fraction of water that did not reach the shore evaporates rapidly.
The water extracted from 16 drained wells located in the Amurga Mountain Range was analyzed over five years during last decade, with monitoring starting at the beginning of summer. Figure 3 and Table 1 give the location of the wells, as well as two geological sections of the area under review, thus giving insight into the orography of the relief.
The aim of this study was to characterize the evolution of the hydrochemistry of the 16 groundwater wells located in the southeast of Gran Canaria Island in order to evaluate the impact of the human activity in the abovementioned area.
2.2. Sampling and Analytics
A total of 288 samples were collected, and 4320 tests were carried out in the laboratory of the research group (located in Gran Canaria Island), which has an ENAC (National Accreditation Entity) accreditation in all the parameters included in this work. Most samples were obtained directly from the intakes, after washing the sampling containers with the water from the same intake. The samples obtained were stored in glass bottles and double-capped polyethylene with a capacity of 1000 mL, without air bubbles, with light protection and with their corresponding preservatives according to the parameter to be analyzed. Since the samples were obtained in the field until their arrival in the laboratory, an average of 2 h elapsed. In the laboratory the samples were kept refrigerated to avoid changes in their chemical characteristics. Regarding the longitudinal records of temperature and conductivity, we have data from previous studies in soundings that were out of service, with a probe made by SEBA company, which allowed the temperature to be recorded up to 300 m deep (with an accuracy of ±0.1 °C) and electrical conductivity. Parallel to the sampling of groundwater, determinations of air and groundwater temperature in situ were made. The temperature of the air and groundwater (°C) was measured with a mercury thermometer of a precision of ±0.2 °C. All other parameters were analyzed in the laboratory, due to the fact that between the sampling and analysis time there were only about 2 h.
The following physicochemical parameters were analyzed: bicarbonate, sulfates, chlorides, nitrates, calcium, magnesium, sodium, potassium, silica, carbonates, iron, pH, conductivity, salinity, total dissolved solids (TDS), colour, turbidity. Not all the mentioned parameters are relevant to be shown in this work, so the considered parameters are listed in Table 2.
A Beckman Coulter DU 800 UV-Visible spectrophotometer (Beckman Coulter, Inc., Fullerton, CA, USA) was used for the analysis of sulfates, nitrites, nitrates, iron and silica. A GLP 22 pH-meter (Crison, Barcelona, Spain) and a GLP 32 conductivity meter (Crison, Barcelona, Spain, measurement error ≤0.5%) were used. The identification of sodium and potassium was carried out using 904 AA atomic absorption equipment (GBC, Braeside, Victoria, Australia). The remaining parameters were determined by titration. All the instruments were calibrated prior to the tests, using certified standards. The limit of detection (LOD) was the triple of the standard deviation within the batch of a natural sample containing a low concentration of the parameter, or the quintuple of the standard deviation of a blank sample according with the Spanish regulation and the precision according with the standard ISO 5725-1:1994.
The samples were taken at the exit point of the pumping system in place at each well. In each and every case, a minimum sample of 1 L in volume was taken, according to the storage characteristics of each group of parameters. Table 2 shows the minimum requirements, which were taken into account at the time of sampling. Conductivity and pH measurements were carried out in situ.
The data used in this study, which are limited to the distribution of the majority inorganic ions, stem from a databank, in which tests are selected on the basis that the anion/cation balance is <±4 [40].
When it came to grading the types of water, a rating system based on the combinations of the majority ions [23] (Table 3) was selected. This system is widely used in hydrogeology, where majority ions are expressed as a percentage of meq/L, taking as the 100% basis the sum of cations and anions. The ratios Na/Cl, (Na-Cl)/SO4 and (Cl-Na)/Mg were calculated in order to determine the type of water. Four different types of water were identified, based on this classification. These types are: sodium sulfated, sodium bicarbonated, magnesium chlorided, and calcium chlorided.
3. Results and Discussions
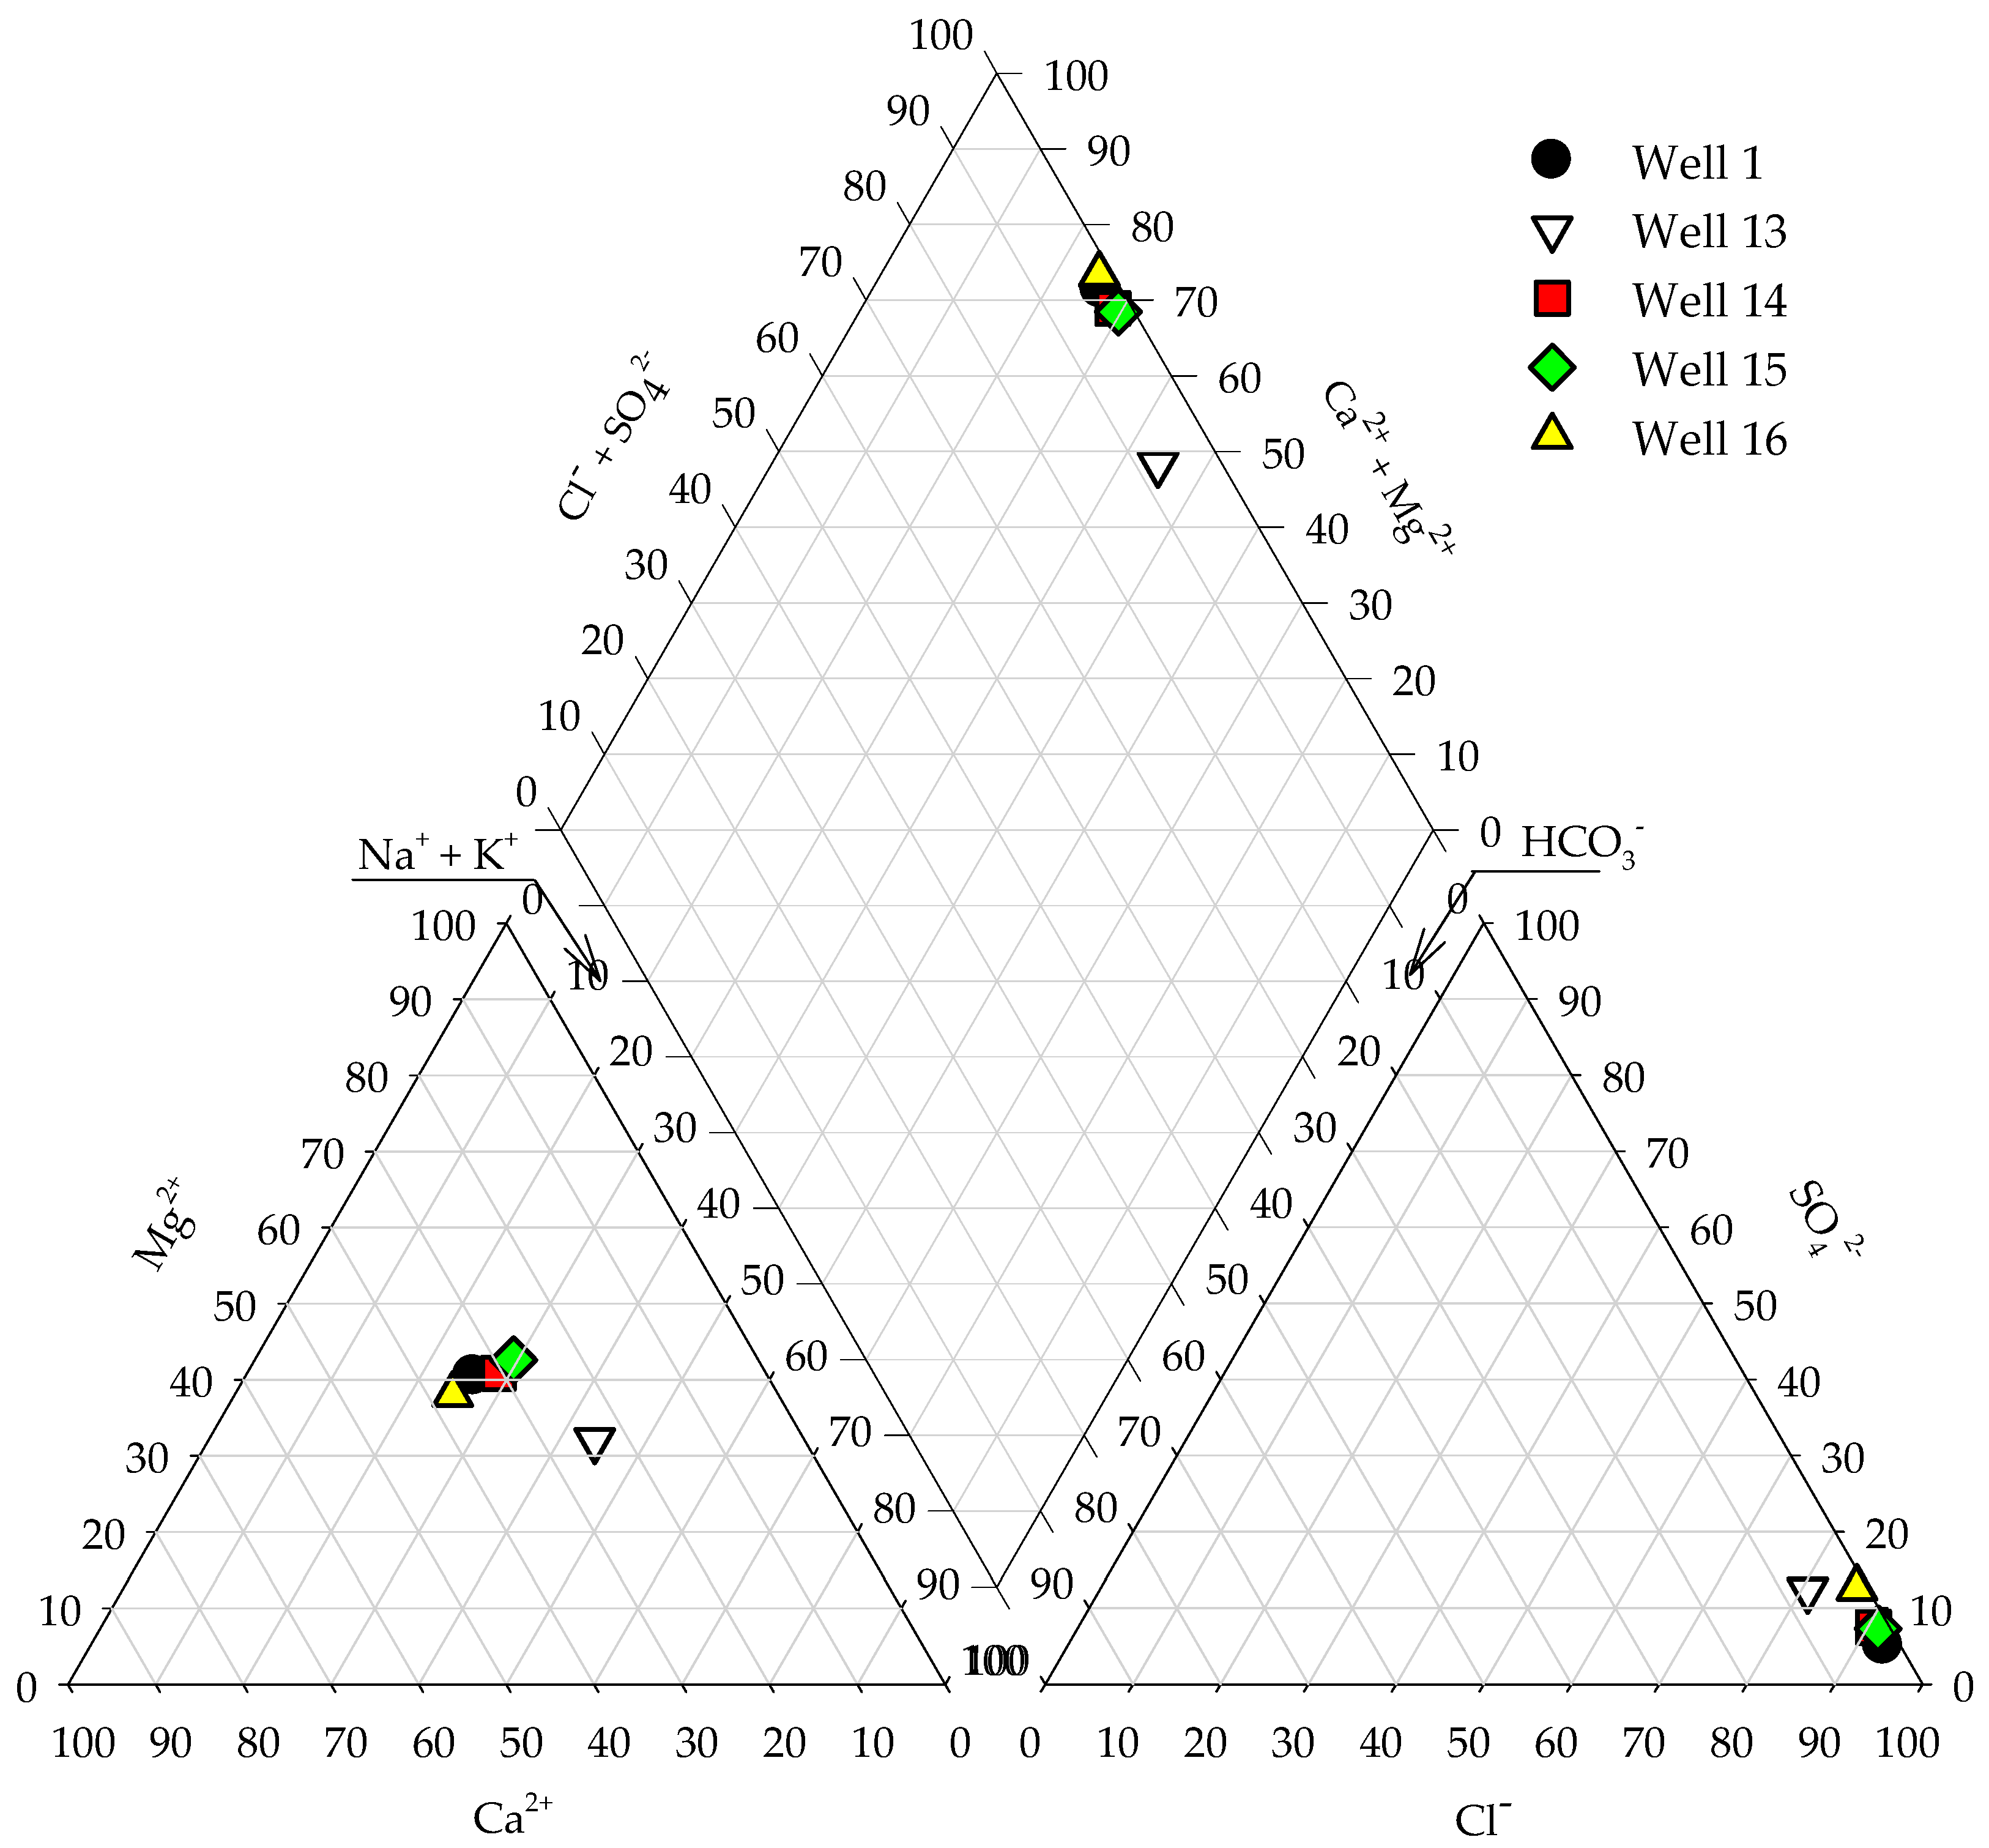
The analysis of the various types of water were described using the Piper diagrammatic method [41]. This diagram rates waters according to their chemical composition and indicates the prevailing chemical reactions occurring between the water and rocks.
The average pH and rates, as well as the concentration of majority ions obtained from the tests on the wells are supplied in Table 4 and Table 5. A total of 18 samples were taken per well and each sample was analyzed three times. Even though, in most of the data, the concentration levels given were high, the mean values reflected the general character of each well.
The rates of ion concentration were influenced by the presence of different types of water, and the Piper diagram was used in order to assess the latter, since it was easier to detect water combinations more clearly along a channel line because this is a ternary diagram. In spite of the fact that all the waters were fairly mineralized, one group stood out due to the presence of Cl-Mg and Na-SO4, which we called Type II. These waters were considered as hard, with conductivity values ranging between 1300 and 2700 µS/cm; in contrast, the other group is characterized by the presence of Cl-Ca, which we called Type I. These waters were very hard, conductivity values fluctuating between 6500 and 11,700 µS/cm.
When looking at the sodium absorption ratio (SAR), we noticed that the waters taken from the various wells presented a low risk of alkalinization, since all the values were below 10. With regard to hardness (TH), which is the presence of calcium and magnesium salts in the water, two types of water can be easily identified, that of wells 1, 13–16, where values exceed 1500; and the waters from the remaining wells, where these values were far lower. If we look at TDS, we also ranked the water into two types, on the one hand, wells 1, 13–16, where TDS were >4000 mg/L, and on the other, wells where some levels did not even reach a value of 1000 mg/L.
Most underground water resources were fairly mineralized, since conductivity values were relatively high, with some exceeding 10,000 µS/cm (wells 14–16), and concentration in bicarbonates was ≥100 mg/L, which indicates that the waters were rather hard. Figure 4 represents the Piper diagram of the 16 wells under consideration. The analysis of this diagram clearly shows two large categories of wells. All the wells are of the Chloride Type, as illustrated in the ternary diagram corresponding to anions, whereas if we analyze the ternary diagram corresponding to cations, we find a group presenting the Sodium and Potassium Type, and another one that shows no prevailing cation (the latter being located in the central area of the diagram). These two major groups are presented independently in Figure 5 and Figure 6, where distribution of the different parameters can be clearly assessed. It can be observed that all the wells had a high concentration of chloride ions, but those with the highest concentration were wells 1, and 13–16. In addition to a high concentration in chloride ions, these five wells also feature high concentrations of sodium, calcium and magnesium ions. For the sake of optimum clarity in presenting the results, these five wells, whose water we called Type I waters, for the most part, were located along the Tirajana Gorge (see Figure 3). The high concentration in chloride ions may be due to the penetration of this anion into the soil through the dragging action of the marine aerosol. This aerosol deposits the chloride anions on the soil, and these may then drain through into the underground reservoirs [42].
The wells with Type II waters were located in the Arguineguín Gorge, as well as in the Amurga Range itself. The waters from these wells were characterized by a higher concentration of sodium and bicarbonates ions in relation to other ions, being generally waters of the Na-SO4 and Cl-Mg type. Even though, in comparison with other waters, levels of bicarbonates were higher, they did not reach HCO3 type. The concentration in salts of the waters from these wells was much lower than that of the Type I wells, yet they were also hard waters.
In this case, the separation only applies to two distinct volumes of water, i.e., Type I waters, with wells 1, and 13–16, located mainly in the Tirajana Gorge, where it is obvious that there is the same blend, are calcium chlorided; whereas in Type II waters, which correspond to the remaining wells, the range of concentrations is much wider, which makes it a much more heterogeneous blend.
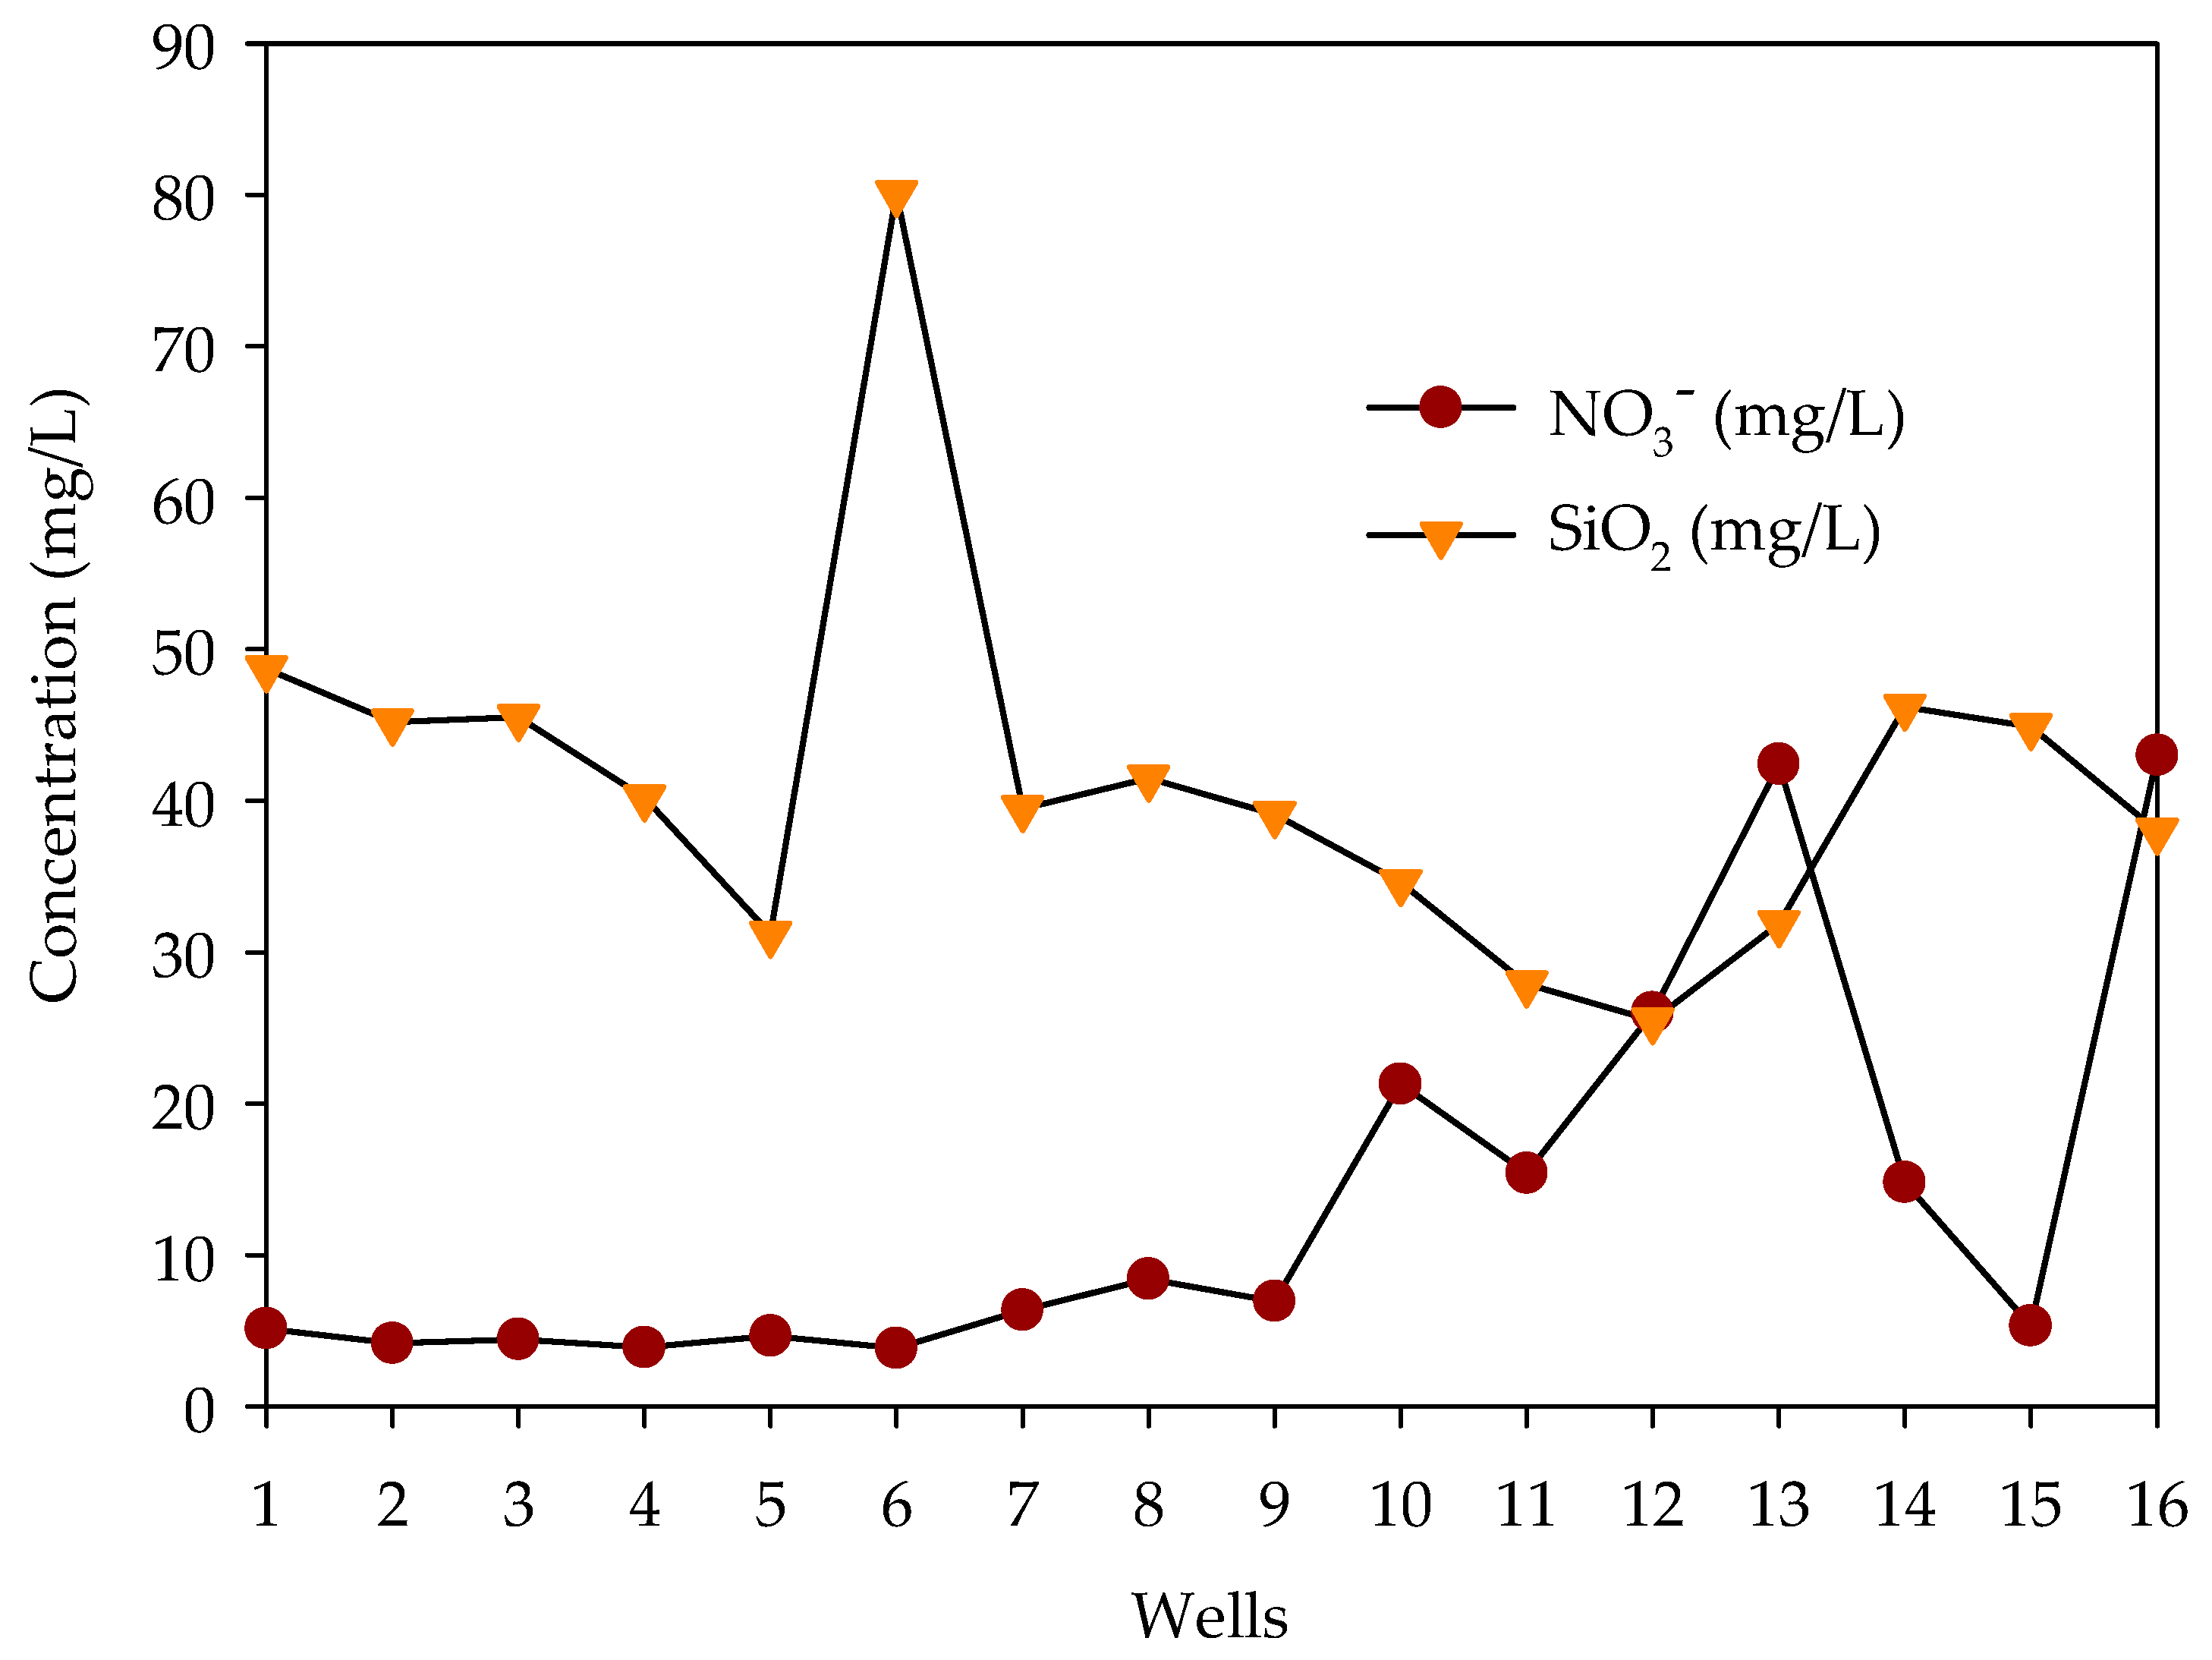
Furthermore, all the wells are characterized by a high concentration of silica, between 30 and 50 mg/L on average, with the exception of well 6, which shows a mean value of 80.1 mg/L, with a maximum of 94 and a minimum of 47 mg/L. Figure 7 shows the mean values of the nitrates and silica levels for all 16 wells during the whole testing period. This phenomenon is due as much to the hardness of the water as to the location of the wells, which are situated in an area where the bedrock, for the most part, is characterized by a high silica content and the prevalence of alkalines [16,17,43].
Figure 7 also illustrates the mean concentration of nitrates inside the wells, which shows that, in wells 1–9 and 15, contamination due to nitrates was minimal (maximum mean value of 8.41 mg/L in well 8), and their concentration levels remained constant, whilst in the other wells, the average concentration rose sharply during the research period. The majority of the highly contaminated wells are situated in the Tirajana Gorge, an area where the land is cultivated more intensively. Figure 8 presents the variations in the levels of nitrates from wells 10–14 and 16 during the sampling period (including in which month the samples were collected). A significant variation in the levels of nitrates can be observed in wells 12, 13, 14 and 16. Well 12 presents a minimum value of 1.2 mg/L in the sample taken in August and a maximum of 189 mg/L for the month of February. The same phenomenon is occurring in the other wells, where we have variations in the levels of nitrates of up to two orders of magnitude, with the exception of well 15, where the values range from 1.3 to 47.7 mg/L. This was linked to the intensive use of the land for agricultural purposes in the area. Wells 12, 13, 14 and 16 are located in an area of intensive land cultivation (Figure 3), whilst wells 10 and 11, which are situated in the same gorge, are located further from this cultivated area. It is worth mentioning that these wells are located on higher ground (cf., Figure 3).
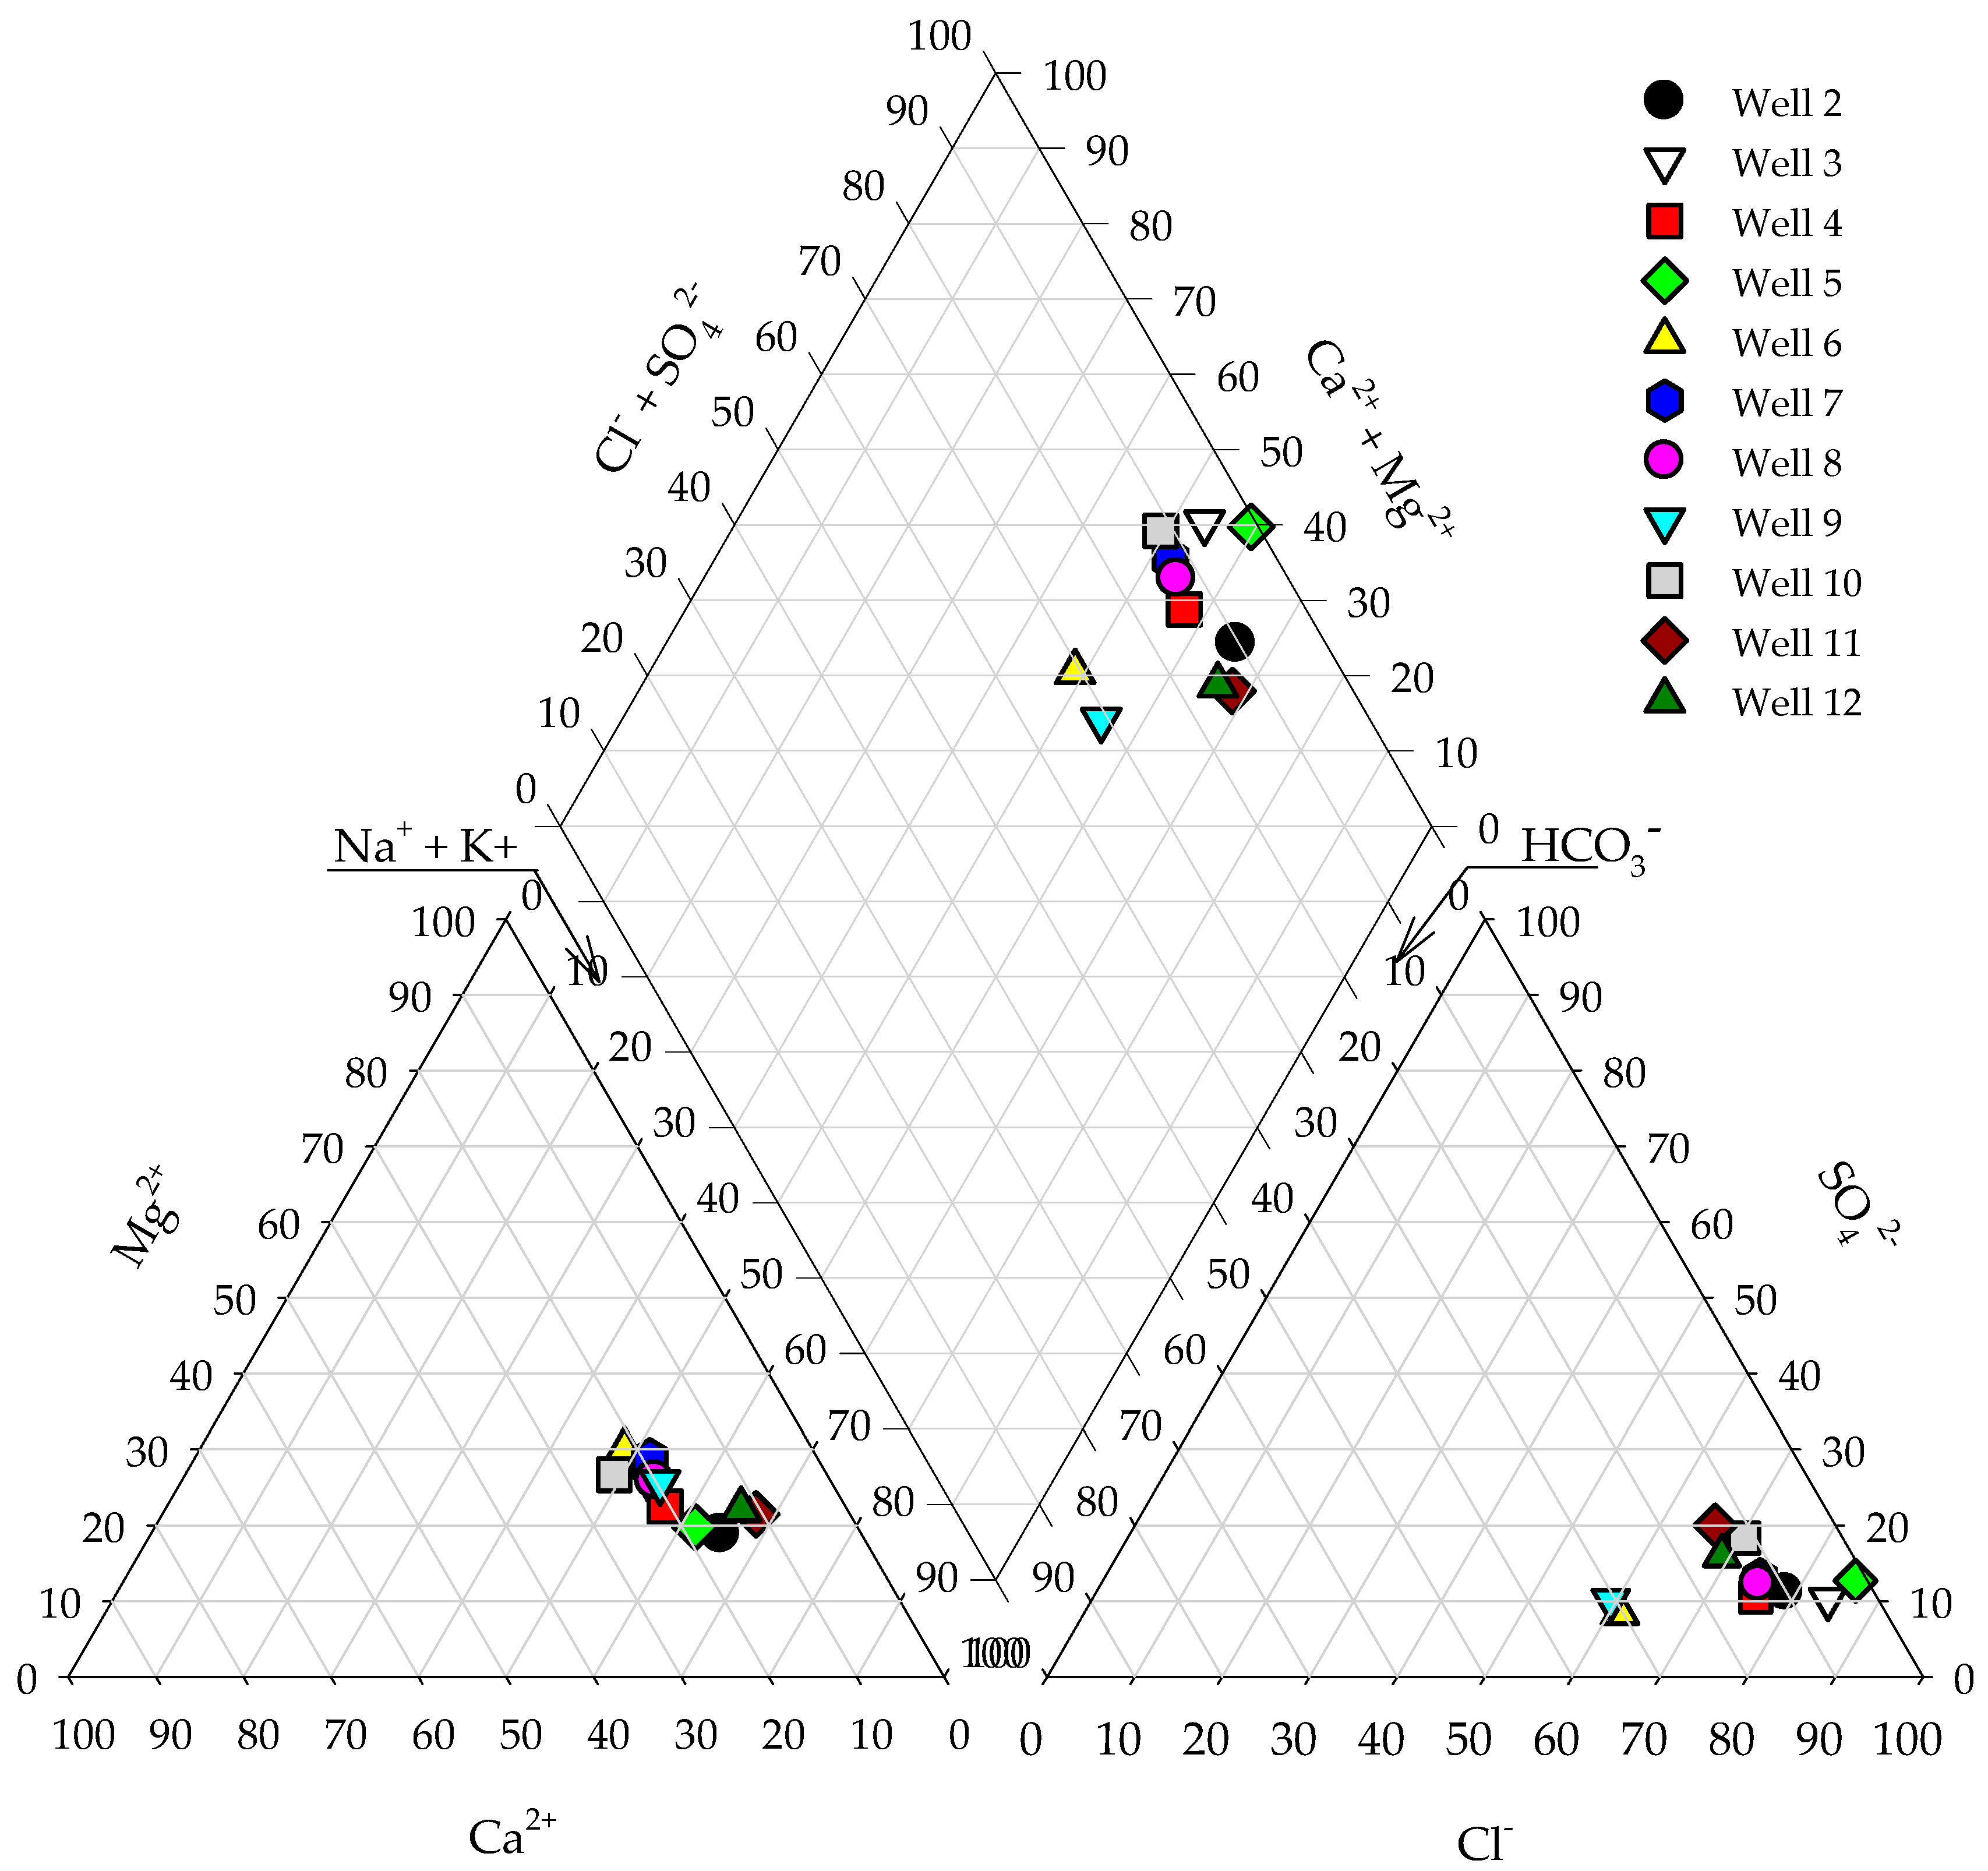
3.1. Waters of Type I (Cl-Ca)
The waters belonging to this type are those from wells 1, and 13–16. In this area, the underground water is fairly mineralized, with considerable hardness. Conductivity levels were very high, ranging between 6500 and 11,700 µS/cm. These wells present high salt contents. In this case, all the waters are of the Cl-Ca type (Figure 5). Due to high levels of salts in such waters, these waters would be deemed considerably hard. These high levels of salts may be the result of the prolonged interaction between the water and the rock, since, according to [32], the water resources in this area are at least 10,000 years old, and it is possible for the salts from the rocks to have gradually dissolved. It can also be observed that the level of sulfates is high, exceeding the limit set by the Spanish legislation in force [44] (Table 6), i.e., 250 mg/L. Well 1 is the only one not to exceed this limit.
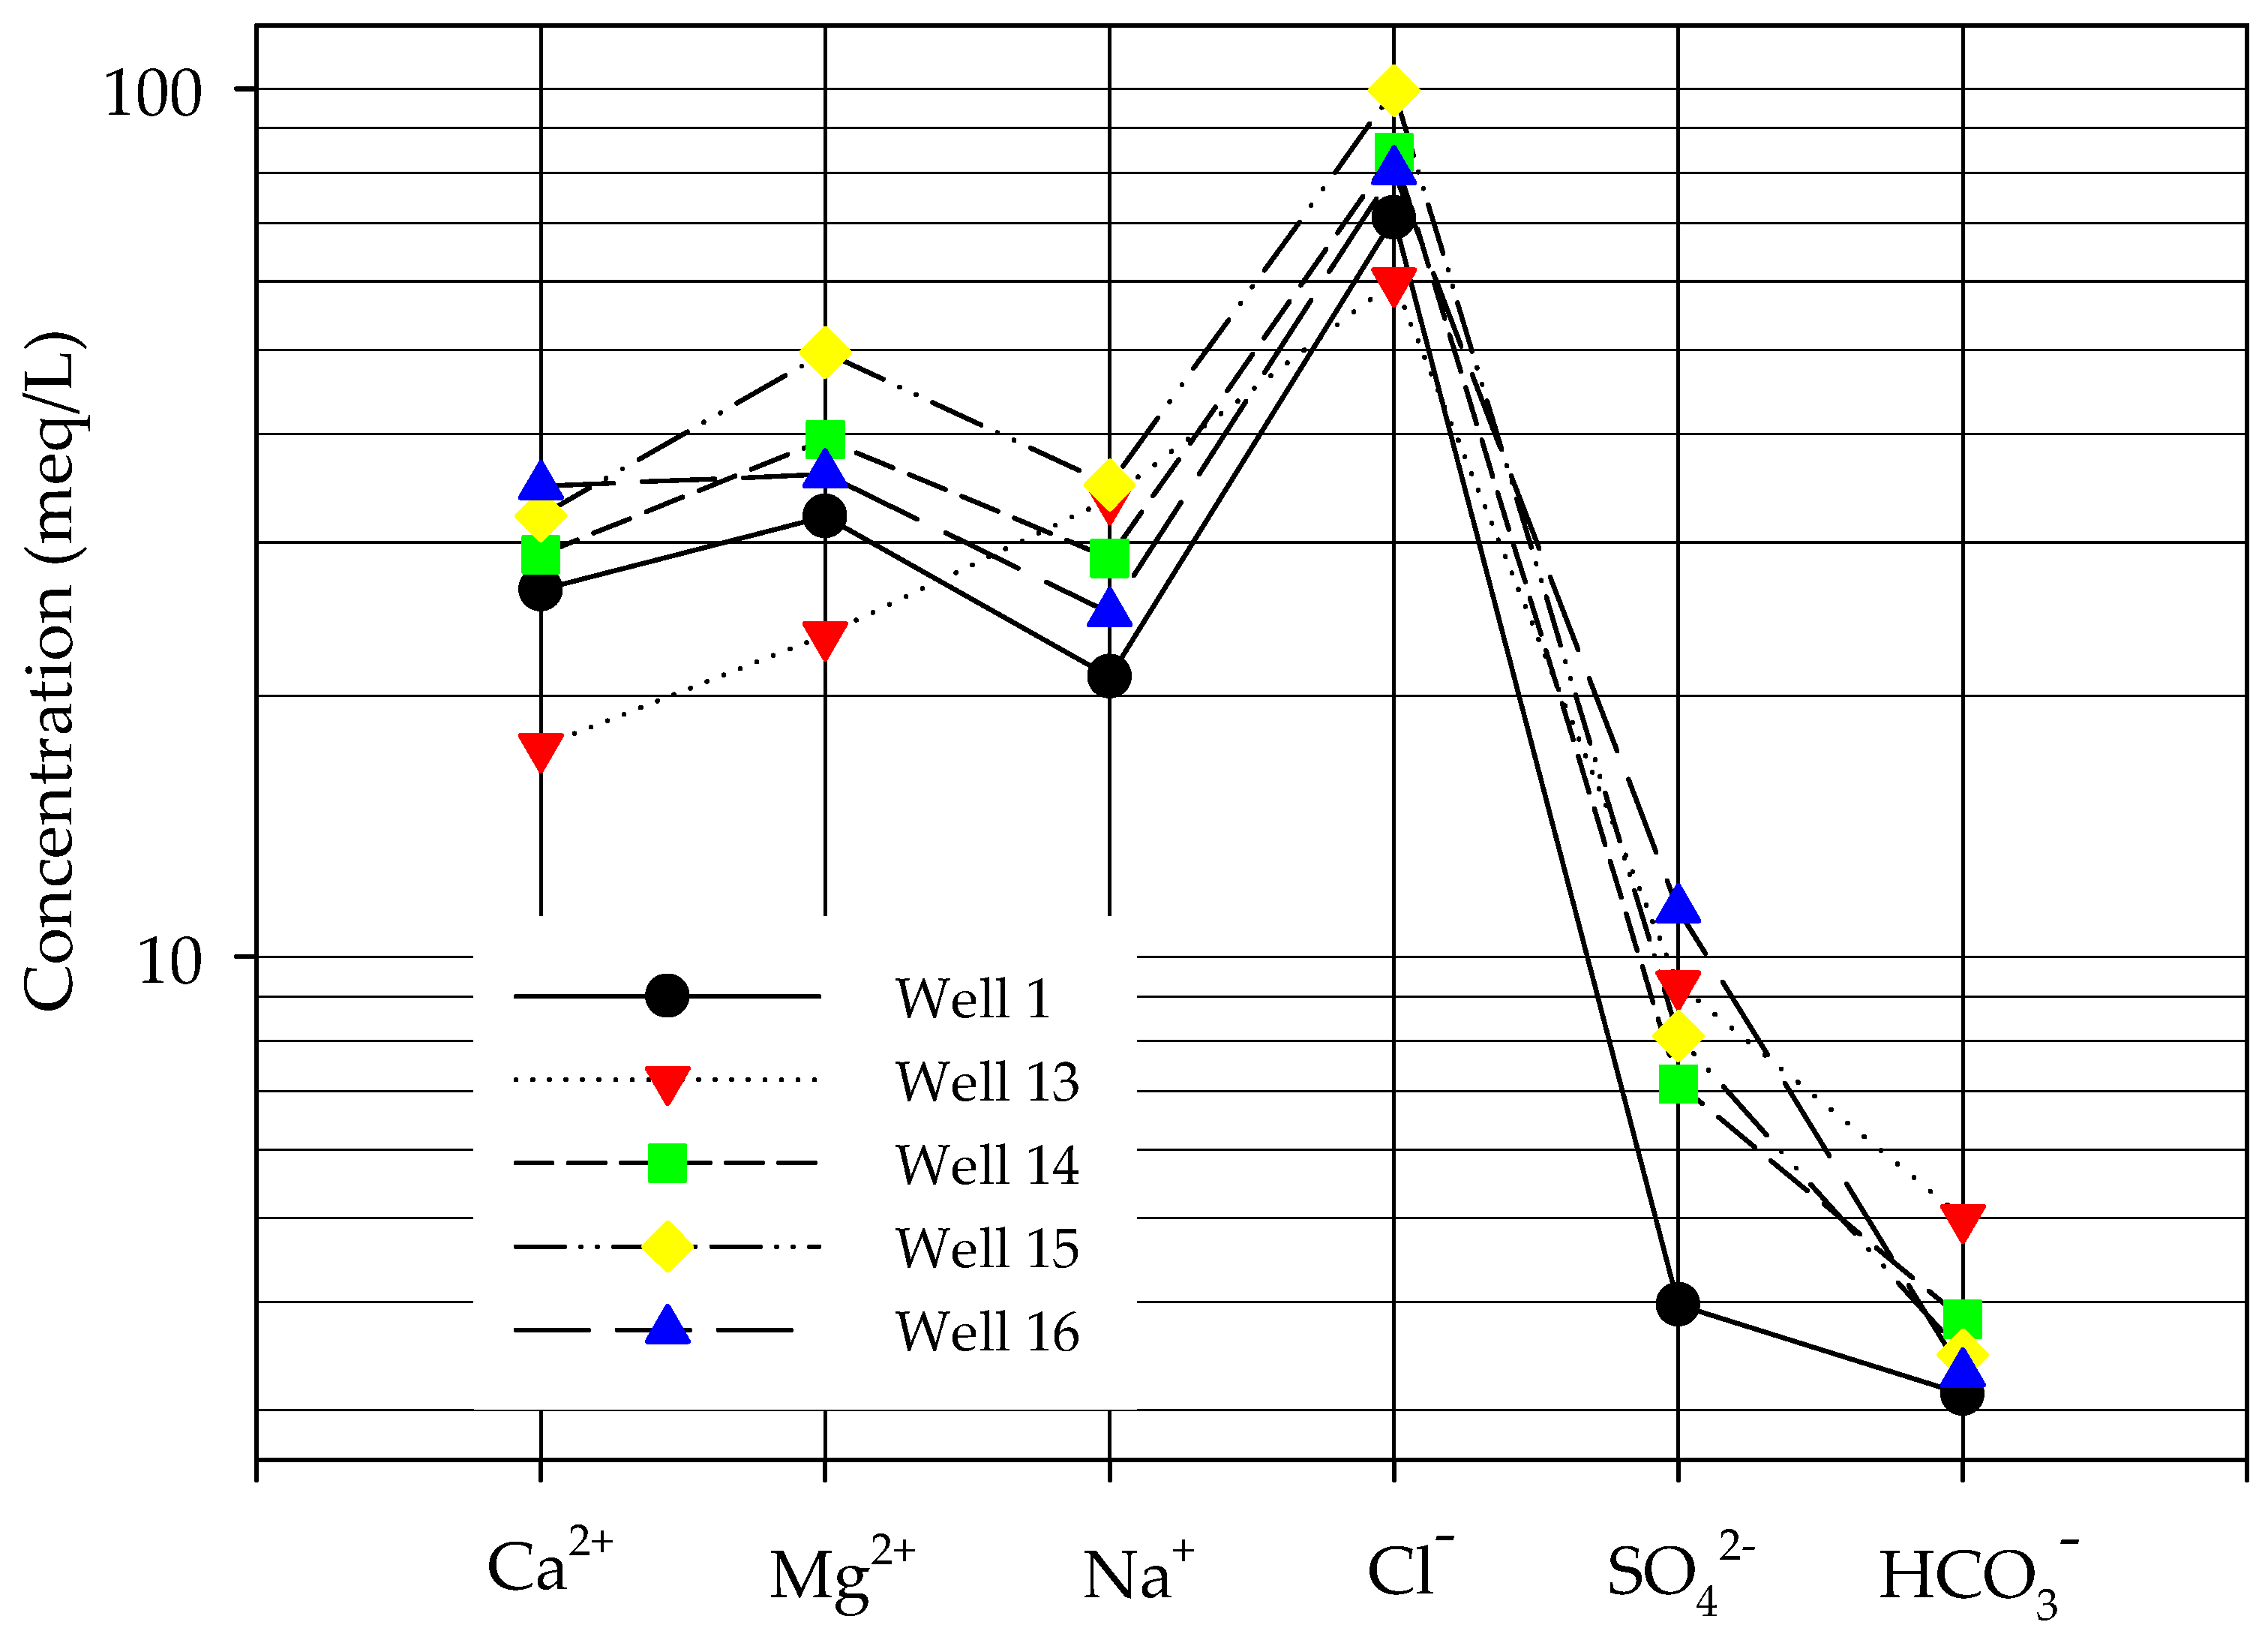
Figure 9 illustrates the Schoeller diagram, which shows the cationic and anionic relation of the waters from the wells given in meq/L. It therefore reveals clearly the high contents in calcium, magnesium, sodium and chloride salts, whilst sulfate and bicarbonates salts were in smaller quantities.
According to the limits shown in Table 6, the wells 1, and 13–16 exceed the limits established in the Spanish regulation [44] in terms of chloride, magnesium, sodium, potassium, conductivity and TDS. The concentration of nitrates was below the limits and the concentration of sulfates in well 1 was also below the maximum. The mentioned wells exceed the limits in terms of conductivity and TDS.
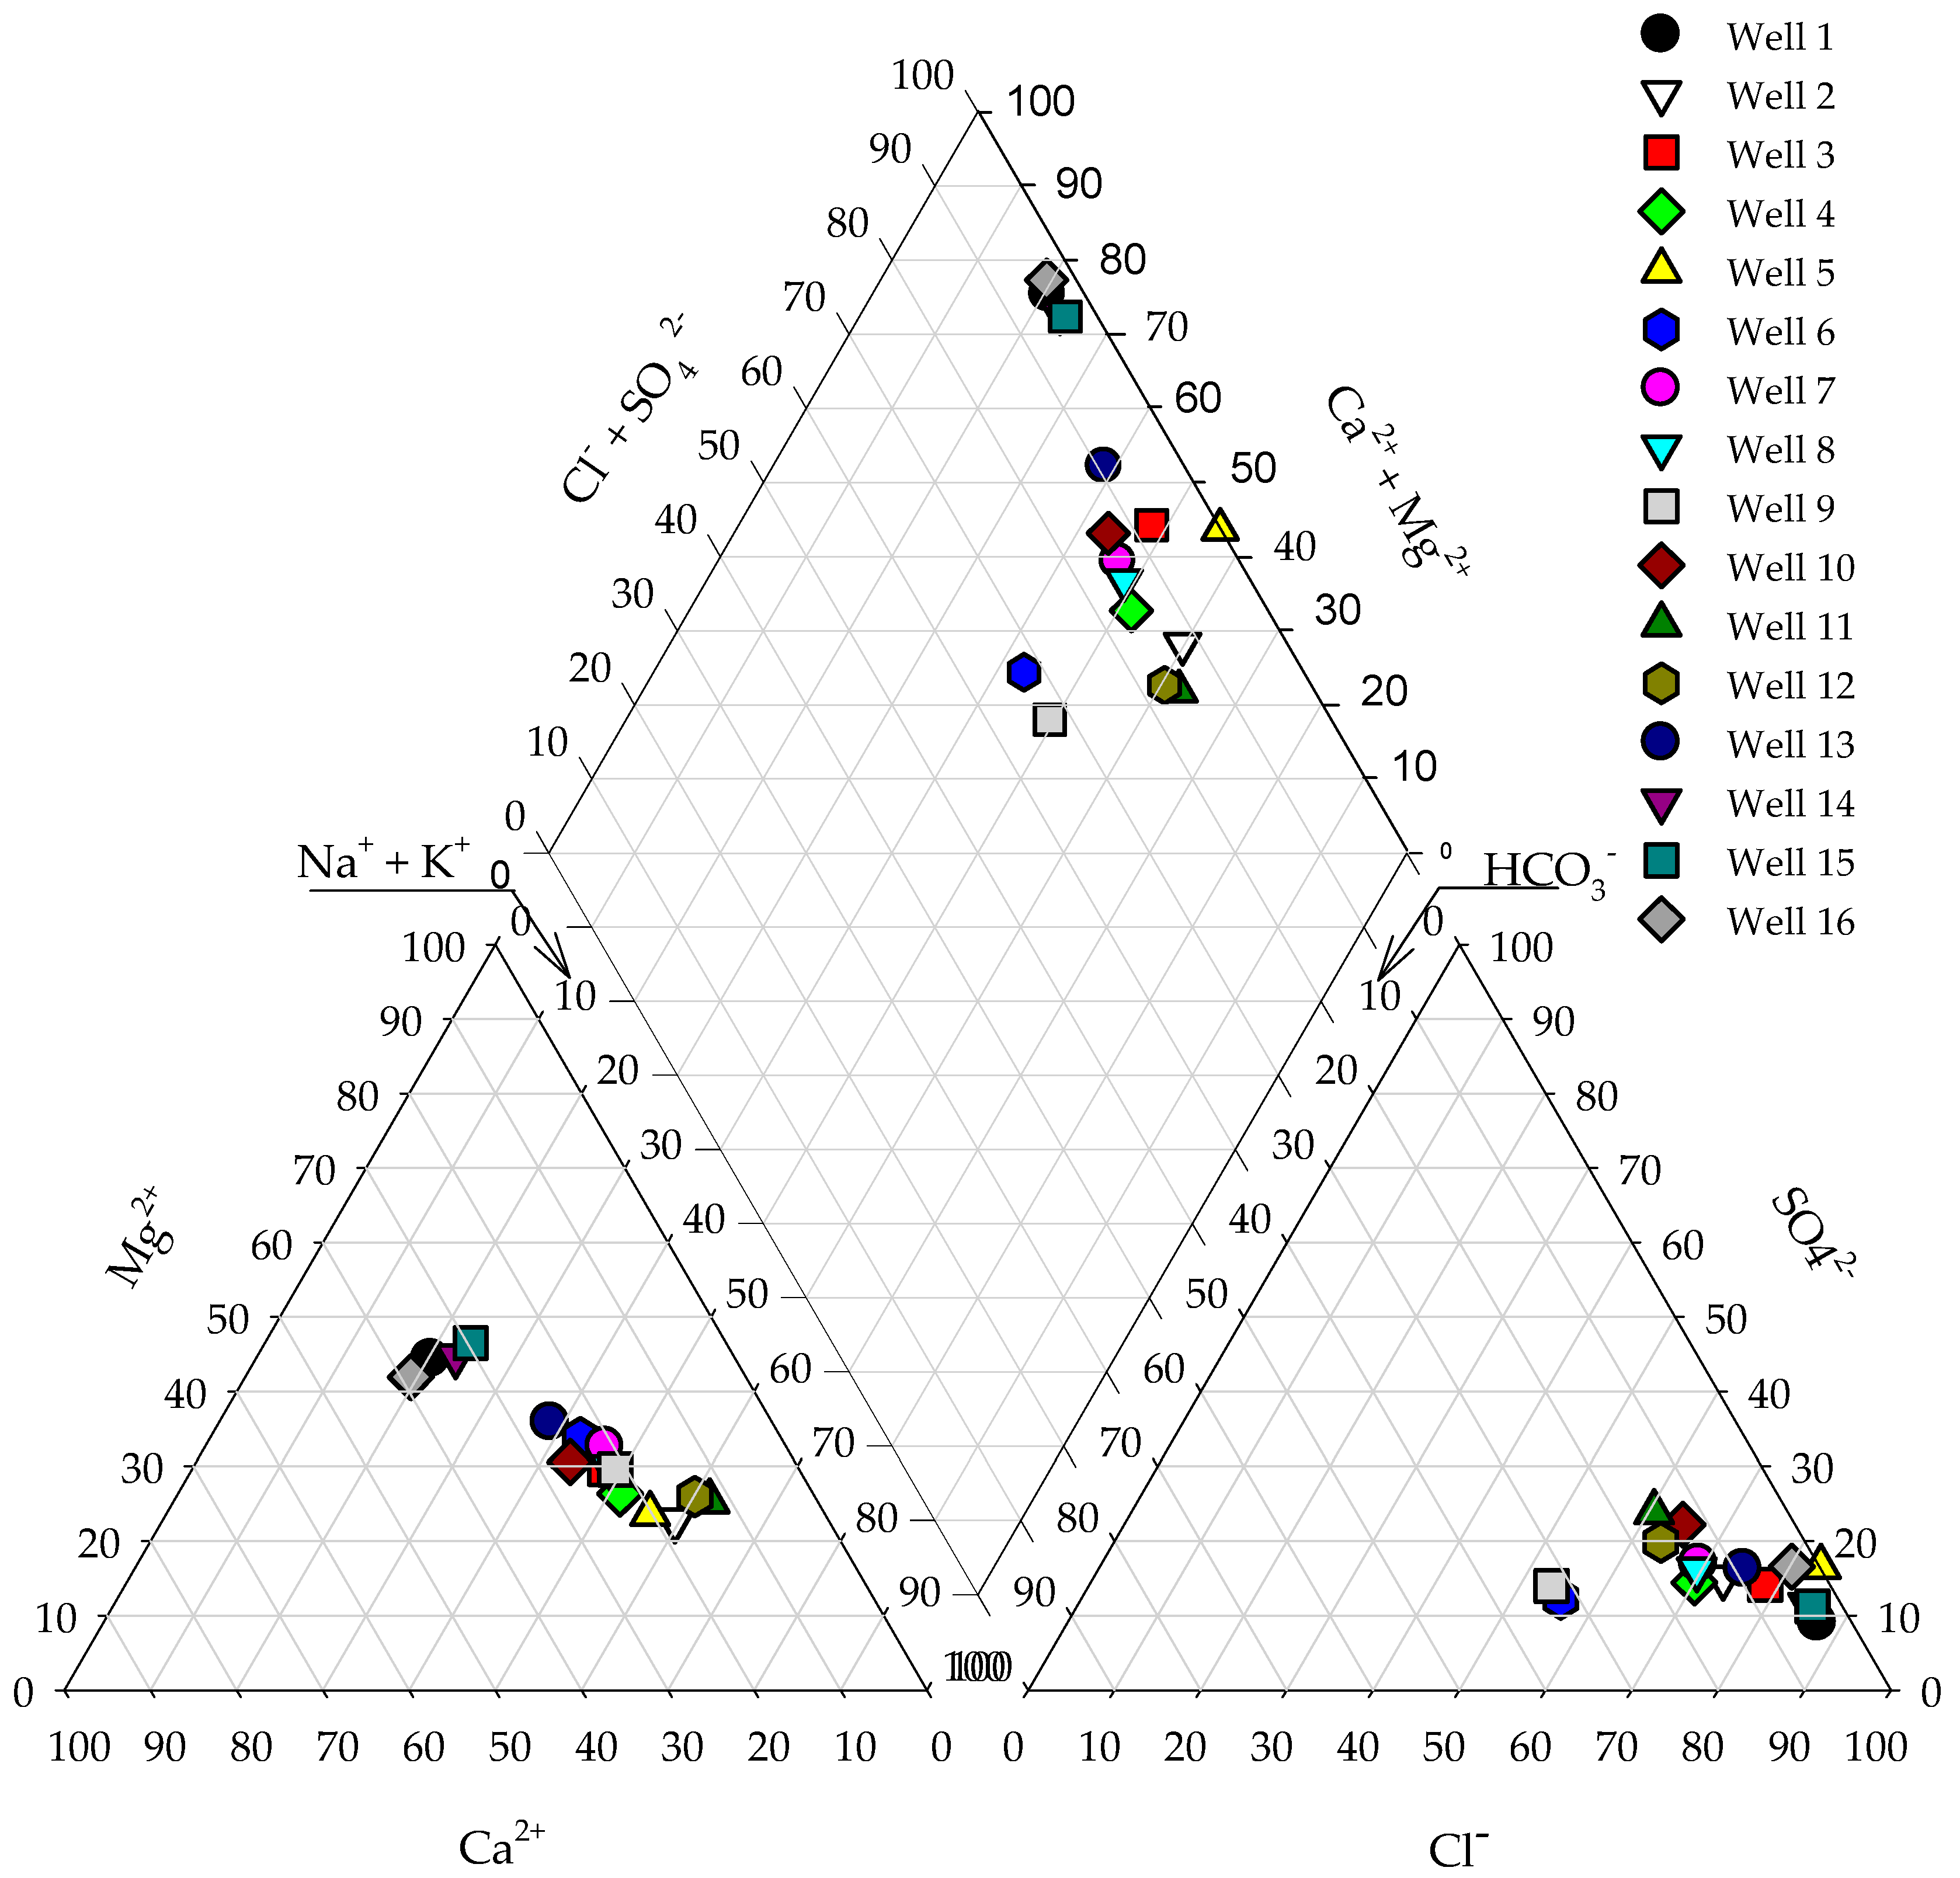
3.2. Waters of Type II (Mg-Cl, Na-SO4)
These waters come from the remaining wells, i.e., 2–12, which are located in the Arguineguín Gorge and, above all, on the Amurga Range itself. These wells are characterized by a more heterogeneous type of water from one to the other, in contrast to the previous case, where all the wells show similar characteristics.
The waters, for the most part, are of the Mg-Cl type, although some are of the Na-SO4 type (Figure 6). In this case, the water from the wells is a less reliable mix, the ion distribution is more varied, and it could be subdivided into more blends, although we decided to speak of only one blend in this case.
These waters are not hard, yet they are considered to have a high level of salinity as well. In this case, the conductivity levels of the wells range from 1314 to 2708 µS/cm, which is lower than the waters in Type I, but nonetheless exceeds the value set by the legislation, i.e., 1250 µS/cm. As for sulfates, even though none of the wells exceeds the limit, they do exceed the value recommended by the Spanish legislation, which would be 25 mg/L [44].
It is worth singling out well 11 among these wells, as it shows a high pH (8.80), whilst its conductivity level (1659 µS/cm) is not high compared to the others. Such a basic pH value is due to the presence of high levels of carbonates, i.e., 87.6 mg/L, that make it stand out against the other wells.
When representing the Schoeller diagram for these wells (see Figure 10), we see the distribution of the majority ions, which is much less in this case. It can be observed that, even though ion levels are much lower, sodium and chloride ions are high, whilst bicarbonates and magnesium, calcium and sulfates are slightly lower, in general.
The wells of this type of water (wells 2–12) did not show high sulfate and nitrate concentrations in comparison with the limit established in the Spanish regulation (Table 6). The chloride concentration in the well 2 was admissible, the magnesium concentration was below the limit in the wells 4, 6, 9 and 11, the sodium concentration in well 6 and the potassium concentration in wells 6 and 9 were appropriate according to the limits of Table 6. The conductivity and TDS were below the limits for most wells.
4. Conclusions
The analyzed underground water taken from the drained wells situated in the Amurga Mountain Range presents a high mineralization rate. No well would be able to supply water of suitable quality without prior treatment due to the considerable mineralization and the high chloride levels detected. All the waters are fairly hard, and alkaline, which may be due to the interaction between the waters and the rock bed, thus leading to the hypothesis that there may be some infiltrations of seawater, above all in the wells closest to the ocean, as a result of the type of rock composition in the area, since the rock bed is very dense, and water cannot filter through it. Such high levels of salinity may also be due to the almost non-existing regeneration of the waters, since there is very little rainfall in this area.
On the basis of the Piper diagrams, the waters from these wells can be classified into two main groups, according to their relation Cl-Ca (Type I waters) and Mg-Cl, Na-SO4 (Type II waters). It was found that the groups of wells arranged into one or the other category are located in the same geographical strips, which implies that we are dealing with different reservoirs. High levels of nitrates have been found in the wells situated in the area of the Tirajana Gorge (in comparison with the rest of the wells), where land cultivation is intensive, with the exception of the wells, which despite being located in the same strip, are remote from the cultivated area (respectively higher and lower ground in the gorge).
All the tested components are in the form of macro (>1 mg/L) and microcomponents (average around 100 mg/L). Our findings do not show levels of trace or microtrace amounts, including the tested metals. The waters from these wells cannot be used as drinking water, as most of them exceed the recommended limits set in the legislation [44]. Alternative water resources should be used, such as seawater desalination, in order to curb the deterioration of these aquifers and avoid the depletion of the wells in question. Likewise, the phreatic levels should be rejuvenated by injecting water from other sources.
Author Contributions
Conceptualization, R.M.S. and J.J.S.; methodology, M.D.C.-C. and J.J.S.; software, M.D.C.-C., V.M. and J.J.S.; validation, R.M.S., J.J.S. and I.N.; formal analysis, A.R.-G. and M.D.C.-C.; investigation, M.D.C.-C.; resources, R.M.S., J.J.S. and I.N.; data curation, M.D.C.-C.; writing—original draft preparation; A.R.-G., M.D.C.-C. and V.M.; writing—review and editing, A.R.-G., R.M.S., J.J.S. and I.N.; visualization, R.M.S., J.J.S. and I.N.; supervision, R.M.S., J.J.S. and I.N.; project administration, J.J.S;. fund raising, J.J.S.
Funding
This research was funded by the Unamuno Framework MAC/3/M126 of the European Regional Development Fund (Brussels, Belgium).
Acknowledgments
The authors wish to thank the ELMASA company (San Bartolomé de Tirajana, Gran Canaria, Spain) for their support in carrying out this study, which would not have been possible without their assistance. A grant awarded to JJS under the Unamuno Framework MAC/3/M126 of the European Regional Development Fund (Brussels, Belgium) to conduct a stay at the University of the Azores is gratefully acknowledged.
Conflicts of Interest
Declare conflicts of interest or state “The authors declare no conflict of interest.”
References
- Custodio, E. Aquifer overexploitation: What does it mean? Hydrogeol. J. 2002, 10, 254–277. [Google Scholar] [CrossRef]
- Serio, F.; Miglietta, P.P.; Lamastra, L.; Ficocelli, S.; Intini, F.; De Leo, F.; De Donno, A. Groundwater nitrate contamination and agricultural land use: A grey water footprint perspective in Southern Apulia Region (Italy). Sci. Total Environ. 2018, 645, 1425–1431. [Google Scholar] [CrossRef]
- Klassen, J.; Allen, D.M. Assessing the risk of saltwater intrusion in coastal aquifers. J. Hydrol. 2017, 551, 730–745. [Google Scholar] [CrossRef]
- Liu, S.; Tang, Z.; Gao, M.; Hou, G. Evolutionary process of saline–water intrusion in Holocene and Late Pleistocene groundwater in southern Laizhou Bay. Sci. Total Environ. 2017, 607–608, 586–599. [Google Scholar] [CrossRef]
- Li, Y.; Zhang, B.; Shi, L.; Ye, Y. Dynamic variation characteristics of seawater intrusion in underground water-Sealed oil Storage cavern under island tidal environment. Water 2019, 11, 130. [Google Scholar] [CrossRef]
- Kløve, B.; Ala-Aho, P.; Bertrand, G.; Gurdak, J.J.; Kupfersberger, H.; Kværner, J.; Muotka, T.; Mykrä, H.; Preda, E.; Rossi, P.; et al. Climate change impacts on groundwater and dependent ecosystems. J. Hydrol. 2014, 518, 250–266. [Google Scholar] [CrossRef]
- Chun, J.A.; Lim, C.; Kim, D.; Kim, J.S. Assessing impacts of climate change and sea-level rise on seawater intrusion in a coastal aquifer. Water 2018, 10, 357. [Google Scholar] [CrossRef]
- Van Vliet, M.T.H.; Zwolsman, J.J.G. Impact of summer droughts on the water quality of the Meuse river. J. Hydrol. 2008, 353, 1–17. [Google Scholar] [CrossRef]
- Chunn, D.; Faramarzi, M.; Smerdon, B.; Alessi, D.S. Application of an integrated SWAT–MODFLOW Model to evaluate potential impacts of climate change and water withdrawals on groundwater–surface water interactions in West–Central Alberta. Water 2019, 11, 110. [Google Scholar] [CrossRef]
- Ruiz-García, A.; Feo-García, J. Estimation of maximum water recovery in RO desalination for different feedwater inorganic compositions. Desalin. Water Treat. 2017, 70, 34–45. [Google Scholar] [CrossRef]
- Custodio, E. Low permeability volcanics in the Canary Islands (Spain). In Proceedings of the International Congress on Hydrology of Rocks of Low Permeability, Tucson, AZ, USA, 7–12 January 1985. [Google Scholar]
- Custodio, E.; del Carmen Cabrera, M.; Poncela, R.; Puga, L.-O.; Skupien, E.; del Villar, A. Groundwater intensive exploitation and mining in Gran Canaria and Tenerife, Canary Islands, Spain: Hydrogeological, environmental, economic and social aspects. Sci. Total Environ. 2016, 557–558, 425–437. [Google Scholar] [CrossRef] [PubMed]
- Guerra Marrero, J.L. The market of the water in Canarias. In Underground Waters and Urban Supply (El Mercado del Agua en Canarias. Aguas Subterráneas y Abastecimiento Urbano); Geological and Mining Institute of Spain (IGME): Madrid, Spain, 2000. (In Spanish) [Google Scholar]
- Spanish Statistical Office (INE). Review of the Municipal Register of Inhabitants (Revisión del Padrón Municipal de Habitantes); Spanish Statistical Office (INE): Madrid, Spain, 2017. [Google Scholar]
- IGME. ITGE Geological Map of Spain, Island of Gran Canaria (Mapa Geológico de España, Isla de Gran Canaria); Geological and Mining Institute of Spain (IGME): Madrid, Spain, 1992. [Google Scholar]
- Herrera, C. Use of the relationship Cl/Br like tracer hydrogeochemical in underground hydrology (Utilización de la relación Cl-Br como trazador hidroquímico en hidrología subterránea). Bol. Geol. Min. 2000, 111, 49–68. [Google Scholar]
- Lomoschitz, A.; Meco, J.; Corominas, J. The Barranco de Tirajana basin, Gran Canaria (Spain). A major erosive landform caused by large landslides. Geomorphology 2002, 42, 117–130. [Google Scholar] [CrossRef]
- Rosen, M.R. Sedimentologic and geochemical constraints on the evolution of Bristol Dry Lake Basin, California, U.S.A. Palaeogeogr. Palaeoclimatol. Palaeoecol. 1991, 84, 229–257. [Google Scholar] [CrossRef]
- Nurmi, P.A.; Kukkonen, I.T.; Lahermo, P.W. Geochemistry and origin of saline groundwaters in the Fennoscandian Shield. Appl. Geochem. 1988, 3, 185–203. [Google Scholar] [CrossRef]
- Nishri, A.; Stiller, M.; Rimmer, A.; Geifman, Y.; Krom, M. Lake Kinneret (The Sea of Galilee): The effects of diversion of external salinity sources and the probable chemical composition of the internal salinity sources. Chem. Geol. 1999, 158, 37–52. [Google Scholar] [CrossRef]
- Al-Bassam, A.M.; Al-Rumikhani, Y.A. Integrated hydrochemical method of water quality assessment for irrigation in arid areas: Application to the Jilh aquifer, Saudi Arabia. J. Afr. Earth Sci. 2003, 36, 345–356. [Google Scholar] [CrossRef]
- Mallick, J.; Singh, C.K.; AlMesfer, M.K.; Kumar, A.; Khan, R.A.; Islam, S.; Rahman, A. Hydro-geochemical assessment of groundwater quality in Aseer Region, Saudi Arabia. Water 2018, 10, 1847. [Google Scholar] [CrossRef]
- Hadi, K.M.B. Evaluation of the suitability of groundwater quality for reverse osmosis desalination. Desalination 2002, 142, 209–219. [Google Scholar] [CrossRef]
- Minissale, A.; Magro, G.; Vaselli, O.; Verrucchi, C.; Perticone, I. Geochemistry of water and gas discharges from the Mt. Amiata silicic complex and surrounding areas (central Italy). J. Volcanol. Geotherm. Res. 1997, 79, 223–251. [Google Scholar] [CrossRef]
- Yang, N.; Wang, G.; Shi, Z.; Zhao, D.; Jiang, W.; Guo, L.; Liao, F.; Zhou, P. Application of multiple approaches to investigate the hydrochemistry evolution of groundwater in an arid region: Nomhon, Northwestern China. Water 2018, 10, 1667. [Google Scholar] [CrossRef]
- Aleem, M.; Shun, C.J.; Li, C.; Aslam, A.M.; Yang, W.; Nawaz, M.I.; Ahmed, W.S.; Buttar, N.A. Evaluation of groundwater quality in the vicinity of Khurrianwala Industrial Zone, Pakistan. Water 2018, 10, 1321. [Google Scholar] [CrossRef]
- Galy, A.; France-Lanord, C. Weathering processes in the Ganges–Brahmaputra basin and the riverine alkalinity budget. Chem. Geol. 1999, 159, 31–60. [Google Scholar] [CrossRef]
- Cendrero, A.; Sánchez, J.; Antolin, C.; Arnal, S.; Diaz de Terán, J.R.; Francés, E.; Martínez, V.; Moiunõ, M.; Nieto, M.; Nogales, I.; et al. Geoscientific maps for planning in semi–arid regions: Valencia and Gran Canaria, Spain. Eng. Geol. 1990, 29, 291–319. [Google Scholar] [CrossRef]
- Cruz-Fuentes, T.; Cabrera Mdel, C.; Heredia, J.; Custodio, E. Groundwater salinity and hydrochemical processes in the volcano–sedimentary aquifer of La Aldea, Gran Canaria, Canary Islands, Spain. Sci. Total Environ. 2014, 484, 154–166. [Google Scholar] [CrossRef]
- Consejo Insular de Aguas de Gran Canaria. Hydrological Plan of Gran Canaria; Consejo Insular de Aguas de Gran Canaria: Gran Canaria, Spain, 2010. [Google Scholar]
- Ruiz-García, A.; Feo-García, J. Antiscalant cost and maximum water recovery in reverse osmosis for different inorganic composition of groundwater. Desalin. Water Treat. 2017, 73, 46–53. [Google Scholar] [CrossRef]
- Gasparini, A. Hydrochimie et Géochimie Isotopique de Circulations Souterraines en Milieu Volcanique sous Climat Semi–Aride (Grande Canarie, Iles Canaries). Ph.D. Thesis, Université de Paris Sud., Paris, France, 1989. (In French). [Google Scholar]
- Naranjo, G.; Cruz–Fuentes, T.; Cabrera, D.M.; Custodio, E. Estimating natural recharge by means of chloride mass balance in a volcanic aquifer: Northeastern Gran Canaria (Canary Islands, Spain). Water 2015, 7, 2555–2574. [Google Scholar] [CrossRef]
- Custodio, E.; Badiella, P. Partial Report of Amurga–1 (Informe Parcial Amurga–1. Evaluación de datos de Bombeo de los Pozos de Amurga). Private report. 1990. (In Spanish) [Google Scholar]
- Custodio, E.C.J. Partial Report of Amurga–2 (Informe Parcial Amurga–2. Recopilación y Síntesis de los datos Químicos de los Pozos de Amurga). Private report. 1993. (In Spanish) [Google Scholar]
- Gonfiantini, R.; Simonot, M. Isotopic investigation of groundwater in the Cul–de–Sac Plain, Haiti. In Isotope Techniques in Water Resources Development; International Atomic Energy Agency: Vienna, Austria, 1987; Available online: https://inis.iaea.org/collection/NCLCollectionStore/_Public/19/054/19054614.pdf?r=1&r=1. (accessed on 10 April 2019).
- Lloyd, J.W.; Miles, J.C. An examination of the mechanisms controlling groundwater gradients in hyper–arid regional sedimentary basins1. JAWRA J. Am. Water Resour. Assoc. 1986, 22, 471–478. [Google Scholar] [CrossRef]
- Gasparini, A.; Custodio, E.; Fontes, J.-C.; Jimenez, J.; Nuñez, J. Exemple d′etude geochimique et isotopique de circulations aquiferes en terrain volcanique sous climat semi–aride (Amurga, Gran Canaria, Iles Canaries). J. Hydrol. 1990, 114, 61–91. (In French) [Google Scholar] [CrossRef]
- Consejo Insular de Aguas de Gran Canaria. Hydrological Plan of Gran Canaria; Consejo Insular de Aguas de Gran Canaria: Gran Canaria, Spain, 1999. [Google Scholar]
- Robins, N. Groundwater quality in Scotland: Major ion chemistry of the key groundwater bodies. Sci. Total Environ. 2002, 294, 41–56. [Google Scholar] [CrossRef]
- Piper, A.M. A graphic procedure in the geochemical interpretation of water–analyses. Eos Trans. Am. Geophys. Union 1944, 25, 914–928. [Google Scholar] [CrossRef]
- Hutchins, M.; SmithM, B.; Rawlins, B.; Lister, T. Temporal and spatial variability of stream waters in Wales, the Welsh borders and part of the West Midlands, UK—1. Major ion concentrations. Water Res. 1999, 33, 3479–3491. [Google Scholar] [CrossRef]
- Custodio, E.; Alcalá-García, F.J. The potential of the Cl/Br ratio as indicator of the origin of the salinity of the Spanish coastal aquifers (El potencial de la relación Cl/Br como indicador del origen de la salinidad de los acuíferos costeros españoles). In Coastal Aquifers Intrusion Technology, Mediterranean Countries; IGME: Madrid, Spain, 2003; pp. 401–412. [Google Scholar]
- Ministry of the Spanish Presidency RD 140/2003. Technical—Sanitarian Regulation for the Supply and the Quality Control of the potable waters (Reglamentación técnico–sanitaria para el abastecimiento y el control de calidad de las aguas potables); (80/778/CEE); 2003. Available online: https://www.boe.es/buscar/pdf/2003/BOE-A-2003-3596-consolidado.pdf (accessed on 10 April 2019).
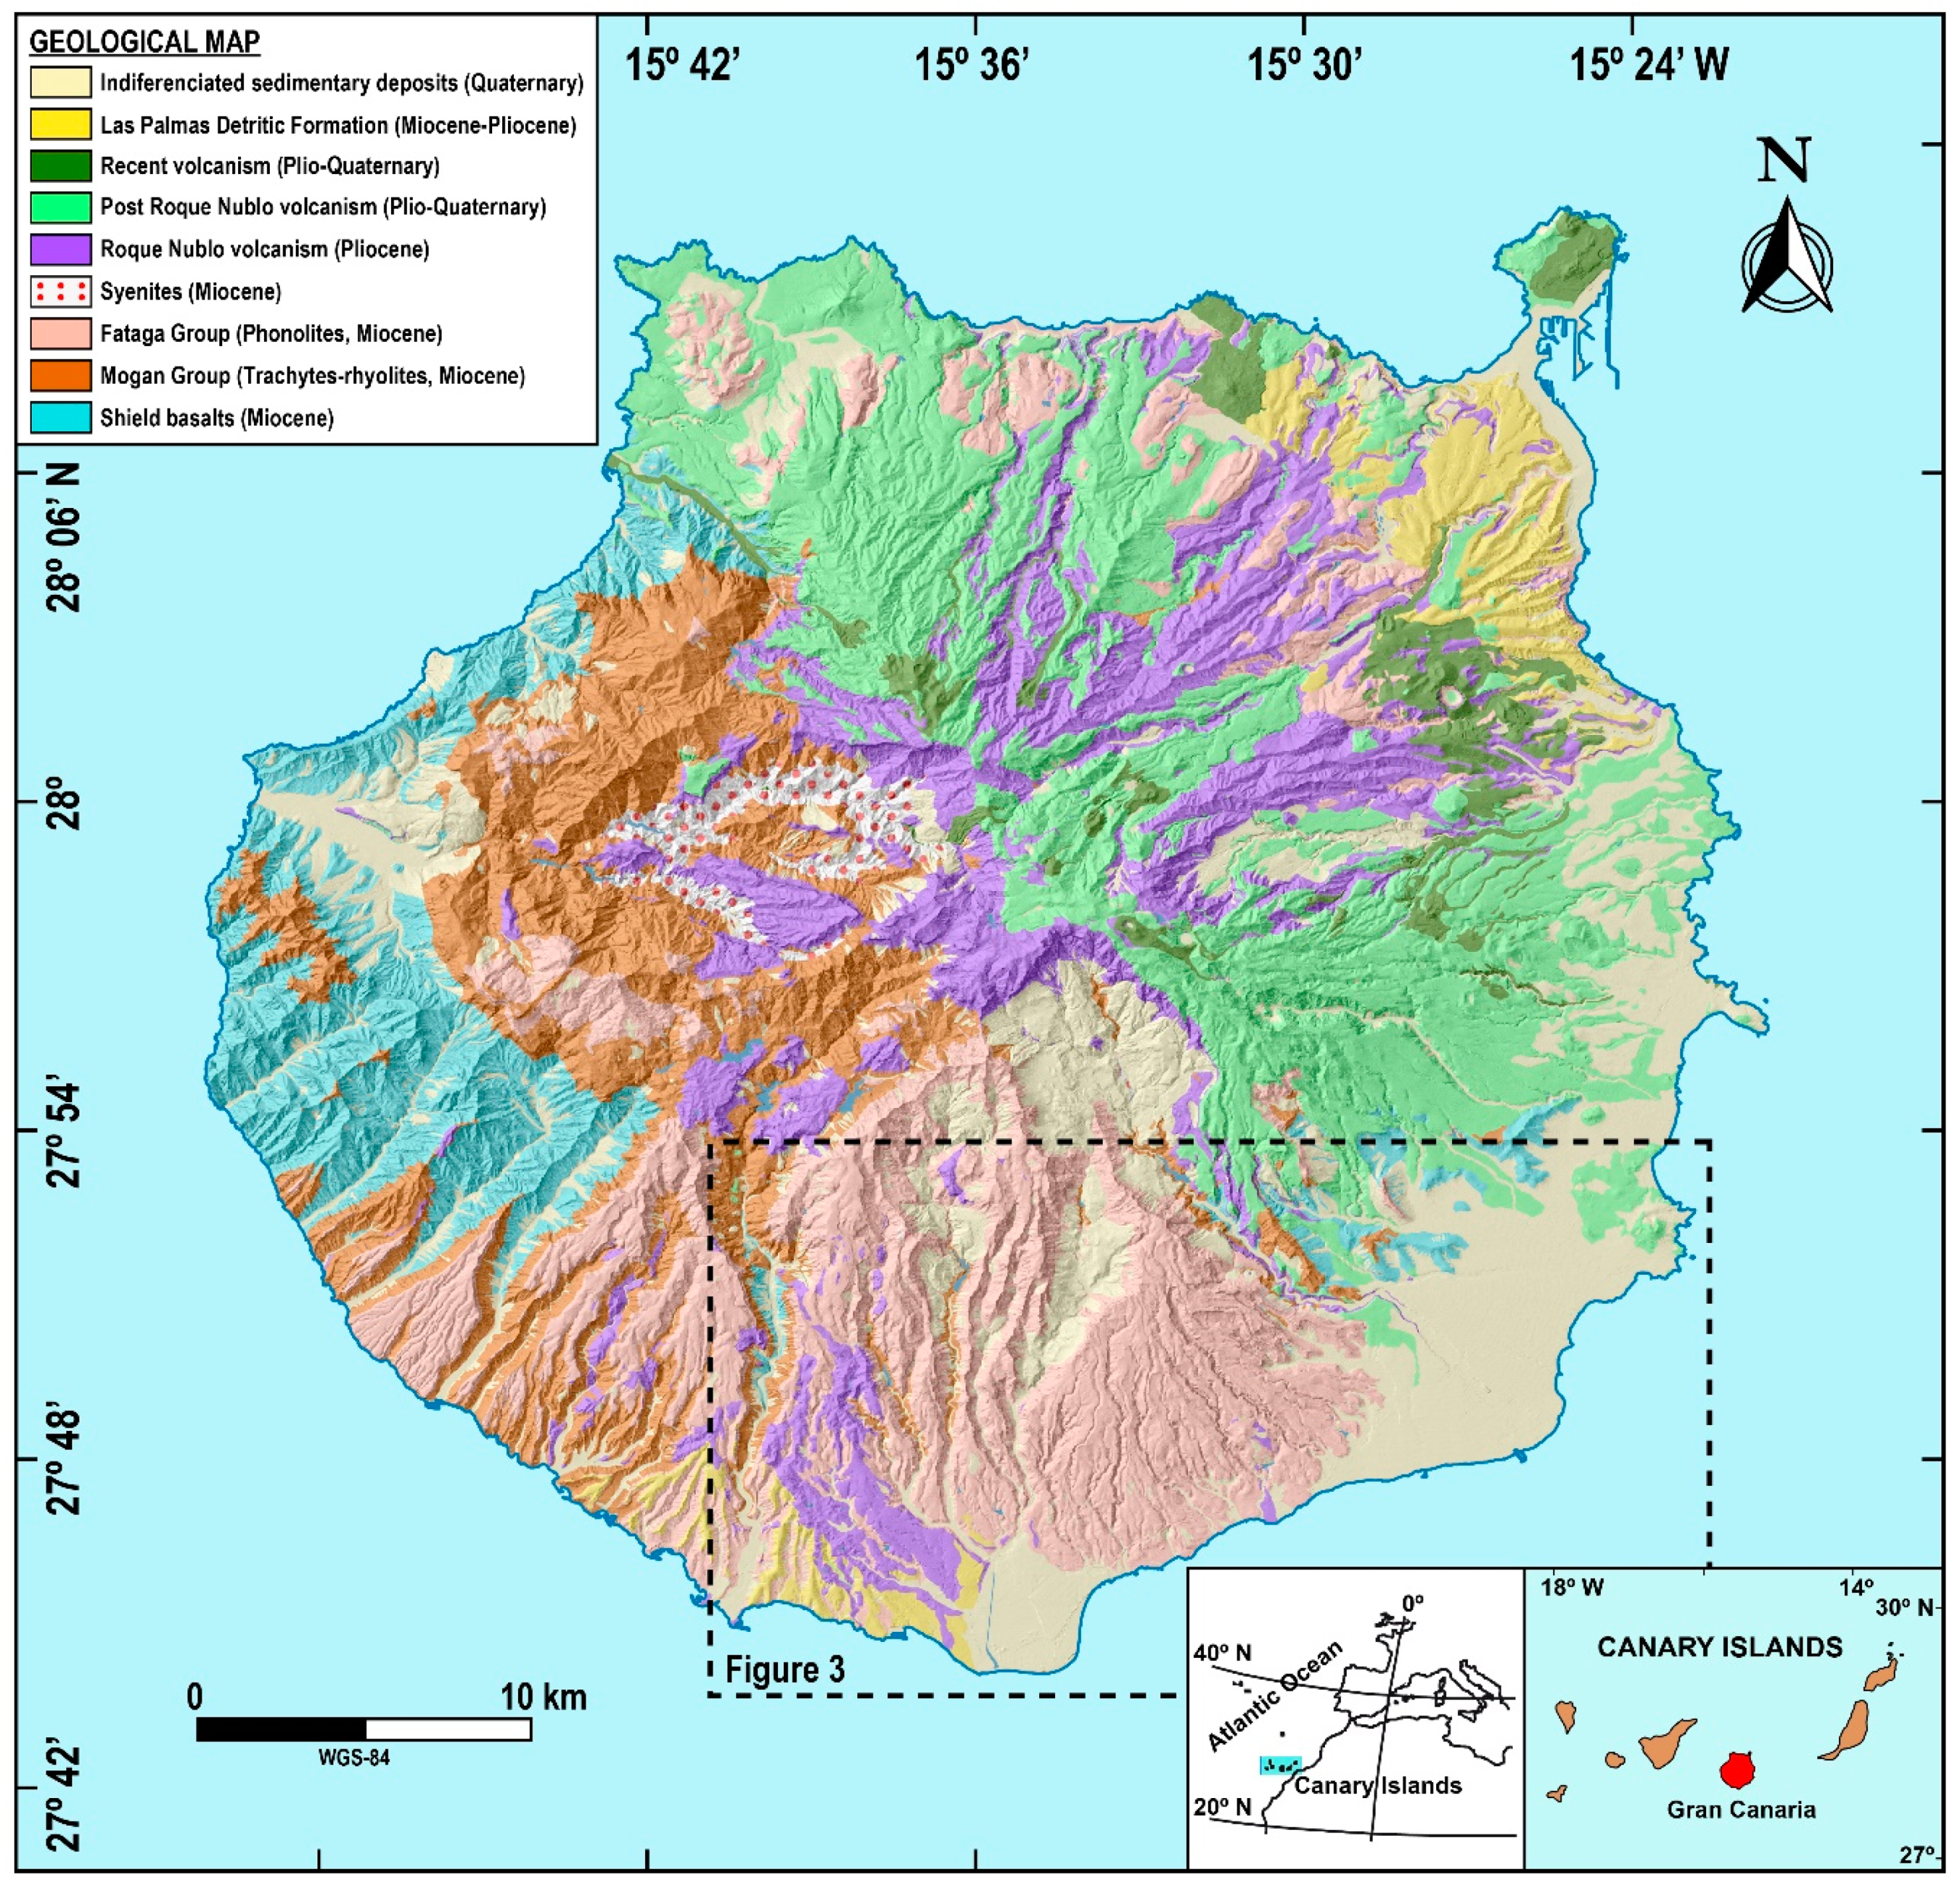
Figure 1.
Geographical location of the Canary Islands′ Archipelago, and map of the Island of Gran Canaria, showing in detail the geological structure of the various areas of the island and the region under study.
Figure 1.
Geographical location of the Canary Islands′ Archipelago, and map of the Island of Gran Canaria, showing in detail the geological structure of the various areas of the island and the region under study.

Figure 2.
Annual variation of some climate parameters in the Island of Gran Canaria averaged over a 30 year period (from 1980s to 2010s): (a) precipitation and evapotranspiration (ETP) values, as well as the minimum (min) effective precipitation values and the time intervals during which ETP exceeded rainfall and vice versa; (b) rainfall and temperature.

Figure 3.
Orography of the terrain in the area under study, and location of the 16 wells with regard to the two geological sections. Symbols in the legend allow distinction to be made between those wells directly located on a given cross-section, and those occurring in their proximity.
Figure 3.
Orography of the terrain in the area under study, and location of the 16 wells with regard to the two geological sections. Symbols in the legend allow distinction to be made between those wells directly located on a given cross-section, and those occurring in their proximity.

Figure 4.
Piper diagram for the 16 wells under monitoring.

Figure 5.
Piper diagram for the wells with Type II water.

Figure 6.
Piper diagram for the wells with Type I water.

Figure 7.
Variation in the average concentration of nitrates and silica among the 16 wells monitored.
Figure 7.
Variation in the average concentration of nitrates and silica among the 16 wells monitored.

Figure 8.
Time evolution in the levels of nitrates in waters from wells 10–14, and 16, over the five year test period.
Figure 8.
Time evolution in the levels of nitrates in waters from wells 10–14, and 16, over the five year test period.

Figure 9.
Schoeller diagram corresponding to Type I wells.

Figure 10.
Schoeller diagram corresponding to Type II wells.


Table 1.
Localization of the groundwater wells.
| Well | Latitude | Longitude | Elevation (m a.s.l.) |
|---|---|---|---|
| 1 | 27°50′52.04″ N | 15°29′00.20″ W | 160 |
| 2 | 27°47′51.71″ N | 15°40′08.14″ W | 85 |
| 3 | 27°48′14.66″ N | 15°40′06.16″ W | 85 |
| 4 | 27°48′44.62″ N | 15°39′54.10″ W | 85 |
| 5 | 27°49′40.05″ N | 15°39′42.20″ W | 115 |
| 6 | 27°49′58.37″ N | 15°29′39.63″ W | 140 |
| 7 | 27°48′38.86″ N | 15°28′39.77″ W | 40 |
| 8 | 27°50′06.72″ N | 15°28′37.08″ W | 125 |
| 9 | 27°49′06.21″ N | 15°27′28.87″ W | 60 |
| 10 | 27°48′21.88″ N | 15°28′17.50″ W | 25 |
| 11 | 27°49′37.22″ N | 15°27′45.85″ W | 90 |
| 12 | 27°49′11.25″ N | 15°27′56.59″ W | 65 |
| 13 | 27°49′42.04″ N | 15°27′12.67″ W | 65 |
| 14 | 27°50′29.97″ N | 15°28′02.16″ W | 115 |
| 15 | 27°50′40.38″ N | 15°27′59.46″ W | 120 |
| 16 | 27°49′15.14″ N | 15°26′50.37″ W | 45 |
Table 2.
Special requirements taken into account when taking the samples on the basis of the type of parameter to be analyzed. The type of container used is specified, as well as the method and maximum storage time.
Table 2.
Special requirements taken into account when taking the samples on the basis of the type of parameter to be analyzed. The type of container used is specified, as well as the method and maximum storage time.
| Parameter | Container 1 | Conservation of the Sample | Max. Time for Analysis | Norm |
|---|---|---|---|---|
| Conductivity | P, G | Refrigeration 2–5 °C | 28 days | (ISO 7888, 1985) |
| pH | P, G | Directly analysis | 2 h | (APHA–AWWA–WPCF, 1992i) |
| Bicarbonates | Refrigeration 2–5 °C | 14 days | (ISO 9963–1, 1996) | |
| Alkalinity (TAC) | P, G | Refrigeration 2–5 °C | 24 h | (ISO 9963–1, 1996) |
| Sulfates | P, G | Refrigeration 2–5 °C | 28 days | (APHA–AWWA–WPCF, 1992m) |
| Nitrates | P, G | Refrigeration 2–5 °C | 48 h | (APHA–AWWA–WPCF, 1992k) |
| Calcium | P, G | Refrigeration 2–5 °C | 6 months | (APHA–AWWA–WPCF, 1992d) |
| Magnesium | P, G | Refrigeration 2–5 °C | 24 h | (APHA–AWWA–WPCF, 1992c) |
| TDS | P, G | Refrigeration 2–5 °C | 2–7 days | (APHA–AWWA–WPCF, 1992c) |
| Chlorides | P, G | Refrigeration 2–5 °C | 24 h | (APHA–AWWA–WPCF, 1992h) |
| Sodium | P, G | Refrigeration 2–5 °C | 6 months | (APHA–AWWA–WPCF, 1992g) |
| Potassium | P, G | Refrigeration 2–5 °C | 6 months | (APHA–AWWA–WPCF, 1992f) |
| Silica | P | Refrigeration, no freeze | 28 days | (APHA–AWWA–WPCF, 1992l) |
1 P is Polyethylene and G is Glass.
Table 3.
Types of water genetic classification according to the Sulin system [23].
Table 3.
Types of water genetic classification according to the Sulin system [23].
| Type of Water | Na/Cl | (Na-Cl)/SO4 | (Cl-Na)/Mg |
|---|---|---|---|
| Chloride-calcium | <1 | <0 | >1 |
| Chloride-magnesium | <1 | <0 | <1 |
| Sodium-bicarbonate | >1 | >1 | <0 |
| Sodium-sulfate | >1 | <1 | <0 |
Table 4.
Average concentration of prevailing ions (mg/L) and their rates (minimum and maximum values between brackets).
Table 4.
Average concentration of prevailing ions (mg/L) and their rates (minimum and maximum values between brackets).
| Well ID n° | HCO3 | SO4 | Cl | NO3 | Ca | Mg | Na | K | SiO2 |
|---|---|---|---|---|---|---|---|---|---|
| 1 | 191 (92–305) | 191 (148–323) | 2519 (1715–3362) | 5.14 (1–9.6) | 529 (368–783) | 389 (264–483) | 483 (257–830) | 37.7 (17–85) | 48.7 (30–65) |
| 2 | 168 (91–336) | 96.9 (59–194) | 500 (325–600) | 4.17 (1.4–8.2) | 56.5 (37.5–79) | 41.3 (13.2–52) | 318 (195–595) | 19.5 (8.8–27) | 45.2 (14.8–54.2) |
| 3 | 157 (88–290) | 74.0 (42–122) | 445 (344–532) | 4.43 (1.5–8) | 65.0 (40–90) | 50.2 (41–81) | 214 (163–268) | 15.4 (12–22) | 45.5 (29.8–64.5) |
| 4 | 212 (107–365) | 70.9 (24–131) | 374 (328–450) | 3.89 (1.3–6.2) | 60.9 (53–78) | 41.0 (17–77) | 215 (152–263) | 13.6 (10–18) | 40.2 (20.4–47) |
| 5 | 96.2 (55–161) | 128 (58–208) | 662 (510–781) | 4.67 (1.7–8.05) | 81.4 (70–128) | 52.9 (26–106) | 330 (250–425) | 15.8 (11–21) | 31.2 (17–36) |
| 6 | 288 (150–368) | 40.2 (24–84) | 216 (170–270) | 3.84 (1.1–10.9) | 47.1 (28–66.9) | 40.0 (21–51) | 143 (97–175) | 11.0 (8.2–15) | 80.1 (47–94) |
| 7 | 247 (146–344) | 132 (77–217) | 555 (376–669) | 6.37 (0.16–12.8) | 79 (59–113) | 73.4 (43–167) | 289 (200–365) | 16.5 (10–22) | 39.5 (18.5–45) |
| 8 | 242 (66–479) | 82.7 (39–195) | 371 (240–683) | 8.41 (1.3–24.6) | 63.0 (45–112) | 50.5 (40–62) | 210 (148–355) | 13.1 (9.9–20) | 41.5 (23–64.4) |
| 9 | 229 (128–315) | 58.2 (28–124) | 251 (125–325) | 6.95 (1.3–13) | 46.2 (35–66) | 37.5 (29–45) | 161 (120–190) | 11.36 (8.2–15) | 39.1 (19.1–92) |
| 10 | 211 (91.5–280) | 176 (115–481) | 497 (205–975) | 21.3 (1–73.9) | 95.2 (59–128) | 64.9 (25–115) | 269 (172–449) | 18.4 (11.7–24) | 34.6 (25–67) |
| 11 | 195 (70–286) | 125 (70–341) | 304 (191–806) | 15.4 (1.3–47.7) | 27.8 (5–90.4) | 33.9 (14–72.8) | 246 (147–617) | 16.4 (9.4–23) | 27.9 (12.6–65) |
| 12 | 296 (128–480) | 169 (53–696) | 536 (161–1377) | 26.0 (1.2–189) | 49.2 (27–136) | 56.4 (24.8–152) | 365 (116–788) | 17.5 (9–25) | 25.5 (14.1–30) |
| 13 | 305 (174–416) | 446 (240–750) | 2,129 (1377–4200) | 42.4 (1.7–189) | 349 (136–1090) | 284 (148–709) | 774 (500–1150) | 33.5 (23–50) | 31.9 (13–48) |
| 14 | 233 (134–342) | 342 (42–932) | 2999 (459–4100) | 14.8 (0.3–167) | 581 (117–783) | 477 (73.7–821) | 662 (122–1040) | 39.1 (10–53) | 46.2 (14.2–54.3) |
| 15 | 212 (104–332) | 389 (249–760) | 3533 (368–4154) | 5.32 (0.4–17) | 644 (450–1109) | 601 (347–695) | 804 (408–1150) | 51.4 (11–92) | 44.9 (26.9–52) |
| 16 | 202 (107–562) | 573 (137–860) | 2851 (676–3830) | 43.0 (0.4–117) | 697 (171–1182) | 435 (116–665) | 572 (142–1660) | 41.1 (10–59) | 38 (16.2–62) |
Table 5.
Average of carbonate, iron and physical parameters and quality grades (minimum and maximum values between brackets).
Table 5.
Average of carbonate, iron and physical parameters and quality grades (minimum and maximum values between brackets).
| Well ID n° | CO3 | Fe | pH | Cond (µS/cm) | Salinity (mg/L) | TDS | SAR | Langelier-Hoover Index |
|---|---|---|---|---|---|---|---|---|
| 1 | 0.42 (0–9.3) | 0.32 (0.08–1.22) | 7.32 (6.94–8.18) | 7716 (5590–8770) | 4400 (3600–4800) | 4676 (2900–6766) | 3.69 (2.4–6.3) | 0.59 Incrust |
| 2 | 0.70 (0–9.2) | 0.22 (0.04–0.90) | 7.78 (7.5–8.4) | 2128 (152–2,640) | 1180 (941–1385) | 1183 (846–1498) | 7.45 (4.9–9.7) | 0.66 Incrust |
| 3 | 0.53 (0–6.5) | 0.12 (0.04–0.50) | 7.73 (7–8.02) | 1906 (1695–2230) | 945 (844–1138) | 1005 (780–415) | 4.62 (0.4–7.6) | 0.64 Incrust |
| 4 | 0.18 (0–4.3) | 0.21 (0.02–1.58) | 7.69 (7.48–8) | 1810 (1581–2729) | 913 (786–1437) | 946 (750–1163) | 5.25 (3.8–6.9) | 0.74 Incrust |
| 5 | 0.85 (0–9.4) | 1.04 (0.02–15.90) | 7.87 (7.45–8.05) | 2708 (2,462–3090) | 1436 (1277–1654) | 1330 (1055–1891) | 7.13 (5.3–10.8) | 0.68 Incrust |
| 6 | 0.96 (0–22) | 0.15 (0.04–0.57) | 7.27 (7–7.73) | 1314 (1,095–1581) | 645 (538–786) | 748 (550–872) | 3.75 (2.7–6) | 0.27 Incrust |
| 7 | 1.28 (0–30.8) | 0.18 (0.05–0.60) | 7.44 (7.13–7.7) | 2569 (1680–2950) | 1343 (837–1,570) | 1378 (100–1831) | 5.73 (3–8.1) | 0.56 Incrust |
| 8 | 0.48 (0–11.4) | 0.65 (0.03–11.40) | 7.89 (7.32–8.2) | 1750 (1450–2617) | 878 (719–1370) | 977 (800–1346) | 4.83 (3.4–7.8) | 0.44 Incrust |
| 9 | - | 0.18 (0.02–0.58) | 7.57 (7.17–8.22) | 1334 (800–1958) | 660 (389–979) | 757 (610–1010) | 4.11 (2–5.6) | 0.56 Incrust |
| 10 | 0.51 (0–12.2) | 1.69 (0.05–15.70) | 7.75 (7.42–8) | 2339 (1300–3870) | 1167 (643–1,589) | 1322 (974–2256) | 5.28 (3.75–6.7) | 0.98 Incrust |
| 11 | 20.4 (0–100) | 4.41 (0.07–93) | 8.80 (7.76–9.85) | 1659 (900–3810) | 724 (535–913) | 900 (530–2204) | 7.71 (3.6–15.3) | 1.65 Incrust |
| 12 | 2.95 (0–19) | 0.16 (0.03–0.70) | 7.96 (7.63–8.23) | 2409 (1151–5760) | 1098 (567–1330) | 1356 (510–3548) | 8.92 (3.8–12.8) | 1.03 Incrust |
| 13 | 0.89 (0–21.4) | 0.19 (0.03–0.69) | 7.51 (7.1–8) | 6599 (2500–8750) | 3630 (1300–4775) | 4357 (3,100–8845) | 8.58 (3.8–14.2) | 0.78 Incrust |
| 14 | - | 0.56 (0.05–6.90) | 7.25 (6.9–7.91) | 9680 (1715–11,620) | 5735 (4720–6391) | 5486 (1182–8384) | 5.11 (2.49–15) | 0.66 Incrust |
| 15 | - | 0.27 (0.04–1.32) | 7.19 (7–7.78) | 11762 (7250–13,410) | 7868 (5736–8646) | 6732 (3904–10,299) | 5.50 (3–8.3) | 0.64 Incrust |
| 16 | - | 0.26 (0.05–1.90) | 7.2 (6.9–8.04) | 9862 (1917–13,350) | 5810 (958–8610) | 5867 (514–11,135) | 4.44 (2.3–13.7) | 0.55 Incrust |
Table 6.
Maximum admissible levels of concentrations of the various parameters tested in a drinkable water in accordance with [44].
Table 6.
Maximum admissible levels of concentrations of the various parameters tested in a drinkable water in accordance with [44].
| Parameter | Unit | Maximum Level |
|---|---|---|
| Calcium | mg/L Ca | - |
| Chloride | mg/L Cl– | 250 |
| Sulfate | mg/L SO4 | 250 |
| Nitrite | mg/L NO2– | 0.1 |
| Nitrate | mg/L NO3– | 50 |
| pH | - | 6.5–9.5 |
| Potassium | mg/L K | 12 |
| Magnesium | mg/L Mg | 50 |
| Sodium | mg/L Na | 150 |
| Conductivity | µS/cm | 2500 |
| TDS | mg/L | 1500 |
| Langelier-Hoover index | - | ±0.5 |
© 2019 by the authors. Licensee MDPI, Basel, Switzerland. This article is an open access article distributed under the terms and conditions of the Creative Commons Attribution (CC BY) license (http://creativecommons.org/licenses/by/4.0/).
Share and Cite
MDPI and ACS Style
Ruiz-García, A.; Carrascosa-Chisvert, M.D.; Mena, V.; Souto, R.M.; Santana, J.J.; Nuez, I. Groundwater Quality Assessment in a Volcanic Mountain Range (South of Gran Canaria Island, Spain). Water 2019, 11, 754. https://doi.org/10.3390/w11040754
AMA Style
Ruiz-García A, Carrascosa-Chisvert MD, Mena V, Souto RM, Santana JJ, Nuez I. Groundwater Quality Assessment in a Volcanic Mountain Range (South of Gran Canaria Island, Spain). Water. 2019; 11(4):754. https://doi.org/10.3390/w11040754
Chicago/Turabian StyleRuiz-García, A., M.D. Carrascosa-Chisvert, V. Mena, R.M. Souto, J.J. Santana, and I. Nuez. 2019. "Groundwater Quality Assessment in a Volcanic Mountain Range (South of Gran Canaria Island, Spain)" Water 11, no. 4: 754. https://doi.org/10.3390/w11040754
Note that from the first issue of 2016, this journal uses article numbers instead of page numbers. See further details here.