Residential Flood Loss Assessment and Risk Mapping from High-Resolution Simulation
by
 , ,
, ,
Zulfahmi Afifi
1, 
Hone-Jay Chu
2,*,
Yen-Lien Kuo
3,
Yung-Chia Hsu
4,
Hock-Kiet Wong
5 and
Muhammad Zeeshan Ali
2 1
International Master Program on Natural Hazards Mitigation and Management, National Cheng Kung University, Tainan City 701, Taiwan
2
Department of Geomatics, National Cheng Kung University, Tainan City 701, Taiwan
3
Department of Economics, National Cheng Kung University, Tainan City 701, Taiwan
4
Hydrotech Research Institute, National Taiwan University, Taipei 10617, Taiwan
5
Department of Hydraulics and Ocean Engineering, National Cheng Kung University, Tainan City 701, Taiwan
*
Author to whom correspondence should be addressed.
Water 2019, 11(4), 751; https://doi.org/10.3390/w11040751
Submission received: 12 March 2019
/
Revised: 8 April 2019
/
Accepted: 8 April 2019
/
Published: 10 April 2019
(This article belongs to the Special Issue Recent Advances in the Assessment of Flood Risk in Urban Areas)
Abstract
:Since the patterns of residential buildings in the urban area are small-sized and dispersed, this study proposes a high-resolution flood loss and risk assessment model to analyze the direct loss and risk impacts caused by floods. The flood inundation simulation with a fine digital elevation model (DEM) provides detailed estimations of flood-inundated areas and their corresponding inundation depths during the 2016 Typhoon Megi and 2017 Typhoon Haitang. The flood loss assessment identifies the impacts of both events on residential areas. The depth-damage table from surveys in the impacted area was applied. Results indicated that the flood simulation with the depth-damage table is an effective way to assess the direct loss of a flood disaster. The study also showed the effects of spatial resolution on the residential loss. The results indicated that the low-resolution model easily caused the estimated error of loss in dispersed residential areas when compared with the high-resolution model. The analytic hierarchy process (AHP), as a multi-criteria decision-making method, was used to identify the weight factor for each vulnerability factor. The flood-vulnerable area was mapped using natural and social vulnerability factors, such as high-resolution DEM, distance to river, distance to fire station, and population density. Eventually, the flood risk map was derived from the vulnerability and flood hazard maps to present the risk level of the flood disaster in the residential areas.
1. Introduction
Floods are some of the most catastrophic natural disasters that include severe economic impacts, especially if floods happen in big cities around the world. In Taiwan, floods in the last 25 years have resulted in losses of $518 million USD. The flood losses are approximately 4.6 times the losses caused by fire damage [1]. Floods result in the exposure of many properties in residential areas to standing water. Inundation may cause structural damages, such as on wall linings, and property damage, including electronic devices [2]. Flood damages and losses can be broadly divided into two types: direct losses and indirect losses. Direct flood losses are those caused by the physical or structural impact of a flood event while indirect losses are not the direct economic losses of a flood. In the majority of damage estimation studies, losses are restricted to direct losses for each element [3]. The evaluation of flood loss is related to the use of damage functions from potential asset damaging [4]. However, flood loss is highly correlated to flood water depth. The depth-damage curve or table was created via a field survey of direct loss in a flood event in the flood loss model [5]. The loss assessment includes asset exposure, susceptibility to suffer damage, and damaging potential [6]. Moreover, flood risk was usually defined as the product of hazard e.g., probability of occurrence and vulnerability or estimated cost of foreseeable damage [7]. Risk assessment was generally measured as the expected loss degree of risk as a consequence of a hazardous event [8].
Flood loss and risk assessment have been determined through flood hazard data, i.e., spatial distribution of flood area, exceedance probability, and asset vulnerability data [6]. However, most flood information is only based on point discharge measurements at discrete locations without spatiotemporal information of flood inundation [9]. For the lack of sufficient depth measurements, we offer a flood loss and risk assessment that integrates 2D hydraulic model results and high-resolution digital elevation model (DEM) data, especially during the typhoon events. Considering the pattern of residential area in the urban area, the water depth of each residential area is more appropriate based on the high-resolution inundation simulation. A simulation-based flood loss and risk assessment can provide an effective way for the spatial estimation and visualization of flood loss and risk in potential flooding areas. Eventually, the impact of estimated loss or risk using a geographic information system (GIS) is practical for flood loss assessment and disaster management [4,5,10].
This study proposes a GIS-based high-resolution flood loss and risk assessment model to analyze the direct loss and risk impacts caused by a flood in a residential urban area. The model with fine grids provides a high-resolution estimation of a flood-inundated area and its corresponding loss and risk. The flood simulated water depths based on typhoon events during the 2016 Typhoon Megi and 2017 Typhoon Haitang were used in this research. The flood loss assessment identifies the impact of a simulated flood water depth in the residential area. The highest water depths in the simulation of the typhoon event were used to estimate the maximum loss in residential buildings. The depth-damage table of the impacted area was applied in our survey for flood loss assessment. In addition, risk is defined as the product of hazard e.g., high-resolution water depth and flood vulnerability. The flood-vulnerable area was mapped using natural and social vulnerability factors, such as distance from the river, distance to the fire station, elevation, and people density. The analytic hierarchy process (AHP) was used to acquire the weight factor of each vulnerability factor. A flood risk map was derived from the vulnerability and flood hazard maps to show the risk of the flood disaster.
2. Datasets and Methods
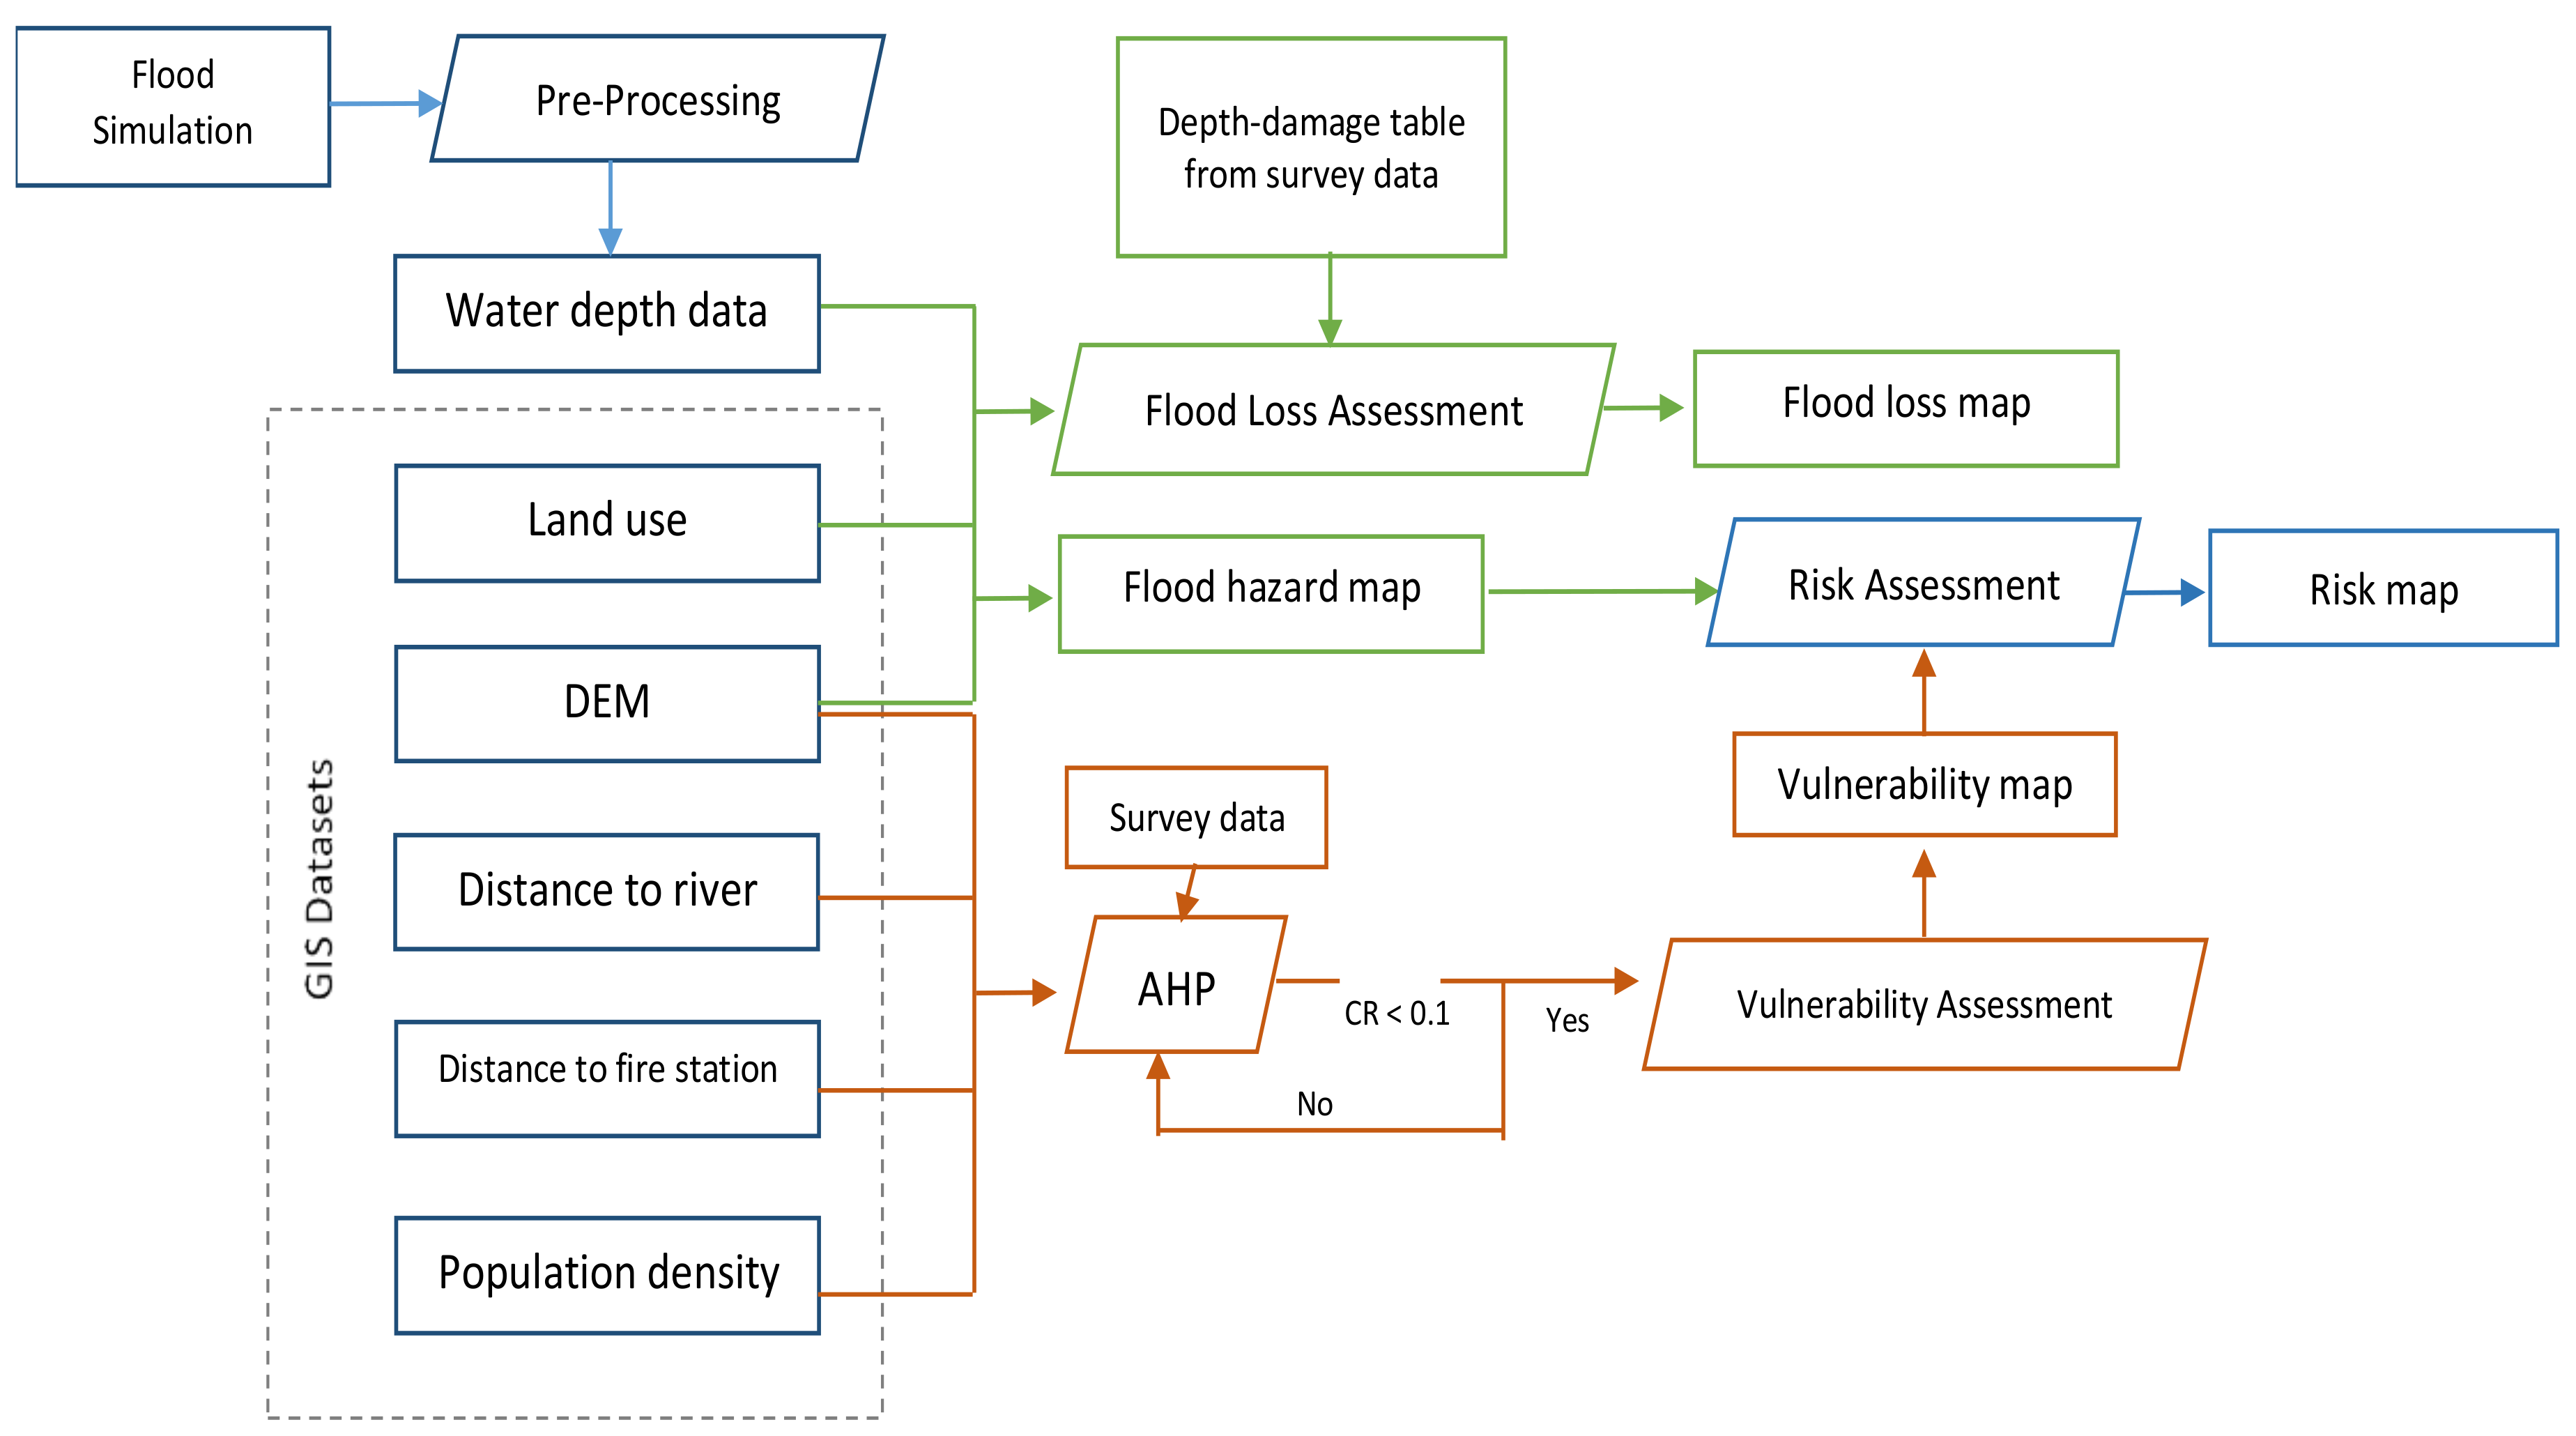
Figure 1 describes the process of each element in different colors. Each component represents the proposed material and method used to derive the results. The black and blue colors indicate the materials used in the beginning of the study. The current land use map was used to analyze the impact of the flood disasters on the residential area. The high-resolution (1 m resolution) DEM was used in this study. Water depth data were generated from the 3Di model [11]. The DEM, distance to river, distance to fire station, and population density were used as natural and social vulnerability factors. The green color indicates the process of deriving the flood loss and hazard map. The orange color indicates the process of generating the vulnerability map. The blue color indicates the process of deriving the risk map as the final step. A GIS model was also used to make the flood loss and risk process automatic. This model combined loss and risk functions and processes developed using Python. The proposed model enhances the applications with the purpose of flood loss and risk assessment by combining functions and data related to flood loss, hazard, and vulnerability (Figure 1).
2.1. Flood Model
The 3Di model was developed by Professor Stelling from TU Delft, Netherlands in 2010 [11]. The 3Di model combines four numerical methods including the subgrid method, bottom friction based on the concepts of roughness depth, the staggered-grid finite-volume method for shallow water equations with rapidly varying flows, and the quad-tree technique [12]. The 3Di model with sub-grid and quad-tree methods can handle a large number of computational grids with high-resolution topographic data [13]. The 3Di numerical method utilizes a finite volume. The method works by solving the 2D shallow water equations and combining the data through the quad-tree method. Such process increases the density of computational cells in important areas, such as urban areas, levees, and roads. It also ensures that the flow field will perform smoothly and reduces errors affected by the terrains. 3Di can efficiently perform under high-resolution terrain data. The integrated 3Di model consists of two main components including 2D and 1D-flow components. In the model simulation, 3Di uses 1D and 2D equations in terms of terrain conditions.
Compared with other inundation models, the most special part is the technique of the simulation cell in the 3Di model, such as the sub-grid and quad-tree methods. The sub-grid method works before starting a simulation, and it provides a series of temporary tables that contain the water volume–level relationship of each simulation cell and link during the simulation when a water level is being solved. Accordingly, we determine the volume of water that has changed between two adjacent cells. The quad-tree method is suitable for simulating high-resolution terrain data or a large simulation area. It has been widely used in inundation simulation or hydraulic calculation. This method can increase the flexibility of simulation cells and is efficient when used for simulation.
In this study, the high-resolution simulation model was based on the high-resolution DEM. The distributed rainfall data used in the 3Di flood simulation data were the Quantitative Precipitation Estimation and Segregation Using Multiple Sensors (QPESUMS). QPESUMS is the rainfall time series developed by the Central Weather Bureau, the Soil and Water Conservation Bureau, and the Water Resources Agency in 2002. This time series integrates radar, satellite, rain gauge station, and lightning observation data and is combined with the QPESUMS development. The size of QPESUMS rainfall data is 1.3 km × 1.3 km, and it collects rainfall data every 10 minutes. Observed water level data from two stations were used to validate the flood model data result. The gauging stations of the Wangliao Bridge and the Yanzi Bridge are located in the Yongkang District. The water level data will be updated every 10 min. Moreover, the simulated water levels and depths from the 3Di are the vector data in the form of quad-tree data of the water level in the study area. These data were then converted into raster data for the subsequent loss and risk assessment. The flood raster data were converted to different resolutions to determine the effects of differences in the resolution. The flood losses in using different spatial resolutions (1, 5, and 10 m) were compared in this study.
2.2. Loss Assessment
The flood loss assessment was calculated based on a direct assessment method of the impact of flooding on residential buildings. This assessment used the maximum water depth data of the flood simulation model from the 3Di model during the flood events and the depth-damage table from the field survey.
The depth-damage table was generated via the field survey in the flood area in the Rende District using the synthetic method [14]. Fourteen local residents joined the loss survey. The survey was conducted using a questionnaire given to residents in the flood disaster-prone areas. The table was generated from the survey results of the flooding areas, depths, and the losses in the residential area including furniture, clothes, electronic devices, and domestic appliances [14]. The survey data implied that no costs were incurred by the community in the disaster-prone area for the flood recovery work. The building recovery work and cleaning process were performed by the homeowners themselves and assisted by the government, such as firefighters and military personnel.
2.3. Risk Assessment
A flood risk map is useful for increasing the awareness of local communities, local authorities, and other organizations on flood risks. The determination of flood-risk areas is normally accomplished through a subjective method using vulnerability data and the water depth of flood, with the concept of risk itself interpreted in various ways. With a combination of the data hazard and vulnerability, the flood risk map was generated using automatic procedures. The flood risk was generated by multiplying the flood hazard map with the vulnerability map [15,16].
where is the risk map, is the flood hazard map, and is the flood vulnerability map. The maximum water depth of each typhoon event was determined from the flood simulation. Furthermore, the average water depth from two events were applied for the flood hazard map. In this study, the five-level risk map was generated for flood risk assessment.
2.4. Vulnerability Assessment
Flood vulnerability mapping is the process of determining the degree of susceptibility of a given place to flooding. Vulnerability is the most crucial component of risk since it determines whether exposure to a hazard constitutes a risk that may actually result in a disaster. Flood vulnerability can be obtained from the weighted product model. This flood vulnerability map will be combined with available vulnerability data in the study area.
where is the weight of the factor i (i.e., DEM, distance to river, distance to fire station, and population density) from the AHP. is the vulnerability map for factor i and n is the number of factors. The final result is a flood vulnerability map that has information on vulnerability levels ranging from very low to extreme levels.
The vulnerability factor data in this study include natural and social factors, such as the DEM, distance to river, distance to fire station, and population density. In Tainan, low-lying areas have a high vulnerability to the dangers of floods. The DEM data were used as one of the vulnerability factors in this study. Flood happens when rainwater exceeds the capacity of waterways or rivers. Distance to the river is also an important factor in the analysis of vulnerability to flooding. River line area data were also included to calculate vulnerability in terms of the distance of an area to river flow. Areas that are close to the river will tend to have a higher value of vulnerability than other areas located far away from the river. Distance to the river is determined through GIS. Moreover, fire stations in Tainan are considered the first agency that can handle emergencies during a disaster, including floods. A region that has a distance far from a fire station will have a higher vulnerability when a flood occurs than an area located close to the fire station. This vulnerability is interpreted as the first response to an emergency situation to prevent casualties and dangers that can cause losses due to flooding. People can acquire help from firefighters and military services. Thus, fire stations are critical facilities when considering the social vulnerability index [17]. In addition, population density is an important factor for vulnerability that must be considered. The Ministry of Interior Affairs provides the village-based population data. The polygon data are converted to a raster dataset through GIS.
2.5. AHP for Vulnerability Weight
The flood disaster vulnerability map was created by processing some of the available vulnerability factor data. A multi-criterion decision-making (MCDM) method was used to determine the importance of vulnerability factors from the vulnerability factor data. One of the MCDM methods used was the AHP. AHP is a semi-quantitative decision-making value judgment approach that fulfills the objectives of decision makers [18]. In this study, the AHP model [19] was used. The AHP continued until the obtained consistency ratio was less than 0.1.
Twenty participants were selected for the AHP survey. Among them, 40% were local students from the International Master Program on Natural Hazard Mitigation and Management Program, 50% were hydraulic engineering students, and 10% were social science students. The backgrounds of the participants were acquired to examine their various perspectives.
2.6. Study Area
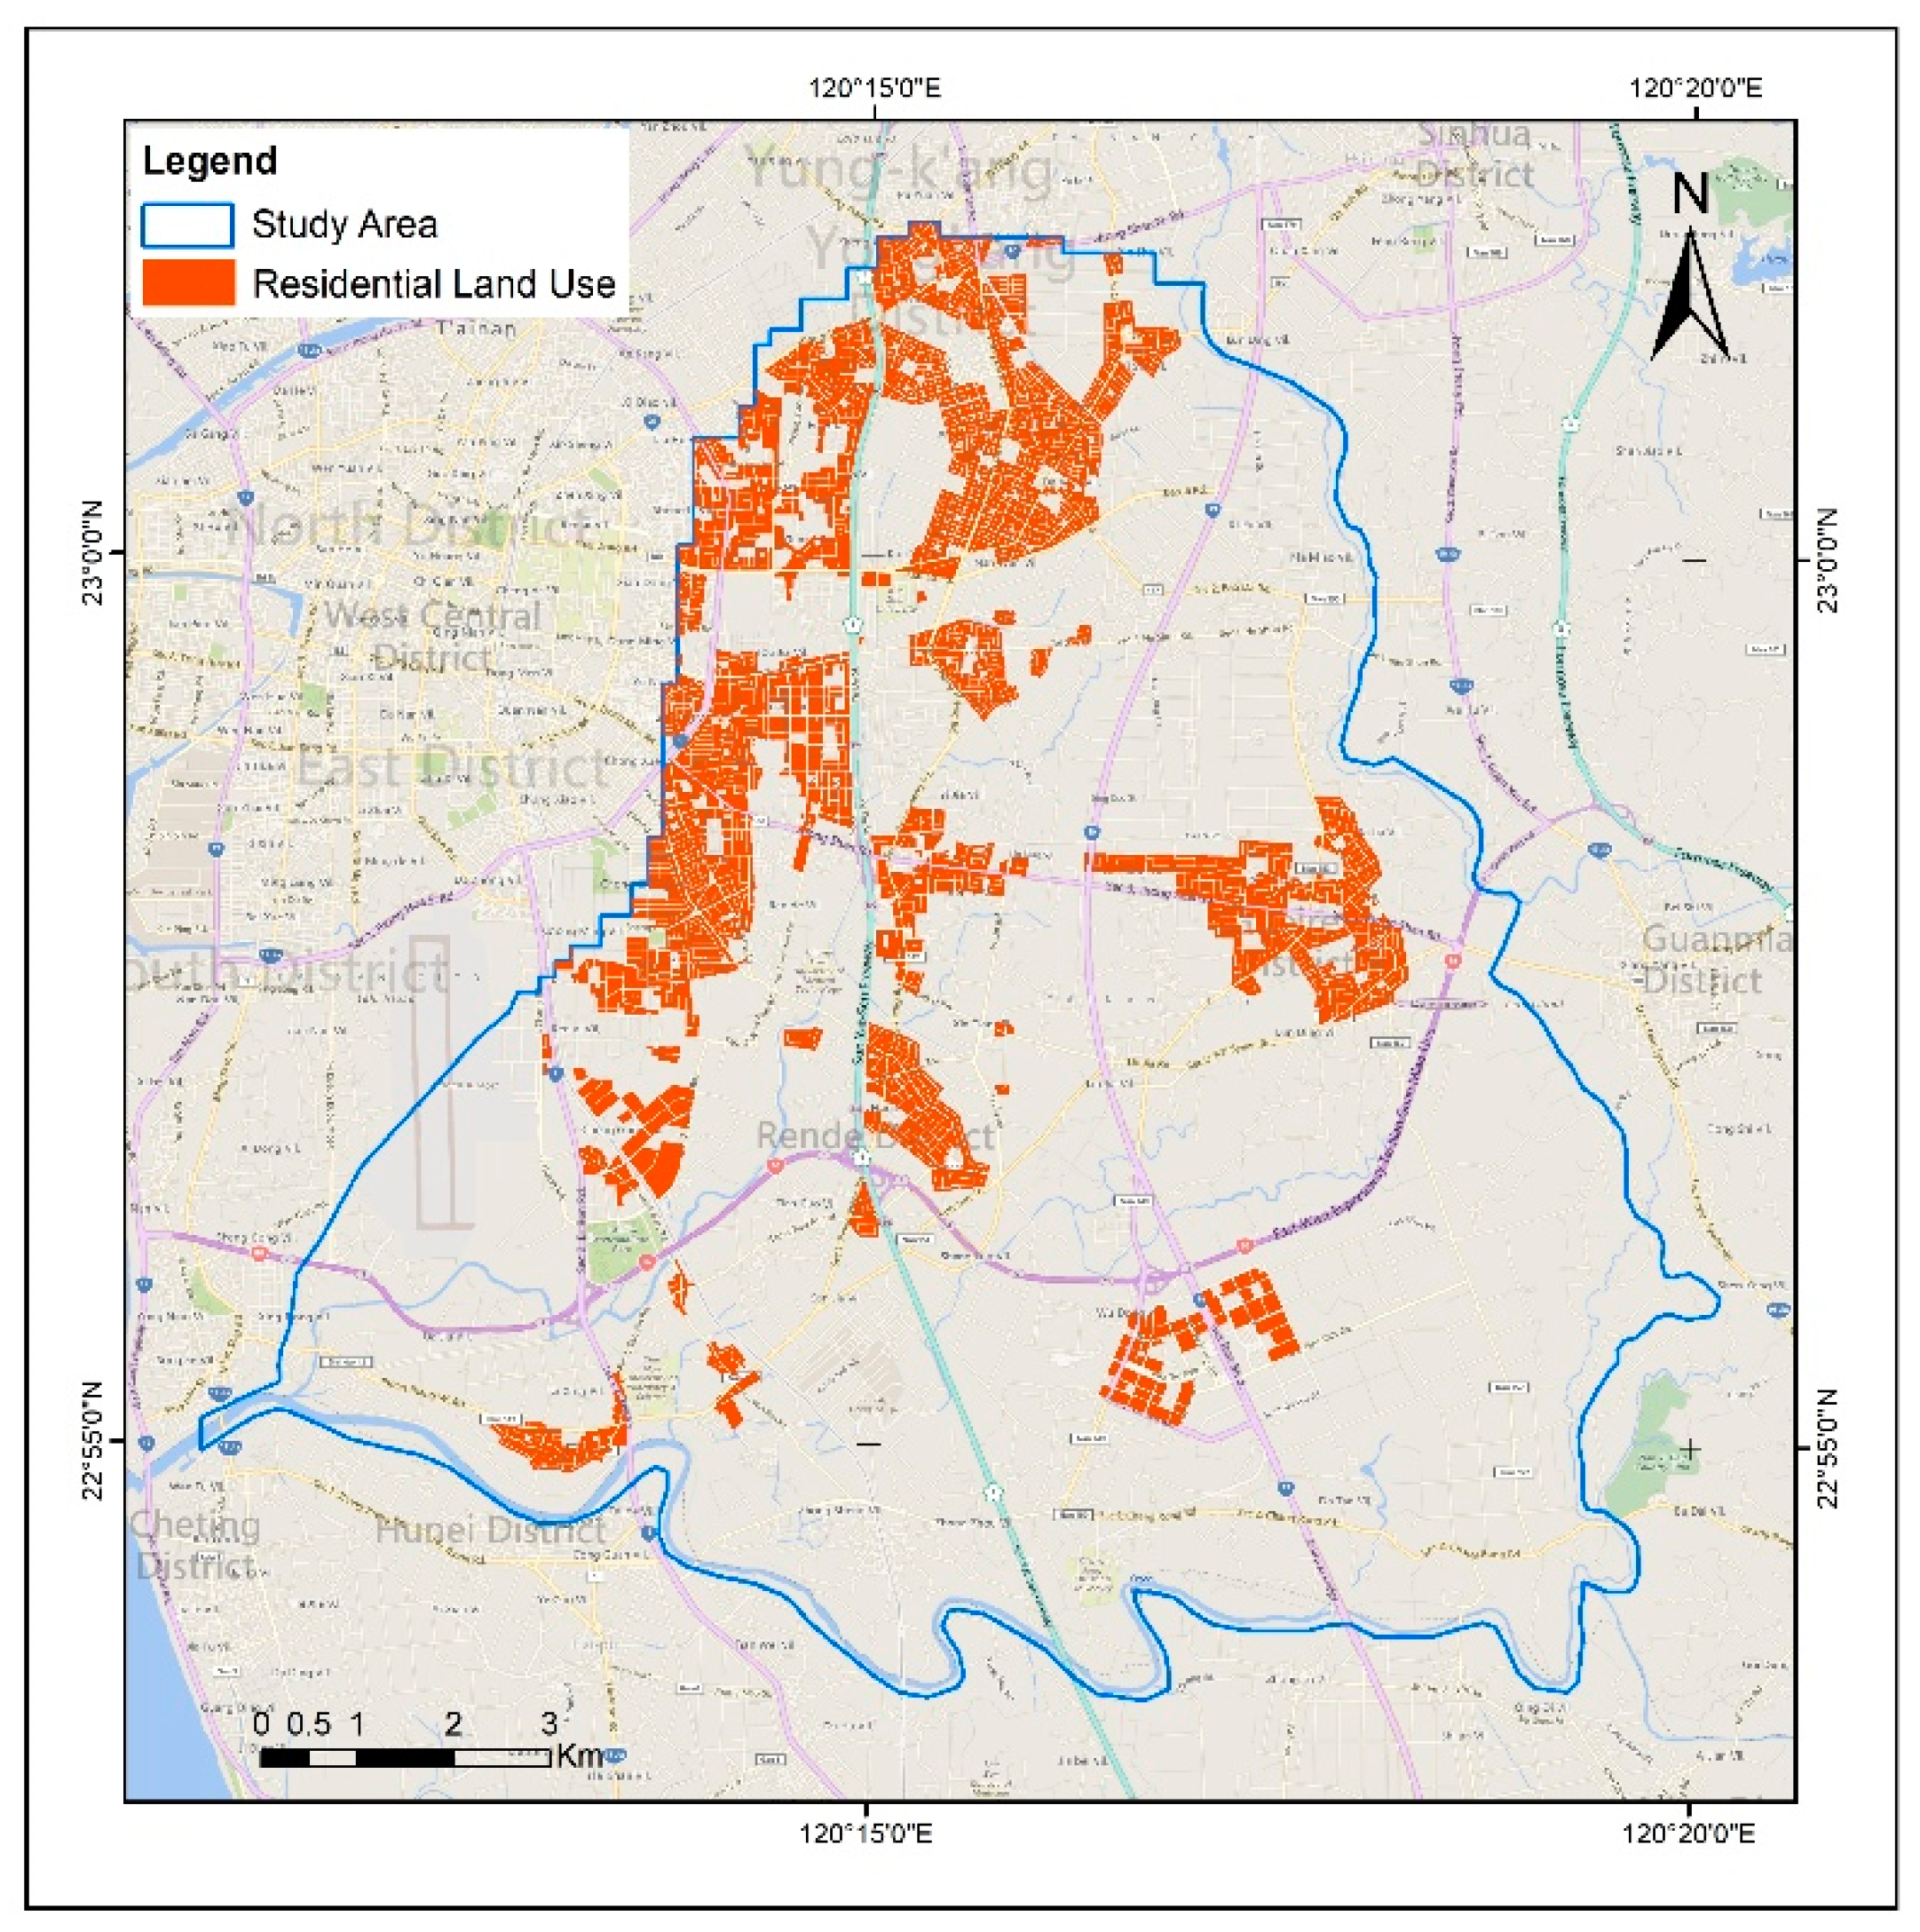
The study area is Tainan City in Taiwan, which covers an area of 137 km2. The locations of the study area (blue polygon) and residential area (orange polygon) are shown in Figure 2. The river (Erren River) moves through the middle of the city. Typhoons, e.g., the 2016 Typhoon Megi and 2017 Typhoon Haitang, were accompanied by abundant rainfall (352 and 430 mm with 24-h accumulated rainfall) that caused serious damages in Tainan.
3. Result and Discussion
3.1. Flood Hazard Map, Depth-Damage Table, and Vulnerability Weight by AHP
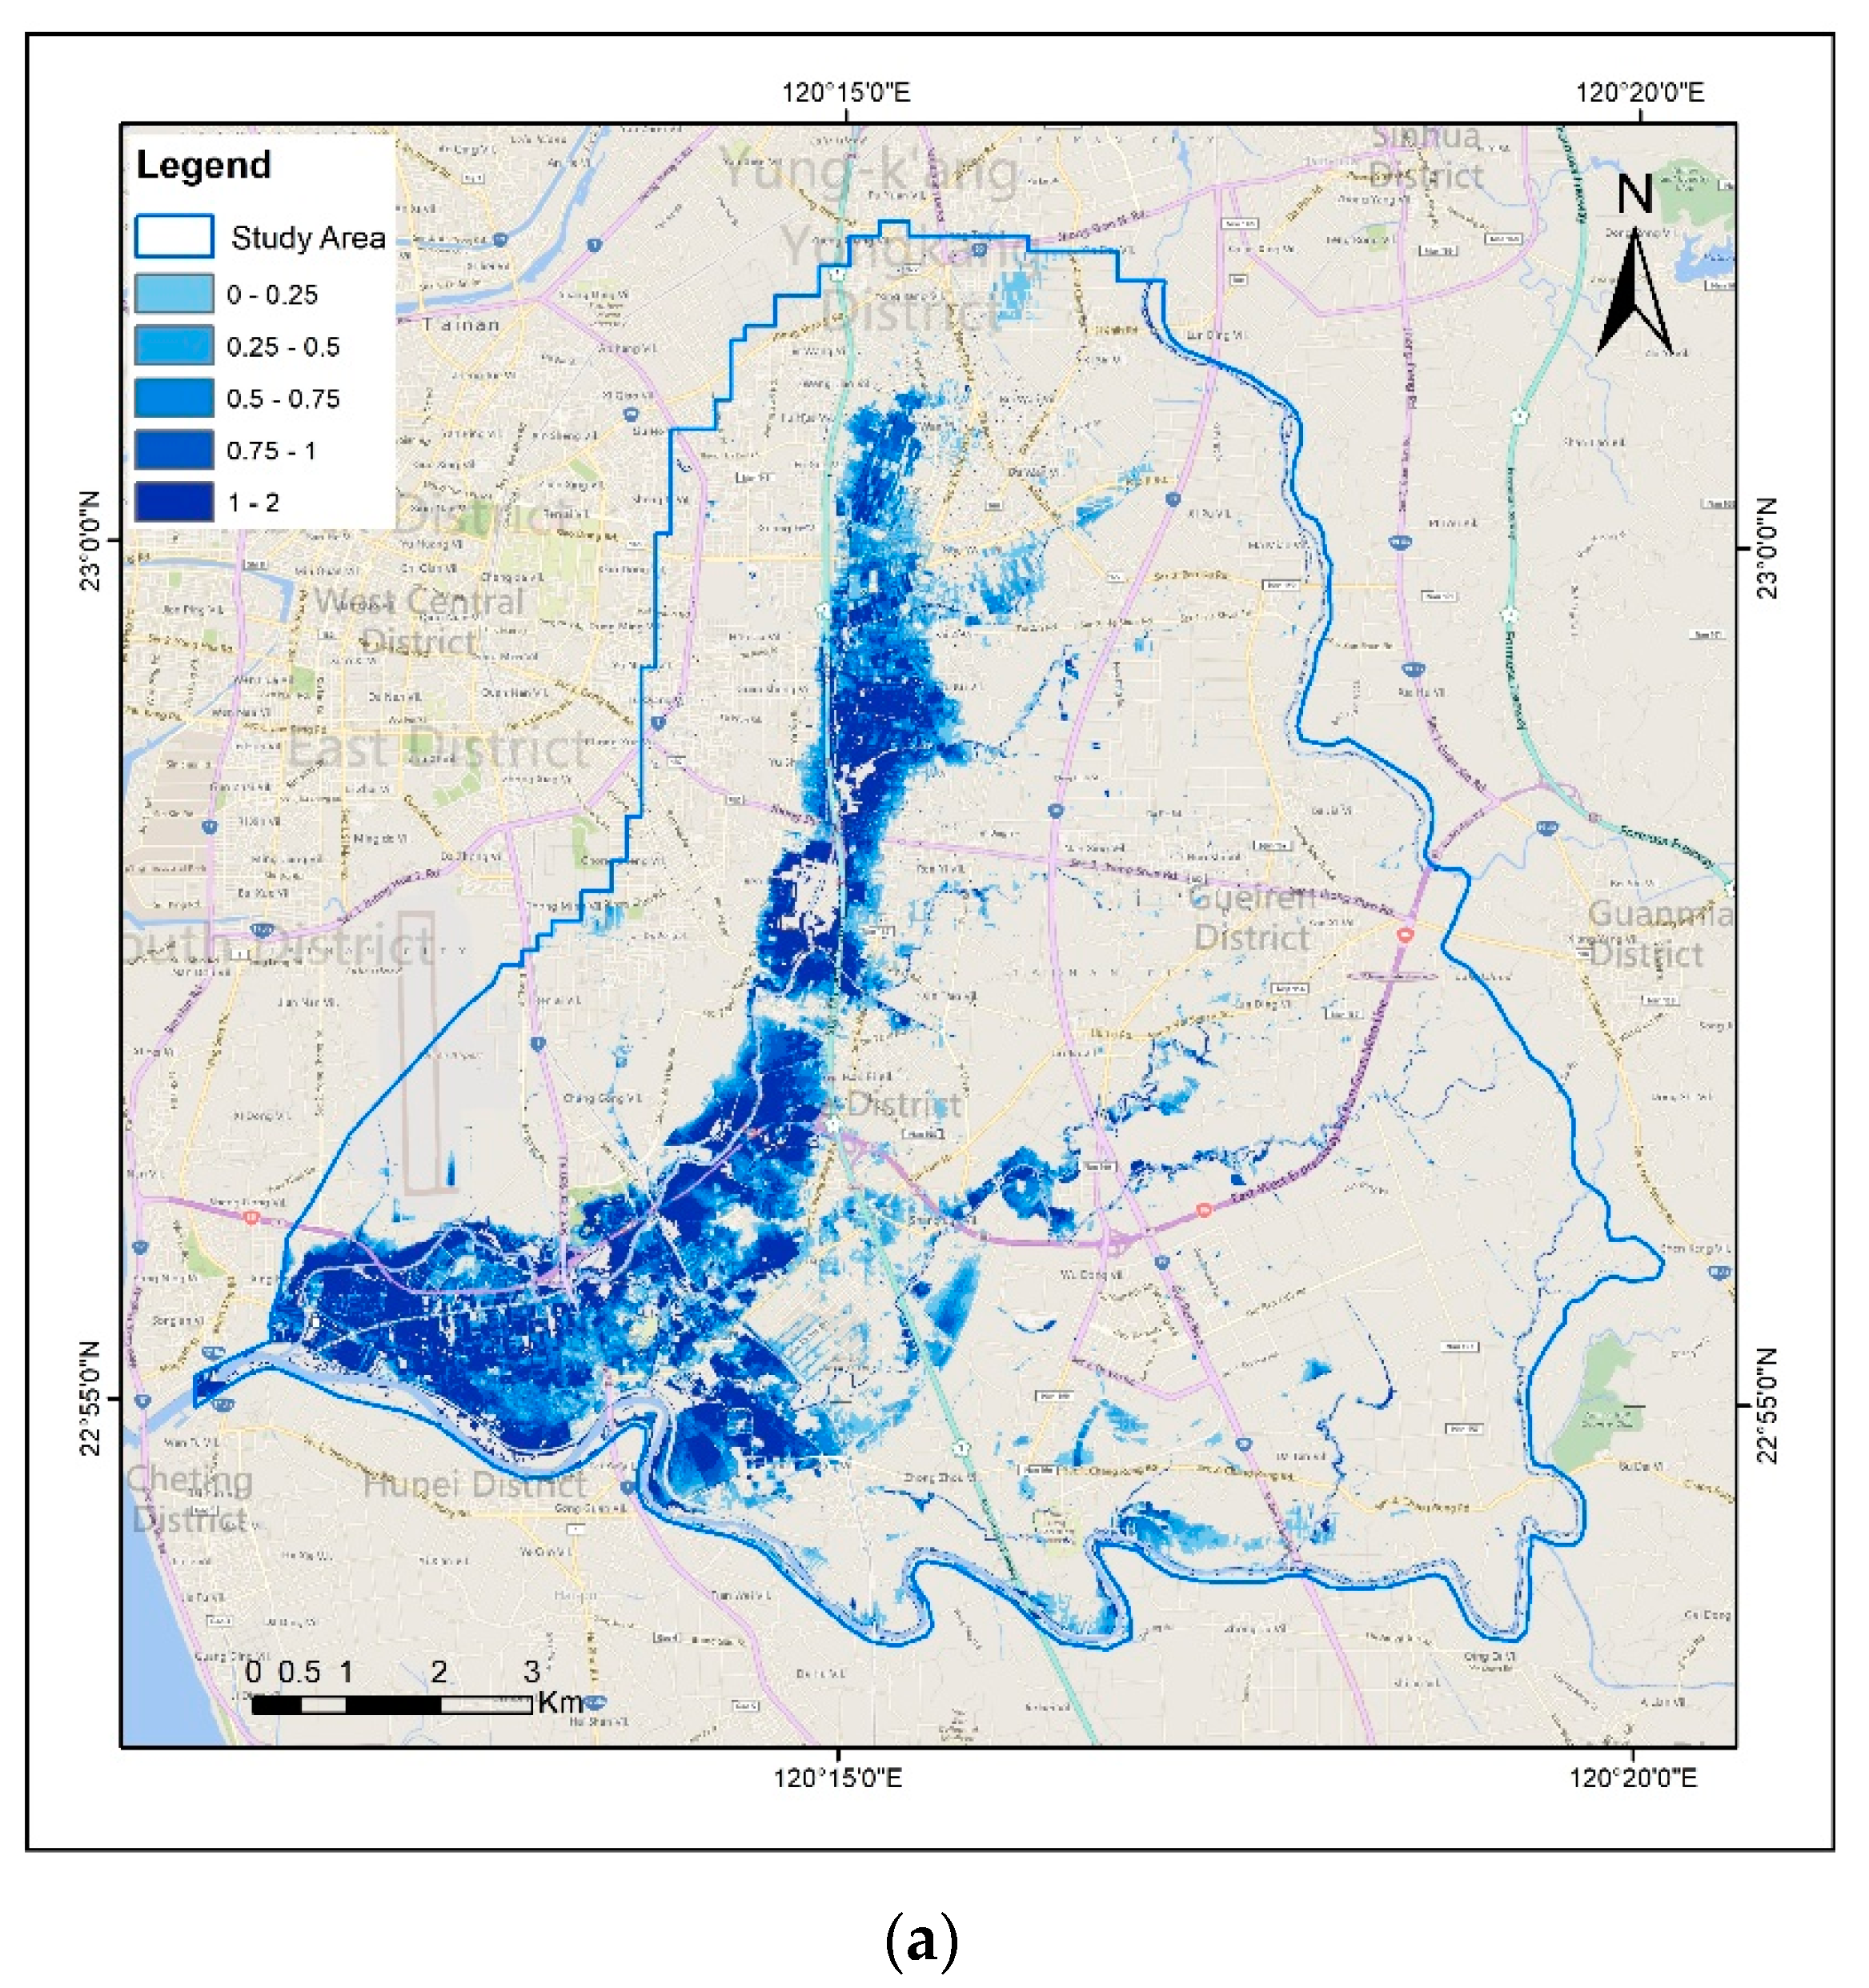
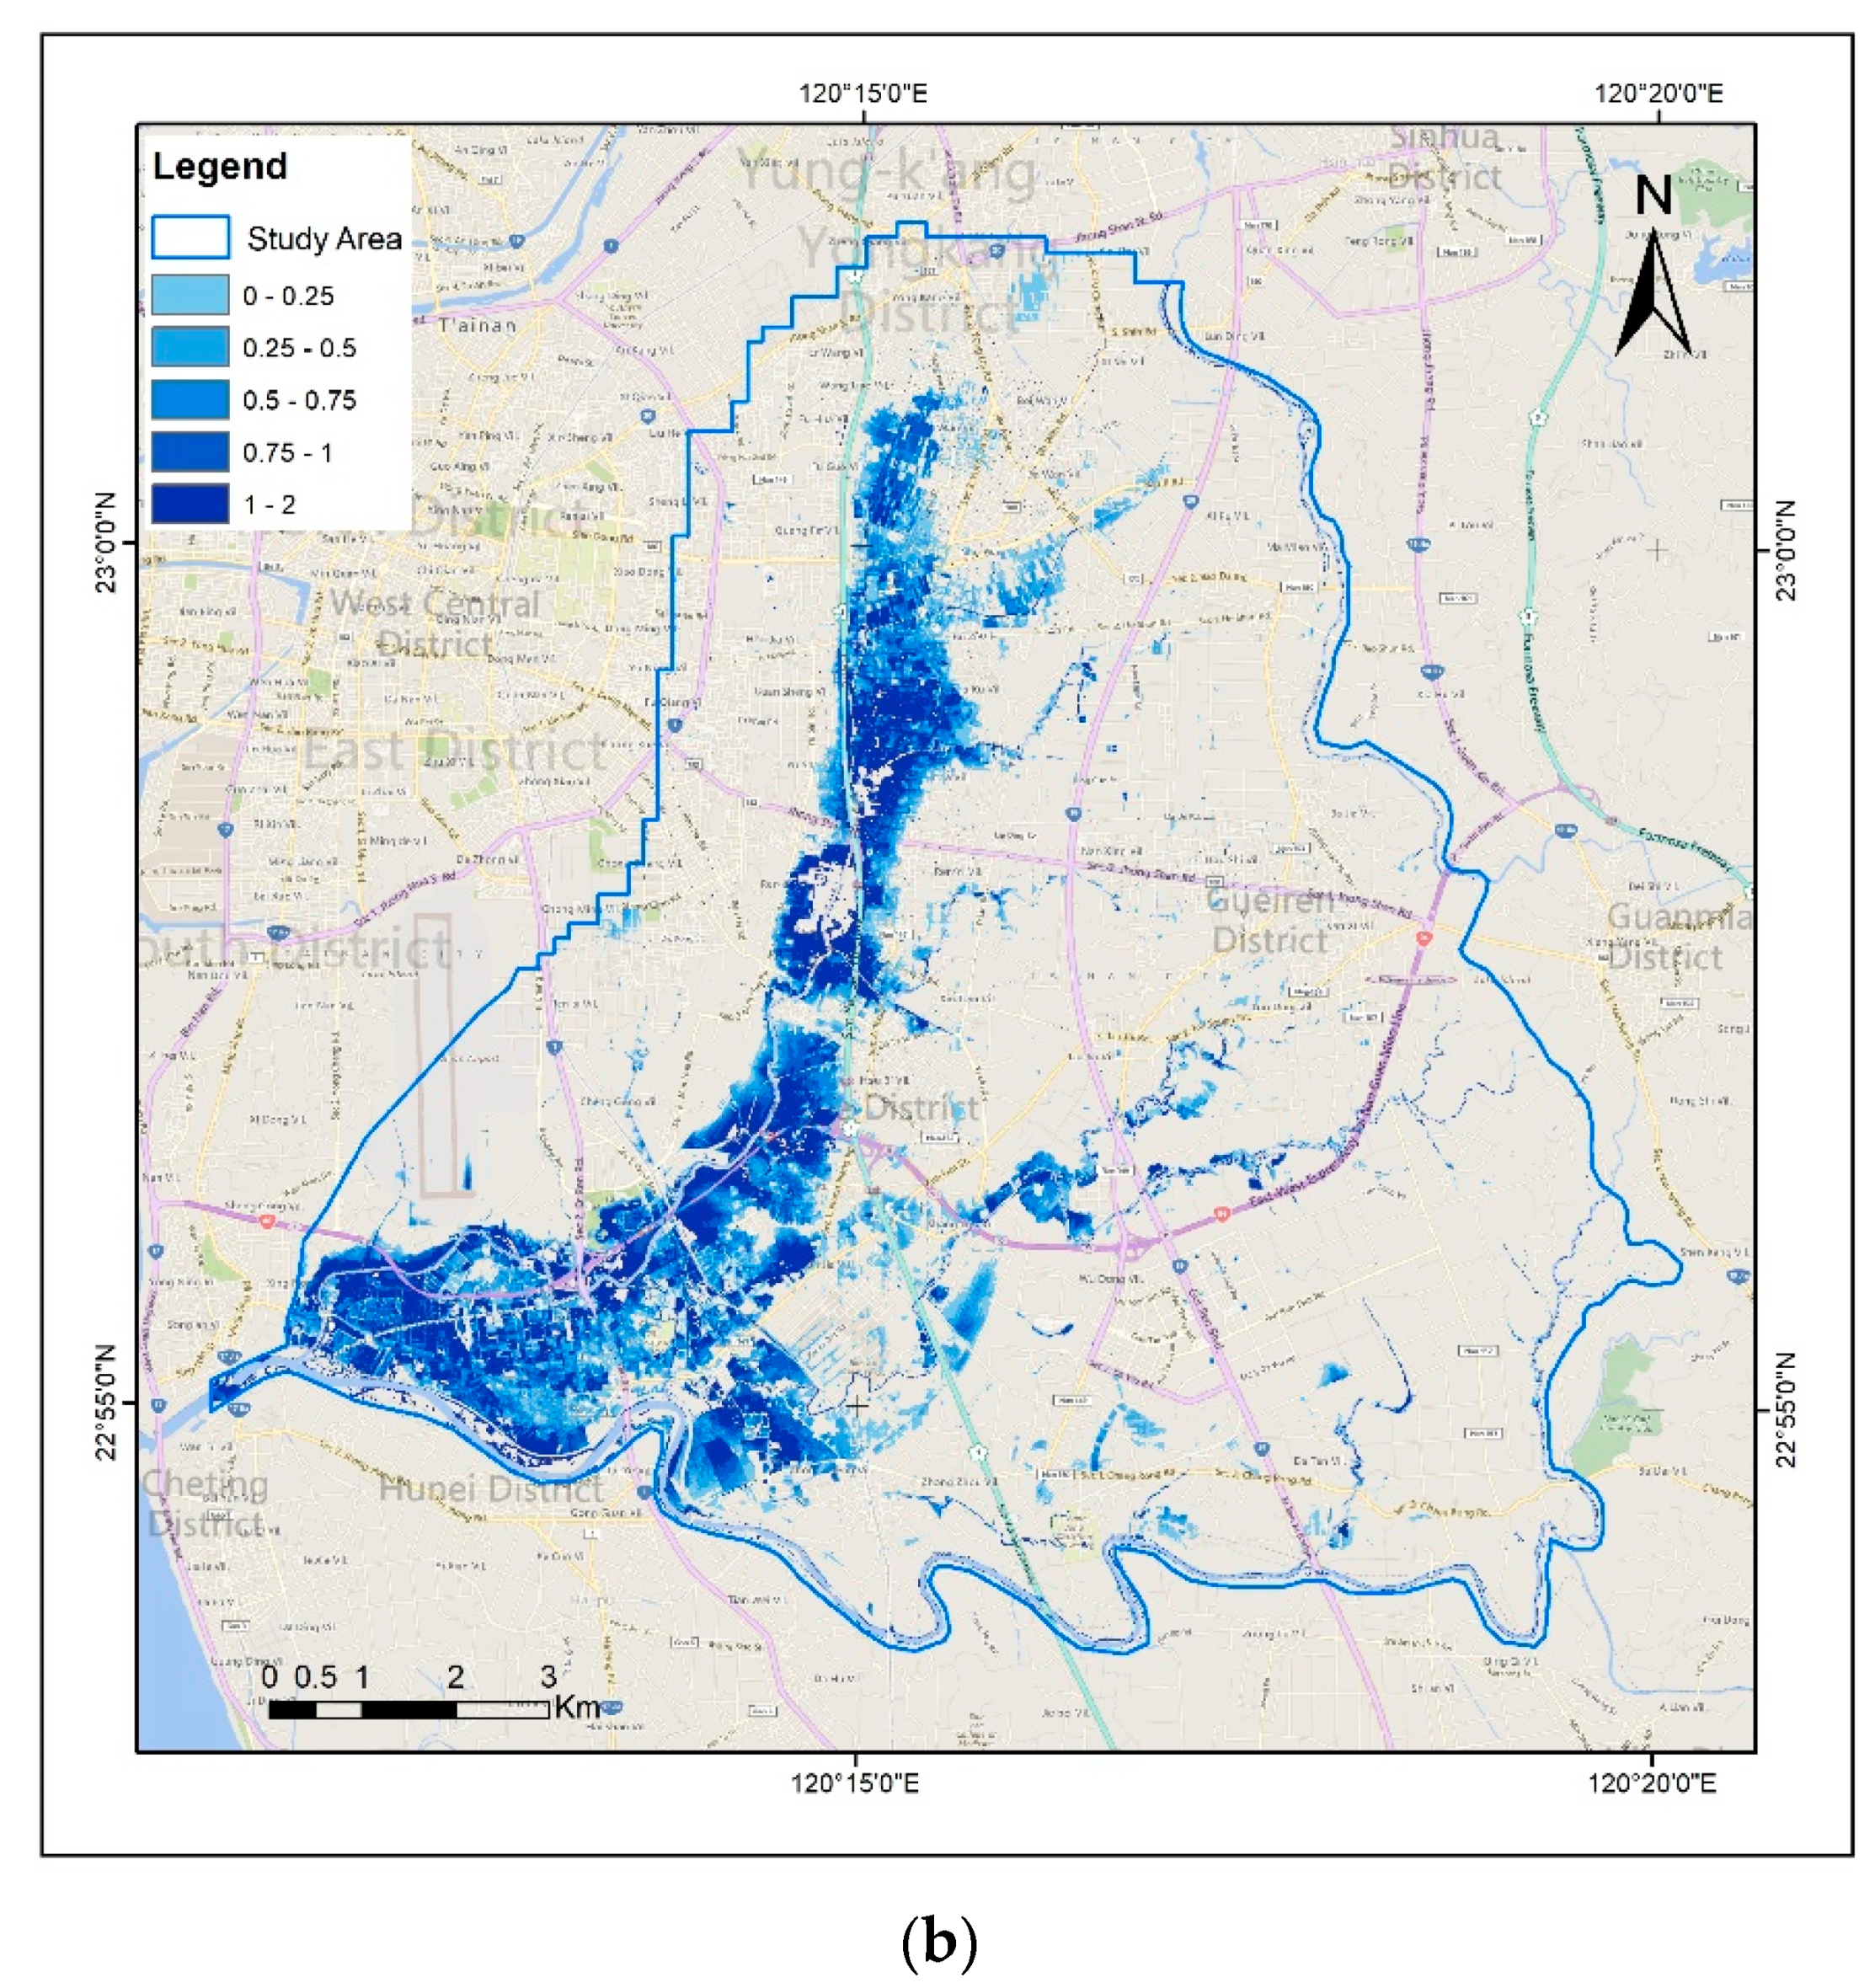
A flood hazard map was created on the basis of the data of the flood simulation model that was processed with an automatic GIS model. The flood simulation data were obtained from the research generated from the 3Di model. Water depth data from two flood events were used in this study (the 2016 Typhoon Megi and the 2017 Typhoon Haitang). The average water depths from both typhoon events were used to generate the flood hazard maps. Water level data from two stations known as the Wangliao Bridge and the Yanzi Bridge were used to validate the flood model data result. Figure 3 shows the comparison between flood simulations and observation of the water level in the two typhoon events. The red color represents the observation of the water level and the blue one represents the simulation of the water level. The results showed a good fitting between the simulated and observed water levels. Figure 4 shows the maximum flood water depth of each typhoon for the flood hazard map. The intensity level of the blue color indicates water depth. The dark blue indicates the highest water level in the study area. The automatic model was developed based on the flood data simulation caused by the typhoon disaster. In the 2016 Typhoon Megi and 2017 Typhoon Haitang, the results showed that the maximum flood water level ranged from 0.25 m to 2 m in the entire study area.
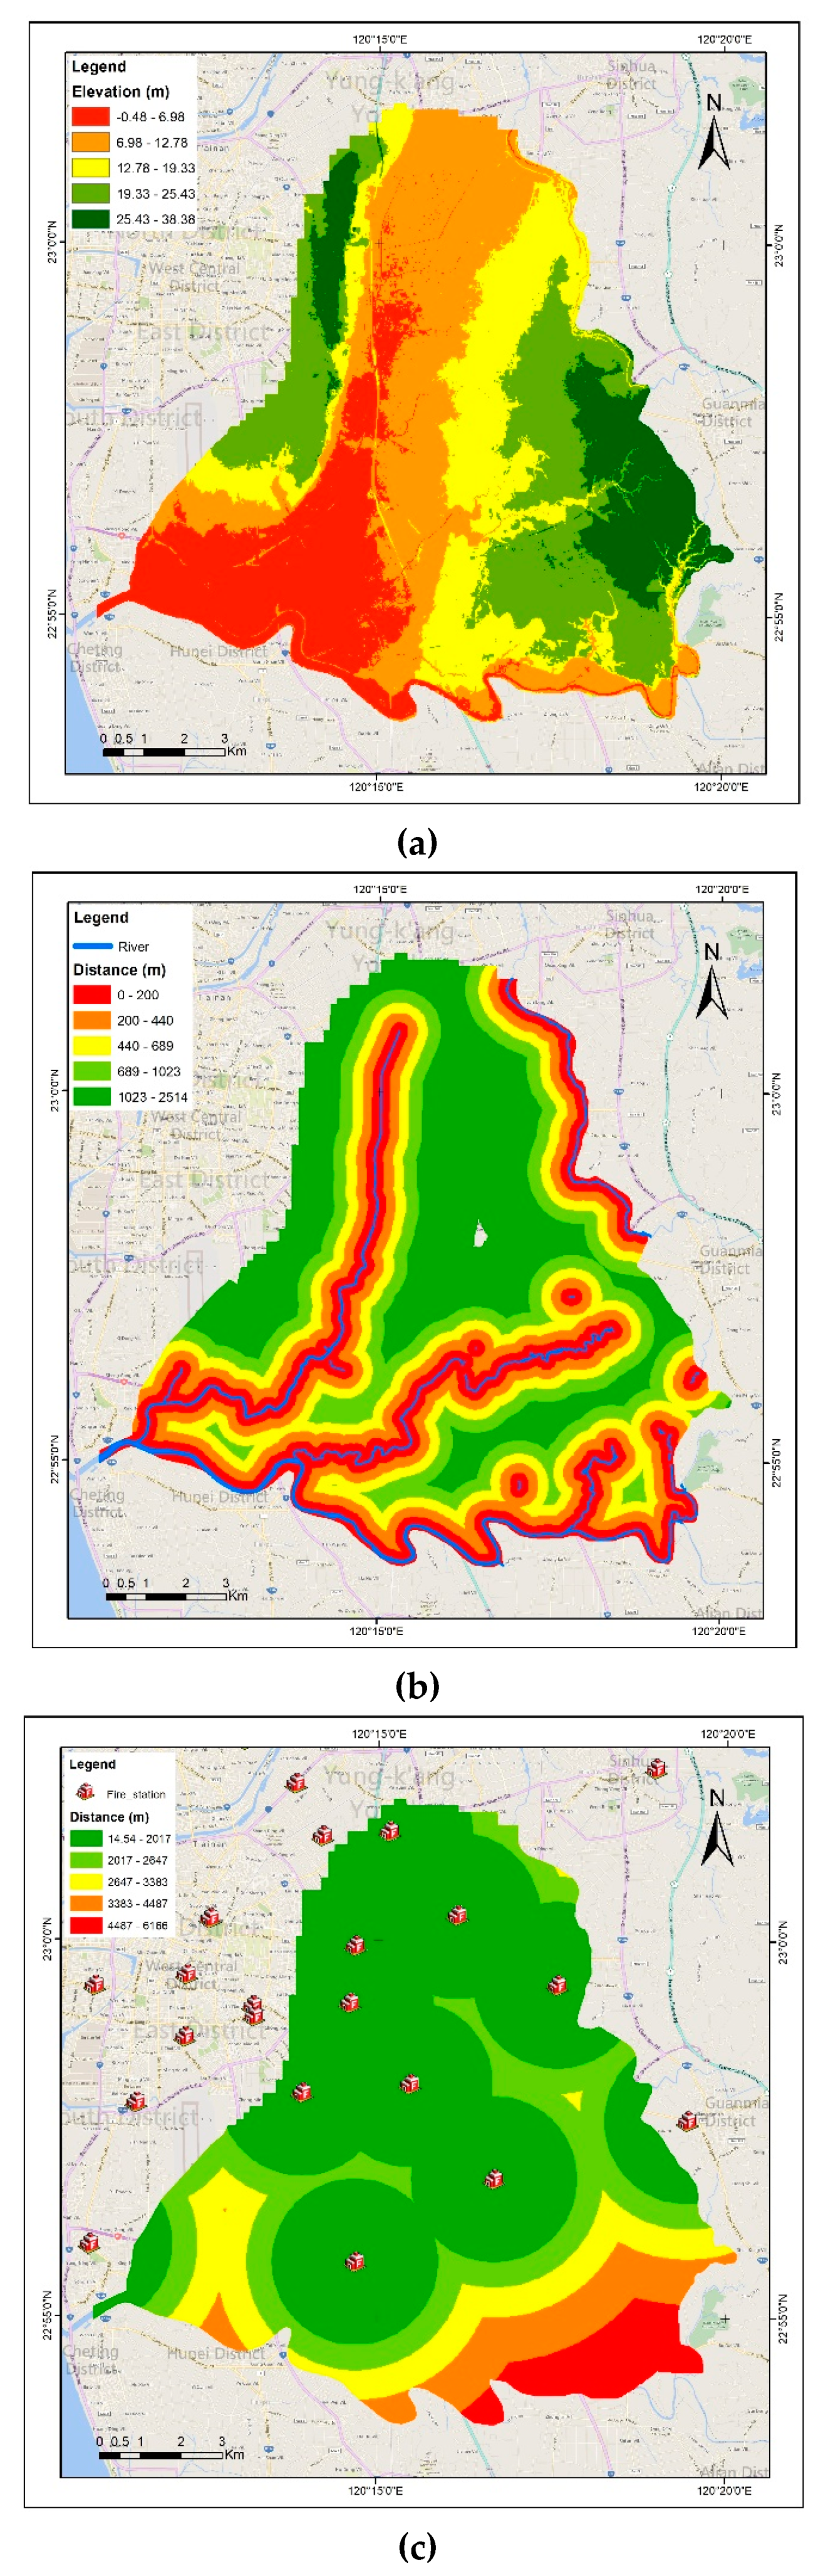
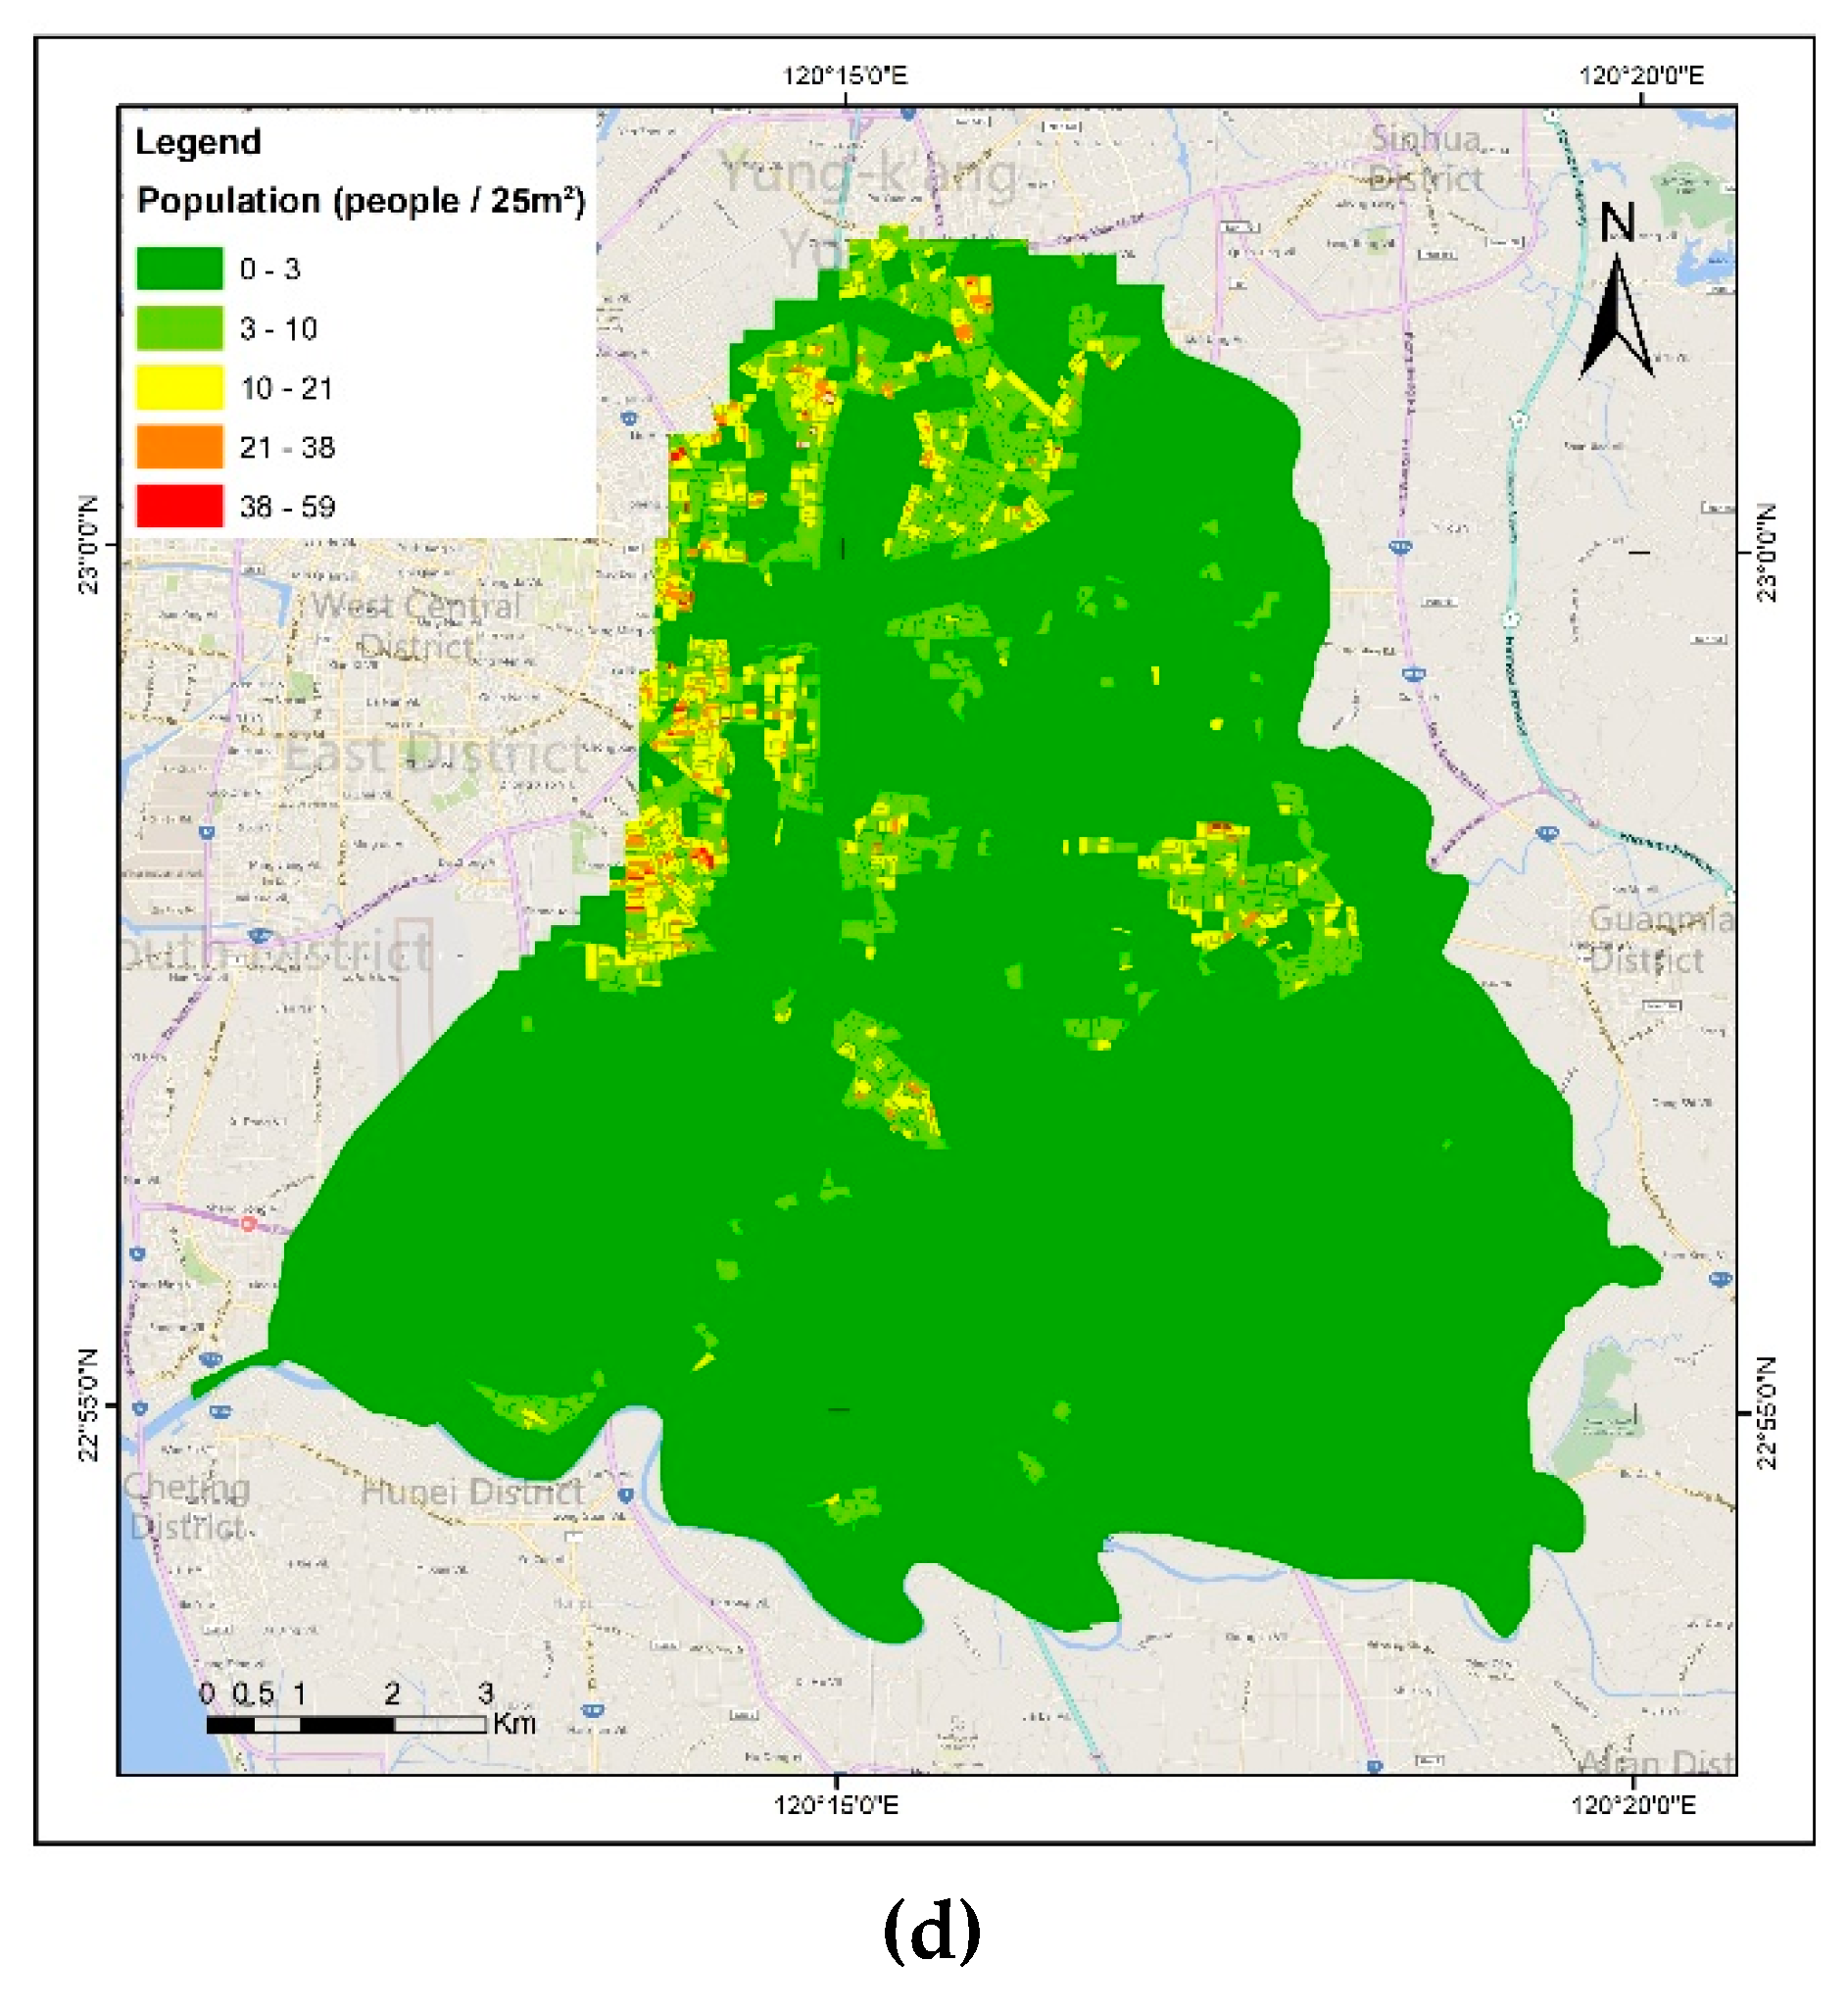
Table 1 shows the depth-damage table generated from the field survey in the flood area in the Rende District. No damage losses occurred if the water depth was less than 0.15 m. The flood loss increased with water depth in the depth-damage table. The damage per area is at maximum if the water depth is higher than 2 m. Figure 5 shows the vulnerability factor data such as (a) DEM, (b) distance to river, (c) distance to fire station, and (d) population density. In Figure 5a, the elevation of the study area is between −0.5 m and 40 m. Figure 5b shows that the residential area is close to rivers. In Figure 5c, the fire station is uniformly distributed except in the southeast area. Figure 5d shows that the population density is less than three persons per 25 m2 in most areas but is crowded with 10 persons to 59 persons per 25 m2 in the area. The urban population is concentrated in the core area of the northern part. The vulnerability factor is an important element for minimizing the impact of floods in the future.
Table 2 shows the vulnerability weight value from the AHP. The results of the AHP method is the weight value used to determine the level of importance of the vulnerability factor. The two most important factors are the population density (weight = 0.310) and distance to river (weight = 0.271). Vulnerability weights contribute in the evaluation of flood risk and are sensitive due to their specific local factors [20]. AHP modeling can identify vulnerability on a local scale but is difficult to impeccably quantify because it depends on the quality of the indicators and survey data.
3.2. Flood Loss Comparison Using Different Resolutions
In this subsection, the effects of different spatial model resolutions are discussed. Based on the loss comparisons with different spatial resolutions in Table 3, the estimated flood losses and flooding area at the fine resolutions of 1 m and 5 m resolutions were similar but were different from the 10 m resolution. Table 4 shows the comparison in flood loss at resolutions of 1 m to 5 m and 10 m. The loss result from the 10-m resolution contains a large difference among the cases. We explored the sensitivity of the flood loss estimates with the spatial representation in the flood loss model. The estimated loss at the 1 m or 5 m resolution is more appropriate due to the dispersed and small-sized residential buildings in Tainan City. Since the pattern of the residential area is dispersed, the high-resolution flood model offers relatively detailed loss assessment in the flood areas. This loss value will increase or decrease depending on the used scale of the study area. The case evaluated the sensitivity of the spatial resolution. In summary, the loss differences reached 7.8% and 11.2% during two events when compared with the 1-m and 10-m resolutions. Spatial resolutions used in the assessment had a direct impact on the potential flood heights [21]. However, the flood loss evaluation was often restricted due to the lack of dense observation data [22]. The adoption of a high-resolution flood simulation approach represents small-scale structural elements and small topographic variations [23]. The detailed simulation information is relevant for assessing the flood loss and risk in an urban area.
For flood management, the loss and risk are identified effectively based on simulation approaches [5,8]. The simulation model is applied to determine the maximum water depths during typhoon events without sufficient flood depth measurements. Since the patterns of residential areas in the study area are distributed, inundation depths in a residential area can be better identified using the high -resolution simulation model. However, the benefits of using the complex building representation and high-resolution flood inundation model are uncertain because of the lack of sufficient data for model calibration and validation [23].
3.3. Vulnerability and Risk Maps
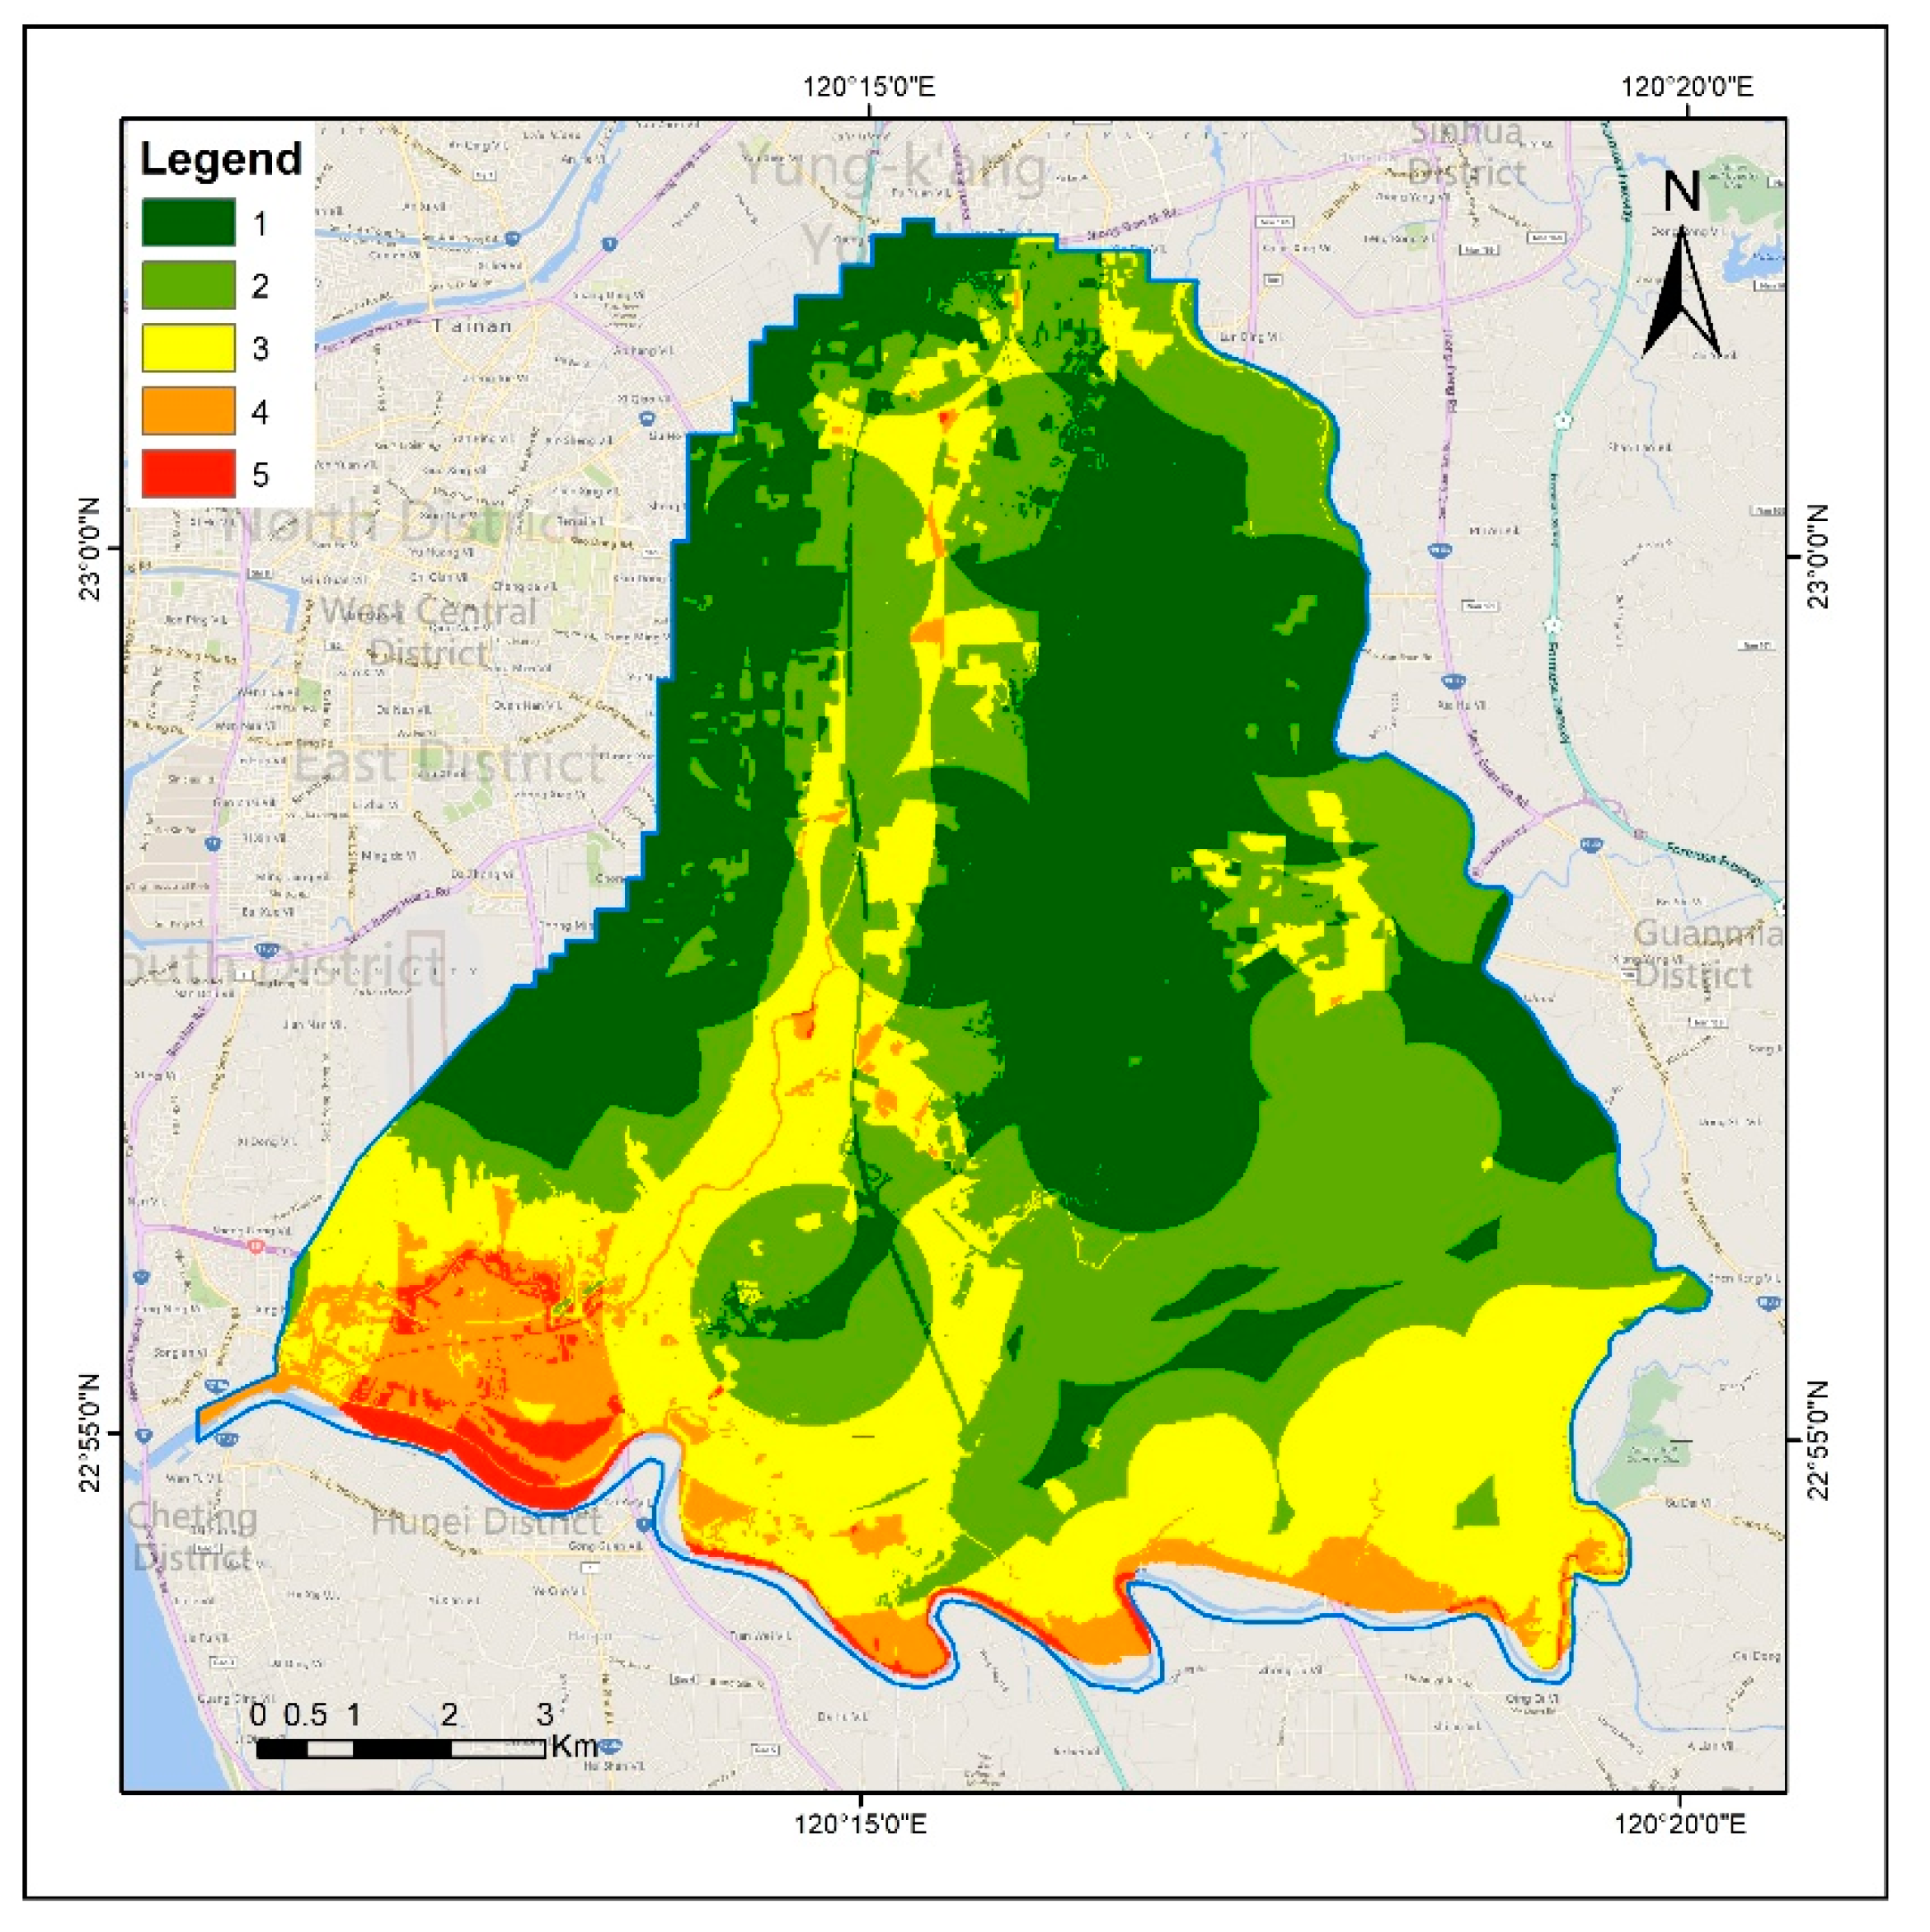
A vulnerability map was derived from four vulnerability factors. Figure 6 shows the vulnerability results classified into five categories. Every vulnerability range is represented by a unique color. Level 1 (dark green color) indicates the areas with a very low vulnerability. Level 2 (light green) indicates the areas with low vulnerability, and level 3 (yellow color) indicates the areas with a moderate level of loss. Levels 4 and 5 (orange and red colors) indicate areas with high and very high vulnerabilities, respectively. The vulnerability map shows that the areas with the highest vulnerability are located in the south and center line because they are close to the river and are composed of lowland with high population density.
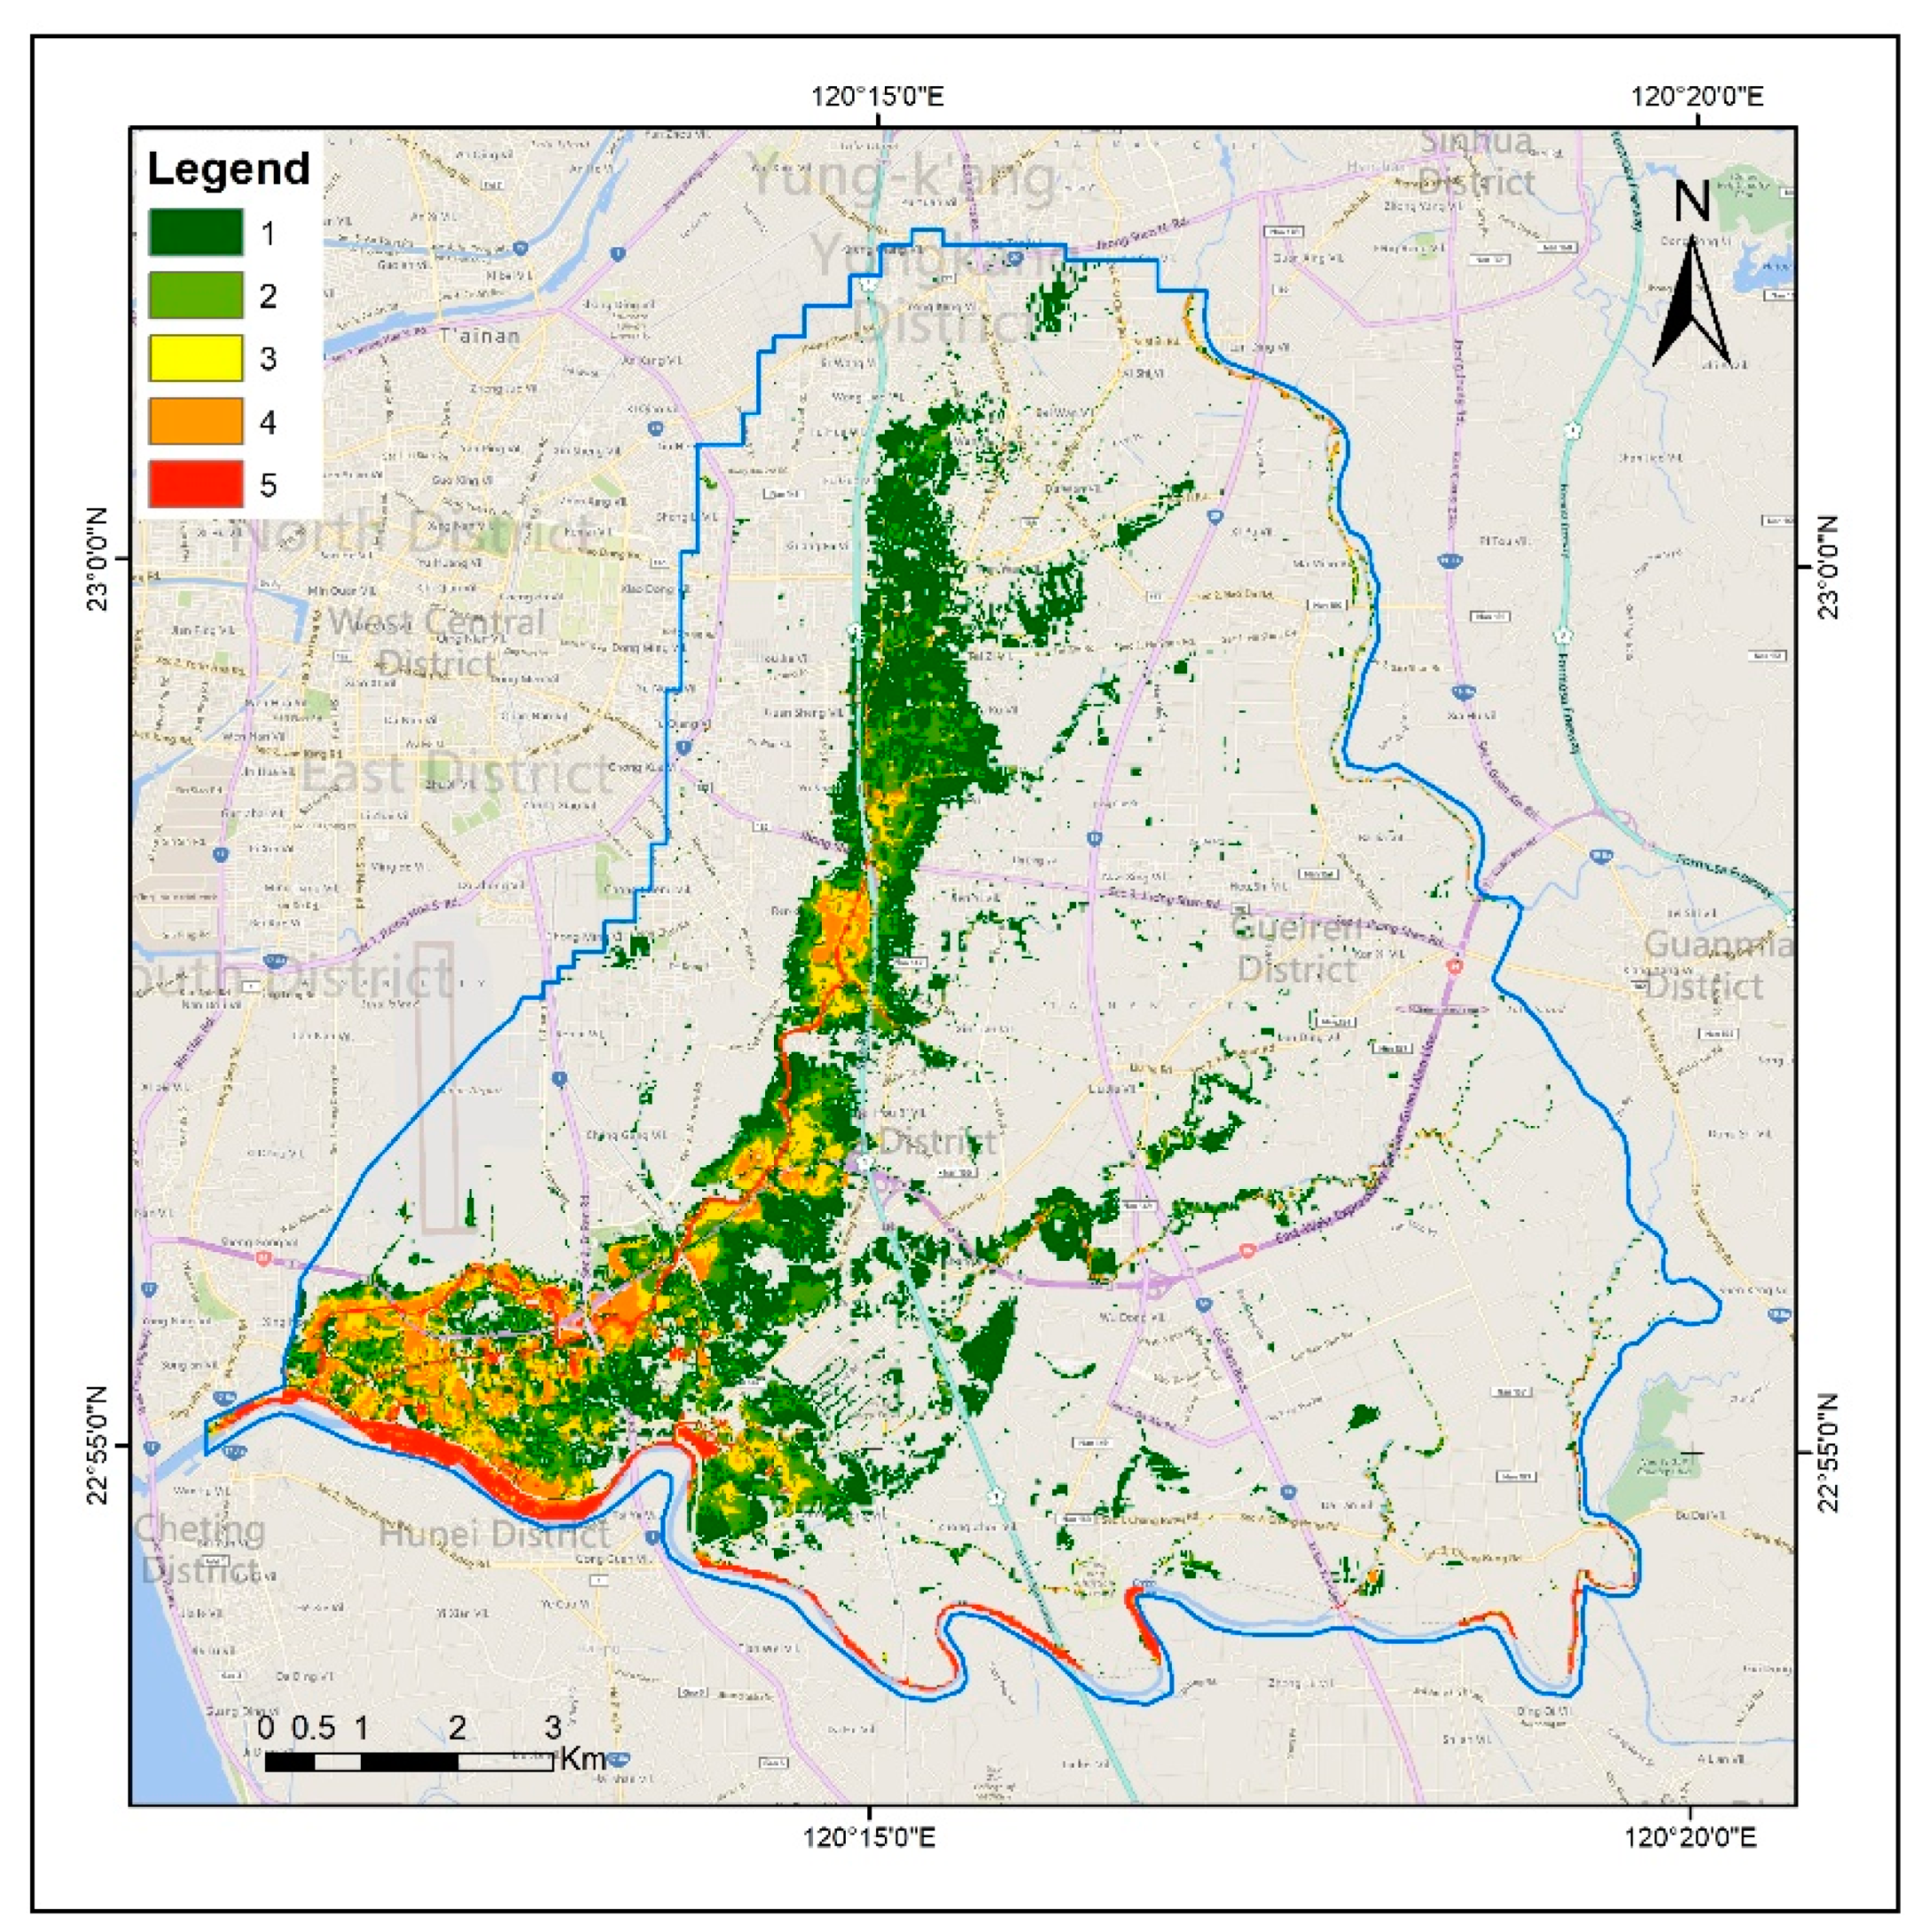
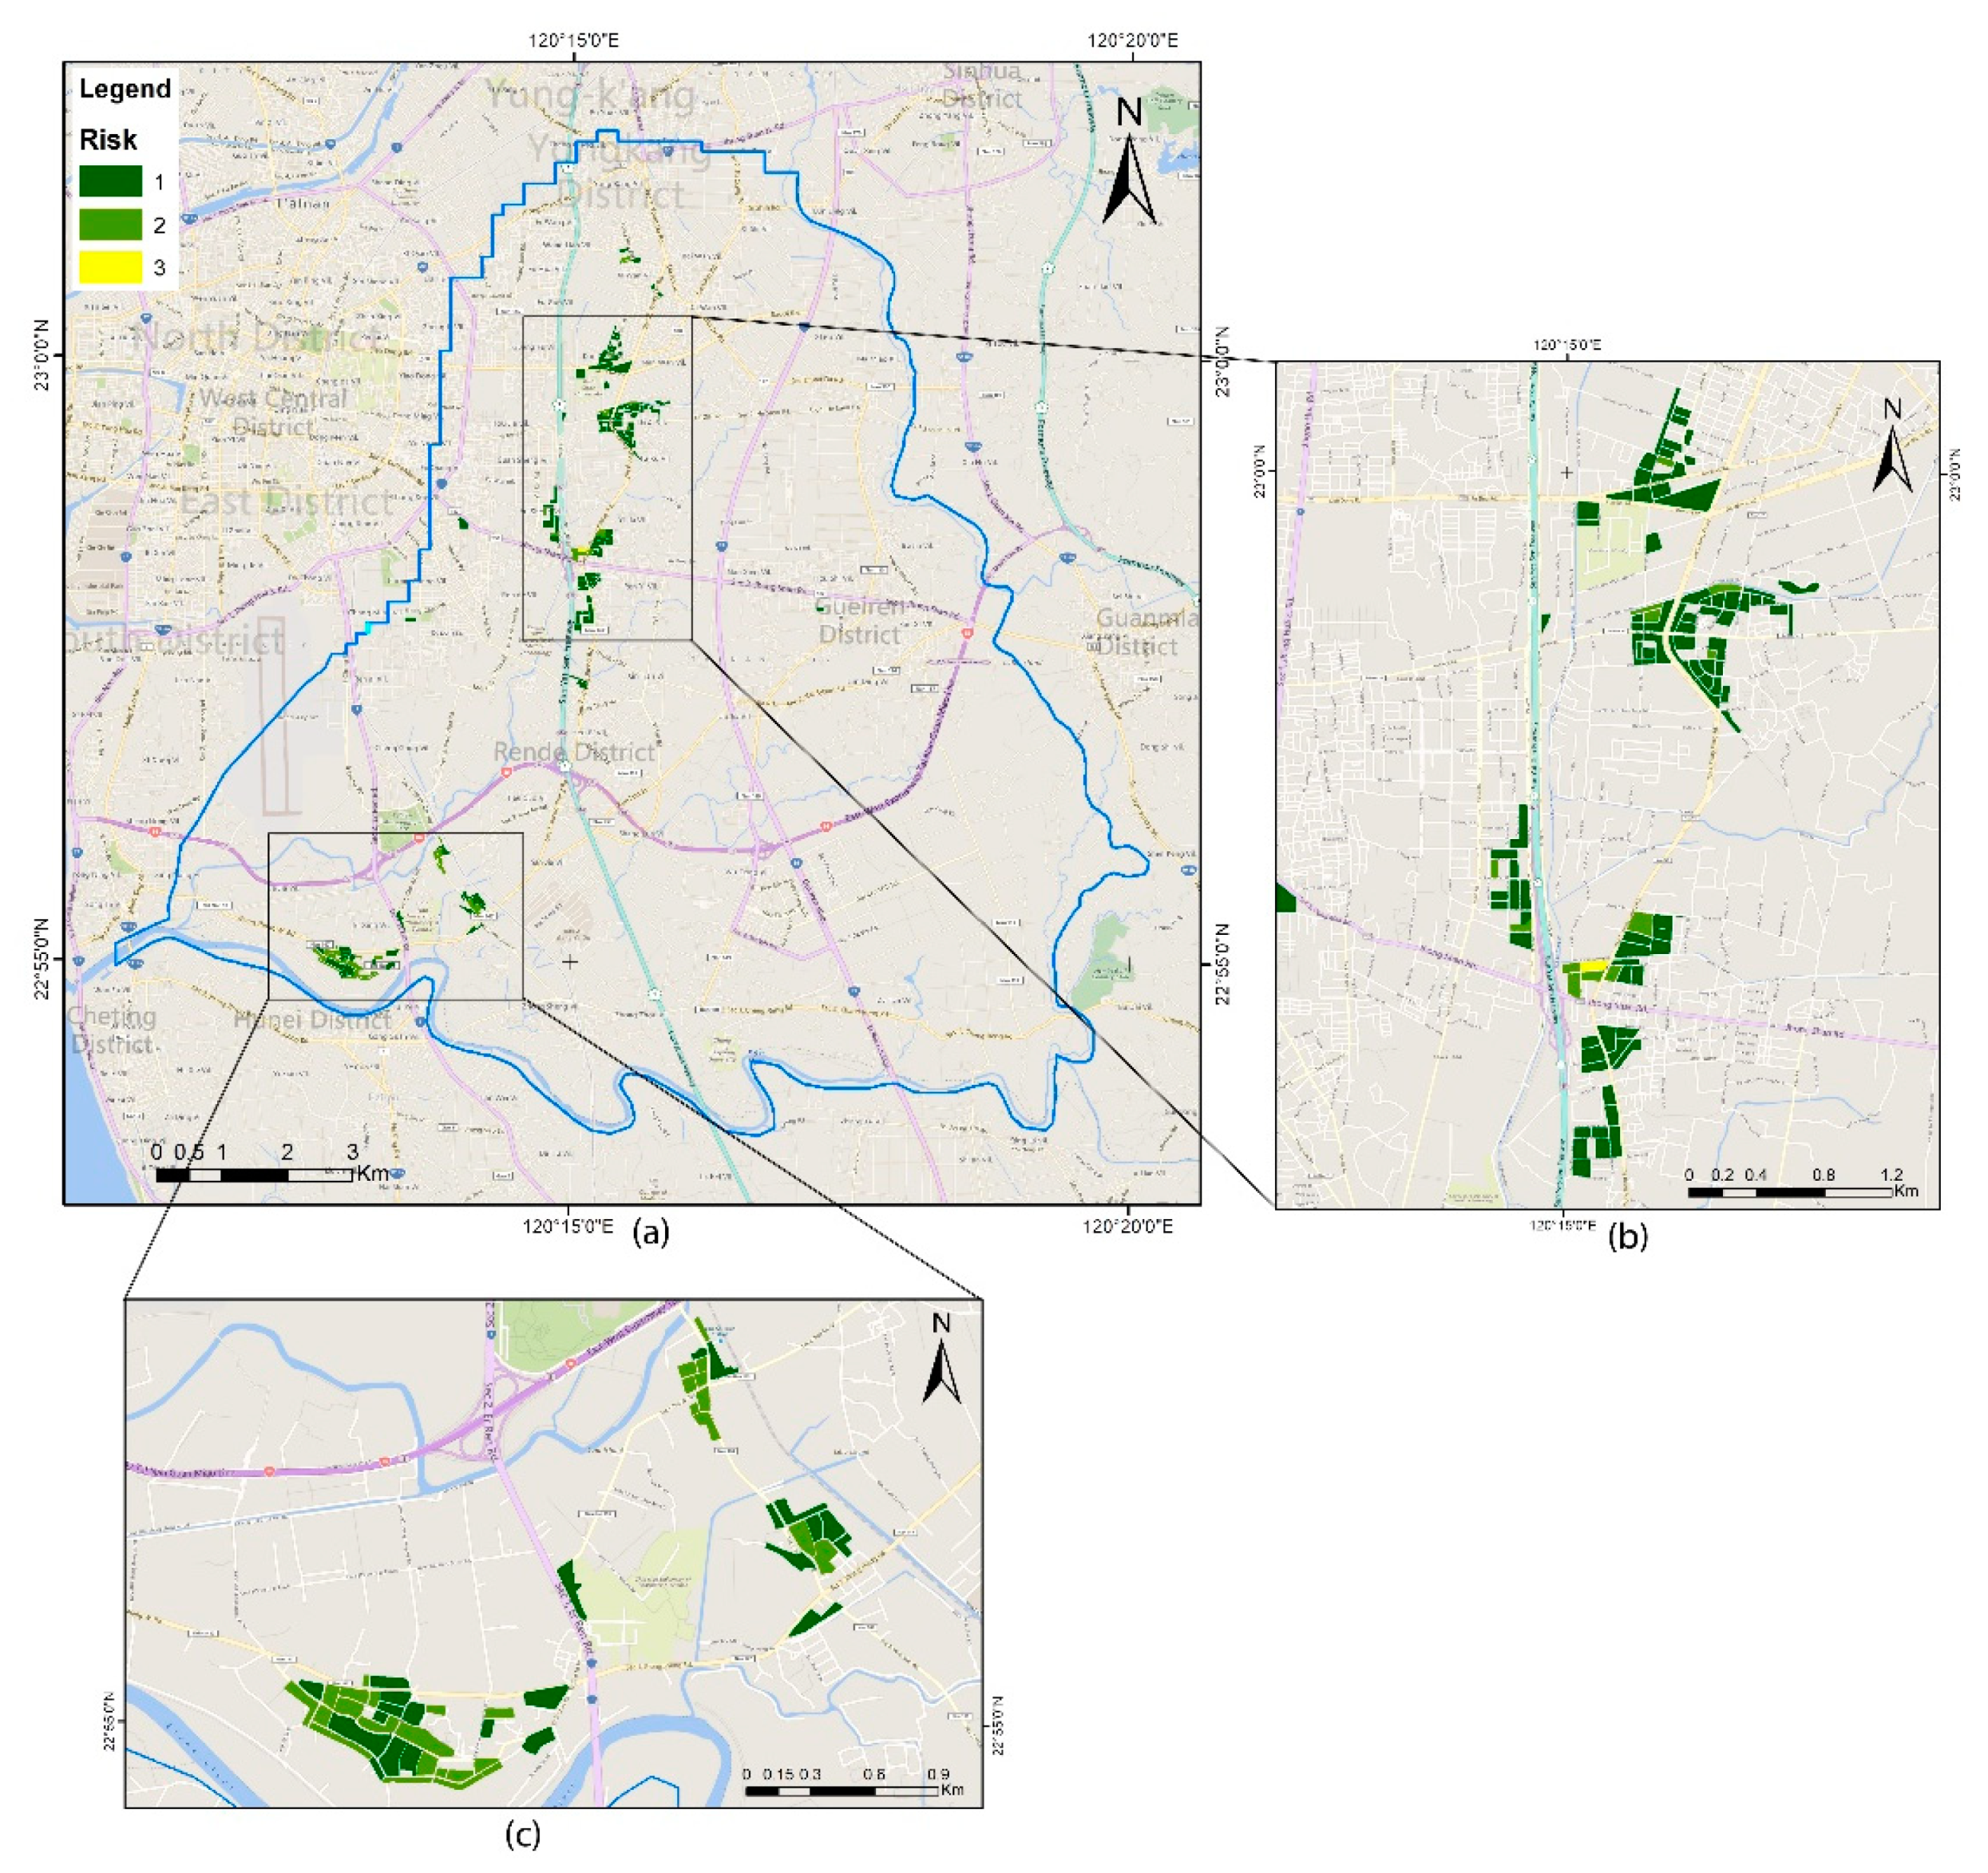
Figure 7 shows the risk map of the study area. The risk level is highly dependent on flood hazard and vulnerability. The flood risk is classified into the five levels of colors. Level 1 (dark green color) indicates the areas with very low risk. Level 2 (light green) indicates the areas with low risk, and level 3 (yellow color) indicates the areas with a moderate level of loss. Levels 4 and 5 (orange and red colors) indicate the areas with high and very high risks, respectively. In the risk map, most areas have no risk of flooding even though some have high vulnerability. The result also showed that the most areas at risk are located in the South District near the river area. The areas at risk of flooding are located around the river and have low elevation. The Tainan City Government can use the risk map as a reference to reduce the level of vulnerability in the areas around the river. Such a goal can be achieved by adding fire station units and reducing population density around the river. Reducing the value of this vulnerability factor will also have an impact for decreasing the risk of flood loss in the future.
The risk map analysis indicated that most areas (883,526 m2) have a very low risk level, as denoted by the dark green color in Figure 7. A total of 269,192 m2 areas are located in the low-risk area, as indicated by the light green color. Only 8099 m2 areas are located in the moderate level of risk, as represented by the yellow color. In the flood risk maps, the southwestern parts of the district near the river were most vulnerable to floods. The risk value was calculated based on the water depth from the hazard map and the value of the vulnerability map. Most areas are not at risk for floods but some have high vulnerability. The government can reduce the risk value and reduce the social vulnerability value through population reduction and adding fire station in areas with high water depth value. Figure 8 identifies all residential areas that have risk values and very low risk level. Risk value is affected by the vulnerability factors and the hazard map in the risk-generating process. In Figure 8, no residential polygon that has a high level risk or a very high level risk was determined. Therefore, the residential polygon in the study area faces a low potential risk against flood disaster loss in the future. The government needs to pay attention to the areas, even those with less than level 3 of risk.
Flood risk is a product of the probability of the flood event occurrence and its consequence to society and the environment [24,25,26]. The 24-h accumulated rainfall for Typhoon Megi or Haitang exceeds 350 mm over the 200-year return period. The risk map over the 200-year return period was generated in this study. The risk maps with various flood probability distributions would be recommended in the development of flood loss and risk assessment. However, the uncertainty in flood loss and risk assessment can lead to significant over-estimations or under-estimations [27]. The main uncertainties lie in the scarcity of data, the assessment model, and the human dimension e.g., the uncertainties within DEM accuracy, parameterization of the hydraulic model, house types, and field surveys [27,28]. The further study will address the impact of uncertainty in flood loss and risk assessment. In addition, the effects of the urban imperviousness [29], land development, and climate change can be quantified in hazard mitigation planning.
4. Conclusions
This study offers a GIS-based flood loss and risk assessment model to analyze the direct loss and risk impacts caused by floods in a residential urban area with small-sized residential buildings. Since the pattern of a residential area in the study area is dispersed, the water depths of a residential area are easier to identify using the high-resolution model. This study integrates high-resolution inundation simulation to generate fine-resolution flood hazard and risk maps. The high-resolution model provides detailed information of water depth in each pixel inside the residential area. The effect of the simulation resolution on flood loss was identified. The spatial resolution of simulation greatly affects the results of loss value. The assessment model shows different resolution estimations of a flood-inundated area and its corresponding loss. Moreover, vulnerability factors used in this study were prepared based on the importance of each of the vulnerability value factors in the study area. The AHP identified the weights of the vulnerability factors. The risk map is the result of combining flood hazard and vulnerability maps. Spatial flood risk maps show that the southwestern parts of the district near the river are most vulnerable to floods.
Future studies will consider flood risk under various return periods in order to identify the expected annual damage for each return period. Data collection of filled survey and social vulnerability factors, such as household income, and uncertainty analysis must also be added to develop a reliable loss and risk estimator.
Author Contributions
Z.A. contributed to model development, paper writing, and reporting of the results. H.-J.C. contributed to the study design, the model concept, data preparation, and the writing of the manuscript. Y.-L.K. and Y.-C.H. contributed to the improvement of the draft manuscript. H.K.W. contributed to the 3Di model. M.Z.A. contributed to paper processing. All authors have seen and approved the final version.
Funding
MOST 107-2119-M-006-024 and 107-2622-M-006-001-CC2 funded the APC.
Acknowledgments
The students from the International Master Program on Natural Hazards Mitigation and Management, NCKU, supported this work. The authors thank reviewers for valuable comments and suggestions.
Conflicts of Interest
The authors declare no conflict of interest.
References
- Teng, W.-H.; Hsu, M.-H.; Wu, C.-H.; Chen, A.S. Impact of Flood Disasters on Taiwan in the Last Quarter Century. Nat. Hazards 2006, 37, 191–207. [Google Scholar] [CrossRef]
- Eves, C. The long-term impact of flooding on residential property values. Prop. Manag. 2002, 20, 214–227. [Google Scholar] [CrossRef]
- Li, K.; Wu, S.; Dai, E.; Xu, Z. Flood loss analysis and quantitative risk assessment in China. Nat. Hazards 2012, 63, 737–760. [Google Scholar] [CrossRef]
- Eleuterio, J.; Martinez, D.; Rozan, A. Developing a GIS tool to assess potential damage of future floods. WIT Trans. Inf. Commun. Technol. 2010, 43, 381–392. [Google Scholar]
- Velasco, M.; Cabello, À.; Russo, B. Flood damage assessment in urban areas. Application to the Raval district of Barcelona using synthetic depth damage curves. Urban Water J. 2016, 13, 426–440. [Google Scholar] [CrossRef]
- Penning-Rowsell, E.; Johnson, C.; Tunstall, S.; Tapsell, S.; Morris, J.; Chatterton, J.; Green, C. The Benefits of Flood and Coastal Risk Management: A Manual of Assessment Techniques; The Multi-Coloured Manual; Flood Hazard Research Centre, Middlesex University: London, UK, 2005. [Google Scholar]
- Pedrono, M.; Locatelli, B.; Ezzine-de-Blas, D.; Pesche, D.; Morand, S.; Binot, A. Impact of Climate Change on Ecosystem Services. Climate Change and Agriculture Worldwide; Springer: Berlin/Heidelberg, Germany, 2016; pp. 251–261. [Google Scholar]
- Naso, S.; Chen, A.S.; Aronica, G.T.; Djordjević, S. A novel approach to flood risk assessment: The Exposure-Vulnerability matrices. E3S Web Conf. 2016, 7, 08007. [Google Scholar] [CrossRef]
- Shen, D.; Wang, J.; Cheng, X.; Rui, Y.; Ye, S. Integration of 2-D hydraulic model and high-resolution lidar-derived DEM for floodplain flow modeling. Hydrol. Earth Syst. Sci. 2015, 19, 3605–3616. [Google Scholar] [CrossRef]
- Yang, S.-Y.; Chan, M.-H.; Chang, C.-H.; Chang, L.-F. The Damage Assessment of Flood Risk Transfer Effect on Surrounding Areas Arising from the Land Development in Tainan, Taiwan. Water 2018, 10, 473. [Google Scholar] [CrossRef]
- Dahm, R.; Hsu, C.-T.; Lien, H.-C.; Chang, C.-H.; Prinsen, G. (Eds.) Next generation flood modelling using 3Di: A case study in Taiwan. In Proceedings of the DSD International Conference, Hongkong, China, 12–14 November 2014. [Google Scholar]
- Stelling, G.S. Quadtree flood simulations with sub-grid digital elevation models. Proc. Inst. Civ. Eng. 2012, 165, 567–580. [Google Scholar]
- Meesuk, V. Point Cloud Data Fusion for Enhancing 2D Urban Flood Modelling; CRC Press: Boca Raton, FL, USA, 2017. [Google Scholar]
- Merz, B.; Hall, J.; Disse, M.; Schumann, A. Fluvial flood risk management in a changing world. Nat. Hazards Earth Syst. Sci. 2010, 10, 509–527. [Google Scholar] [CrossRef]
- Birkmann, J. Measuring Vulnerability to Natural Hazards: Towards Disaster Resilient Societies; United Nations University: New York, NY, USA, 2006. [Google Scholar]
- Roy, P.S. Flood risk assessment using multi-criteria analysis: A case study from Kopili River Basin, Assam, India. Geomat. Nat. Hazards Risk. 2018, 9, 79–93. [Google Scholar]
- Karmakar, S.; Simonovic, S.P.; Peck, A.; Black, J. An Information System for Risk-Vulnerability Assessment to Flood. J. Geogr. Inf. Syst. 2010, 2, 129–146. [Google Scholar] [CrossRef]
- Saaty, T.L. A scaling method for priorities in hierarchical structures. J. Math. Psychol. 1977, 15, 234–281. [Google Scholar] [CrossRef]
- Goepel, K.D. A New AHP Excel Template with Multiple Inputs. 2013. Available online: http://bpmsg.com (accessed on 20 April 2018).
- Nasiri, H.; Yusof, M.J.M.; Ali, T.A.M. An overview to flood vulnerability assessment methods. Sustain. Resour. Manag. 2016, 2, 331–336. [Google Scholar] [CrossRef]
- Komolafe, A.; Herath, S.; Avtar, R. Sensitivity of flood damage estimation to spatial resolution. J. Flood Risk Manag. 2018, 11, S370–S381. [Google Scholar] [CrossRef]
- Chen, A.S.; Hammond, M.J.; Djordjević, S.; Butler, D.; Khan, D.M.; Veerbeek, W. From hazard to impact: Flood damage assessment tools for mega cities. Nat. Hazards 2016, 82, 857–890. [Google Scholar] [CrossRef]
- Bermúdez, M.; Zischg, A.P. Sensitivity of flood loss estimates to building representation and flow depth attribution methods in micro-scale flood modelling. Nat. Hazards 2018, 92, 1633–1648. [Google Scholar] [CrossRef]
- Ward, P.J.; De Moel, H.; Aerts, J.C.J.H. How are flood risk estimates affected by the choice of return-periods? Nat. Hazards Earth Syst. Sci. 2011, 11, 3181–3195. [Google Scholar] [CrossRef]
- Kobayashi, K.; Takara, K.; Sano, H.; Tsumori, H.; Sekii, K. A high-resolution large-scale flood hazard and economic risk model for the property loss insurance in Japan. J. Flood Risk Manag. 2016, 9, 136–153. [Google Scholar] [CrossRef]
- Collet, L.; Beevers, L.; Stewart, M.D. Decision-Making and Flood Risk Uncertainty: Statistical Data Set Analysis for Flood Risk Assessment. Water Resour. Res. 2018, 54, 7291–7308. [Google Scholar] [CrossRef]
- Wagenaar, D.J.; De Bruijn, K.M.; Bouwer, L.M.; De Moel, H. Uncertainty in flood damage estimates and its potential effect on investment decisions. Nat. Hazards Earth Syst. Sci. 2016, 16, 1–14. [Google Scholar] [CrossRef]
- Winter, B.; Schneeberger, K.; Huttenlau, M.; Stötter, J. Sources of uncertainty in a probabilistic flood risk model. Nat. Hazards 2018, 91, 431–446. [Google Scholar] [CrossRef]
- Lepeška, T. The impact of impervious surfaces on ecohydrology and health in urban ecosystems of Banská Bystrica (Slovakia). Soil Water Res. 2016, 11, 29–36. [Google Scholar] [CrossRef]
Figure 1.
Flowchart of the GIS-based flood loss and risk assessment.

Figure 2.
Study area and residential area.

Figure 3.
Comparison between flood simulation (blue color) and observation (red color) from the water level station at the (a) Yanzi Bridge during Typhoon Megi, (b) the Wangliao Bridge during Typhoon Megi, (c) the Yanzi Bridge during Typhoon Haitan, and (d) the Wangliao Bridge during Typhoon Haitang (unit: m).

Figure 4.
Flood hazard map: maximum flooding water depth during (a) 2016 Typhoon Megi and (b) 2017 Typhoon Haitang (unit: m).
Figure 4.
Flood hazard map: maximum flooding water depth during (a) 2016 Typhoon Megi and (b) 2017 Typhoon Haitang (unit: m).


Figure 5.
Vulnerability factors for (a) DEM (unit: m), (b) distance to river (unit: m), (c) distance to fire station (unit: m), and (d) population density (unit: persons/25 m2).
Figure 5.
Vulnerability factors for (a) DEM (unit: m), (b) distance to river (unit: m), (c) distance to fire station (unit: m), and (d) population density (unit: persons/25 m2).


Figure 6.
Vulnerability map in five levels from low (green color) to high (red color).

Figure 7.
Risk map in five levels from low (green color) to high (red color).

Figure 8.
Risk map in a residential area: (a) risk in the entire study area, (b) details in the Rende District, and (c) details in the South District.
Figure 8.
Risk map in a residential area: (a) risk in the entire study area, (b) details in the Rende District, and (c) details in the South District.


Table 1.
Depth-damage table for the residential area from the field survey.
| Depth-Damage | Depth (m) | ||||
|---|---|---|---|---|---|
| <0.15 | 0.15–0.35 | 0.35–0.7 | 0.7–0.9 | ≥2 | |
| Damage (NTD/m²) | 0 | 242 | 1136 | 1623 | 3607 |
Table 2.
Vulnerability weight values from the AHP.
| AHP Factor | Elevation | Distance to River | Distance to Fire Station | Population Density |
|---|---|---|---|---|
| Weight | 0.202 | 0.271 | 0.217 | 0.310 |
Table 3.
Flood losses from different spatial resolutions.
| Flood Event | Different Resolutions | |||||
|---|---|---|---|---|---|---|
| 1 m | 5 m | 10 m | ||||
| Area (m²) | Residential Loss (NTD) | Area (m²) | Residential Loss (NTD) | Area (m²) | Residential Loss (NTD) | |
| Megi 2016 | 515,477 | 257,760,212 | 539,148 | 258,043,549 | 611,390 | 277,865,133 |
| Haitang 2017 | 330,025 | 137,362,931 | 335,488 | 134,118,030 | 414,167 | 152,810,339 |
Table 4.
Flood loss comparison of l m resolution.
| Flood Event | Residential Loss in Different Resolution (NTD) | ||
|---|---|---|---|
| 1 m | 5 m | 10 m | |
| Megi 2016 | 257,760,212 | 258,043,549 | 277,865,133 |
| Difference from 1 m resolution | 0.1% | 7.8% | |
| Haitang 2017 | 137,362,931 | 134,118,030 | 152,810,339 |
| Difference from 1 m resolution | −2.4% | 11.2% | |
© 2019 by the authors. Licensee MDPI, Basel, Switzerland. This article is an open access article distributed under the terms and conditions of the Creative Commons Attribution (CC BY) license (http://creativecommons.org/licenses/by/4.0/).
Share and Cite
MDPI and ACS Style
Afifi, Z.; Chu, H.-J.; Kuo, Y.-L.; Hsu, Y.-C.; Wong, H.-K.; Zeeshan Ali, M. Residential Flood Loss Assessment and Risk Mapping from High-Resolution Simulation. Water 2019, 11, 751. https://doi.org/10.3390/w11040751
AMA Style
Afifi Z, Chu H-J, Kuo Y-L, Hsu Y-C, Wong H-K, Zeeshan Ali M. Residential Flood Loss Assessment and Risk Mapping from High-Resolution Simulation. Water. 2019; 11(4):751. https://doi.org/10.3390/w11040751
Chicago/Turabian StyleAfifi, Zulfahmi, Hone-Jay Chu, Yen-Lien Kuo, Yung-Chia Hsu, Hock-Kiet Wong, and Muhammad Zeeshan Ali. 2019. "Residential Flood Loss Assessment and Risk Mapping from High-Resolution Simulation" Water 11, no. 4: 751. https://doi.org/10.3390/w11040751
Note that from the first issue of 2016, this journal uses article numbers instead of page numbers. See further details here.