Dissolved and Particulate Organic Carbon in Icelandic Proglacial Streams: A First Estimate


1
Department of Geography, Philipps-University Marburg, 35032 Marburg, Germany
2
Department of Biology, Trent University, 1600 W Bank Dr, Peterborough, ON K9J 0G2, Canada
3
Department of Limnology and Bio-Oceanography, University of Vienna, 1090 Vienna, Austria
*
Author to whom correspondence should be addressed.
Water 2019, 11(4), 748; https://doi.org/10.3390/w11040748
Submission received: 24 February 2019
/
Revised: 5 April 2019
/
Accepted: 5 April 2019
/
Published: 10 April 2019
(This article belongs to the Section Water Quality and Contamination)
Abstract
:Here for the first time, we analyze the concentration of dissolved (DOC) and particulate organic carbon (POC), as well as its optical properties (absorbance and fluorescence) from several proglacial streams across Iceland, the location of Europe’s largest non-polar ice cap. We found high spatial variability of DOC concentrations and dissolved organic matter (DOM) composition during peak melt, sampling 13 proglacial streams draining the 5 main Icelandic glaciers. Although glacial-derived organic matter (OM) was dominated by proteinaceous florescence, organic matter composition was variable among glaciers, often exhibiting relatively higher aromatic content and increased humification (based on absorbance and fluorescence measurements) closer to the glacier terminus, modulated by the presence of glacial lakes. Additional sampling locations the in flow path of the river Hvitá revealed that while POC concentrations decreased downstream, DOC concentrations and the autochthonous fraction of OM increased, suggesting the reworking of the organic carbon by microbial communities, with likely implications for downstream ecosystems as glaciers continue to melt. Based on our measured DOC concentrations ranging from 0.11 mg·L−1 to 0.94 mg·L−1, we estimate a potential annual carbon release of 0.008 ± 0.002 Tg·C·yr−1 from Icelandic glaciers. This non-conservative first estimate serves to highlight the potentially significant contribution of Icelandic pro-glacial streams to the global carbon cycle and the need for the quantification and determination of the spatio-temporal variation of DOC and POC fluxes and their respective drivers, particularly in light of increased rates of melting due to recent trends in climatic warming.
1. Introduction
Glaciers have only recently been recognized as unique ecosystems, with the potential to affect the global carbon cycle [1]. These systems accumulate organic carbon (OC) from the deposition of carbonaceous material derived from terrestrial and anthropogenic sources, in addition to in-situ primary production [1,2,3,4]. Organic carbon stored in glacial ice is released as dissolved and particulate organic carbon (DOC, POC respectively), primarily through melt water at the glacier’s surface, and subglacial flow discharges into proglacial streams toward the ocean [5]. The POC component of glacial OC has been found to be considerable, and can exceed twice the DOC concentration [5]). Recent global estimations in a previous study [1] indicate annual exports of glacial DOC and POC of 1.04 Tg·C·yr−1 and 1.97 Tg·C·yr−1, respectively. Current global projections forecast cumulative POC exports of 78 Tg by 2050, more than double the total predicted export of DOC (32.4 Tg) for the same period [1].
When compared to non-glaciated catchments, the exported amount of OC of glacier ecosystems is typically low [5,6,7,8]. Exports support heterotrophic metabolism in proglacial streams, as the bioavailability of glacier-derived OC is noticeably higher (BDOC, 59 ± 20%; [3]) than those from headwaters in forested catchments (25 ± 5%; [8]) or in structured natural catchments, including forests, agricultural soils, or wetlands (mean 25%; [9]). Moreover, compared to temperate catchments, there are relatively less terrigenous OC inputs from the riparian zone or organic soils in glaciated catchments [10,11,12,13]. Microbial communities within these aquatic ecosystems can benefit from the partly high bioavailability of glacial DOC [3] and the export POC and associated nutrients, such as phosphorus [6]. Consequently, the composition and bioavailability of glacial-derived carbon plays an important role for the aquatic food web and for carbon cycling in the proglacial streams [13,14].
Currently, there is a lack of regional analysis of the total amount of organic carbon released from glaciers. Estimations of the global release of DOC and POC in a previous study [1] are based solely on 23 samples of the Antarctic Ice Sheet, 9 samples of the Greenland Ice Sheet, and 55 samples of mountain glaciers. Furthermore, although the release of glacial organic carbon has been investigated in proglacial streams and glacial ice in Alaska [1], the European Alps [3], Greenland [7,15,16,17], Svalbard [18], and Asia [19], to our knowledge, there is no comparable information available for Iceland. Thus, Icelandic glaciers were not included in the derivation of the global release of DOC and POC the previous study [1], which is surprising as the largest nonpolar ice cap of Europe (Vatnajökull) is located in Iceland [20]. Existing studies, including measurements of DOC and POC in Icelandic streams, focus around the impact of land degradation on carbon fluxes [21] and how damming impacts riverine fluxes to the ocean (both in northeastern Iceland; [22]). Other previous studies [23,24] measured the transport of dissolved solids, including DOC and POC concentration, during two glacier outburst floods (jökulhlaups, there exist no comparable measurements during normal flow conditions). Additionally, there is only one known study investigating DOC in Icelandic glacial ice, focusing on the diversity of snow algae [25].
It is expected that predicted climate-driven changes would have a greater impact on glacial runoff than other components of the hydrological cycle [1]. Glaciers constitute 11 % of the Icelandic land area, and range in size from 3 km² (Gljúfurárjökull) to 8100 km² (Vatnjajökull; [20]). These temperate glaciers have been shown to be particularly sensitive to climatic fluctuations on an annual to decadal scale [26]. Since the mid-1990’s, Icelandic glaciers have shown an average annual mass loss of 9.5 ± 1.5 Gt·yr−1, resulting in a total loss of 84 km³ from the icecap volume [9,27,28]. Due to the altitude differences and the geographical position of the glaciers within Iceland, at the border between Arctic and temperate seas, and the cold air masses of the Arctic and warm air masses of lower latitudes, Icelandic glaciers show varying mass balances depending on their position and aspect [20]. For example, over the period 1995 to 2010, Vatnajökull lost 3.7% of its total ice mass, while Hofsjökull and Langjökull both lost 11%. Furthermore, the ice cap Snæfellsjökull was lowered by 14 m on average between 1999 and 2008, corresponding to an average mass loss of 1.25 m.w.e. per year [29]. Model prediction for the future development of the mass balances to the year 2040 estimate a retreat of 25% of the current volume for Hofsjökull and Vatnajökull [30,31]. Particularly in the latter case, the southern outlet glaciers are vulnerable to warming and climate change [26,31]. At Langjökull, estimated volume reduction will be more intense at −35% of the total volume during the same time period, due its lower elevation in comparison to Hofsjökull and Vatnajökull [32].
While Icelandic glaciers show high accumulation rates during winter, they also show strong melting during summer [33]. In fact, it has been estimated that a total melting of all Icelandic glaciers would lead to a 1 cm rise in global sea level [28]. Presently, glaciers account for approximately 30% of the total runoff (1500 m³ s−1 of 5000 m³ s−1) in Iceland [30,34], highlighting the important hydrological role of glaciers in Iceland. Furthermore, in contrast to Greenland, several proglacial streams in Iceland have a relatively long flow path from the glacial terminus to the Atlantic Ocean, which may result in the input of additional terrestrial DOC inputs from the increasingly unglaciated downstream catchment area. This may impact the composition and bioavailability of OC along these streams [35,36]. However, their OC composition and concentration remain largely unknown.
Here for the first time, we investigate the concentration and composition of glacial-derived OC from Icelandic glaciers. We assess: (i) the concentration of dissolved and particulate organic carbon (DOC and POC), (ii) DOM composition (as absorbance and fluorescence) in several Icelandic proglacial streams, and (iii) the longitudinal changes of DOC and POC concentrations, as well as composition, along a proglacial stream from the glacier terminus to the Atlantic Ocean. The study illuminates the potential for significant contributions of Icelandic glaciers to global C cycling, capturing spatial variability across multiple proglacial streams from the 5 main Icelandic glaciers. Thus, this pilot study seeks to inform future work investigating spatial and temporal variability of DOC and POC in Icelandic proglacial streams. Furthermore, it contributes to an enhanced worldwide prediction of OC export from glaciers, as there is currently no comparable data with such a high spatial resolution available for Iceland.
2. Materials and Methods
2.1. Sampling Points
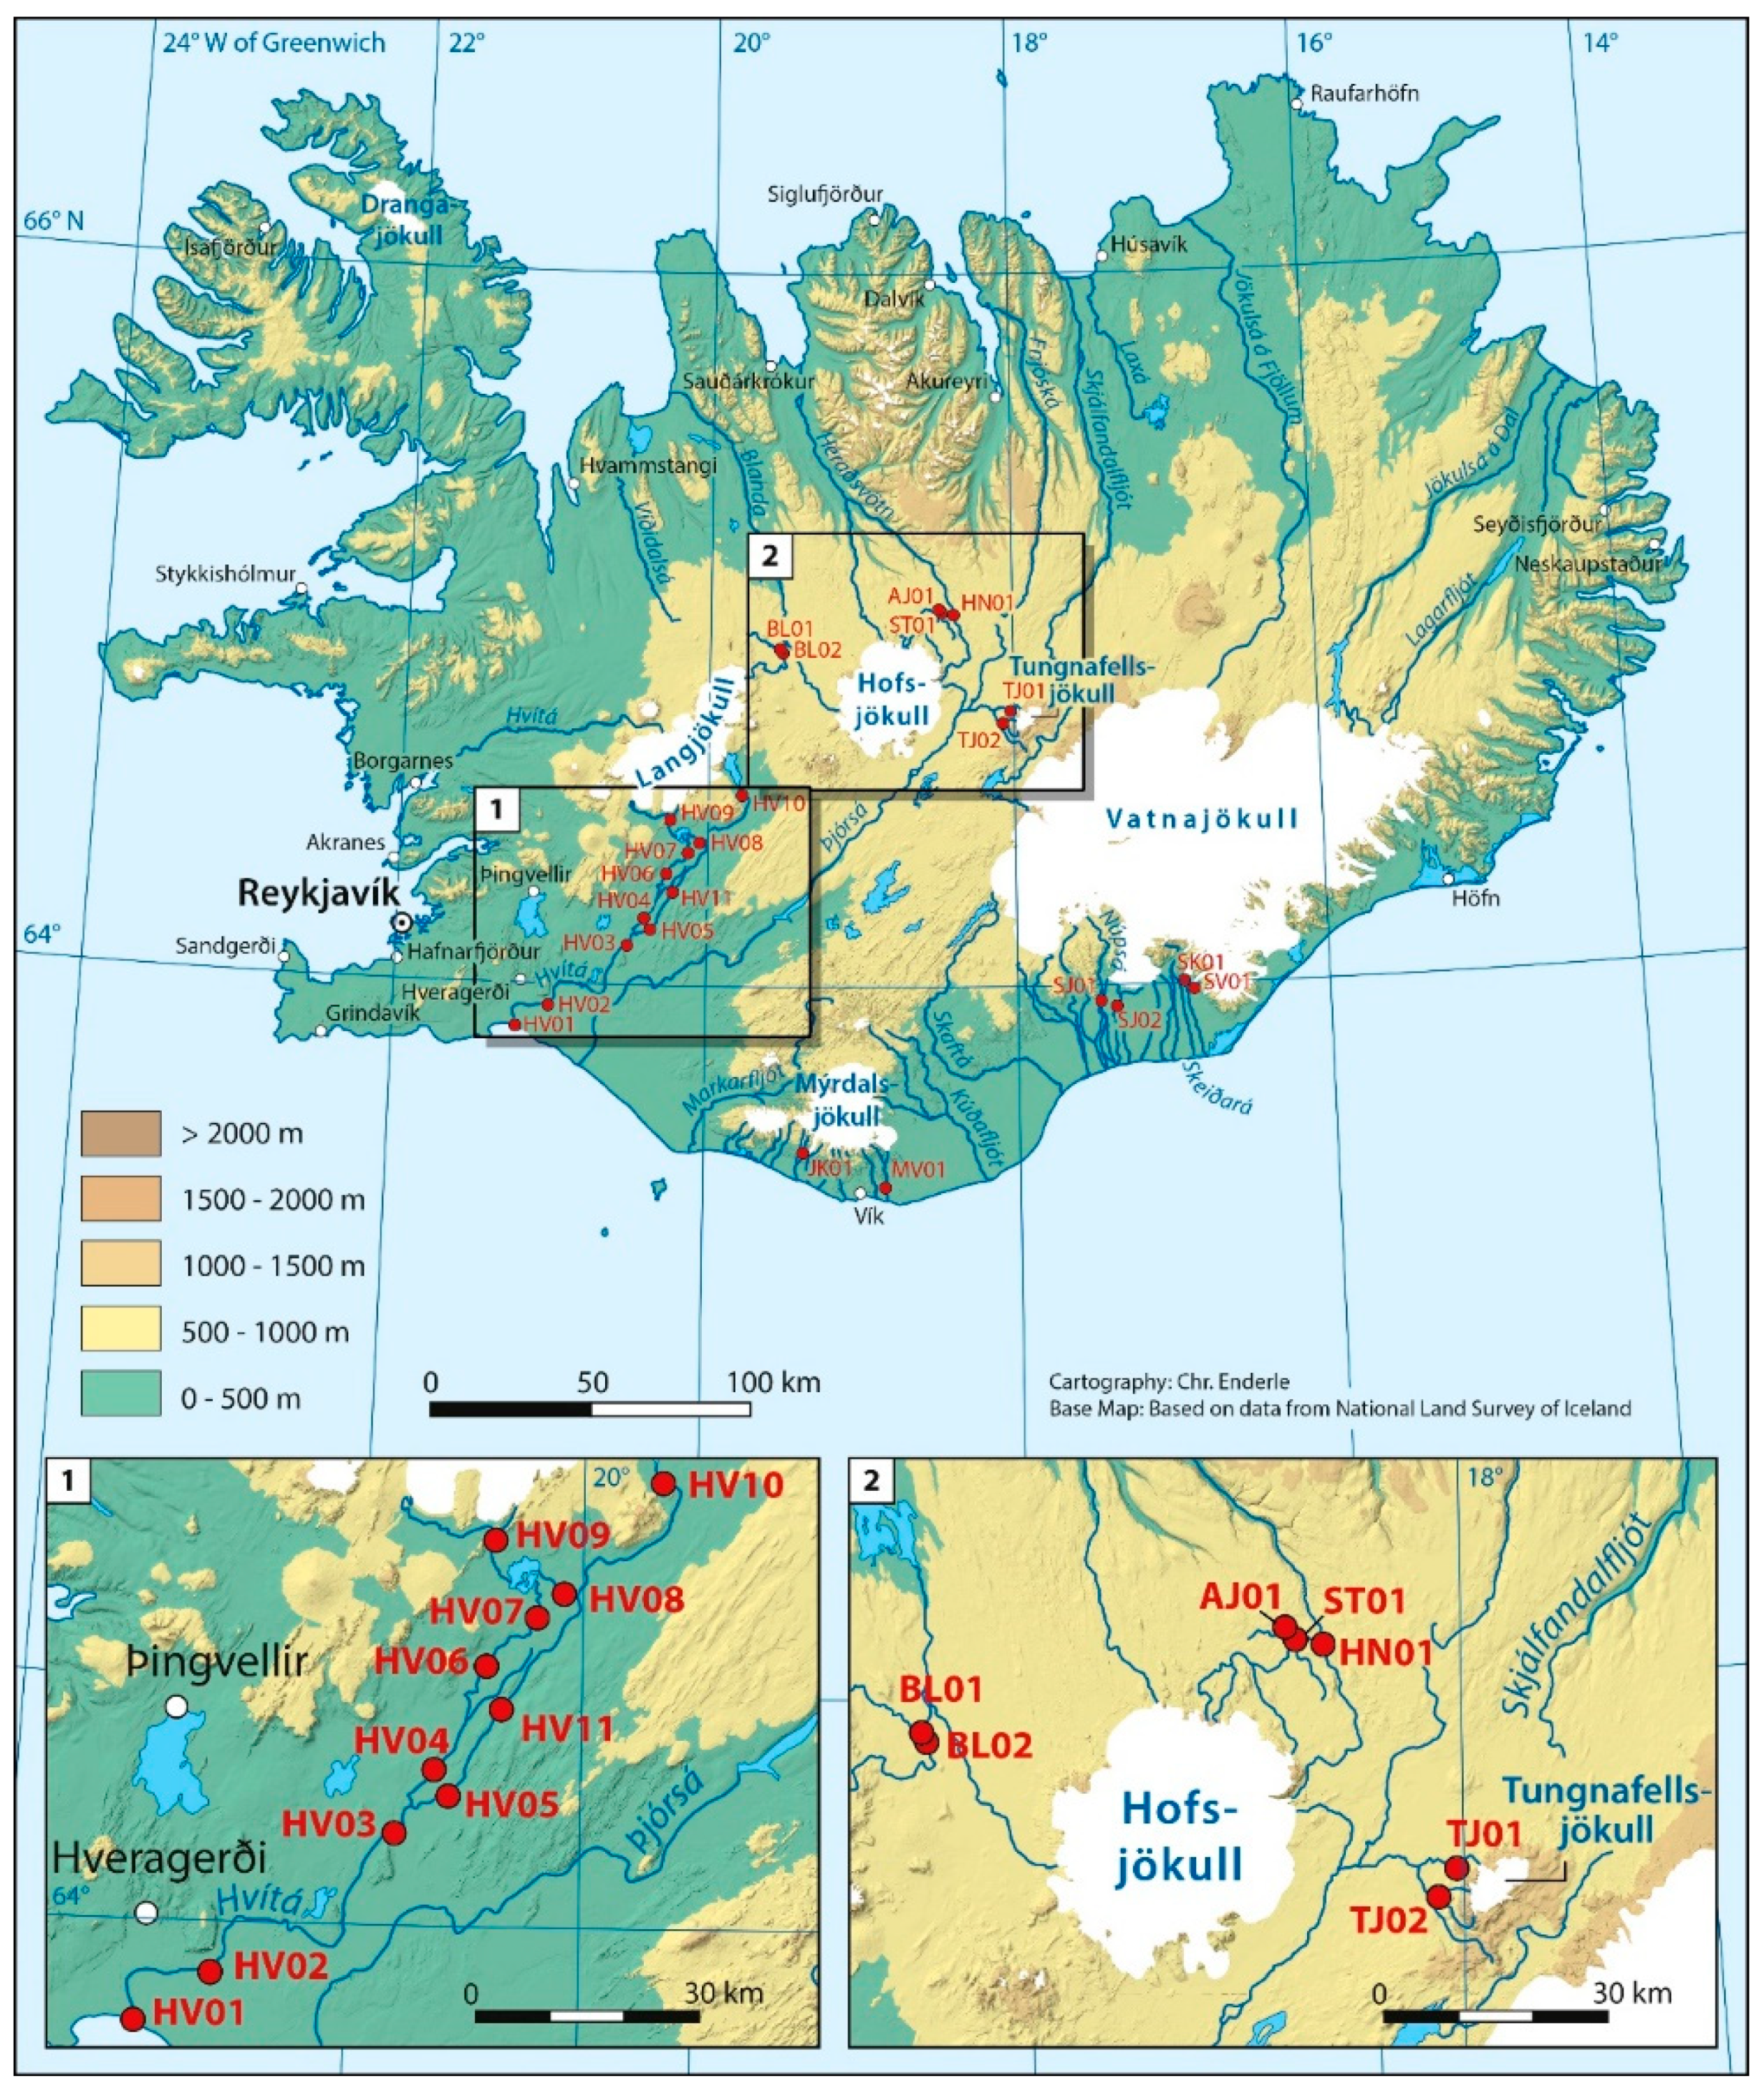
We sampled stream water from 24 proglacial stream sites, draining a total of 5 Icelandic glaciers during the peak of the melting season (snapshot samples, 23–31 July 2016). The melting season was chosen for sampling as during this period the ablation zones of the glaciers are free of snow and the proglacial streams comprise OC from several different meltwater sources (supraglacial, englacial, and subglacial). Based on results of [7,15,37], which were obtained in Greenland representing similar environmental conditions as exist in Iceland, during the summer melt season, the main water source areas of glacial OC are linked by a hydrological network within the glacial ecosystem, with the characteristics of the melt water in the proglacial streams reflecting the contribution of these sources [7,15,37]. Sampling points included melt water from glaciers of the Icelandic ice caps, namely Vatnajökull, Langjökull, Hofsjökull, Myrdalsjökull, and Tungnafellsjökull, comprising 13 individual proglacial streams, in addition to 2 streams originating in an unglaciated area for comparison (Figure 1, Table 1). Furthermore, in order to assess the riverine transformation of organic carbon and longitudinal variability, we took samples along the river Hvitá (9 additional sampling points), starting at the glacier Langjökull and ending at its terminus at the Atlantic Ocean in the southwest of Iceland. None of the sampling points in the proglacial streams or along the river Hvitá drained active volcanic sites.
2.2. Sample Preparation and Field Parameters
Electrical conductivity, water temperature, and pH of the unfiltered meltwater was measured using a regularly calibrated portable water quality meter (Hanna Combo HI98129). For further analyses (POC, DOC, and optical analysis), water samples (150 mL) were filtered on site using pre-combusted (4 h at 450 °C) glass fiber filters (Whatman GF/F), which is a commonly-used practice (e.g., Fasching et al. [38]). As we suspected high bioavailability, we used a double layer of GF/F filters according to Fasching et al. [38]. Each of the filters were individually stored in aluminum foil and the samples were kept cool (4 °C) and in the dark. Samples for DOC and optical analysis were stored in 40 mL glass vials (pre-soaked with 0.1 N HCl, rinsed thoroughly with purified water, and combusted for 4 h at 450 °C) sealed with Teflon-coated septa (pre-soaked with 0.1 N NaOH and rinsed thoroughly with purified water). Water samples were stored in a dark cooling box (4 °C) until shipment and laboratory analysis within 8 days of sampling.
2.3. Analysis of DOC and POC Concentration
DOC concentrations were measured using a TOC analyzer (TOC-L, Shimadzu, Japan—detection limit, 4 μg/L), using high-temperature combustion of organic matter (OM) followed by thermal detection of CO2. Prior to injection, DOC samples (GF/F-filtered) were automatically acidified in the analyzer as recommended by the manufacturer. The injection volume was 50 µL without any dilution. The calculation of the mean DOC concentration is based on the multiple injection approach, where the detected concentration of 2 out of 3 injections is used if the standard deviation between these two measurements does not exceed the value of 0.100. If the first two measurements exceeded a standard deviation of 0.100, a further injection and measurement was performed. If this value had been exceeded for all three measurements, the entire measurement process would have been repeated, but this was not the case. Using purified (Milli-Q) water, we also measured blanks for the correction of DOC concentration. The mass of total suspended solids (TSS) was determined by drying the glass fiber filters (65 °C) after sampling. POC was measured by determining mass lost upon combustion of the samples; the thoroughly dried samples were combusted at 550 °C, allowed to cool, and re-weighed to calculate the amount of particulate organic matter according to a previous study [39].
Clay minerals present in volcanic ash and soils may contain water stored within their layers. This water of hydration is expelled at ~300 °C [40], and thus during combustion of the sample (550 °C), potentially influencing particulate organic matter estimates. The dehydration of hydrated clay minerals, such as allophane, which are typical of volcanic ash, may result in a weight loss of up to 36%, with the majority of water of hydration being lost at ~110 °C [21,41]. Other common clay minerals, such as kaolinite or montmorillonite, show weight losses of about 14% and 15%, but lose the majority of their water of hydration only at higher temperatures [41]. Due to this uncertainty we did not attempt to estimate POC fluxes. We estimated DOC fluxes using a simple approach based on annual glacial discharges [30] and measured DOC concentrations in the proglacial streams nearby the glacier termini. Although it is likely that a substantial amount of the measured DOC concentrations originate from the glaciers, we acknowledge that we cannot directly infer total loss from glaciers.
2.4. Absorbance Measurements, Excitation Emission Matrices (EEMs), and Parallel Factor Analysis (PARAFAC)
The excitation emission matrices (EEMs) were generated by measuring fluorescence intensities at excitation wavelengths ranging from 200 to 450 nm (5 nm increments) and emission wavelengths from 250 to 700 nm (2 nm increments), with a scan speed of 12,000 nm·min−1 according to a previous study [3]. We used a 1 cm quartz cuvette and a fluorescence spectrometer (Shimadzu RF-6000) for analysis. Raw EEM matrices were corrected with MilliQ blanks, and the inner filter effect was corrected for using corresponding absorbance measurements. EEMs are expressed in Raman units using the Raman peak area of MilliQ as a reference value. Absorbance was measured using a UV-VIS spectrophotometer (Genesys 10S, ThermoFisher) and 1 cm quartz cuvettes. Absorbance and fluorescence measurements were conducted at the Department of Geography, Philipps-University of Marburg, and used to calculate a suite of indices, such as the slope ratio, used as an indicator of molecular weight (SR, [42]), as well as the specific UV absorbance at 280 nm (SUVA280; [43]), indicating aromaticity. In addition, the humification index (HIX; [44]) and the freshness index (ß/α; [45,46])) were used to determine the degree of humification, autochthonous input, and DOM source, respectively. Based on excitation emission matrices (EEM) generated by measuring the fluorescence of DOM (Shimadzu RF-6000), parallel factor analysis (PARAFAC, [47]) was used to model individual fluorescent components and to detect the likely origin of glacial DOM (Figure 1). Modeling was performed in Matlab (7.11.0) using the DOMFluor Toolbox (1.7; containing the N-Way toolbox, 3.1; [48]. The PARAFAC model was validated using the functions “split-half validation” and residual analysis [47]. Using this technique, we determined that two components could be validated. Residual analysis confirmed that the two-component model was adequate, explaining the majority of the variation in the EEMs, with C1 representing humic-like fluorescence and C2 representing protein-like fluorescence of tyrosine and tryptophan [49,50].
2.5. Statistical Analyses
All multivariate and statistical analyses were performed using the statistical environment R (R Core Team, 2017) and the package vegan [51]. To assess the spatial variability of DOM we computed a principal component analysis (PCA), based on the optical indices and fluorescent components of the proglacial streams. All variables were centered and z-standardized before performing the PCA. The contour lines visualize the gradient of POC in the ordination and were added to the ordination using the vegan package function “ordisurf”, which utilizes generalized additive models.
3. Results and Discussion
3.1. DOC and POC Concentration in the Proglacial Streams
Measured DOC-concentrations were relatively low (average: 0.226 mg·L−1), ranging from 0.11mg·L−1 to 0.94 mg·L−1 (Figure 2 and Table 2), but were closely bracketed by values measured in the melt water for comparable regions, such as the Greenland Ice Sheet (average: 0.51 mg·L−1), Antarctic Ice Sheet (0.43 mg·L−1) and mountain glaciers (0.37 mg·L−1) [1]. POC concentrations ranged from 0.67 mg·L−1 to 84.67 mg·L−1 (with the higher values typically occurring at points with considerable anthropogenic influence) and exceeded their respective DOC concentrations at every sampling location (Figure 1 and Figure 2, Table 2). This observed relationship between DOC and POC is comparable to the Greenland Ice Sheet, but contrasts small glaciers in the European Alps, where the concentrations of DOC and POC are more or less equal [1]. Nevertheless, studies citing comparable POC values are limited [1]. We hypothesize that lake size may play an important role in POC sedimentation. Samples taken downstream of the larger lakes Sandvatn (HV07) and Hvítárvatn (HV10) showed relatively lower POC concentrations (0.67 mg·L−1 and 4.0 mg·L−1 respectively), the likely result of sedimentation of organic and inorganic material within the lake. A comparatively high POC concentration (56.0 mg·L−1) was measured at the terminus of Hagafellsjökull (HV08), despite the presence of a small glacial lake between the outlet of the glacier Hagafellsjökull and the sampling point. Glacial melt water from the Skaftafellsjökull (SK01) and the Svínafellsjökull (SV01) displayed similar DOC and POC concentrations of 0.15 mg·L−1 and 40 mg·L−1 and 0.14 mg·L−1 and 46 mg·L−1, respectively. In contrast, the two main rivers draining the Súlujökull and Skeidarárjökull (sampling points: SJ01, SJ02) showed different DOC and POC concentrations, which suggests the influence of local factors, such as slope, glacier size, meltwater temperature, or differences within the glacial catchment itself. Additionally, the POC concentration at point SJ01 was higher than at the other three sampling points within this main glacier. These observations suggest proglacial lakes may affect POC concentrations at the points SJ02, SV01, and SK01, due to the presence of the larger proglacial lake between the glacier terminus and sampling point in comparison to point SJ01.
The DOC and POC concentrations of the proglacial streams differed between the individual glaciers. Higher DOC concentrations were measured in the proglacial streams originating from Hofsjökull (AJ01, HN01) and Langjökull (BL02), with values ranging from 0.16 mg·L−1 to 0.26 mg·L−1. DOC concentrations of the proglacial streams, related to the main glacier (Mýrdalsjökull: JK01, MV01; Langjökull: e.g., HV10, HV09; Tungnafellsjökull: TJ01, TJ02; Vatnajökull: SK01, SJ01, SJ02, SV01), were found to be lower (0.11 mg·L−1 to 0.16 mg·L−1). POC concentrations of the proglacial streams draining Vatnajökull and Mýrdalsjökull peaked at 84.67 mg·L−1 and 70 mg·L−1, respectively. Such elevated concentrations may have implications for biogeochemical processes in the ocean, due to the relatively short distance from the glacier terminus of these glaciers to the North Atlantic Ocean compared to the other glaciers [15]. Therefore, it may be possible that the majority of OC is transported to the coastal zone without substantial processing within the proglacial stream (e.g. burial, microbial reworking, outgassing etc.), or retained in reservoirs, such as in the northeast of Iceland [22]. This increased input of organic carbon of Mýrdalsjökull and Vatnajökull should be taken into account, since terrestrial organic carbon, especially from glacial runoff, represents an important source of carbon to near-shore coastal areas [15,52].
3.2. DOC and POC Concentrations along the River Hvitá (from Glacier Terminus to Ocean)
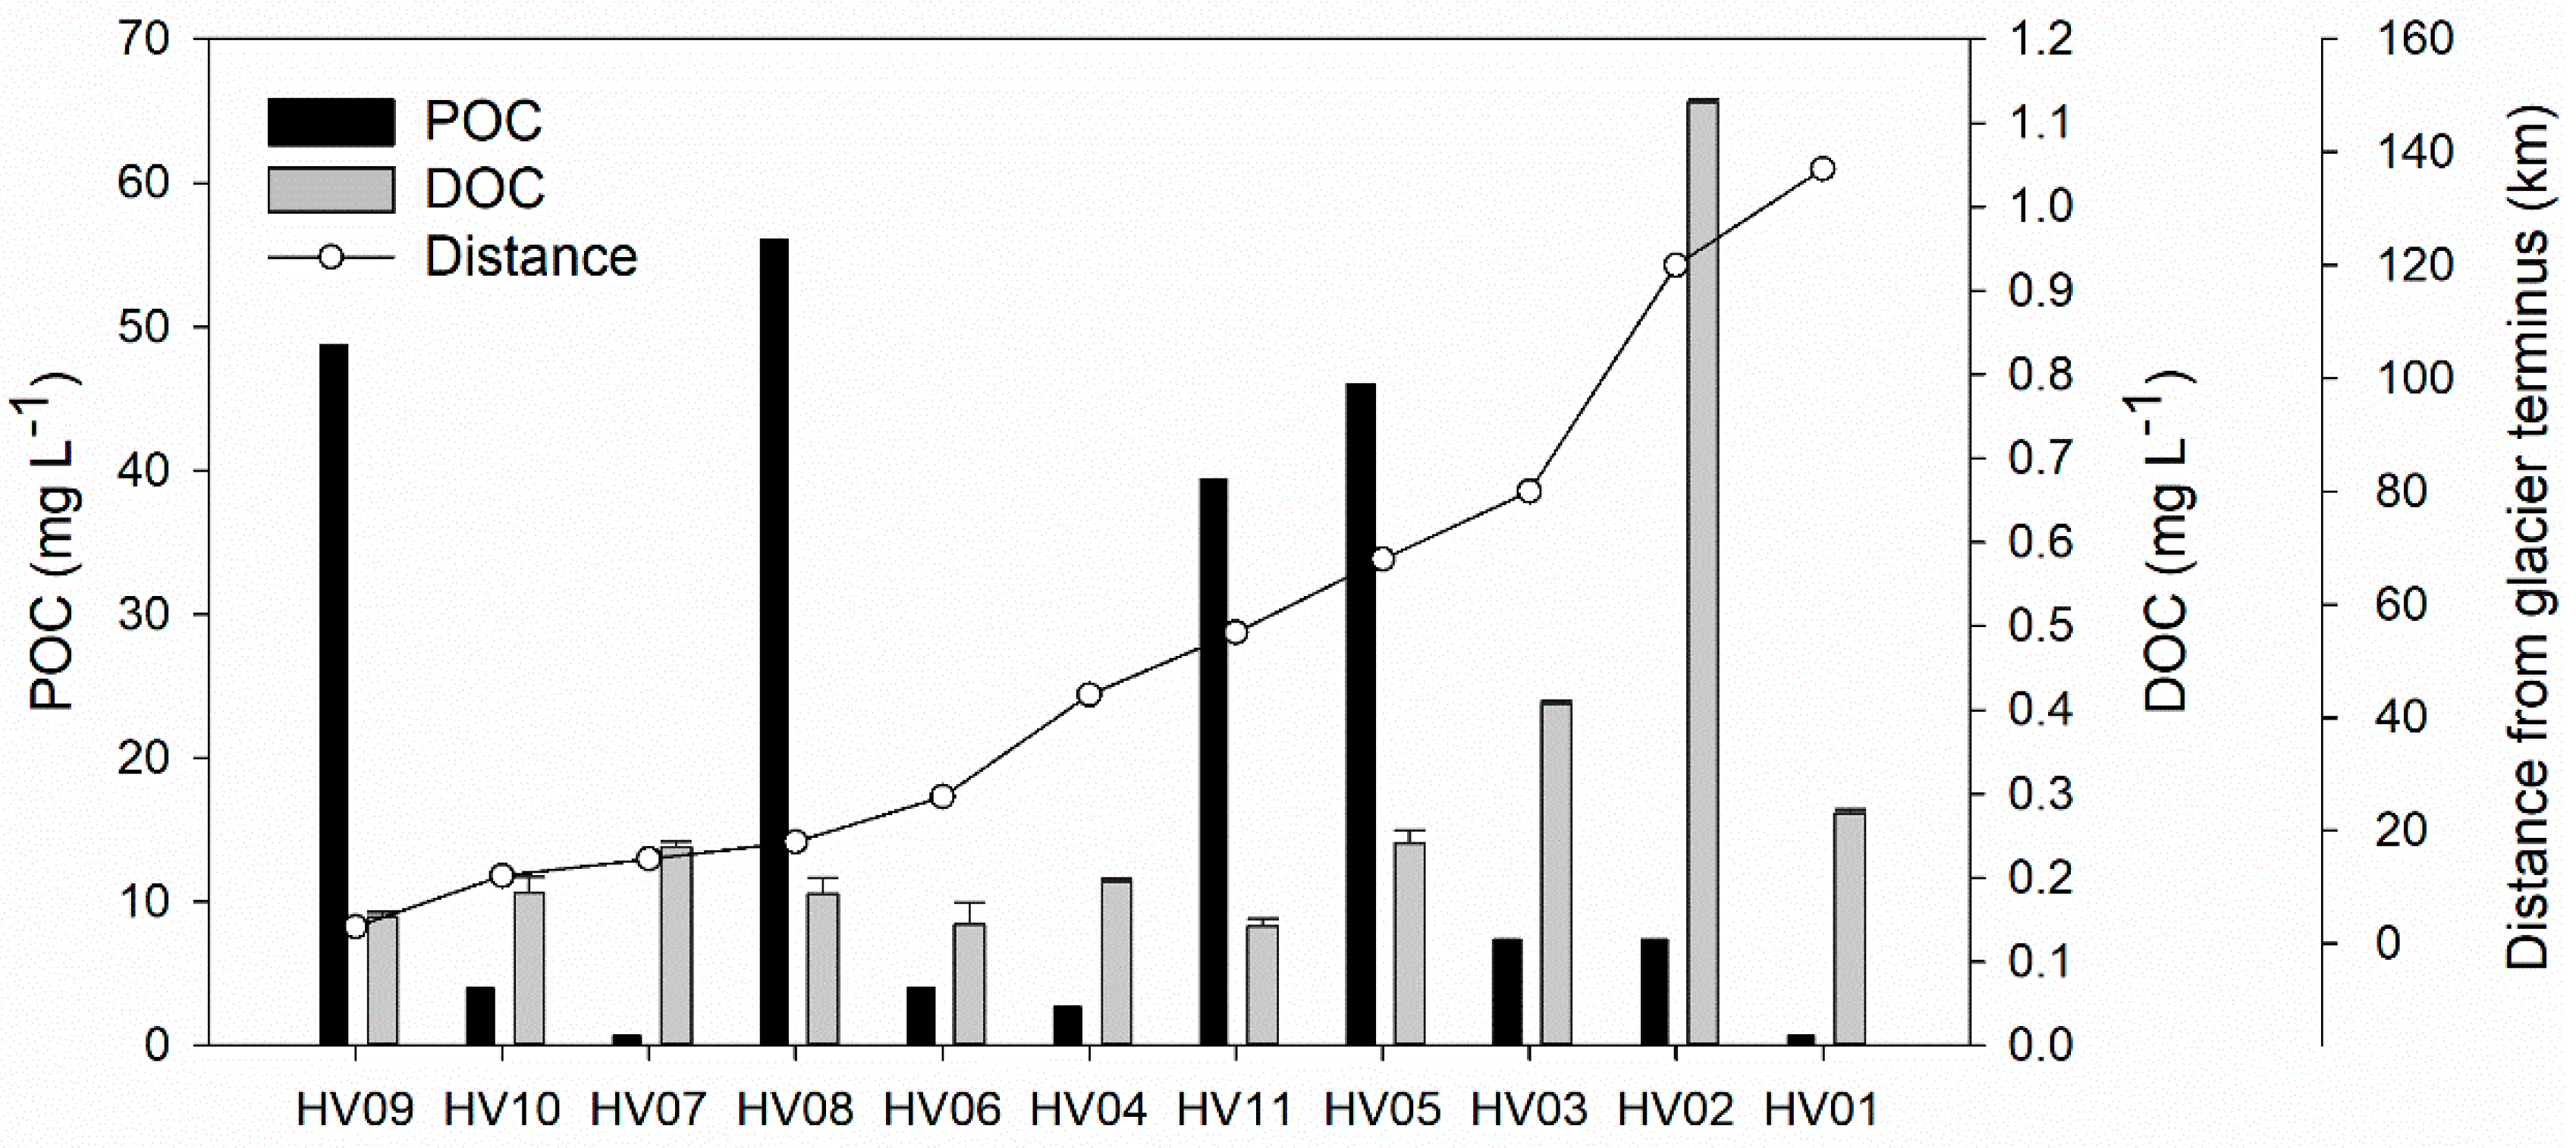
Both POC and DOC concentration varied longitudinally along the river Hvitá, from the proglacial lakes Hagavatn and Hvítárvatn toward the river mouth at the Atlantic Ocean nearby Eyrarbakki (Figure 3). DOC concentrations at the outlet of both lakes were similar, whereas the POC concentration differed, with the lower concentrations at HV10 likely a result of sedimentation within the larger lake Hvítárvatn. Along the flow path of the rivers Hvitá (HV11, HV05) and Tungufljiot (HV07, HV06, HV04), DOC concentration remained relatively constant, indicating limited input of further OC from the surrounding catchment, likely due to sparse or complete lack of vegetation [13]. This underlines the importance of glacier-derived organic carbon inputs to the proglacial streams in the upper reaches. Downstream, the vegetation cover of the catchment increased along with anthropogenic impact, likely resulting in the observed elevated DOC concentrations—the highest DOC concentration was measured near an urbanized location, Selfoss, HV02 (0.94 mg·L−1). We hypothesize that the potential discharge of effluent from communities directly or indirectly to the river at Selfoss may contribute to high DOC concentrations at this site. Furthermore, between sites HV02 and HV01 there is a large lake, where sedimentation may occur, accounting for the observed lower DOC concentration at HV02 [53]. Similarly, the high POC concentrations along the flowpath of the river Hvitá may be caused by anthropogenic influence or high clay mineral content present in the samples (see methods section) or other environmental factors.
The observed longitudinal changes of DOC concentration along the proglacial stream Hvitá highlights the importance of glacial-derived OC for downstream carbon balance. Urban settlements (near HV02) likely led to the observed spike in DOC concentration (up to 0.94 mg·L−1), while along the length of the stream (80 km) between HV10 (most upstream sampling point) and HV03 (upstream of the settlement), DOC concentration only increased from 0.15 mg·L−1 to 0.34 mg·L−1. Finally, at the estuary of the river Hvitá, located at the end of the lagoon Ölfusá, the DOC concentration decreased, possibly as a result of the influence of incoming seawater, indicated by the substantially higher electrical conductivity at this location (Table 2). Low flow velocities in the lagoon may induce sedimentation and cause lower stream water POC concentrations. A previous study [52] highlighted the role of estuaries as a critical link for the transport of DOC and POC between terrestrial and marine ecosystems. Similarly, the role of lagoons, which are typical for the southwest coast of Iceland, have to be taken into account in terms of the export of OC into the ocean.
3.3. Composition and Spatial Variability of Glacial OC in Icelandic Proglacial Rivers
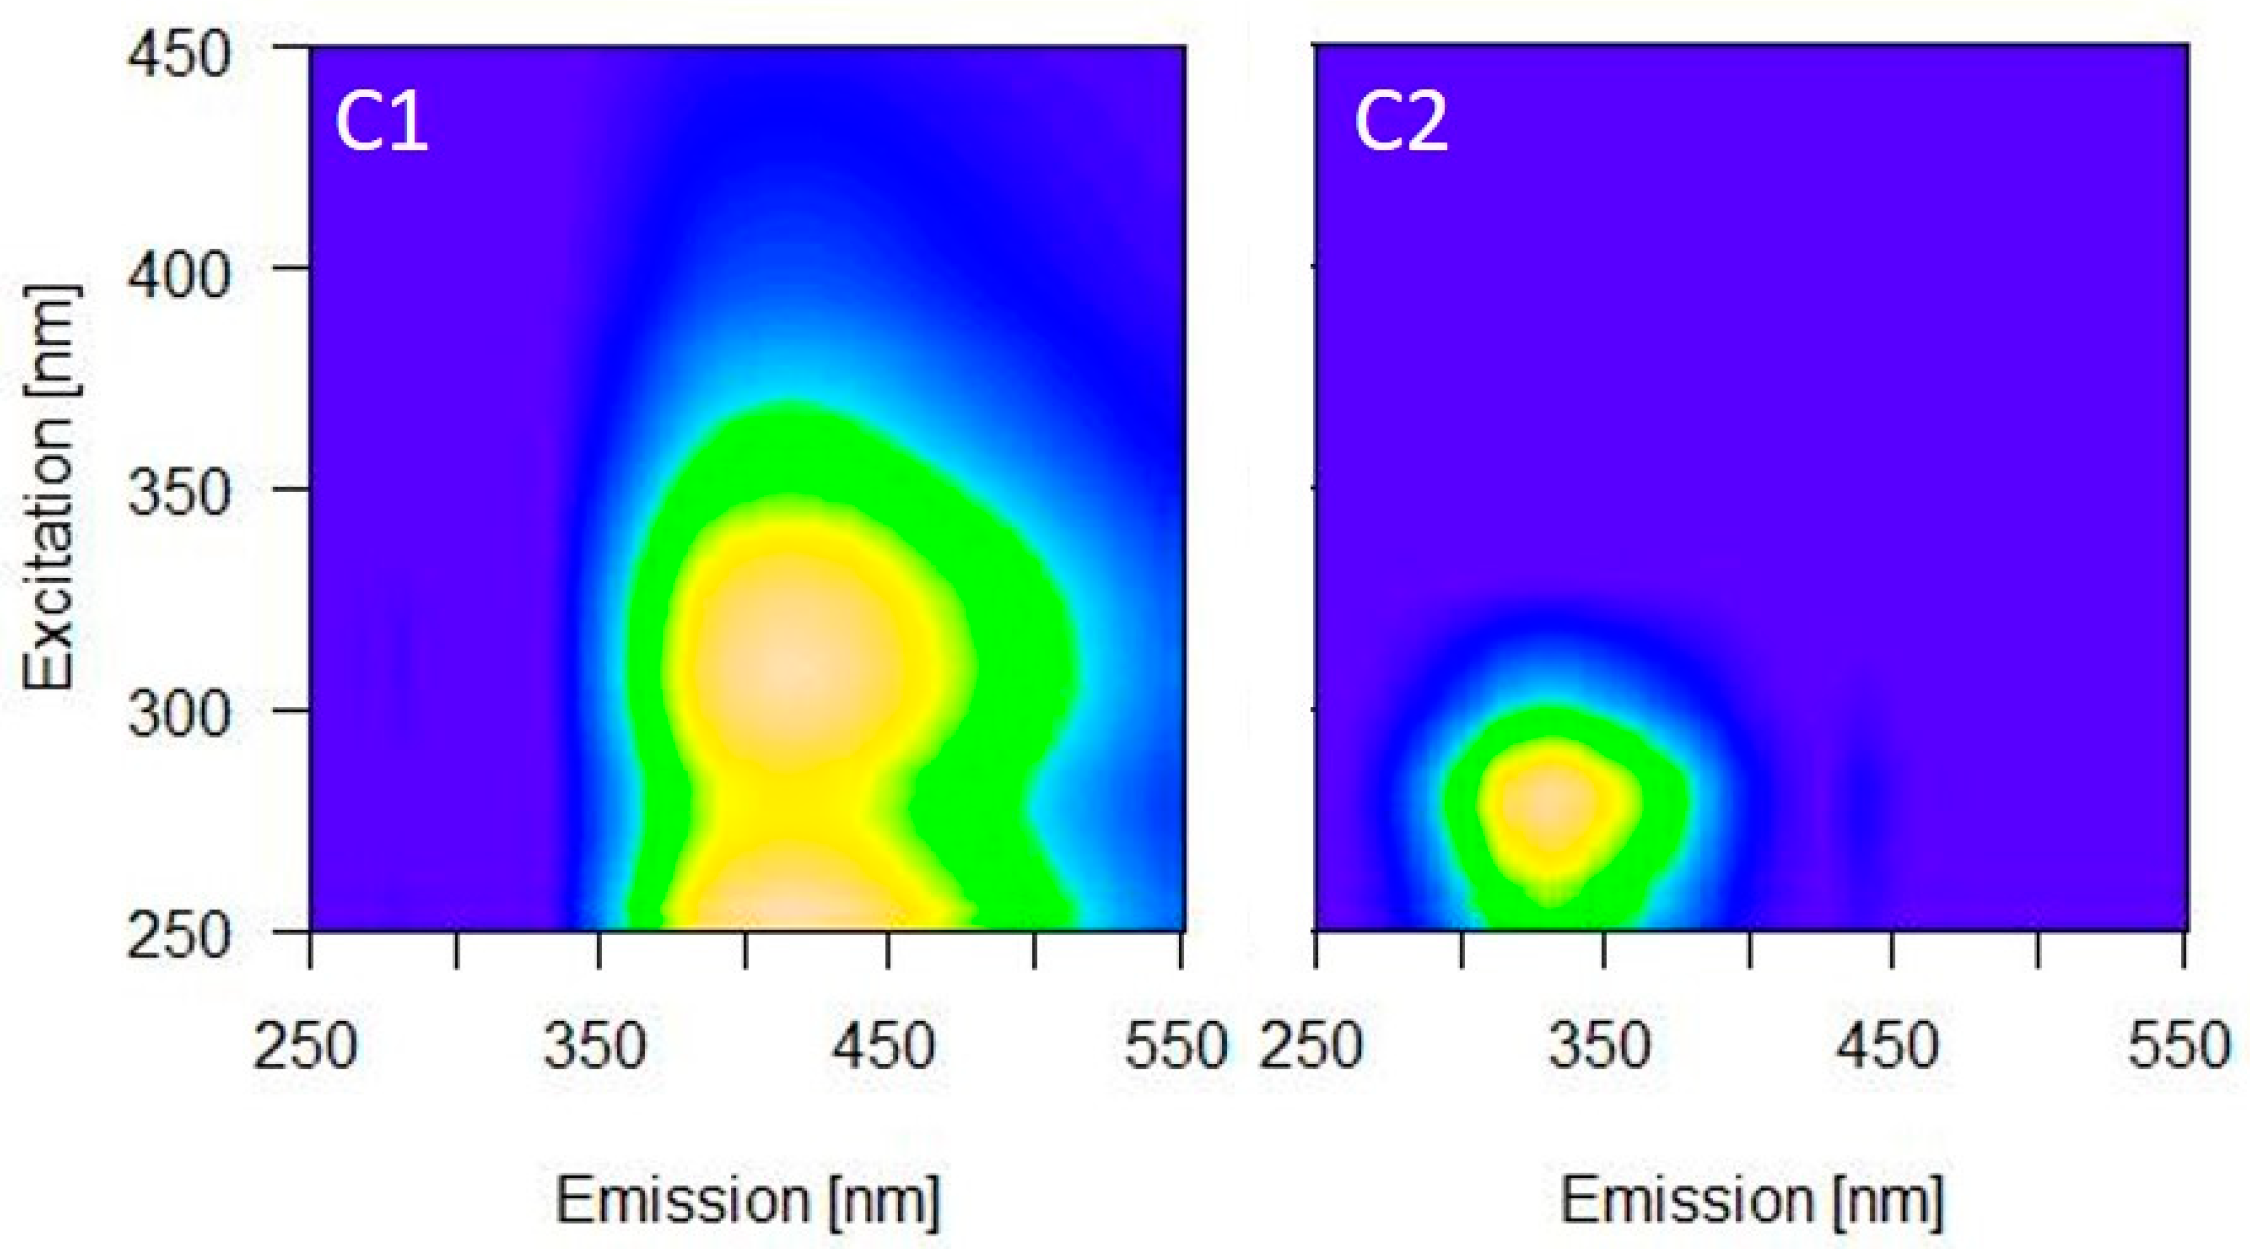
Based on the generated excitation emission matrices (EEM) and using PARAFAC, two individual fluorescent components were modeled (Figure 4). The first component resembled the humic-like fluorescence of terrestrial/allochthonous origin, comparable to peak A found in a previous study [49]. The second component resembled the protein-like fluorescence of tyrosine and tryptophan [49,50], which are prominent contributors to total DOM fluorescence in various glaciers [6,54]. This protein-like fluorescence indicates freshly produced DOM, possibly derived from algae and bacteria, as often observed in glacial environments [55]. We acknowledge that our comparatively small sample size adds some degree of uncertainty to the PARAFAC results, and likely does not capture the full diversity of fluorophores in these environments. However, the high percentage of C2 (47–92%) points to proteinaceous DOM as a main contributor to glacial DOM, which is in line with findings of previous studies in other glacial environments [55,56].
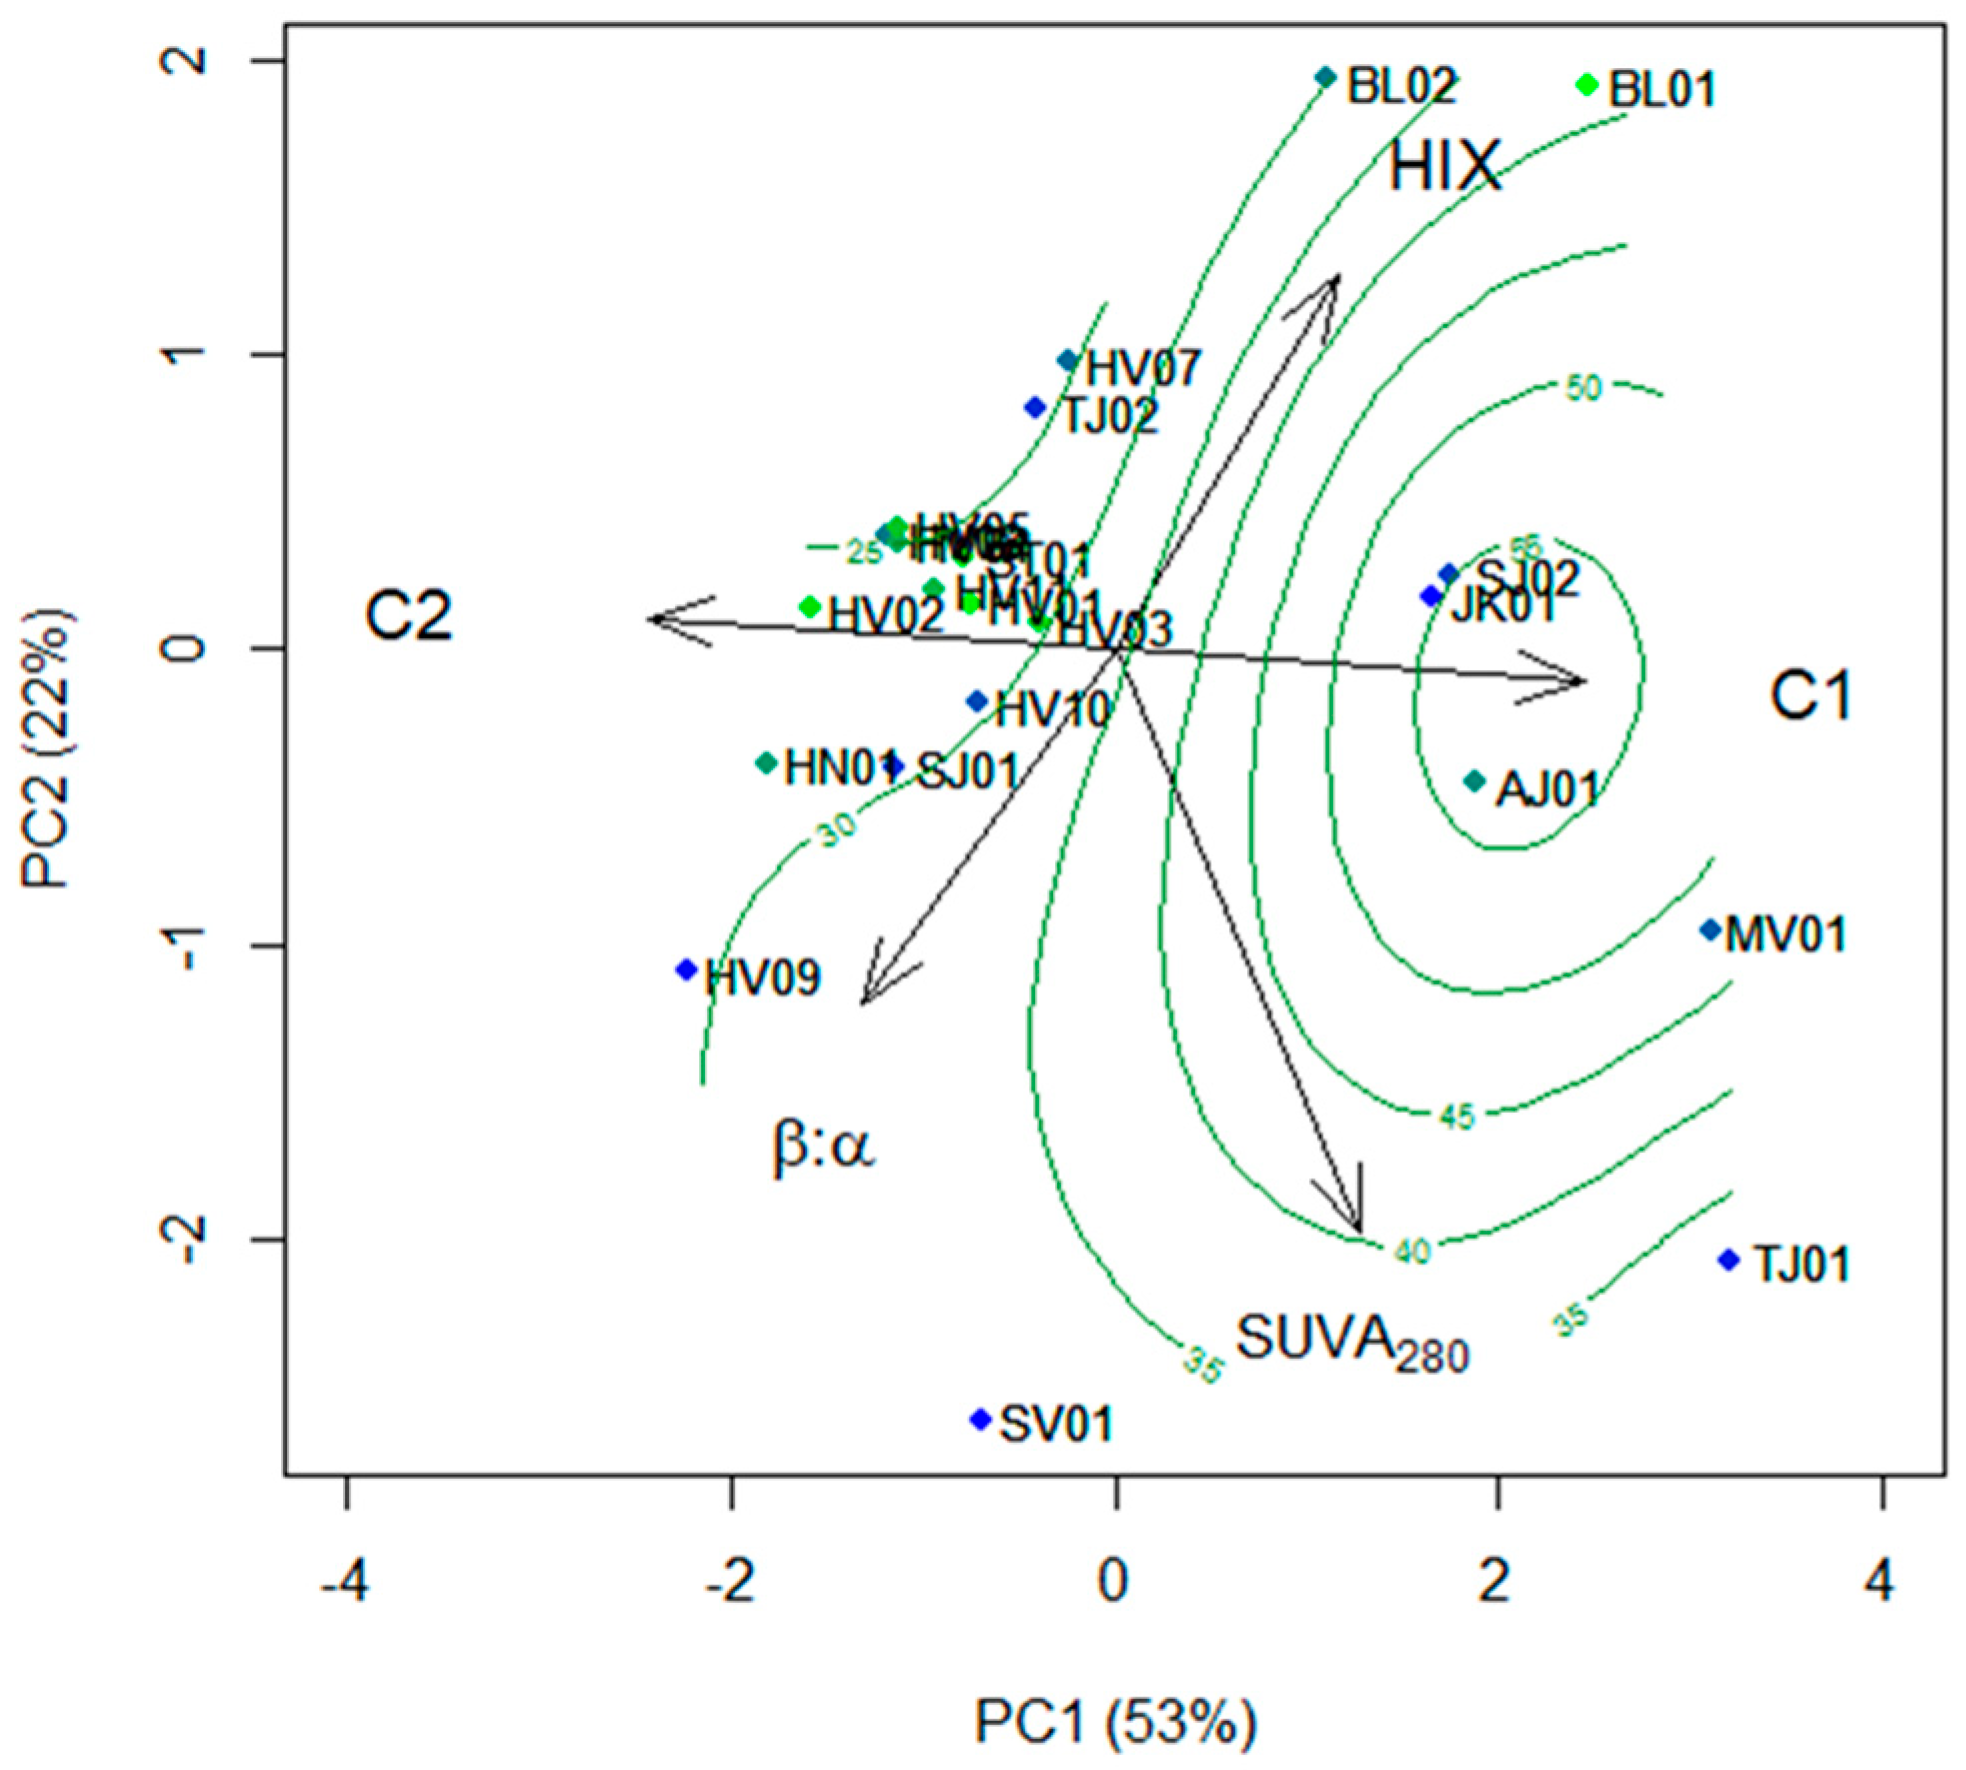
To assess the spatial variability of DOM within the sampled proglacial streams, we computed a principal component analysis (PCA), based on the optical indices and fluorescent components of the proglacial streams (Figure 5). The PCA revealed a gradient from more terrestrial contributions, as indicated by higher % C1, to more proteinaceous contributions, characterized by higher % C2 and higher freshness (higher β/α). Although glacial DOM generally exhibited high proteinaceous fluorescence (C2), the PCA revealed DOM properties to vary among glaciers, with sampling points closer to the glacier termini being more closely related in terms of DOM optical composition. Glacial-derived DOM from Langjökull was composed of relatively fresher DOM (higher β/α), with a higher contribution of the protein-like component C2, while glacial derived DOM from Myrdalsjökull contained relatively more terrestrial-like material (higher contributions of C1 and higher HIX) (Figure 2). However, the sampling points closest to the glacier termini showed distinct optical properties, differing from the other sampling points in the same region (Figure 6). This may be partially due to increased residence times in the proglacial lakes at the glacier terminus. In fact, the sampling points TJ01, SV01, and JK01 were in close proximity (1–3 km) to the terminus of the glaciers Tungnafellsjökull, Svinafellsjökull, and Sólheimajökull, but their DOM composition was highly variable (Figure 2 and Figure 5). Meltwater closer to the terminus of the glaciers Tungnafellsjökull and Sólheimajökull exhibited a relatively more terrestrial character, possibly pointing to ancient vegetation stored in glacial ice and released upon melt as the OC source. Although a previous study [56] found that elevated contributions of glaciers in a catchment increase the fraction of proteinaceous DOM in proglacial streams, another study [3] found phenolic compounds derived from vascular plants or soil associated with humic-like fluorescence dominate the highly diverse glacial derived DOM. This indicates that glacial melt exhibits a distinct DOM composition, which is likely the result of surrounding soils or ancient vegetation [3], as well as autochthonous sources, possibly derived from microbial activity and algae [55,56]. Upon release, this diverse array of DOM would be subject to microbial metabolism, possibly explaining downstream compositional changes [57].
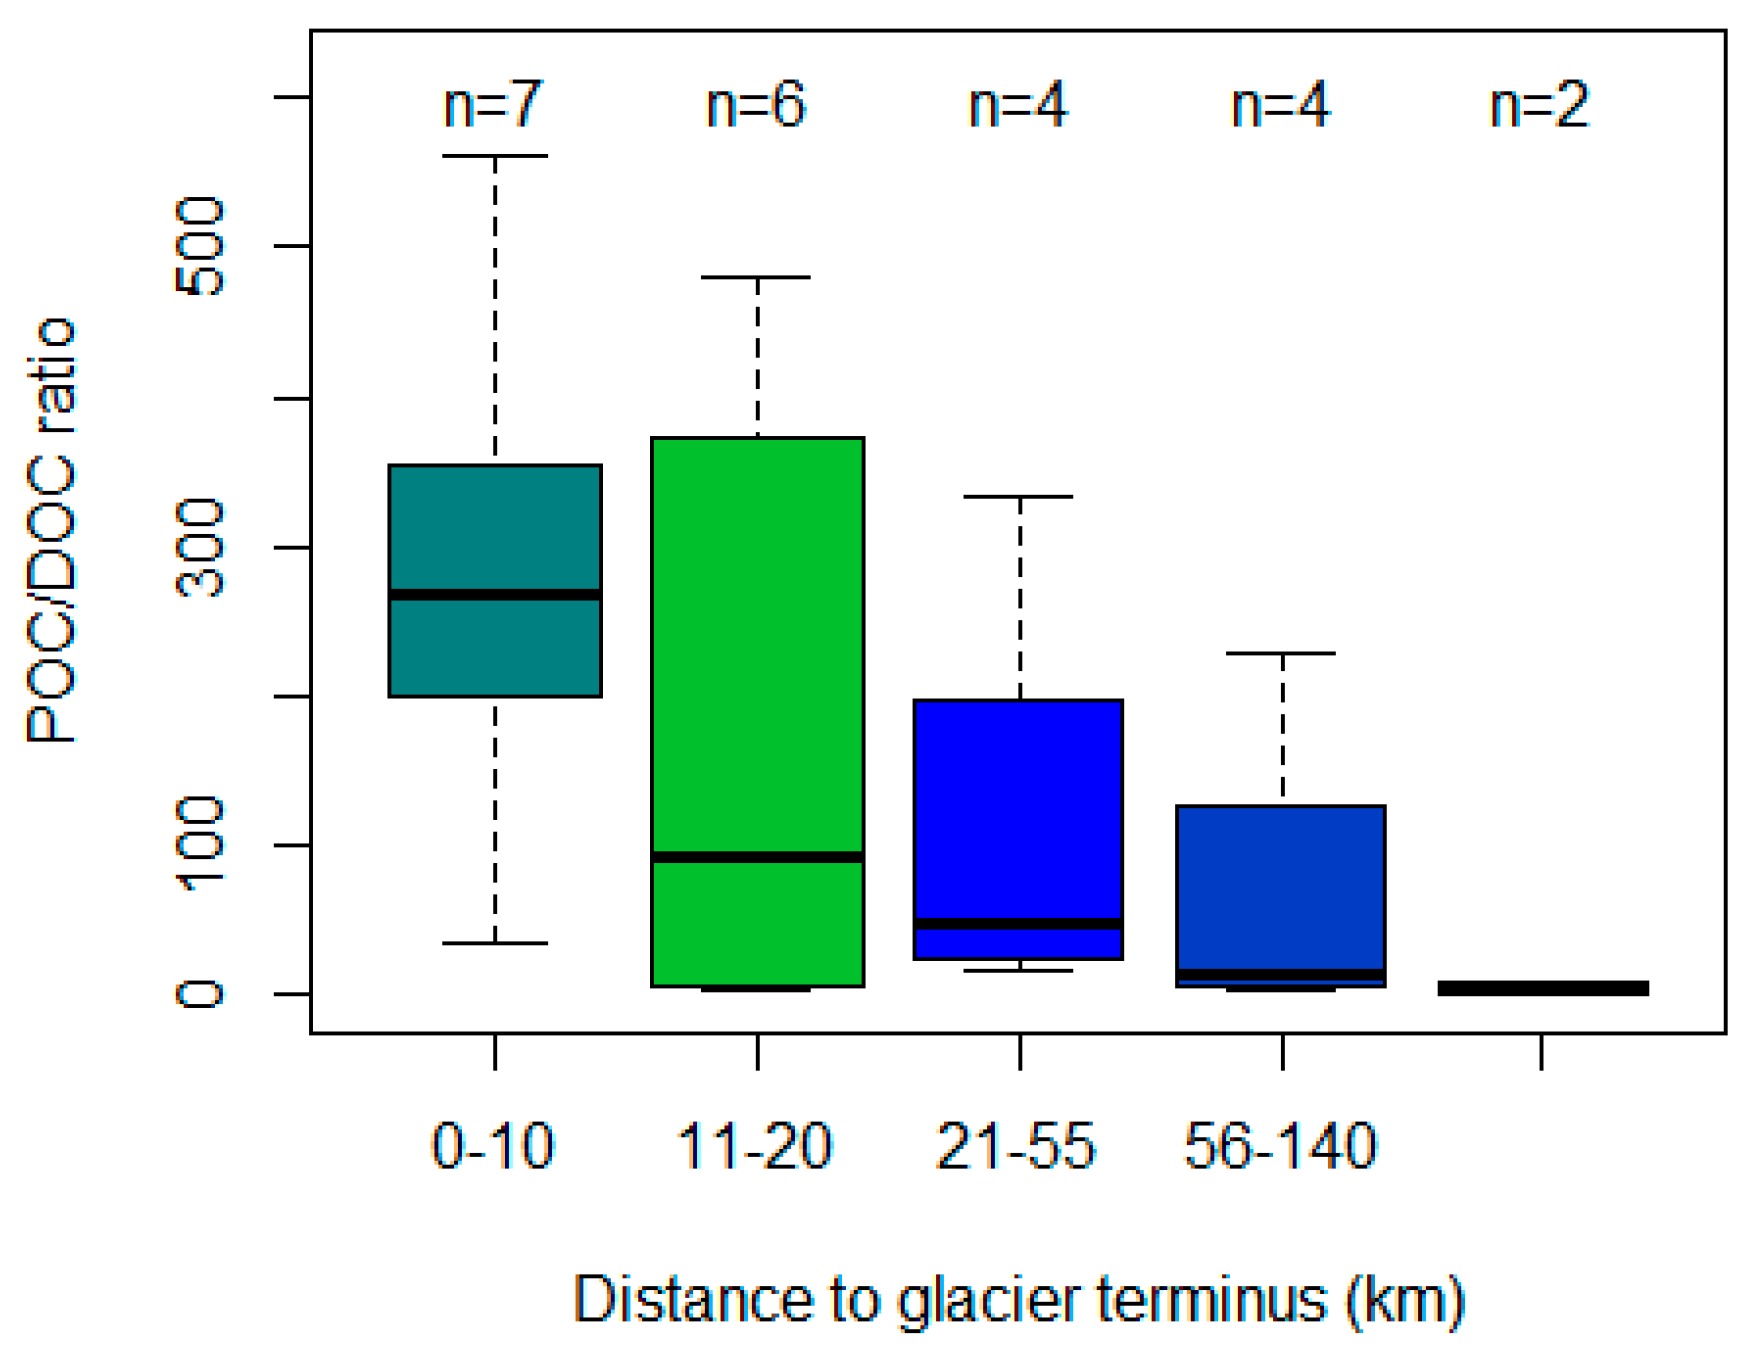
POC concentrations exhibited a distinct spatial pattern, with samples corresponding to the highest values in proglacial streams originating from the glaciers Vatnajökull, Myrdalsjökull, and Hofsjökull, and lower values in Langjökull. POC represented the quantitatively more important fraction of OC. We found POC to decrease, while DOC increased (linear regression, r2 = 0.21, p < 0.05, n = 21) with the distance from the glacier termini (Figure 3 and Figure 6). In fact, POC concentrations were highest close to the glacier termini, especially compared to streams draining unglaciated areas. The further distances (>30 km) from the glacier terminus were only represented by the river Hvitá, which we sampled at multiple locations (n = 11) in order to investigate the occurrence of longitudinal variability of DOM along the flow path of Icelandic proglacial streams. Thus, further studies investigating the change in DOC and POC over stream distances > 30 km from the glacier terminus of multiple streams would be needed to confirm if the observed trend is generally applicable for Icelandic and other similar stream systems. The observed decrease in POC may be due to direct use and reworking by benthic organisms [58]. Furthermore, POC retention is often strongly correlated with macroinvertebrate abundance, particularly with respect to detritivorous invertebrates, which utilize POC as a source of nutrition [59,60]. POC is directly used by a variety of invertebrates, and so may represent a more direct pathway of carbon transfer than the “microbial loop” with its inherent respiratory losses [58]. In fact, the findings of previous studies [13,61] support the idea that the observed POC decrease may be due to direct use and reworking by benthic organisms. Here, filter-feeders of POC (especially Simulidae, blackflies) only occur in downstream reaches of the glacial river, while the most upper river sections are only inhabited by algae scrapping chironomid larvae due to the harsh environmental conditions. The observed shift from relatively more terrestrial to autochthonous DOM (Figure 7) moving downstream may be the result of recent autochthonous in-stream production, likely from algae or reworking of the material [62].
Optical DOM characteristics along the river Hvitá revealed that sampling points at the lower part of the river had similar characteristics (e.g., HV01, HV02, HV03, HV05) (Figure 5), with particularly the proteinaceous component (C2) showing high intensities along the flow path (Figure 7, indicated by the color). A changed DOM composition became recognizable at the sampling points HV07, HV09, and slightly at HV10, which are located in the headwater of the river Hvitá, at shorter distances to the glacier terminus (Table 1). Similarly, [14] found that glacier derived carbon was incorporated into consumer biomass in a proglacial stream in southeast Alaska. Additionally, photooxidation [42] or sorption to the streambed may play a role in the loss of OC along the flow path of the stream. In Iceland, proglacial streams with a short distance (approximately 2 to 9 km) from the glacier terminus to the Atlantic Ocean are numerous, and therefore glacial OC may be subjected to comparatively less alteration, and may directly serve as a source of carbon and nutrients for marine aquatic heterotrophs. However, the influence of the influx of glacial derived and riverine organic matter on the trophodynamics of coastal marine food webs is still not well understood [52,63].
3.4. DOC Flux
We estimated a potential average annual DOC flux from Icelandic glaciers at 0.008 ± 0.0002 Tg C yr−1. This first estimation is based on the product of mean DOC concentrations of sampled proglacial streams and the mean glacial stream runoff of 1500 m³ s−1 from Icelandic glaciers [30]. We include only samples <20 km from the glacier terminus (n = 13), as these likely represent locations consisting of a mix of different meltwater sources (supraglacial, englacial, and subglacial) accounting for potential differences in meltwater source DOC. We are aware that this first estimate is based on peak melt conditions and a single sampling, and suggest it serve as an upper, non-conservative DOC flux estimate for Icelandic glaciers under ongoing and continued high glacial melt.
Given our study focused on peak melting conditions to capture the full diversity of DOC and POC sources, there may be considerable variation in OC concentration and composition within the melting period. Considering seasonal variations of OC concentrations, our estimate may represent values close to the upper boundary for expected Icelandic glacier DOC fluxes. Furthermore, our study represents an initial estimation of particulate organic matter focusing on POC, and does not investigate particulate organic nitrogen (PON) concentrations. A previous study [22] estimated a mean annual flux of 185 t N yr−1 and 106 ton N yr−1 (period 1998–2003), respectively, for the two rivers Jökulsá á Dal and Lagafljót in the north of Vatnajökull. Our study findings result in an estimated annual release of DOC, weighted by the glaciated area of Iceland (11,060 km²; [64]), of 0.0007 ± 0.0002 Gg C year−1 km−2. This value exceeds the area-weighted estimations of the Greenland Ice Sheet and the European Alps (0.0002 Gg C year−1 km−2 each) [1,64] and highlights the significance of Icelandic glaciers and underlines the absolute necessity to include the Icelandic glaciers in global organic carbon budgets.
4. Conclusions
For the first time we investigate the spatial variability of DOC and POC in proglacial streams in Iceland, highlighting the importance of including Icelandic glaciers in current global organic carbon budgets and further expanding the current understanding of glacial OC composition and the role of glacier-derived OC for downstream carbon fluxes. DOC-concentrations ranged between 0.11 and 0.94 mg·L−1 and are comparable with values in other regions (e.g., Alaska, Greenland, European Alps), while POC concentrations exceeded those of the DOC concentration in every investigated proglacial stream. Although DOM composition was highly variable, especially in aromaticity and humification, it was generally dominated by proteinaceous fluorescence, and often changed distinctly downstream of the glacier terminus, possibly due to the presence of proglacial lakes acting as sites of sedimentation, and or biological transformation and mineralization processes. The high variability of glacial OC concentration and composition may be the result of a mix of terrestrial sources and in-situ production, and reworking of OC in glaciers and proglacial streams. Additionally, the observed longitudinal DOC concentration patterns highlight the importance of glacial-derived OC for downstream carbon balance and the effect of anthropogenic influences on DOC concentration (up to 0.94 mg·L−1) and its downstream transport. We acknowledge that our samples representing longitudinal variability beyond 30 km from the glacier terminus are based on the river Hvitá. Nevertheless, our study gives a first estimate of the potential for spatial and longitudinal variation in proglacial stream POC and DOC concentrations and export to the ocean from Icelandic glacial streams. Future studies including replicate sampling of multiple streams and repeated sampling over space and time to account for spatial and temporal (diurnal–seasonal) variability and the effect of drivers, such as temperature and discharge, land use, and anthropogenic impacts, would serve to confirm the validity and transferability of these first findings to similar streams within Iceland, and other proglacial stream networks globally.
According to recent predictions, an increase of glacial runoff can be expected, which will considerably impact the input of glacial-derived OC to proglacial streams [65,66]. Our findings give a first and important insight into the spatial variability of DOC and POC concentration, as well as the DOM composition in Icelandic proglacial streams, which ultimately transport glacial DOM into the ocean. In contrast to the Greenland ice sheet, the predicted melt rates for Icelandic glaciers are distinctly higher, thus the release of OC stored in Icelandic glaciers is important for the surrounding environment, with implications for downstream ecosystems and associated species. In order to further constrain current predictions of the OC export due to the rapid melting of Icelandic glaciers, further studies of both proglacial streams and glacial ice are required.
Author Contributions
Research concept and project organization was developed by P.C.; sampling was conducted by P.C. and M.R.; lab analyses and data interpretation was carried out by C.F., K.S.B., and L.D.; original manuscript was written by P.C. and C.F. with assistance from M.R., K.S.B., and L.D.; manuscript review and editing was conducted by P.C., K.S.B. and C.F.
Funding
This research was funded by federal state resources (Hesse, Germany). We propose funds for covering the costs or part of the costs to publish in open access via the Open Access Fund of the Philipps-University Marburg supported by the German Research Foundation (DFG).
Acknowledgments
We are grateful to Gísli Már Gíslason and Guðfinna ðalgeirsdóttir from the University of Iceland, Reykjavik, for support in the organization of the field trip, and Olga Schechtel for preparing lab equipment and assistance with water chemical analyses.
Conflicts of Interest
The authors declare no conflict of interest.
References
- Hood, E.; Battin, T.J.; Fellman, J.; O’neel, S.; Spencer, R.G. Storage and release of organic carbon from glaciers and ice sheets. Nat. Geosci. 2015, 8, 91. [Google Scholar] [CrossRef]
- Anesio, A.M.; Hodson, A.J.; Fritz, A.; Psenner, R.; Sattler, B. High microbial activity on glaciers: Importance to the global carbon cycle. Glob. Chang. Biol. 2009, 15, 955–960. [Google Scholar] [CrossRef]
- Singer, G.A.; Fasching, C.; Wilhelm, L.; Niggemann, J.; Steier, P.; Dittmar, T.; Battin, T.J. Biogeochemically diverse organic matter in Alpine glaciers and its downstream fate. Nat. Geosci. 2012, 5, 710–714. [Google Scholar] [CrossRef]
- Stibal, M.; Šabacká, M.; Žárský, J. Biological processes on glacier and ice sheet surfaces. Nat. Geosci. 2012, 5, 771–774. [Google Scholar] [CrossRef]
- Mulholland, P.J. Dissolved organic matter concentration and flux in streams. J. N. Am. Benthol. Soc. 1997, 16, 131–141. [Google Scholar] [CrossRef]
- Barker, J.D.; Sharp, M.J.; Fitzsimons, S.J.; Turner, R.J. Abundance and dynamics of dissolved organic carbon in glacier systems. Arct. Antarct Alp. Res. 2006, 38, 163–172. [Google Scholar] [CrossRef]
- Bhatia, M.P.; Das, S.B.; Longnecker, K.; Charette, M.A.; Kujawinski, E.B. Molecular characterization of dissolved organic matter associated with the Greenland ice sheet. Geochim. Cosmochim. Acta 2010, 74, 3768–3784. [Google Scholar] [CrossRef]
- Volk, C.J.; Volk, C.B.; Kaplan, L.A. Chemical composition of biodegradable dissolved organic matter in streamwater. Limnol. Oceanogr. 1997, 42, 39–44. [Google Scholar] [CrossRef]
- Risse-Buhl, U.; Hagedorn, F.; Dümig, A.; Gessner, M.O.; Schaaf, W.; Nii-Annang, S.; Gerull, L.; Mutz, M. Dynamics, chemical properties and bioavailability of DOC in an early successional catchment. Biogeosciences 2013, 10, 4751–4765. [Google Scholar] [CrossRef]
- Castella, E.; Adalsteinsson, H.; Brittain, J.E.; Gislason, G.M.; Lehmann, A.; Lencioni, V.; Lods-Crozet, B.; Maiolini, B.; Milner, A.M.; Olafsson, J.S.; et al. Macrobenthic invertebrate richness and composition along a latitudinal gradient of European glacier-fed streams. Freshwater Biol. 2001, 46, 1811–1831. [Google Scholar] [CrossRef]
- Gíslason, G.M.; Ólafsson, J.S.; Adalsteinsson, H. Animal communities in Icelandic rivers in relation to catchment characteristics and water chemistry. Hydrol. Res. 1998, 29, 129–148. [Google Scholar] [CrossRef]
- Gíslason, G.M.; Ólafsson, J.S.; Adalsteinsson, H. Life in glacial and alpine rivers in central Iceland in relation to physical and chemical parameters. Hydrol. Res. 2000, 31, 411–422. [Google Scholar] [CrossRef]
- Gíslason, G.M.; Hansen, I.; Ólafsson, J.S.; Svavarsdóttir, K. Longitudinal changes in macroinvertebrate assemblages along a glacial river system in central Iceland. Freshwater Biol. 2001, 46, 1737–1751. [Google Scholar] [CrossRef]
- Fellman, J.B.; Hood, E.; Raymond, P.A.; Hudson, J.; Bozeman, M.; Arimitsu, M. Evidence for the assimilation of ancient glacier organic carbon in a proglacial stream food web. Limnol. Oceanogr. 2015, 60, 1118–1128. [Google Scholar] [CrossRef]
- Bhatia, M.P.; Das, S.B.; Xu, L.; Charette, M.A.; Wadham, J.L.; Kujawinski, E.B. Organic carbon export from the Greenland ice sheet. Geochim. Cosmochim. Acta 2013, 109, 329–344. [Google Scholar] [CrossRef]
- Bhatia, M.; Das, S.B.; Kujawinski, E.B.; Henderson, P.; Burke, A.; Charette, M.A. Seasonal evolution of water contributions to discharge from a Greenland outlet glacier: Insight from a new isotope-mixing model. J. Glaciol. 2011, 57, 929–941. [Google Scholar] [CrossRef]
- Lawson, E.C.; Wadham, J.L.; Tranter, M.; Stibal, M.; Lis, G.P.; Butler, C.E.; Laybourn-Parry, J.; Nienow, P.; Chandler, D.; Dewsbury, P. Greenland ice sheet exports labile organic carbon to the Arctic oceans. Biogeosciences 2014, 11, 4015–4028. [Google Scholar] [CrossRef]
- Zhu, Z.Y.; Wu, Y.; Liu, S.M.; Wenger, F.; Hu, J.; Zhang, J.; Zhang, R.F. Organic carbon flux and particulate organic matter composition in Arctic valley glaciers: Examples from the Bayelva River and adjacent Kongsfjorden. Biogeosciences 2016, 13, 975–987. [Google Scholar] [CrossRef]
- Spencer, R.G.; Guo, W.; Raymond, P.A.; Dittmar, T.; Hood, E.; Fellman, J.; Stubbins, A. Source and bioavailability of ancient dissolved organic matter in glacier and lake ecosystems on the Tibetan Plateau. Geochim. Cosmochim. Acta 2014, 142, 64–74. [Google Scholar] [CrossRef]
- Björnsson, H.; Pálsson, F.; Gudmundsson, S.; Magnússon, E.; Adalgeirsdóttir, G.; Jóhannesson, T.; Berthier, E.; Sigurdsson, O.; Thorsteinsson, T. Contribution of Icelandic ice caps to sea level rise: Trends and variability since the Little Ice Age. Geophys. Res. Lett. 2013, 40, 1546–1550. [Google Scholar] [CrossRef]
- Kitagawa, Y. An aspect of the water in clay minerals: An application of nuclear magnetic resonance spectrometry to clay mineralogy. Am. Mineral. 1972, 57, 751–764. [Google Scholar]
- Eiriksdottir, E.S.; Oelkers, E.H.; Hardardottir, J.; Gislason, S.R. The impact of damming on riverine fluxes to the ocean: A case study from Eastern Iceland. Water Res. 2017, 113, 124–138. [Google Scholar] [CrossRef] [PubMed]
- Galeczka, I.; Oelkers, E.H.; Gislason, S.R. The chemistry and element fluxes of the July 2011 Múlakvísl and Kaldakvísl glacial floods, Iceland. J. Volcanol. Geoth. Res. 2014, 273, 41–57. [Google Scholar] [CrossRef]
- Galeczka, I.; Eiriksdottir, E.S.; Hardardottir, J.; Oelkers, E.H.; Torssander, P.; Gislason, S.R. The effect of the 2002 glacial flood on dissolved and suspended chemical fluxes in the Skaftá river, Iceland. J. Volcanol. Geoth. Res. 2015, 301, 253–276. [Google Scholar] [CrossRef]
- Lutz, S.; Anesio, A.M.; Edwards, A.; Benning, L.G. Microbial diversity on Icelandic glaciers and ice caps, Front. Microbiol. 2015, 6, 307. [Google Scholar] [CrossRef]
- Bradwell, T.; Sigurđsson, O.; Everest, J. Recent, very rapid retreat of a temperate glacier in SE Iceland. Boreas 2013, 42, 959–973. [Google Scholar] [CrossRef]
- Jaenicke, J.; Mayer, C.; Scharrer, K.; Münzer, U.; Gudmundsson, Á. The use of remote-sensing data for mass-balance studies at Mýrdalsjökull ice cap, Iceland. J. Glaciol. 2006, 52, 565–573. [Google Scholar] [CrossRef]
- Jóhannesson, T.; Björnsson, H.; Magnússon, E.; Gudmundsson, S.; Pálsson, F.; Sigurdsson, O.; Thorsteinsson, T.; Berthier, E. Ice-volume changes, bias estimation of mass-balance measurements and changes in subglacial lakes derived by lidar mapping of the surface of Icelandic glaciers. Ann. Glaciol. 2013, 54, 63–74. [Google Scholar] [CrossRef]
- Jóhannesson, T.; Björnsson, H.; Pálsson, F.; Sigurðsson, O.; Þorsteinsson, Þ. LiDAR mapping of the Snæfellsjökull ice cap, western Iceland. Jökull 2011, 61, 19–32. [Google Scholar]
- Björnsson, H.; Pálsson, F. Icelandic glaciers. Jökull 2008, 58, 365–386. [Google Scholar]
- Aðalgeirsdóttir, G.; Jóhannesson, T.; Björnsson, H.; Pálsson, F.; Sigurðsson, O. Response of Hofsjökull and southern Vatnajökull, Iceland, to climate change. J. Geophys. Res. 2006, 111, 15. [Google Scholar] [CrossRef]
- Pope, A.; Willis, I.C.; Pálsson, F.; Arnold, N.S.; Rees, W.G.; Björnsson, H.; Grey, L. Elevation change, mass balance, dynamics and surging of Langjökull, Iceland from 1997 to 2007. J. Glaciol. 2016, 62, 497–511. [Google Scholar] [CrossRef]
- Mayer, C.; Jaenicke, J.; Lambrecht, A.; Braun, L.; Völksen, C.; Minet, C.; Münzer, U. Local surface mass-balance reconstruction from a tephra layer—A case study on the northern slope of Mýrdalsjökull, Iceland. J. Glaciol. 2017, 63, 79–87. [Google Scholar] [CrossRef]
- Jónsdóttir, J.F.; Uvo, C.B. Long-term variability in precipitation and streamflow in Iceland and relations to atmospheric circulation. Int. J. Climatol. 2009, 29, 1369–1380. [Google Scholar] [CrossRef]
- Milner, A.M.; Khamis, K.; Battin, T.J.; Brittain, J.E.; Barrand, N.E.; Füreder, L.; Cauvy-Fraunie, S.; Gíslason, G.M.; Jacobsen, D.; Hannah, D.M.; et al. Glacier shrinkage driving global changes in downstream systems. Proc. Natl. Acad. Sci. USA 2017, 114, 9770–9778. [Google Scholar] [CrossRef] [PubMed]
- Shirokova, L.S.; Chupakova, A.A.; Chupakov, A.V.; Pokrovsky, O.S. Transformation of dissolved organic matter and related trace elements in the mouth zone of the largest European Arctic river: Experimental modeling. Inland Waters 2017, 7, 272–282. [Google Scholar] [CrossRef]
- Das, S.B.; Joughin, I.; Behn, M.D.; Howat, I.M.; King, M.A.; Lizarralde, D.; Bhatia, M.P. Fracture propagation to the base of the Greenland Ice Sheet during supraglacial lake drainage. Science 2008, 320, 778–781. [Google Scholar] [CrossRef] [PubMed]
- Fasching, C.; Ulseth, A.J.; Schelker, J.; Steniczka, G.; Battin, T.J. Hydrology controls dissolved organic matter export and composition in an Alpine stream and its hyporheic zone. Limnol. Oceanogr. 2016, 61, 558–571. [Google Scholar] [CrossRef]
- Maciejewska, A.; Pempkowiak, J. DOC and POC in the water column of the southern Baltic. Part, I. Evaluation of factors influencing sources, distribution and concentration dynamics of organic matter. Oceanologia 2014, 56, 523–548. [Google Scholar] [CrossRef]
- Lagaly, G. Reaktionen der Tonminerale. In Tonimerale und Tone; Steinkopff: Berlin, Germany, 1993; pp. 89–167. [Google Scholar]
- Hensen, E.J.; Smit, B. Why clays swell. J. Phys. Chem. B 2002, 106, 12664–12667. [Google Scholar] [CrossRef]
- Helms, J.R.; Stubbins, A.; Ritchie, J.D.; Minor, E.C.; Kieber, D.J.; Mopper, K. Absorption spectral slopes and slope ratios as indicators of molecular weight, source, and photobleaching of chromophoric dissolved organic matter. Limnol. Oceanogr. 2008, 53, 955–969. [Google Scholar] [CrossRef]
- Chin, Y.-P.; Aiken, G.; Loughlin, E.O. Molecular weight, polydispersity, and spectroscopic properties of aquatic humic substances. Environ. Sci. Technol. 1994, 28, 1853–1858. [Google Scholar] [CrossRef]
- Zsolnay, A.; Baigar, E.; Jimenez, M.; Steinweg, B.; Saccomandi, F. Differentiating with fluorescence spectroscopy the sources of dissolved organic matter in soils subjected to drying. Chemos 1999, 38, 45–50. [Google Scholar] [CrossRef]
- Parlanti, E.; Wörz, K.; Geoffroy, L.; Lamotte, M. Dissolved organic matter fluorescence spectroscopy as a tool to estimate biological activity in a coastal zone submitted to anthropogenic inputs. Org. Geochem. 2000, 31, 1765–1781. [Google Scholar] [CrossRef]
- Wilson, H.F.; Xenopoulos, M.A. Effects of agricultural land use on the composition of fluvial dissolved organic matter. Nat. Geosci. 2009, 2, 37–41. [Google Scholar] [CrossRef]
- Stedmon, C.A.; Bro, R. Characterizing dissolved organic matter fluorescence with parallel factor analysis: A tutorial. Limnol. Oceanogr. Meth. 2008, 6, 572–579. [Google Scholar] [CrossRef]
- Andersson, C.A.; Bro, R. The N-way toolbox for MATLAB. Chemometr. Intell. Lab. 2000, 52, 1–4. [Google Scholar] [CrossRef]
- Coble, P.G. Characterization of marine and terrestrial OM in seawater using excitation emission matrix spectroscopy. Mar. Chem. 1996, 51, 325–346. [Google Scholar] [CrossRef]
- Stedmon, C.A.; Markager, S.; Bro, R. Tracing dissolved organic matter in aquatic environments using a new approach to fluorescence spectroscopy. Mar. Chem. 2003, 82, 239–254. [Google Scholar] [CrossRef]
- Oksanen, J.; Blanchet, F.G.; Kindt, R.; Legendre, P.; Minchin, P.R.; O’Hara, R.B. vegan: Community Ecology Package. R package version 2.0-9. 2013. Available online: http:// CRAN.R-project.org/package = vegan (accessed on 10 April 2019).
- Fellman, J.B.; Spencer, R.G.; Hernes, P.J.; Edwards, R.T.; D’Amore, D.V.; Hood, E. The impact of glacier runoff on the biodegradability and biochemical composition of terrigenous dissolved organic matter in near-shore marine ecosystems. Mar. Chem. 2010, 121, 112–122. [Google Scholar] [CrossRef]
- Hatt, B.E.; Fletcher, T.D.; Walsh, C.J.; Taylor, S.L. The influence of urban density and drainage infrastructure on the concentrations and loads of pollutants in small streams. Environ. Manag. 2004, 34, 112–124. [Google Scholar] [CrossRef]
- Dubnick, A.; Barker, J.; Sharp, M.; Wadham, J.; Lis, G.; Telling, J.; Fitzsimons, S.; Jackson, M. Characterization of dissolved organic matter (DOM) from glacial environments using total fluorescence spectroscopy and parallel factor analysis. Ann. Glaciol. 2010, 51, 111–122. [Google Scholar] [CrossRef]
- Hodson, A.; Anesio, A.M.; Tranter, M.; Fountain, A.; Osborn, M.; Priscu, J.; Laybourn-Parry, J.; Sattler, B. Glacial ecosystems. Ecol. Monogr. 2008, 78, 41–67. [Google Scholar] [CrossRef]
- Hood, E.; Fellman, J.; Spencer, R.G.; Hernes, P.J.; Edwards, R.; D’amore, D.; Scott, D. Glaciers as a source of ancient and labile organic matter to the marine environment. Nature 2009, 462, 1044–1047. [Google Scholar] [CrossRef] [PubMed]
- Guillemette, F.; del Giorgio, P.A. Simultaneous consumption and production of fluorescent dissolved organic matter by lake bacterioplankton. Environ. Microbiol. 2012, 14, 1432–1443. [Google Scholar] [CrossRef]
- Findlay, S. Importance of surface-subsurface exchange in stream ecosystems: The hyporheic zone. Limnol. Oceanogr. 1995, 40, 159–164. [Google Scholar] [CrossRef]
- Dangles, O.; Guerold, F.; Usseglio-Polatera, P. Role of transported particulate organic matter in the macroinvertebrate colonization of litter bags in streams. Freshwater Biol. 2001, 46, 575–586. [Google Scholar] [CrossRef]
- Monaghan, M.T.; Thomas, S.A.; Minshall, G.W.; Newbold, J.D.; Cushing, C.E. The influence of filter-feeding benthic macroinvertebrates on the transport and deposition of particulate organic matter and diatoms in two streams. Limnol. Oceanogr. 2001, 46, 1091–1099. [Google Scholar] [CrossRef]
- Lods-Crozet, B.; Lencioni, V.; Olafsson, J.S.; Snook, D.L.; Velle, G.; Brittain, J.E.; Rossaro, B. Chironomid (Diptera: Chironomidae) communities in six European glacier-fed streams. Freshwater Biol. 2001, 46, 1791–1809. [Google Scholar] [CrossRef]
- Kaplan, L.A.; Bott, T.L. Diel fluctuations in bacterial activity on streambed substrata during vernal algal blooms: Effects of temperature, water chemistry, and habitat. Limnol. Oceanogr. 1989, 34, 718–733. [Google Scholar] [CrossRef]
- Arimitsu, M.L.; Hobson, K.A.; Webber, D.N.; Piatt, J.F.; Hood, E.W.; Fellman, J.B. Tracing biogeochemical subsidies from glacier runoff into Alaska’s coastal marine food webs. Glob. Chang. Biol. 2018, 24, 387–398. [Google Scholar] [CrossRef] [PubMed]
- Grinsted, A. An estimate of global glacier volume. Cryos. 2013, 7, 141–151. [Google Scholar] [CrossRef]
- Hood, E.; Berner, L. Effects of changing glacial coverage on the physical and biogeochemical properties of coastal streams in southeastern Alaska. J. Geophys. Res. Biogeo. 2009, 114. [Google Scholar] [CrossRef]
- Bliss, A.; Hock, R.; Radić, V. Global response of glacier runoff to twenty-first century climate change. J. Geophys. Res. 2014, 119, 717–730. [Google Scholar] [CrossRef]
Figure 1.
Topographic map of Iceland showing glacier distribution and the location of sampling points. Samples were taken from different proglacial streams draining five different glaciers (Vatnajökull: SJ01, SJ02, SV01, SK01; Langjökull: HV10, HV09, BL02; Hofsjökull: AJ01, HN01; Myrdalsjökull: JK01, MV01; Tungnafellsjökull: TJ01, TJ02), two unglaciated areas (BL01, ST01), and along the flowpath of the river Hvitá to capture longitudinal changes along the flow path from the glacier terminus to the ocean (HV01, HV02, HV03, HV04, HV05, HV06, HV07, HV08, HV11). Abbreviations of the sampling points reflect the names of the proglacial rivers or the adjacent glaciers.

Figure 2.
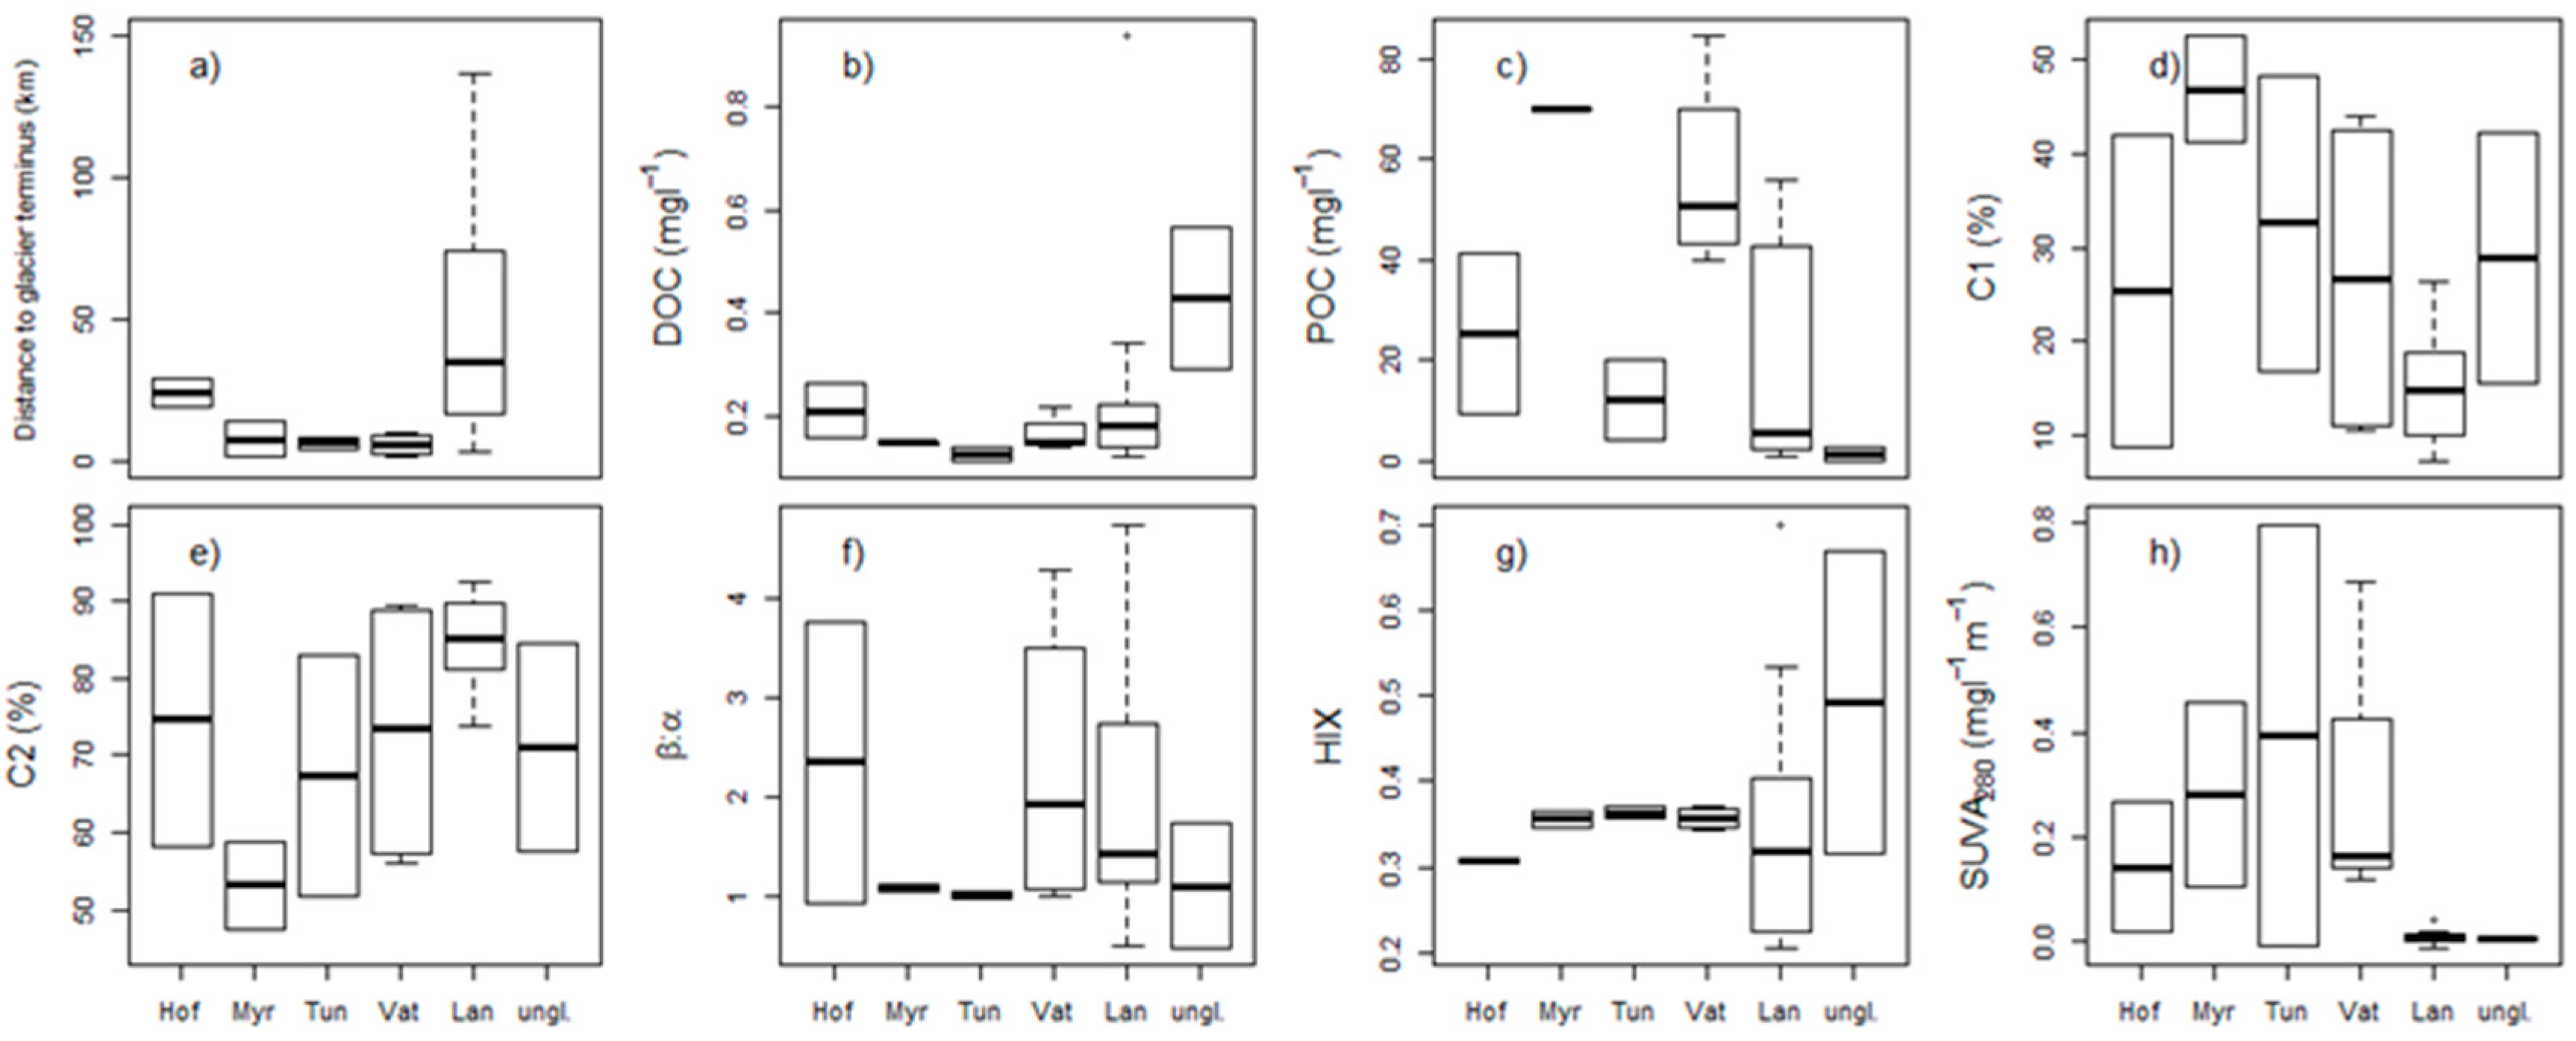
Boxplot of (a) distance to the glacier, (b) DOC concentration, (c) POC concentration, (d) and (e) components C1 and C2, (f) freshness index (β/α), (g) humification index (HIX), and (h) SUVA280. Samples were taken from different proglacial streams (n = 2–4) draining five different glaciers (Vat = Vatnajökull, Lan = Langjökull, Hof = Hofsjökull, Myr = Myrdalsjökull, and Tun = Tungnafellsjökull), and two unglaciated areas (ungl.), including along the flow path of the river Hvitá, to capture longitudinal changes along the flow path from the glacier terminus to the ocean (Hvitá : n = 11, Total: n = 21–24 for each plot).
Figure 2.
Boxplot of (a) distance to the glacier, (b) DOC concentration, (c) POC concentration, (d) and (e) components C1 and C2, (f) freshness index (β/α), (g) humification index (HIX), and (h) SUVA280. Samples were taken from different proglacial streams (n = 2–4) draining five different glaciers (Vat = Vatnajökull, Lan = Langjökull, Hof = Hofsjökull, Myr = Myrdalsjökull, and Tun = Tungnafellsjökull), and two unglaciated areas (ungl.), including along the flow path of the river Hvitá, to capture longitudinal changes along the flow path from the glacier terminus to the ocean (Hvitá : n = 11, Total: n = 21–24 for each plot).

Figure 3.
DOC and POC concentrations of water samples along the river Hvitá (HV01, HV02, HV03, HV08, HV10, HV11) and the tributaries Tungufljiot (HV04, HV06, HV07, HV09) and Sandá (HV08). Values represent a snapshot of the DOC and POC concentrations at peak melt, shown as points is the distance of each sampling location from the glacier terminus in kilometers. Analytical error bars are based on the standard deviations listed in Table 2.

Figure 4.
Fluorescent components of glacial DOM sampled during the summer 2016 field campaign modeled by PARAFAC, based on excitation emission matrices.
Figure 4.
Fluorescent components of glacial DOM sampled during the summer 2016 field campaign modeled by PARAFAC, based on excitation emission matrices.

Figure 5.
Principal component analysis (PCA) based on the optical properties of the sampled proglacial streams distinguishes terrigenous from autochthonous DOM (as depicted by PC1 scores) (n = 21). Terrigenous DOM was characterized by a high humification index (HIX), higher SUVA280, and higher contributions of the humic-like component (C1). High values of the freshness index (β/α) and high contributions of the protein-like component (C2) describe DOM with a more autochthonous character. The color gradient of the symbols represent distance from glacier terminus, with more blue colored points representing sampling locations closest to the terminus, while more green colored points represent sampling locations furthest downstream and samples from unglaciated catchments (BL01 and ST01). Arrows are based on PCA structural coefficients and contours represent POC concentration in mg·L−1.

Figure 6.
Change of humification index (HIX), SUVA280, freshness index (β/α), and components C1 and C2 with distance from each sampling point to the glacier terminus. Color indicates the respective glacier (Vat=Vatnajökull, Lan = Langjökull, Hof = Hofsjökull, Myr = Myrdalsjökull, and Tun = Tungnafellsjökull) and unglaciated area (unglaciated). Values represent a snapshot of the conditions at sampling across a wide range of Icelandic proglacial streams.

Figure 7.
Boxplot of the POC/DOC ratio along distance classes from glacier termini. Color represents DOM composition (as depicted by the PC1), with green representing relatively more terrestrial inputs and blue more autochthonous DOM (n = 23).
Figure 7.
Boxplot of the POC/DOC ratio along distance classes from glacier termini. Color represents DOM composition (as depicted by the PC1), with green representing relatively more terrestrial inputs and blue more autochthonous DOM (n = 23).


Table 1.
Description of the sampling points. Samples (total n = 24) were taken from several proglacial streams per glacier (n = 5) and along the flow path of the river Hvitá (n = 11) to capture longitudinal changes along the flow path from the glacier terminus to the ocean.
Table 1.
Description of the sampling points. Samples (total n = 24) were taken from several proglacial streams per glacier (n = 5) and along the flow path of the river Hvitá (n = 11) to capture longitudinal changes along the flow path from the glacier terminus to the ocean.
| Site | Main Glacier | Sub Glacier | Sampling Time (GMT) | Coordinates | Distance to Glacier (km) |
|---|---|---|---|---|---|
| HV01 | Langjökull | Hagafellsjökull/Nordurjökull | 24 July 2016 (18:00) | 63°52′42.6″ N, 21°12′43.2″ W | 137 |
| HV02 | Langjökull | Hagafellsjökull/Nordurjökull | 24 July 2016 (18:30) | 63°56′17.7″ N, 21°0′20.9″ W | 120 |
| HV03 | Langjökull | Hagafellsjökull/Nordurjökull | 24 July 2016 (19:30) | 64°6′38.4″ N, 20°30′39.6″ W | 80 |
| HV04 | Langjökull | Hagafellsjökull | 25 July 2016 (11:15) | 64°11′17.4″ N, 20°24′19.2″ W | 44 |
| HV05 | Langjökull | Nordurjökull/Hagafellsjökull | 25 July 2016 (11:00) | 64°9′4.1″ N, 20°21′53.4″ W | 68 |
| HV06 | Langjökull | Hagafellsjökull | 25 July 2016 (11:50) | 64°18′49.5″ N, 20°15′56.7″ W | 26 |
| HV07 | Langjökull | Hagafellsjökull | 25 July 2016 (13:15) | 64°22′22.8’’ N, 20°7′38.7″ W | 15 |
| HV08 | Langjökull | Hagafellsjökull | 25 July 2016 (14:15) | 64°24′7.4’’ N, 20°3′12.6″ W | 18 |
| HV09 | Langjökull | Hagafellsjökull | 25 July 2016 (15:20) | 64°27’55.8″ N, 20°14′48.0″ W | 3 |
| HV10 | Langjökull | Nordurjökull | 25 July 2016 (17:00) | 64°32′12.0″ N, 19°46′51.6″ W | 12 |
| HV11 | Langjökull | Nordurjökull/Hagafellsjökull | 25 July 2016 (12:30) | 64°15′43.5″ N, 20°13′21.0″ W | 55 |
| BL01 | Unglaciated drainage area | 26 July 2016 (09:45) | 64°56′12.9″ N, 19°31′16.8″ W | ||
| BL02 | Langjökull | Baldkökull | 26 July 2016 (10:00) | 64°56’12″ N, 19°31′14.9″ W | 18 |
| AJ01 | Hofsjökull | Illvidrajökull | 26 July 2016 (16:30) | 65°3′32.8″ N, 18°29′17.9″ W | 19 |
| ST01 | Unglaciated drainage area | 26 July 2016 (17:00) | 65°3′0.0″ N, 18°28′12.0″ W | ||
| HN01 | Hofsjökull | Miklafellsjökull/Klakksjökull | 26 July 2016 (17:30) | 65°2′37.8″ N, 18°23′27.6″ W | 29 |
| TJ01 | Tungnafellsjökull | Hagajökull | 27 July 2016 (10:20) | 64°46′21.0″ N, 18°1′12.0″ W | 4 |
| TJ02 | Tungnafellsjökull | Tungnafellsjökull | 27 July 2016 (11:00) | 64°44′17.9″ N, 18°4′19.8″ W | 8 |
| JK01 | Mýrdalsjökull | Sólheimajökull | 28 July 2016 (15:00) | 63°32′3.0″ N, 19°22′17.4″ W | 1 |
| MV01 | Mýrdalsjökull | Kötlujökull | 28 July 2016 (16:10) | 63°26′15.0″ N, 18°51′6.0″ W | 14 |
| SJ01 | Vatnajökull | Súlujökull | 28 July 2016 (18:00) | 63°57′20.9″ N, 17°28′9.6″ W | 8 |
| SJ02 | Vatnajökull | Skeidarárjökull | 28 July 2016 (18:20) | 63°56′23.4″ N, 17°22′9.0″ W | 10 |
| SV01 | Vatnajökull | Svinafellsjökull | 29 July 2016 (09:00) | 63°59′1.5″ N, 16°52′23.4″ W | 1 |
| SK01 | Vatnajökull | Skaftafelljökull | 29 July 2016 (10:20) | 64°0′23.4″ N, 16°56’2.1″ W | 3 |
Table 2.
DOC and POC concentrations and hydrochemical characteristics of the sampled Icelandic proglacial streams. Samples were taken from several proglacial streams (n = 2–4) per glacier (n = 5) and along the flow path of the river Hvitá to capture longitudinal changes along the flow path from the glacier terminus to the ocean (n = 11); (*) signifies below detection limit. DOC concentration is calculated from the injections as mean value, indicating additionally the standard deviation (SD).
| Site | Electrical Conductivity [µS·cm−1] | Total Suspended Solids (mg·L−1) | DOC (mg·L−1) | POC (mg·L−1) | |
|---|---|---|---|---|---|
| Ø | SD | ||||
| HV01 | 300.0 | 13.3 | 0.23 | 0.00398 | 0.67 |
| HV02 | 55.0 | 32.7 | 0.94 | 0.00261 | 7.33 |
| HV03 | 102.0 | 28.0 | 0.34 | 0.00261 | 7.33 |
| HV04 | 40.0 | 6.0 | 0.16 | 0.00230 | 2.67 |
| HV05 | 51.0 | 144.7 | 0.20 | 0.01330 | 46.00 |
| HV06 | 34.0 | 0.1 | 0.12 | 0.02227 | 4.00 |
| HV07 | 21.0 | 7.3 | 0.20 | 0.00580 | 0.67 |
| HV08 | 12.0 | 180.0 | 0.15 | 0.01562 | 56.00 |
| HV09 | 2.0 | 210.7 | 0.13 | 0.00435 | 48.67 |
| HV10 | 42.0 | 11.3 | 0.15 | 0.01577 | 4.00 |
| HV11 | 48.0 | 149.3 | 0.12 | 0.00747 | 39.33 |
| BL01 | 53.0 | 2.7 | 0.56 | 0.08799 | 0.00 * |
| BL02 | 47.0 | 6.0 | 0.22 | 0.00139 | 1.33 |
| AJ01 | 32.0 | 203.3 | 0.26 | 0.01925 | 41.33 |
| ST01 | 38.0 | 4.7 | 0.29 | 0.01742 | 2.67 |
| HN01 | 22.0 | 74.7 | 0.16 | 0.00652 | 9.33 |
| TJ01 | 20.0 | 36.7 | 0.11 | 0.01405 | 4.00 |
| TJ02 | 27.0 | 86.0 | 0.14 | 0.00215 | 20.00 |
| JK01 | 48.0 | 536.0 | 0.15 | 0.00135 | NA |
| MV01 | 160.0 | 412.0 | 0.15 | 0.01953 | 70.00 |
| SJ01 | 18.0 | 260.7 | 0.15 | 0.01036 | 84.67 |
| SJ02 | 35.0 | 401.3 | 0.22 | 0.01582 | 55.33 |
| SV01 | 32.0 | 188.0 | 0.14 | 0.00252 | 46.00 |
| SK01 | 14.0 | 158.0 | 0.15 | 0.02183 | 40.00 |
© 2019 by the authors. Licensee MDPI, Basel, Switzerland. This article is an open access article distributed under the terms and conditions of the Creative Commons Attribution (CC BY) license (http://creativecommons.org/licenses/by/4.0/).
Share and Cite
MDPI and ACS Style
Chifflard, P.; Fasching, C.; Reiss, M.; Ditzel, L.; Boodoo, K.S. Dissolved and Particulate Organic Carbon in Icelandic Proglacial Streams: A First Estimate. Water 2019, 11, 748. https://doi.org/10.3390/w11040748
AMA Style
Chifflard P, Fasching C, Reiss M, Ditzel L, Boodoo KS. Dissolved and Particulate Organic Carbon in Icelandic Proglacial Streams: A First Estimate. Water. 2019; 11(4):748. https://doi.org/10.3390/w11040748
Chicago/Turabian StyleChifflard, Peter, Christina Fasching, Martin Reiss, Lukas Ditzel, and Kyle S. Boodoo. 2019. "Dissolved and Particulate Organic Carbon in Icelandic Proglacial Streams: A First Estimate" Water 11, no. 4: 748. https://doi.org/10.3390/w11040748
Note that from the first issue of 2016, this journal uses article numbers instead of page numbers. See further details here.