Article

Estimates of Tillage and Rainfall Effects on Unsaturated Hydraulic Conductivity in a Small Central European Agricultural Catchment

Faculty of Civil Engineering, Czech Technical University in Prague, Thákurova 7, 166 29 Prague 6, Czech Republic
*
Author to whom correspondence should be addressed.
Water 2019, 11(4), 740; https://doi.org/10.3390/w11040740
Submission received: 29 December 2018 / Revised: 29 March 2019 / Accepted: 29 March 2019 / Published: 10 April 2019
(This article belongs to the Special Issue Soil Hydrology in Agriculture)

Abstract

:
In arable land, topsoil is exposed to structural changes during each growing season due to agricultural management, climate, the kinetic energy of rainfall, crop and root growth. The shape, size, and spatial distributions of soil aggregates are considerably altered during the season and thus affect water infiltration and the soil moisture regime. Agricultural topsoils are prone to soil compaction and surface sealing which result in soil structure degradation and disconnection of preferential pathways. To study topsoil infiltration properties over time, near-saturated hydraulic conductivity of topsoil was repeatedly assessed in a catchment in central Bohemia (Czech Republic) during three consecutive growing seasons, using a recently developed automated tension minidisk infiltrometer (MultiDisk). Seasonal variability of soil bulk density and saturated water content was observed as topsoil consolidated between seedbed preparations. Topsoil unsaturated hydraulic conductivity was lower in spring and increased in the summer months during two seasons, and the opposite trend was observed during one season. Temporal unsaturated hydraulic conductivity variability was higher than spatial variability. Cumulative kinetic energy of rainfall, causing a seasonal decrease in soil macroporosity and unsaturated hydraulic conductivity, was not a statistically significant predictor.

Graphical Abstract

1. Introduction

The spatial arrangement of soil aggregates significantly affects the process of water infiltration and the subsequent moisture regime of the soil profile. In arable land, the soil is exposed to rapid structural changes, both abrupt and continuous, within each growing season due to agrotechnical practices [1], quick crop and root growth [2], soil biota and climatic conditions [3,4]. Agricultural soils are prone to soil compaction and soil structure degradation, depending strongly on the intensity of agricultural production, fertilization, cover crops, tillage, and harvesting technologies [5].
Soil cultivation causes specific topsoil conditions. Soil aggregates on the surface after tillage are rather large, the topsoil is loose, the soil surface is rough and free of vegetation (see, for example, the review by Strudley et al. [4]) and the soil has a lower bulk density, higher macroporosity, high pore connectivity and high saturated hydraulic conductivity [6]. However, this state is mechanically unstable. Intense rainfall can initiate splash erosion [7] wherein fine soil particles are detached and translocated from aggregates and clog the large elongated voids connecting the surface to the soil profile. Rainfall with high kinetic energy over a recently tilled soil, therefore, often results in topsoil compaction and soil crusting [8,9], and the topsoil quickly consolidates. This consolidation caused by rainfall propagates a soil profile. Rousseva et al. [10] measured the soil macroporosity of a loamy soil profile during rainfall events and detected a decrease in macroporosity down to a depth of 6 cm below the soil surface. Moreover, soil exposure to rainfall and the subsequent destruction of soil aggregates lead to further soil degradation, resulting in higher emissions of soil carbon dioxide [11] and increased soil erosion [12,13].
The splash erosion and structural changes in topsoil are, among other factors, influenced by the kinetic energy of rainfall [14]. Rainfall kinetic energy (KE) is a quantity dependent on the raindrop’s mass (drop size distribution) and velocity. This kinetic energy is usually estimated with empirical relationships which express kinetic energy as a function of rainfall intensity (KE-I) [15]. It has been shown that the KE-I relationship is tied to the specific climatic conditions of a given location [16,17].
Compacted soils with poor structure (lacking macropores) are usually considered unfavorable for crop growth due to low water infiltration into the root zone [18]. However, under unsaturated conditions, the size of the contact area between the neighboring aggregates is important for vertical water movement. Therefore soil consolidation often results in the increase of its infiltration capacity [19,20]. Soil with well-developed aggregates can be assessed by a dual-continuum system of two mutually communicating porous media: (a) preferential flow domain and (b) matrix flow domain [21]. The preferential flow domain is represented by large inter-aggregate voids, which create a well-connected network of hydraulically conductive pores and the matrix domain consists of much finer intra-aggregate micropores.
The structure of the micropore matrix is quite stable; on the contrary, macropores can easily be created or destroyed by tillage and soil compaction processes [22,23]. Preferential flow dominates during saturated and nearly saturated flow conditions, in which water percolates through the network of the preferential pathways bypassing the aggregates to the deep soil profile. Most natural rainfall in Central Europe is not sufficiently intense to create area-wide ponding on a tilled surface [24], leaving the large pores and voids between the aggregates drained. Water under unsaturated conditions flows only through the aggregates and via capillary bridges that are formed at the aggregates’ contacts and in the close vicinity. Wetting front propagation is, therefore, slower than one would assume based on the value of the soil matrix hydraulic conductivity alone.
Unsaturated hydraulic conductivity is routinely measured in the field with tension infiltrometers. There are many different types of apparatus available for conducting tension infiltration experiments. Infiltrometers differ in measurement methods, levels of automation and infiltration disk diameters. Simple versions of disk infiltrometers require manual read-outs of the cumulative infiltration, which can be inefficient, especially in cases where experiments take a long time due to low hydraulic conductivity or when a large number of datasets is needed. Therefore, Ankeny et al. [25], Moret et al. [26] and Madsen and Chandler [27] among others, have suggested several automation techniques. Recently, Klipa et al. [28] developed an automatic mini-disk tension infiltrometer which can be used as a multi-point version of six coupled infiltrometers (MultiDisk).
The effect of soil consolidation on water flow has been studied at the scales of individual aggregates [19,20] to those in the vicinity of a root tip [29]. On the other hand, according to our knowledge, there are no field data on the seasonal variability of the unsaturated hydraulic conductivity that would show increased values with increasing soil compaction. An increasing trend of unsaturated hydraulic conductivity (pressure head of −3 cm) during vegetation season was observed by Logsdon et al. [30], but the increase was attributed to the soil swelling, not to topsoil consolidation. Hu et al. [31] did not observe any significant temporal changes in hydraulic conductivity (K) from near saturation up to pressure heads of −15 cm across sites with different land-use. Decreasing unsaturated hydraulic conductivity measured during a growing season, specifically with the pressure head set between −4 and −6 cm, were presented by [32,33], for example. Statistically non-significant temporal variability of unsaturated hydraulic conductivity overshadowed by spatial variation was also reported [34,35].
Somaratne and Smettem [36] reported that the unsaturated hydraulic conductivity for a pressure head of −4 cm was constant at the beginning of the growing season, decreased in July and remained constant until the time of harvest. It was concluded that fine soil particles, detached due to the impact of raindrops, blocked pores from conducting water under a pressure head of −4 cm. Decreases in topsoil hydraulic conductivity after an artificial rainfall experiment, compared to conditions before the experiment, observed a pressure head of −2 cm. No significant decrease of unsaturated hydraulic conductivity for a pressure head of −4 cm was observed after the experiment, suggesting that only the pores larger than 0.75 mm consolidated [36].
The purposes of this study were threefold. Firstly, it aimed to introduce the automatic multi-point tension infiltrometer (MultiDisk) based on the automation technique of Klipa et al. [28] and to use the MultiDisk for the measurement of near-saturated hydraulic conductivity across a period of three years. Secondly, it aimed to observe the temporal variability of unsaturated topsoil hydraulic conductivity during the vegetation season and test whether the changes could be attributed to the rainfall kinetic energy. Thirdly, it aimed to study the impact of soil cultivation on soil hydraulic properties.

2. Materials and Methods

2.1. Study Area

The infiltration experiments were carried out on plots located in the Nučice experimental catchment (Figure 1). This catchment is situated in a moderately hilly area of central Bohemia (Czech Republic), 30 km east of Prague (approximate closing profile position 49°57′49.230″ N, 14°52′13.242″ E). The catchment area is 0.531 km2. More than 95% of the area is arable land, while the remainder includes watercourse, riparian trees and shrubs and paved roads. There are no forests, grasslands or urbanized areas. The Nučice catchment is drained by a narrow stream, which has been piped in the uppermost part [37]. The average altitude is 401 m a.s.l., the mean land slope is 3.9%, and the climate is humid continental. Based on the records from 1975 to 2015, the average annual precipitation is 630 mm, potential evapotranspiration ranges from 500 to 550 mm [38], and mean annual air temperature is 7.9 °C [24]. Precipitation and temperature data were recorded in 5 min intervals and the distance between the tipping-bucket rain gauge and the infiltration plots was approximately 300 m (Figure 1).
The arable land is cultivated down to the stream banks, and conservation tillage has been practiced since 2000. Compact disk harrows and cultivators are employed, and the maximum disturbance of the soil profile due to tillage operations reaches 16 cm. The constant parallel traffic lines with a span of 8 m are maintained using a GPS guidance system. The standard crop rotation includes winter wheat (Triticum aestivum L.), rapeseed (Brassica napus), summer oats (Avena sativa) and mustard (Sinapis alba L.) (Table 1).
Since the establishment of the experimental catchment in 2011, we have been collecting undisturbed soil samples (100 cm3) on a regular basis to study the temporal variability in topsoil physical properties. Soil cores are taken from the top 7 cm between the plants and analyzed by standard gravimetric methods to measure the bulk density, porosity, and hydraulic characteristics.
The soils are developed on conglomerates, which consist of sandstone and siltstone, and are classified according to the World Reference Base for Soil Resources as Haplic Luvisols and Cambisols, which are a USDA Soil Taxonomy quasi-equivalent to Alfisols and Inceptisols. Based on geophysical monitoring conducted in a close-by location, the bedrock emerges at depths of 15–20 m and the groundwater level is more than 2 m below the surface. On the basis of the standard laboratory particle size distribution analysis (a combination of the sieving and sedimentation hydrometer methods), the proportions of the textural classes were determined to be 9% clay, 58% silt, and 33% sand; the soil was classified as silty loam. The loamy Ap horizon (10–15 cm deep, Cox of 1.1%) with well-developed soil aggregation is underlined by a silty and silty-clay Bt horizon with a compact structure. There is a clear divide between tilled topsoil and compacted subsoil, which was found at a depth of 14 ± 2 cm below the soil surface [39]. A single topsoil water retention curve was determined in the laboratory with use of a sand-box for the wet end and a pressure plate apparatus for the dry end. The soil hydraulic model of van Genuchten [40] was fit to the measured retention curve. These parameters were considered the reference for further retention curve scaling in the region close to saturation. The van Genuchten’s empirical parameters of the reference soil water retention curve of the topsoil were: α = 0.05 cm−1 and n = 1.25.

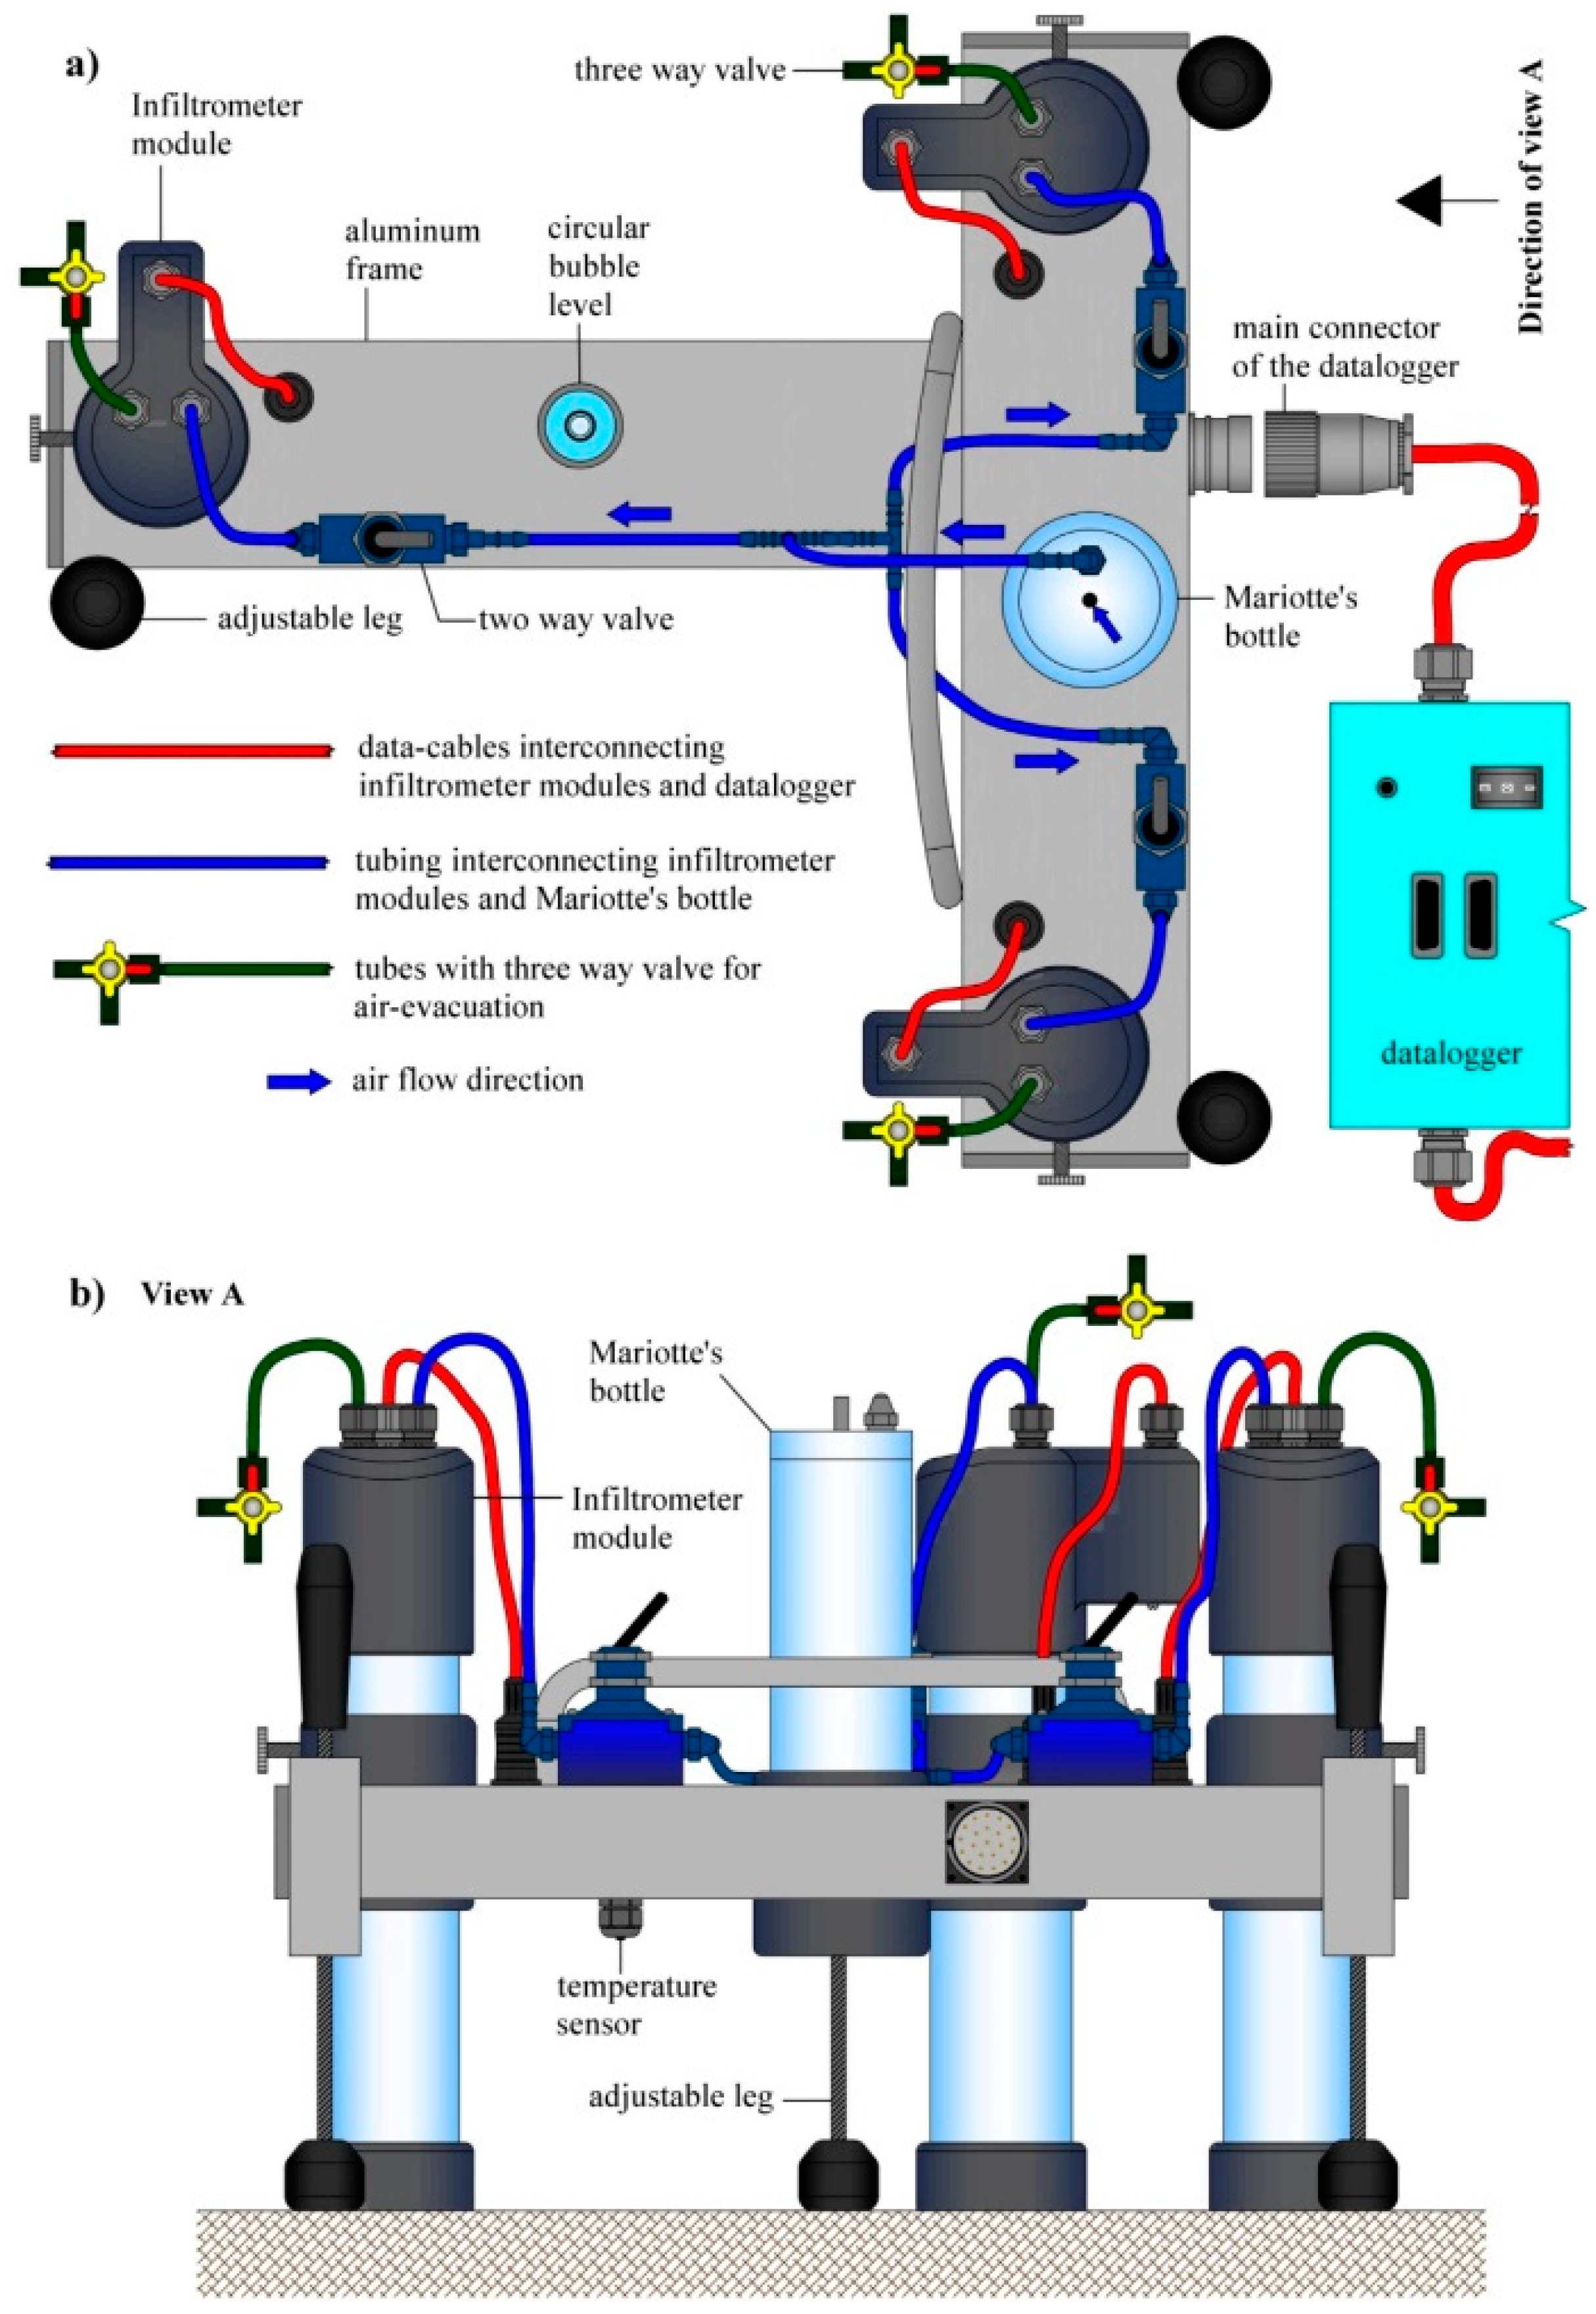
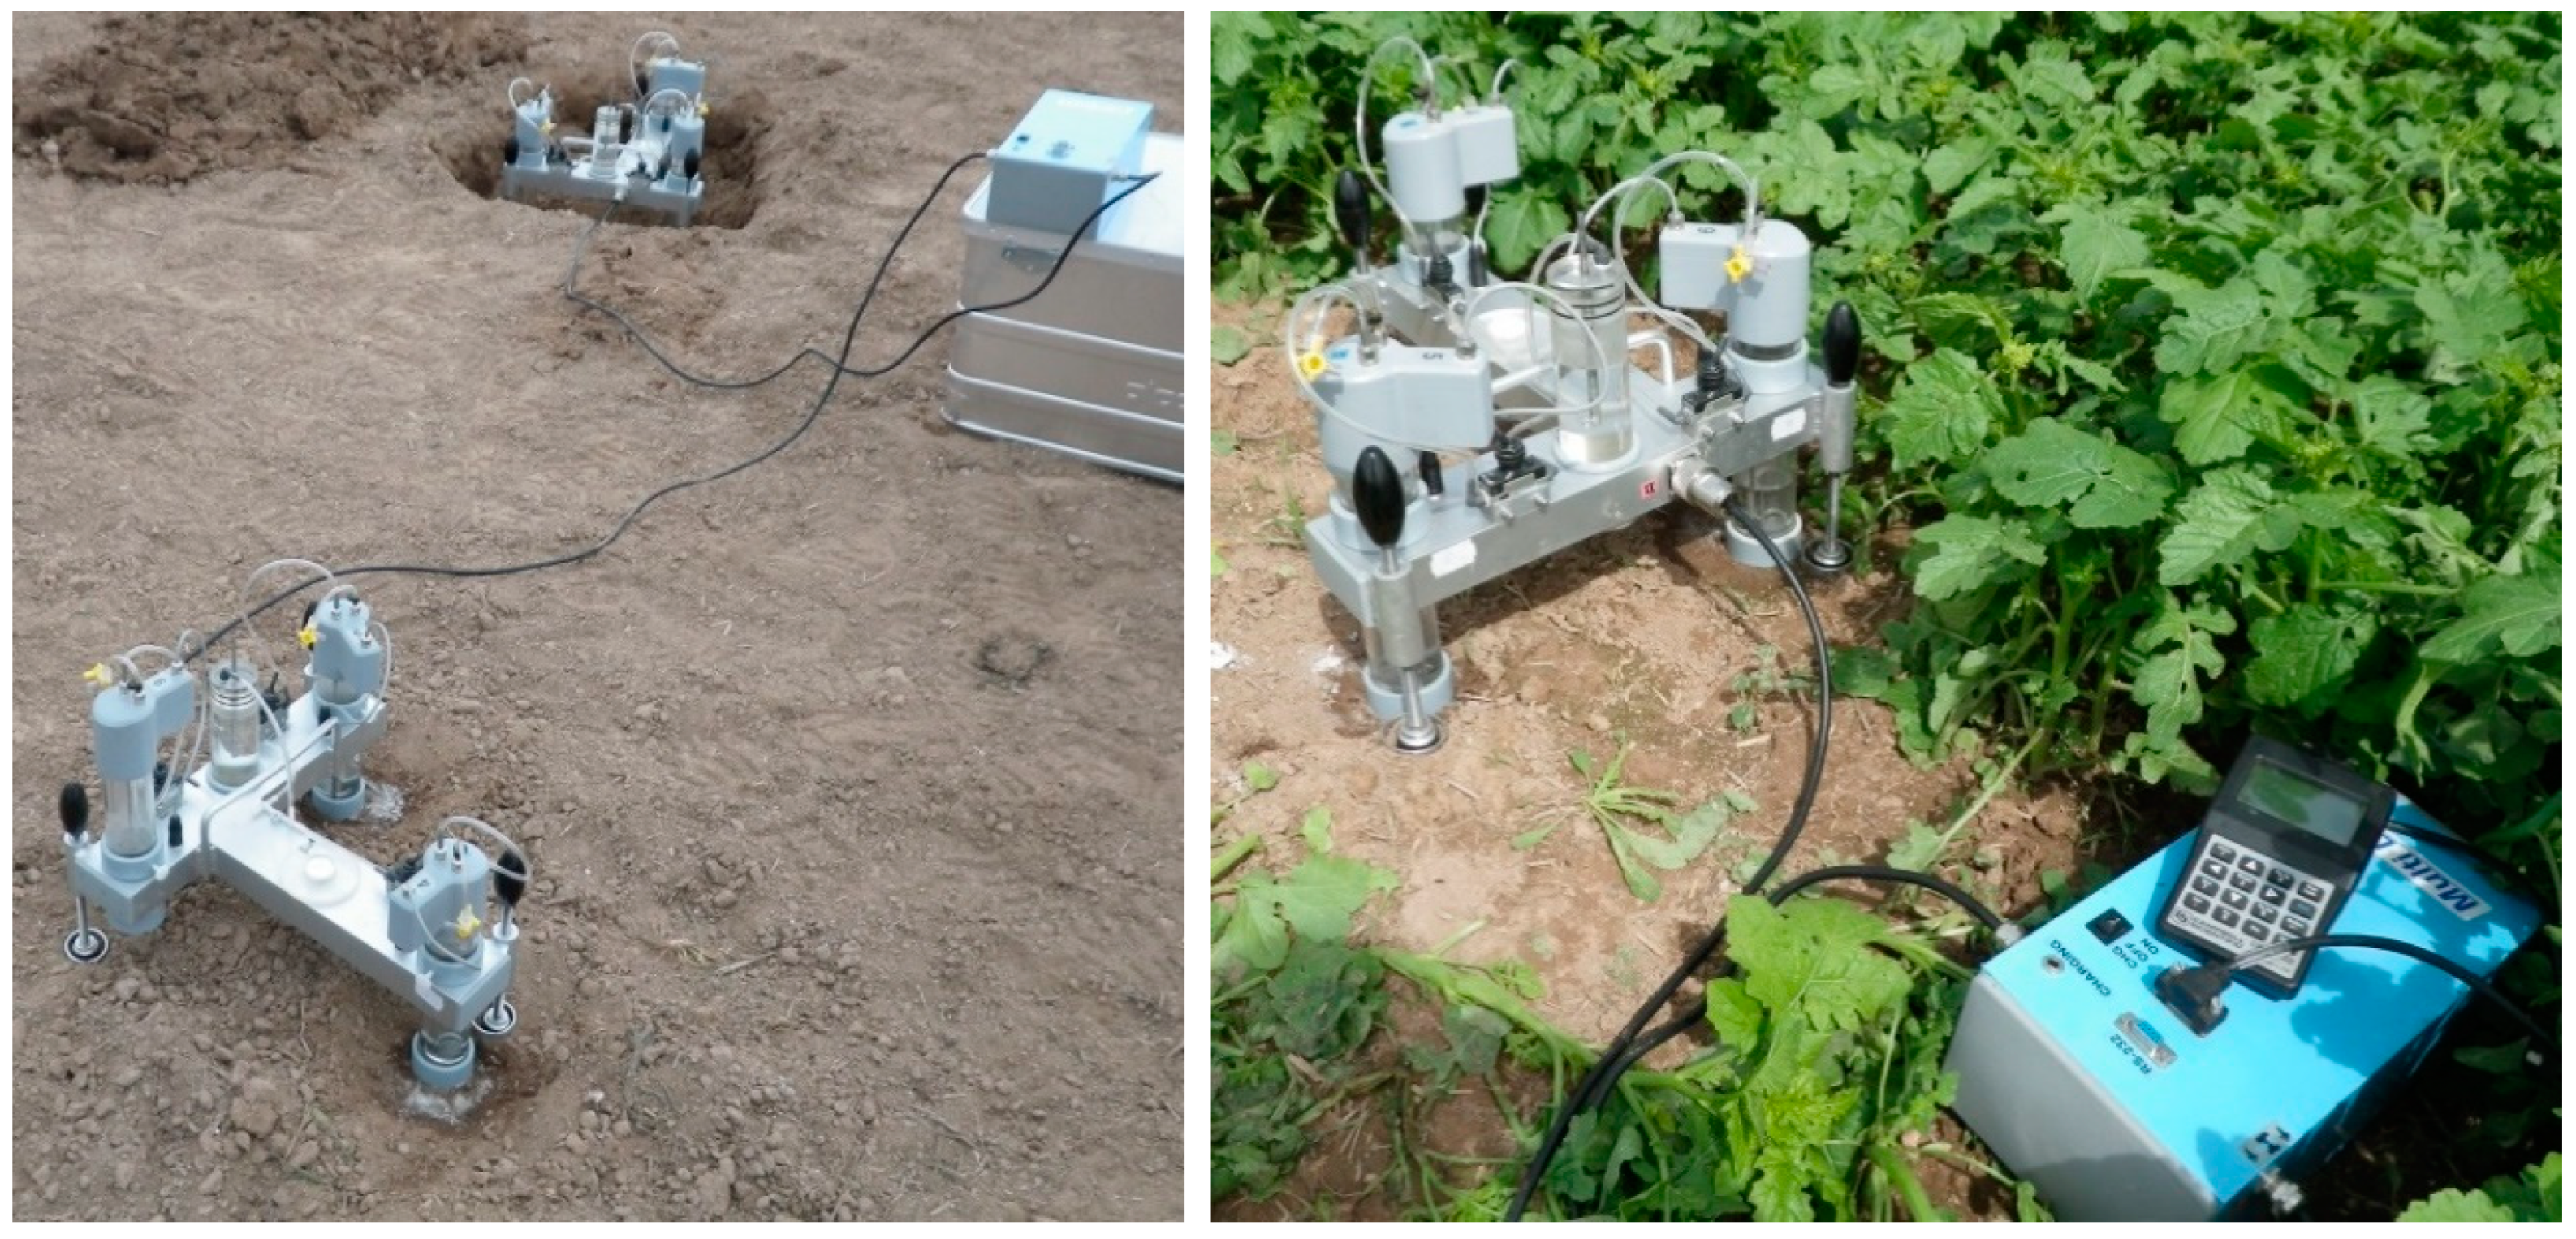
2.2. Infiltration Experiments

The infiltration experiments were carried out at the experimental site with the use of automatic minidisk infiltrometers (MultiDisk). All measurements were performed with a pressure head h0 of −3 cm. The chosen pressure head represents the equivalent pore diameter of 1 mm, which ensures reliable elimination of preferential pathways for the soil in this study [41]. Thus, data collected during the infiltration experiments characterized flow in the soil matrix only. The reason for setting of h0 to −3 cm was mainly practical. Lower values prolong the experiments considerably and a pressure head closer to saturation (e.g., −1 cm) would not avoid the large pores (as also mentioned by Bodner et al. [23]).
Thirteen regular infiltration campaigns (72 individual tension infiltration experiments, as six infiltrations were terminated due to technical problems) were conducted during the growing seasons from March 2013 until July 2015. Agricultural activities and associated crop life cycles are summarized in Table 1. In general, the agricultural practices envelop the complete life cycle from sowing, through harvest, to postharvest stubble breaking.
A single experimental plot with an approximate size of 5 × 5 m was selected in the experimental catchment (Figure 1) and repeatedly used for all measurement campaigns. The plot was situated on a gentle slope (incline below 1%) in the middle part of the hillslope and at least 2 m from the tractor wheel tracks. The infiltration rate was measured on barren surfaces and in the rows between the sown crops. The soil crust was removed, if present, to ensure a flat soil surface which is essential for the correct course of infiltration run. No more than three centimeters of soil were removed (depending on the actual soil roughness) to guarantee that the infiltration rate measurements were representative of the topsoil and not influenced by the different hydraulic properties of the thin soil surface crust, or by the compacted subsoil. The soil was manually leveled, and a very thin layer (ca. 1 mm) of dry fine quartz sand (grain composition 0.10–0.63 mm) was added to ensure hydraulic contact between the disk and the soil. The sand was moistened with a fine sprinkler immediately before infiltration.
Moreover, three undisturbed soil samples (volume of 100 cm3) were taken before the infiltration experiment to determine the bulk density and the actual and saturated water content of the topsoil. Six smaller soil samples (volume of 26.5 cm3) were taken directly below each infiltrometer of the MultiDisk immediately after the experiments. Samples were analyzed for soil bulk density, water content and saturated water content with standard gravimetric methods. The specific volume of the smaller soil samples was selected on the basis of extensive numerical modeling of infiltration from the MultiDisk to ensure homogeneity and representativeness of excavated soil volume for a wide variety of soil types.
Infiltrations started when the preparation of each location was finished and when infiltrometers were applied on contact sand layers. Termination criteria for individual experiments were as follows: (i) infiltration time exceeded two hours, (ii) water reservoir storage became empty, or (iii), an unavoidable circumstance occurred (rainfall event, sensor failure, operator error, etc.).
The experiments were performed with the use of a newly developed infiltration device. The automated multipoint minidisk infiltrometer, “MultiDisk”, consists of six infiltrometer modules (see Figure 2) with stainless steel porous disks with a diameter of 4.45 cm and 3 mm thickness. The proposed device is automated using a high precision load cell with a mounted vertical bar which is immersed in water in the reservoir tube (with a maximum storage volume of 175 cm3). The volume of infiltrated water is measured via changes of buoyant force acting on the vertical bar [28]. The output signal of the load cell is recalculated to the actual cumulative infiltration; cumulative infiltration data are directly fitted using the Philip equation [42], and unsaturated hydraulic conductivity is evaluated using the modified Zhang method [43,44].
The automated multipoint minidisk tension infiltrometer (MultiDisk) consists of two separable identical aluminous frames and an enclosure containing the datalogger and battery. Each of the two frames is equipped with three infiltrometer modules and a single Mariotte bottle that allows for the application of a constant pressure head during the infiltration experiments. Figure 2 presents the single frame with three infiltration modules in an operational configuration. Bisection of the MultiDisk allows the preparation of each part independently (see Figure 3) at different locations, while another advantage is the possibility of setting different degrees of pressure head for both triplets of infiltrometer modules, ranging from −0.5 cm to −6.0 cm. All MultiDisk’s modules must have perfect hydraulic contact between the porous disc and soil surface. This can be achieved by leveling the frame into a ground plane using three leveling screws. The datalogger is placed in the transport box during the measurement.

2.3. Estimation of K in Soils with Changing Structure

In the present study, we assume that gradual topsoil consolidation (change of bulk density) induced by mechanical compression, stubble breaking, raindrop impacts etc. can be characterized by measured saturated water content. To prove the correlation between the bulk density and the saturated water content, we analyzed 217 undisturbed soil samples from the topsoil. The sampling was conducted during the growing seasons of 2013 and 2014. The samples, each with a volume of 100 cm3, were collected from fields within the Nučice experimental catchment, no further than 400 m from the infiltration experiments.
We adopted the suggestion of Nimmo [45] who hypothesized that the pore size distribution and therefore the soil water retention curve varies due to agricultural practice predominantly in the region of large pores, i.e., low-pressure heads. This key hypothesis is also supported by the results of Ahuja et al. [46] who showed that tillage influences mainly larger pore-sizes and that the topsoil saturated water content increases after tillage. As the volume of the large pores in the topsoil varied for each infiltration experiment, we modified the retention curves accordingly. The modification was done based on the measured actual saturated water content.
Soil samples were taken after each infiltration experiment. Experiment-specific retention curves resulted from the fitting of resampled points to the reference retention curve across the range of pressure heads (−100 cm to −10,000 cm) and the measured saturated water content. The only optimized retention parameter was van Genuchten’s empirical parameter α (cm−1). Residual water content and empirical van Genuchten’s parameter n, often associated with the pore size distribution (e.g., [47]) rather than changes in macroporosity, exhibited very low sensitivity to the θs variability and therefore remained fixed. Thus, experiment-specific retention curves were obtained for each infiltration experiment. For presentation, in Figure 4 the soil matrix parameters are scaled using scaling factors of pressure head and water content [48]. Scaling factors allow each of the experiment-specific retention curves to be characterized by a unique set of scaling factors representing a single measurement campaign (IE1 to IE13, see Table 1).
Subsequently, we utilized the two parameter infiltration equation by Philip [42], which was originally derived for one-dimensional flow. The same equation with a different interpretation of coefficients was used for three-dimensional flow:
I C = C 1 t 1 / 2 + C 2 t
where IC is the cumulative infiltration rate (m), t is time (s), and C1 (m s−1/2) and C2 (m s−1) are coefficients which can be determined by fitting Equation (1) to the measured infiltration data. Zhang suggested that hydraulic conductivity is dependent on the value of C2, the van Genuchten’s retention parameters n (-) and α (cm−1), the disk pressure h0 (m) and the radius of the infiltration disk r0 (m) [43]. For near-saturated hydraulic conductivity and n < 1.35 [44] Equation (2) holds:
K h 0 = C 2 ( α r 0 ) 0.6 11.65 ( n 0.82 1 )   exp   [ 34.65 ( n 1.19 ) α h 0 ]
where Kh0 (cm s−1) is the unsaturated hydraulic conductivity corresponding to the pressure h0. The set of experiment-specific retention curves allows for determination of experiment-specific near-saturated hydraulic conductivity, which reflects changing soil structure over time.

2.4. Rainfall Kinetic Energy Calculation

Measured rainfall intensity was used for the calculation of cumulative rainfall kinetic energy. Rainfall kinetic energy was calculated based on the empirical exponential expression [15]:
k e = 28.3 ( 1 0.52 exp ( 0.042 i ) )
where ke stands for kinetic energy per unit rainfall depth (J mm−1 m−2) and i stands for rainfall intensity (mm h−1). The cumulative kinetic energy, to which the surface was exposed, is based on the accumulated kinetic energy between two seedbed cultivations. It is assumed that after each seedbed cultivation, the topsoil pore size distribution recovers to its initial state. The cumulative kinetic energy is the sum of kinetic energies per unit rainfall height (Equation (3)) and corresponding rainfall intensities:
K E n = i = 1 n I i k e i
where KEn (J m−2) stands for kinetic energy the soil surface exposed to between 1st and nth rainfall record of a given period delineated by subsequent seedbed cultivations, Ii stands for the ith rainfall amount (mm) and kei stands for kinetic energy per unit of rainfall height of the ith rainfall record based on Equation (3). The seedbed cultivation dates are shown in the Table 1. The second infiltration measurement (IE2 in Table 1) was performed in the period when rainfall data was missing due to a power failure at the meteorological station. The last rainfall data were recorded seven days prior to the measurement.

3. Results

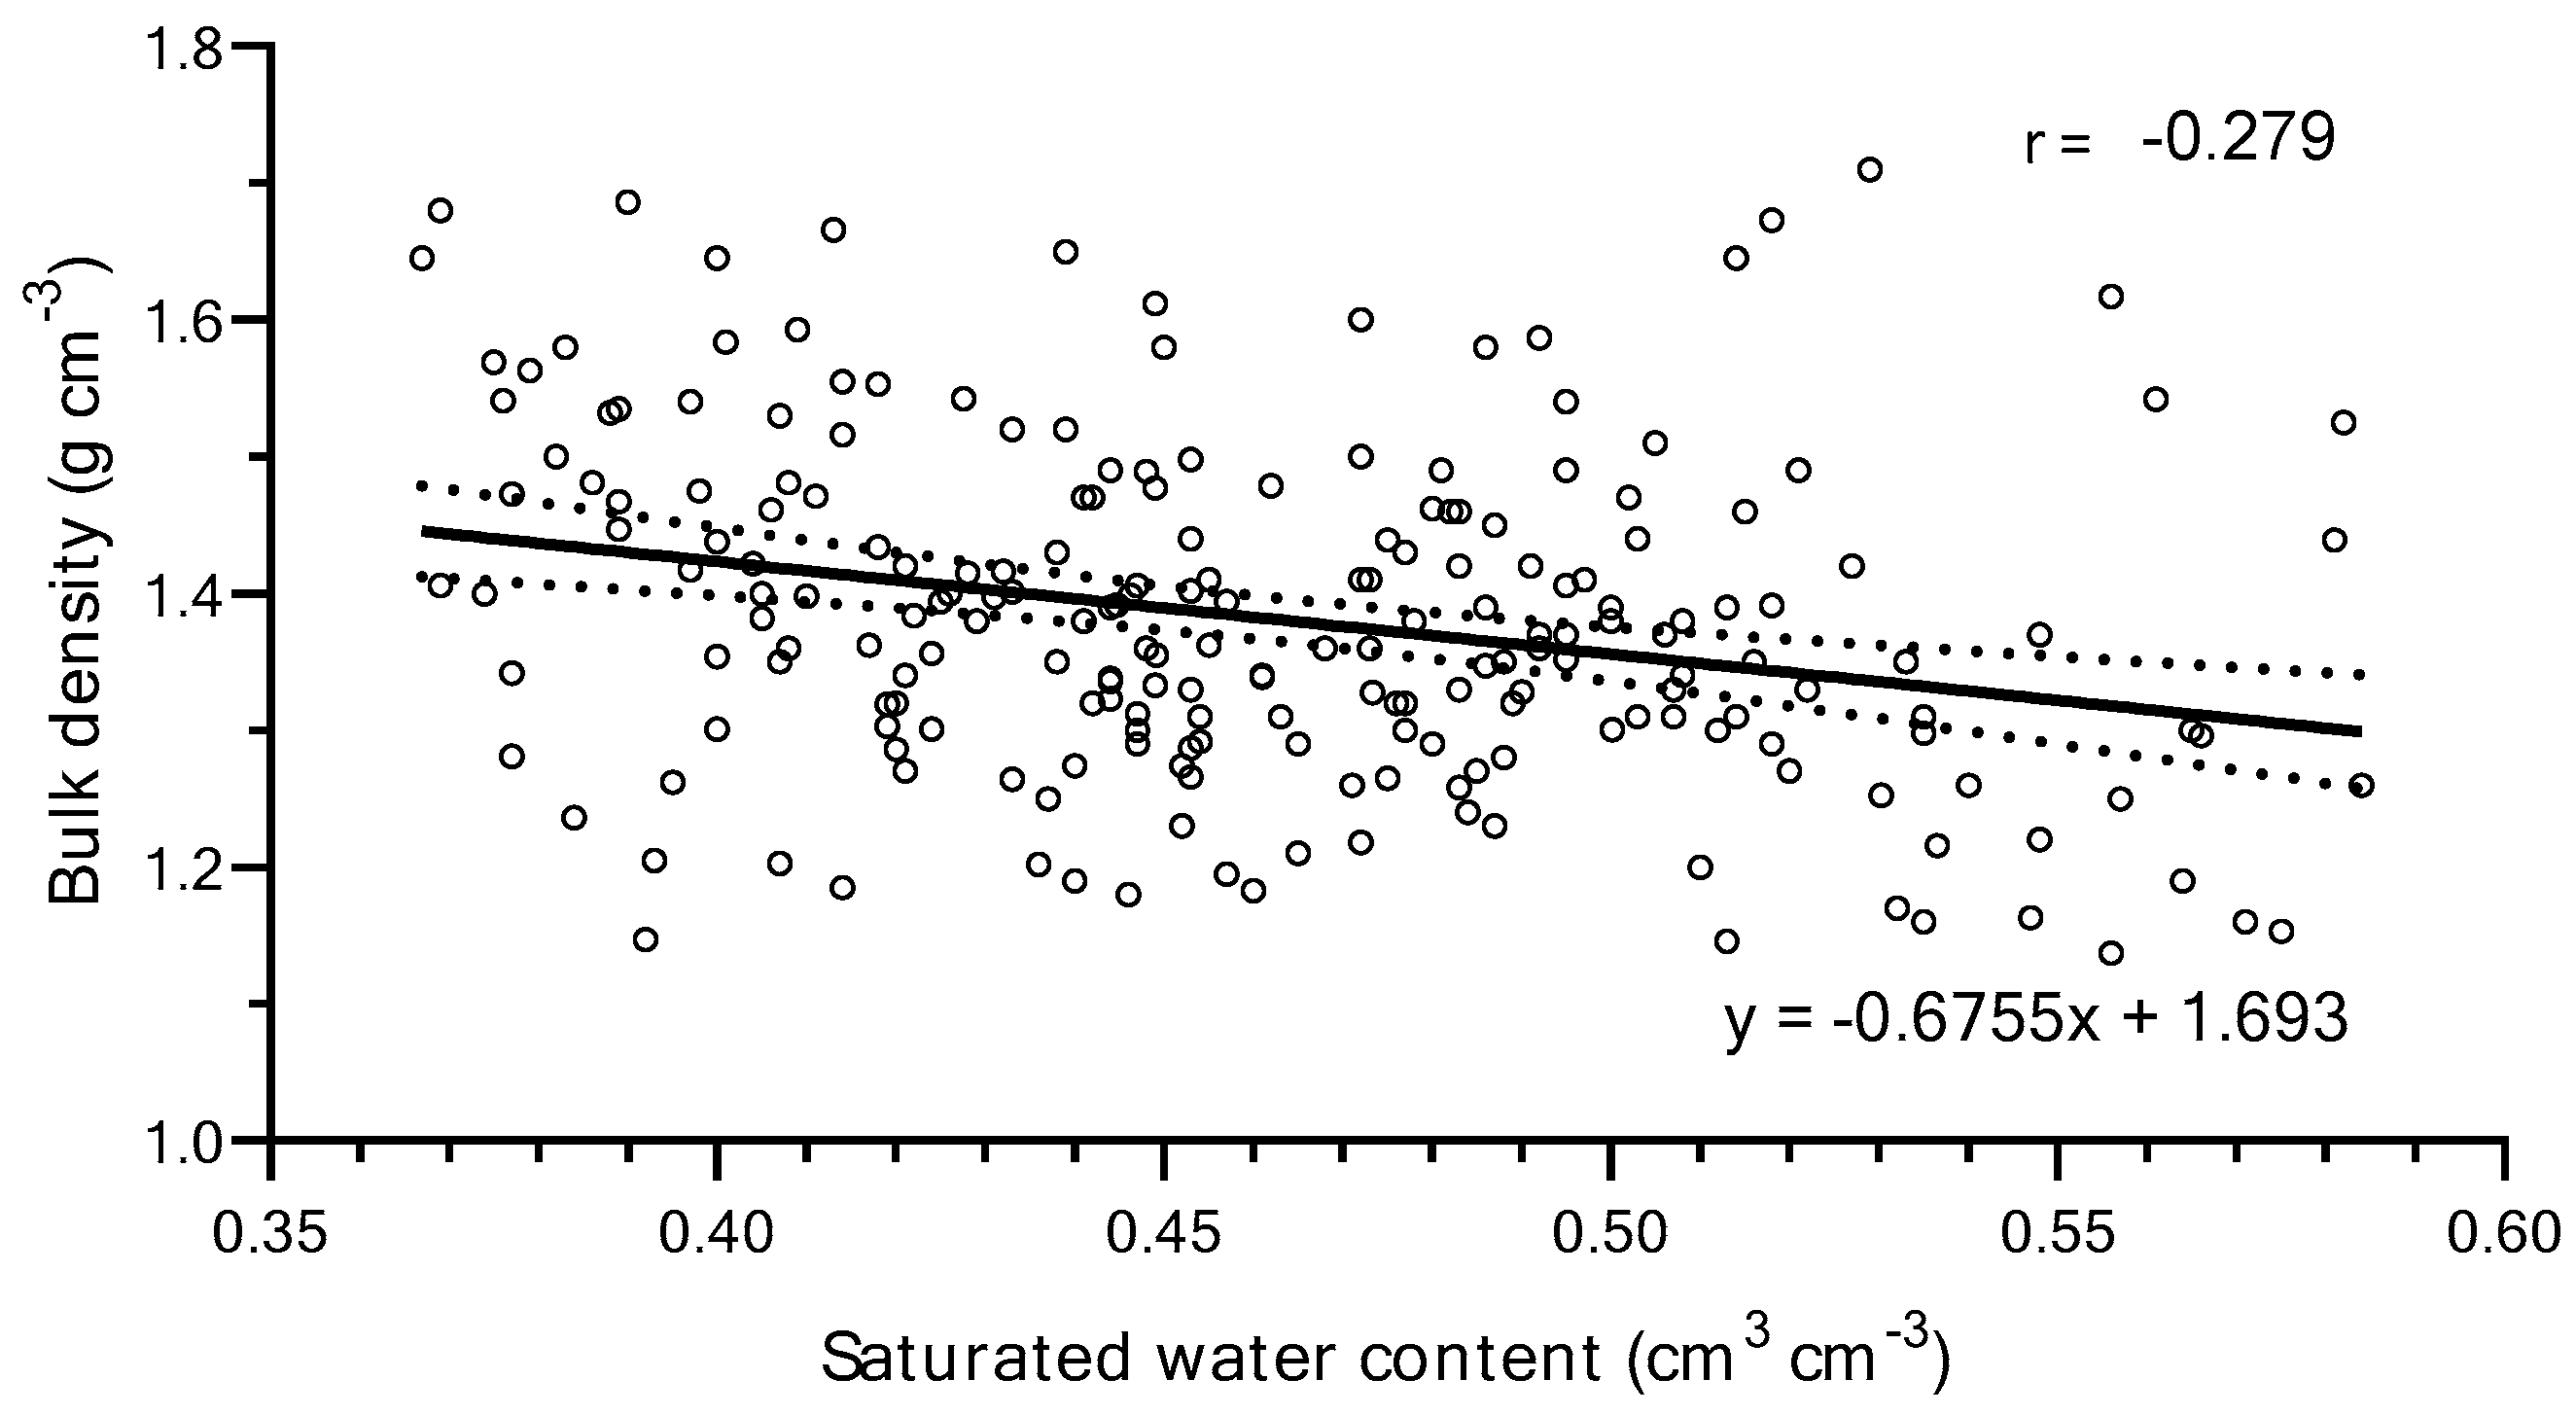
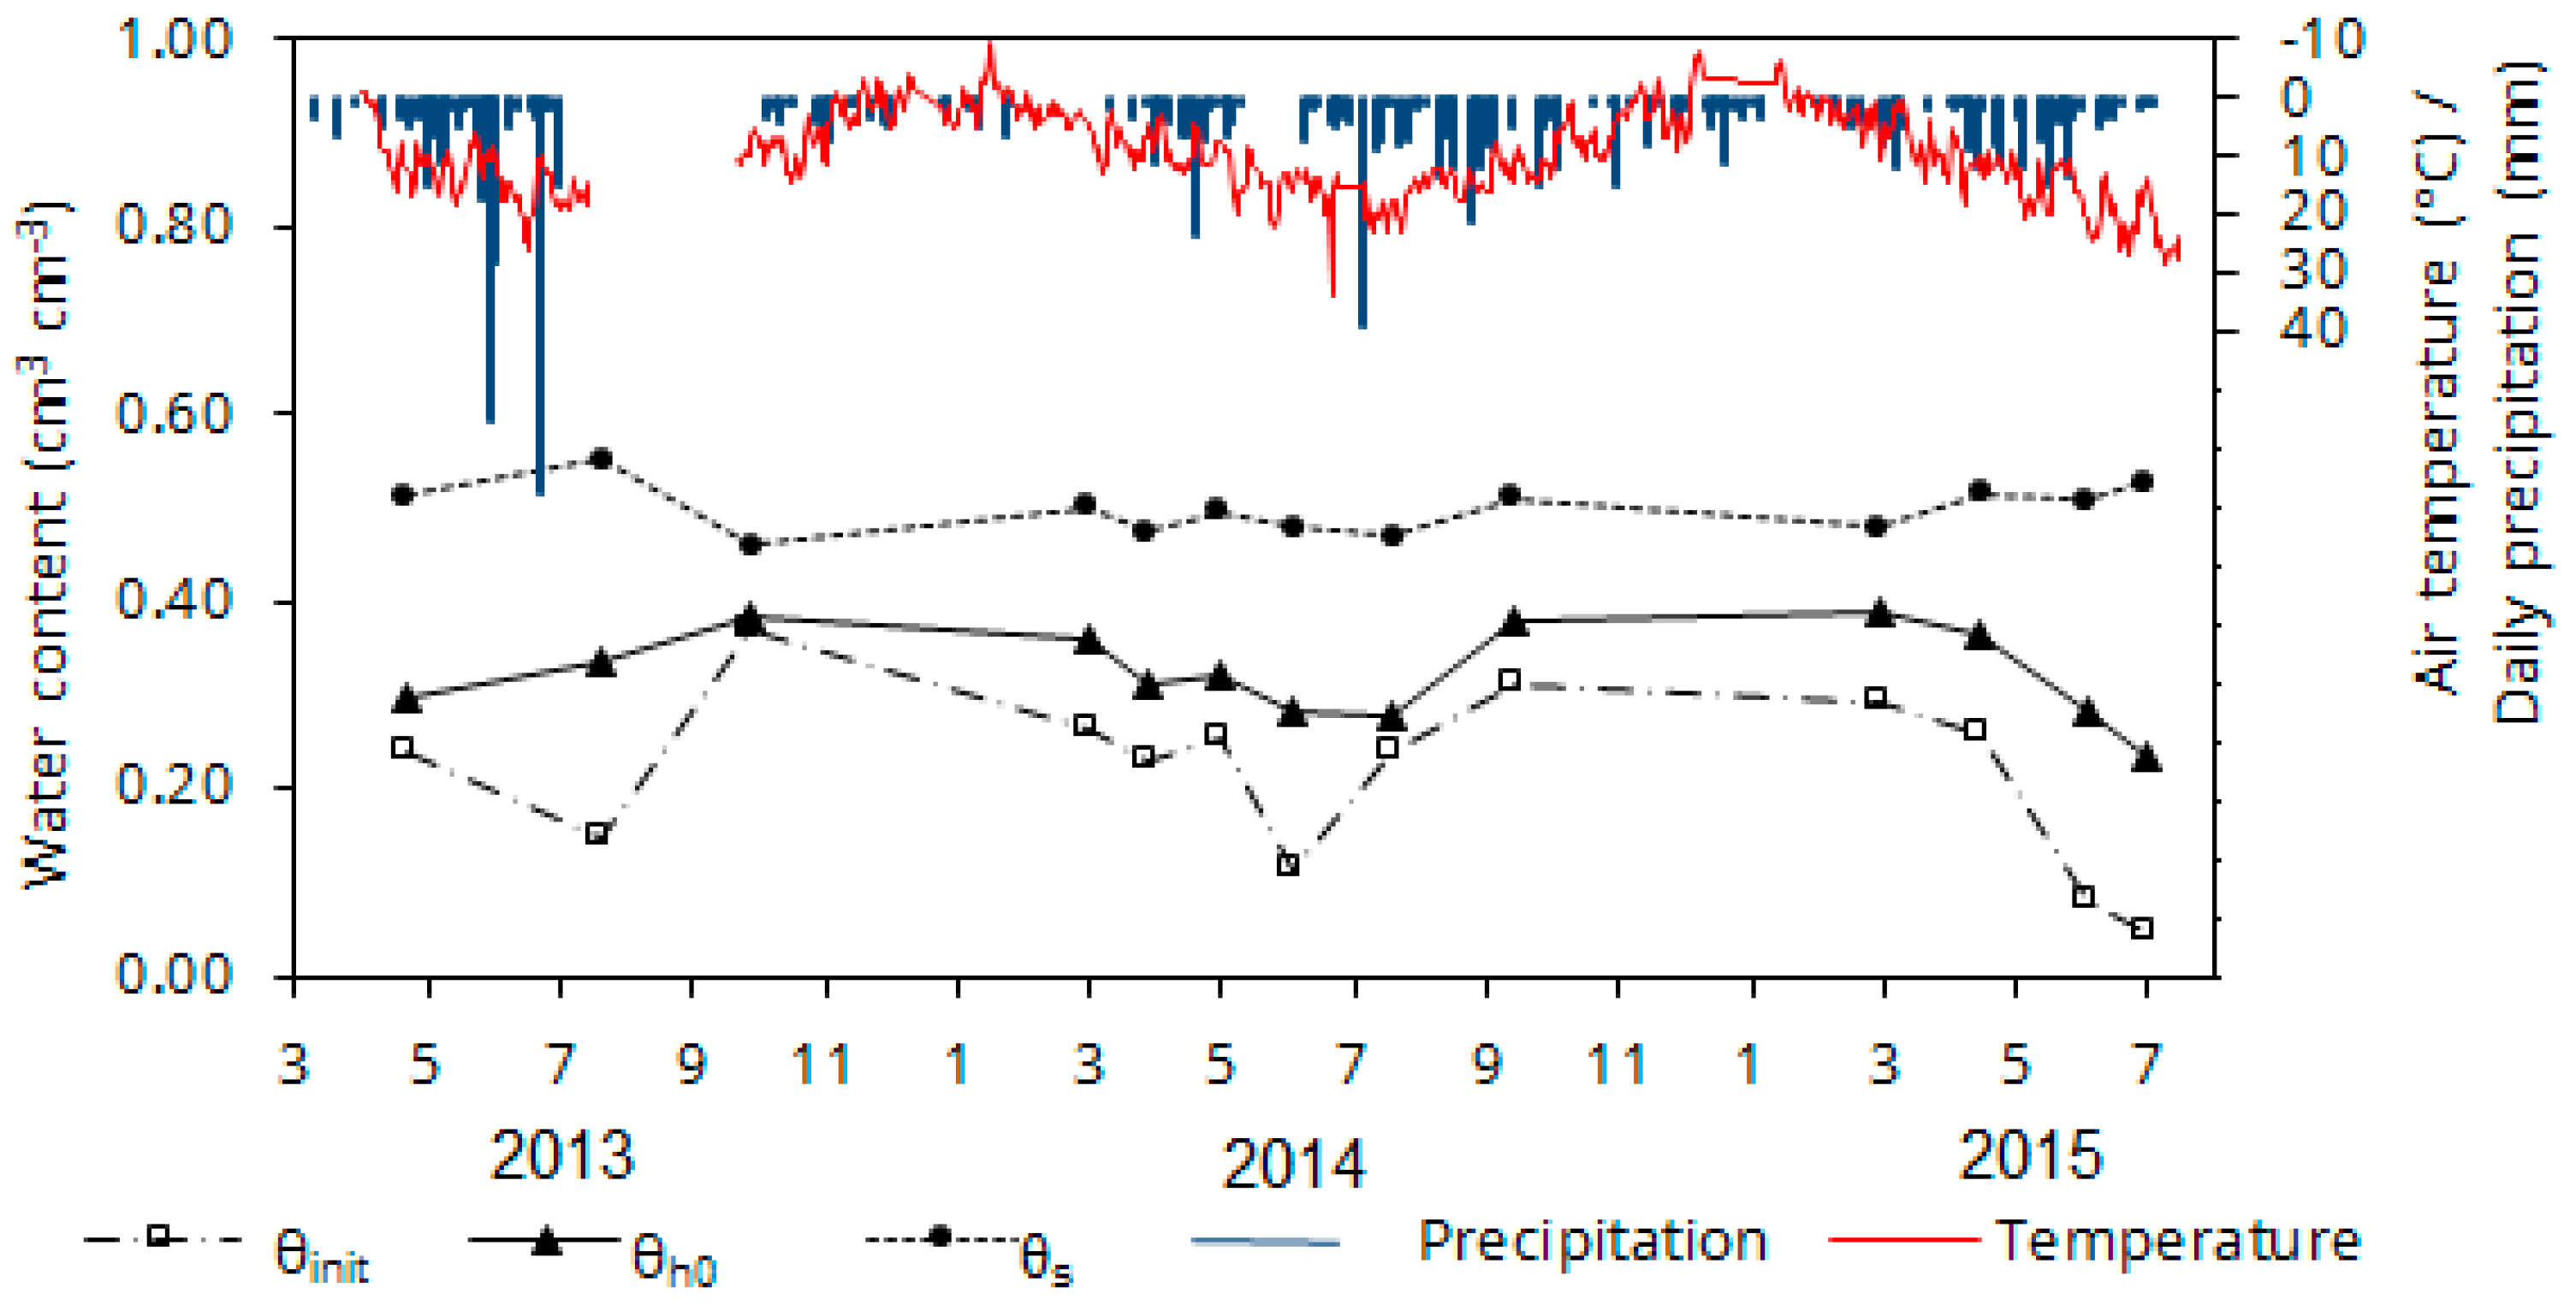
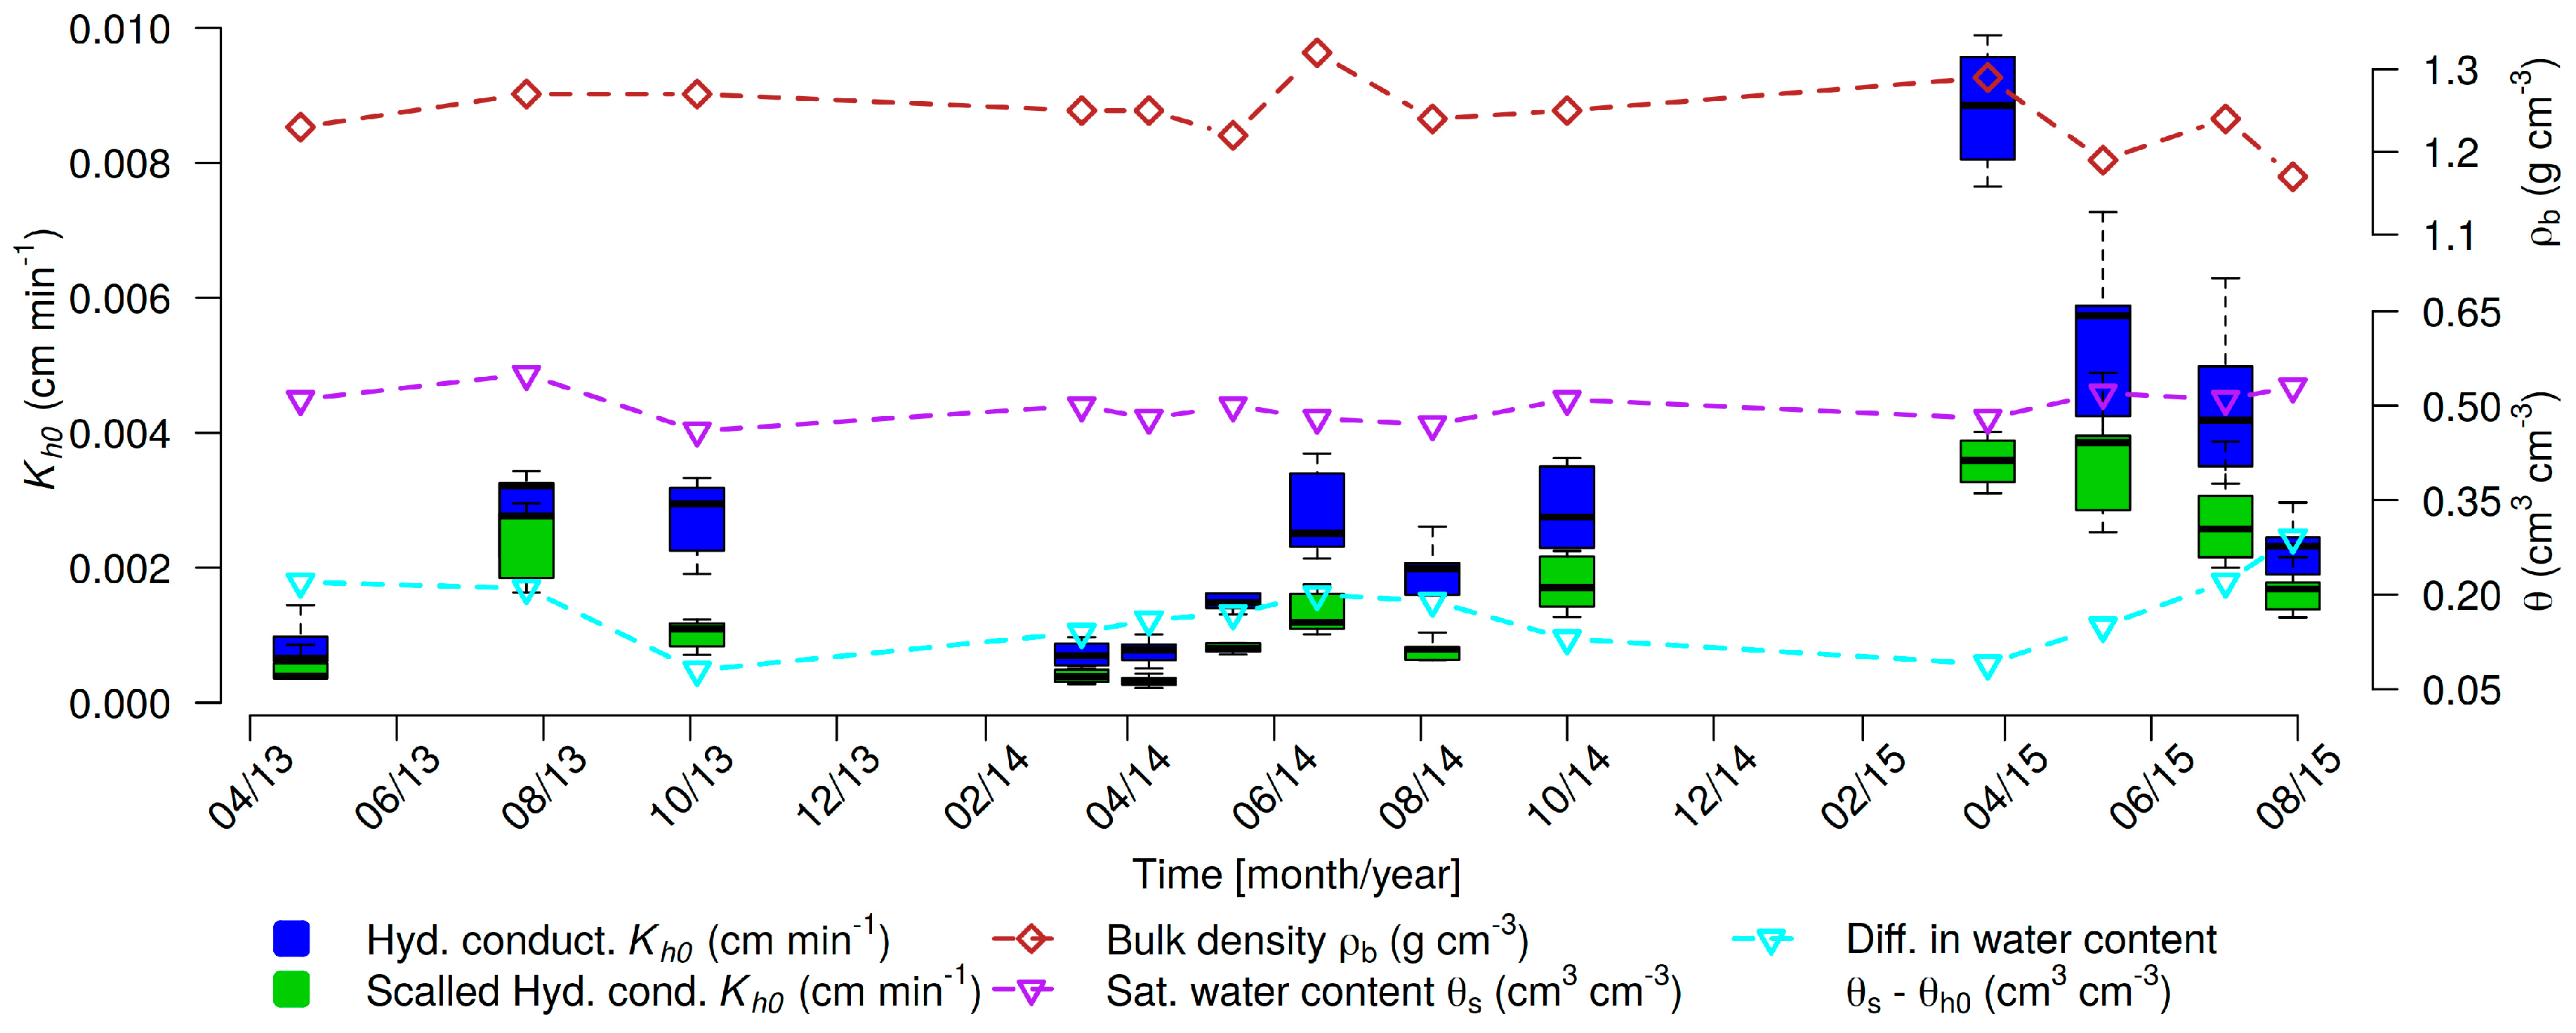
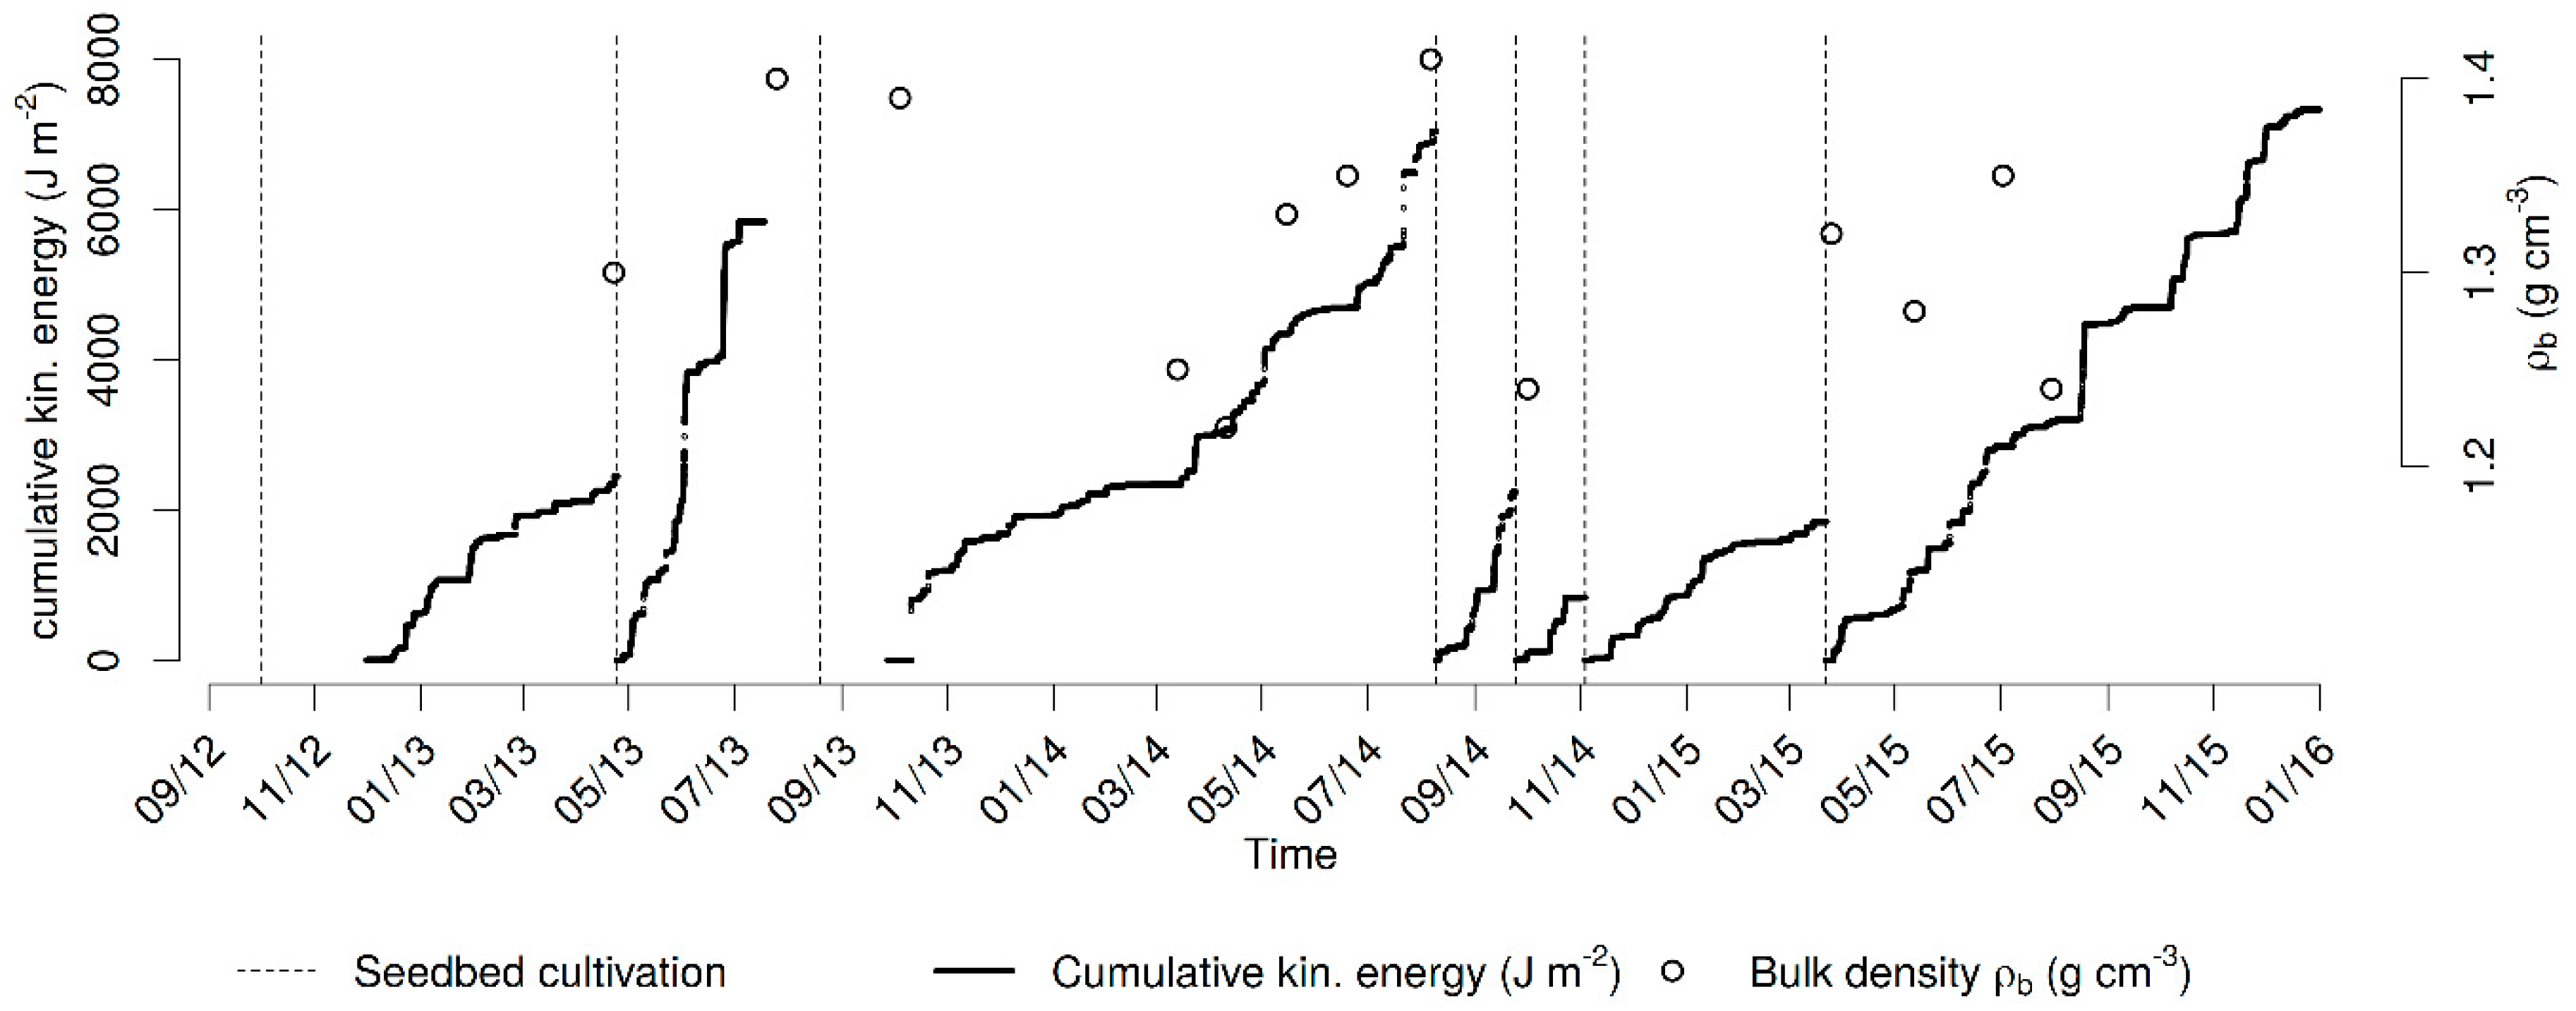
3.1. Temporal Variability of Bulk Density and Saturated Water Content

The dataset from the long-term topsoil physical characteristics monitoring shows large variability (Figure 5) with statistically significant dependence of bulk density on saturated water content, as the zero-slope hypothesis was rejected at the α = 0.05 level of significance (p < 0.0001). In general, the saturated water content of the topsoil decreased with the increasing bulk density (as a result of the topsoil consolidation).

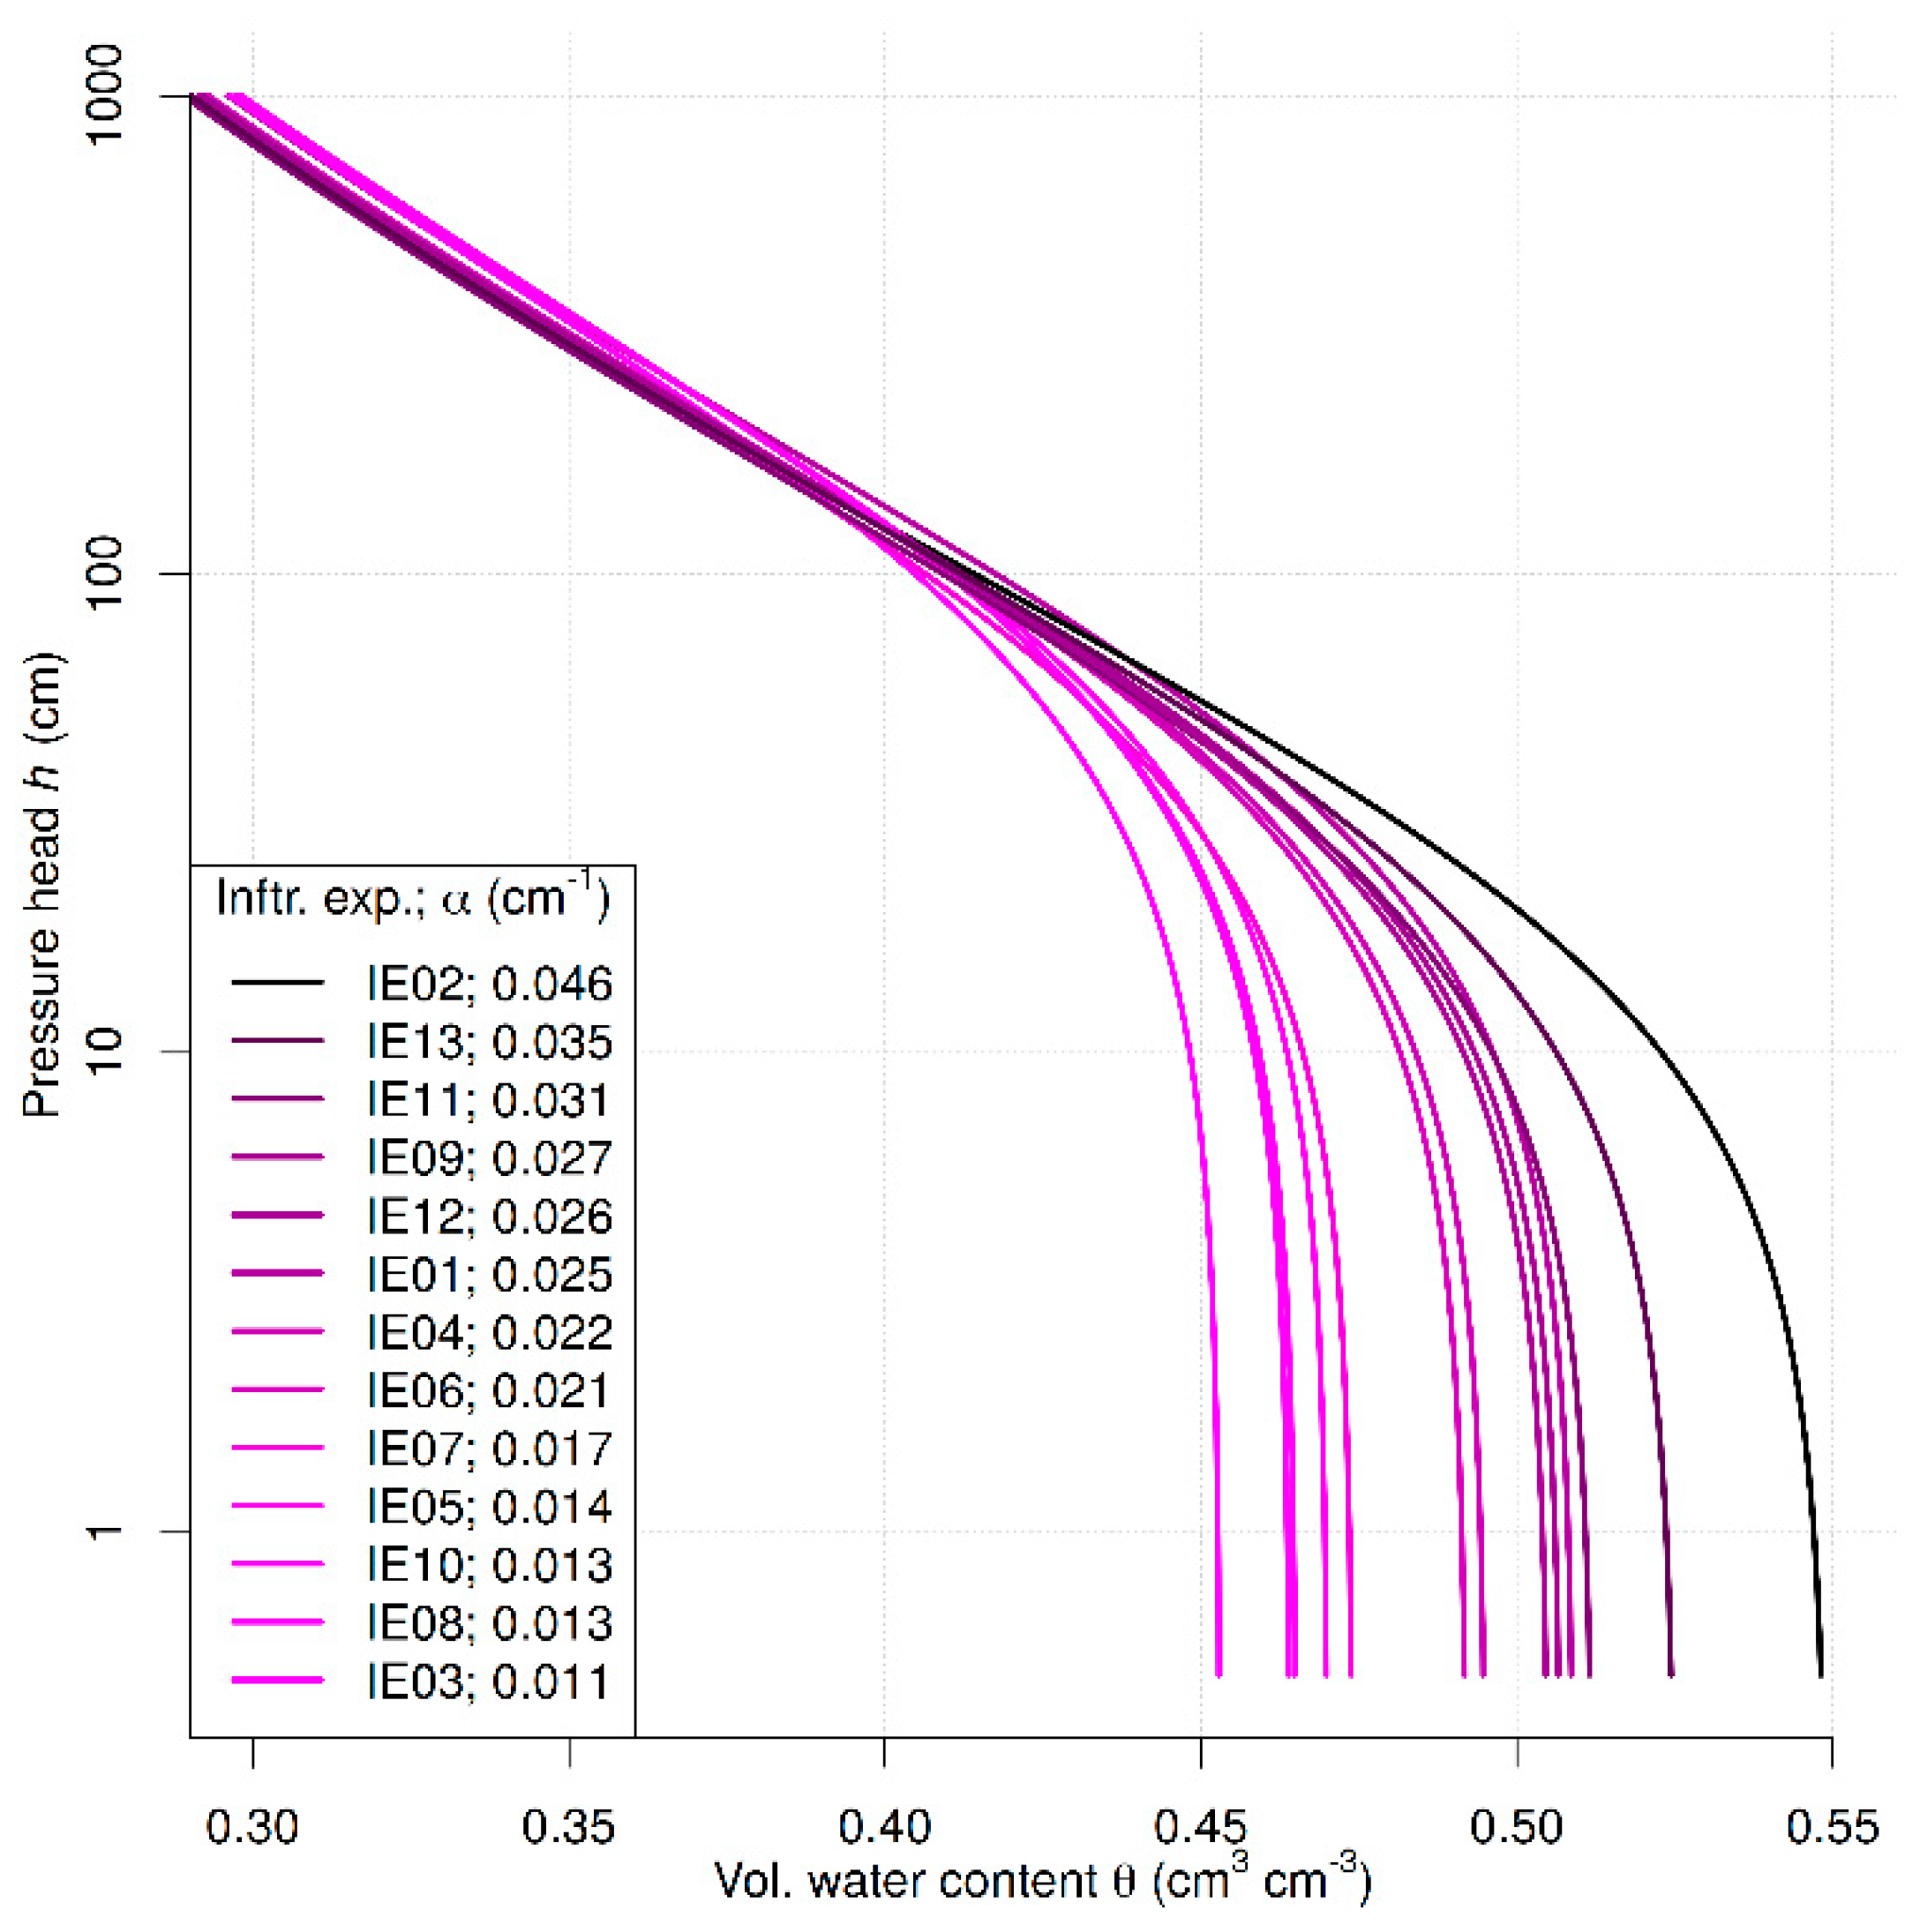
3.2. Tension Infiltration Experiments

The infiltration experiments were carried out during the vegetation season across various states of topsoil, various initial soil moisture conditions and different climatic conditions. The timing of the experiments is depicted in Figure 6 by symbols representing soil water content before and after each experiment. Initial soil water content ranged from 0.04 cm3 cm−3 to 0.37 cm3 cm−3, with dry topsoil typically in June and July and wet topsoil in the spring and autumn. Measured saturated water content ranged from 0.46 cm3 cm−3 to 0.55 cm3 cm−3 with an average of 0.50 cm3 cm−3. The unsaturated water content temporal variability ranged between the saturated and initial water content variability, with an average of 0.33 cm3 cm−3, minimum of 0.24 cm3 cm−3 and maximum of 0.39 cm3 cm−3. The meteorological, hydropedological and infiltration data are published together with the manuscript as the Supplementary Materials.
Note the low water content and high air temperatures in July 2015, when the last infiltration experiments were performed. The summer of 2015 was characterized by exceptionally high temperatures and below average precipitation in Central Europe [49].
Observed unsaturated hydraulic conductivity (Kh0) during three growing seasons shows high temporal variability (Figure 7). The difference between the blue (Kh0 calculated without retention curve scaling) and the green box-plots (Kh0 calculated with retention curve scaling) varies for each infiltration experiment.
Unsaturated hydraulic conductivity was lowest in early spring and increased at the beginning of summer in the years 2013–2014. During the summer and autumn (2013–2014), the unsaturated hydraulic conductivity remained relatively unchanged. In contrast, results in the year 2015 showed the opposite trend—the highest hydraulic conductivity was observed in early spring and gradually decreased until the end of July. In 2015 the measured hydraulic conductivity was twice as high as previous seasons.
Differences in trends of unsaturated hydraulic conductivities in the years 2013–2014 and year 2015 were probably caused by different precipitation regimes (2013 and 2014 were average, 2015 was very dry), agricultural management and the timing of the first spring measurement. The first two infiltration experiments (IE1, IE2) in the year 2013 took place before the spring seedbed cultivation. In 2013 and 2015, plowing was conducted in the previous year, but the first measurement was performed a few days after seedbed preparation. In 2014, plowing and sowing were carried out in the previous year and the first infiltration experiment (IE4) was conducted after winter, into the sown soil. However, the exact impact of individual agricultural procedures was not fully apparent in the dataset.
Proportionality between the soil bulk density and hydraulic conductivity for three seasons (13 experiments) was not detected at the α = 0.05 level of significance (Figure 7 and Table 2). The t-test did not show a significant non-zero slope for individual years either (Table 2). Measured unsaturated hydraulic conductivity was not dependent on initial soil water content, or on the saturated and quasi-saturated water content, with the exception of the year 2015 for the latter.

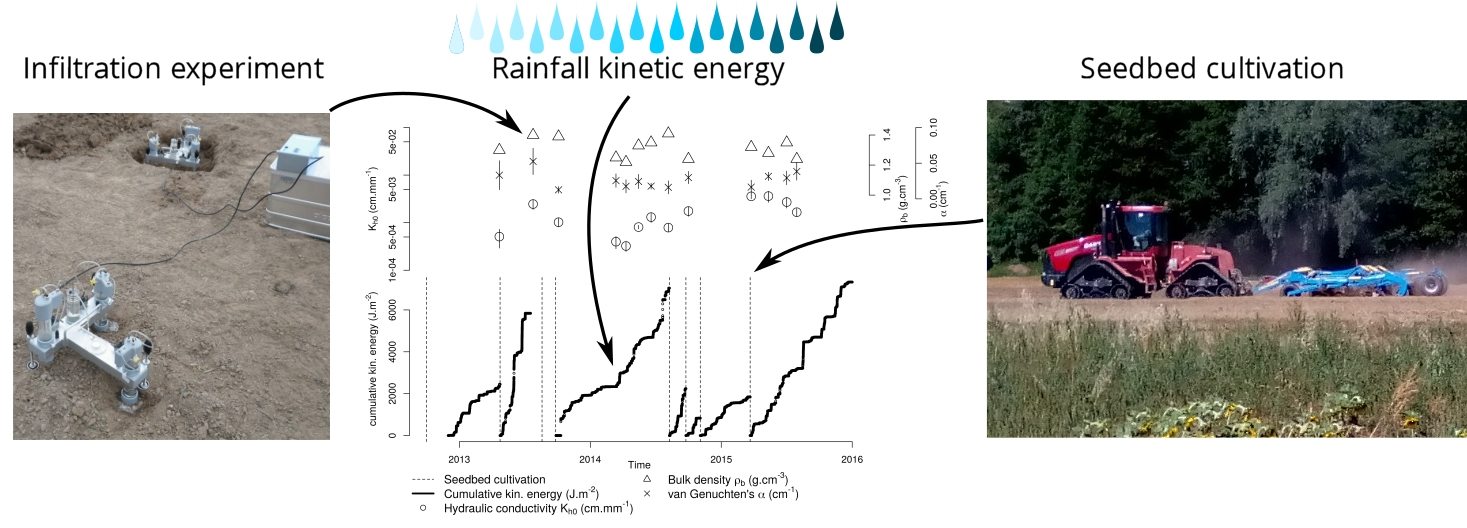
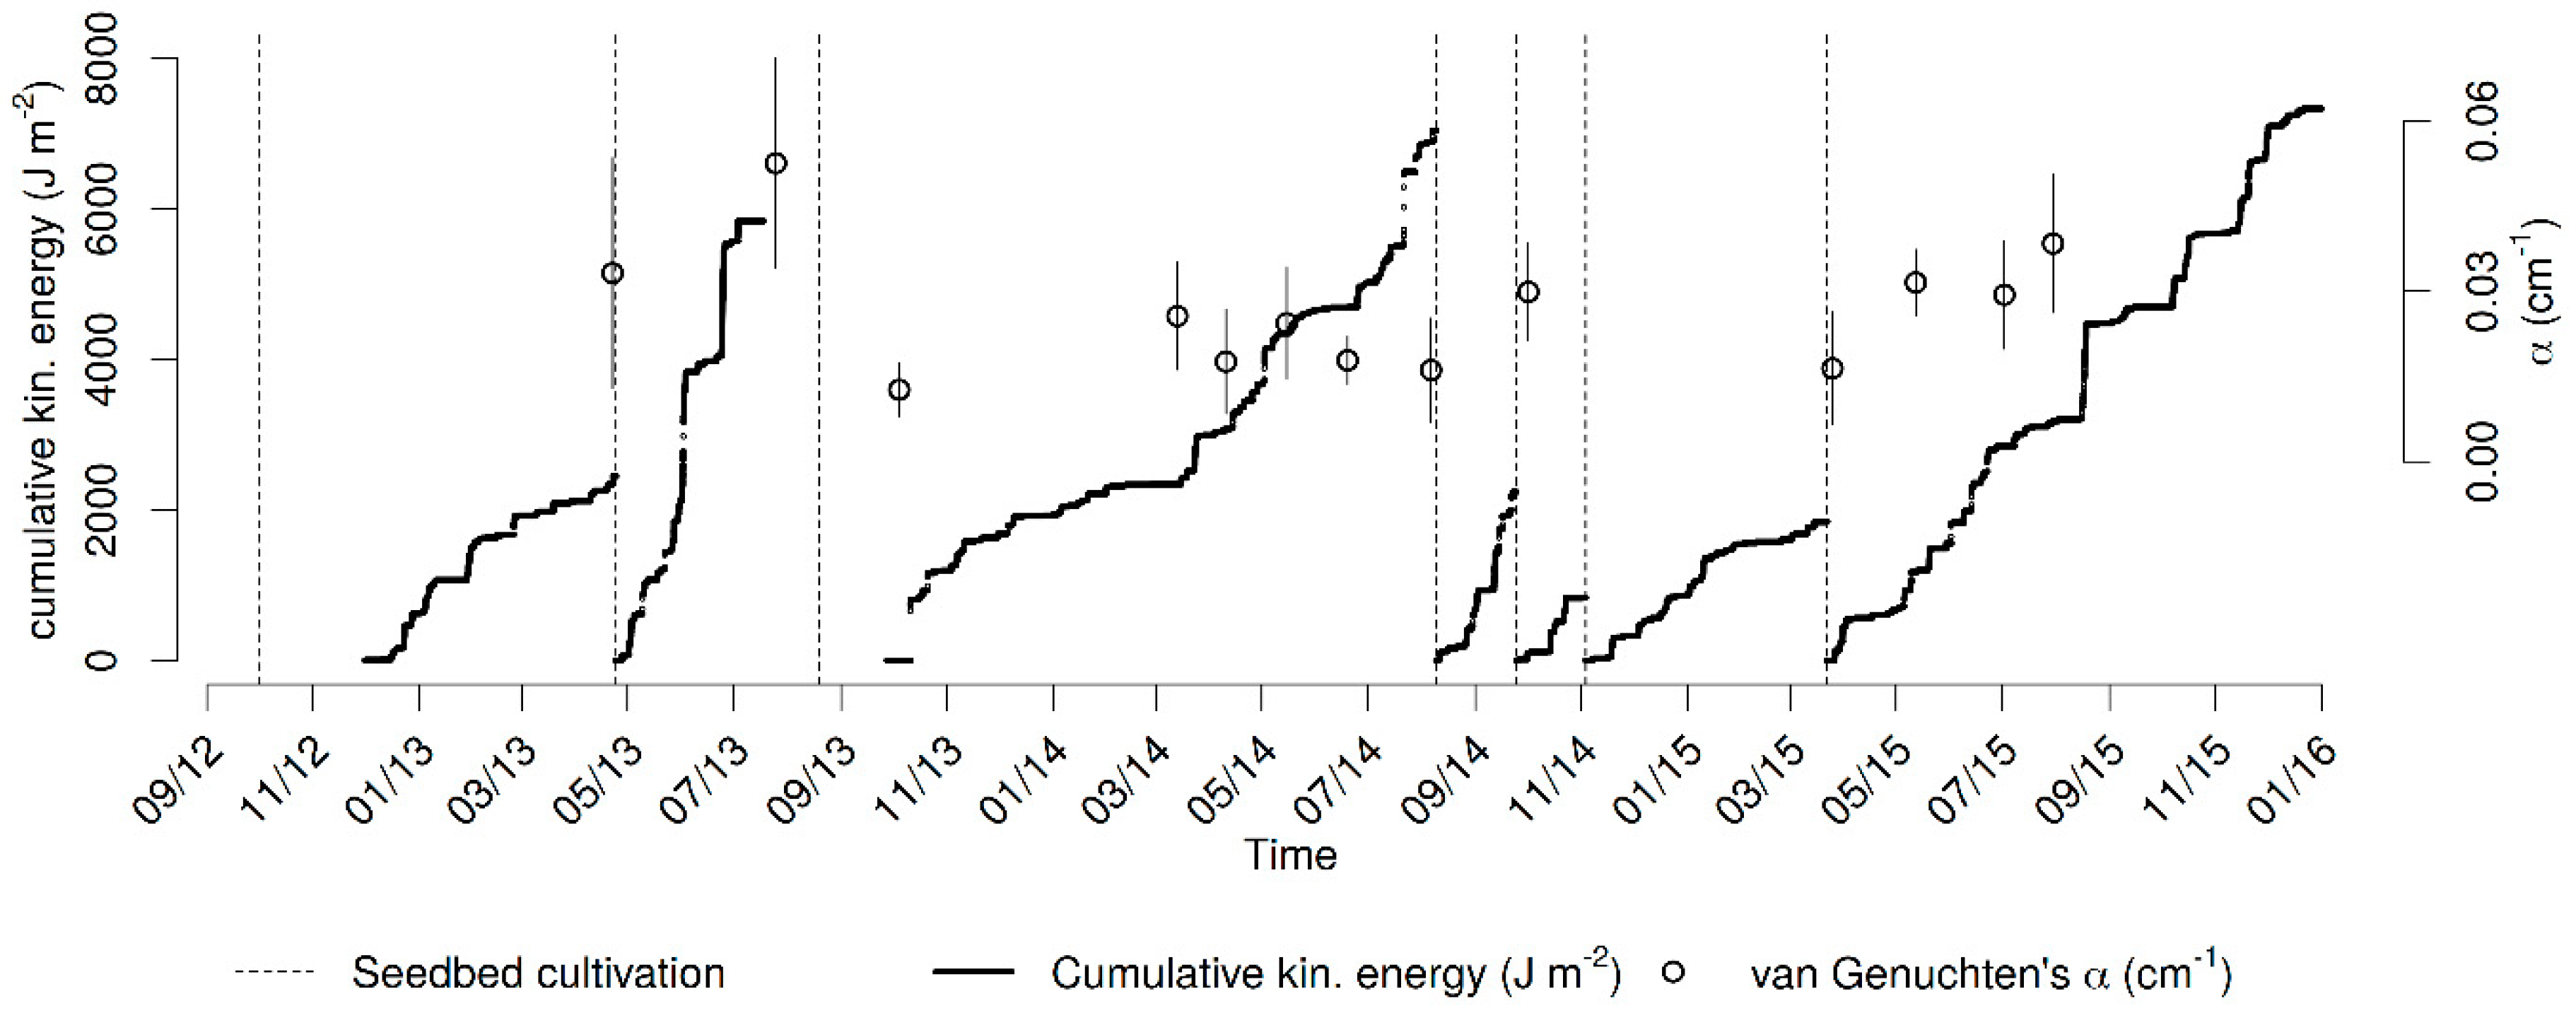
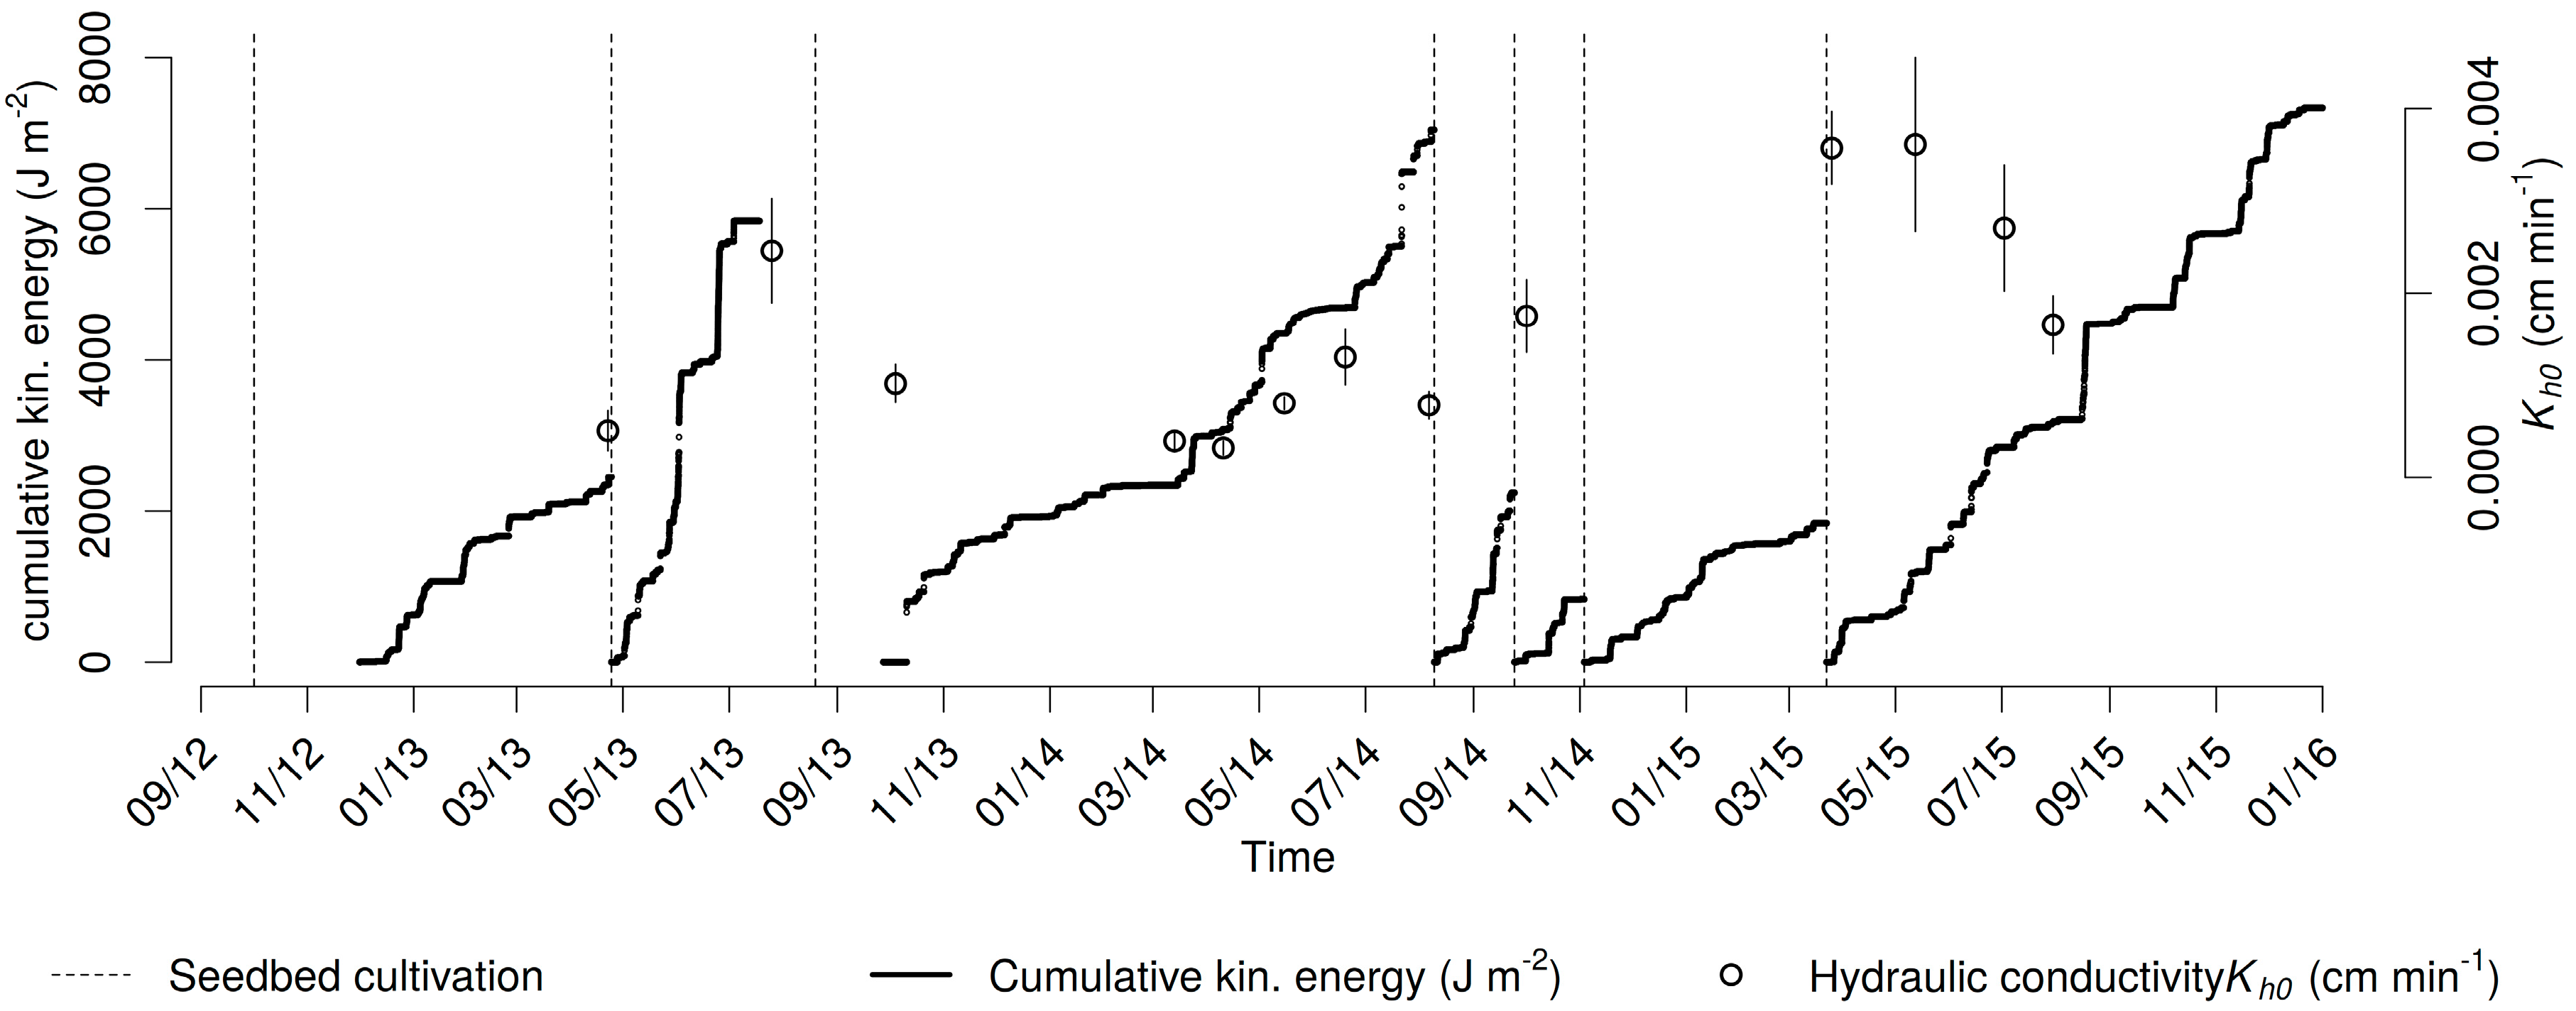
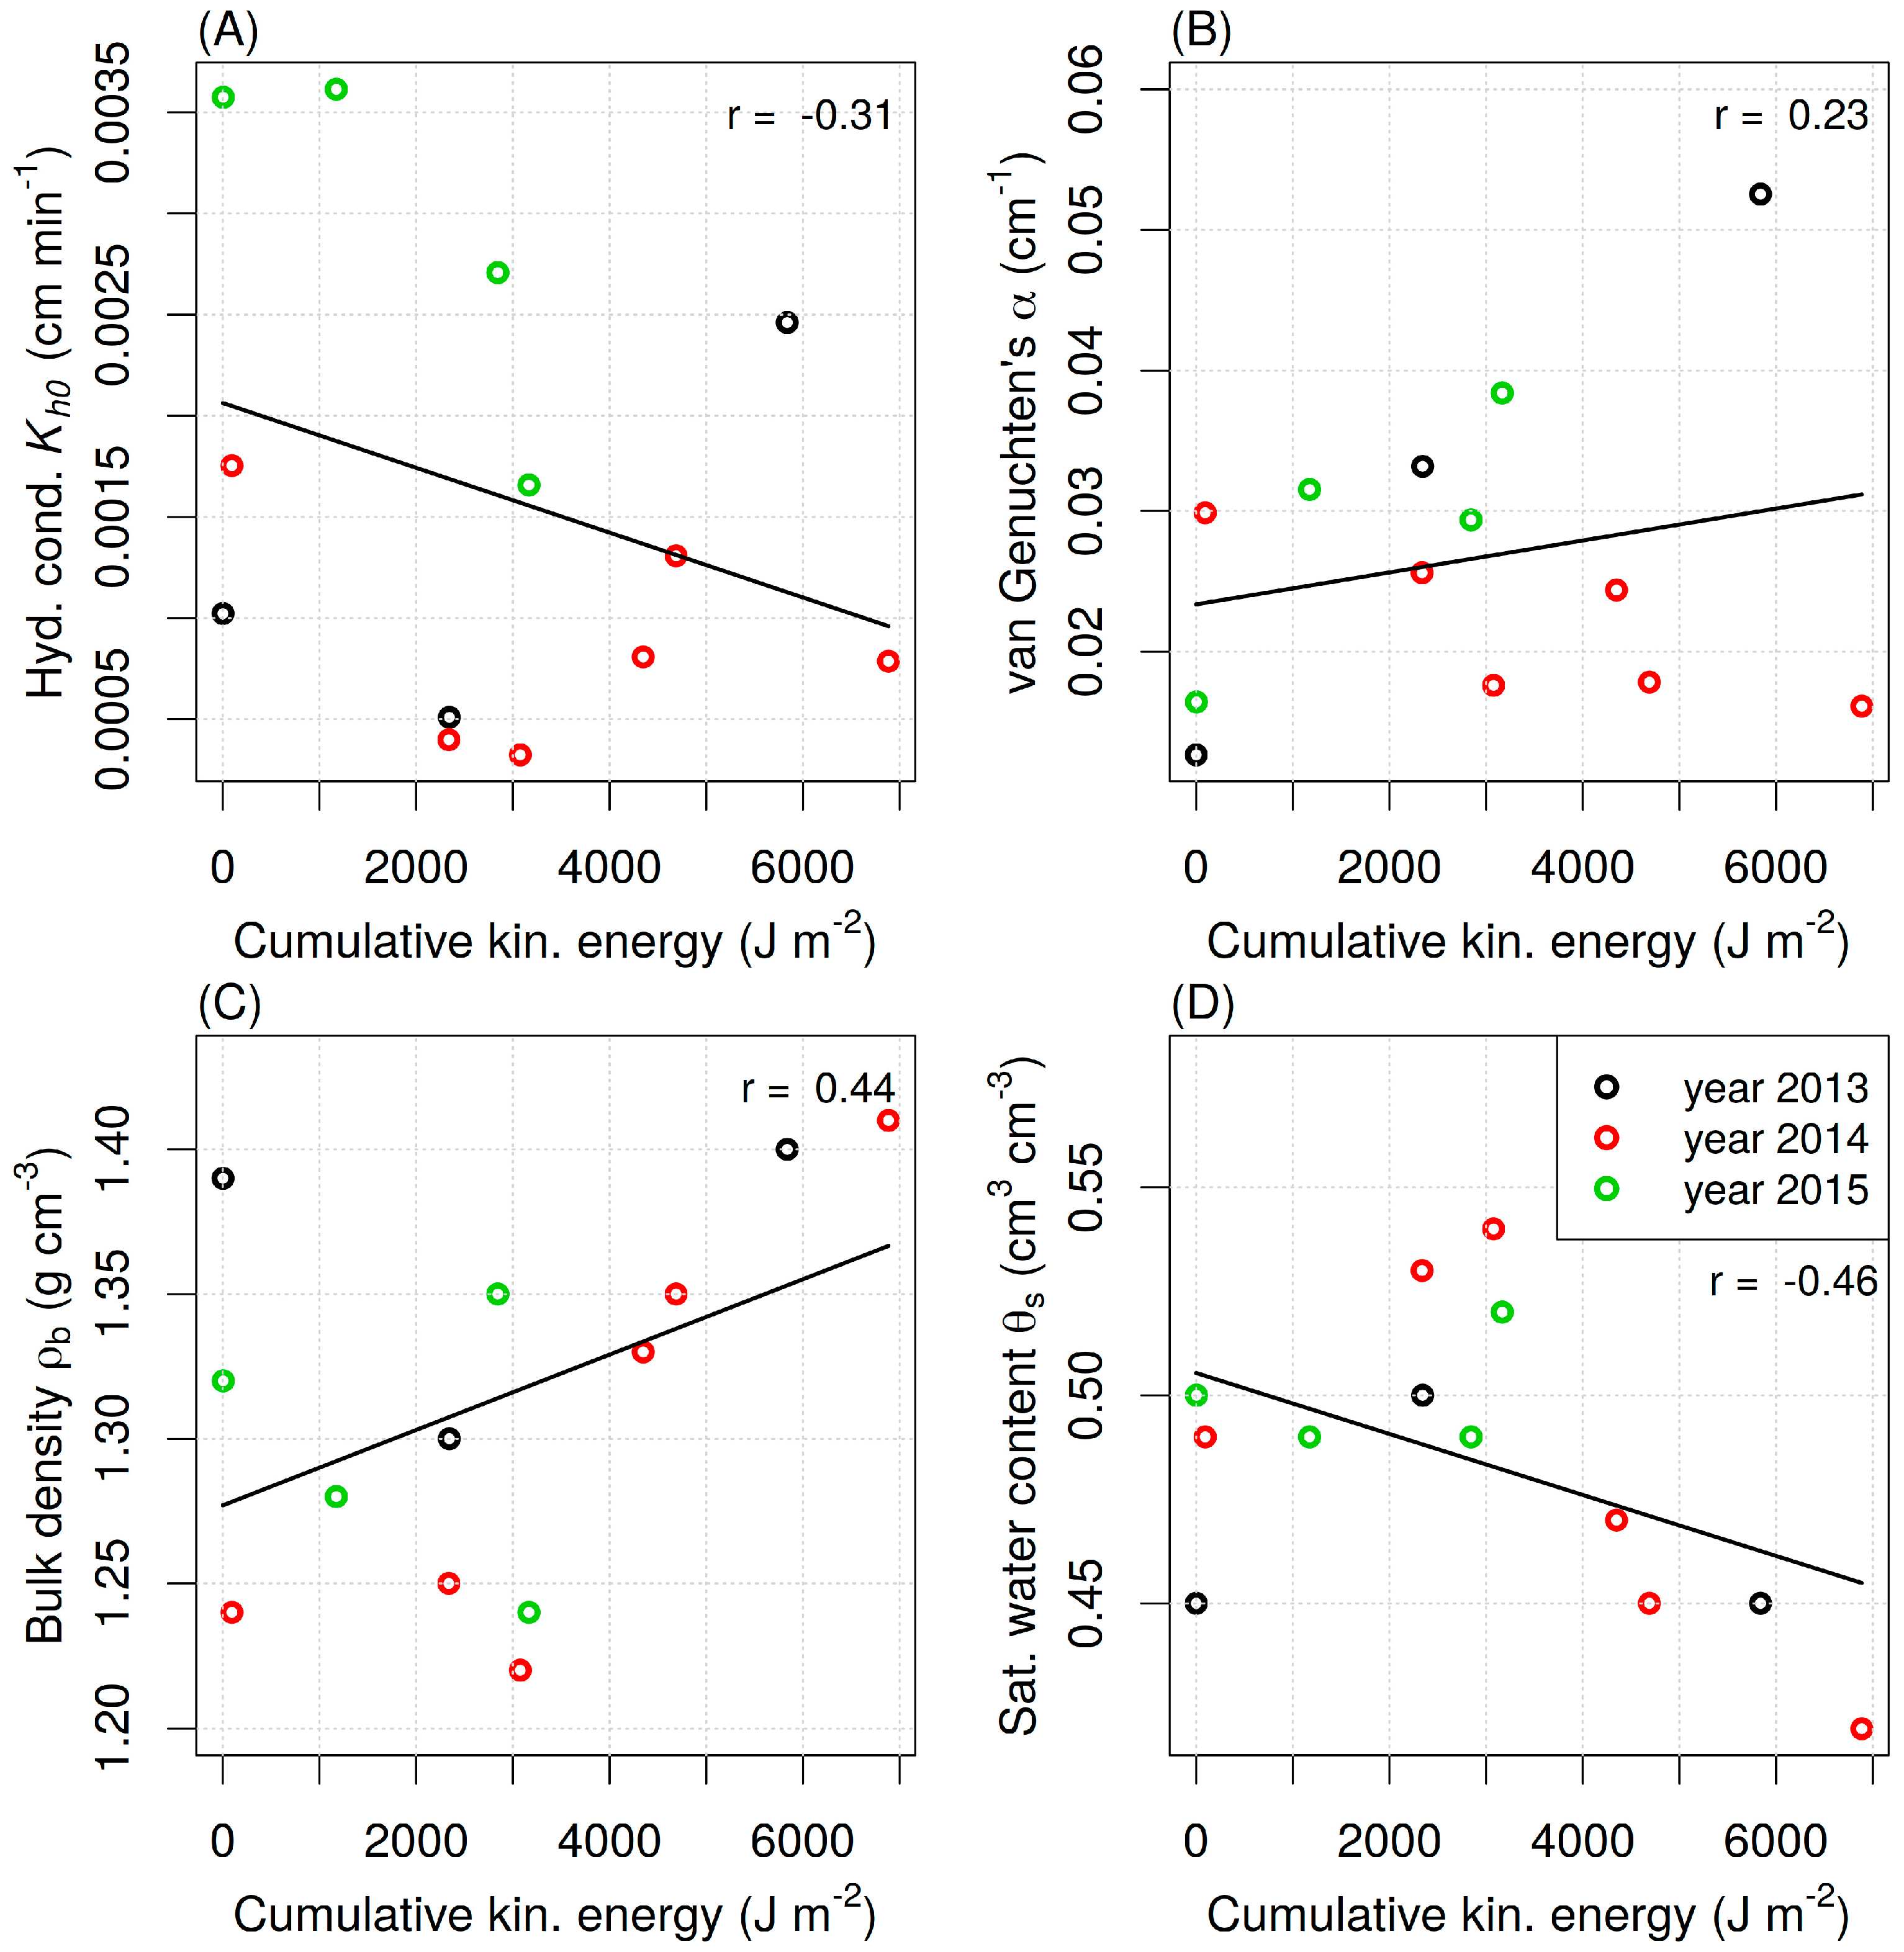
3.3. Effect of Rainfall on Unsaturated Hydraulic Conductivity

Development of the cumulative rainfall’s kinetic energy during three monitored seasons is shown in Figure 8, Figure 9 and Figure 10. It is assumed that each seedbed cultivation interrupts the topsoil consolidation effect of the previous rainfall period. In the years 2013 and 2015, seedbed cultivation was performed twice, once in spring (before sowing) and once in late summer (after the harvest). For the 2014 season, the winter wheat was previously sown at the end of 2013. During the winter of 2013–2014 the rainfall impact could have been reduced due to snow precipitation and snow cover, and this winter period was not taken into account.
Linear regressions between cumulative kinetic energy KE, unsaturated hydraulic conductivity Kh0, van Genuchten’s parameter α and bulk density ρb are shown in Figure 11. Hydraulic conductivity exhibited a negative correlation with the corresponding cumulative KE as shown in Figure 11A. In 2015, the negative trend was stronger compared to the overall trend as depicted by the trend line and the value of the correlation coefficient. In Figure 11B, the relationship between parameter α and the corresponding cumulative KE is shown, and the trend line exhibited a weak positive correlation. The trend, however, differs among the years. Although the data show an increase of α with cumulative KE in 2013 and 2015, the trend in 2014 is the opposite. It has to be noted that α and hydraulic conductivity Kh0 are not independent variables, as α is used to derive Kh0.
Bulk density was positively correlated with the cumulative KE (Figure 11C), with the only exception in 2013 where the data points corresponding to the lowest cumulative kinetic energy exhibited larger values. An increasing trend corresponds with the idea of gradual compaction between consecutive seedbed cultivations due to a complex set of factors including the impact of the rainfall. In Figure 11D, the trend between saturated water content and the corresponding cumulative KE is negative. A gradual increase of the topsoil saturated water content during the growing season is visible in all the years up to the cumulative kinetic energy of 3000 J m−2, then the θs decreases. For our interpretation of the results, the changes in the saturated water content serve as a proxy for macroporosity.
The dataset shown in Figure 11 was further tested to determine whether there was a significant linear relationship between the variables. Where the slope of the regression line is significantly different from zero, with the use of Student’s t-test it is possible to conclude that there is a significant relationship. The results of the test are shown in the Table 3. Based on the test, the slope of all trend lines is not significantly different from zero. Only bulk density and saturated water content showed smaller p-values, however none reached the level of significance, 0.05.

4. Discussion

4.1. Tension Infiltration Experiments

The key problems relating to the tension infiltration experiments are the long duration of a single infiltration and the high spatial variability of unsaturated hydraulic conductivity, as it is strongly dependent on actual pore geometry. The selection of an appropriate method for the given conditions and soils is important to obtain representative values of hydraulic conductivity [50]. We have shown that the use of the MultiDisk, consisting of two triplets with automated infiltration modules, is a very effective way to perform a large number of infiltration experiments. The obtained values of the unsaturated hydraulic conductivity were within the range of previously published results measured in agricultural tilled soils, e.g., [51,52,53,54].
The temporal variability of Kh0 was approximately ten times higher than the spatial variability observed during each infiltration campaign (Figure 7). A similar conclusion was presented by Moret and Arrue [54] who observed a significant impact of tillage on soil hydrophysical properties in both short-term and seasonal scales, which outweighed the effects of spatial variability. The main driver of Kh0 temporal variability on the tilled soil studied is attributed to the actual state of the topsoil structure; namely the macropores, mesopores and large inter-aggregate void proportion and connectivity changes, as also suggested by, for example, [10,41,55,56]. Additional explanations for the increase of the hydraulically active pores during the season are biological activity, carbon content, root growth, and wetting/drying cycles [57].
In 2013 and 2014, the Kh0 was increasing as topsoil was consolidating after tillage, which is in agreement with other studies [57,58]. This trend suggests that the loose soil after tillage has a high proportion of larger inter-aggregate voids that decrease water flux during unsaturated conditions [20]. Also, high precipitation resulted in a higher soil water content throughout the seasons (compared to 2015) which was the driver for the slightly increasing Kh0. We can exclude the effect of the surface soil crusting; the crust, if present, was always removed before the experiments. The Kh0 trend was different in 2015 when compared to the previous years. Surprisingly, in 2015 the Kh0 increased throughout the season, and the measured Kh0 values were significantly higher than in previous years. Similar trends were observed in previous studies, but usually due to the surface clogging or because lower suction pressure was applied during the infiltration [59]. Decreasing unsaturated hydraulic conductivity through the growing season has been reported as well due to clogging of pores by fine soil particles detached from aggregates by rainfall impact [36] or rainfall induced soil surface sealing [60]. The reason for the different outcome in our case is not clear; however, a possible explanation could lie in the specific weather conditions in 2015, which resulted in exceptionally dry topsoil conditions before the spring tillage and throughout the season. Soil moisture conditions and soil aeration affect the amount and properties of macropores [61]. Tillage of very dry soil could also lead to lower stability and differing sizes and arrangement of soil aggregates. The unstable soil aggregates could break down and regroup, even during tension infiltration, so that the fine particles fill the inter-aggregate voids. A high water pressure gradient due to very low initial soil moisture, caused rapid water fluxes and probably resulted in a slightly overestimated Kh0 for the experiments performed in July. Different year-on-year trends in hydraulic conductivity that cannot be easily explained were also observed by Jirku et al. [62].
Unfortunately, neither the soil aggregate stability nor imaging techniques to measure the macroporosity and pore connectivity were implemented. Therefore, the proposed explanation remains a hypothesis that cannot be proven with the available data. CT imaging, especially, would be a great asset, as similar studies have proved [59,63,64,65].

4.2. Temporal Variability of Physical Properties of the Soil

It is a known fact that tillage changes the topsoil characteristics, generally leading to a decrease in bulk soil density and an increase in the soil aggregate size and macroporosity. The soil aggregate arrangement is unstable, so the topsoil eventually reverts to its former state [3,46,66].
We observed an anticipated gradual increase in the topsoil bulk density and decrease in saturated water content after each seedbed preparation. Similar results with a comparable scale of temporal changes have already been published by, for example, [62,67,68].
None of the monitored soil physical characteristics were recognized as being the significant cause of the measured unsaturated hydraulic conductivity variability. As suggested by Sandin et al. [59], the reasons for Kh0 temporal variability are complex and the pore connectivity and macroporosity also need to be evaluated. As Leij et al. [69] noted, the data on soil structural dynamics needed to propose a reliable model that would explain its effect on the water dynamics are still lacking.

4.3. Effect of Rainfall on Soil Water Regime

The impact of rainfall on topsoil consolidation and soil structure has been already studied, but rainfall kinetic energy is often missing from the rainfall properties tested. Detailed rainfall properties, including kinetic energy, are commonly analyzed in soil erosion studies, especially when evaluating splash erosion [70,71,72]. It has been shown that rainfall intensity and duration affect the degree of topsoil compaction (increase of bulk density and decrease of macroporosity) and surface seal formation [8,73]. The inverse relationship between rainfall event kinetic energy and saturated hydraulic conductivity has also been observed [74].
The analysis of our dataset did not show a significant relationship between the cumulative rainfall kinetic energy and monitored soil physical properties, but it needs to be emphasized that we did not evaluate the changes in the upper 1–3 cm, where the consolidation effects are stronger [10], and we did not evaluate the changes after every significant rainfall. Only during the 2014 season did we observe the expected relationship for bulk density (p-value of 0.0072) and saturated water content (p-value of 0.0068). Trends for the soil moisture retention curve and unsaturated hydraulic conductivity were not detected. The significant relationship can be partly explained by the high number and well-distributed timing of the infiltration experiments during 2014, so we were able to detect gradual changes between the seedbed preparations.
The measured data do not clearly show the variable seasonal gradient of alterations in the topsoil properties, which is mainly due to the limited number of infiltration experiments. In addition, the analysis considers kinetic energy of rainfall, but the kinetic energy of the raindrops hitting the soil surface is attenuated due to growing crops (oat, wheat, mustard) during the season, especially between May and July. Also, during this period, other factors such as roots and soil fauna strongly influence the soil water regime. One would expect that the largest changes would be detected after heavy rainfall events, especially when the soil surface is bare (spring and early summer). Bryk et al. [75] observed the largest soil structure alterations during spring under similar climate and soil conditions to ours, and they also did not find a statistically valid correlation with precipitation.

5. Conclusions

The newly developed, automated, multi-point infiltrometer (MultiDisk) was successfully used for long-term unsaturated hydraulic conductivity monitoring of intensively cultivated topsoil. The device proved to be reliable, with 72 out of 78 (over 90%) infiltration experiments recorded and analyzed successfully.
The topsoil Kh0 varied during the growing season. Kh0 had an increasing trend between the seedbed preparation and harvest in 2013 and 2014, but a decreasing trend was observed in 2015. We attribute this different outcome to the distinct climatic conditions in 2015, which resulted in very dry topsoil during most of the season. The temporal Kh0 variability, within the single seasons and across the years, was higher than the spatial variability under the studied conditions. The topsoil bulk density and saturated soil water content changed as expected with the gradual topsoil consolidation during the growing season.
Based on the seasonal dataset we could not observe a statistically significant trend between topsoil physical characteristic changes and cumulative rainfall kinetic energy, nor between KE and Kh0. We assume that analysis performed on a single rainfall events basis could provide better results. Such a study requires Kh0 monitoring after every significant rainfall event, which is very labor intensive in the field conditions but would be feasible to perform with the use of the multi-point automated MultiDisk. More detailed data could better explain how changes in topsoil hydraulic characteristics over time are the main drivers of the topsoil temporal variability. This information would be beneficial for detailed hydrological models that need to include topsoil temporal variability.

Supplementary Materials

The following are available online at https://www.mdpi.com/2073-4441/11/4/740/s1, Supplementary: the data on temporary variable soil physical properties measured within the infiltration experiments (bulk density, initial soil water content, saturated water content, Kh0 and meteorological data (rainfall, rainfall kinetic energy).

Author Contributions

Conceptualization, D.Z. and M.D.; Formal analysis, J.J. and V.K.; Methodology, M.D. and M.S.; Project administration, D.Z.; Supervision, D.Z. and M.S.; Visualization, J.J.; Writing—original draft, D.Z.; Writing—review & editing, J.J., M.D. and M.S.

Funding

This research was performed within the project “Kinetic energy of rainfall as driving force of soil detachment and transport“, jointly funded by The Czech Science Foundation (GACR), grant number GF17-33751L, and by the Austrian Science Fund (FWF), grant number I 3049. The automated multi-point mini-disk infiltrometer was developed in the framework of project no. TA01021844 funded by the Technology Agency of the Czech Republic. Additional funding was provided by the Grant Agency of the Czech Technical University in Prague, grant no. SGS18/122/OHK1/2T/11.

Acknowledgments

We thank our dear colleague Milena Cislerova who provided insight and expertise that greatly assisted the research.

Conflicts of Interest

The authors declare no conflicts of interest. The funders had no role in the design of the study; in the collection, analyses, or interpretation of data; in the writing of the manuscript, or in the decision to publish the results.

References

  1. Pagliai, M.; Vignozzi, N.; Pellegrini, S. Soil structure and the effect of management practices. Soil Tillage Res. 2004, 79, 131–143. [Google Scholar] [CrossRef]
  2. Angers, D.A.; Caron, J. Plant-induced changes in soil structure: Processes and feedbacks. Biogeochemistry 1998, 42, 55–72. [Google Scholar] [CrossRef]
  3. Bronick, C.J.; Lal, R. Soil structure and management: A review. Geoderma 2005, 124, 3–22. [Google Scholar] [CrossRef]
  4. Strudley, M.; Green, T.; Ascoughii, J. Tillage effects on soil hydraulic properties in space and time: State of the science. Soil Tillage Res. 2008, 99, 4–48. [Google Scholar] [CrossRef]
  5. Horn, R.; Domżżał, H.; Słowińska-Jurkiewicz, A.; van Ouwerkerk, C. Soil compaction processes and their effects on the structure of arable soils and the environment. Soil Tillage Res. 1995, 35, 23–36. [Google Scholar] [CrossRef]
  6. Schlüter, S.; Großmann, C.; Diel, J.; Wu, G.-M.; Tischer, S.; Deubel, A.; Rücknagel, J. Long-term effects of conventional and reduced tillage on soil structure, soil ecological and soil hydraulic properties. Geoderma 2018, 332, 10–19. [Google Scholar] [CrossRef]
  7. Fernández-Raga, M.; Palencia, C.; Keesstra, S.; Jordán, A.; Fraile, R.; Angulo-Martínez, M.; Cerdà, A. Splash erosion: A review with unanswered questions. Earth-Sci. Rev. 2017, 171, 463–477. [Google Scholar] [CrossRef] [Green Version]
  8. Augeard, B.; Bresson, L.M.; Assouline, S.; Kao, C.; Vauclin, M. Dynamics of soil surface bulk density: Role of water table elevation and rainfall duration. Soil Sci. Soc. Am. J. 2008, 72, 412–423. [Google Scholar] [CrossRef]
  9. Bresson, L.M.; Moran, C.J. Role of compaction versus aggregate disruption on slumping and shrinking of repacked hardsetting seedbeds. Soil Sci. 2003, 168, 585–594. [Google Scholar] [CrossRef]
  10. Rousseva, S.; Torri, D.; Pagliai, M. Effect of rain on the macroporosity at the soil surface. Eur. J. Soil Sci. 2002, 53, 83–93. [Google Scholar] [CrossRef]
  11. Novara, A.; Armstrong, A.; Gristina, L.; Semple, K.T.; Quinton, J.N. Effects of soil compaction, rain exposure and their interaction on soil carbon dioxide emission. Earth Surf. Process. Landf. 2012, 37, 994–999. [Google Scholar] [CrossRef] [Green Version]
  12. Baartman, J.E.M.; Jetten, V.G.; Ritsema, C.J.; Vente, J. Exploring effects of rainfall intensity and duration on soil erosion at the catchment scale using openLISEM: Prado catchment, SE Spain. Hydrol. Process. 2012, 26, 1034–1049. [Google Scholar] [CrossRef]
  13. Sharma, P.P.; Gupta, S.C.; Foster, G.R. Raindrop-induced soil detachment and sediment transport from interrill areas. Soil Sci. Soc. Am. J. 1995, 59, 727–734. [Google Scholar] [CrossRef]
  14. Wilken, F.; Baur, M.; Sommer, M.; Deumlich, D.; Bens, O.; Fiener, P. Uncertainties in rainfall kinetic energy-intensity relations for soil erosion modelling. Catena 2018, 171, 234–244. [Google Scholar] [CrossRef]
  15. Van Dijk, A.I.J.; Bruijnzeel, L.; Rosewell, C. Rainfall intensity–kinetic energy relationships: A critical literature appraisal. J. Hydrol. 2002, 261, 1–23. [Google Scholar] [CrossRef]
  16. Angulo-Martínez, M.; Beguería, S.; Kyselý, J. Use of disdrometer data to evaluate the relationship of rainfall kinetic energy and intensity (KE-I). Sci. Total Environ. 2016, 568, 83–94. [Google Scholar] [CrossRef]
  17. Lobo, G.P.; Bonilla, C.A. Effect of temporal resolution on rainfall erosivity estimates in zones of precipitation caused by frontal systems. Catena 2015, 135, 202–207. [Google Scholar] [CrossRef]
  18. Hamza, M.A.; Anderson, W.K. Soil compaction in cropping systems. Soil Tillage Res. 2005, 82, 121–145. [Google Scholar] [CrossRef]
  19. Carminati, A.; Kaestner, A.; Hassanein, R.; Ippisch, O.; Vontobel, P.; Flühler, H. Infiltration through series of soil aggregates: Neutron radiography and modeling. Adv. Water Resour. 2007, 30, 1168–1178. [Google Scholar] [CrossRef]
  20. Berli, M.; Carminati, A.; Ghezzehei, T.A.; Or, D. Evolution of unsaturated hydraulic conductivity of aggregated soils due to compressive forces. Water Resour. Res. 2008, 44. [Google Scholar] [CrossRef]
  21. Gerke, H.H. Preferential flow descriptions for structured soils. J. Plant Nutr. Soil Sci. 2006, 169, 382–400. [Google Scholar] [CrossRef]
  22. Kribaa, M.; Hallaire, V.; Curmi, P.; Lahmar, R. Effect of various cultivation methods on the structure and hydraulic properties of a soil in a semi-arid climate. Soil Tillage Res. 2001, 60, 43–53. [Google Scholar] [CrossRef]
  23. Bodner, G.; Scholl, P.; Loiskandl, W.; Kaul, H.-P. Environmental and management influences on temporal variability of near saturated soil hydraulic properties. Geoderma 2013, 204–205, 120–129. [Google Scholar] [CrossRef]
  24. Zumr, D.; Dostál, T.; Devátý, J. Identification of prevailing storm runoff generation mechanisms in an intensively cultivated catchment. J. Hydrol. Hydromech. 2015, 63, 246–254. [Google Scholar] [CrossRef] [Green Version]
  25. Ankeny, M.D.; Kaspar, T.C.; Horton, R. Design for an automated tension infiltrometer. Soil Sci. Soc. Am. J. 1988, 52, 893–896. [Google Scholar] [CrossRef]
  26. Moret, D.; López, M.V.; Arrúe, J.L. TDR application for automated water level measurement from Mariotte reservoirs in tension disc infiltrometers. J. Hydrol. 2004, 297, 229–235. [Google Scholar] [CrossRef] [Green Version]
  27. Madsen, M.D.; Chandler, D.G. Automation and use of mini disk infiltrometers. Soil Sci. Soc. Am. J. 2007, 71, 1469–1472. [Google Scholar] [CrossRef]
  28. Klípa, V.; Sněhota, M.; Dohnal, M. New automatic minidisk infiltrometer: Design and testing. J. Hydrol. Hydromech. 2015, 63, 110–116. [Google Scholar] [CrossRef]
  29. Aravena, J.E.; Berli, M.; Ghezzehei, T.A.; Tyler, S.W. Effects of root-induced compaction on rhizosphere hydraulic properties—X-ray microtomography imaging and numerical simulations. Environ. Sci. Technol. 2011, 45, 425–431. [Google Scholar] [CrossRef]
  30. Logsdon, S.D.; Jordahl, J.L.; Karlen, D.L. Tillage and crop effects on ponded and tension infiltration rates. Soil Tillage Res. 1993, 28, 179–189. [Google Scholar] [CrossRef]
  31. Hu, W.; Shao, M.; Wang, Q.; Fan, J.; Horton, R. Temporal changes of soil hydraulic properties under different land uses. Geoderma 2009, 149, 355–366. [Google Scholar] [CrossRef]
  32. Messing, I.; Jarvis, N.J. Temporal variation in the hydraulic conductivity of a tilled clay soil as measured by tension infiltrometers. J. Soil Sci. 1993, 44, 11–24. [Google Scholar] [CrossRef]
  33. Farkas, C.; Gyuricza, C.; Birkás, M. Seasonal changes of hydraulic properties of a Chromic Luvisol under different soil management. Biologia 2006, 61, S344–S348. [Google Scholar] [CrossRef]
  34. Bormann, H.; Klaassen, K. Seasonal and land use dependent variability of soil hydraulic and soil hydrological properties of two Northern German soils. Geoderma 2008, 145, 295–302. [Google Scholar] [CrossRef]
  35. Alletto, L.; Coquet, Y. Temporal and spatial variability of soil bulk density and near-saturated hydraulic conductivity under two contrasted tillage management systems. Geoderma 2009, 152, 85–94. [Google Scholar] [CrossRef]
  36. Somaratne, N.M.; Smettem, K.R.J. Effect of cultivation and raindrop impact on the surface hydraulic properties of an Alfisol under wheat. Soil Tillage Res. 1993, 26, 115–125. [Google Scholar] [CrossRef]
  37. Zumr, D.; Dostál, T.; Devátý, J.; Valenta, P.; Rosendorf, P.; Eder, A.; Strauss, P. Experimental determination of the flood wave transformation and the sediment resuspension in a small regulated stream in an agricultural catchment. Hydrol. Earth Syst. Sci. 2017, 21. [Google Scholar] [CrossRef]
  38. Hanel, M.; Mrkvičková, M.; Máca, P.; Vizina, A.; Pech, P. Evaluation of simple statistical downscaling methods for monthly regional climate model simulations with respect to the estimated changes in runoff in the Czech Republic. Water Resour. Manag. 2013, 27, 5261–5279. [Google Scholar] [CrossRef]
  39. Jeřábek, J.; Zumr, D.; Dostál, T. Identifying the plough pan position on cultivated soils by measurements of electrical resistivity and penetration resistance. Soil Tillage Res. 2017, 174, 231–240. [Google Scholar] [CrossRef]
  40. Van Genuchten, M.T. A closed-form equation for predicting the hydraulic conductivity of unsaturated soils. Soil Sci. Soc. Am. J. 1980, 44, 892–898. [Google Scholar] [CrossRef]
  41. Kodešová, R.; Jirků, V.; Kodeš, V.; Mühlhanselová, M.; Nikodem, A.; Žigová, A. Soil structure and soil hydraulic properties of Haplic Luvisol used as arable land and grassland. Soil Tillage Res. 2011, 111, 154–161. [Google Scholar] [CrossRef]
  42. Philip, J.R. The theory of infiltration, 1. The infiltration equation and its solution. Soil Sci. 1957, 83, 345–357. [Google Scholar] [CrossRef]
  43. Zhang, R. Determination of soil sorptivity and hydraulic conductivity from the disk infiltrometer. Soil Sci. Soc. Am. J. 1997, 61, 1024–1030. [Google Scholar] [CrossRef]
  44. Dohnal, M.; Dusek, J.; Vogel, T. Improving hydraulic conductivity estimates from minidisk infiltrometer measurements for soils with wide pore-size distributions. Soil Sci. Soc. Am. J. 2010, 74, 804–811. [Google Scholar] [CrossRef]
  45. Nimmo, J.R. Modeling structural influences on soil water retention. Soil Sci. Soc. Am. J. 1997, 61, 712–719. [Google Scholar] [CrossRef]
  46. Ahuja, L.R.; Fiedler, F.; Dunn, G.H.; Benjamin, J.G.; Garrison, A. Changes in soil water retention curves due to tillage and natural reconsolidation. Soil Sci. Soc. Am. J. 1998, 62, 1228–1233. [Google Scholar] [CrossRef]
  47. Ghezzehei, T.A.; Kneafsey, T.J.; Su, G.W. Correspondence of the Gardner and van Genuchten-Mualem relative permeability function parameters. Water Resour. Res. 2007, 43. [Google Scholar] [CrossRef] [Green Version]
  48. Vogel, T.; Cislerova, M.; Hopmans, J.W. Porous media with linearly variable hydraulic properties. Water Resour. Res. 1991, 27, 2735–2741. [Google Scholar] [CrossRef]
  49. Ionita, M.; Tallaksen, L.M.; Kingston, D.G.; Stagge, J.H.; Laaha, G.; Van Lanen, H.A.J.; Scholz, P.; Chelcea, S.M.; Haslinger, K. The European 2015 drought from a climatological perspective. Hydrol. Earth Syst. Sci. 2017, 21, 1397–1419. [Google Scholar] [CrossRef] [Green Version]
  50. Bagarello, V.; Iovino, M.; Tusa, G. Factors affecting measurement of the near-saturated soil hydraulic conductivity. Soil Sci. Soc. Am. J. 2000, 64, 1203–1210. [Google Scholar] [CrossRef]
  51. Das Gupta, S.; Mohanty, B.P.; Köhne, J.M. Soil hydraulic conductivities and their spatial and temporal variations in a vertisol. Soil Sci. Soc. Am. J. 2006, 70, 1872–1881. [Google Scholar] [CrossRef]
  52. Mohanty, B.P.; Ankeny, M.D.; Horton, R.; Kanwar, R.S. Spatial analysis of hydraulic conductivity measured using disc infiltrometers. Water Resour. Res. 1994, 30, 2489–2498. [Google Scholar] [CrossRef]
  53. Lin, H.S.; McInnes, K.J.; Wilding, L.P.; Hallmark, C.T. Low tension water flow in structured soils. Can. J. Soil Sci. 1997, 77, 649–654. [Google Scholar] [CrossRef] [Green Version]
  54. Moret, D.; Arrúe, J.L. Dynamics of soil hydraulic properties during fallow as affected by tillage. Soil Tillage Res. 2007, 96, 103–113. [Google Scholar] [CrossRef] [Green Version]
  55. Chandrasekhar, P.; Kreiselmeier, J.; Schwen, A.; Weninger, T.; Julich, S.; Feger, K.-H.; Schwärzel, K.; Chandrasekhar, P.; Kreiselmeier, J.; Schwen, A.; et al. Why we should include soil structural dynamics of agricultural soils in hydrological models. Water 2018, 10, 1862. [Google Scholar] [CrossRef]
  56. Logsdon, S.D.; Jaynes, D.B. Methodology for determining hydraulic conductivity with tension infiltrometers. Soil Sci. Soc. Am. J. 1993, 57, 1426–1431. [Google Scholar] [CrossRef]
  57. Schwen, A.; Bodner, G.; Scholl, P.; Buchan, G.D.; Loiskandl, W. Temporal dynamics of soil hydraulic properties and the water-conducting porosity under different tillage. Soil Tillage Res. 2011, 113, 89–98. [Google Scholar] [CrossRef]
  58. Zhang, Z.; Lin, L.; Wang, Y.; Peng, X. Temporal change in soil macropores measured using tension infiltrometer under different land uses and slope positions in subtropical China. J. Soils Sediments 2016, 16, 854–863. [Google Scholar] [CrossRef]
  59. Sandin, M.; Koestel, J.; Jarvis, N.; Larsbo, M. Post-tillage evolution of structural pore space and saturated and near-saturated hydraulic conductivity in a clay loam soil. Soil Tillage Res. 2017, 165, 161–168. [Google Scholar] [CrossRef]
  60. Armenise, E.; Simmons, R.W.; Ahn, S.; Garbout, A.; Doerr, S.H.; Mooney, S.J.; Sturrock, C.J.; Ritz, K. Soil seal development under simulated rainfall: Structural, physical and hydrological dynamics. J. Hydrol. 2018, 556, 211–219. [Google Scholar] [CrossRef] [Green Version]
  61. Josa, R.; Gorchs, G.; Ginovart, M.; Solé-Benet, A. Influence of tillage on soil macropore size, shape of top layer and crop development in a sub-humid environment. Biologia 2013, 68, 1099–1103. [Google Scholar] [CrossRef] [Green Version]
  62. Jirků, V.; Kodešová, R.; Nikodem, A.; Mühlhanselová, M.; Žigová, A. Temporal variability of structure and hydraulic properties of topsoil of three soil types. Geoderma 2013, 204–205, 43–58. [Google Scholar] [CrossRef]
  63. Katuwal, S.; Norgaard, T.; Moldrup, P.; Lamandé, M.; Wildenschild, D.; de Jonge, L.W. Linking air and water transport in intact soils to macropore characteristics inferred from X-ray computed tomography. Geoderma 2015, 237–238, 9–20. [Google Scholar] [CrossRef]
  64. Fohrer, N.; Berkenhagen, J.; Hecker, J.-M.; Rudolph, A. Changing soil and surface conditions during rainfall. Catena 1999, 37, 355–375. [Google Scholar] [CrossRef]
  65. Rabot, E.; Wiesmeier, M.; Schlüter, S.; Vogel, H.-J. Soil structure as an indicator of soil functions: A review. Geoderma 2018, 314, 122–137. [Google Scholar] [CrossRef]
  66. Sandin, M.; Jarvis, N.; Larsbo, M. Consolidation and surface sealing of nine harrowed Swedish soils. Soil Tillage Res. 2018, 181, 82–92. [Google Scholar] [CrossRef]
  67. Angulo-Jaramillo, R.; Thony, J.L.; Vachaud, G.; Moreno, F.; Fernandez-Boy, E.; Cayuela, J.A.; Clothier, B.E. Seasonal variation of hydraulic properties of soils measured using a tension disk infiltrometer. Soil Sci. Soc. Am. J. 1997, 61, 27–32. [Google Scholar] [CrossRef]
  68. Linh, T.B.; Ghyselinck, T.; Khanh, T.H.; Van Dung, T.; Guong, V.T.; Van Khoa, L.; Cornelis, W. Temporal variation of hydro-physical properties of paddy clay soil under different rice-based cropping systems. L. Degrad. Dev. 2017, 28, 1752–1762. [Google Scholar] [CrossRef]
  69. Leij, F.J.; Ghezzehei, T.A.; Or, D. Modeling the dynamics of the soil pore-size distribution. Soil Tillage Res. 2002, 64, 61–78. [Google Scholar] [CrossRef]
  70. Vaezi, A.R.; Ahmadi, M.; Cerdà, A. Contribution of raindrop impact to the change of soil physical properties and water erosion under semi-arid rainfalls. Sci. Total Environ. 2017, 583, 382–392. [Google Scholar] [CrossRef]
  71. Angulo-Martínez, M.; Beguería, S.; Navas, A.; Machín, J. Splash erosion under natural rainfall on three soil types in NE Spain. Geomorphology 2012, 175–176, 38–44. [Google Scholar] [CrossRef]
  72. Salles, C.; Poesen, J. Rain properties controlling soil splash detachment. Hydrol. Process. 2000, 14, 271–282. [Google Scholar] [CrossRef]
  73. Assouline, S.; Mualem, Y. Modeling the dynamics of seal formation and its effect on infiltration as related to soil and rainfall characteristics. Water Resour. Res. 1997, 33, 1527–1536. [Google Scholar] [CrossRef] [Green Version]
  74. Torri, D.; Regüés, D.; Pellegrini, S.; Bazzoffi, P. Within-storm soil surface dynamics and erosive effects of rainstorms. Catena 1999, 38, 131–150. [Google Scholar] [CrossRef]
  75. Bryk, M.; Kołodziej, B.; Słowińska-Jurkiewicz, A.; Jaroszuk-Sierocińska, M. Evaluation of soil structure and physical properties influenced by weather conditions during autumn-winter-spring season. Soil Tillage Res. 2017, 170, 66–76. [Google Scholar] [CrossRef]
Figure 1. Geographic position and a map of the Nučice catchment.
Water 11 00740 g001
Figure 2. Scheme of one triplet of the MultiDisk infiltrometer modules held by an aluminum frame viewed, (a) from the top and (b) from the side (View A). Note that one apparatus-MultiDisk-consists of two identical triplets.
Water 11 00740 g002
Figure 3. The MultiDisk infiltrometer performing an infiltration in the Nučice catchment.
Water 11 00740 g003
Figure 4. Scaled retention curves of fitted experiment-specific retention curves from individual infiltration campaigns.
Water 11 00740 g004
Figure 5. Saturated water content and bulk density as measured on 217 undisturbed topsoil samples during two growing seasons. The gray area represents the 95% confidence interval of the fitted line; r stands for correlation coefficient.
Water 11 00740 g005
Figure 6. Meteorological and pedological conditions during experiments. Air temperature was measured at a height of 200 cm.
Water 11 00740 g006
Figure 7. Seasonal variation of unsaturated hydraulic conductivity at the pressure head of −3 cm (blue boxes before retention curve scaling, green boxes after scaling). The bottom and top of the box are the first and third quartiles and the band inside the box represents the weighted average of Kh0 weighted by inverse values of the RMSE. Ends of whiskers represent minimal and maximal values of Kh0. Dashed lines stand for bulk density, saturated water content and fraction of empty pores at the pressure head of −3 cm.
Water 11 00740 g007
Figure 8. Seasonal variability of the van Genuchten’s parameter α related to cumulative rainfall kinetic energy. Seedbed cultivation (dashed line) is assumed to interrupt the effect of the previous rainfall.
Water 11 00740 g008
Figure 9. Seasonal variability of the bulk density (ρd) related to cumulative rainfall kinetic energy. Seedbed cultivation (dashed line) is assumed to interrupt the effect of the previous rainfall.
Water 11 00740 g009
Figure 10. Seasonal variability of the scaled unsaturated hydraulic conductivity related to cumulative rainfall kinetic energy. Seedbed cultivation (dashed line) is assumed to interrupt the effect of the previous rainfall.
Water 11 00740 g010
Figure 11. Correlation between cumulative rainfall kinetic energy and unsaturated hydraulic conductivity Kh0 (A), van Genuchten’s parameter α (B), bulk density ρb (C) and saturated water content θs (D). The correlation coefficient r is calculated based on all data points in each graph. The color, which distinguishes data from different years, only serves for visual interpretation of the data.
Water 11 00740 g011
Table 1. General overview of the agricultural activities and infiltration experiments (lines highlighted in grey), seedbed cultivation (s.c.) is marked in the Notes column.
DateCropAgricultural ActivityNotes
October 2012 stubble breakingdepth 10–12 cm (s.c.)
6 April 2013 fertilizationnitrogen fertilizer
22 April 2013 Tension infiltration experiments—IE1
27 April 2013naked oatsowingchisel plowing, depth 14 cm (s.c.)
17 May 2013naked oatcrop-sprayingherbicide
1 July 2013naked oatcrop-sprayingfungicide and herbicide
25 July 2013naked oatTension infiltration experiments—IE2
17 August 2013naked oatharvest
19 August 2013 stubble breakingdepth 10–12 cm (s.c.)
10 September 2013 crop-sprayingherbicide and insecticide
25 September 2013winter wheatsowing, fertilizationchisel plowing—depth 14 cm, combined fertilizer
4 October 2013winter wheatTension infiltration experiments—IE3
10 October 2013winter wheatcrop-sprayingherbicide and insecticide
20 February 2014winter wheatfertilizationnitrogen fertilizer
3 March 2014winter wheatfertilizationfertilizer containing sulfur
13 March 2014winter wheatTension infiltration experiments—IE4
17 March 2014winter wheatfertilizationnitrogen fertilizer
9 April 2014winter wheatfertilizationmorphoregulators, fertilizers containing B, Cu, Mn, Mg
10 April 2014winter wheatTension infiltration experiments—IE5
22 April 2014winter wheatcrop-spraying, fertilizationherbicide, fungicide, wetting agent, nitrogen fertilizer
15 May 2014winter wheatTension infiltration experiments—IE6
9 June 2014winter wheatcrop-sprayingfungicide, insecticide, wetting agent
19 June 2014winter wheatTension infiltration experiments—IE7
17 July 2014winter wheatcrop-sprayingherbicide
6 August 2014winter wheatTension infiltration experiments—IE8
9 August 2014winter wheatharvest
10 August 2014 stubble breakingdepth 10–12 cm (s.c.)
24 September 2014 fertilization and plowingmanure, depth of plowing 22 cm
October 1 2014 Tension infiltration experiments—IE9
3 November 2014 plowingdeepening to 25–28 cm (s.c.)
22 March 2015white mustardsowing, fertilizationchisel plowing—depth 14 cm, fertilizer (s.c.)
26 March 2015white mustardTension infiltration experiments—IE10
8 April 2015white mustardfertilizationfertilizer containing sulfur
25 April 2015white mustardcrop-spraying, fertilizationherbicide, nitrogen fertilizer
12 May 2015white mustardcrop-spaying, fertilizationfungicide, morphoregulator, fertilizer containing boron
12 May 2015white mustardTension infiltration experiments—IE11
6 June 2015white mustardcrop-spaying, fertilizationfungicide, fertilizer containing boron and copper
2 July 2015white mustardTension infiltration experiments—IE12
30 July 2015white mustardTension infiltration experiments—IE13
3 August 2015white mustardharvest
Table 2. t-test of the linear regressions assessing the relationship between unsaturated hydraulic conductivity at the −3 cm pressure head (Kh0) and bulk density (ρb), initial water content (θinit), saturated water content (θs) and water content under the pressure head of −3 cm (θh0). N stands for number of data points, a for the slope and b for the interception.
ModelTime PeriodNSlope (a)Slope p-Value
Kh0 = aρb + bAll130.00210.69
201330.01400.44
201460.00080.81
201540.00090.51
Kh0 = aθinit + bAll13−0.00160.65
20133−0.00580.56
20146−0.00010.97
20154−0.00680.07
Kh0 = aθs + bAll13−0.00180.85
20133−0.0250.50
20146−0.00510.38
20154−0.0500.23
Kh0 = aθh0 + bAll130.0070.32
201330.0040.86
201460.00270.69
201540.0120.03
Table 3. Results of statistical hypothesis testing using Student’s t-test of the non-zero slope of the regression line between cumulative kinetic energy KE and soil physical properties: unsaturated hydraulic conductivity Kh0, van Genuchten’s α, bulk density ρb and saturated water content θs. 13 data points were used for every test. The a stands for the slope and b for the interception.
ModelSlope (a)Slope p-Value
Kh0 = aKE + b−1.602 × 10−70.31
α = akE + b1.135 × 10−60.46
ρb = aKE + b1.302 × 10−50.13
θs = aKE + b−7.329 × 10−60.11

