Water Footprint of Meat Analogs: Selected Indicators According to Life Cycle Assessment


1
Center for Nutrition, Healthy Lifestyles, and Disease Prevention, School of Public Health, Loma Linda University, Loma Linda, CA 92350, USA
2
Water Sciences & Insights, Encinitas, CA 92023, USA
*
Author to whom correspondence should be addressed.
†
First two authors contributed equally and are listed in arbitrary order.
Water 2019, 11(4), 728; https://doi.org/10.3390/w11040728
Submission received: 13 March 2019
/
Revised: 3 April 2019
/
Accepted: 4 April 2019
/
Published: 9 April 2019
(This article belongs to the Section Water, Agriculture and Aquaculture)
Abstract
:Animal-based products reportedly have substantial water footprints. One alternative to meat products is meat analogs, which are processed plant-based foods mimicking real meat products. As data for the water footprints of meat analogs are limited, the present study assesses their water consumption and their potential for contributing to eutrophication and ecotoxicity in fresh and marine receiving waters. Life cycle assessments, which encompassed the generation of ingredients to the packaging of products, were performed for 39 meat analogs. Estimates for consumptive water use, ecotoxicity, and eutrophication are reported per ton of product and per kilogram of protein. On average, 3800 m3 of water were consumed per ton of product, whereas 0.56 kg P equivalents. and 12 kg 1,4-DCB (1,4-dichlorobenzene)) equivalents. were potentially released to terrestrial freshwaters and 2.2 kg N equivalents. and 7 kg 1,4-DCB equivalents. to marine waters. The predominant driver for water consumption and marine ecotoxicity was processing the meat analogs, whereas producing the raw ingredients was the main driver for freshwater toxicity and eutrophication. For reducing the use of and potential impacts on water, meat analogs may represent a viable alternative to processed meat products.
1. Introduction
The conceptual basis of a footprint is that everything produced, consumed or utilized by humans requires inputs from the natural world (usually as resources) that can be quantified. As such, footprints reflect the embedded resources in products that, when traded or sold, constitute a virtual exchange of them. Virtual or imbedded resources can be imported, exported or utilized locally. Water footprints specifically quantify the volume that is consumed (i.e., no longer available for immediate reuse) to generate a product or service [1,2]. A product’s water footprint includes both the natural and anthropogenic processes that are required to create or transform it into a usable commodity, as well as to deal with its associated pollutants. Although often unrecognized, water quality often restricts the quantity available for specific uses. Life Cycle Assessment (LCA) is a method for evaluating water footprints that is designed to assess water use and environmental impacts via specific pathways, production phases, and relevant indicators such as eutrophication, acidification, and toxicity [3].
The relationship between water resources and dietary habits (especially the consumption of meat) has been evaluated from a number of perspectives during the last two decades. From the standpoint of nutritional water productivity, which describes the mass or calories of food produced per unit volume of water, changes in food habits may be required at some point to feed a growing world population [4]. As such, people consuming a higher percentage of plant-based foods and limiting food waste could reduce the water resources necessary to grow the required crops [5,6]. Mekonnen and Hoekstra [7] estimated the substantial global water footprint of animal-based products and concluded that governments promoting a shift away from meat-rich diets will likely become a component of environmental policies.
Food comprises about 90% of a person’s consumptive water use, and people from industrialized nations typically consume protein (primarily as animal-based foods) at twice the recommended levels, thus increasing their personal water footprints and susceptibility to chronic health problems [8]. In order for alternative food choices to be a viable means of conserving water or other limited resources, the options available to people in making the shifts must be acceptable on a personal, nutritional, financial, and environmental basis. A frequently suggested protein alternative for meats is so-called meat analogs, which are plant-based foods that typically contain soybeans, grains, nuts, seeds, and legumes processed in a manner mimicking real meat products such as sausages and hamburgers. A number of food companies have specialized in meat substitutes, and it has become increasingly difficult to discern them from real meat [9,10]. Surveys have suggested that a consumer’s repeated exposure to the unfamiliar meat substitutes generally leads to an increased acceptance unless his or her initial impressions are negative [11]. The market for meat analog products has increased to the point that more than one-third of Americans have reportedly purchased meat analogs [12,13]. Besides their escalating popularity among vegetarians, meat analogs are also popular with non-vegetarians who choose to reduce their meat intake for health-related reasons and/or to adopt a more environmentally sustainable diet [14].
The study of meat analogs is still in its infancy. Based on their nutritional composition, many meat analogs qualify as complete proteins (containing all essential amino acids) and offer the additional nutritional benefits of dietary fiber, antioxidants, and phytochemicals, while reducing the intake of cholesterol and saturated fats [15,16,17]. Recent investigations focusing on this topic have suggested that meat analogs may serve as sustainable alternatives to processed meat products [17,18,19]. Nonetheless, the potential for meat analogs to affect water usage or aquatic ecosystems has been less well studied. Few researchers have addressed the potential impacts of meat analogs on water quantity and quality within their production life cycles [20]. Although meat analogs are plant-based products, they are highly processed foods that require water for on-farm ingredients and processing operations, both of which can impact waters.
This paper focuses on the evaluation of meat analog products via an LCA methodology that calculates the volume of water consumed in their production and assesses their potential impacts to fresh and marine receiving waters via eutrophication and ecotoxicity. In doing so, the contribution of distinct production phases (i.e., generating/transporting food ingredients, packaging products, performing in-factory activities) to water consumption and aquatic ecosystem degradation are identified.
2. Materials and Methods
There are two widely employed methods for calculating the water footprint of products [3]. One is the LCA methodology described in this study and the other is the water footprint assessment (WFA), which is often used for appropriating freshwater resources. WFA is designed to quantify direct and indirect water use, involving both consumers and producers, along supply chains for the primary purpose of water management. As previously described, LCA is a quantitative method for assessing the impact of processes, such as food production and manufacturing, on the environment or specific resources [21,22,23]. The LCA methodology was selected for this study because its primary focus is product sustainability [3]. The primary difference between WFA and LCA is that the former focuses on the volume of water and the latter on the impacts linked to water use. Indicators of water usage and impacts derived from the two methods are potentially compatible, but are not directly comparable.
As described by Boulay et al. [2], WFA employs an approach to water resources that includes setting goals and scope, footprint accounting, sustainability assessment, and response formulation. By contrast, LCA is more focused on quantitative indicators of water use that consider specific pathways and indices relevant to human health, ecosystem impacts and resource depletion. WFA outputs rely largely on water use in the inventory phase and are generally easier to compare among different products or processes (as a volume of water) than are LCA outputs, which are more dependent on indices in the impact phase and are often expressed in dissimilar units. The International Organization for Standardization (ISO) has introduced protocols for conducting and reporting LCAs that address issues of consistency, reproducibility and comparability.
Life cycle analyses of products for the specified types of water footprints considered in this study were organized according to the ISO 14046 norm [24]. This standard takes the life cycle approach as in ISO 14044 [25], but focuses solely on water. According to the general norm, a complete LCA is composed of four steps:
- (1)
- Definition of the goal and scope of the LCA
- (2)
- Life cycle inventory (LCI) analysis phase
- (3)
- Life cycle impact assessment (LCIA) phase
- (4)
- Interpretation phase
2.1. Goal and Scope Definition
The objective of this study was to perform a non-comprehensive water footprint profile of meat analog production, considering the following indicators: water consumption, freshwater ecotoxicity, marine ecotoxicity, freshwater eutrophication, and marine eutrophication. For each of the 39 meat analogs, the environmental impacts were assessed with respect to the functional unit of 1000 kg (one metric ton) of product in preparation for shipment to market. In addition, water footprints were assessed for the additional functional unit of one kilogram of protein contained within the meat analog products. The protein value of the meat analogs was based on the mass of the various ingredients that were stipulated in recipes used by the food processing facility. The conversion of mass to protein for ingredients, which were summed to estimate the protein content of products, was based on data presented in the Nutrition Data System for Research 2013. This database stores nutrient profile information on more than 20,000 foods and is updated annually [21]. Mean and standard deviation (SD) values for products were calculated with respect to the five designated impacts and in accordance with the two functional units, thus providing information regarding the variability among products.
Data were collected between the years of 2013 and 2015 from a Midwest American food processing facility specializing in meat analogs. This timeframe and location represented the temporal and geographic aspects of interest for the study. System boundaries included the phases of (i) growing raw ingredients, (ii) transporting raw ingredients from the farms to the processing facility, (iii) manufacturing the packaging material and, (iv) all in-factory activities (i.e., storing ingredients, processing ingredients into the meat analogs, packaging and storing finished products). Impacts associated with the various phases of generating meat analogs (e.g., ingredient production and transportation, processing ingredients into the meat analogs, packaging of final products) were also calculated independently. The proportional contribution of each LCA phase to the total water-related impacts were also estimated.
2.2. Life Cycle Inventory Analysis
For 39 consumed products, both the on-farm and processing components of production were considered. The facility’s personnel provided inventories containing information on inputs required by its recipes in producing the commercial products. These inventories contained information regarding the mass of each ingredient in the various recipes, the distance from farms to the factory, and the mode of transporting ingredients. Energy and water consumed in the factory was provided by the facility, as was the type and quantity of packaging used for each product. The collected data were used as inputs for the LCA. Table 1 lists the inputs used to calculate water consumption and environmental impacts for four LCA phases. Additionally, the facility provided output data were for the mass of each final product generated and for relevant chemical analyses of wastewater.
The data inventories for most inputs were obtained from the US Life Cycle Inventory and its updated version, US-EI 2.2. This new version fills the data gaps in the original version using the Ecoinvent database as a proxy that has been adapted for the US energy system. Data for some inputs were obtained from the manufacturers of food ingredients (e.g., isolated soy protein) or were modeled according to SimaPro 8.5 [26].
Assumptions and Allocations
Energy consumption estimates were made on a factory-wide basis and then proportioned according the mass of individual products generated. As the facility frequently processed several products simultaneously, each product was allocated its share of the total energy based entirely on mass. For a majority of ingredients, the modes of transportation (and associated fuel requirements) from farm to processing facility were known. However, data were unavailable for some of the minor ingredients, which were assumed to be transported via a combination of sea (10%), rail (40%), and truck (50%).
2.3. Life Cycle Impact Assessment
The software program SimaPro 8.5 [26] was selected to quantify potential environmental impacts posed throughout the life cycle of meat analog products. Calculations were performed for the water that is actually and virtually consumed during the production of meat analogs, as well as the potential for eutrophication and ecotoxicity to impact fresh and marine receiving waters.
Potential impacts to aquatic environments were assessed using algorithms contained in the ReCiPe 2016 (version 1.1) method [27]. This method addresses uncertainty and assumptions in one of three ways. The one selected for this study was a so-called hierarchical approach, which is based on a scientific consensus regarding the timeframe (i.e., 100 years) and plausibility of various impact mechanisms. ReCiPe outputs for the impacts are provided in the general form of a mass of environmental stressor per unit mass or volume of a resource used or a pollutant released. A total of five impact categories were considered in this study. The impacts included water consumption, as well as the potential for eutrophication and ecotoxicity in both marine and fresh waters.
For assessing water consumption footprints, the US-EI 2.2. databases utilized in this study accounted for the blue water (i.e., ground and/or surface water sources), but not the green water (precipitation), required to grow the crops that comprise the ingredients of meat analogs. Although this omission almost certainly underestimates the total water consumption calculated for the meat analog products, it is consistent with other LCA studies relying on this database or similar ones that consider only blue water irrigation of crops. The ReCiPe method addressed water consumption by quantifying the volume of ground or surface water consumed within or extracted from the watershed. This included an assumption that none of the water could be returned to the original watershed after its use. The resulting reduction in freshwater availability was then entered into scenarios affecting irrigation supply, food production, river discharges, etc. A water stress index (WSI) of 0.675 was used where required for the method’s calculations.
ReCiPe’s predictions for freshwater eutrophication were based on the incremental mass of pollutants added to water bodies, taking into account (i) pollutant introduction to aquatic ecosystems, (ii) pollutant residence time in the water bodies, and (iii) pollutant removal resulting from mechanisms (i.e., advection, adsorption) that were included in calculating an average potential disappeared fraction (PDF). Seawater eutrophication was calculated in a manner similar to that of freshwater eutrophication, with the exception that latter utilized phosphorus and phosphate ions as indicators and the former utilized nitrogen, ammonia and nitrogen dioxide. Eutrophication was expressed as kilograms of phosphorus (kg P) equivalents and nitrogen (kg N) equivalents for fresh and marine waters, respectively.
ReCiPe evaluated ecotoxicity by factoring in the chemical fate of pollutants, the species exposure, the potentially disappeared fraction of species, and the damage to ecosystems. It should be noted that the aquatic exposure portion of the ecotoxicity assessment may have included as few as one tested species for a limited suite of aquatic pollutants. Ecotoxicity was expressed as kilograms of 1,4-dichlorobenzene (kg 1,4-DCB (1,4-dichlorobenzene)) equivalents for a 100-year time horizon. As a chlorinated aromatic hydrocarbon, 1,4-DCB was used as a reference substance in the calculations by dividing the potential impact of a pollutant by that of 1,4-DCB released to freshwater or seawater. A linear function for concentration-response was assumed using acute response factors as a starting point.
3. Results
The interpretational section corresponds to the fourth and final step of the ISO protocol for LCAs. Hereby, we report the observed results and their interpretation. Table 2 lists the means and standard deviations of the five water-related impacts for meat analog products as assessed by the ReCiPe method. On average, producing a metric ton of the meat analogs consumed almost 3800 m3 of water (i.e., 3.8 m3 or 3800 L per kg of product), which equates to just over 18 m3 of water per kilogram of protein in the products. This estimate is based on facility data for the products’ processing, but regional data for their ingredients, transportation, and packaging material. Hence, it represents a combination of the two data sources and is neither a facility-specific nor an industry-specific value. Standard deviations ranged from 30% to 40% of the projected water volumes consumed, suggesting a moderate amount of variability among the water requirements for life cycles of the various products. Based on a review of the three products with the highest water consumption indices, it appears that the energy-related factors of transportation and electricity use accounted for most of their higher water consumption.
Producing one metric ton of meat analogs could release 0.56 kg P equivalents and 2.2 kg N equivalents into fresh and marine waters, respectively. Standard deviations were in the range of 33%–55% of the mean values, indicating a relatively high variability among the individual products in their actually or potentially releasing these nutrients to receiving waters. Nitrogen (N) displayed greater variation than did phosphorus (P), and the variability was slightly greater when calculated on the basis of protein content than of total mass. For both freshwater and marine eutrophication, the three products with the highest potential impacts also had among the greatest contributions from the fuel-related factor of transportation and the ingredient-related factor of vegetable oil.
Pollutants attributable to producing one metric ton of meat analogs could release the equivalent of almost 12 kg and 7 kg of 1,4-DCB into fresh and marine waters, respectively. Similarly, producing one kilogram of protein from meat analogs could add pollutants (as 1,4-DCB equivalents) of 0.03 kg and 0.003 kg to the freshwater and marine environments, respectively. This 10-fold difference in pollution appears to be related primarily to differences in impacts associated with the on-farm production of ingredients comprising the products. Although the difference between freshwater and marine toxicity is less when based on the product mass, the ingredients appear to be largely responsible for the increased toxicity in freshwater ecosystems because pollutants resulting from transportation, processing, and packaging activities are actually more toxic to marine organisms.
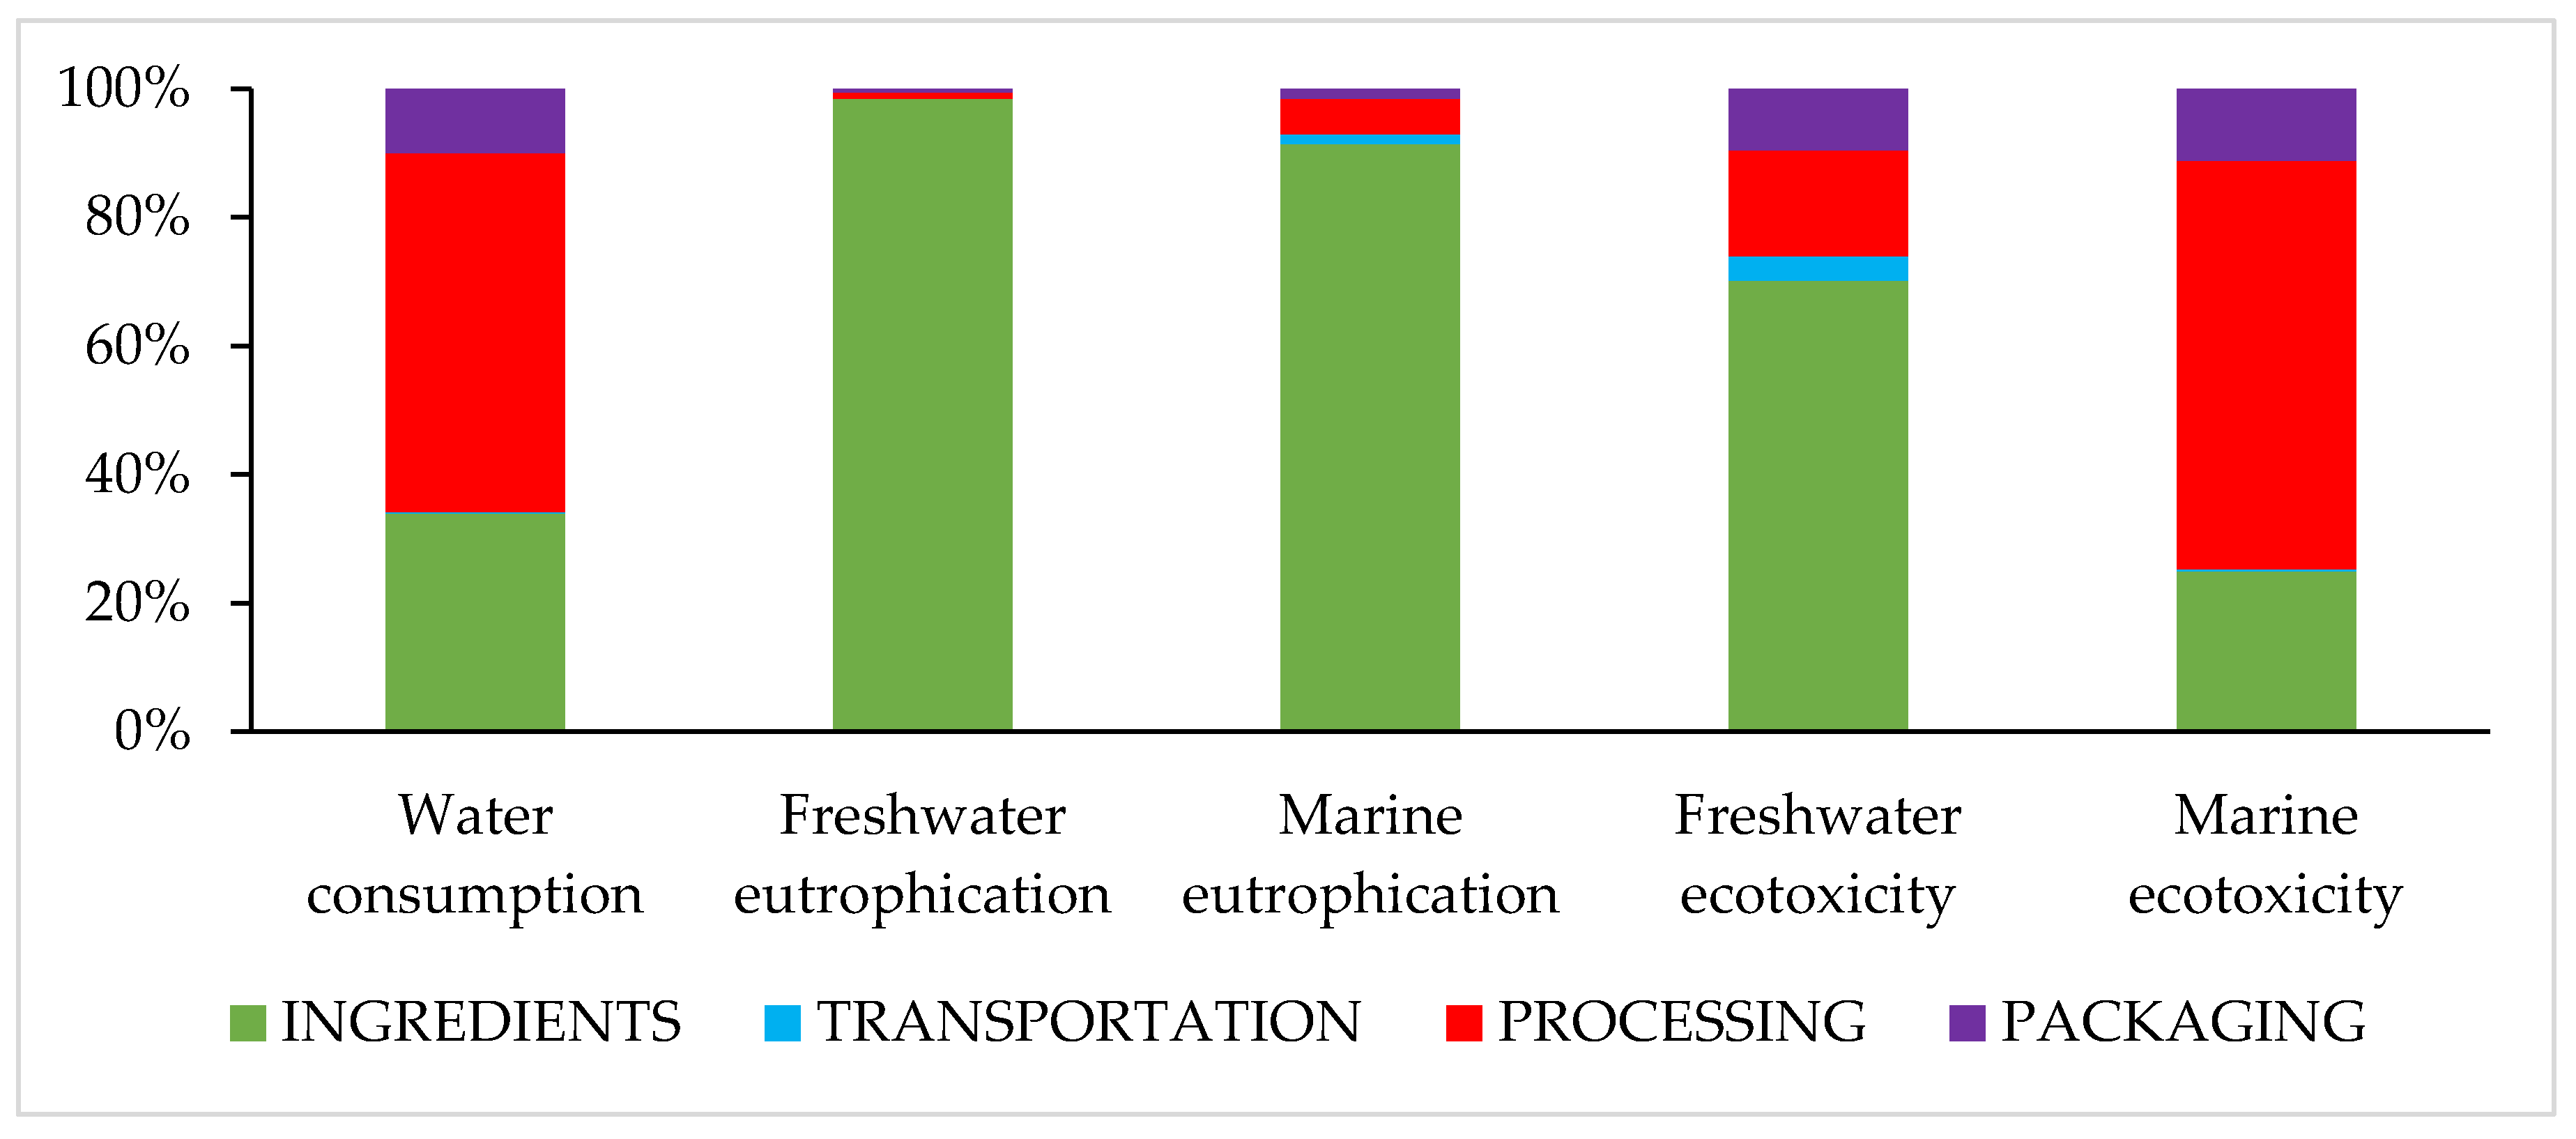
Figure 1 indicates that the main driver for water consumption and marine ecotoxicity is the processing of meat analogs. By contrast, the production of meat analog ingredients is the predominant driver for freshwater ecotoxicity and for eutrophication in both marine and fresh waters. In fact, the production of ingredients accounted for more than 90% of the eutrophication impact and about 70% of the freshwater toxicity. For water consumption and marine ecotoxicity, processing of raw ingredients into final products comprised 55% and 65% of the impacts, respectively. The production of ingredients comprised the bulk of the remaining impact for water consumption and marine ecotoxicity (i.e., about 35% and 25%, respectively).
Overall, transportation of the ingredients appeared to be the least important single driver of the water-related impacts assessed, having never amounted to more than a few percent of the total impacts. Similarly, packaging was a very minor driver for eutrophication and accounted for only about 10% of the impacts associated with both water consumption and ecotoxicity. As noted in Table 1, the impacts for transportation and packaging were based on diesel fuel consumption and packaging materials, respectively.
To sum up, the present LCA investigation provides some of the few data available for water footprints derived from the production of meat analogs and indicates that the predominant driver for water consumption and marine ecotoxicity was the processing of meat analogs, whereas the production of raw ingredients was the main driver for freshwater toxicity and eutrophication (both marine and freshwater). Packaging was a minor driver, and transporting ingredients appeared to be the least important driver. This is often the case for transportation unless the fuels used to transport foods possess a substantial water footprint (e.g., biodiesel). The presence of total nitrogen and phosphorus in agricultural runoff/infiltration and the facility’s wastewater are responsible for the observed eutrophication indicators, whereas an acidic pH and unidentified organic compounds associated with an elevated biochemical oxygen demand (BOD) in the process wastewater could have contributed to the ecotoxicity.
4. Discussion
Table 3 presents a comparison of the five impact indicators that were considered for meat analogs investigated in the present study and those produced by another company, as well as for unprocessed and processed animal products. Not all indicators are available for every food category. Many studies have indicated that meat and other animal products are less water efficient than plant-based products in providing nutrition on both a gravimetric (mass) and caloric (energy) basis [5,28,29,30,31]. Nevertheless, generalizations regarding the LCA-derived impacts of meats should be cautiously interpreted because end products can vary from raw cuts to highly processed foodstuffs, which have very different water-related impacts depending on how and to what extent the meat is processed.
A comparison of similar, but not identical, plant-based meat analogs suggests an approximate three-fold difference in average water requirement for products described in this study compared to those reported by another company. While this discrepancy may reflect differences in water efficiencies associated with producing and/or processing the ingredients, it should be noted that water usage and water consumption are not identical metrics. By contrast, the average freshwater eutrophication indices for the two companies’ meat analogs were very similar, perhaps reflecting commonalities among nitrogen loadings from on-farm activities and process wastewaters. For the other company’s meat analogs, ingredients represented 94% of environmental impacts (including freshwater eutrophication), and water usage was attributable to both the ingredients (62%) and processing (34%). Packaging amounted to less than 5% of the water usage or impacts. Compared to meat analogs investigated in this study, the only notable difference was that processing (56%) was a larger contributor to the other company’s water usage than were the ingredients (34%).
With regard to water consumption, the impact of this study’s meat analogs is similar than that of unprocessed animal meats (e.g., pork [32,33] and chicken [32,34]), based on total food mass. The range of water consumption estimates for unprocessed beef is vast and depends on whether animals are reared in extensive or intensive systems [28,29,32]. The protein content of meat analogs and unprocessed meat are very similar, comprising about 21% of their total mass. Thus, when comparing water consumption indices for meats and meat analogs on the basis of protein, the results are similar to those based on mass. Water use associated with the other company’s meat analogs is less than a quarter of that for processed beef and chicken products and less than half of that for processed pork [20]. Minimally processed animal-sourced foods such as dairy products (e.g., yogurt) have substantially lower water consumption indices than do meat analogs [30], reflecting the sizeable water demand of processed foods derived from either plants or animals.
Eutrophication indicators for both marine and freshwater systems were similar for unprocessed animal meats and for the meat analogs presented on Table 3, including those investigated in this study and those reported by the other company. However, the freshwater eutrophication index for yogurt is higher than that for meat analogs, and processed meat products have a eutrophication potential that is 10- to 35-fold greater than that for analogs. Ecotoxicity indicators for meat analogs were 10-fold lower than those for unprocessed chicken meat and yogurt, but about the same as those for unprocessed pork (no similar data were found for beef). Whereas ecotoxicity data were not presented for processed meats, processing often generates water pollutants such as suspended solids, chlorine, and volatile organics in addition to those contributed by the on-farm practices (e.g., N, P, and pathogens). In general, animal-sourced products (both processed and unprocessed) have a greater impact on freshwater ecosystems in terms of toxicity and eutrophication than do meat analogs, whether compared on the basis of total mass or protein.
Comparing our results with findings from other studies is challenging because each study is performed with its own goals and employs different methodologies. Even when different methods report impact indicators in the same units, the assumptions used to arrive at those values may be quite different. Comparisons require not only the mathematical conversion of units, but also assumptions about whether conversion factors are justified given the variables inherent in studies (e.g., time frames, environmental conditions, sampling/measurement techniques). Moreover, different software versions (e.g., 2008 and 2016 releases of ReCiPe) and similar, but nonetheless distinct, algorithms utilized by various programs can be an issue. Interpretive challenges associated with comparing results from different LCA methodologies have been identified in the literature, reportedly complicating their use as a universal metric for quantifying product impacts [31,36].
Additional research into the water footprints of meat analogs will focus on improving estimates for the ingredients phase of production by collecting water quantity and quality data from the actual locations where the crops are grown and harvested, rather than estimating those parameters from generic databases. Also, investigating the utility of treating process wastewaters on-site to reduce the potential for ecotoxicity and eutrophication is a high priority, as is identifying trends in the retail and consumer sectors related to the water consumption of meat analogs (e.g., food storage, preparation, and waste). The resulting data could then be compared to information on well-documented meat products, providing a more comprehensive basis upon which to assess the overall water-related demands of meat analogs versus those of meat products.
5. Conclusions
Based on results from this study, products such as the meat analogs could represent a sustainable replacement for processed meat products. Nevertheless, it should be recognized that meat analogs are highly processed foods and, as such, appear to possess water requirements and environmental impacts similar to those of unprocessed or minimally processed animal-sourced products. Meat analogs provide consumers with a larger selection of plant-based foods from which to choose, thus potentially reducing the water footprint of their diets without markedly affecting the social and cultural patterns of meat consumption.
Author Contributions
Conceptualization, U.F.; methodology, U.F.; software, M.A.M..; validation, U.F.; formal analysis, U.F.; investigation, U.F., M.A.M., and D.L.M.; writing—original draft preparation, U.F. and D.L.M.; writing—review and editing, U.F., D.L.M., and J.S.; funding acquisition, J.S.
Funding
This research was funded by the McLean Fund for Nutrition Research.
Acknowledgments
We are grateful to the meat analog factories for allowing us to access their site, interview personnel, and collect detailed production data.
Conflicts of Interest
The authors declare no conflict of interest.
References
- Fulton, J.; Cooley, H.; Gleick, P.H. California’s Water Footprint; Pacific Institute: Oakland, CA, USA, 2012; Available online: https://pacinst.org/wp-content/uploads/2013/02/ca_ftprint_full_report3.pdf (accessed on 20 December 2018).
- Hoekstra, A.Y. Virtual Water Trade. In Proceedings of the International Expert Meeting on Virtual Water Trade, Delft, The Netherlands, 12–13 December 2002; Available online: https://waterfootprint.org/media/downloads/Report12.pdf (accessed on 4 April 2019).
- Boulay, A.-M.; Hoekstra, A.Y.; Vionnet, S. Complementarities of Water-Focused Life Cycle Assessment and Water Footprint Assessment. Environ. Sci. Technol. 2013, 47, 11926–11927. [Google Scholar] [CrossRef]
- Renault, D.; Wallender, W.W. Nutritional water productivity and diets. Agric. Water Manag. 2000, 45, 275–296. [Google Scholar] [CrossRef]
- Jalava, M.; Kummu, M.; Porkka, M.; Siebert, S.; Varis, O. Diet change—A solution to reduce water use? Environ. Res. Lett. 2014, 9, 1–14. [Google Scholar] [CrossRef]
- Springmann, M.; Clark, M.; Mason-D’Croz, D.; Wiebe, K.; Bodirsky, B.L.; Lassaletta, L.; de Vries, W.; Vermeulen, S.J.; Herrero, M.; Carlson, K.M.; et al. Options for keeping the food system within environmental limits. Nature 2018, 562, 519–525. [Google Scholar] [CrossRef]
- Mekonnen, M.M.; Hoekstra, A.Y.J.E. A Global Assessment of the Water Footprint of Farm Animal Products. Ecosystems 2012, 15, 401–415. [Google Scholar] [CrossRef] [Green Version]
- Marrin, D.L. Reducing Water and Energy Footprints via Dietary Changes among Consumers. Int. J. Nutr. Food Sci. 2014, 3, 361–369. [Google Scholar] [CrossRef]
- Strom, S. Fake Meats, Finally, Taste Like Chicken. The New York Times. 2 April 2014. Available online: https://www.nytimes.com/2014/04/03/business/meat-alternatives-on-the-plate-and-in-the-portfolio.html (accessed on 20 December 2018).
- Goldstein, B.; Moses, R.; Sammons, N.; Birkved, M. Potential to curb the environmental burdens of American beef consumption using a novel plant-based beef substitute. PLoS ONE 2017, 12, e0189029. [Google Scholar] [CrossRef] [PubMed]
- Hoek, A.C.; Elzerman, J.E.; Hageman, R.; Kok, F.J.; Luning, P.A.; Graaf, C.d. Are meat substitutes liked better over time? A repeated in-home use test with meat substitutes or meat in meals. Food Qual. Prefer. 2013, 28, 253–263. [Google Scholar] [CrossRef]
- Mintel. More than One-Third of Americans Consume Meat Alternatives, But Only a Fraction Are Actually Vegetarians. Available online: http://www.mintel.com/press-centre/food-and-drink/meat-alternatives-market-trend (accessed on 15 March 2018).
- Markets and Markets. Meat Substitutes Market by Source (Soy, Wheat, Mycoprotein), Type (Tofu, Tofu Based Product, Tempeh, TVP, Seitan, Quorn, Others), Category (Frozen, Refrigerated) & Geography—Global Trends, Forecasts up to 2023; Markets and Markets: Dallas, TX, USA, 2018; Available online: https://www.marketsandmarkets.com/Market-Reports/meat-substitutes-market-979.html (accessed on 5 January 2019).
- Hoek, A.C.; Luning, P.A.; Weijzen, P.; Engels, W.; Kok, F.J.; de Graaf, C. Replacement of meat by meat substitutes. A survey on person- and product-related factors in consumer acceptance. Appetite 2011, 56, 662–673. [Google Scholar] [CrossRef]
- Craig, W.J.; Mangels, A.R. American Dietetic Association. Position of the American Dietetic Association: Vegetarian diets. J. Am. Diet. Assoc. 2009, 109, 1266–1282. [Google Scholar] [PubMed]
- U.S. Department of Agriculture, Agricultural Research Service, Nutrient Data Laboratory. USDA National Nutrient Database for Standard Reference, Legacy. 2018. Available online: https://ndb.nal.usda.gov/ndb/ (accessed on 4 April 2019).
- Heller, M.C.; Keoleiank, G.A. Beyond Meat’s Beyond Burger Life Cycle Assessment: A Detailed Comparison between a Plantbased and an Animal-Based Protein Source. CSS18-10. 2018. Available online: http://css.umich.edu/sites/default/files/publication/CSS18-10.pdf (accessed on 4 April 2019).
- Smetana, S.; Mathys, A.; Knoch, A.; Heinz, V. Meat Alternatives: Life Cycle Assessment of Most Known Meat Substitutes. Int. J. Life Cycle Assess. 2015, 20. [Google Scholar] [CrossRef]
- Ritchie, H.; Reay, D.S.; Higgins, P. Potential of Meat Substitutes for Climate Change Mitigation and Improved Human Health in High-Income Markets. Front. Sustain. Food Syst. 2018, 2. [Google Scholar] [CrossRef] [Green Version]
- Dettling, J.Q.T.; Faist, M.; DelDuce, A.; Mandlebaum, S. A Comparative Life Cycle Assessment of Plant-Based Foods and Meat Foods; Quantis USA: Boston, MA, USA, 2016; Available online: https://www.morningstarfarms.com/content/dam/morningstarfarms/pdf/MSFPlantBasedLCAReport_2016-04-10_Final.pdf (accessed on 20 December 2018).
- Sandars, D.L.; Audsley, E.; Cañete, C.; Cumby, T.R.; Scotford, I.M.; Williams, A.G. Environmental Benefits of Livestock Manure Management Practices and Technology by Life Cycle Assessment. Biosyst. Eng. 2003, 84, 267–281. [Google Scholar] [CrossRef]
- Heller, M.C.; Keoleian, G.A. Life cycle energy and greenhouse gas analysis of a large-scale vertically integrated organic dairy in the United States. Environ. Sci. Technol. 2011, 45, 1903–1910. [Google Scholar] [CrossRef]
- Venkat, K. Comparison of twelve organic and conventional farming systems: A life cycle greenhouse gas emissions perspective. J. Sustain. Agric. 2012, 36, 620–649. [Google Scholar] [CrossRef]
- Environmental Management—Water Footprint—Principles, Requirements and Guidelines; ISO 14046:2014; International Organization for Standardization: Geneva, Switzerland, 2014; Available online: https://www.iso.org/standard/43263.html?browse=tc (accessed on 4 April 2019).
- Environmental Management—Life Cycle Assessment—Requirements and Guidelines; ISO 14044:2006; International Organization for Standardization: Geneva, Switzerland, 2006; Available online: https://www.iso.org/obp/ui/#iso:std:iso:14044:ed-1:v1:en (accessed on 4 April 2019).
- SimaPro. SimaPro. 8.5 Computer Software, 8th ed.; Pre-Product Ecology Consultants: Amersfoort, The Netherlands, 2014. [Google Scholar]
- National Institute for Public Health and the Environment. ReCiPe 2016 v1.1 A Harmonized Life Cycle Impact Assessment Method at Midpoint and Endpoint Level Report I: Characterization; National Institute for Public Health and the Environment: Bilthoven, The Netherlands, 2017; Available online: https://www.rivm.nl/bibliotheek/rapporten/2016-0104.pdf (accessed on 5 September 2018).
- Huerta, A.R.; Güereca, L.P.; Lozano, M.d.l.S.R. Environmental impact of beef production in Mexico through life cycle assessment. Resour. Conserv. Recycl. 2016, 109, 44–53. [Google Scholar] [CrossRef]
- Zonderland-Thomassen, M.A.; Lieffering, M.; Ledgard, S.F. Water footprint of beef cattle and sheep produced in New Zealand: Water scarcity and eutrophication impacts. J. Clean. Prod. 2014, 73, 253–262. [Google Scholar] [CrossRef]
- Vasilaki, V.; Katsou, E.; Ponsá, S.; Colón, J. Water and carbon footprint of selected dairy products: A case study in Catalonia. J. Clean. Prod. 2016, 139, 504–516. [Google Scholar] [CrossRef]
- Park, Y.S.; Egilmez, G.; Kucukvar, M. Emergy and End-point Impact Assessment of Agricultural and Food Production in the United States: A Supply Chain-linked Ecologically-based Life Cycle Assessment. Ecol. Indic. 2016, 62, 117–137. [Google Scholar] [CrossRef]
- Berardy, A.; Costello, C.; Seager, T. Life Cycle Assessment of Soy Protein Isolate. In Proceedings of the International Symposium on Sustainable Systems and Technologies, Dearborn, MI, USA, 18–20 May 2015. [Google Scholar]
- Lamnatou, C.; Ezcurra-Ciaurriz, X.; Chemisana, D.; Plà-Aragonés, L.M. Environmental assessment of a pork-production system in North-East of Spain focusing on life-cycle swine nutrition. J. Clean. Prod. 2016, 137, 105–115. [Google Scholar] [CrossRef]
- Kalhor, T.; Rajabipour, A.; Akram, A.; Sharifi, M. Environmental impact assessment of chicken meat production using life cycle assessment. Inf. Process. Agric. 2016, 3, 262–271. [Google Scholar] [CrossRef] [Green Version]
- Berger, M.; Finkbeiner, M. Water Footprinting: How to Address Water Use in Life Cycle Assessment? Sustainability 2010, 2, 919. [Google Scholar] [CrossRef]
- Caffrey, K.R.; Veal, M.W. Conducting an Agricultural Life Cycle Assessment: Challenges and Perspectives. Sci. World J. 2013, 2013, 472431. [Google Scholar] [CrossRef]
Figure 1.
Proportional contribution of each phase of meat analog production to the five environmental impacts.
Figure 1.
Proportional contribution of each phase of meat analog production to the five environmental impacts.


Table 1.
Inputs for the four Life Cycle Assessment (LCA) production phases considered in this study.
Table 1.
Inputs for the four Life Cycle Assessment (LCA) production phases considered in this study.
| LCA Phase | Model Inputs |
|---|---|
| INGREDIENTS | Gluten; Isolated Soy Protein; Texturized Soy Protein; Soy Meal; Wheat Flour; White Egg; Oak Flakes; Peanuts; Vegetable Oil; Salt; Flavorings; Spices; Rice; Starch; Water |
| TRANSPORTATION | Diesel Fuel |
| PROCESSING 1 | Medium Voltage Electricity; Natural Gas |
| PACKAGING MATERIALS | Corrugated Board; Plastic Bags; Tin Cans; Labels |
1 Processing includes all in-factory activities: storing ingredients, processing ingredients into meat analogs, and packaging and storing final products.
Table 2.
Mean (standard deviation) of water-related impacts attributable to different phases of meat analog production. Data for impact categories are reported per 1000 kg (ton) of product and per kg of protein.
Table 2.
Mean (standard deviation) of water-related impacts attributable to different phases of meat analog production. Data for impact categories are reported per 1000 kg (ton) of product and per kg of protein.
| Per 1000 kg (metric ton) of Product | ||||||
| Impact indicator | Units | Ingredients | Transportation | Processing | Packaging | Total |
| Water consumption | Cubic meters | 944 (449) | 12.2 (6.86) | 2410 (1004) | 425 (472) | 3800 (1240) |
| Freshwater eutrophication | Kg P eq. 1 | 0.190 (0.058) | 0.001 (0.001) | 0.313 (0.130) | 0.056 (0.061) | 0.561 (0.183) |
| Marine eutrophication | Kg N eq. 2 | 2.20 (0.96) | 0.000 (0.000) | 0.021 (0.008) | 0.012 (0.007) | 2.23 (0.96) |
| Freshwater ecotoxicity | Kg 1,4-DCB eq. 3 | 10.9 (6.8) | 0.183 (0.103) | 0.656 (0.305) | 0.184 (0.159) | 11.9 (6.78) |
| Marine ecotoxicity | Kg 1,4-DCB eq. 3 | 4.80 (1.84) | 0.258 (0.138) | 1.13 (0.44) | 0.654 (0.696) | 6.84 (2.11) |
| Per Kg of Protein | ||||||
| Impact indicator | Units | Ingredients | Transportation | Processing | Packaging | Total |
| Water consumption | Cubic meters | 4.64 (3.25) | 0.057 (0.032) | 11.4 (4.7) | 2.09 (2.33) | 18.2 (7.3) |
| Freshwater eutrophication | Kg P eq. 1 | 0.010 (0.005) | 1 × 10⁻⁶ (5 × 10⁻⁷) | 1 × 10⁻⁴ (4 × 10⁻⁵) | 6 × 10⁻⁵ (4 × 10⁻⁵) | 0.010 (0.005) |
| Marine eutrophication | Kg N eq. 2 | 0.049 (0.029) | 9 × 10⁻⁴ (5 × 10⁻⁴) | 0.003 (0.002) | 9 × 10⁻⁴ (8 × 10⁻⁴) | 0.054 (0.029) |
| Freshwater ecotoxicity | Kg 1,4-DCB eq. 3 | 0.022 (0.008) | 0.001 (7 × 10⁻⁴) | 0.005 (0.002) | 0.003 (0.004) | 0.032 (0.009) |
| Marine ecotoxicity | Kg 1,4-DCB eq. 3 | 9 × 10⁻⁴ (3 × 10⁻⁴) | 6 × 10⁻⁶ (4 × 10⁻⁶) | 0.001 (6 × 10⁻⁴) | 3 × 10⁻⁴ (3 × 10⁻⁴) | 0.003 (9 × 10⁻⁴) |
1 Kg P eq.: kilograms of phosphorus equivalents; 2 Kg N eq.: kilogram of nitrogen equivalents; 3 Kg 1,4-DCB eq.: kilogram of 1,4-dichlorobenzene equivalents.
Table 3.
Five life cycle assessment indicators associated with generating one kilogram (as the functional unit) of the products indicated.
Table 3.
Five life cycle assessment indicators associated with generating one kilogram (as the functional unit) of the products indicated.
| Food Products | Impact Assessment Method | Water Consumption or Use (L) | Freshwater Eutrophication (kg P eq. *) | Marine Eutrophication (kg N eq. ¥) | Freshwater Ecotoxicity (kg 1,4-DCB eq. #) | Marine Ecotoxicity (kg 1,4-DCB eq. #) |
|---|---|---|---|---|---|---|
| Meat analogs (current study) | ReCiPe 2016 | 3800 | 5.6 × 10⁻⁴ | 2.2 × 10⁻³ | 0.012 | 6.8 × 10⁻³ |
| Garlic quinoa burger [20] | Impact 2002+ | 1100 ∞ | 8.0 × 10⁻⁴ | ----- | ----- | ----- |
| Black bean burger [20] | Impact 2002+ | 1100 ∞ | 6.6 × 10⁻⁴ | ----- | ----- | ----- |
| Veggie burger (griller) [20] | Impact 2002+ | 2000 ∞ | 4.3 × 10⁻⁴ | |||
| Veggie sausage patty [20] | Impact 2002+ | 1200 ∞ | 6.2 × 10⁻⁴ | |||
| Veggie chicken patty [20] | Impact 2002+ | 1100 ∞ | 3.2 × 10⁻⁴ | |||
| Unprocessed beef & [28,29,32] | CML 2001, ReCiPe | |||||
| Extensive systems | <550 © | 0.042–0.087 © | 0.02 © | ----- | ----- | |
| Intensive systems | <15,000 | 0.13 | ----- | ----- | ----- | |
| Beef burger [20] | Impact 2002+ | 8400 ∞ | 0.019 | ----- | ----- | ----- |
| Unprocessed pork & [32,33] | ReCiPe | 1406/4000 | 2.4 × 10⁻³ ©/0.07 | 0.11 © | 0.031 © | 6.2 × 10⁻³ © |
| Pork sausage patty [20] | Impact 2002+ | 2900 ∞ | 6.1 × 10⁻³ | ----- | ----- | ----- |
| Unprocessed chicken [32,34] | ReCiPe, CML 2 baseline 2000 | 4000 | 0.01–0.02 | ----- | 0.11 | 330 |
| Chicken sausage patty [20] | Impact 2002+ | 8000 ∞ | 0.012 | ----- | ----- | ----- |
| Yogurt (plain) [30] | Impact 2002+, ReCiPe | 220 | 2.5 × 10⁻³ | ----- | 0.10 | ----- |
* kg P eq.: kilograms of phosphorus equivalents; ¥ kg N eq.: kilogram of nitrogen equivalents; # kg 1,4-DCB eq.: kilogram of 1,4-dichlorobenzene equivalents ∞ Values are reported as water use rather than water consumption, which refers to water that is unavailable following its use [35]. & Where applicable, meats were assumed to comprise 40% of the animal live weight. © Represents on-farm accounting only (excludes impacts from transportation, processing and packaging).
© 2019 by the authors. Licensee MDPI, Basel, Switzerland. This article is an open access article distributed under the terms and conditions of the Creative Commons Attribution (CC BY) license (http://creativecommons.org/licenses/by/4.0/).
Share and Cite
MDPI and ACS Style
Fresán, U.; Marrin, D.L.; Mejia, M.A.; Sabaté, J. Water Footprint of Meat Analogs: Selected Indicators According to Life Cycle Assessment. Water 2019, 11, 728. https://doi.org/10.3390/w11040728
AMA Style
Fresán U, Marrin DL, Mejia MA, Sabaté J. Water Footprint of Meat Analogs: Selected Indicators According to Life Cycle Assessment. Water. 2019; 11(4):728. https://doi.org/10.3390/w11040728
Chicago/Turabian StyleFresán, Ujué, D. L. Marrin, Maximino Alfredo Mejia, and Joan Sabaté. 2019. "Water Footprint of Meat Analogs: Selected Indicators According to Life Cycle Assessment" Water 11, no. 4: 728. https://doi.org/10.3390/w11040728
Note that from the first issue of 2016, this journal uses article numbers instead of page numbers. See further details here.