Effects of Sediment Released from a Check Dam on Sediment Deposits and Fish and Macroinvertebrate Communities in a Small Stream

 ,
, 
Abstract
:1. Introduction
2. Methodology
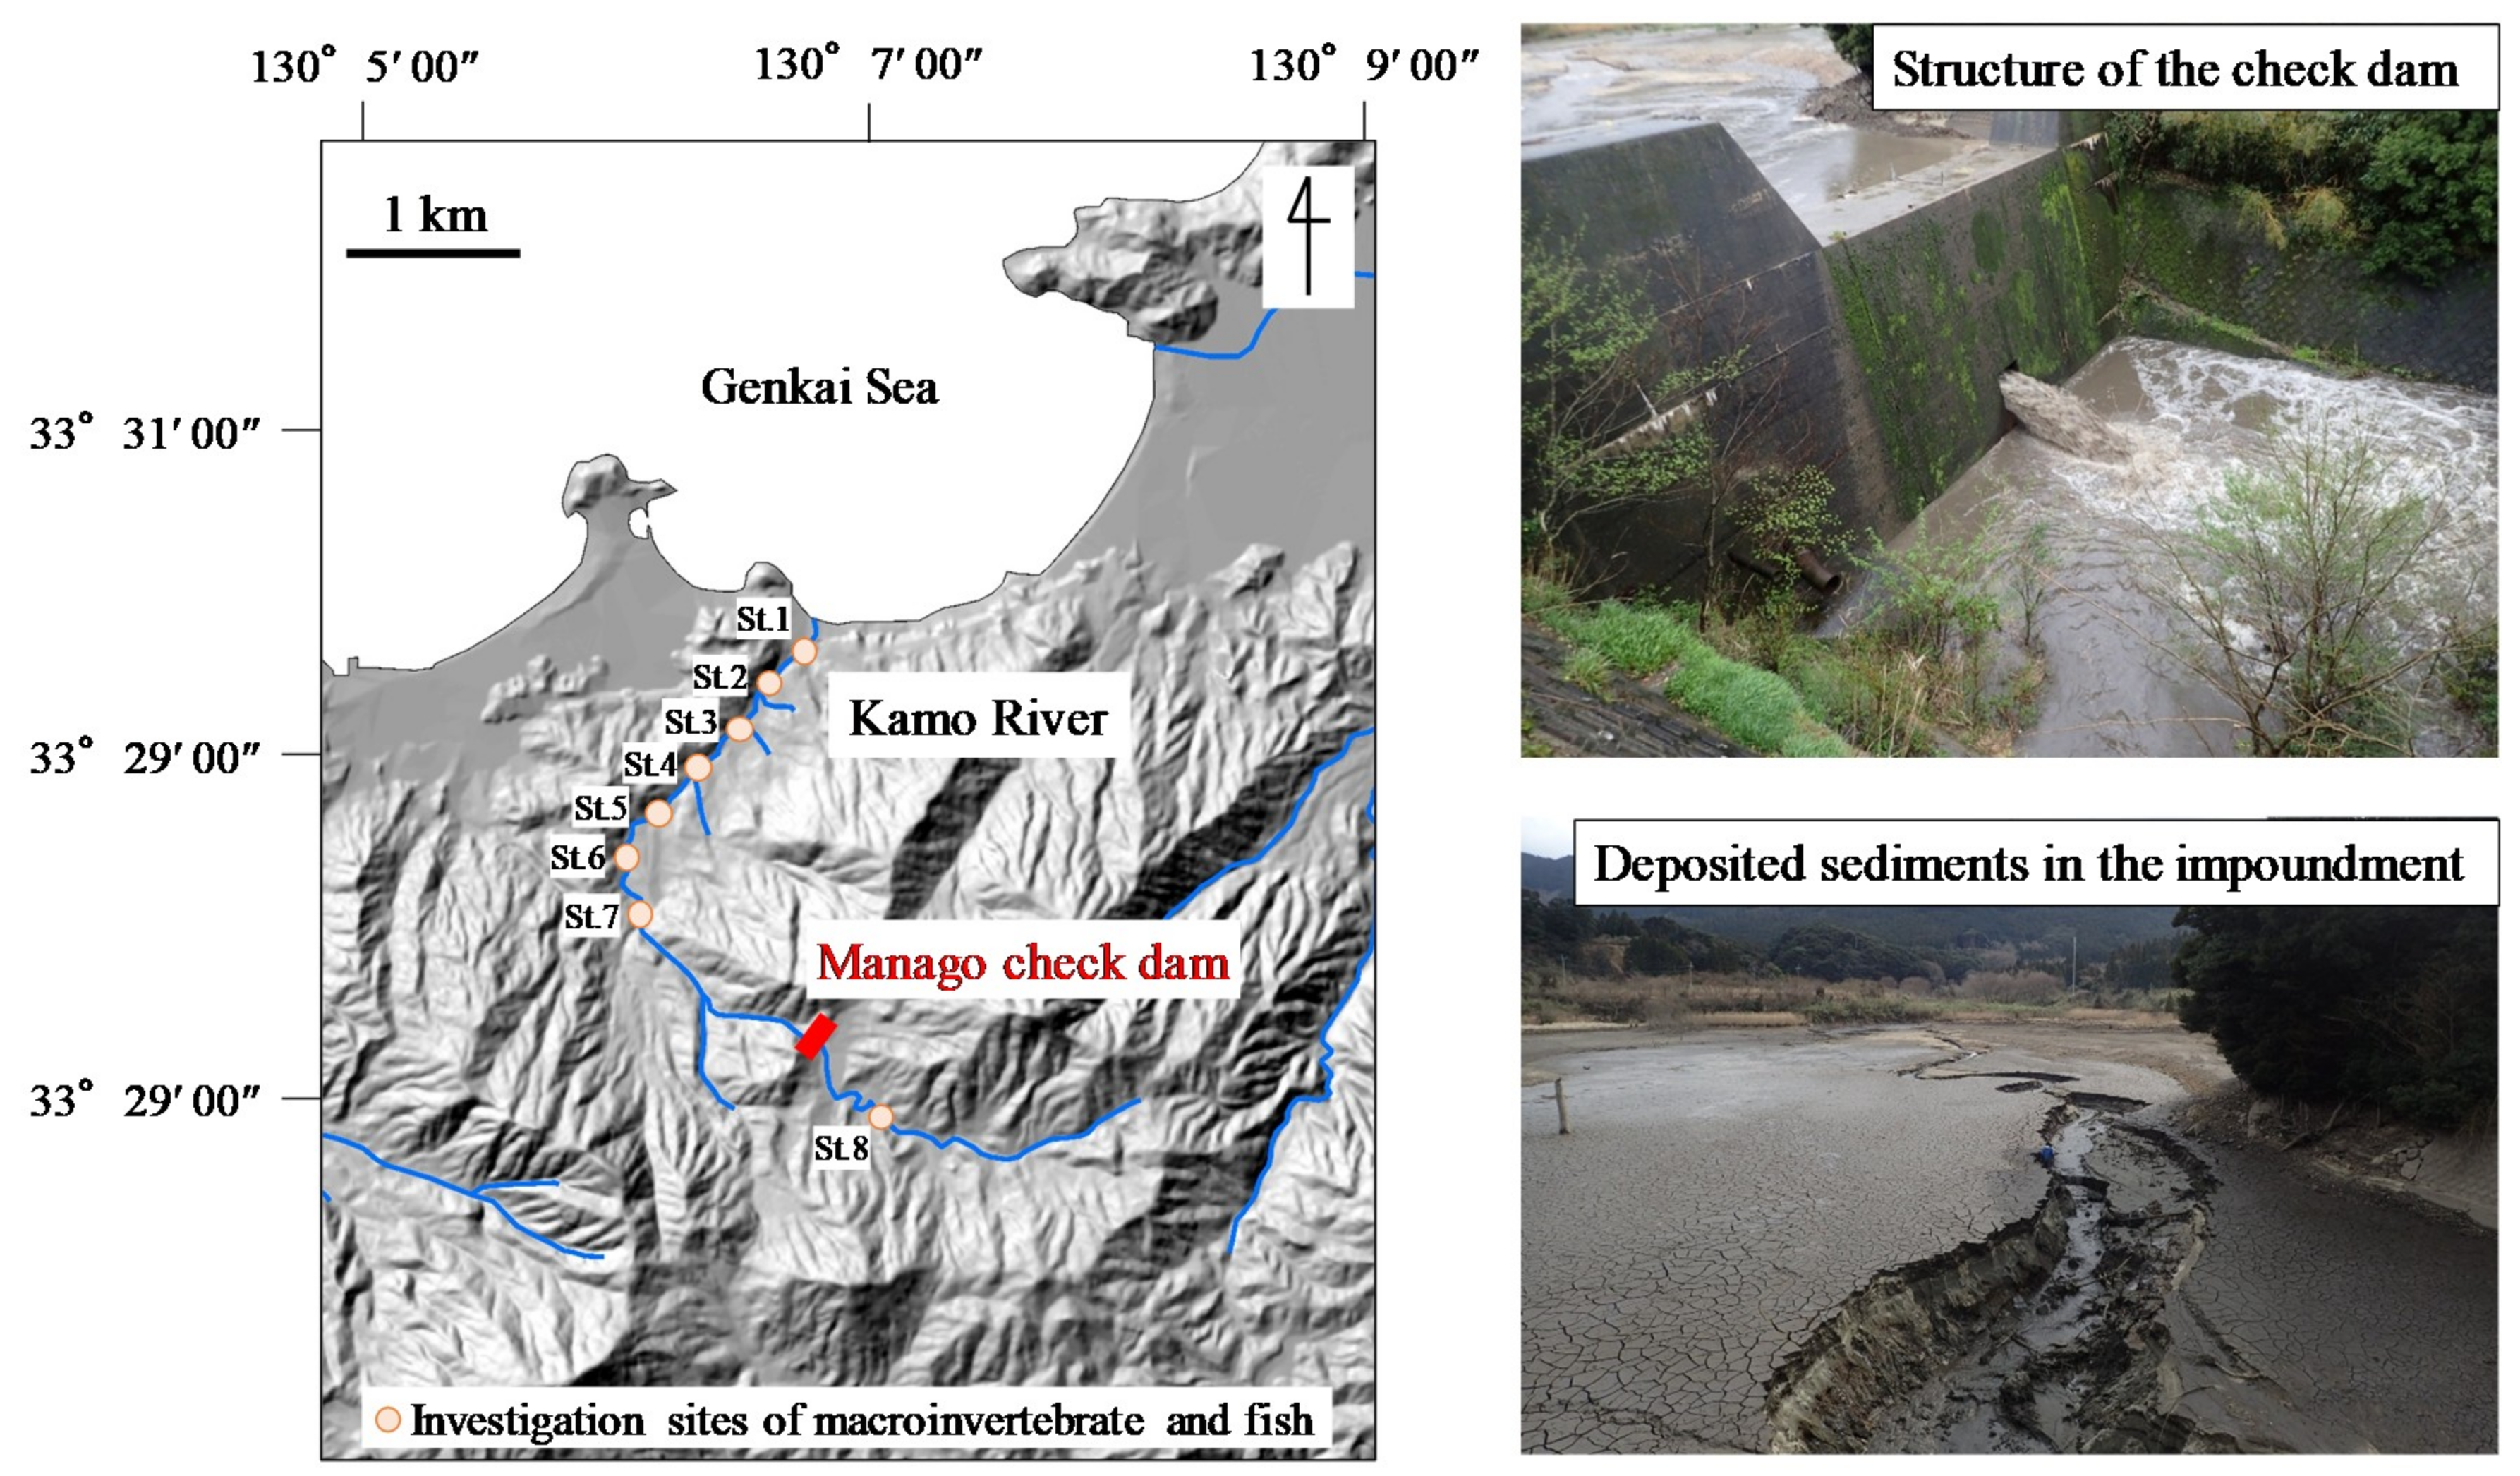
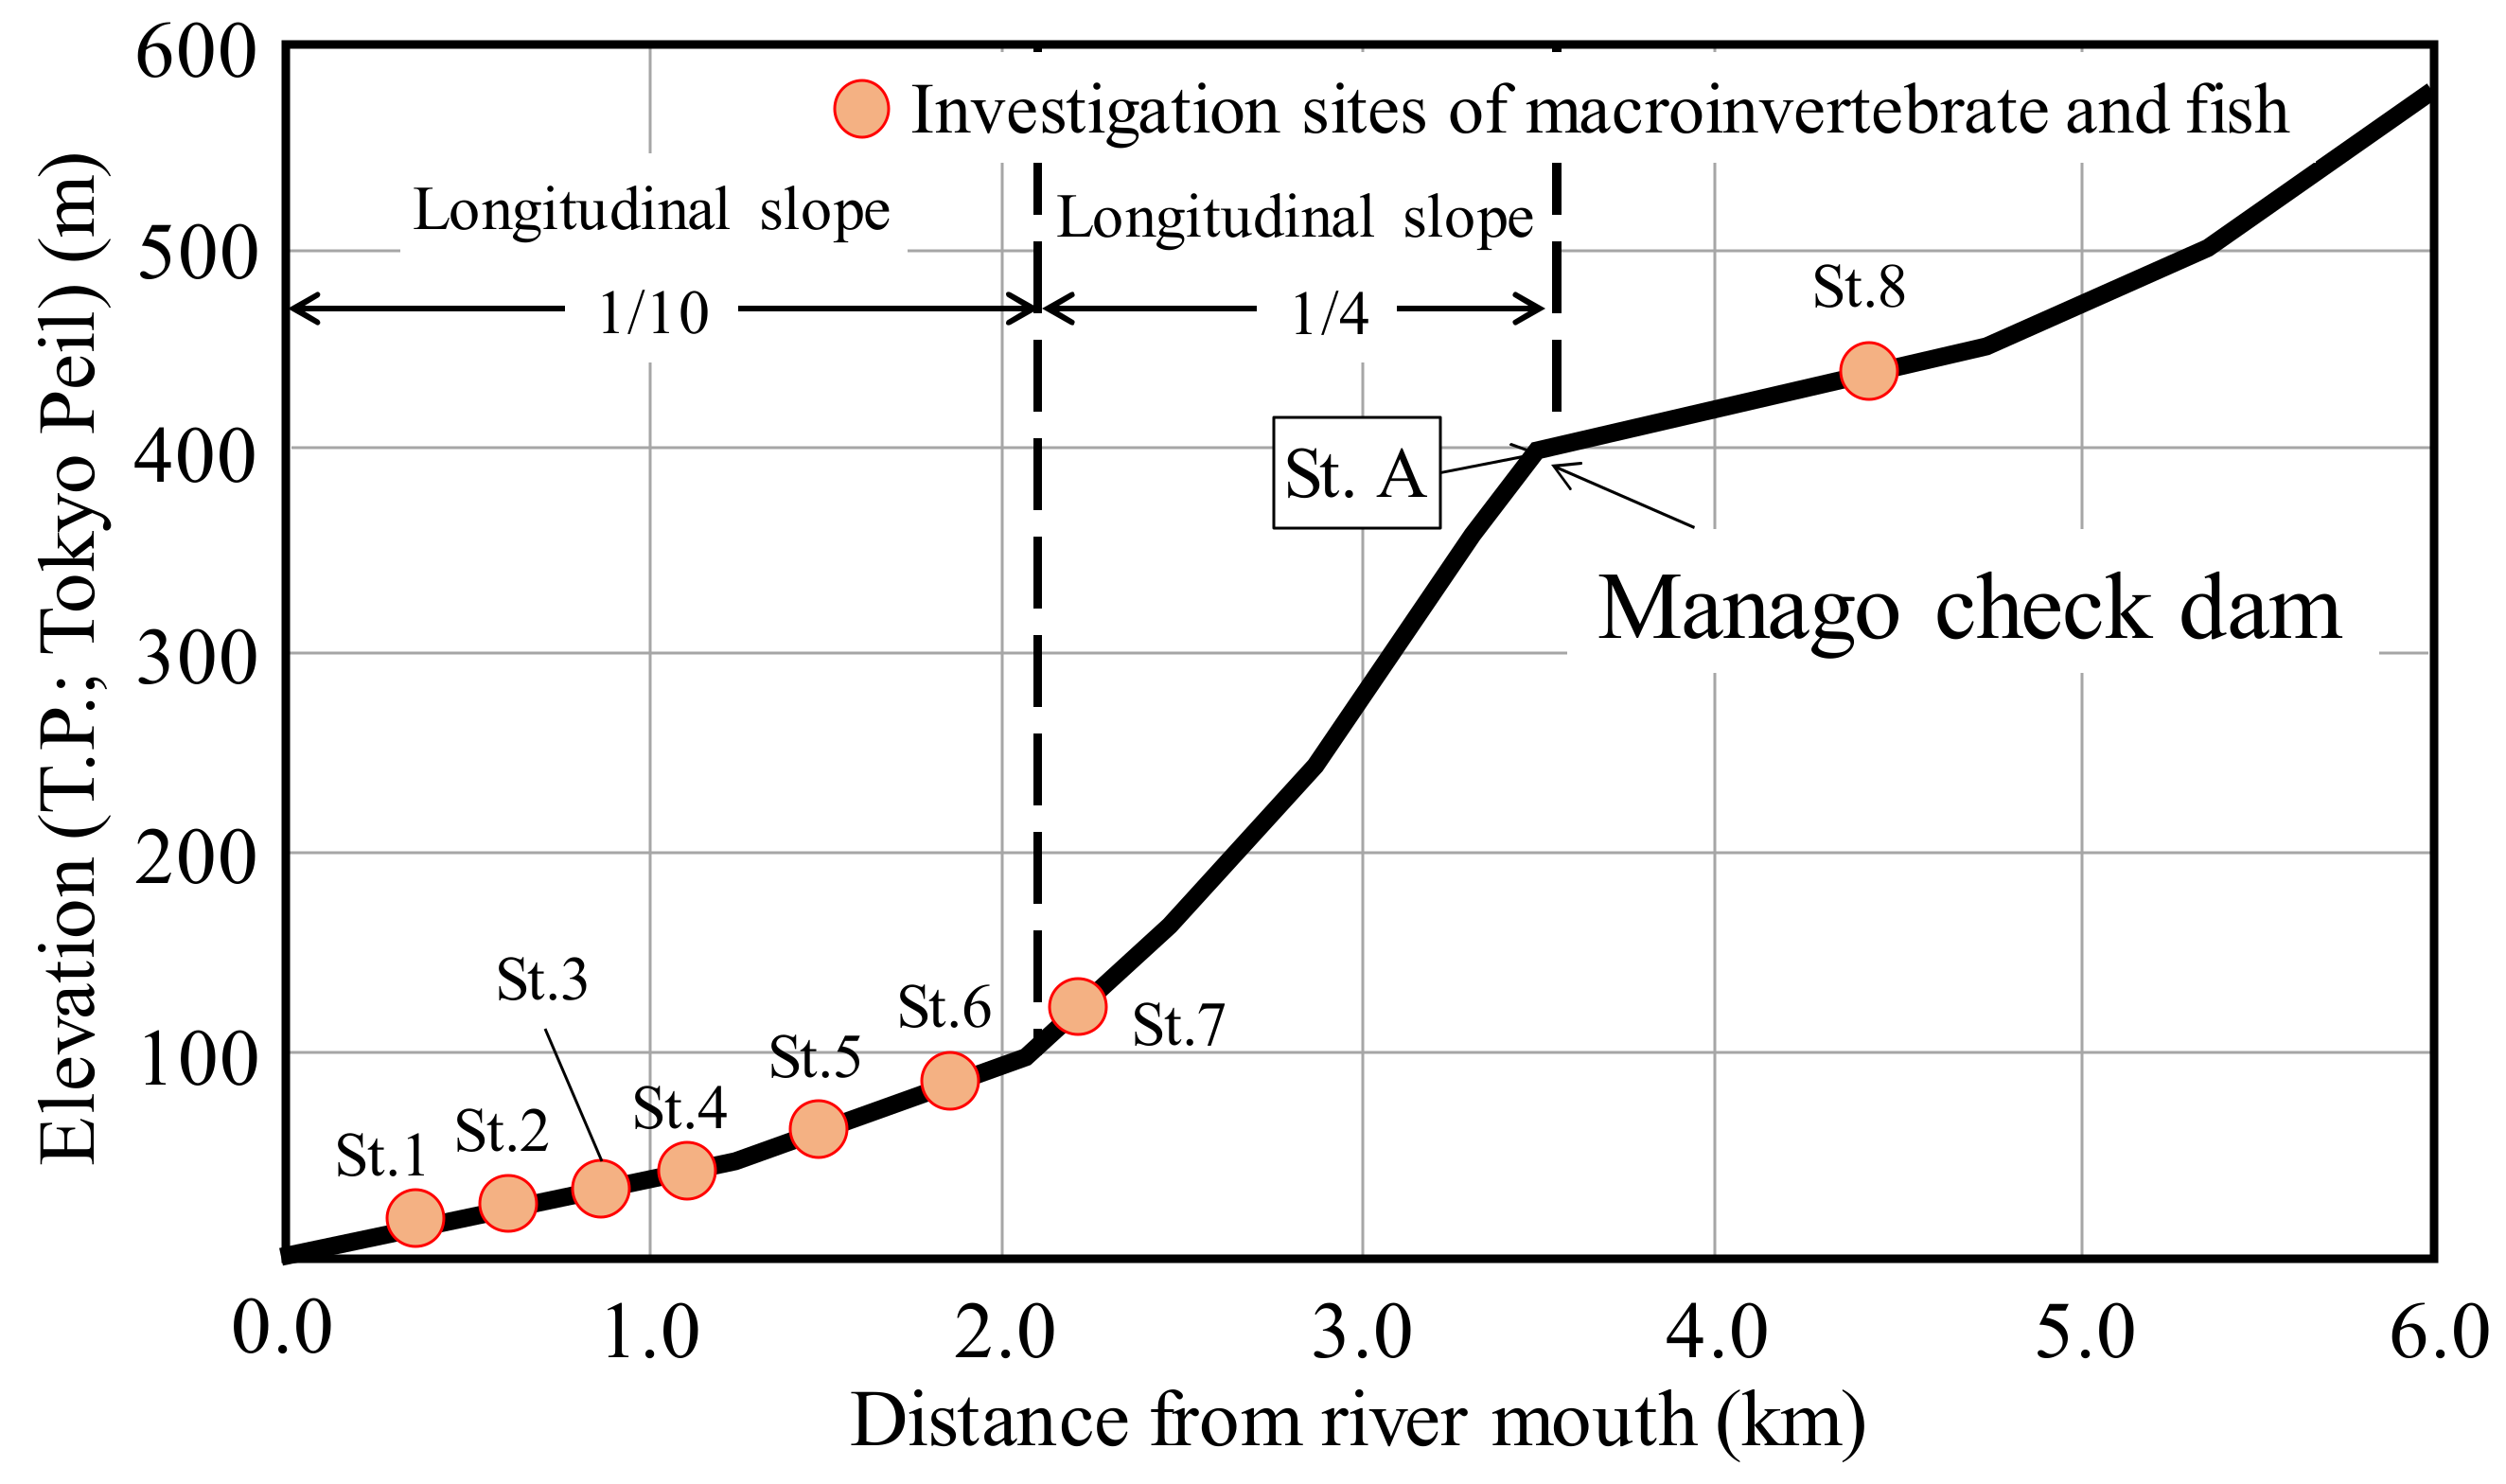
2.1. Site Location
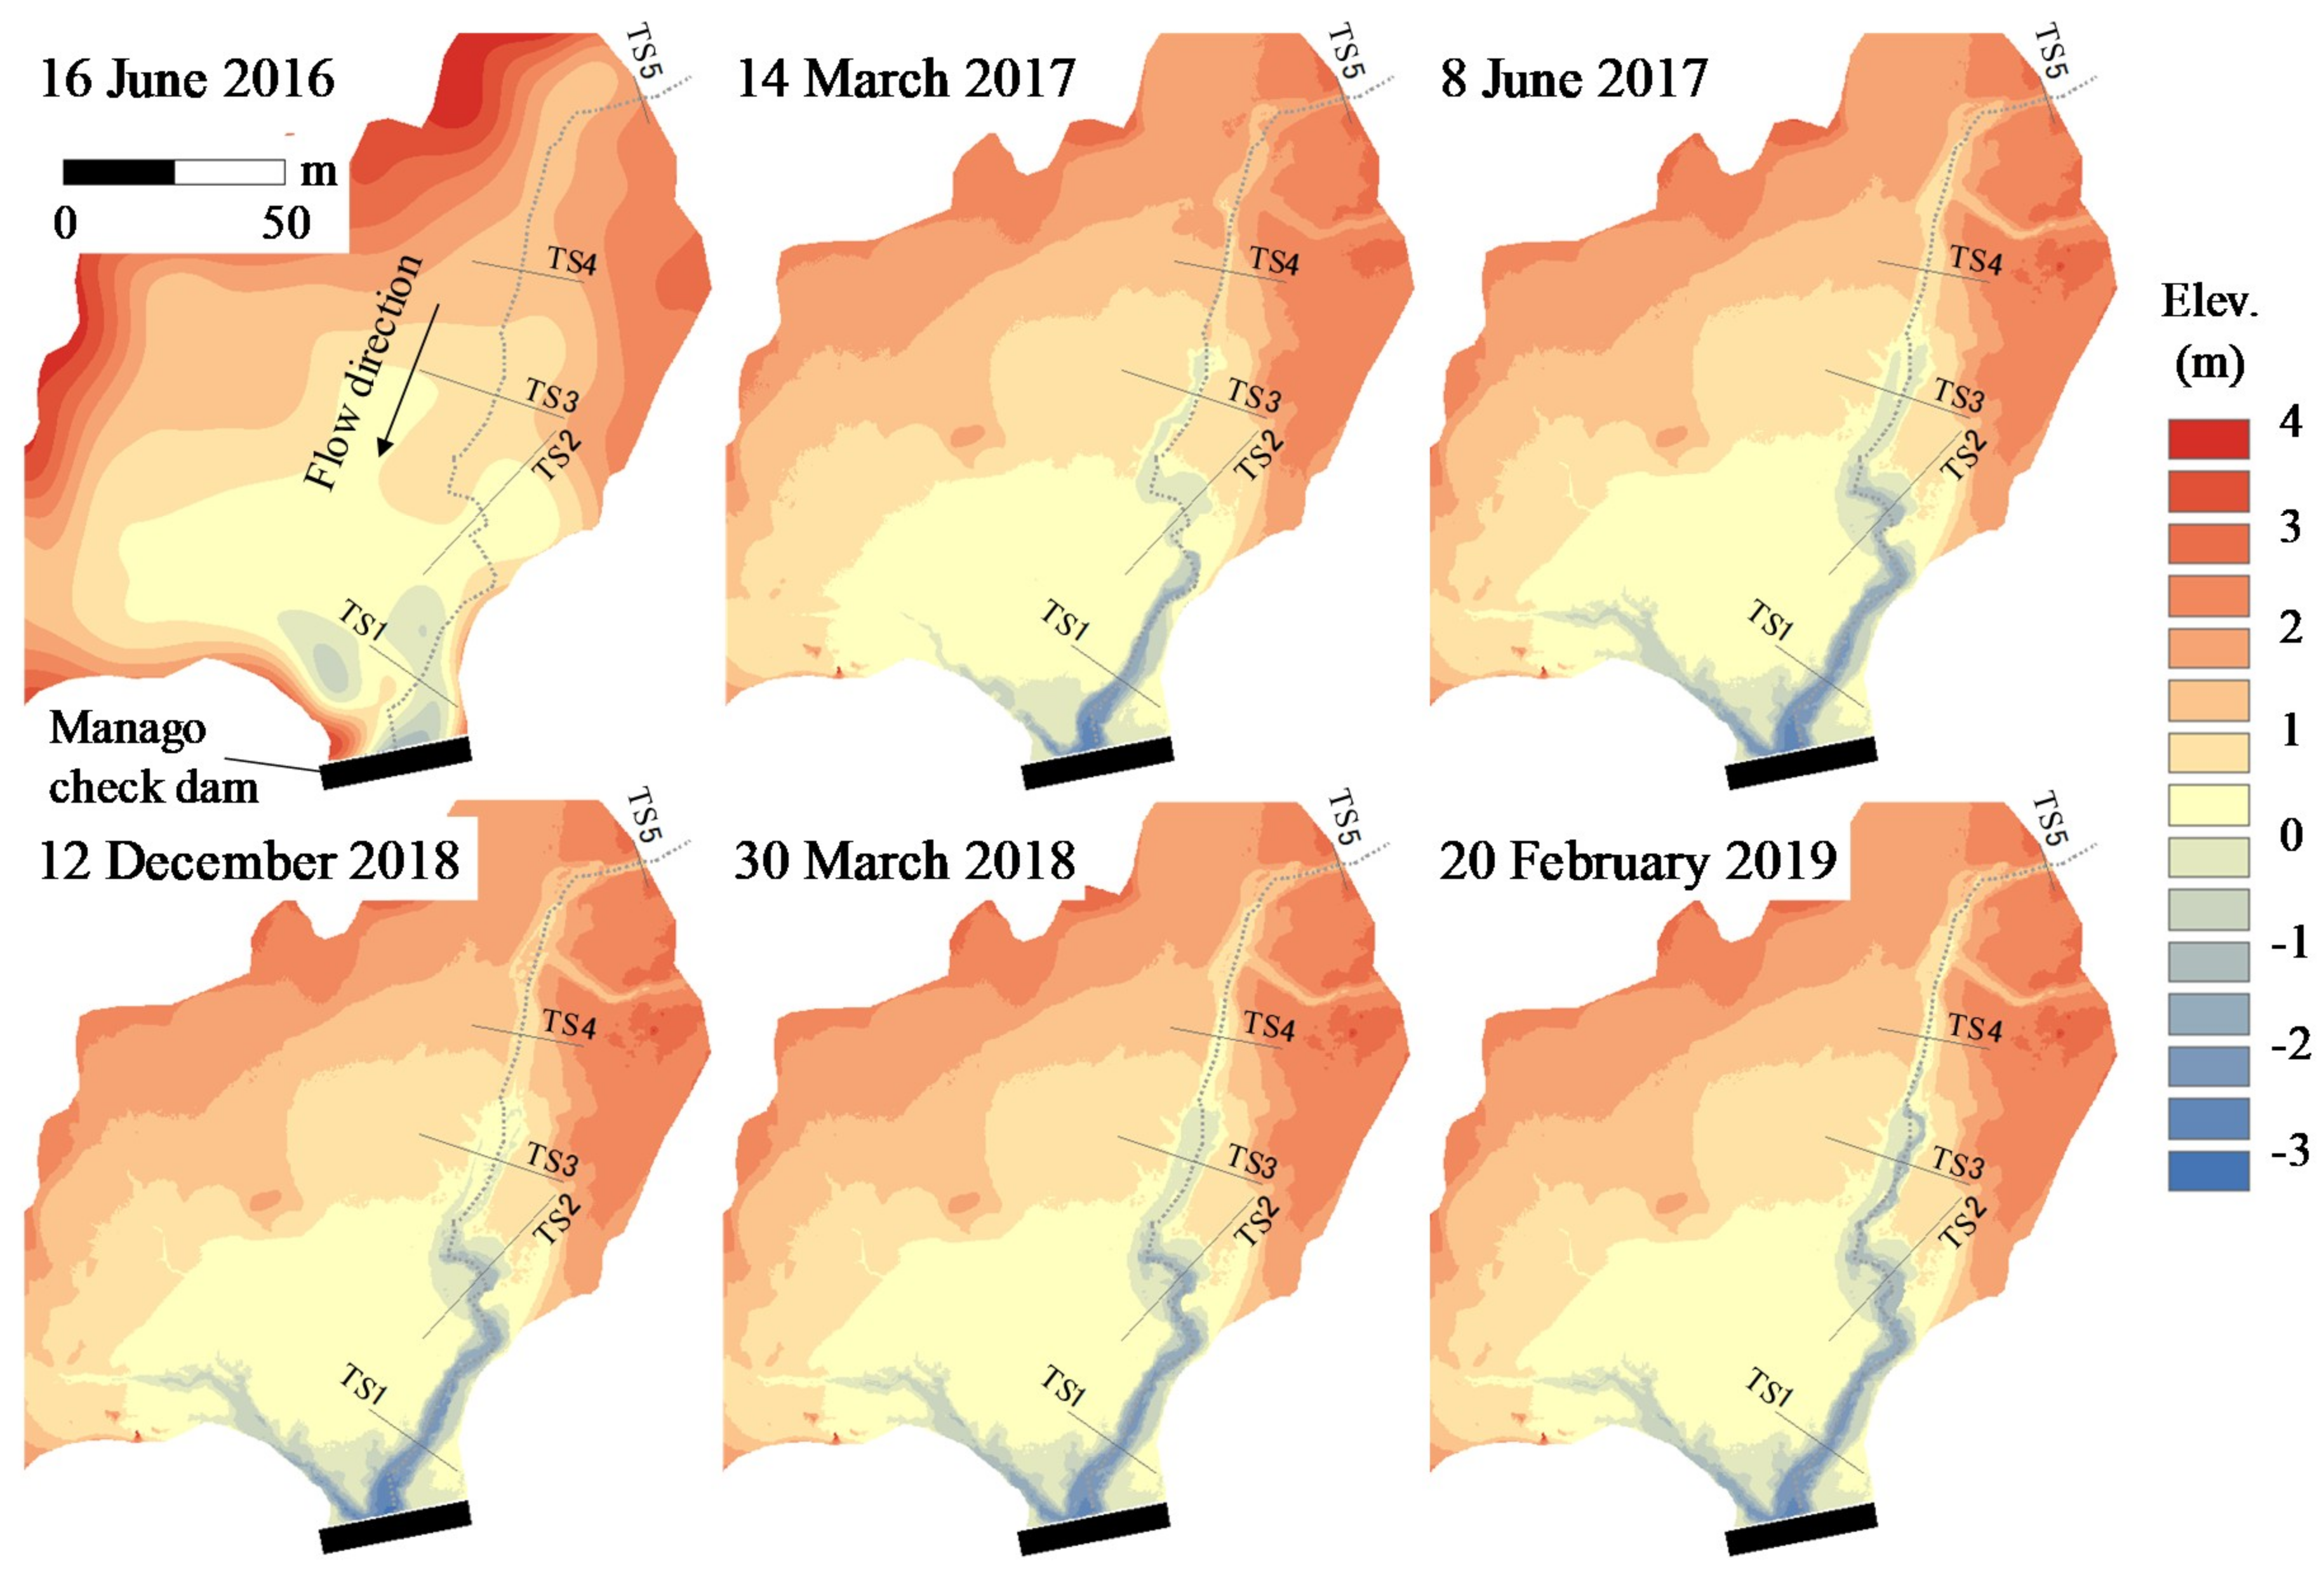
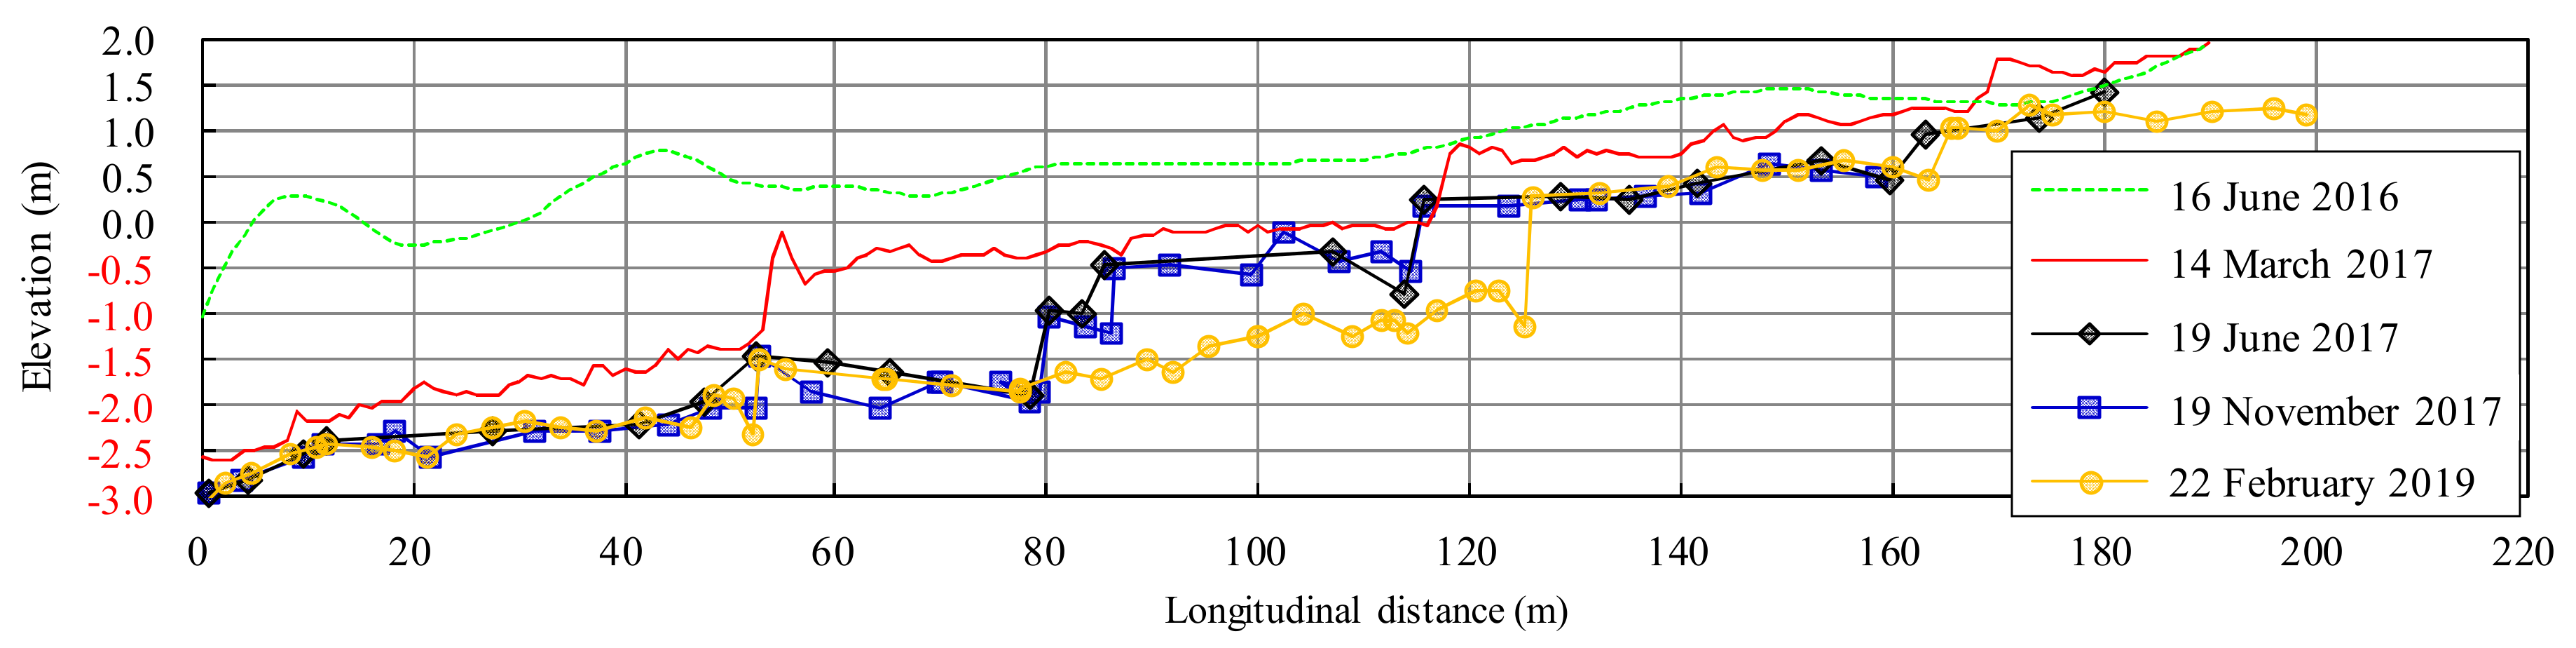
2.2. Geomorphic Changes of Deposited Sediment
2.3. Characteristics of Sediment Transport
2.4. Sampling of Aquatic Community
2.5. Statistical Analysis
3. Results and Discussion
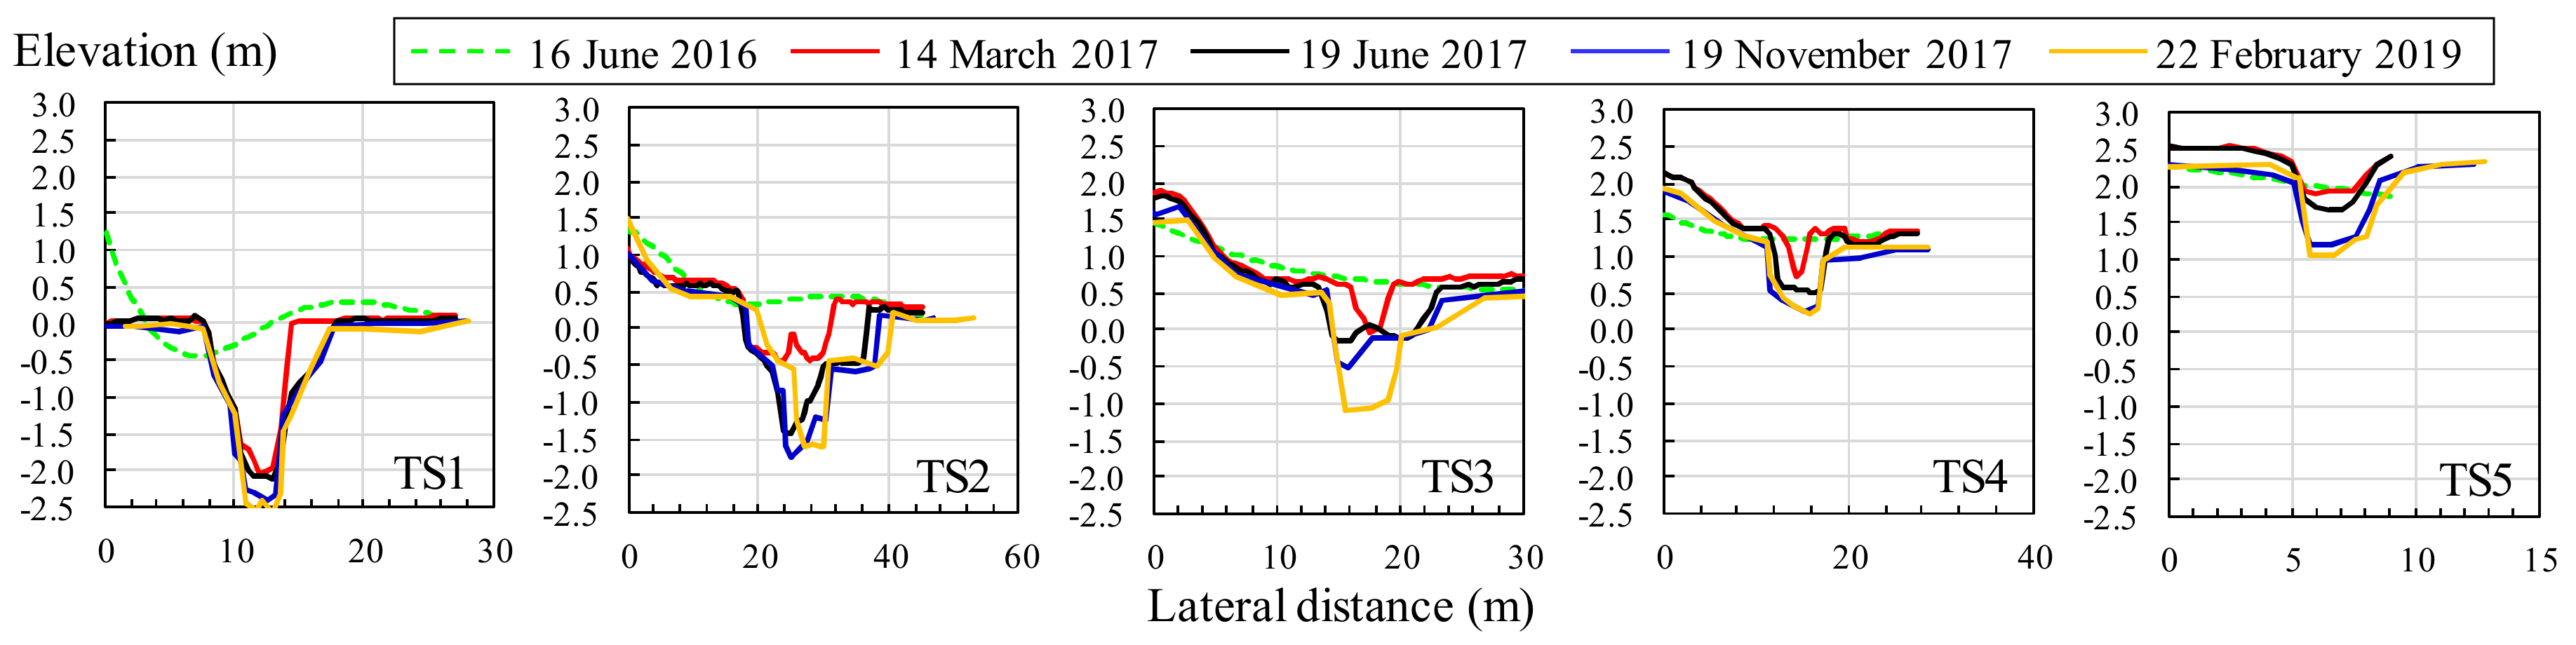
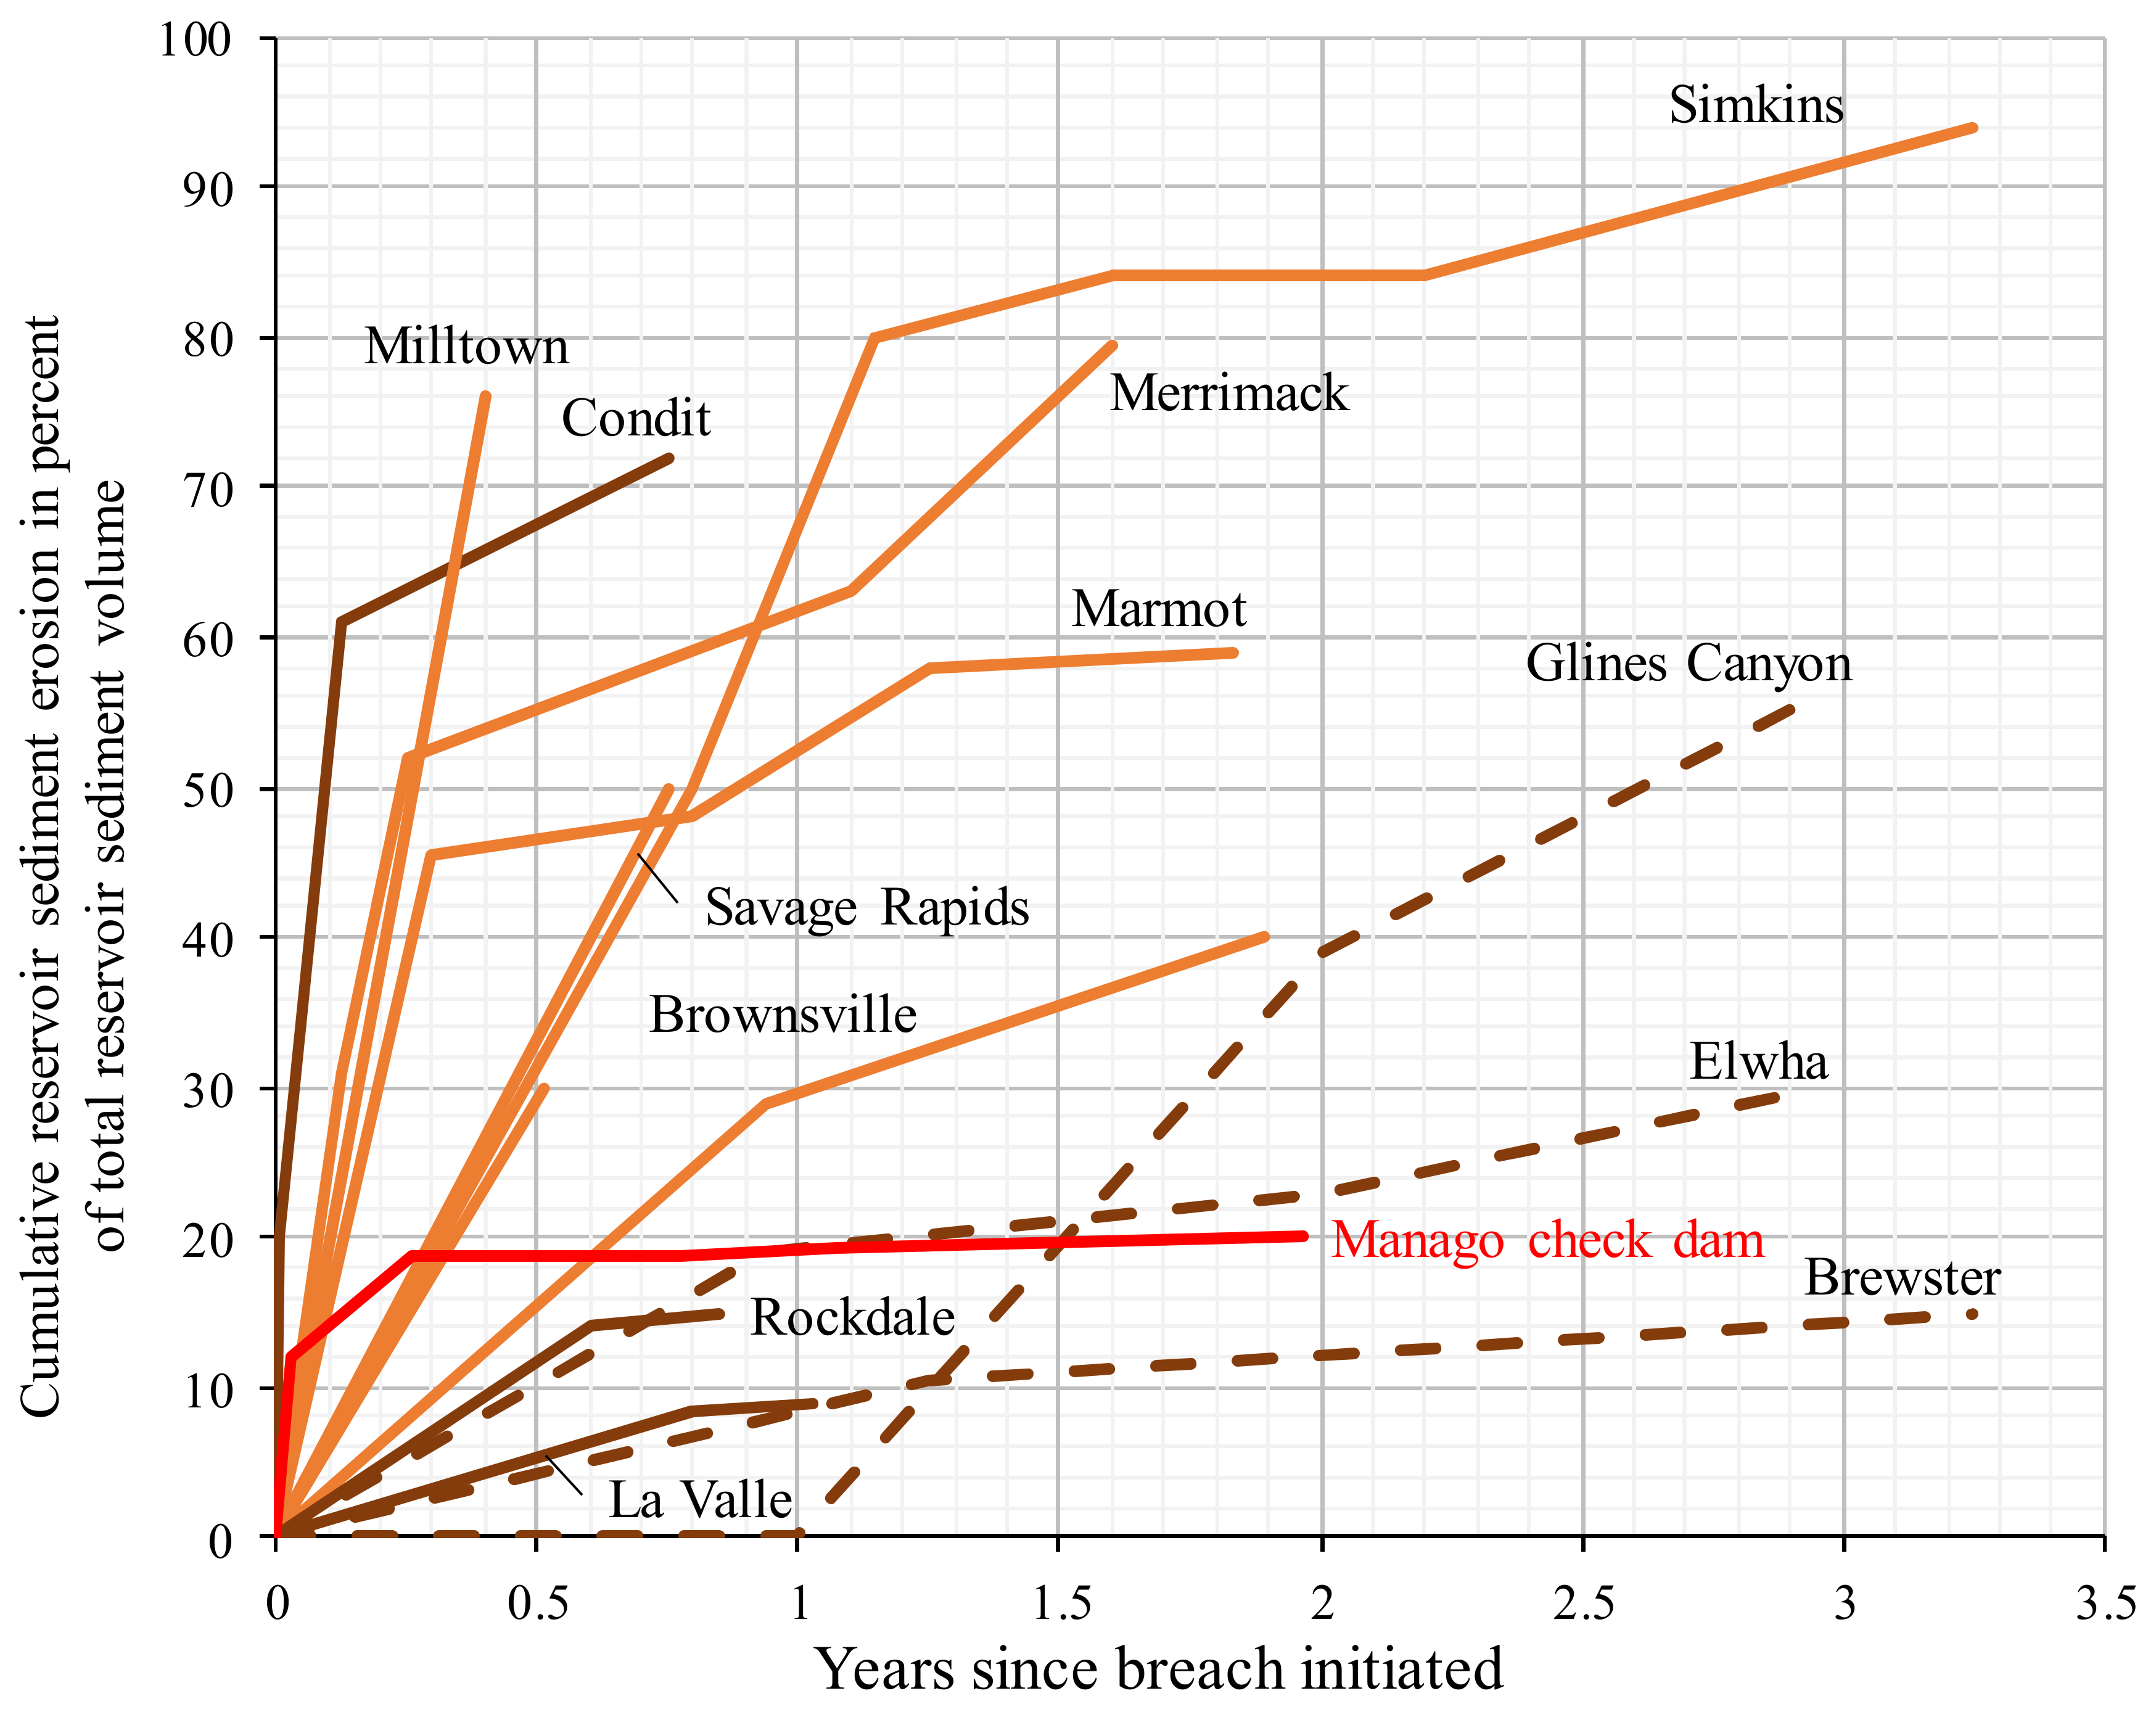
3.1. Runoff of Deposited Sediment and Topographic Changes
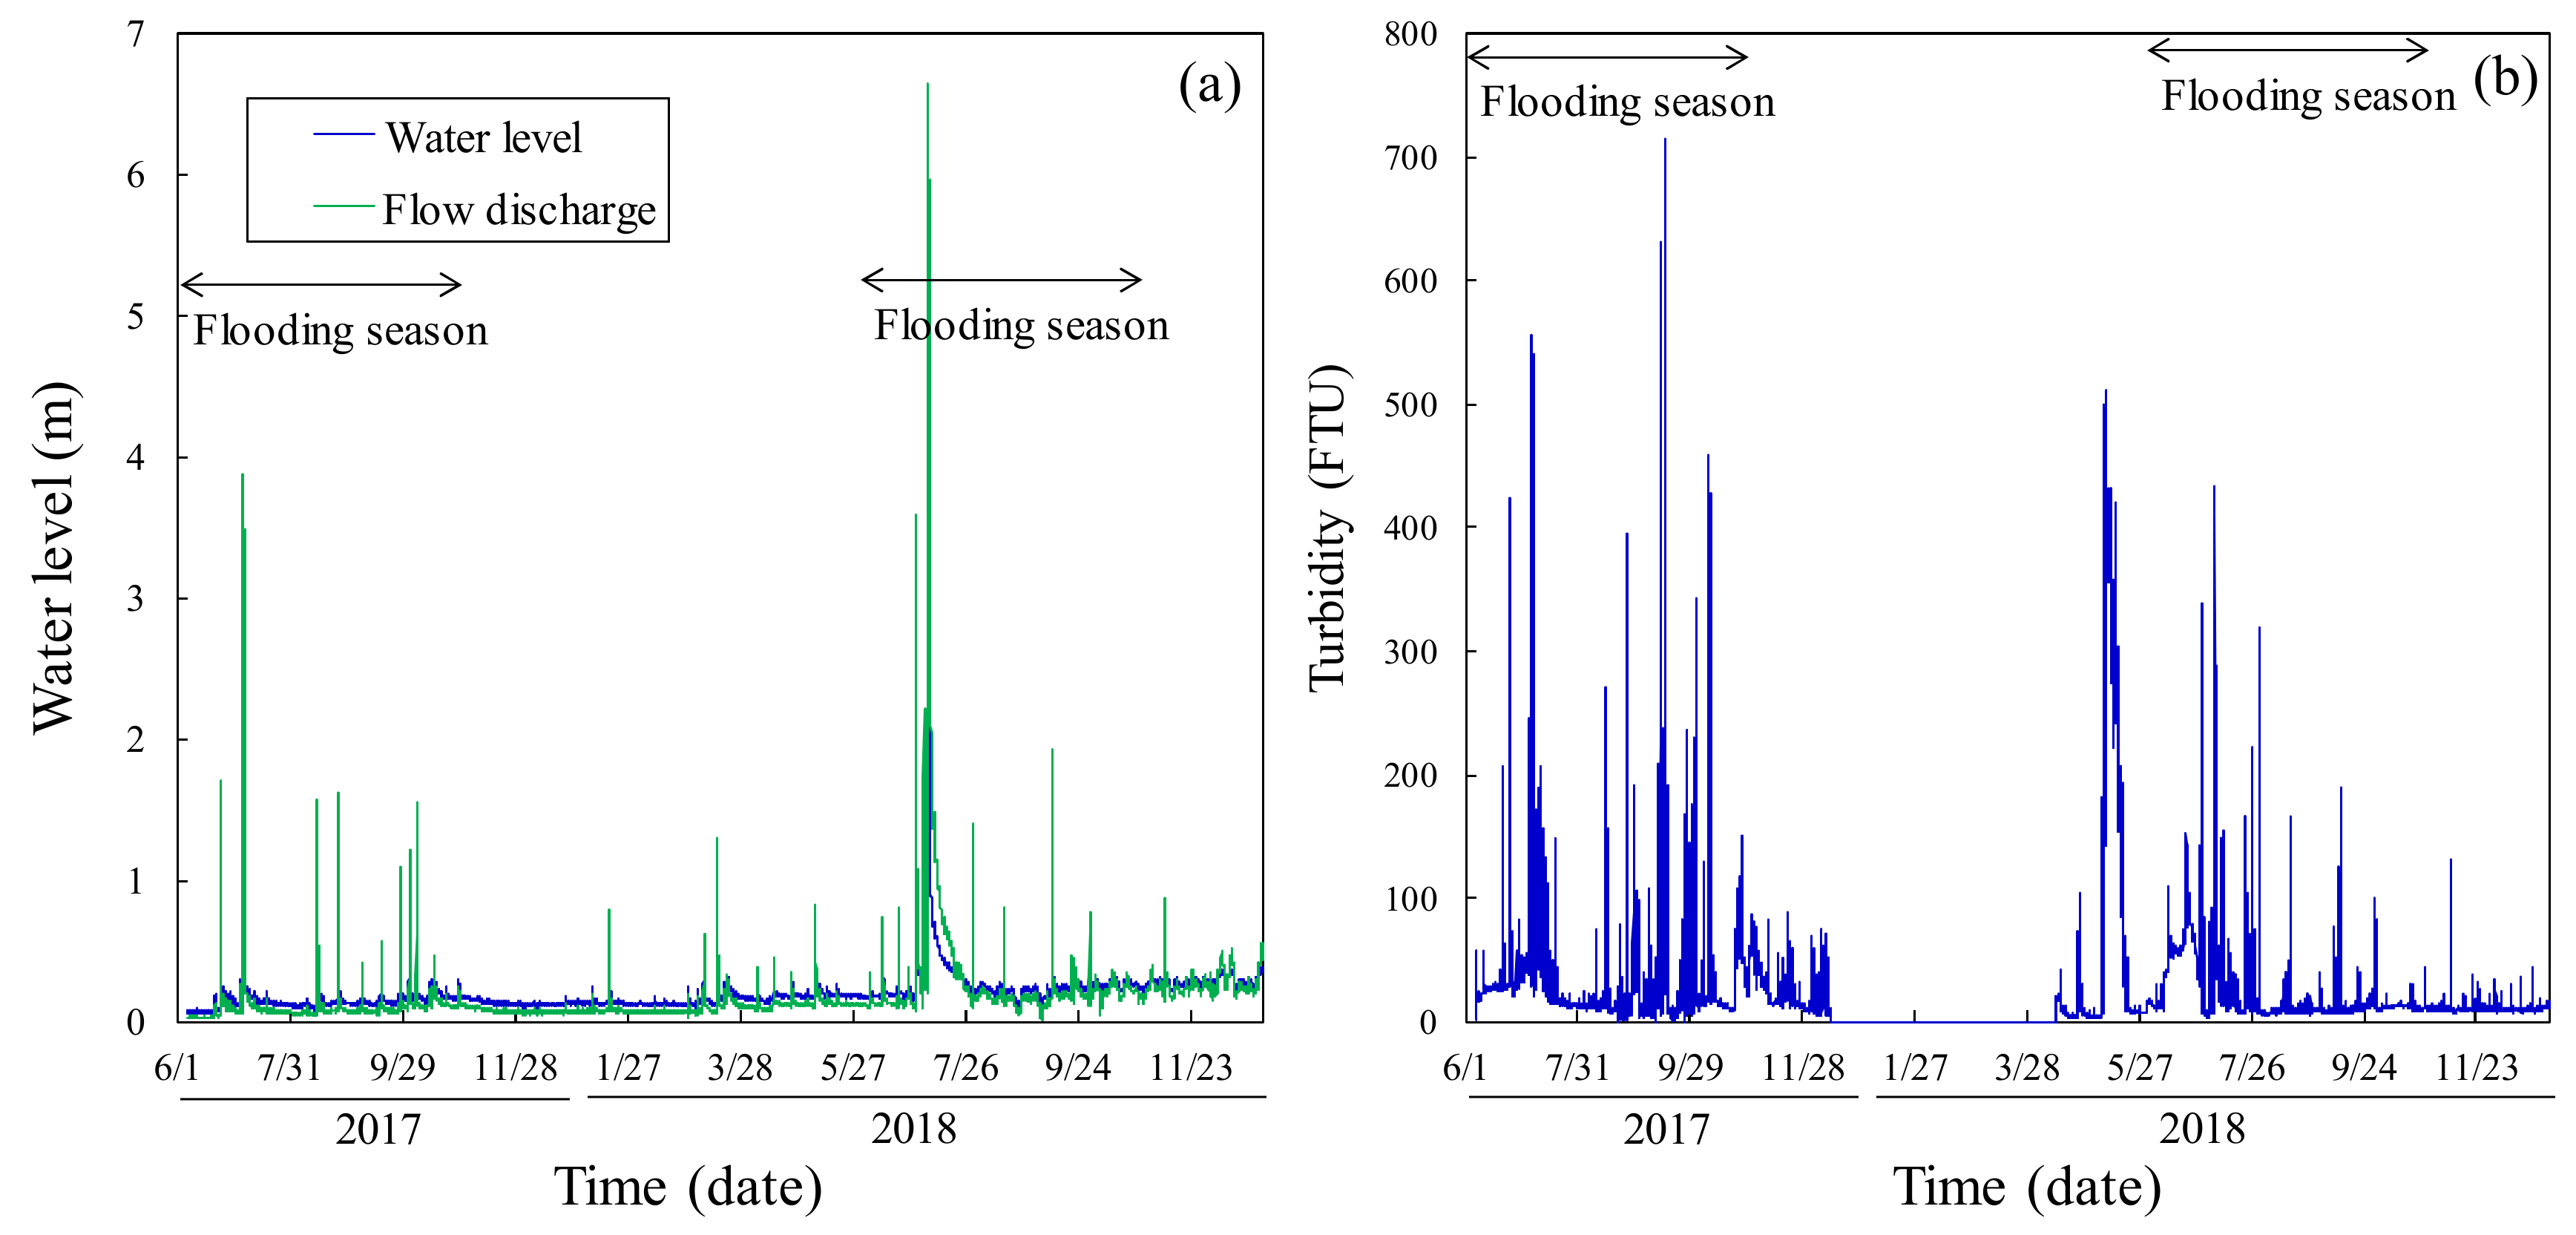
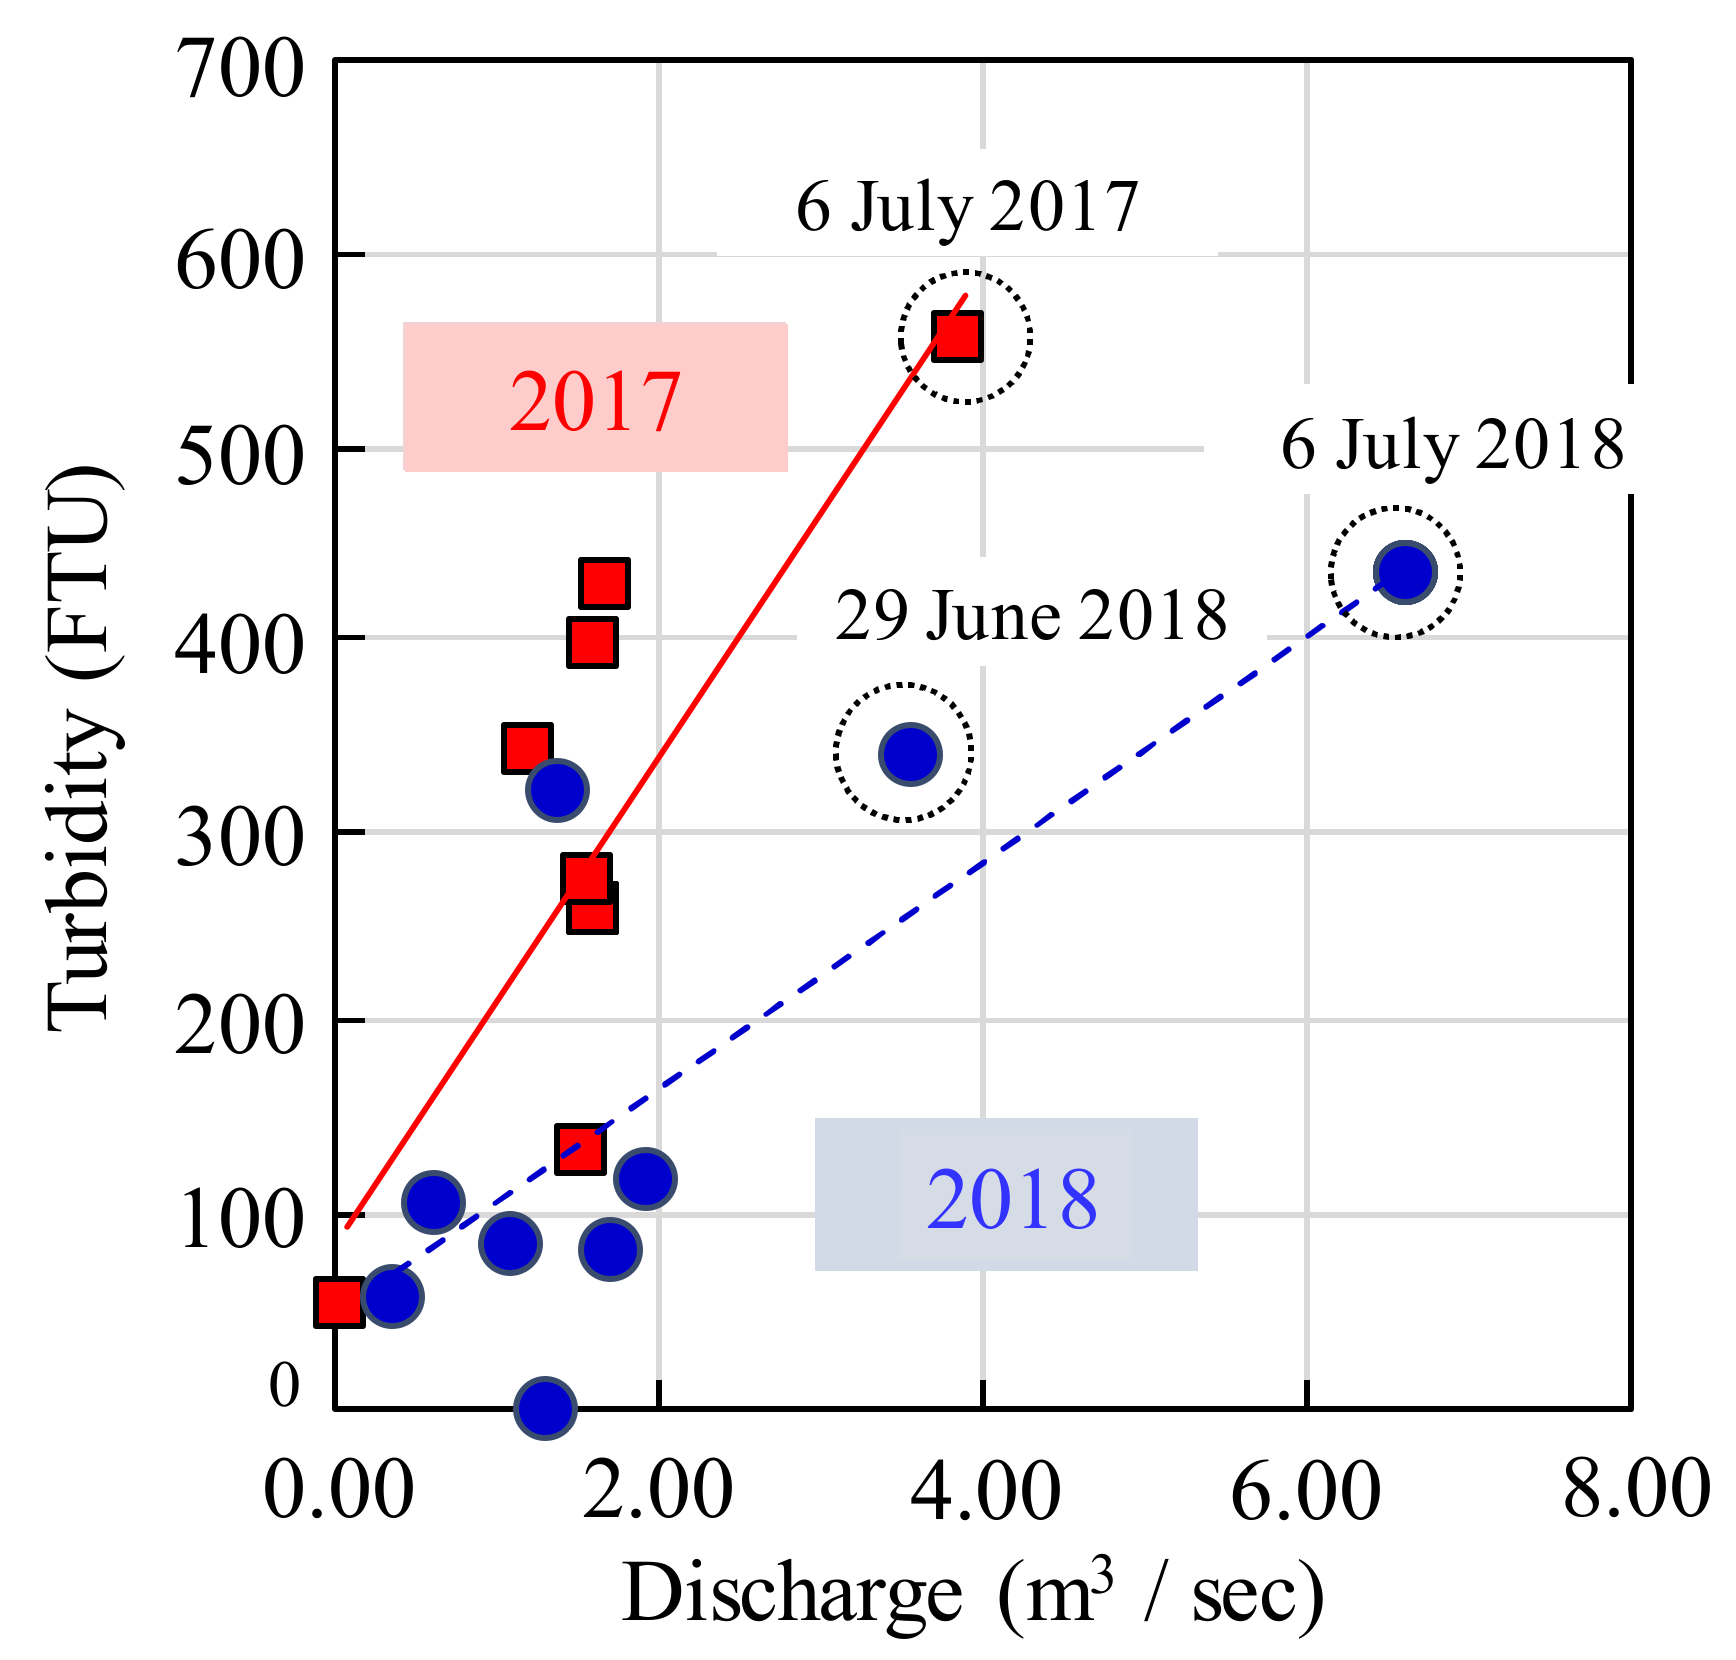
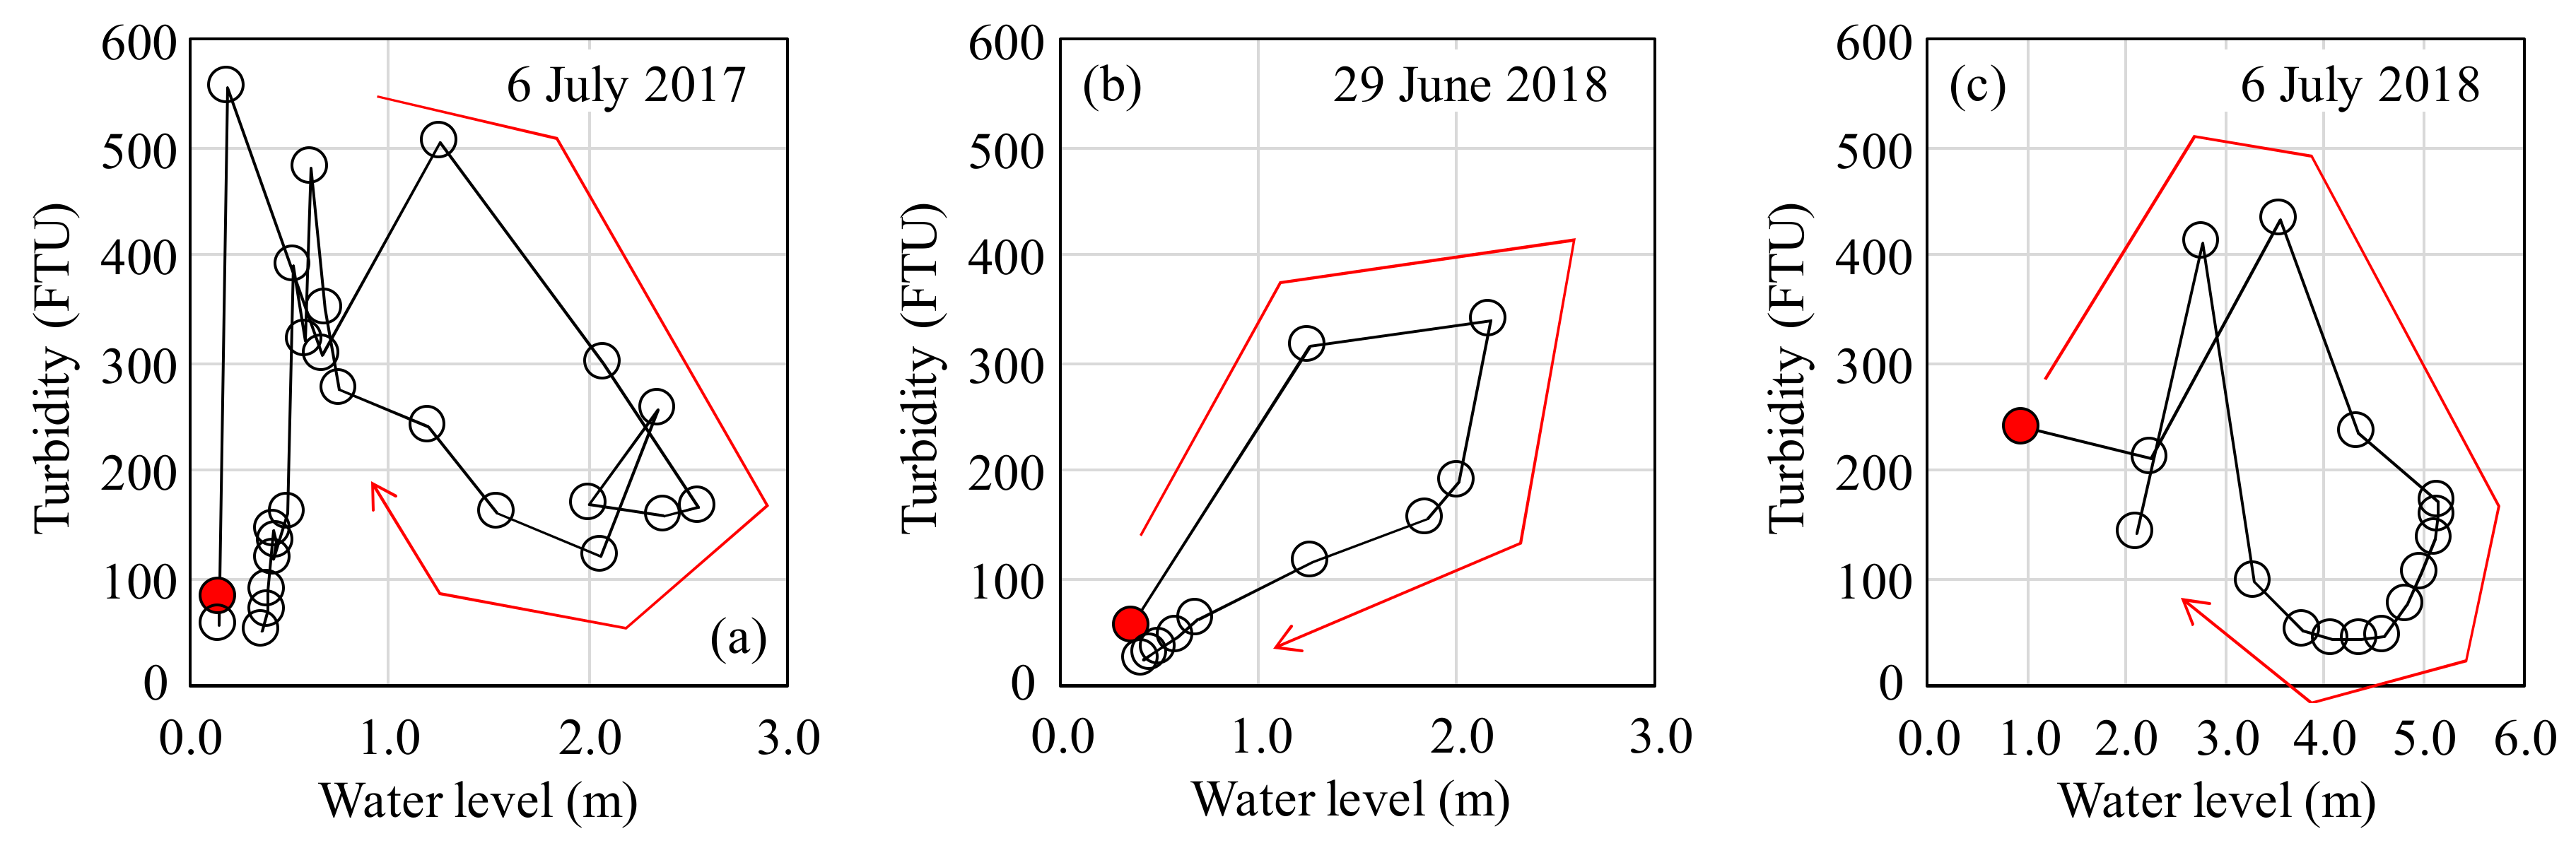
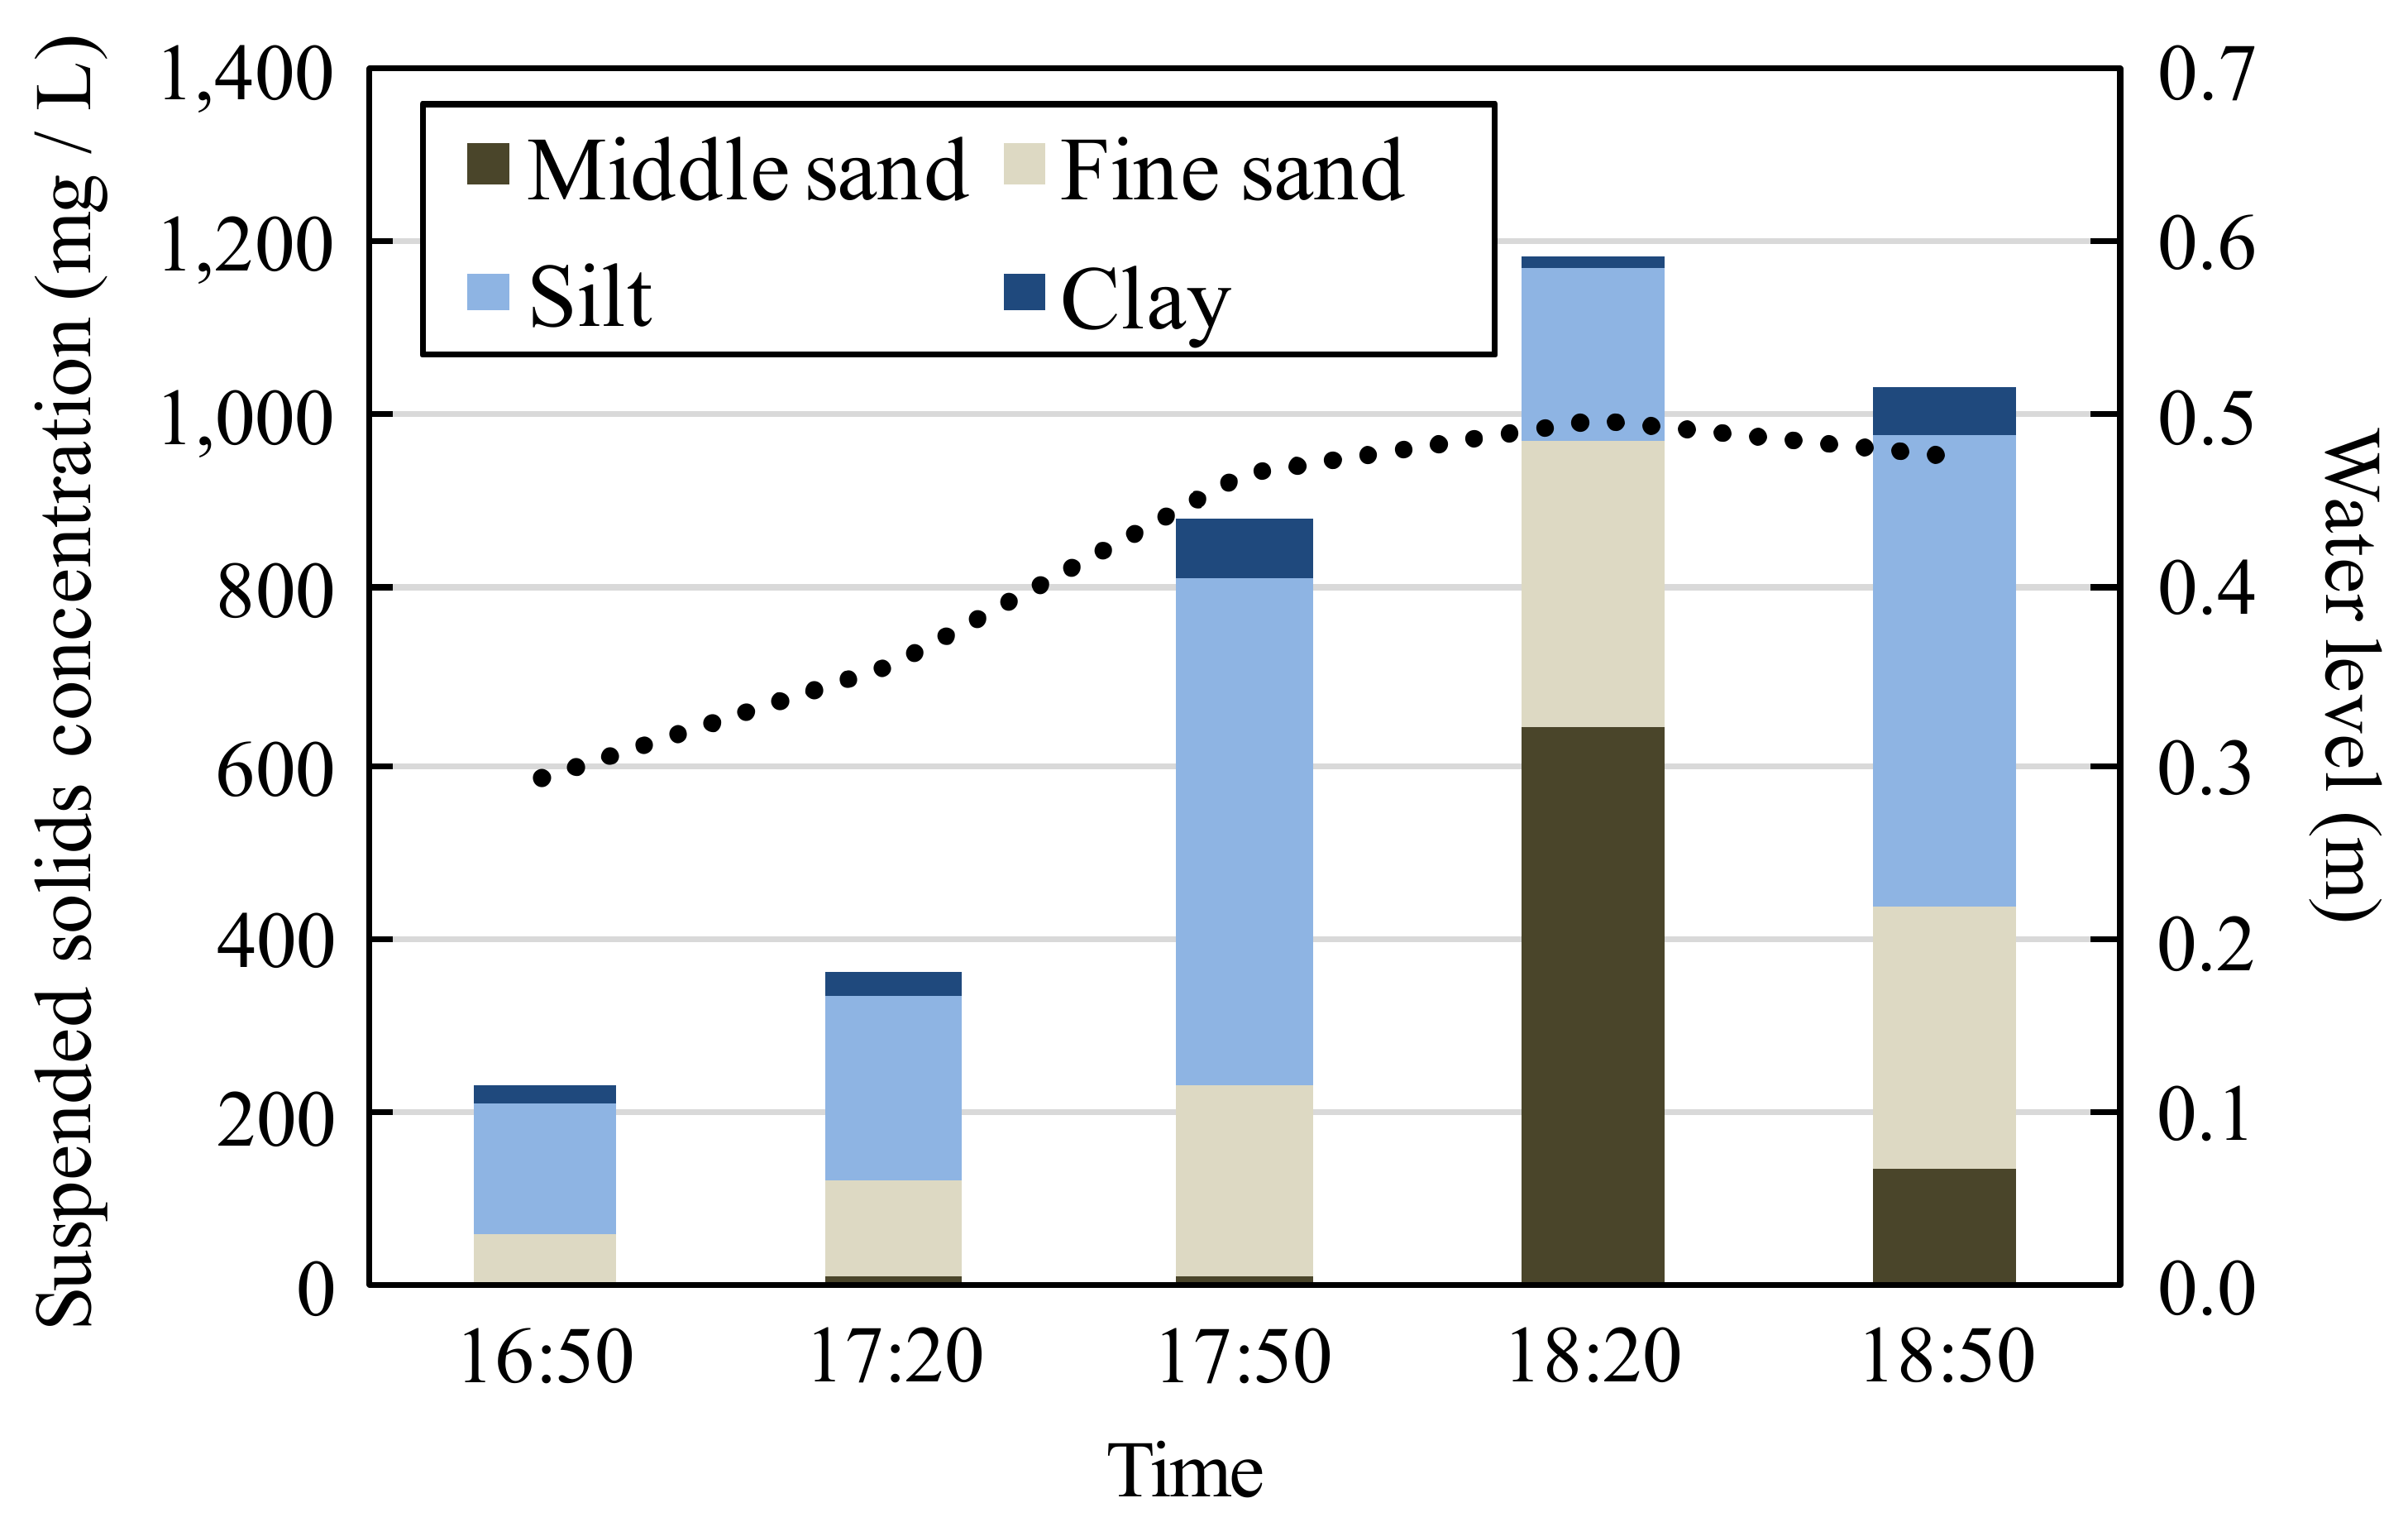
3.2. Characteristics of Sediment Transport
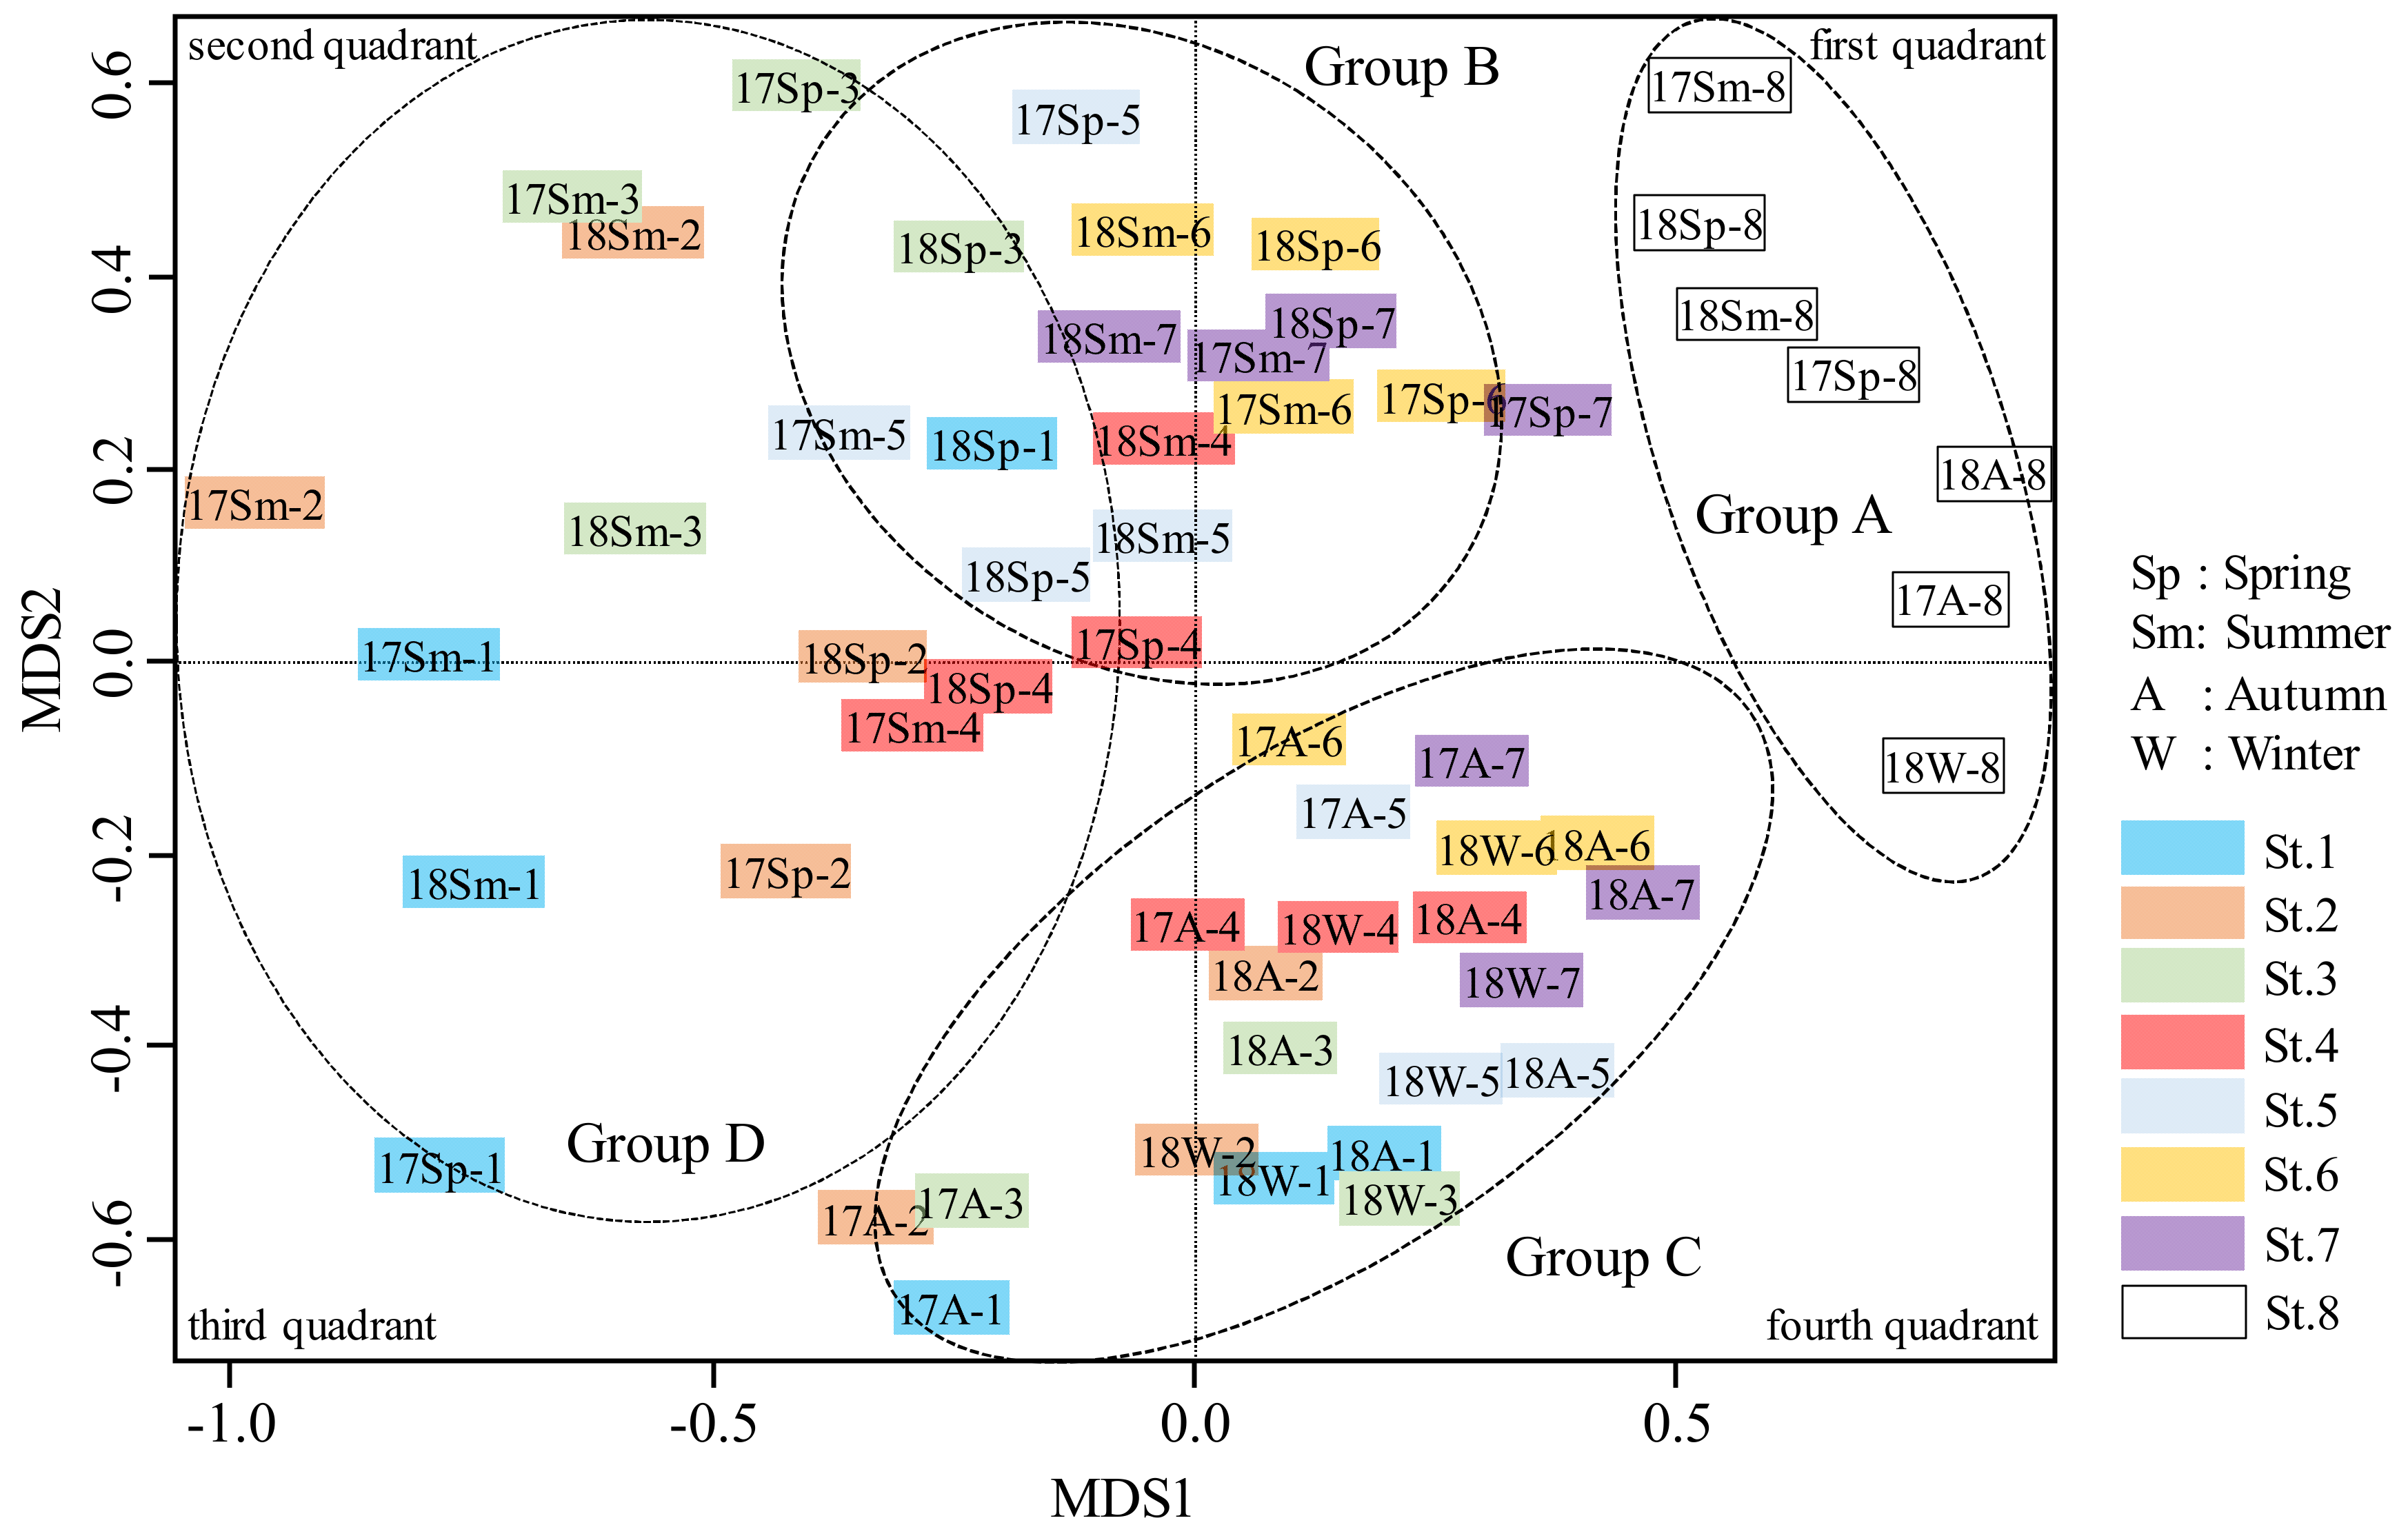
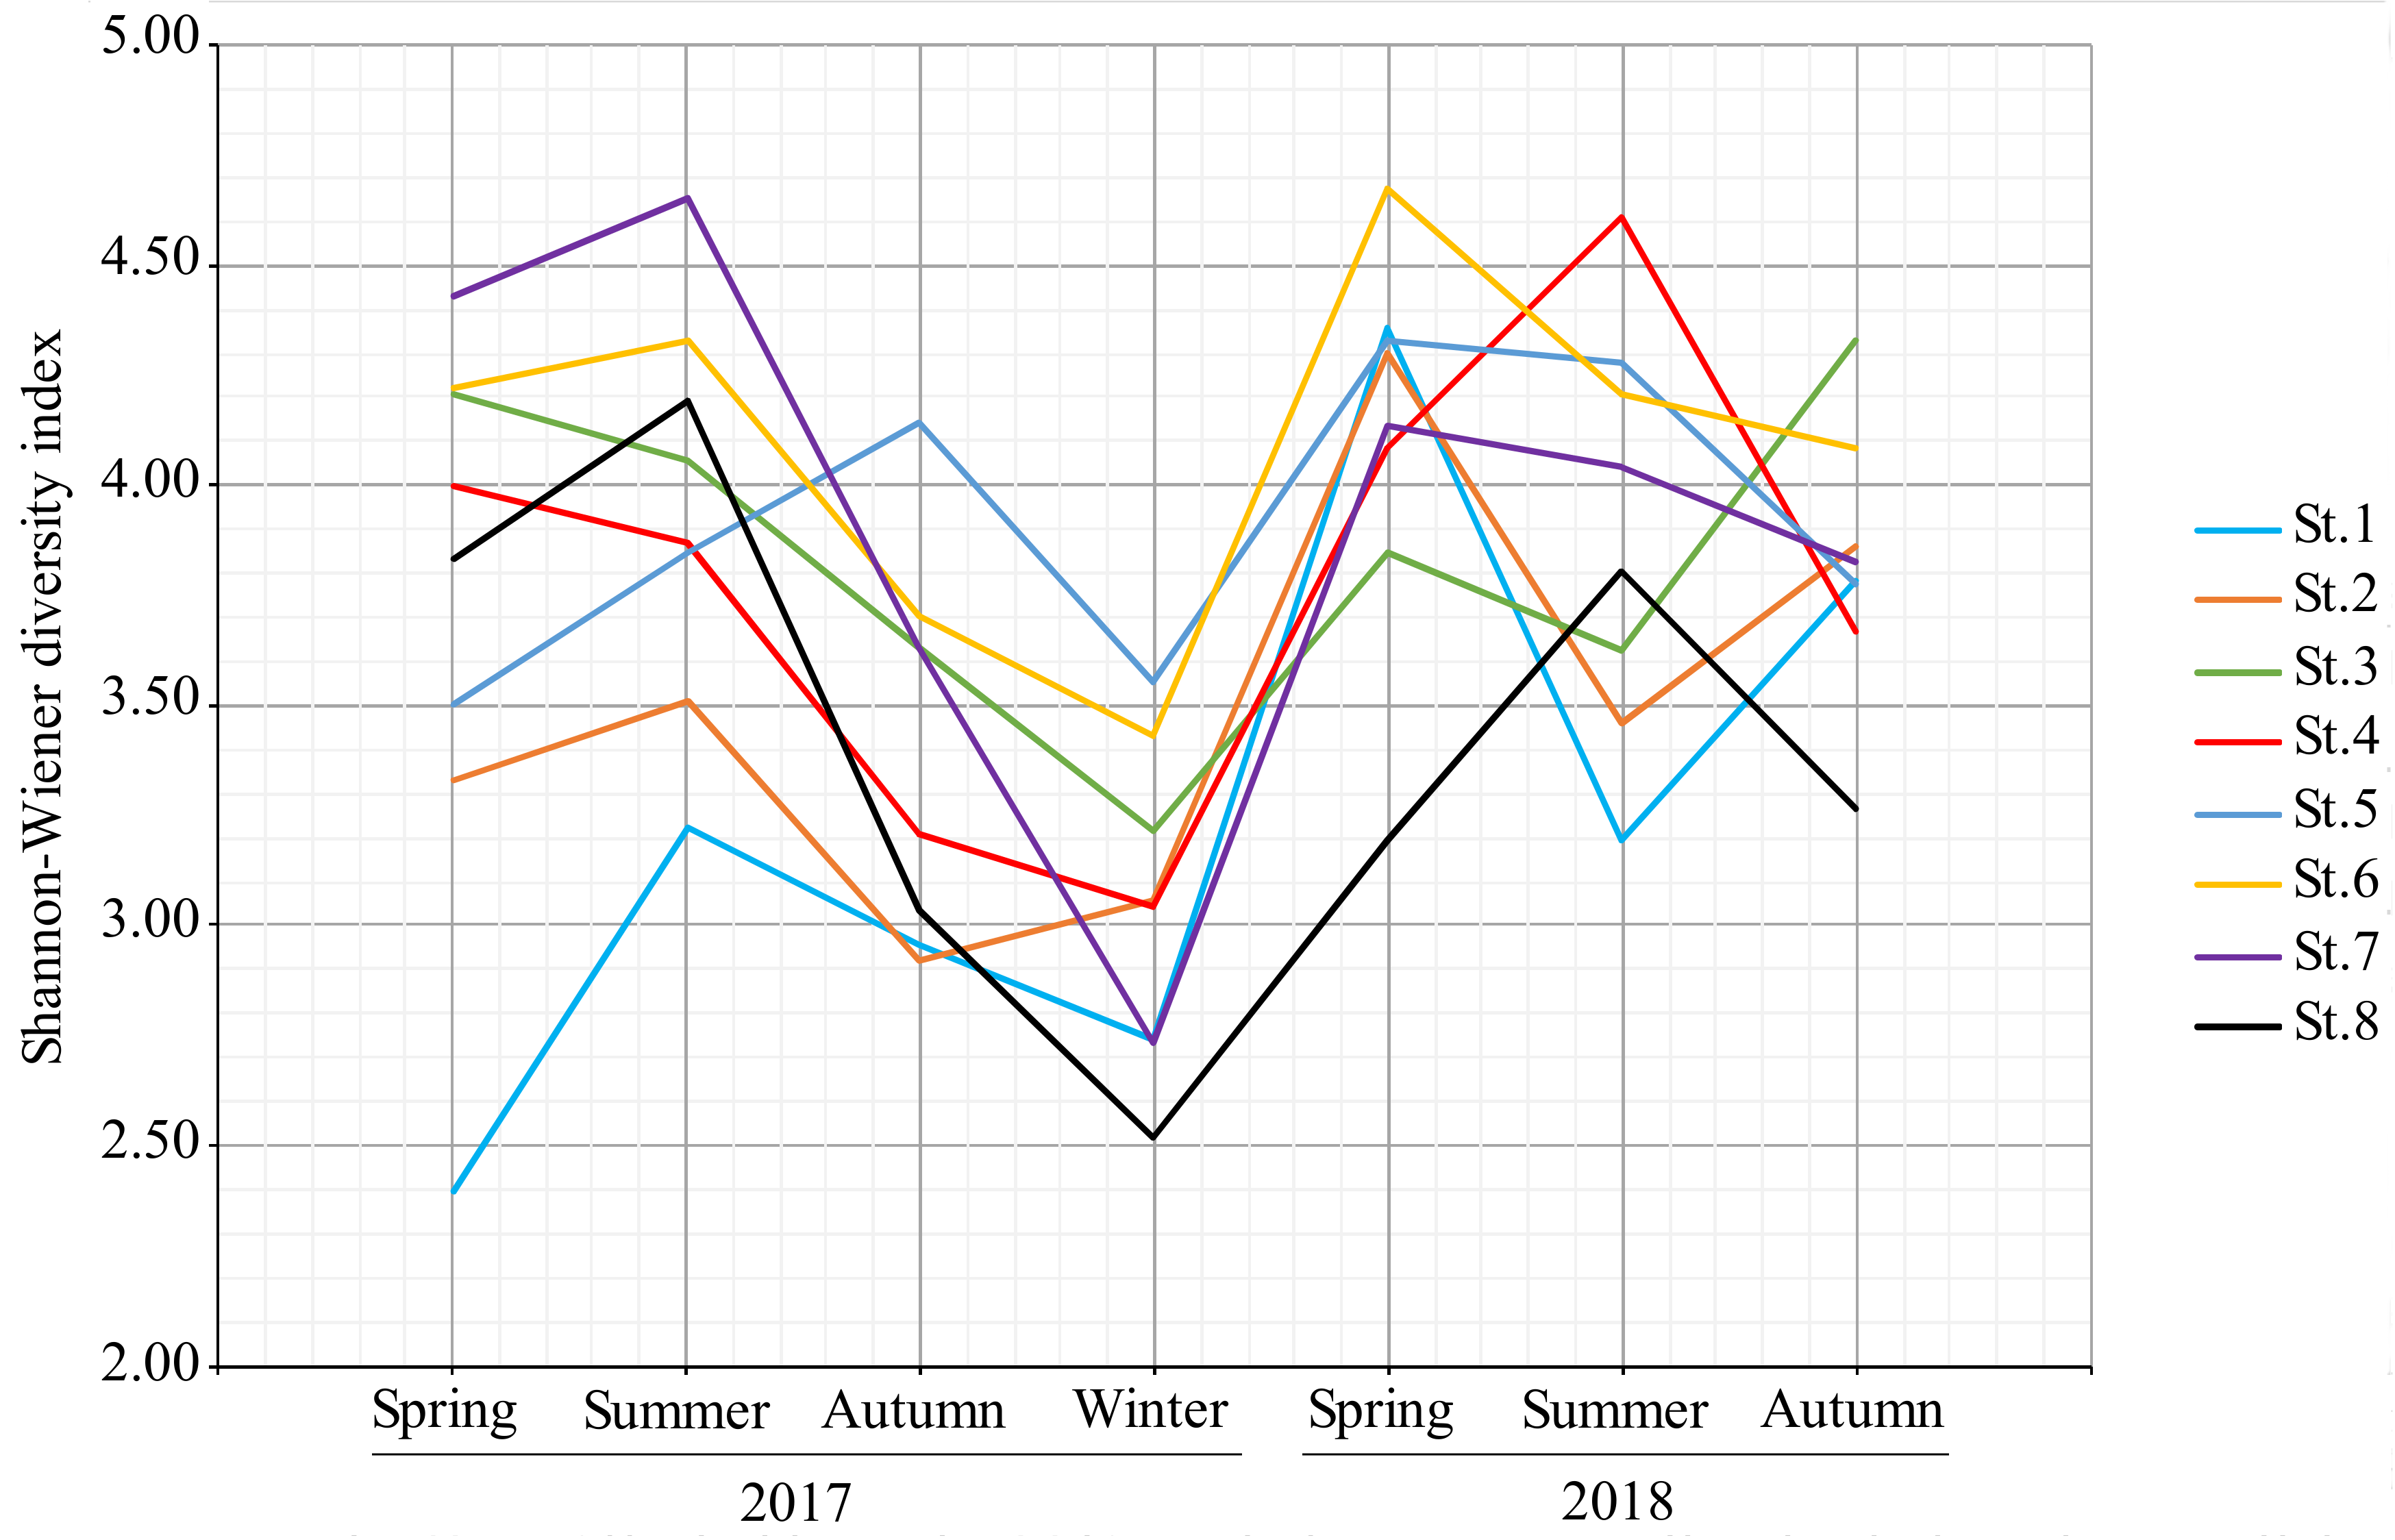
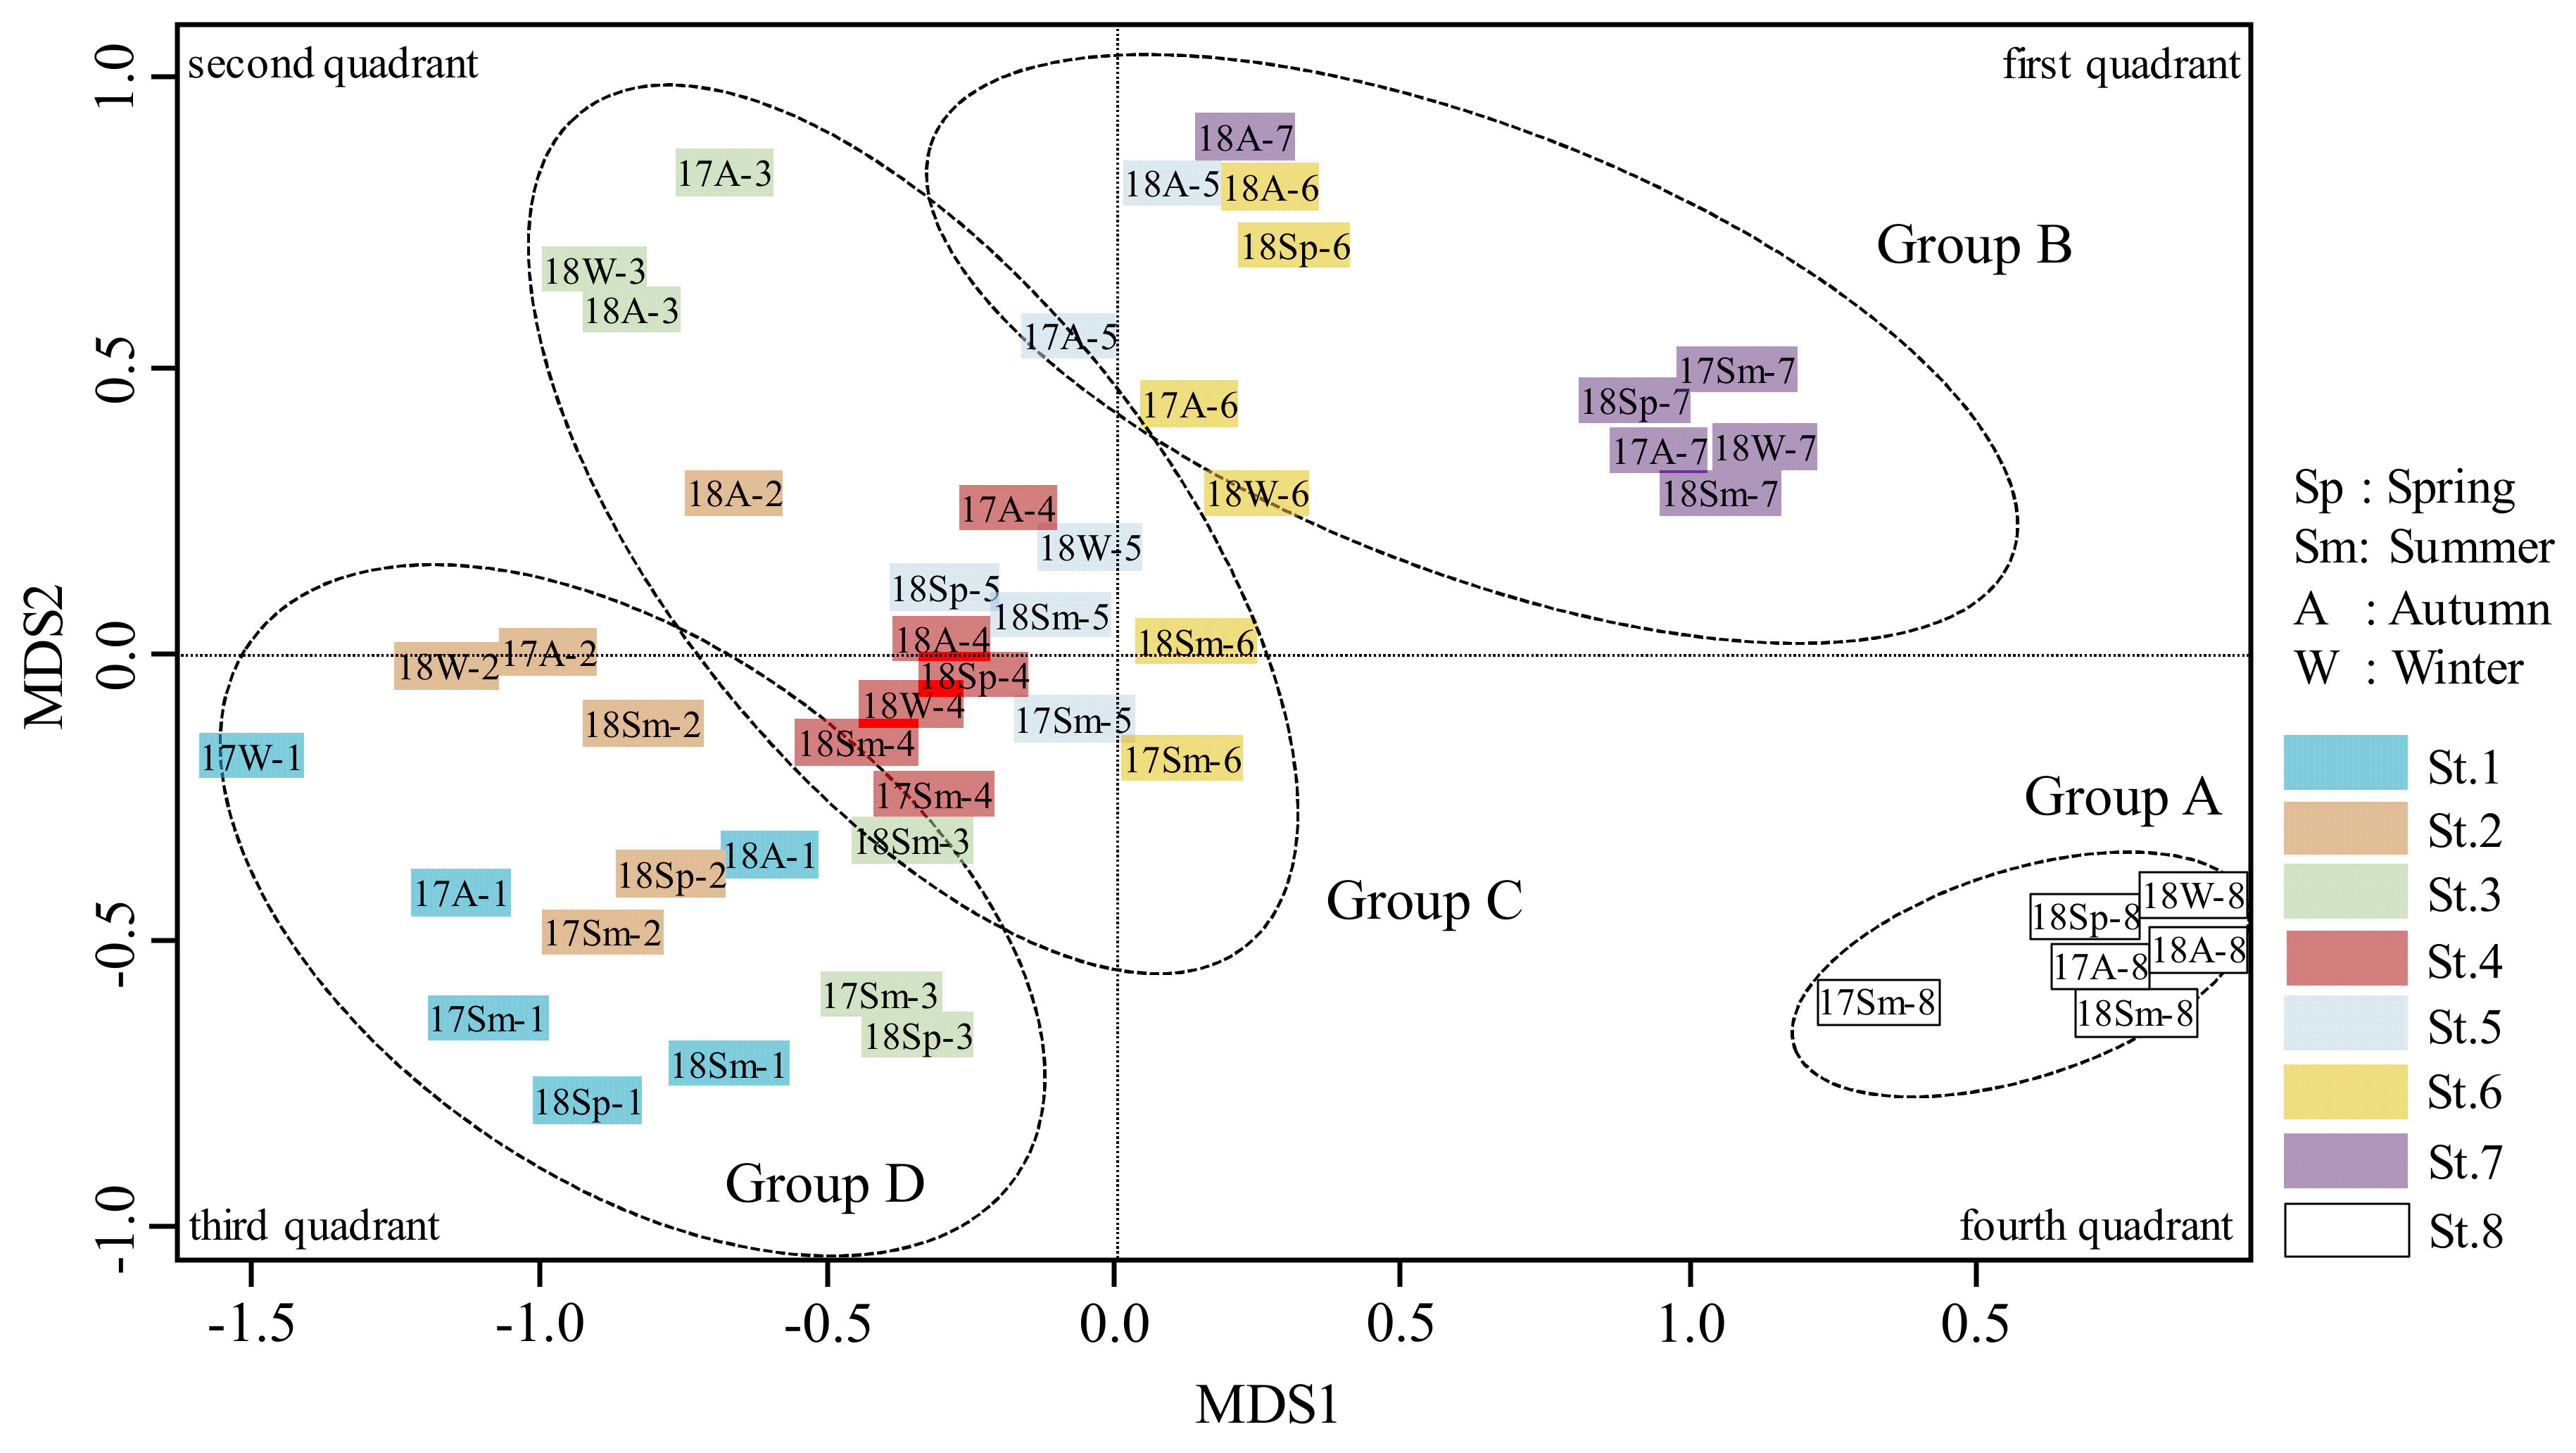
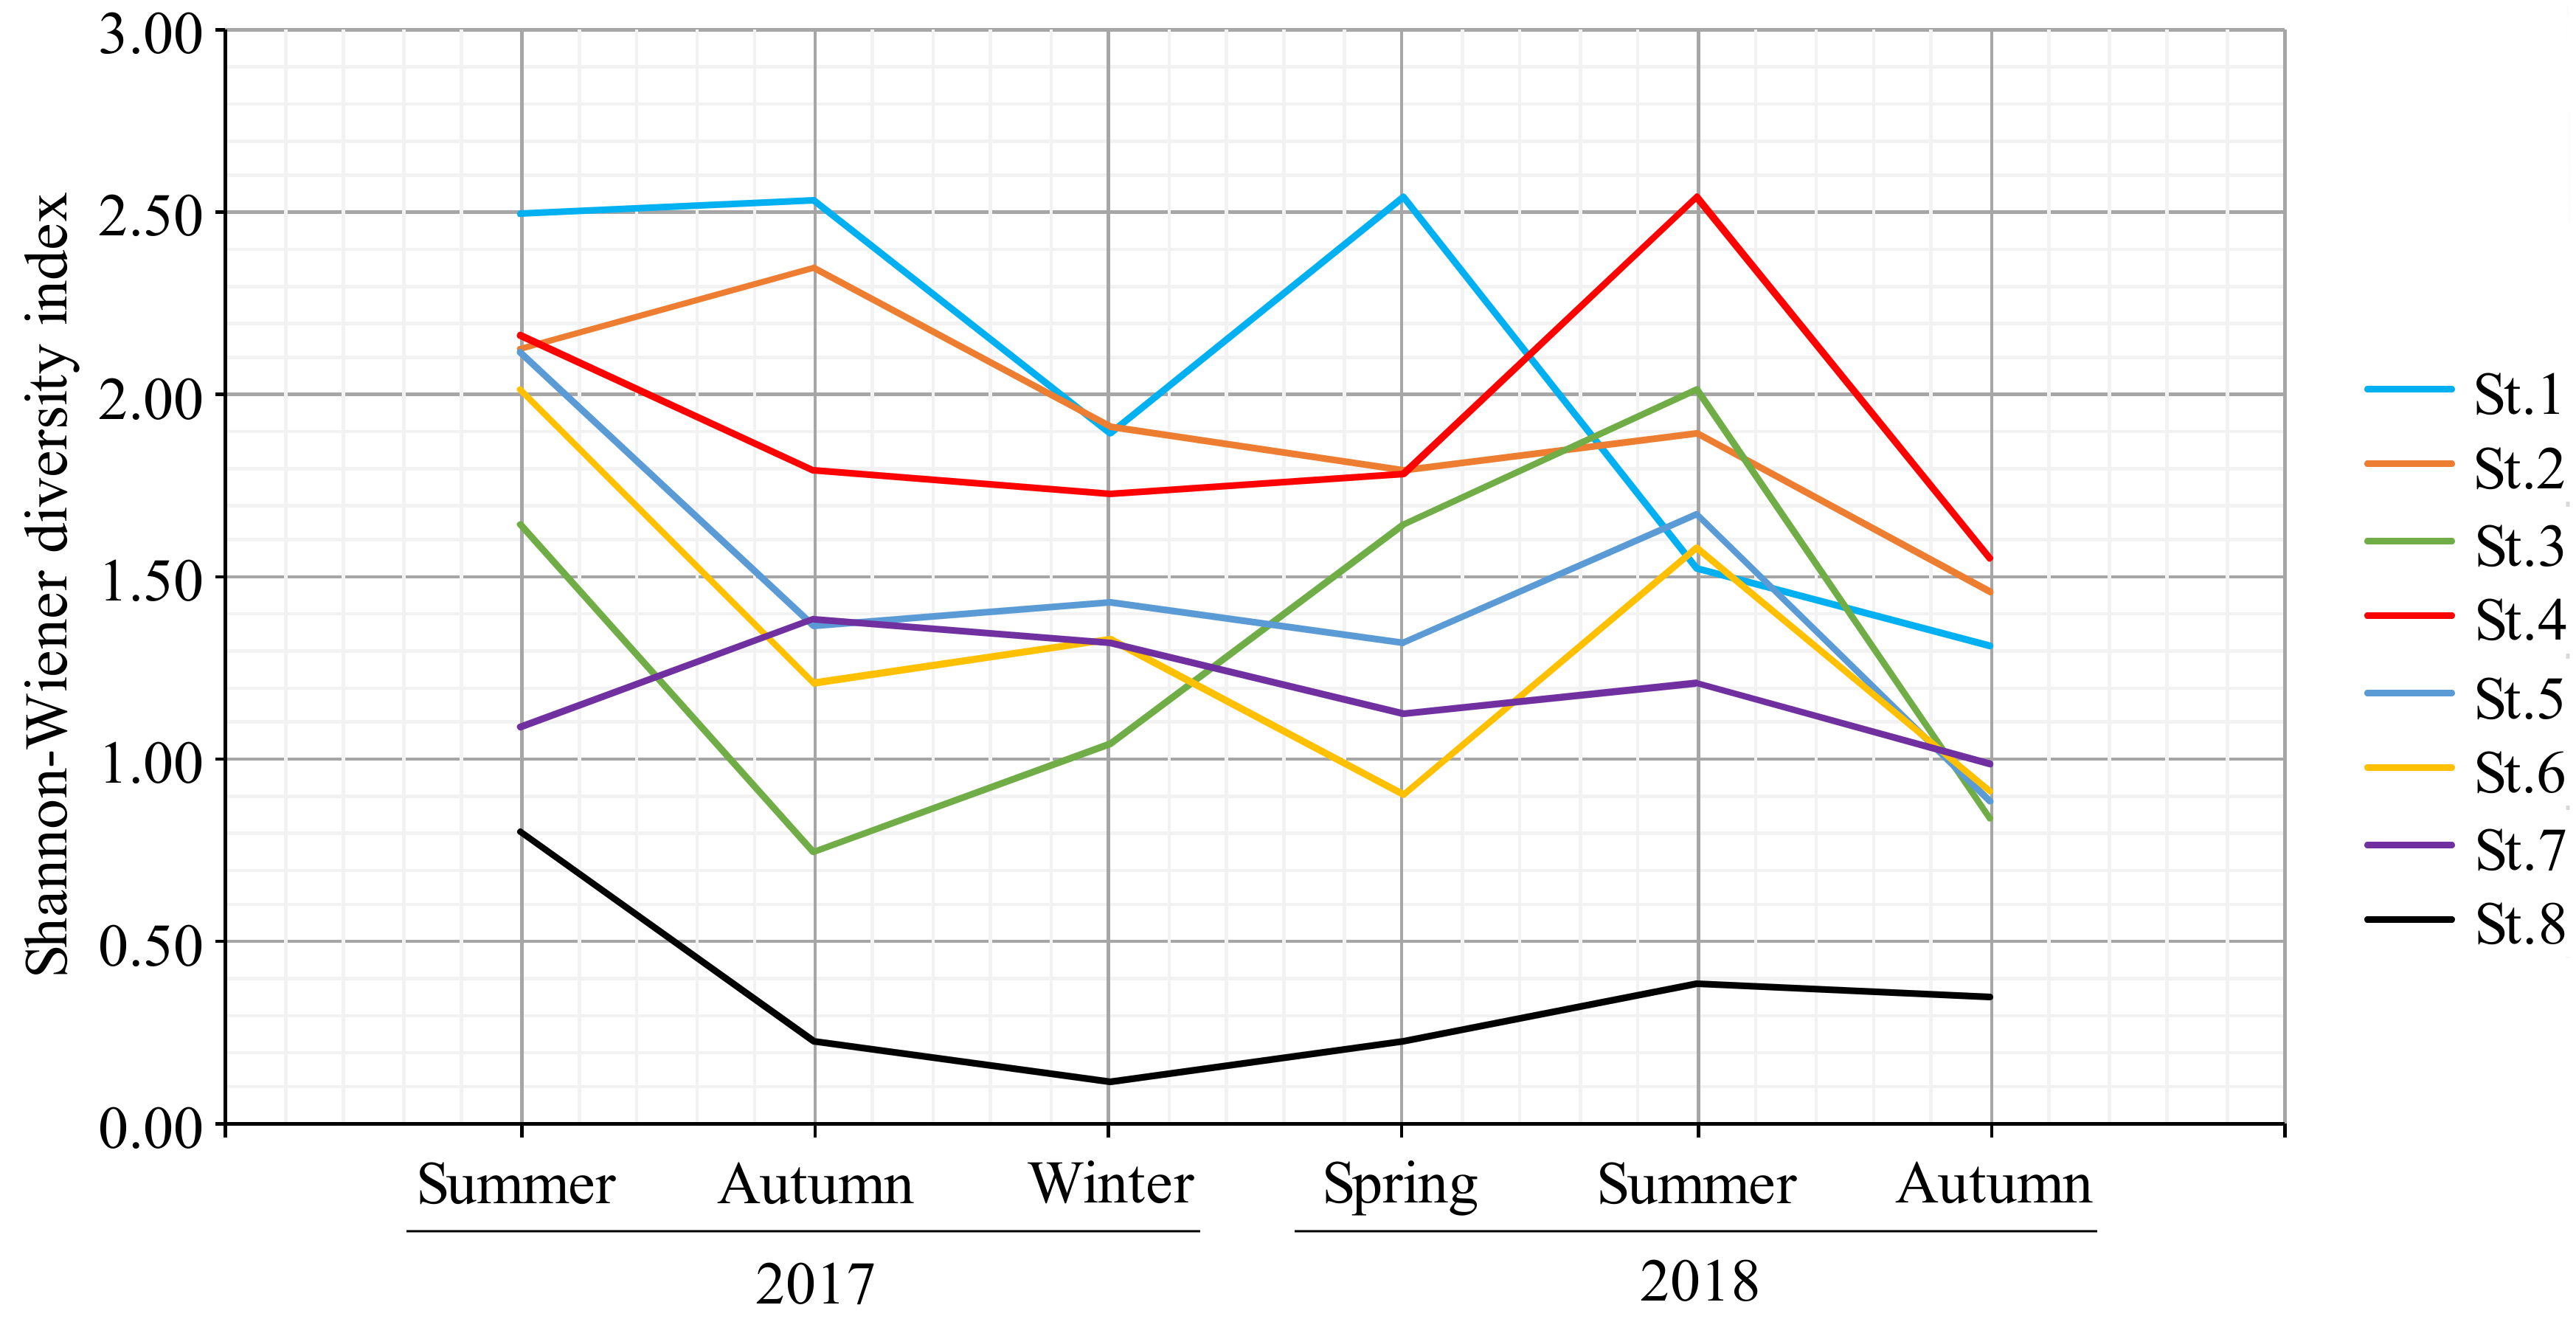
3.3. Seasonal Change of Benthic Macroinvertebrate Assemblage
3.4. Seasonal Variation of Fish Fauna
4. Conclusions
Author Contributions
Funding
Conflicts of Interest
References
- Poff, N.L.; Allan, J.D.; Bain, M.B.; Karr, J.R.; Prestegaard, K.L.; Richter, B.D.; Sparks, R.E.; Stromberg, J.C. The natural flow regime: A paradigm for river conservation and restoration. BioScience 1997, 47, 769–784. [Google Scholar] [CrossRef]
- Tsujimoto, T.; Fujita, K. On scenario-driven research and development toward the integrated management of the river-basin-scale sediment transport system. Adv. River Eng. 2004, 10, 13–18. [Google Scholar]
- Miyamoto, H.; Suzuki, N. Sediment control of a water reservoir at dams. Proc. JSCE. II Hydraul. Sanit. Eng. 2003, 740, 185–195. [Google Scholar]
- Mizuyama, T. Sediment production, transport, sediment control and sabo in river basins. Proc. JSCE. II Hydraul. Sanit. Eng. 2004, 754. [Google Scholar] [CrossRef]
- Center, H. Dam Removal Science and Decision Making; The H. John Heinz III Center for Science, Economics, and the Environment: Washington, DC, USA, 2002. [Google Scholar]
- Pohl, M.M. Bringing down our dams: Trends in American dam removal rationales. J. Am. Water Resour. Assoc. 2002, 38, 1511–1519. [Google Scholar] [CrossRef]
- American Rivers. American Rivers Dam Removal Database 2016. Available online: http://www.americanrivers.org/initiative/dams/projects/2014-dam-removals (accessed on 15 February 2019).
- Sawaske, S.R.; Freyberg, D.L. A comparison of past small dam removals in highly sediment-impacted systems in the U.S. Geomorphology 2012, 151–152, 50–58. [Google Scholar] [CrossRef]
- Grant, G.E.; Lewis, S.L. The remains of the dam: What have we learned from 15 years of us dam removals? Engineering Geology for Society and Territory, 3: River Basins. Reserv. Sediment. Water Resour. 2015, 3, 31–38. [Google Scholar]
- Major, J.J.; East, A.E.; O’Connor, J.E.; Grant, G.E.; Wilcox, A.C.; Magirl, C.S.; Collins, M.J.; Tullos, D.D. Geomorphic responses to dam removal in the United States—A two-decade perspective. In Gravel-Bed Rivers: Processes and Disasters; Tsutsumi, D., Laronne, J., Eds.; Wiley and Sons: Hoboken, NJ, USA, 2017; pp. 355–383. [Google Scholar]
- Pearson, A.J.; Snyder, N.P.; Collins, M.J. Rates and processes of channel response to dam removal with a sand-filled impoundment. Water. Resour. Res. 2011, 47, 7204. [Google Scholar] [CrossRef]
- Wilcox, A.C.; O’Connor, J.E.; Major, J.J. Rapid reservoir erosion, hyperconcentrated flow, and downstream deposition triggered by breaching of 38 m tall Condit Dam, White Salmon River, Washington. J. Geophys. Res. Earth Surf. 2014, 119, 1376–1394. [Google Scholar] [CrossRef] [Green Version]
- Collins, M.J.; Snyder, N.P.; Boardman, G.; Banks, W.S.L.; Andrews, M.; Baker, M.E.; Conlon, M.; Gellis, A.; McClain, S.; Miller, A.; et al. Channel response to sediment release: Insights from a paired analysis of dam removal. Earth Surf. Proc. Land. 2017, 42, 1636–1651. [Google Scholar] [CrossRef]
- Harris, N.; Evans, J.E. Channel Evolution of Sandy Reservoir Sediments Following Low-Head Dam Removal, Ottawa River, Northwestern Ohio, USA. Open J. Mod. Hydrol. 2014, 4, 44–56. [Google Scholar] [CrossRef]
- East, A.E.; Pess, G.R.; Bountry, J.A.; Magirl, C.S.; Ritchie, A.C.; Logan, J.B.; Randle, T.J.; Mastin, M.C.; Minear, J.T.; Duda, J.J.; et al. Large-scale dam removal on the Elwha River, Washington, USA: River channel and floodplain geomorphic change. Geomorphology 2015, 228, 765–786. [Google Scholar] [CrossRef]
- Zunka, J.P.P.; Tullos, D.D.; Lancaster, S.T. Effects of sediment pulses on bed relief in bar-pool channels. Earth Surf. Proc. Land. 2015, 40, 1017–1028. [Google Scholar] [CrossRef]
- Kil, H.K.; Bae, Y.J. Effects of low-head dam removal on benthic macroinvertebrate communities in a Korean stream. Anim. Cells Syst. 2012, 16, 69–76. [Google Scholar] [CrossRef] [Green Version]
- Chiu, M.C.; Yeh, C.H.; Sun, Y.H.; Kuo, M.H. Short-term effects of dam removal on macroinvertebrates in a Taiwan stream. Aquat. Ecol. 2013, 47, 245–252. [Google Scholar] [CrossRef]
- Sullivan, S.M.P.; Manning, D.W.P. Seasonally distinct taxonomic and functional shifts in macroinvertebrate communities following dam removal. PeerJ 2017, 5, e3189. [Google Scholar] [CrossRef] [PubMed]
- Chang, H.Y.; Chiu, M.C.; Chuang, Y.L.; Tzeng, C.S.; Kuo, M.H.; Yeh, C.H.; Wang, H.W.; Wu, S.H.; Kuan, W.H.; Tsai, S.T.; et al. Community responses to dam removal in a subtropical mountainous stream. Aquat. Sci. 2017, 79, 967–983. [Google Scholar] [CrossRef]
- Izzo, L.K.; Maynard, G.A.; Zydlewski, J. Upstream movements of Atlantic salmon in the lower Penobscot River, Maine following two dam removals and fish passage modifications. Mar. Coast. Fish. 2016, 8, 448–461. [Google Scholar] [CrossRef]
- Hogg, R.; Coghlan, S.M.; Zydlewski, J. Anadromous sea lampreys recolonize a maine coastal river tributary after dam removal. Trans. Am. Fish. Soc. 2013, 142, 1381–1394. [Google Scholar] [CrossRef]
- Gillette, D.P.; Daniel, K.; Redd, C. Fish and Benthic Macroinvertebrate Assemblage Response to Removal of a Partially Breached Lowhead Dam. River Res. Appl. 2016, 32, 1776–1789. [Google Scholar] [CrossRef]
- Shaffer, J.A.; Juanes, F.; Quinn, T.P.; Parks, D.; McBride, T.; Michel, J.; Naumann, C.; Hocking, M.; Byrnes, C. Nearshore fish community responses to large scale dam removal: Implications for watershed restoration and fish management. Aquat. Sci. 2017, 79, 643–660. [Google Scholar] [CrossRef]
- Poulos, H.M.; Chernoff, B. Effects of Dam Removal on Fish Community Interactions and Stability in the Eightmile River System, Connecticut, USA. Environ. Manag. 2017, 59, 249–263. [Google Scholar] [CrossRef]
- Ohtsuki, K.; Iyooka, H.; Nihei, Y.; Yoshimori, Y.; Nakamura, S.; Onikura, N. Sediment erosion and deposition in the former Arase dam reservoir under the dam removal project. Ann. J. Hydraul. Eng. JSCE 2016, 72, I_853–I_858. [Google Scholar]
- Ohmoto, T.; Hirakawa, R. Studies of Arase dam for streambed sediment and flow configuration. Ann. J. Hydraul. Eng. JSCE 2013, 72, I_1057–I_1062. [Google Scholar]
- Ohtsuki, K.; Kawasaki, T.; Nihei, Y.; Onikura, N. Non-uniform suspended-sediment transport in Kumagawa river under flooding conditions. Ann. J. Hydraul. Eng. JSCE 2013, 69, I_1063–I_1068. [Google Scholar]
- Kobayashi, S.; Sumi, T.; Takemon, Y. Habitat function of a gravel bar formed downstream after a dam removal. Adv. River Eng. 2016, 22, 463–468. [Google Scholar]
- Shirakawa, T.; Gouda, M.; Takimoto, T.; Takahashi, E. Channel responses to sediment replenishment to downstream rivers in Nagayasuguchi Dam reservoir sedimentation management. Civ. Eng. J. 2016, 58, 36–41. [Google Scholar]
- Okano, M.; Kikui, M.; Ishida, H.; Sumi, T. Study on Reservoir Sediment Excavation Management and Sediment Replenishment to Downstream Rivers. J. Jpn. Soc. Dam Eng. 2005, 15, 200–215. [Google Scholar]
- Musashi, Y.; Shiuchi, M.; Yamashita, M.; Takebayashi, H.; Yuki, T.; Kamata, M.; Akamatsu, Y.; Kawaguchi, Y.; Nakata, Y. Development of numerical model on transport process of replenished sediment and its application. Ann. J. Hydraul. Eng. JSCE 2011, 67, I_817–I_822. [Google Scholar] [CrossRef]
- Tashiro, T.; Okuda, C.; Tsujimoto, T. Impacts of riverbed armoring below dam and their mitigation due to gravel addition on habitat of benthic fish community. Ann. J. Hydraul. Eng. JSCE 2014, 70, I_1321–I_1326. [Google Scholar]
- Yamada, K.; Tashiro, T.; Tsujimoto, T. Effects of sediment replenishment on stream ecosystem below dam and reservoir: Their verification with particulate organic matters, aquatic organisms and their stable isotope ratios of carbon and nitrogen. Limnol. Tokai Reg. Jpn. 2014, 64, 11–21. [Google Scholar]
- Nishita, M.; Azami, K.; Ishizawa, N.; Kumazawa, K.; Nakazawa, S. Changes in physical habitat and benthic animals in the Miharu Dam downstream river in response to river regulation and sediment replenishment after initial impoundment: The result of 11 years monitoring. Ecol. Civ. Eng. 2011, 14, 63–74. [Google Scholar] [CrossRef]
- Tanaka, N.; Furusato, E. Annual changes in community dynamics of invertebrate in gravel bed river downstream of a dam and the change in movability of bed material in low flow channel after artificial sand supply. Ann. J. Hydraul. Eng. JSCE 2014, 70, I_1327–I_1332. [Google Scholar]
- Katano, I.; Negishi, J.; Minagawa, T.; Doi, H.; Kayaba, Y. Extraction of indicator species to test restoration effects by sediment replenishments in downstream reaches of dam. Adv. River Eng. 2010, 16, 519–522. [Google Scholar]
- Sakka, S.; Takeuchi, H.; Aoshima, D.; Saito, A. Investigation on the characteristics of sediment outflow during a flood at the dry dam. J. Jpn. Soc. Dam Eng. 2009, 19, 29–40. [Google Scholar]
- Sumi, T.; Ishida, H.; Satake, Y. Sediment transport monitoring in in-stream flood mitigation dam by RFID technology. Ann. J. Hydraul. Eng. JSCE 2012, 68, I_1071–I_1076. [Google Scholar]
- Murakami, T.; Hodoki, Y. Comparison of Population Density and Species Composition of Aquatic Insect between the Upstream and Downstream Reaches of a Flood Control Dam without Impoundment; A Case Study of the Masuda-gawa Dam in Shimane Prefecture. Jpn. J. Nagoya Women’s Univ. Home Econ. Nat. Sci. Humanit. Soc. Sci. 2011, 57, 75–79. [Google Scholar]
- Itsukushima, R.; Ohtsuki, K.; Sato, T.; Tanaka, W. Sediment properties in steep stream associated with the sediment replenishment by check dam drain outlet opening. Ann. J. Hydraul. Eng. JSCE 2018, 62, I_913–I_918. [Google Scholar] [CrossRef]
- Japanese Standards Association. JIS K 0102 Testing Methods for Industrial Wastewater; Japanese Standards Association: Tokyo, Japan, 2008. [Google Scholar]
- Minchin, P.R. An evaluation of the relative robustness of techniques for ecological ordination. Vegetatio 1987, 69, 89–107. [Google Scholar] [CrossRef]
- Bray, J.R.; Curtis, J.T. An ordination of upland forest communities of southern Wisconsin. Ecol. Monogr. 1957, 27, 325–349. [Google Scholar] [CrossRef]
- Whittaker, R.H. Evolution and measurement of species diversity. Taxon 1972, 21, 213–251. [Google Scholar] [CrossRef]
- Evans, J.E.; Mackey, S.D.; Gottgens, J.F.; Gill, W.M. Lessons from a dam failure. Ohio J. Sci. 2000, 100, 121–131. [Google Scholar]
- Burroughs, B.A.; Hayes, D.B.; Klomp, K.D.; Hansen, J.F.; Mistak, J. Effects of Stronach Dam removal on fluvial geomorphology in the Pine River, Michigan, United States. Geomorphology 2009, 110, 96–107. [Google Scholar] [CrossRef]
- Foley, M.M.; Bellmore, J.R.; O’Connor, J.E.; Duda, J.J.; East, A.E.; Grant, G.E.; Anderson, C.W.; Bountry, J.A.; Collins, M.J.; Connolly, P.J.; et al. Dam removal: Listening in. Water Resour. Res. 2017, 53, 5229–5246. [Google Scholar] [CrossRef] [Green Version]
- Ferrer-Boix, C.; Martín-Vide, J.P.; Parker, G. Channel evolution after dam removal in a poorly sorted sediment mixture: Experiments and numerical model. Water Resour. Res. 2014, 50, 8997–9019. [Google Scholar] [CrossRef] [Green Version]
- Ibisate, A.; Ollero, A.; Ballarín, D.; Horacio, J.; Mora, D.; Mesanza, A.; Ferrer-Boix, C.; Acín, V.; Granado, D.; Martín-Vide, J.P. Geomorphic monitoring and response to two dam removals: Rivers Urumea and Leitzaran (Basque Country, Spain). Earth Surf. Proc. Land. 2016, 41, 2239–2255. [Google Scholar] [CrossRef]
- Randle, T.J.; Bountry, J.A.; Ritchie, A.; Wille, K. Large-scale dam removal on the Elwha River, Washington, USA: Erosion of reservoir sediment. Geomorphology 2015, 246, 709–728. [Google Scholar] [CrossRef]
- Hatano, K.; Takemon, Y.; Ikebuchi, S. Evaluation of the impact of water-storage dam on lower river ecosystems-Response of the substrate structure and benthos communities. Disaster Prev. Res. Inst. Annu. B 2003, 46, 851–866. [Google Scholar]
- Fuller, R.L.; Griego, C.; Muehlbauer, J.D.; Dennison, J.; Doyle, M.W. Response of stream macroinvertebrates in flow refugia and high-scour areas to a series of floods: A reciprocal replacement study. J. N. Am. Benthol. Soc. 2010, 29, 750–760. [Google Scholar] [CrossRef]
- Stanley, E.H.; Luebke, M.A.; Doyle, M.W.; Marshall, D.W. Short-term changes in channel form and macroinvertebrate communities following low-head dam removal. J. N. Am. Benthol. Soc. 2002, 21, 172–187. [Google Scholar] [CrossRef]
- Loosanoff, V.L.; Tommers, F.D. Effect of suspended silt and other substances on rate of feeding of oysters. Science 1948, 107, 69–70. [Google Scholar] [CrossRef] [PubMed]
- Auld, A.H.; Schubel, J.R. Effects of suspended sediment on fish eggs and larvae: A laboratory assessment. Estuar. Coast. Mar. Sci. 1978, 6, 153–164. [Google Scholar] [CrossRef]
- Hori, M.; Wakabayashi, H.; Yamamoto, K.; Kato, S.; Kojima, T. Assessment of influence of sediment flushing from dam on fishery products. Bull. Soc. Sea Water Sci. Jpn. 2007, 61, 352–359. [Google Scholar]


© 2019 by the authors. Licensee MDPI, Basel, Switzerland. This article is an open access article distributed under the terms and conditions of the Creative Commons Attribution (CC BY) license (http://creativecommons.org/licenses/by/4.0/).
Share and Cite
Itsukushima, R.; Ohtsuki, K.; Sato, T.; Kano, Y.; Takata, H.; Yoshikawa, H. Effects of Sediment Released from a Check Dam on Sediment Deposits and Fish and Macroinvertebrate Communities in a Small Stream. Water 2019, 11, 716. https://doi.org/10.3390/w11040716
Itsukushima R, Ohtsuki K, Sato T, Kano Y, Takata H, Yoshikawa H. Effects of Sediment Released from a Check Dam on Sediment Deposits and Fish and Macroinvertebrate Communities in a Small Stream. Water. 2019; 11(4):716. https://doi.org/10.3390/w11040716
Chicago/Turabian StyleItsukushima, Rei, Kazuaki Ohtsuki, Tatsuro Sato, Yuichi Kano, Hiroshi Takata, and Hiroaki Yoshikawa. 2019. "Effects of Sediment Released from a Check Dam on Sediment Deposits and Fish and Macroinvertebrate Communities in a Small Stream" Water 11, no. 4: 716. https://doi.org/10.3390/w11040716