Hydrogeochemical Evaluation of Groundwater and Its Suitability for Domestic Uses in Halabja Saidsadiq Basin, Iraq


1
Groundwater Directorate of Sulaimani, Kurdistan Region 46001, NE, Iraq
2
Division of Mining and Geotechnical Engineering, Department of Civil, Environmental and Natural Resources and Engineering, Lulea University of Technology, 971 87 Luleå, Sweden
3
Department of Geology, University of Sulaimani, Kurdistan Region 46001, NE, Iraq
4
Komar University of Science and Technology, Sulaimani 46001, Iraqi Kurdistan Region, Iraq
*
Author to whom correspondence should be addressed.
Water 2019, 11(4), 690; https://doi.org/10.3390/w11040690
Submission received: 20 January 2019
/
Revised: 13 March 2019
/
Accepted: 29 March 2019
/
Published: 3 April 2019
(This article belongs to the Section Water Quality and Contamination)
Abstract
:Evaluation of the hydrogeochemical characteristics and groundwater suitability for domestic use was conducted in the Halabja Saidsadiq Basin in the northeastern part of Iraq. The total studied area is about 1278 km2 with a specific Mediterranean-type continental interior climate, which is cold in winter and hot in summer. To conduct the required laboratory chemical analysis for groundwater samples in the studied basin, 78 groundwater samples, in total, were collected from 39 water wells in the dry and wet seasons in 2014 and analyzed for major cations and anions, and the results were compared with the permitted limits for drinking water. An examination of the chemical concentrations of the World Health Organization drinking water norms demonstrate that a large portion of the groundwater samples is suitable for drinking, and a preponderance of groundwater samples situated in the class of hard and very hard water types for both seasons. Suitability of groundwater for drinking use was additionally assessed according to the water quality index classification. This showed that more than 98% of groundwater samples have good water quality in the dry and wet seasons. Conversely, the classification of groundwater samples based on Piper’s diagram designates that the groundwater type is alkaline water, with existing bicarbonate along with sulfate and chloride. However, water–rock exchange processes and groundwater flow have been responsible for the dominant water type of Ca–Mg–HCO3.
1. Introduction
The deficiencies in freshwater resources have turned into an essential issue facing the world. Therefore, groundwater is of specific significance regarding civic domestic water supply, particularly for the residents of arid and semi-arid regions [1]. However, rapid urbanization and increasing populations have accelerated the consumption of groundwater resources and caused serious environmental problems in the last few decades [2], and various studies have shown severe groundwater contamination. It is well known that the mineral composition of water has a reflective impact on soil composition and plant growth. Therefore, the classification system for evaluating the quality of groundwater for drinking purposes can be established by analyzing several related chemical elements, including Ca2+, Mg2+, Na+, K+, Cl−, SO42−, HCO3−, and NO3−, and assessing several physical properties like (acidity or alkalinity (pH), electrical conductivity (EC), temperature, total dissolved solid (TDS), and total hardness (TH)).
Generally, the chemistry of groundwater is controlled by the geological character of the vicinity, the intensity of rock’s chemical weathering, groundwater flow direction, and the interaction between rock and water throughout the recharge season, whereby their interaction determines the quality of groundwater and geochemical characteristics [3,4,5,6,7].
Water quality is conventionally assessed by evaluating the rate of physicochemical parameters with the standard rates, which gives an idea about likely contaminants without providing any precise data on the quality of groundwater [8,9]. The water quality index (WQI) gives a solitary number that indicates the general water quality of a specific time and position, according to several water quality parameters [10]. The aim at a water quality index is to revolve multifaceted data onto water quality of comprehensible information and utilizable by the public because the water quality cannot be described by a single number. There are many water quality parameters, though not all of them are included in the water quality index. Nevertheless, a water quality index that has been designed based on some essential parameters can give a straightforward marker for water quality. Consequently, WQI can be applied as a significant tool for evaluating the groundwater quality [10,11].
Iraq is facing an escalating water crisis due to a drop in the water levels of the Tigris and Euphrates rivers, which originate from Turkey. This has had a negative impact on Iraqi drinking, agriculture, and water requirements for irrigation. Halabja Saidsadiq Basin, as one example of a typical case study in Iraq, is experiencing considerable economic development and enhanced security; this imposes a growing demand for water, which has placed substantial pressure on water resources. Alternatively, the groundwater quality has not been evaluated for drinking purposes, which poses a health concern. Therefore, the present study has tried to recommend an applicable model to assess and map groundwater quality using several important groundwater quality parameters with the aid of statistical and mathematical approaches and a geographic information system (GIS) technique in the Halabja Saidsadiq Basin. The principal objective of this study is to apply the water quality index along with the GIS technique as the first attempt in the region to (1) assess the status of groundwater quality and its suitability for drinking; (2) to derive the spatial distribution of groundwater quality parameters; and (3) produce a map of groundwater quality.
2. Materials and Methods
2.1. Study Area
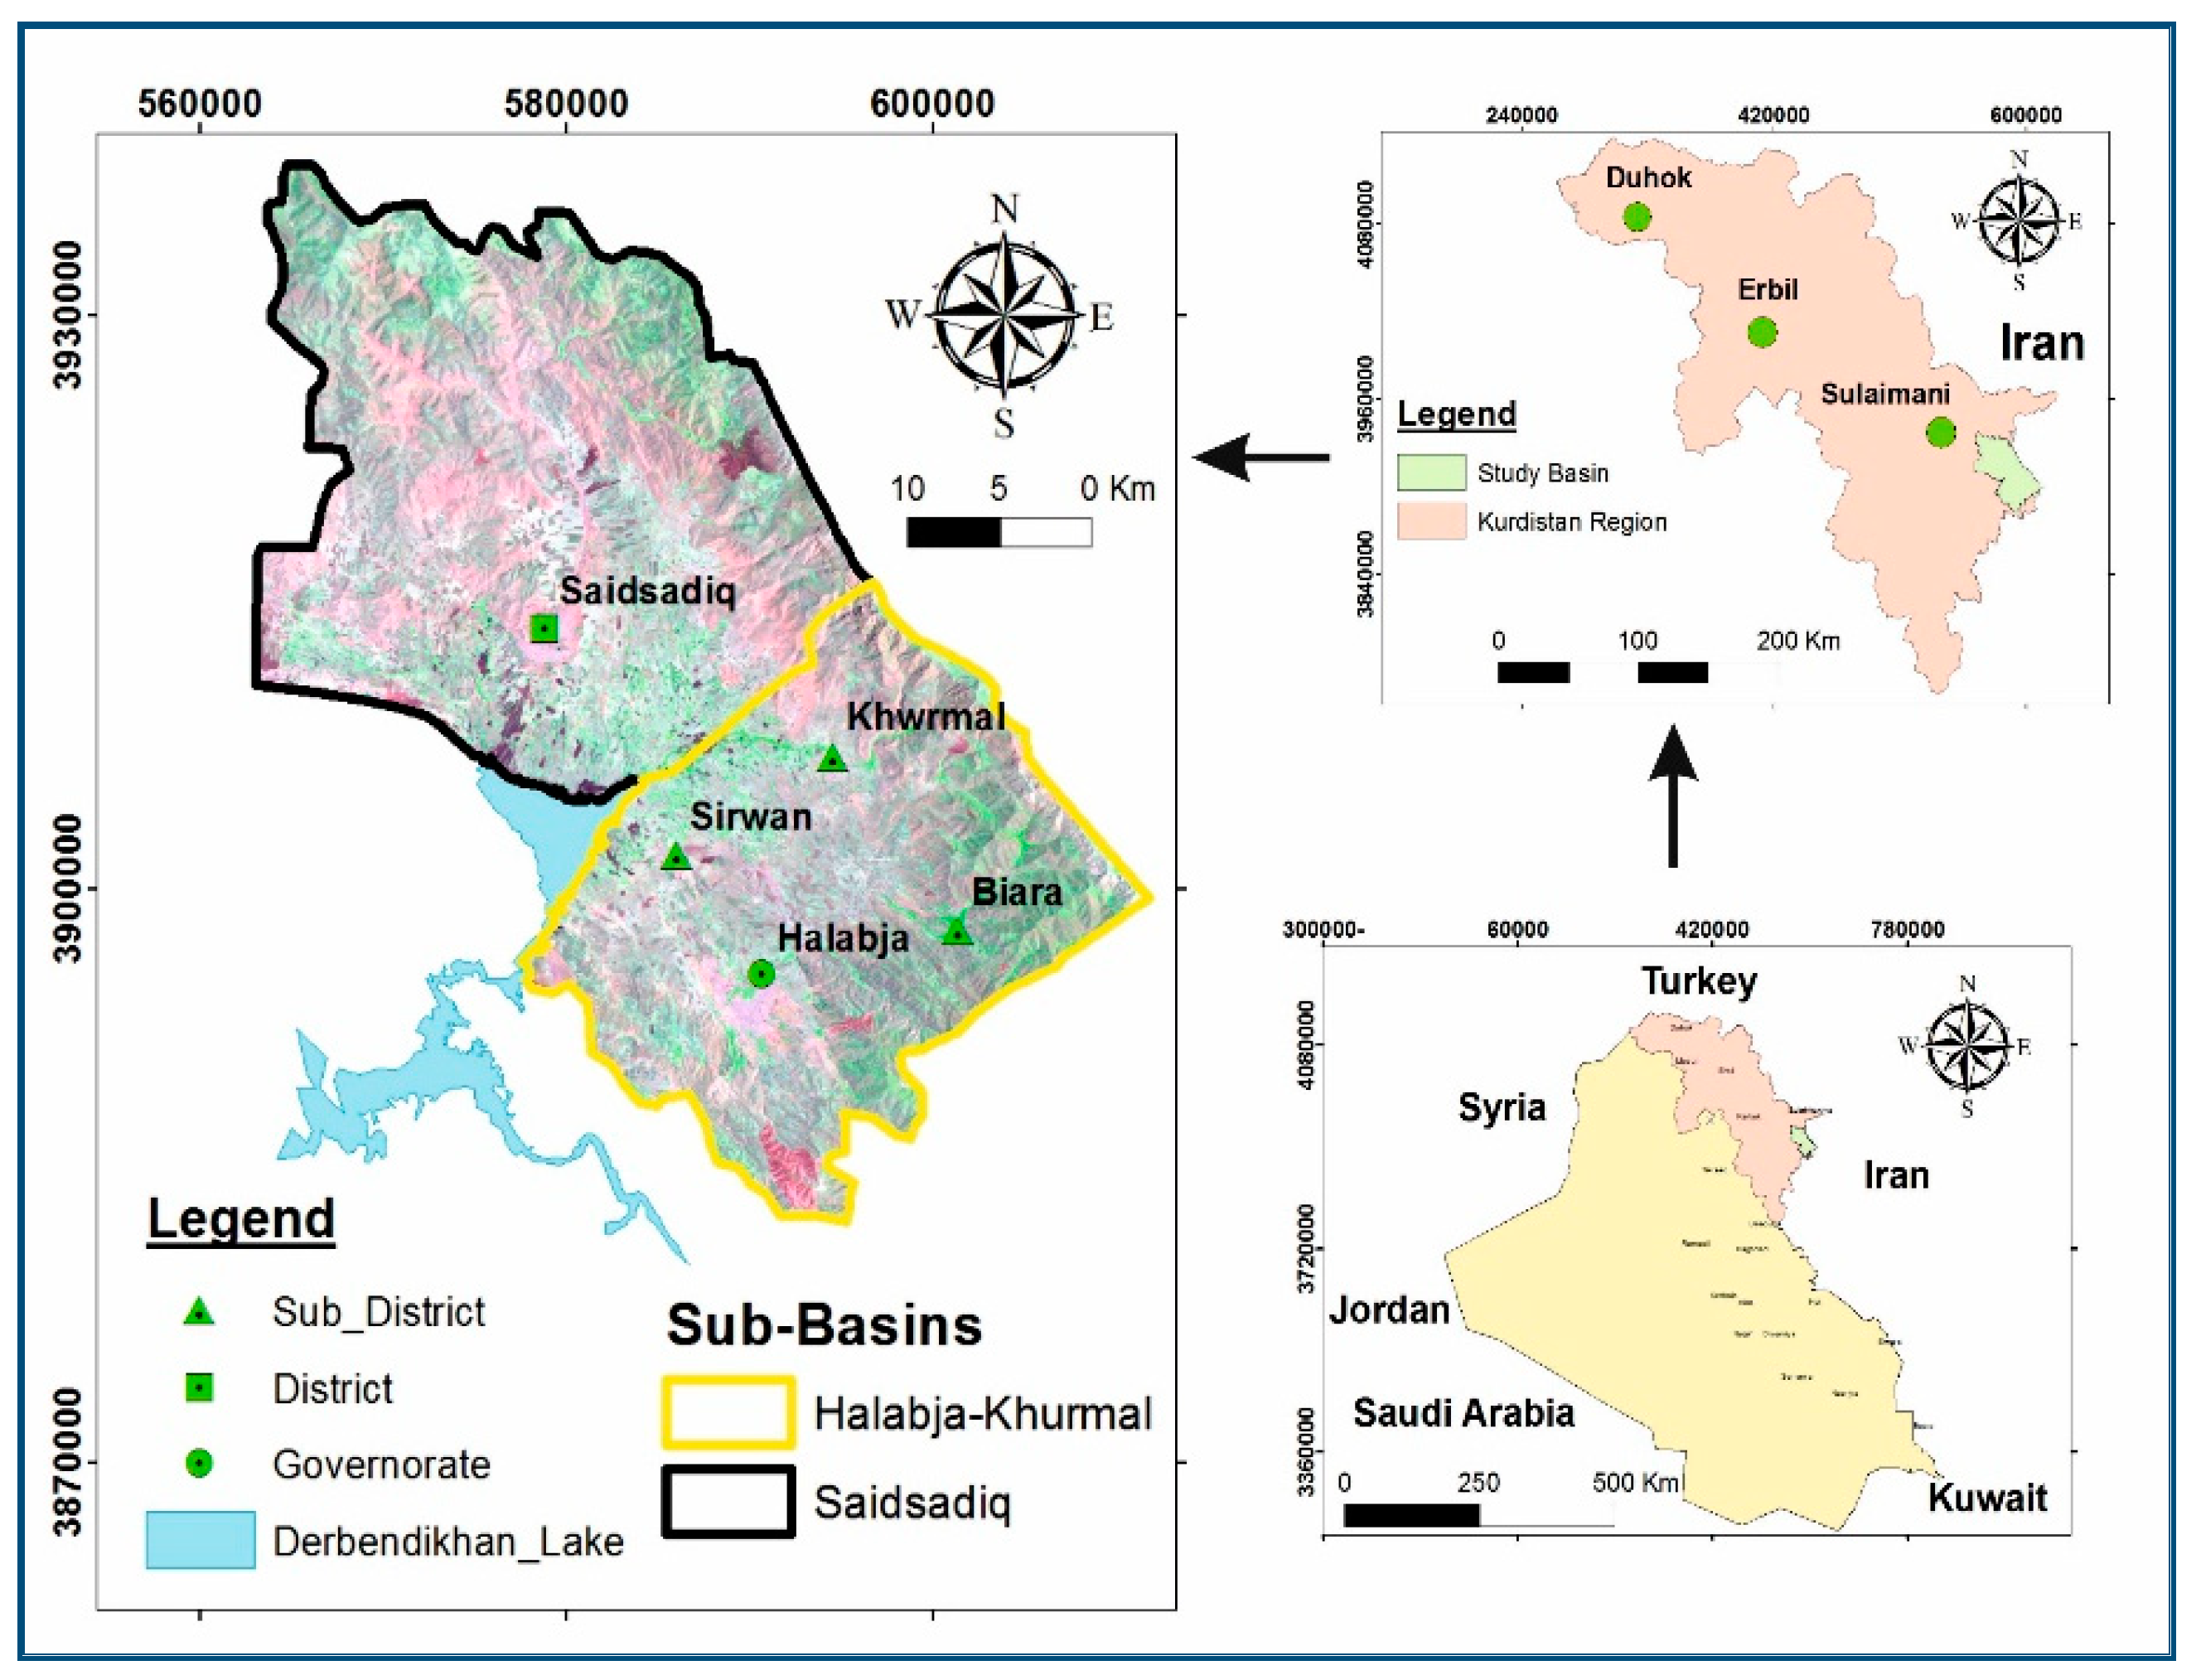
Halabja Saidsadiq Basin (HSB), located in the northeastern part of Iraq, geographically ranged between the latitude 35°00′00” and 35°36′00″ to the north and the longitude 46°36′00″ and 46°12′00″ to the east (Figure 1). Hydrologically, this basin was divided into two subbasins, [12], including Halabja-Khurmal and Said Sadiq subbasins, and named based on its two largest districts from both subbasins. It occupies an area of about 1278 square kilometers, with about 190,727 inhabitants registered in 2015 [12]. The studied area is characterized by a discrete Mediterranean-type continental interior climate of about 45–50 °C in the summers and about 0–10 °C in the winters, with the total annual precipitation ranging from 500 to 700 mm.
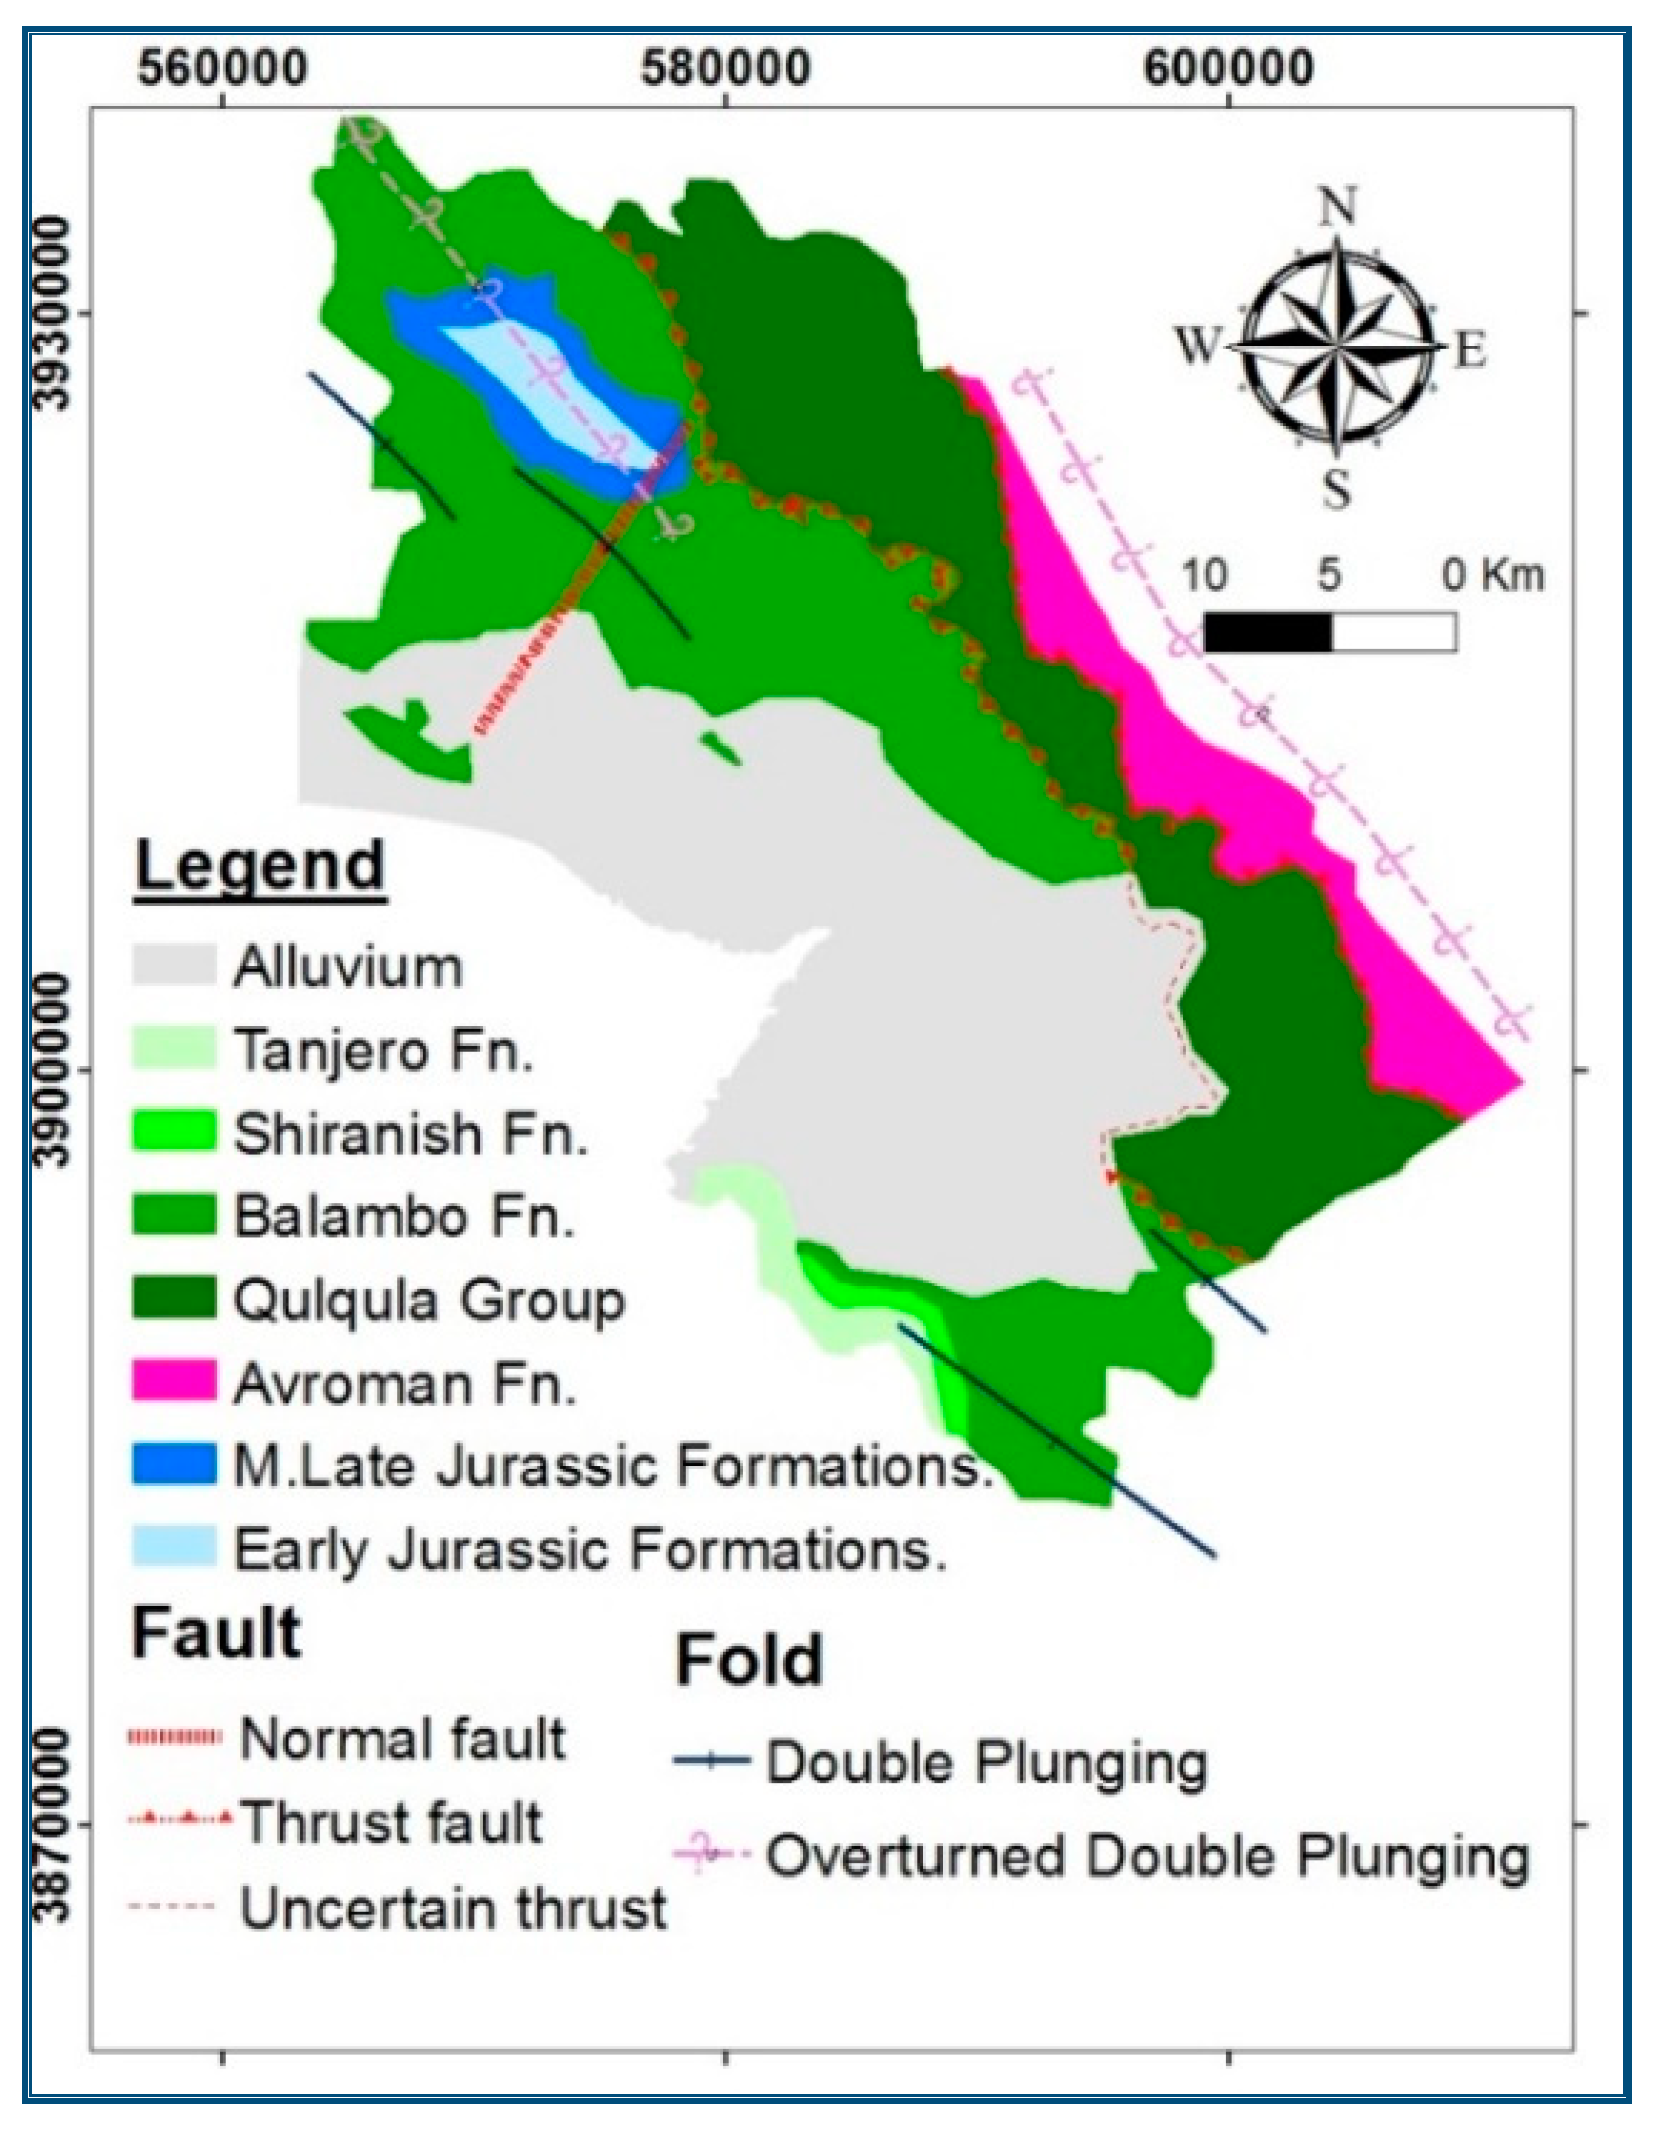
According to the tectonic classification, the area is located mainly in the high folded, imbricated, and thrust zones [13,14]. Stratigraphically, numerous geological units have appeared on the earth’s surface in the HSB at various geological time scales, ranging from Jurassic to recent (Figure 2, Table 1). The oldest exposed rocks in the basin are the Sarki and Sehkanian Formations of Jurassic age [14]. These are followed by lower and middle Jurassic rocks, including Barsarin (limestone and dolomitic limestone), Naokelekan (bituminous limestone) and Sargalu formations [15]. The Qulqula Group consists of two formations, the Qulqula Radiolarian Formation, and the Qulqula Conglomerate Formation. The exposures to the Upper Cretaceous Kometan (Turonian) and Lower Cretaceous Balambo (Valanginian–Cenomanian) Formations are widespread in the area where they are exposed to both subbasins. Shiranish Formation (Campanian) and Tanjero Formation are also exposed in the basin but with restricted outcrops.
Quaternary (alluvial) deposits are the most important unit in the area in terms of hydrogeological characteristics and water supply. These sediments are deposited as debris flows on the gently sloping plains, or channel deposits, or channel margin deposits, and over bank deposits [15]. Previous studies [14,15] stated that the recent deposits are up to 150 m thick, while field observations conducted in this study recorded thicknesses of these deposits of up to nearly 300 m.
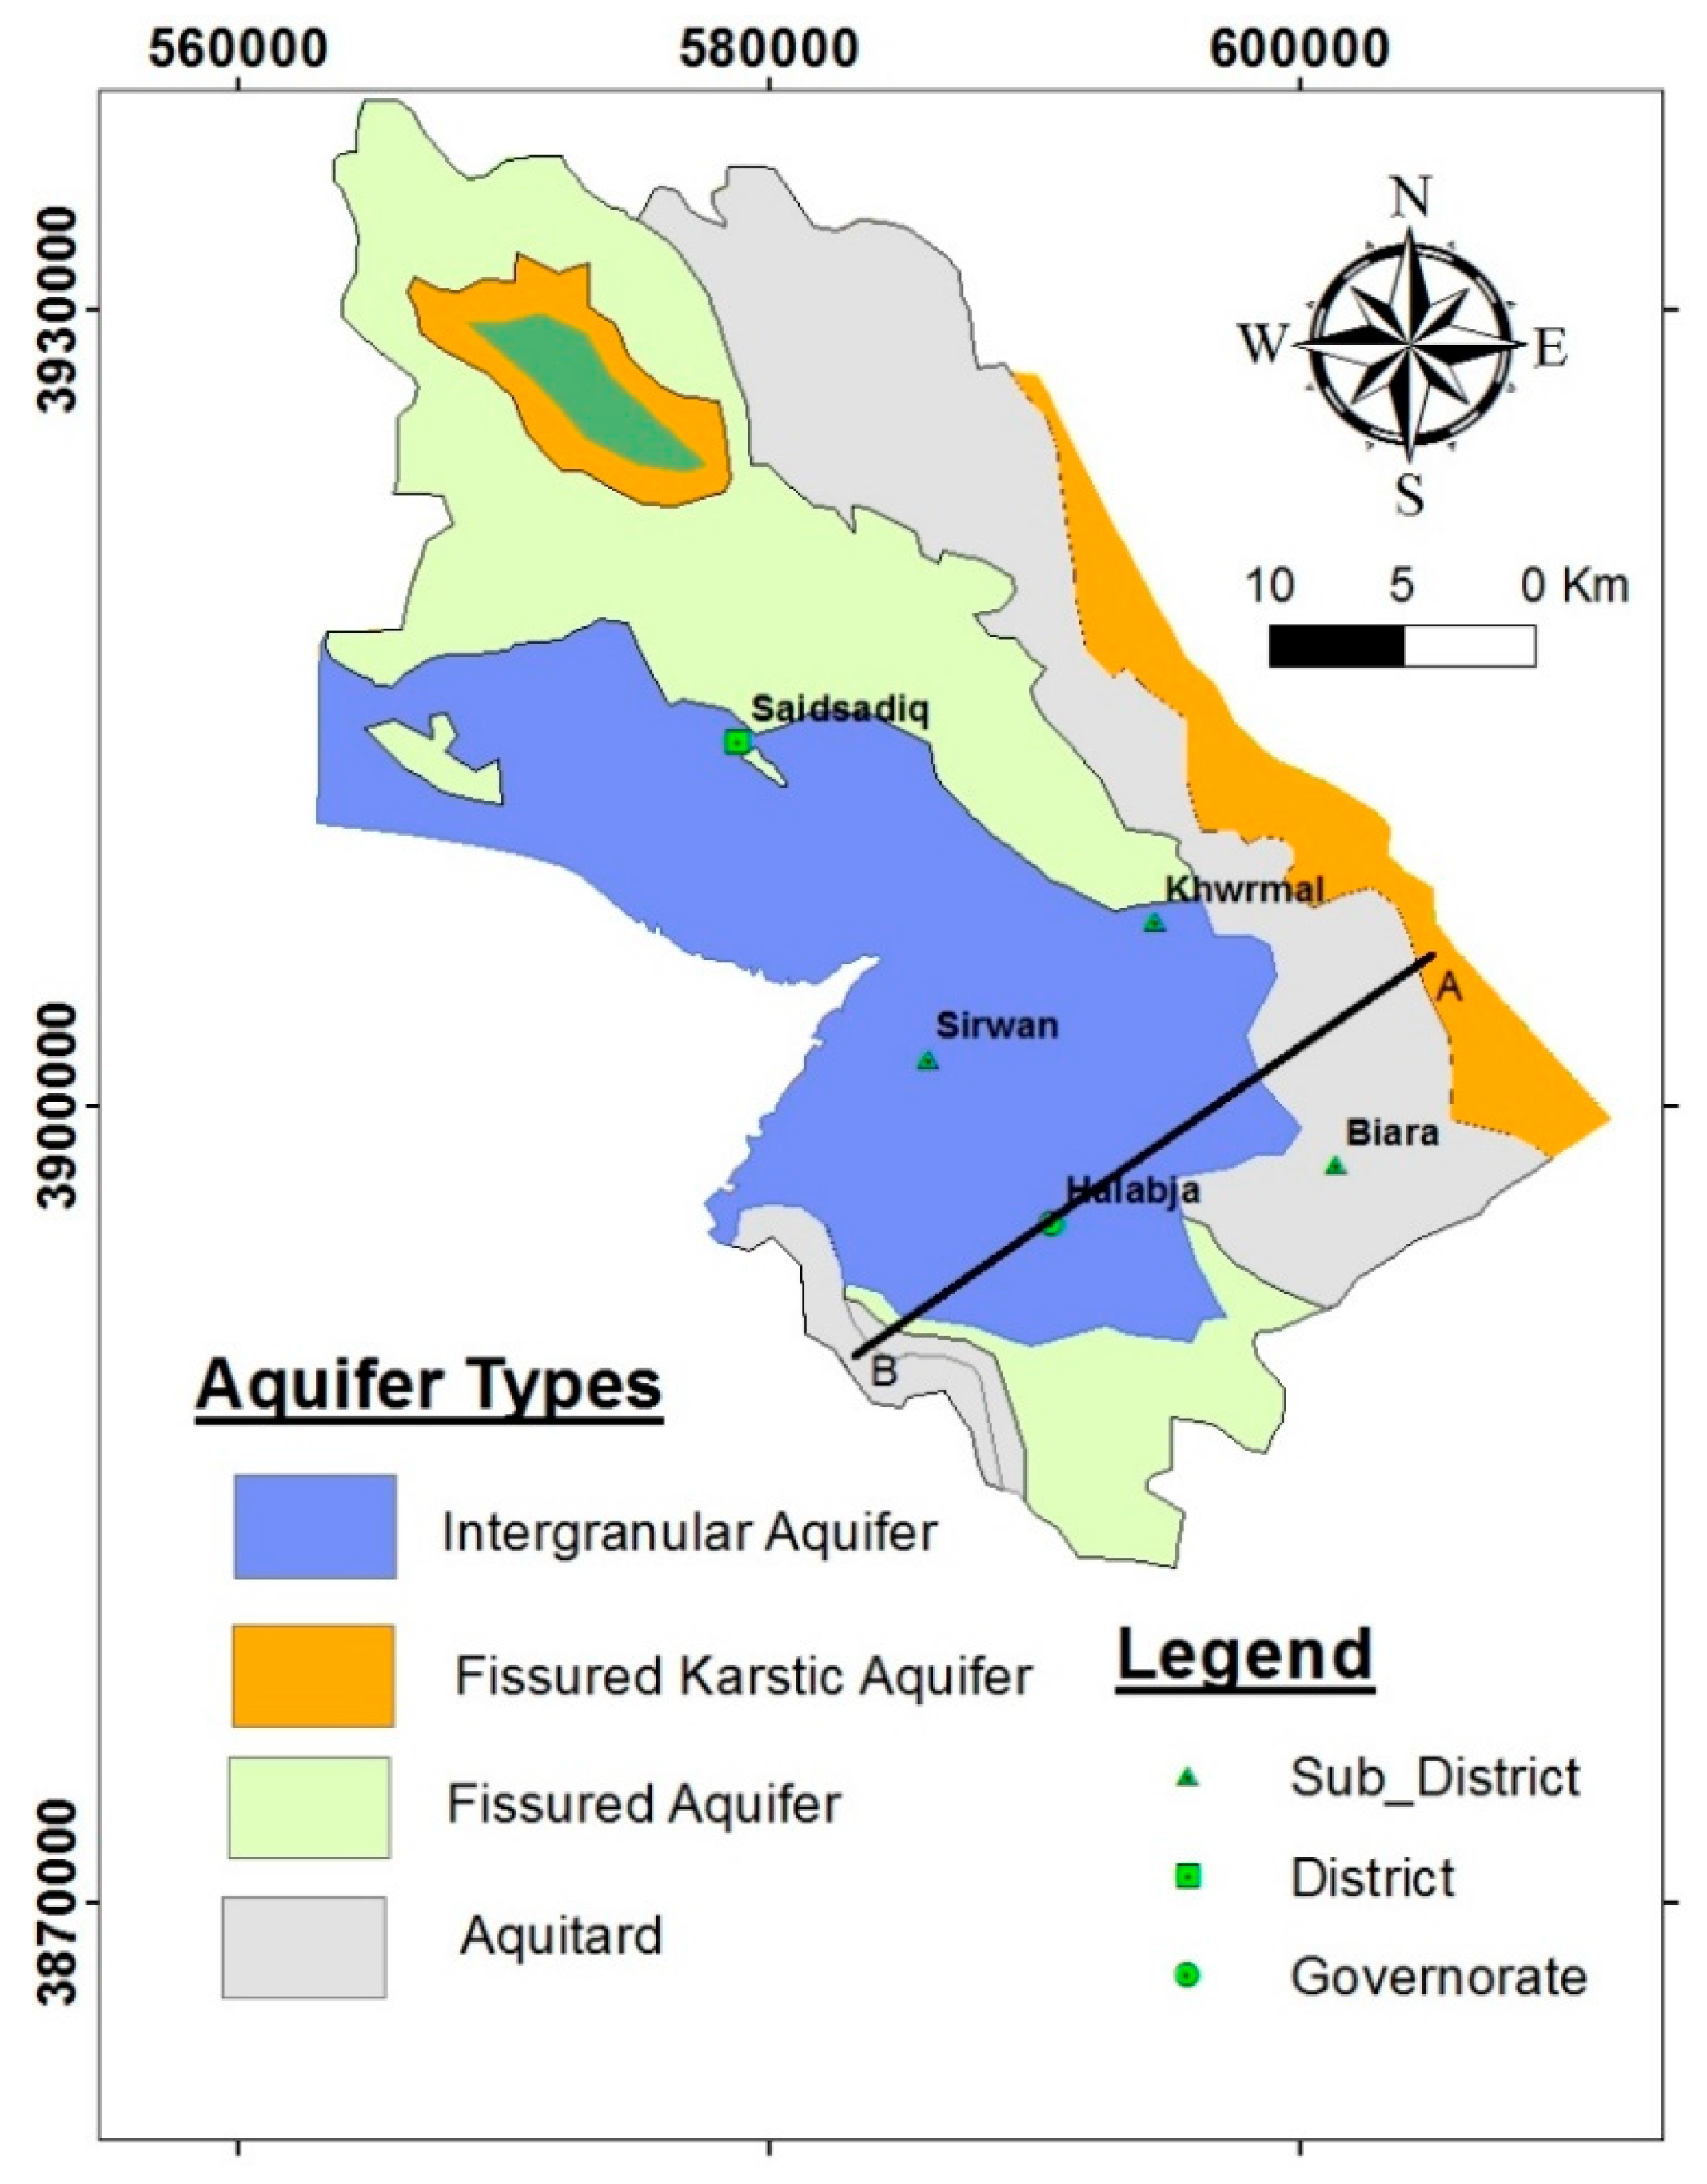
2.2. Hydrogeological Setting
Geological conditions and tectonic processes usually control the hydrogeology of the study basin, affecting groundwater occurrence, and water levels, and movement. In addition, permeability and porosity are the main principal factors in determining the potential of the area to be considered as a water-bearing aquifer. Accordingly, based on their specific classification [15], different types of aquifers were nominated in the study basin (Figure 3 and Figure 4). All aquifer types and thicknesses are explained in Table 1. The groundwater level data recorded in the field work and the archives of the Ground Water Directorate reveal that the mountain series which surround the basin in the northeast and southeast are characterized by a deep water table level, while the center and the southeastern parts have a shallow water table level. The groundwater movement is usually from the north and northeast to southwest, and from the south and southeast to southwest.
Additionally, the study basin comprises several rivers and streams, such as Sirwan river, and the Zalm, Chaqan, Biara, Reshen, and Zmkan streams. All of these rivers and streams are considered as the main recharge sources of Derbandikhan Lake, which is located in the southeast of the basin. There are several springs inside the basin. These springs are classified into three classes [15]: less than 10 L/s, such as Anab, Basak, Bawakochak, and 30 other springs; 10–100 L/s, such as Sheramar, Qwmash, Khwrmal, Garaw, and Kani Saraw springs; and more than 100 L/s, such as Ganjan, Reshen, and Sarawy Swbhan Agha springs.
2.3. Uncertainty Measurement of Chemical Analysis
All measurements have a degree of uncertainty regardless of their precision and accuracy. This is caused by two factors, the limitation of the measuring instrument (systematic error) and the skill of the experimenter making the measurements (random error). In this study, we assessed the impact of systematic errors (trueness) on the chemical analysis [18].
Trueness (Systematic Error) of Chemical Analysis
The trueness (systematic error) of the chemical analysis for major ions can be estimated from the electroneutrality condition. This is achieved by taking the relationship between the total cations (Ca2+, Mg2+, Na+, and K+) and the total anions (SO42−, HCO3−, and Cl−) for each set of complete analyses of water samples [12] using the following equation:
where EN% (electroneutrality) is the percent/reaction error, and Σ is the total cations and anions expressed in milliequivalents per liter. The accepted limit or certain limit is between 0%–5%. If it is between 5%–10% that means it should be carefully dealt and if it exceeds 10% (uncertain) then it means it is not useful for geochemical interpretation and it must be eliminated from the subsequent analyses. By applying the above methods to the water samples, the results from both seasons were found within the acceptable limit.
2.4. Assessment of Groundwater Quality for Domestic Purposes
The chemistry of water is very dynamic, largely controlled, and modified by its medium of contact, namely rocks and soil. Water type and hydrochemical facies evaluations are extremely useful in providing a preliminary idea of the complex hydrochemical processes in the subsurface. Determination of hydrochemical facies has been extensively used in the chemical assessment of groundwater and surface water for several decades. Several researchers recommend a variety of classification modes for water classification, including Piper’s outline [19], Durov charts [20], and Chadha’s graph [21]. The groundwater samples of the considered study area were classified according to the Piper classifications. The Piper diagram has three major components, including a cation triangle, anion triangle, and central diamond-shaped field. This diagram is an effective graphical procedure for segregating relevant analytical data in order to determine the sources of dissolved constituents in the water. This procedure was born under the statement that most natural waters contain cations and anions in chemical equilibrium [19].
The groundwater quality has been assessed for domestic use by analyzing the major ionic elements Ca2+, Mg2+, Na+, K+, Cl−, SO42−, HCO3−, and NO3−, and the physical parameters (pH, EC, and temperature, TDS, and TH).
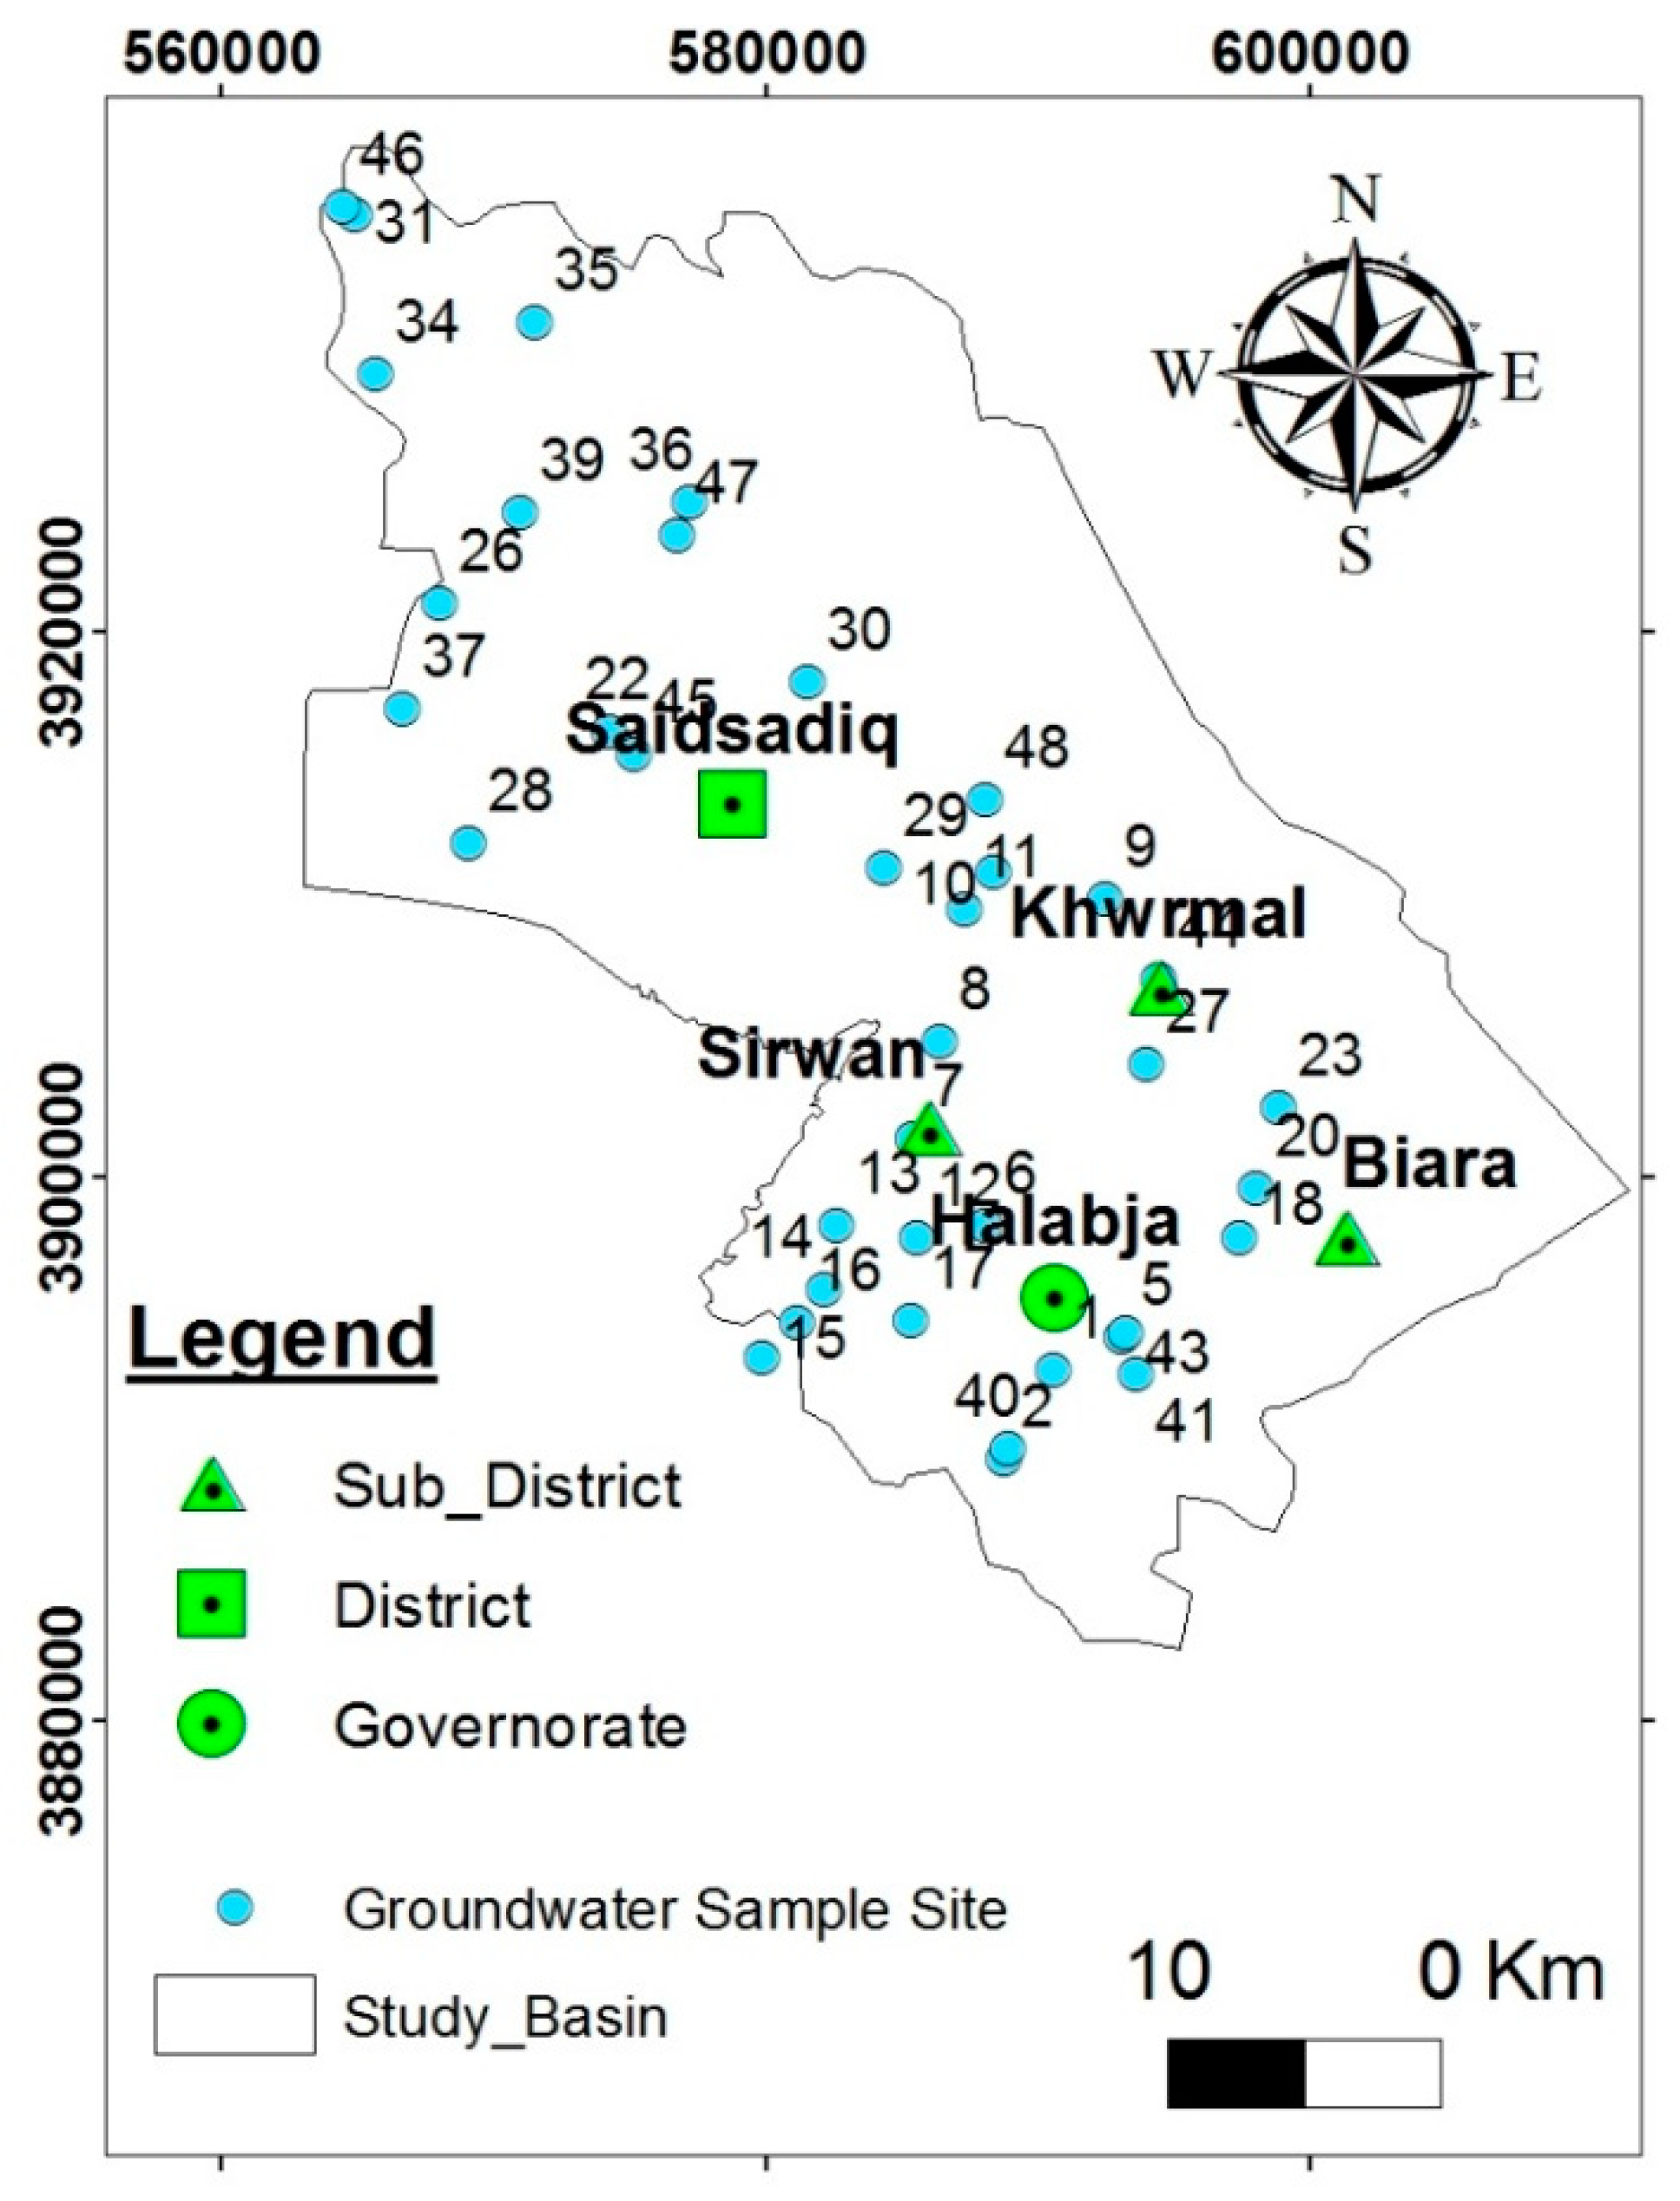
Groundwater samples from 30 water wells and 9 springs were collected at the end of September 2014 for the dry season, and at the end of May 2015 for the wet season (Figure 5), to allow for seasonal variations. These samples were chemically tested for major cations, anions, and minor compounds. All water samples were filtered through cellulose acetate syringe filters Ø: 25 mm with a pore size of 0.20 μm for cation and anion analyses while at, or directly after returning from, the field.
In total, 78 groundwater samples corresponding to the two periods were collected and tested, from which there 39 groundwater samples for the dry season and 39 samples for the wet season. These samples were hydrochemically analyzed in the laboratory branch of the Sulaimani Directorate of Environment (Table 2). The technique used for analysis was the American Public Health Association (APHA) standard methods for water analysis [22]. Groundwater samples were placed in the refrigerator until they were analyzed to avoid deterioration and changes in qualities due to changing temperatures. The applied technique for testing groundwater samples within the laboratory was the APHA standard methods [23]. The field measurement instrument (TPS/90FL-T Field Lab. Analyzer) was fully calibrated before the start of groundwater sampling. This instrument was used to measuring temperature, electrical conductivity, pH, and turbidity, in situ, during the field work in 2014.
Total dissolved solid (TDS) signifies the total amount of residual solids when a water sample is evaporated to dryness [23]. Total dissolved solids comprise inorganic salts (mostly calcium, magnesium, sodium, potassium, bicarbonates, sulfates, and chlorides) and a small amount of organic matter that is dissolved in water. The TDS was measured at the field immediately during sample collection in both periods.
The total hardness (TH) is believed to be one of the most essential parameters for evaluating water quality for drinking suitability. Hardness affects the ability of water to form a lather with soap. Hardness is characteristic which is determined by calcium and magnesium, and is also dependent on several additional factors, such as pH and alkalinity. Total hardness for the tested groundwater samples was computed using the following equation [23].
total hardness = 2.497 (Ca2+ mg/L) + 4.115 (Mg2+ mg/L)
The groundwater quality was evaluated by comparing the physicochemical parameters of different groundwater samples of the HSB with drinking water standards recommended by the World Health Organization [24]. The spatial distribution and the seasonal variations in physicochemical quality parameters of groundwater were investigated by using the principal of the drinking water quality index for both seasons. This was achieved by assessing 11 water quality parameters, including (pH, EC, TDS, Ca2+, Mg2+, Na+, K+, HCO3−, Cl−, SO42−, and NO3−).
The estimations of WQI were dependent on the recommended standards for domestic use, where 11 water quality parameters were selected, including TDS, pH, EC, Na+,Ca2+, K+, Mg2+, HCO3−, SO42−,Cl−, and NO3−. First, the relative weights (wi) were assigned to each parameter, referred to as its effective magnitude in the water quality of drinking utility (Table 3). The highest weight of 5 was allocated to the parameters TDS, Na+, Cl−, NO3−, and SO42−, due to their importance in WQI assessment, and the lowest weight of 1 was given to HCO3− because of its relatively less significant role in WQI assessment [11]. Second, the relative weights (Rwi) were calculated based on the following equation:
where Rwi is the relative weight, wi is the weight of each parameter, and n is the number of parameters.
Finally, the drinking water quality index (qi) for each parameter was computed using the following equation, which is recommended by [24]:
where qi is the quality rating, Ci is the concentration of each chemical parameter in each water sample in mg/L, and Si is the permissible concentration in mg/L for each chemical parameter according to the guidelines.
The WQI was computed by applying the following equation:
In addition, water quality categories were defined based on WQI (Table 4). Generated spatial distribution maps for the TH, TDS, and WQI were created for HSB. The groundwater quality classification map was developed from different thematic layers based on the standards for drinking water [24] by using inverse distance weighting (IDW) in ARC GIS 10.3 software. The classification of water quality is essential for an assessment of the suitability of water for domestic purposes.
3. Results and Discussion
3.1. Hydrogeochemical Evaluation
Understanding groundwater quality is important, because it is the major factor which decides the suitability of water for different uses in domestic, industrial, and agricultural purposes. Arithmetical outcomes of the numerous chemical and physical factors of examined groundwater samples from the HSB are presented in Table 5. The values of pH for both seasons varied from 7.1 to 8.3 with an average of 7.72 and 7.66 in the dry and wet seasons, respectively.
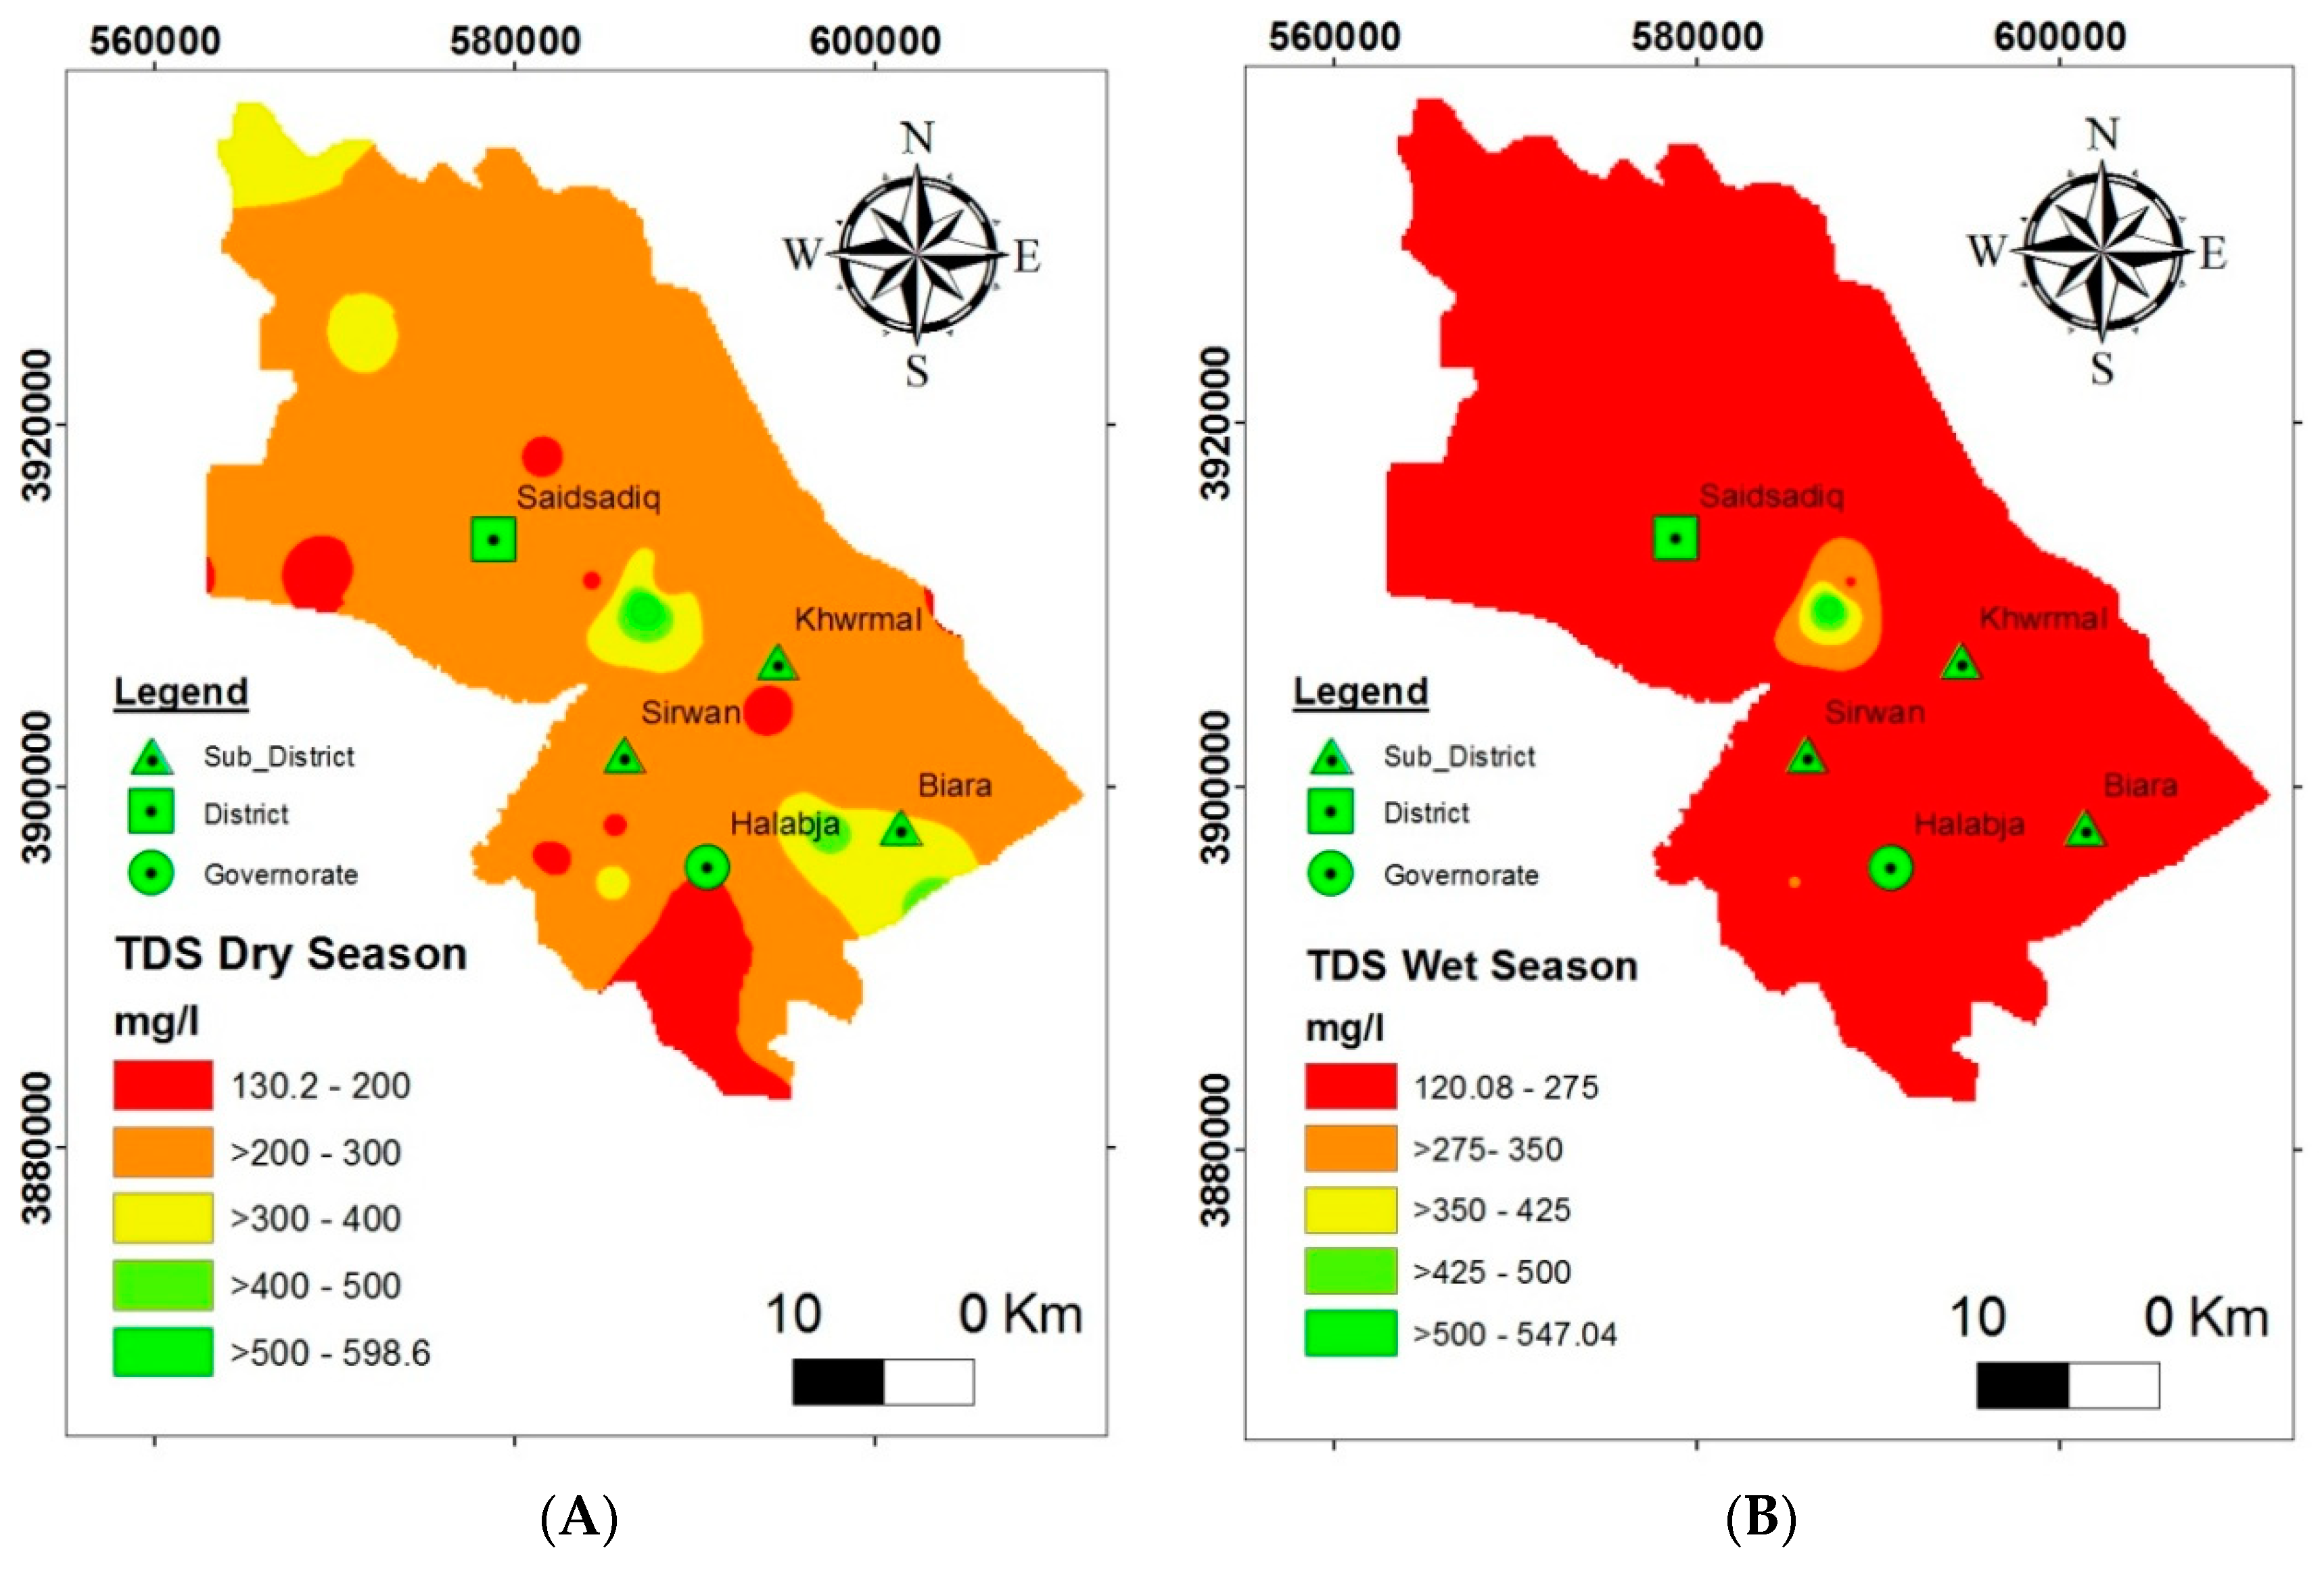
The average of electrical conductivity (EC) during the dry season is 568.03 μS/cm, whilst it is 517.11 μS/cm for the wet season. This shows that all the included water samples are within the suitable range of the standard [24] of 1500 μS/cm for each season. The total dissolved solids (TDSs) represent the concentration of all liquefied matter in the water. TDS levels under 600 mg/L can still be considered as high, and concentrations greater than 1000 mg/L diminish the suitability of the water for drinking [24]. Estimations of TDS in the considered studied area differed from 130 to 600 mg/L, and 120 to 550 mg/L, with an average rate of 254 and 200 mg/L in the dry and wet seasons, respectively.
Piper Diagram
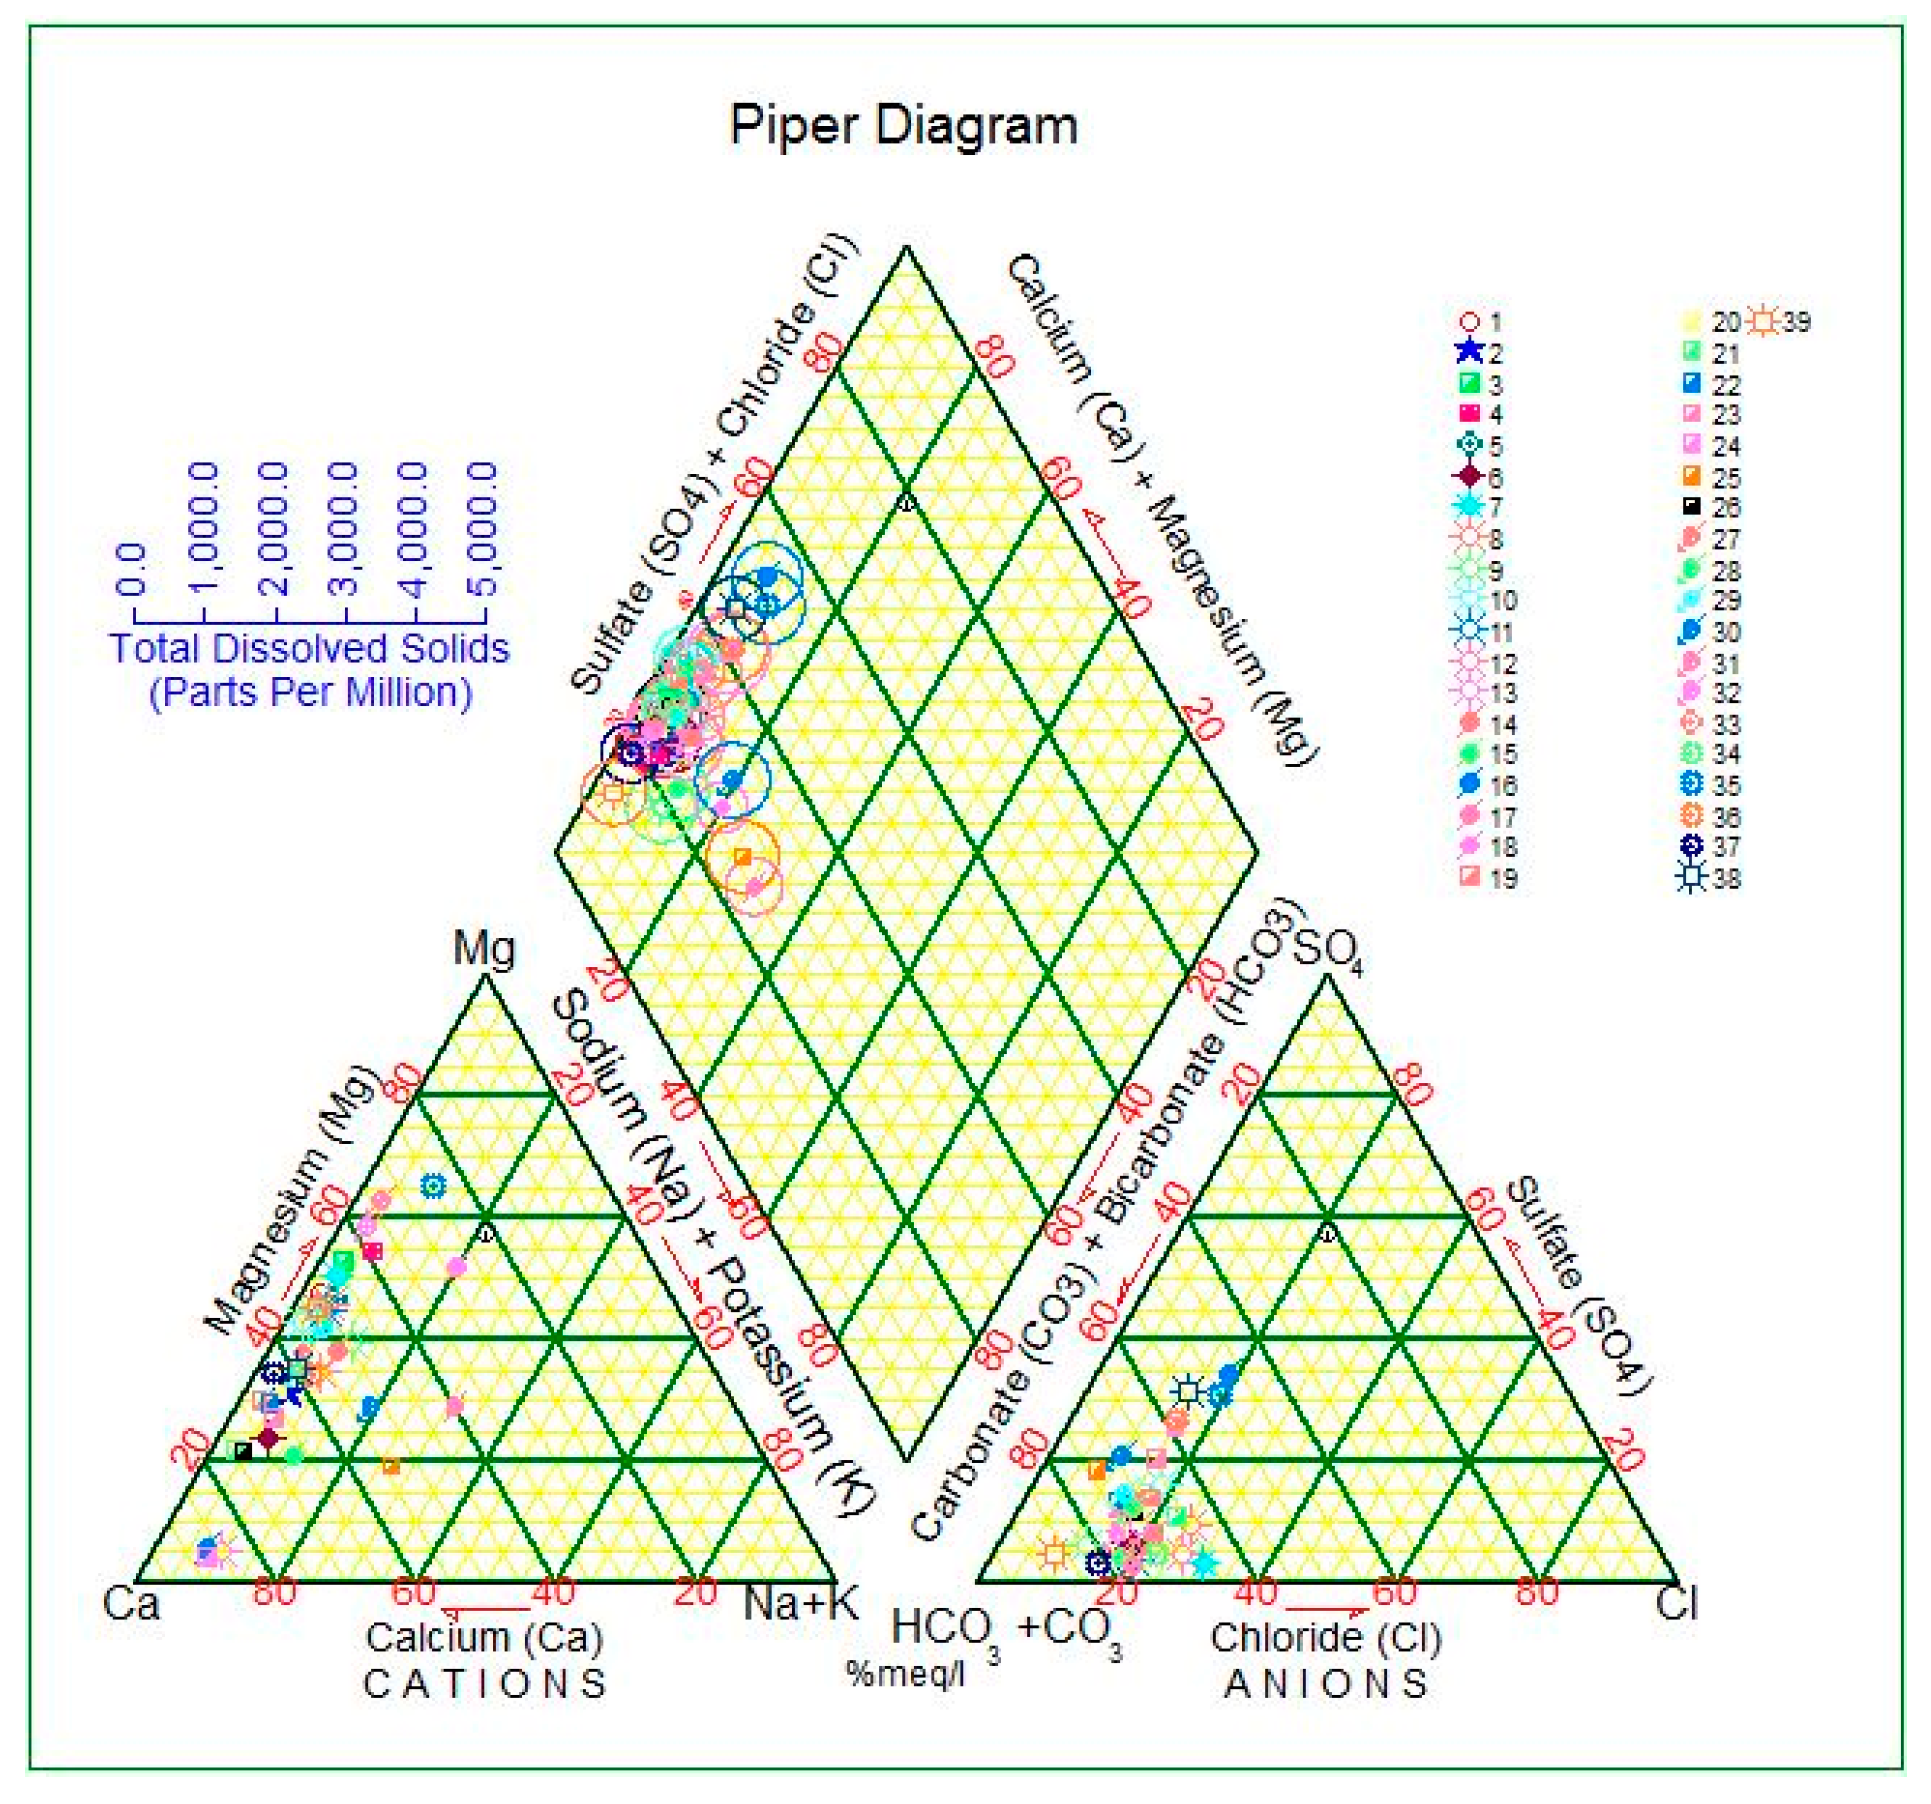
The equivalent percentages of the major cations and anions are outlined in a separate triangle to prepare the Piper diagram. These plotted positions in the triangular fields are anticipated to be further in the central diamond field, which describes the general character of the groundwater [26].
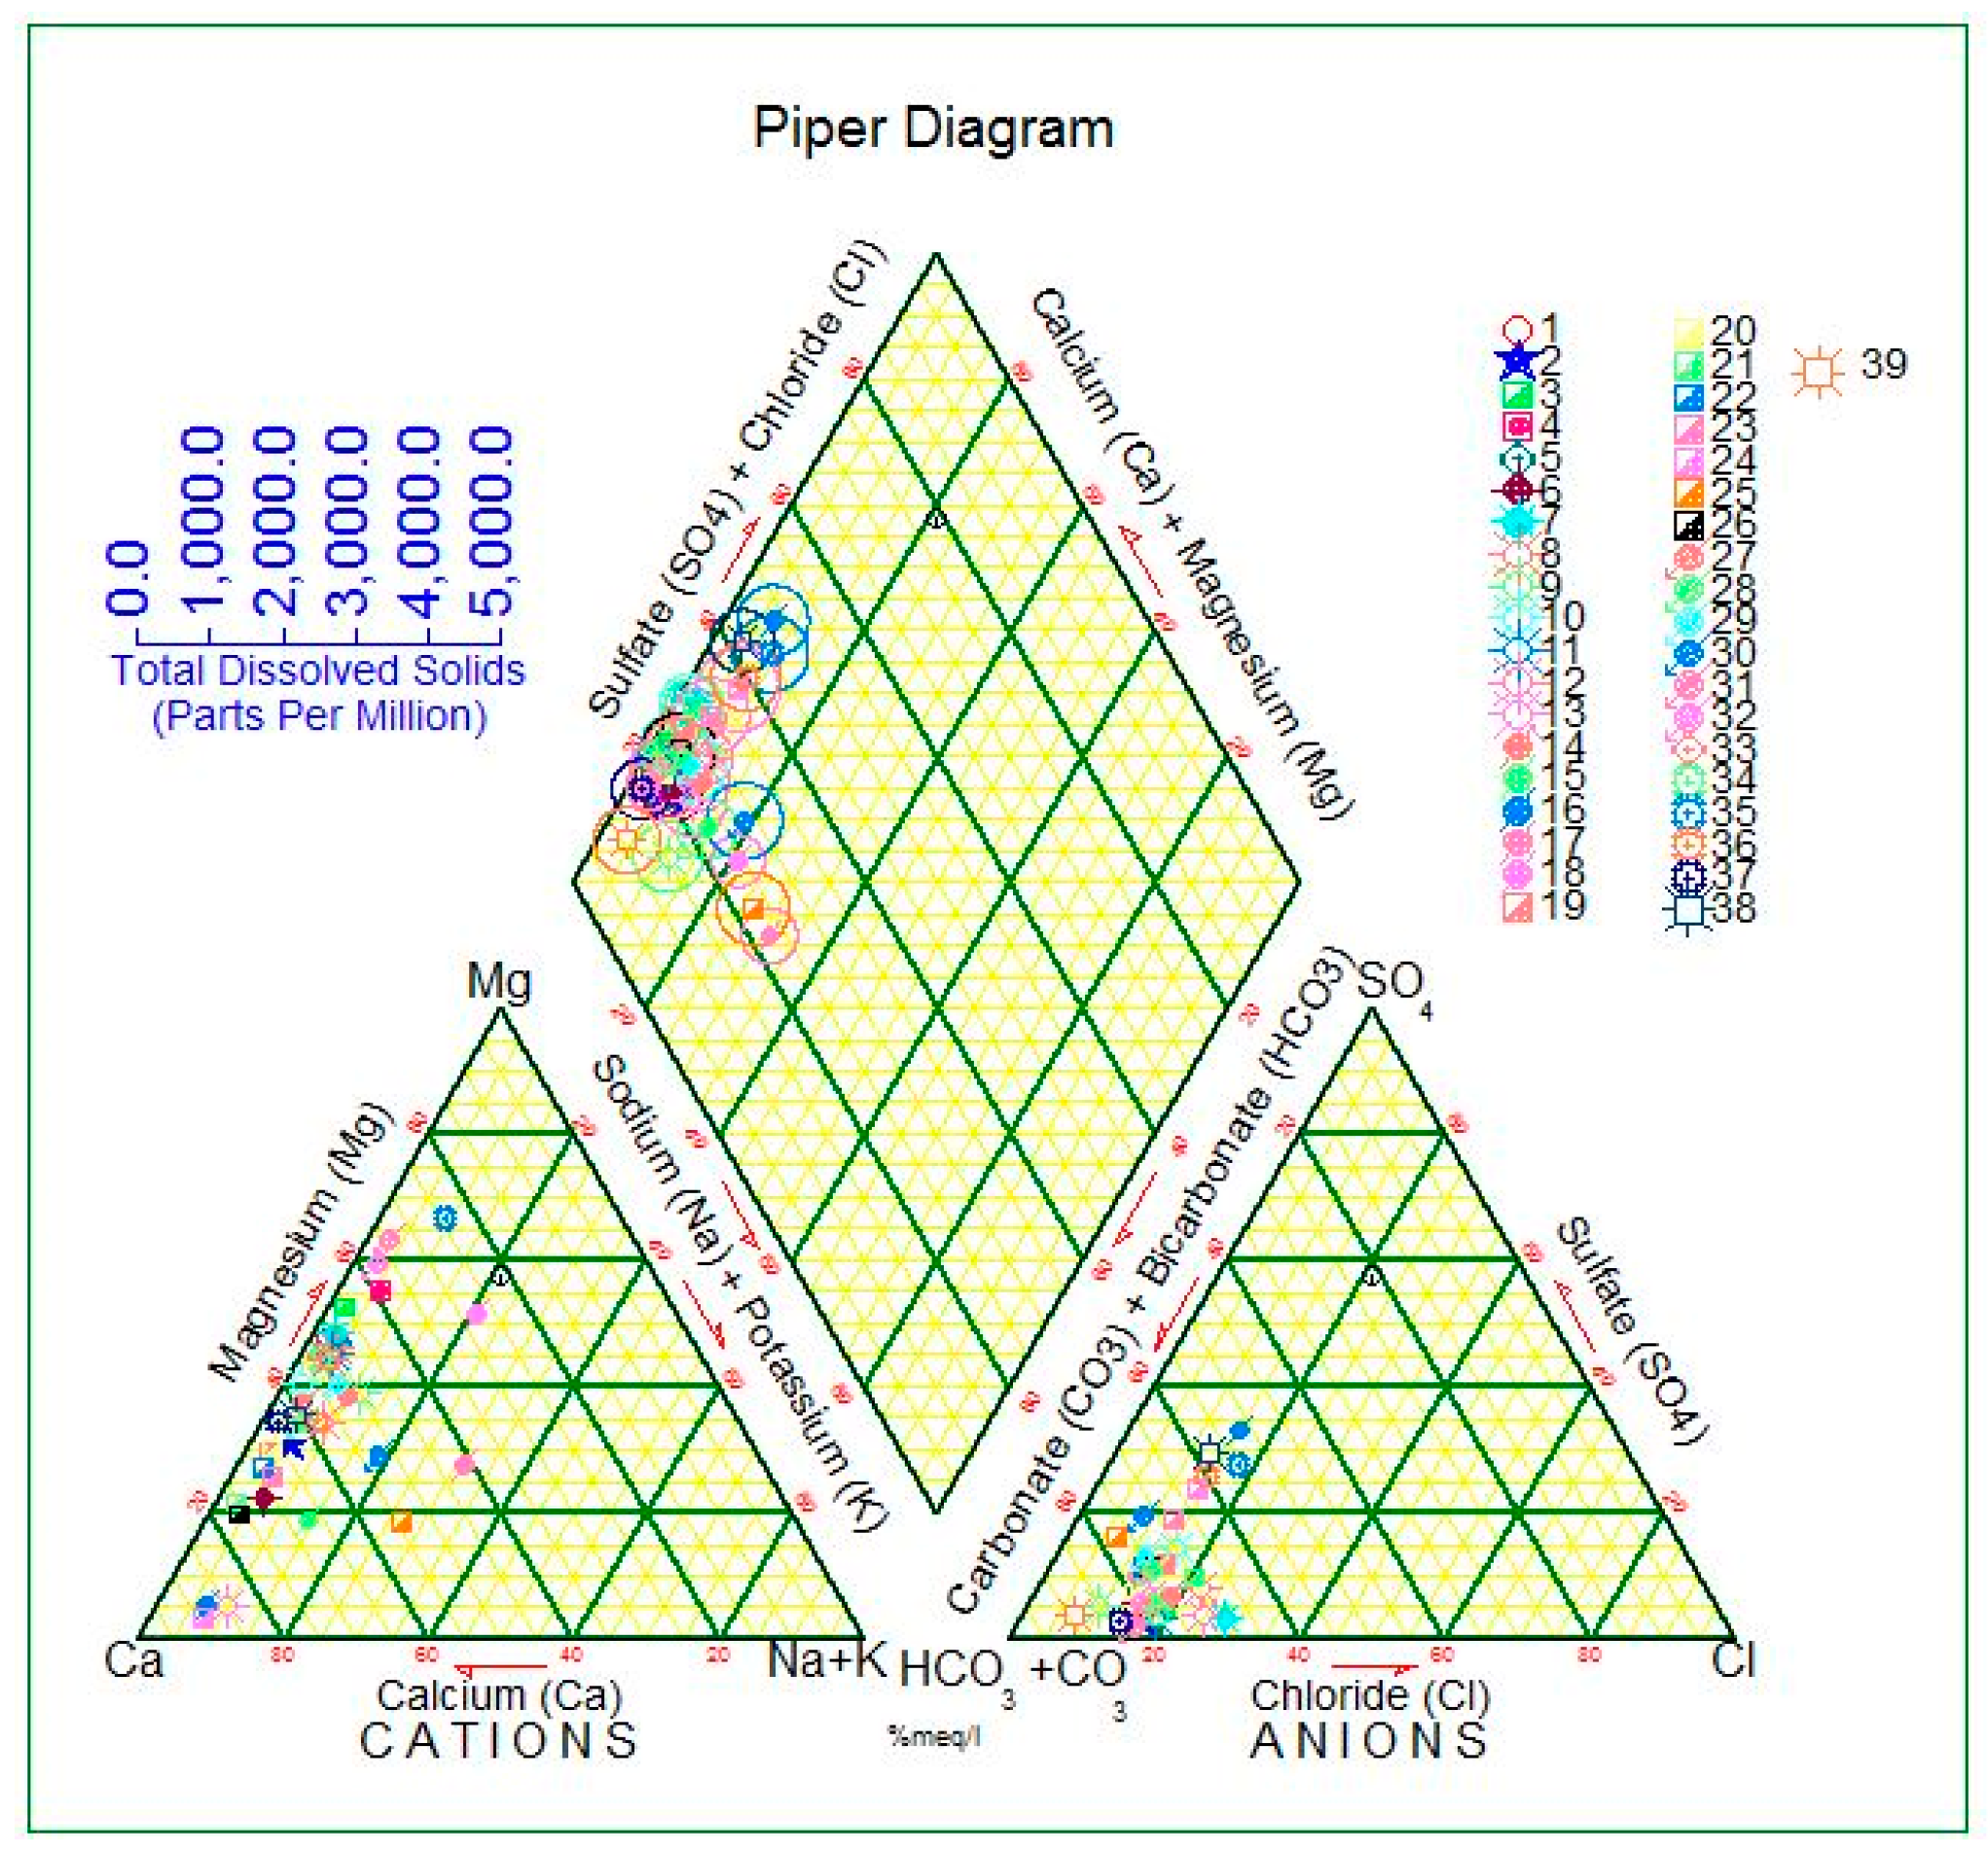
The plot of chemical analysis on a Piper diagram for the dry season (Figure 6) and for the wet season (Figure 7), confirms that a large portion of the groundwater tests in the HSB characterized the groundwater as alkaline with existing bicarbonate and with sulfate and chloride. Similarly, [15] classified groundwater in the same studied basin utilizing a Piper diagram also concluded that the common water was alkaline with existing bicarbonate and with sulfate and chloride. The results achieved from this study and outcomes of [15] support the trueness and precision of this classification. The effect of the carbonate rocks on the properties and type of groundwater within these classes is quite clear. Thus, the high amount of substances corresponding to soluble earth alkaline metals could be ascribed to the groundwater recharge from carbonate rock which embodies the surroundings of the Avroman, Balambo and Jurassic aquifers that were the considered within the investigated catchment areas.
3.2. Evaluation of Groundwater Quality for Domestic Purposes
The map of the spatial distribution of TDS (Figure 8) demonstrates that most of the studied areas have a desirable concentration of TDS in groundwater both in the dry and wet seasons. Expanding the normal estimation of TDS in the dry season indicates that the increased groundwater ejection and the evaporation process led to the extreme deposition of desirable salts. In addition, according to the specific classification [27,28], more than 95% of groundwater samples were fresh with fewer soluble salts and, therefore, groundwater in this area can be used for domestic purposes without any major health risk with regard to TDS.
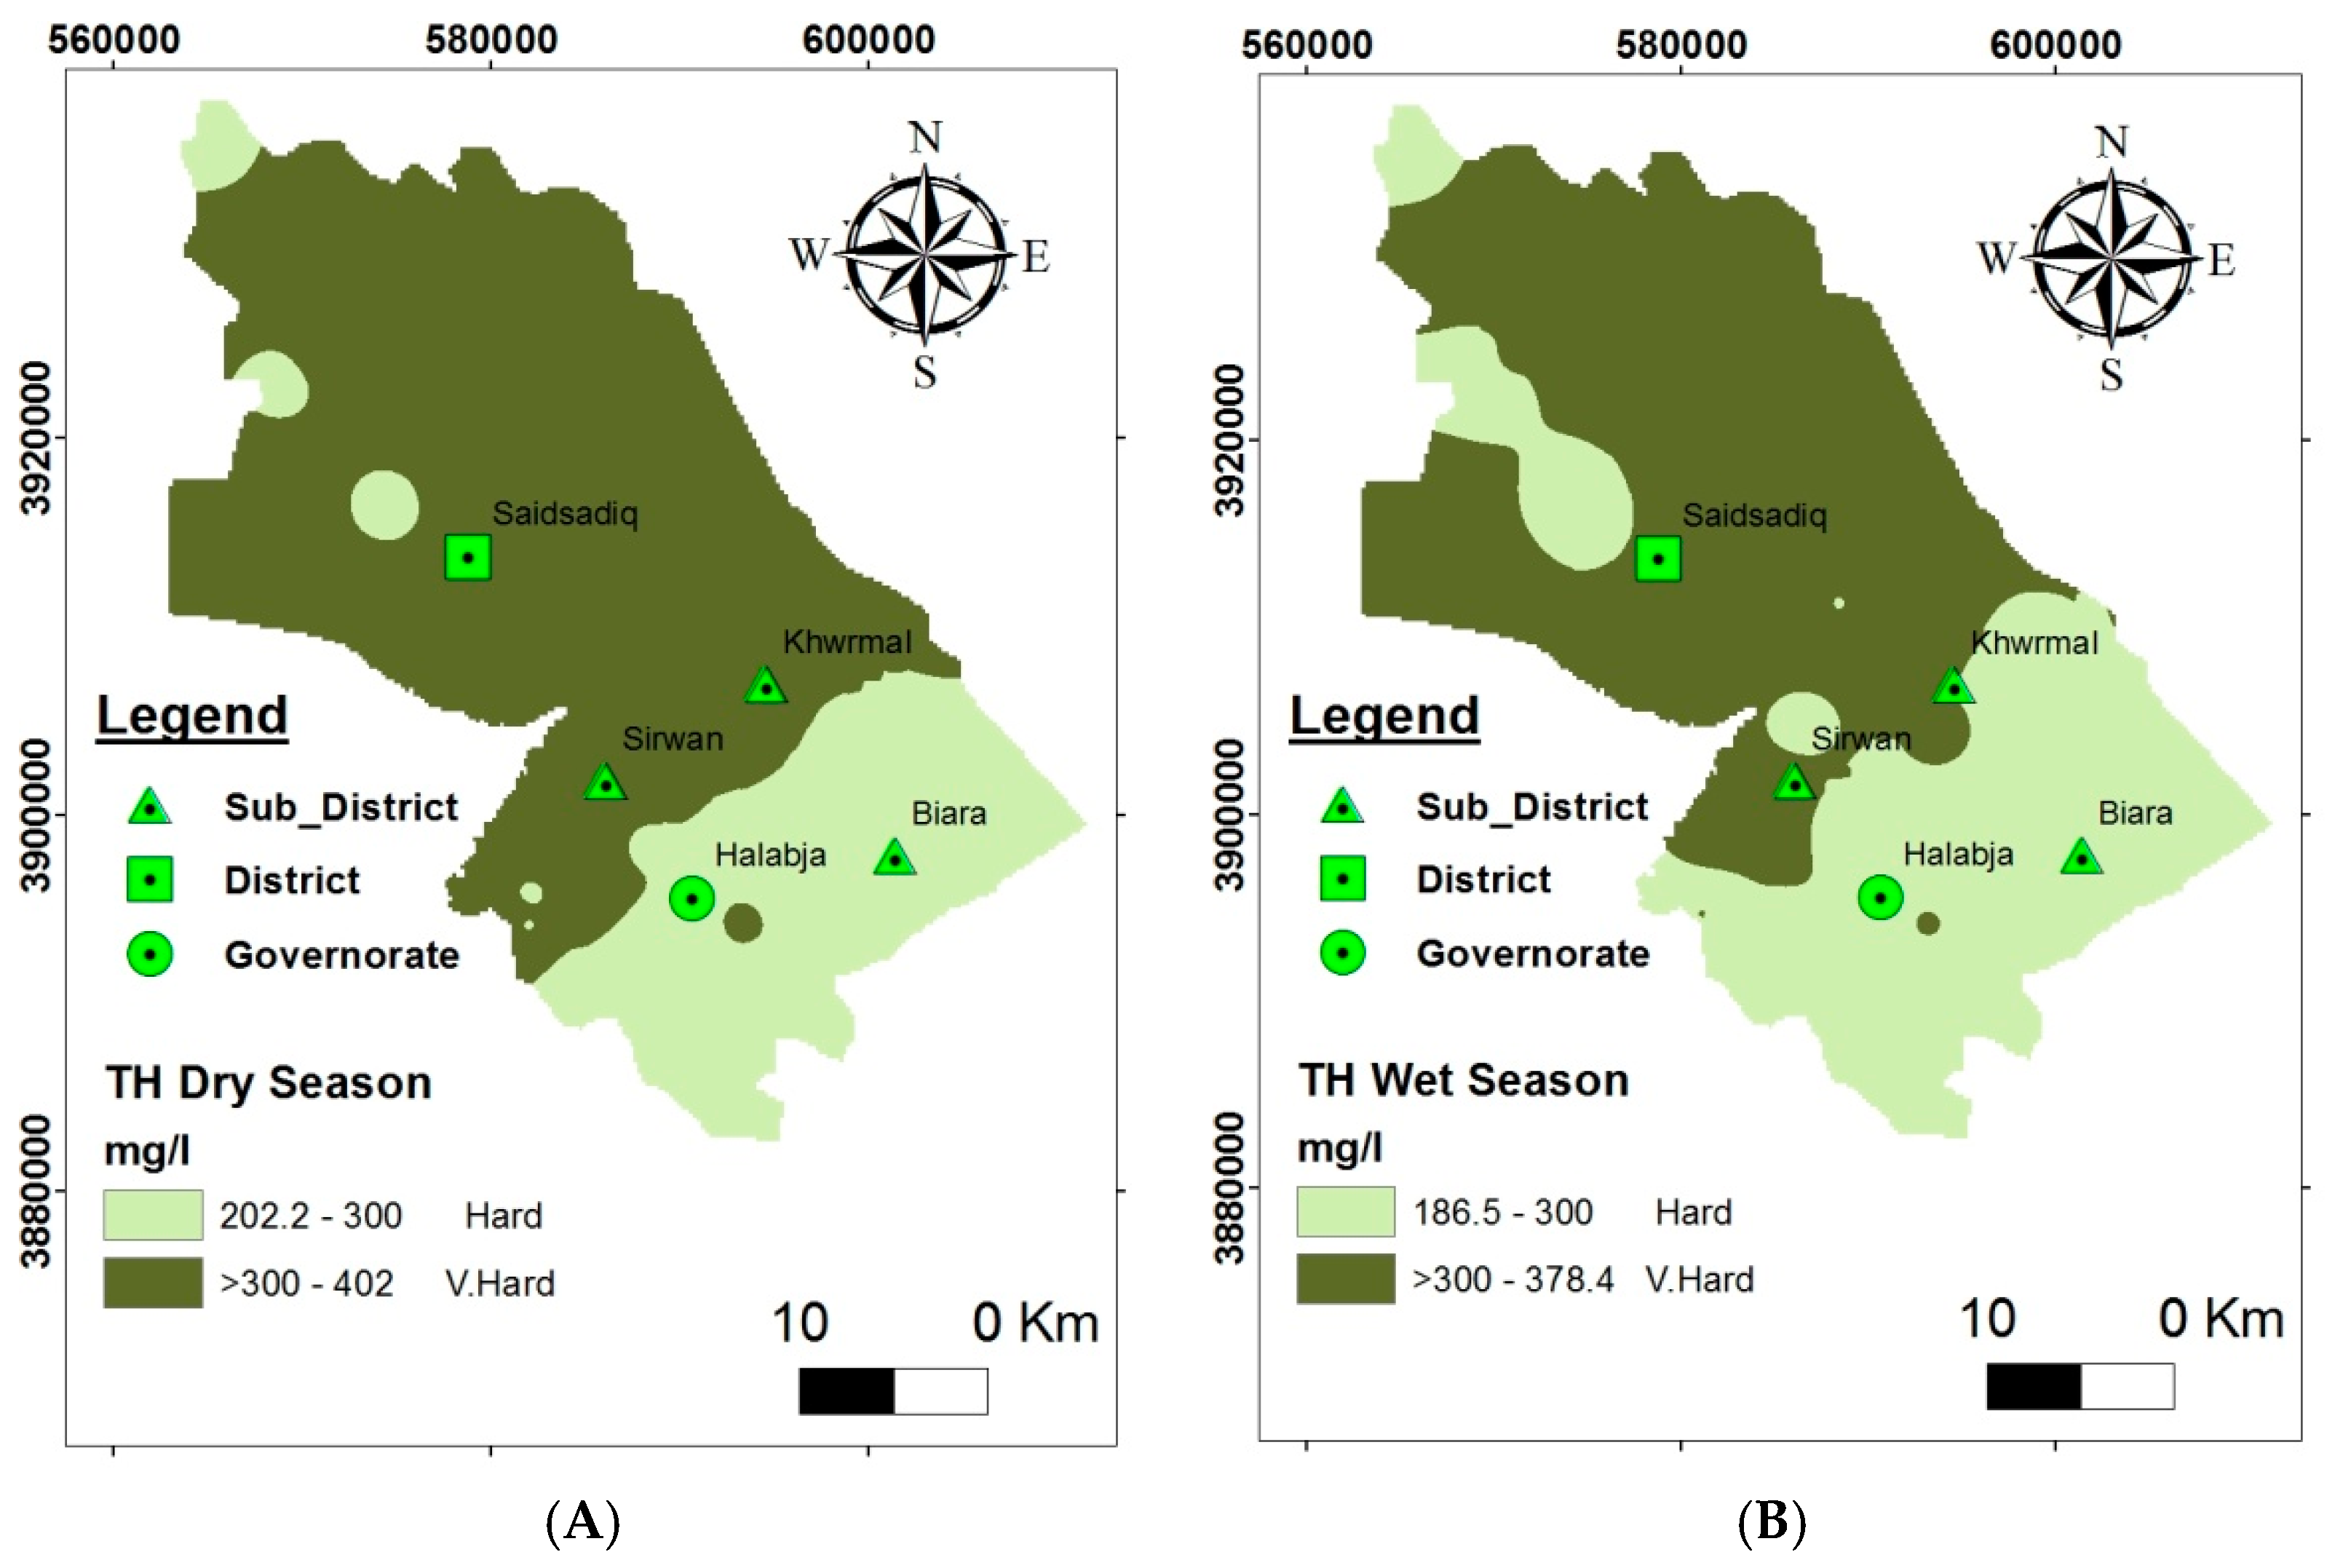
Hardness is an essential property of water from the perspective of drinking application [29]. Figure 9 illustrates the spatial and temporal disparity of groundwater hardness in the HSB. Groundwater investigation reveals that groundwater in the HSB is hard to very hard when referring to the classification proposed by [30], because the average hardness is 318 mg/L for the dry season and 299 mg/L for the wet season. The proper upper limit of TH is 500 mg/L [31]. Consequently, the results of the analysis reveal that the whole studied basin in both seasons has an acceptable limit of total hardness in the groundwater for drinking purposes. Accordingly, TH above 300 mg/L is not suitable for drinking [32]; this water may cause scaling in the public water supply system and also requires more detergents for cleaning and causes yellowing of fabrics.
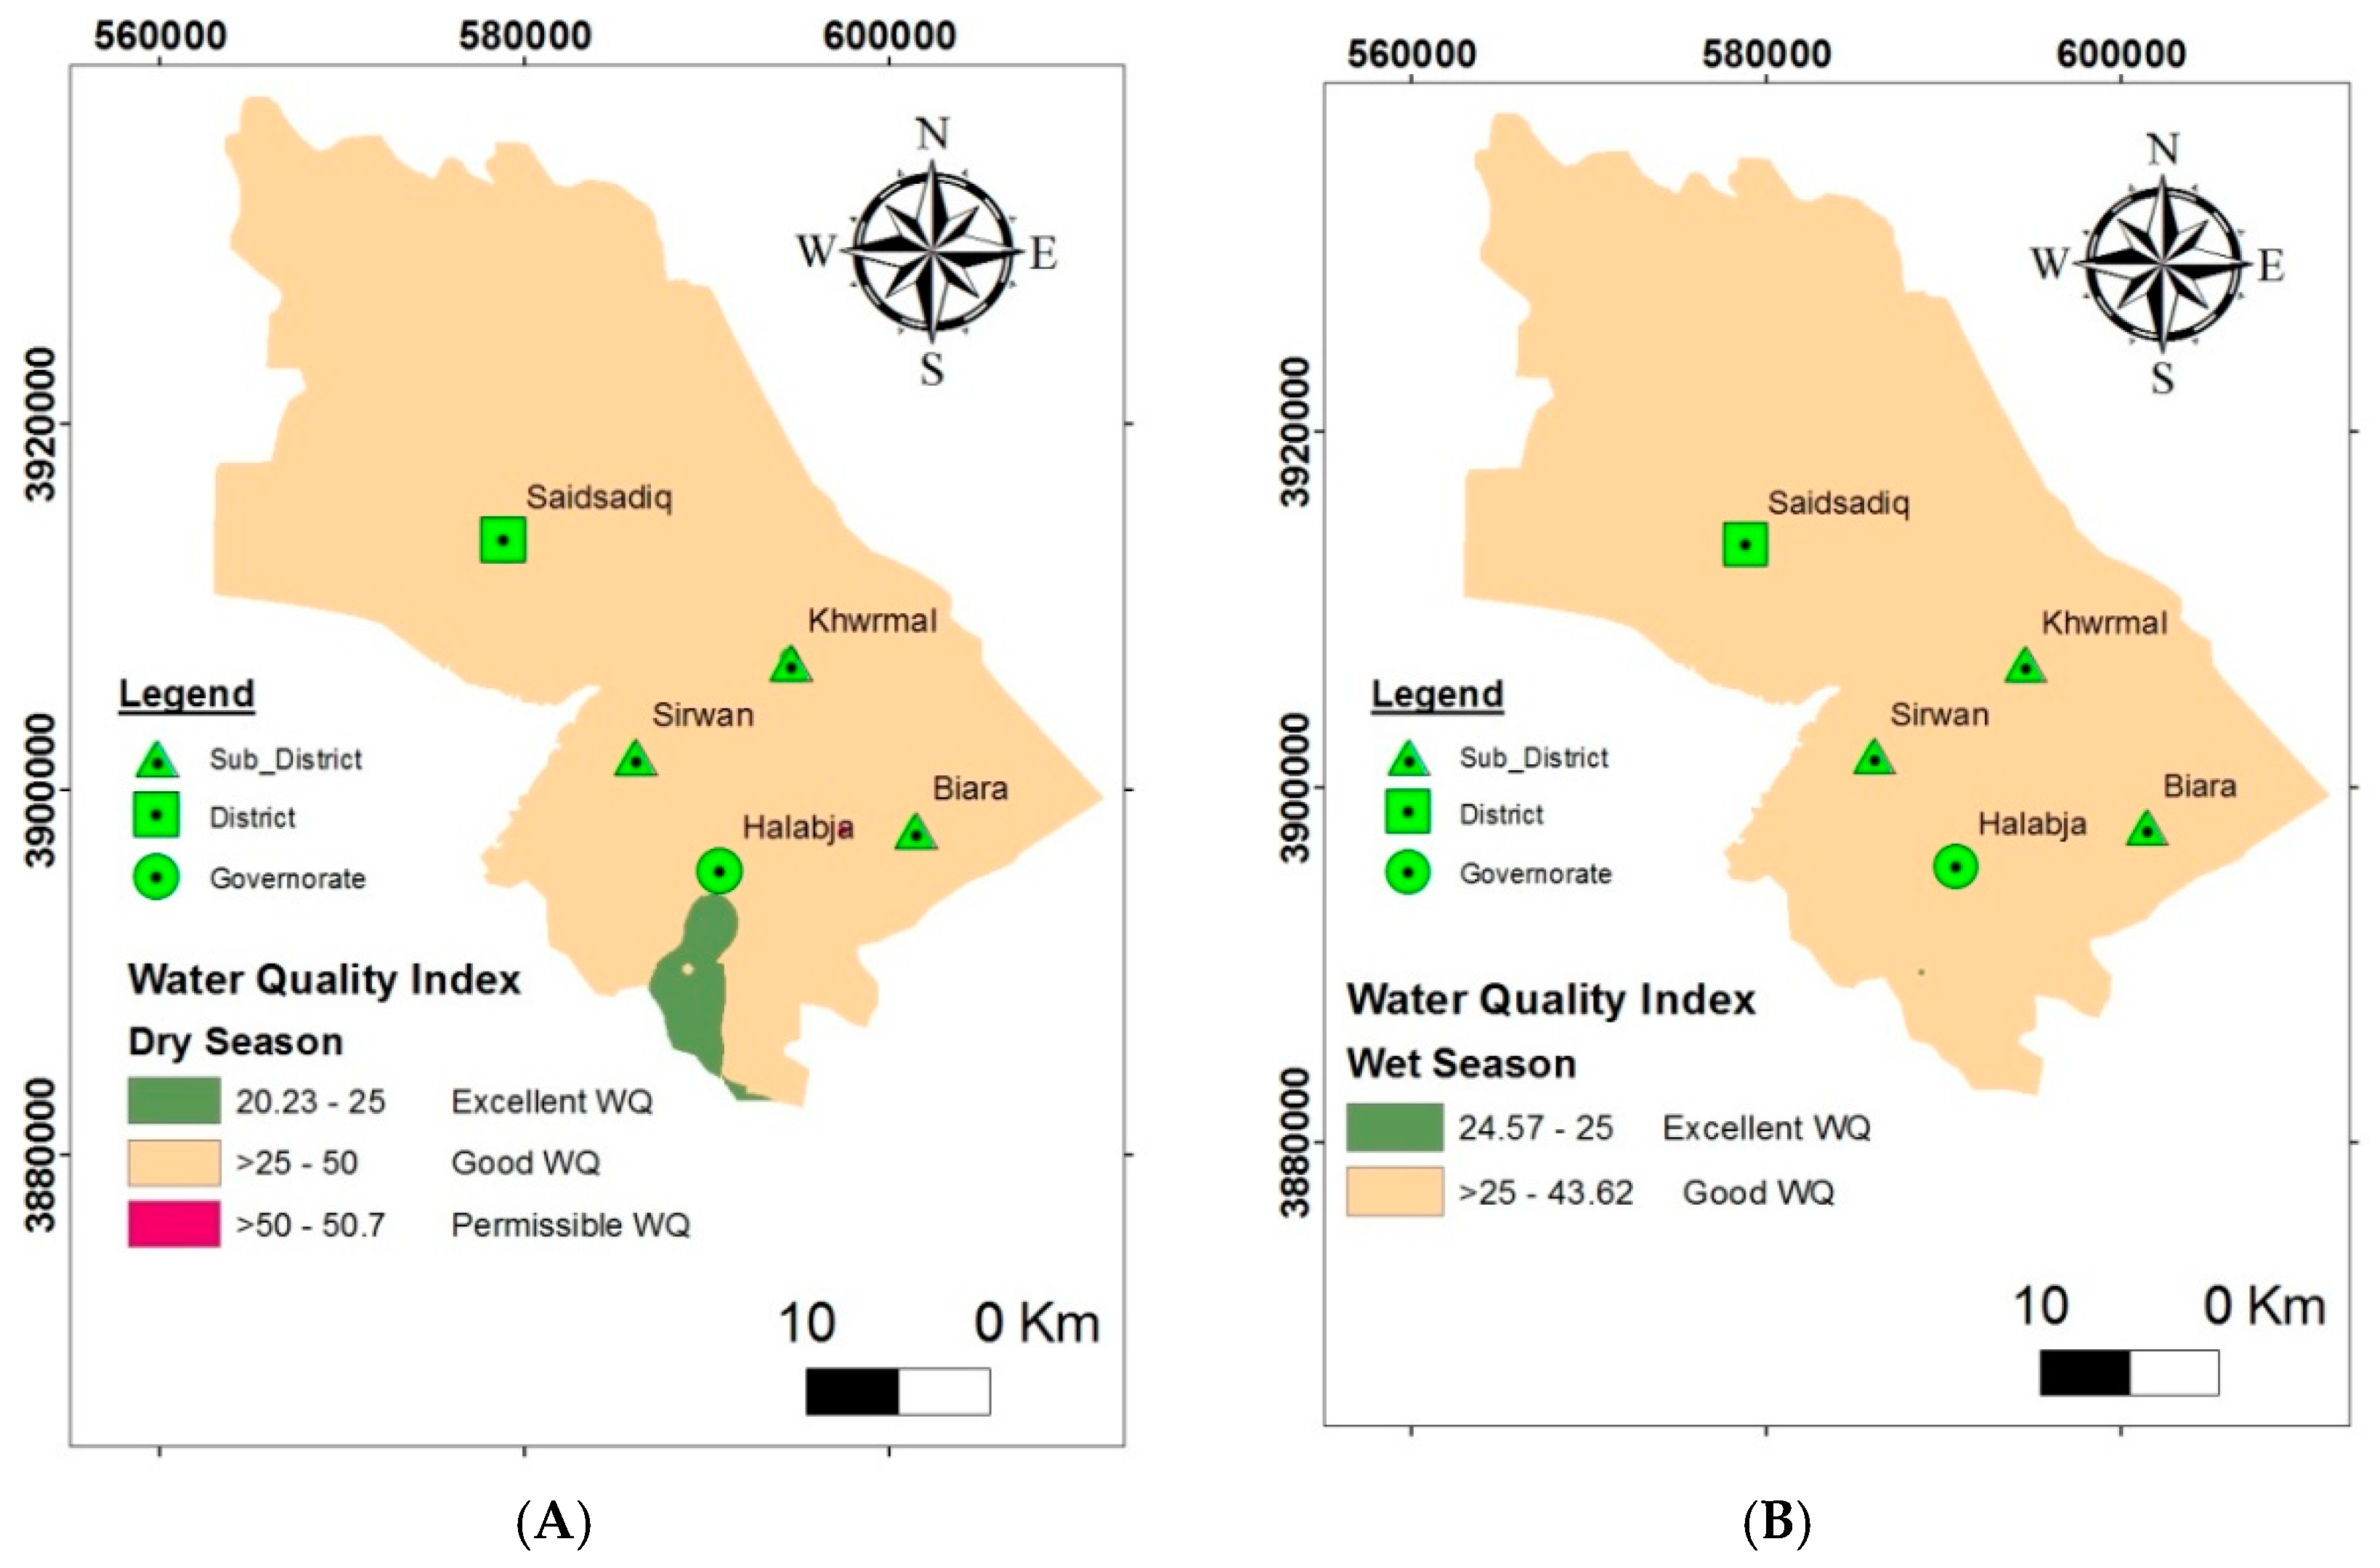
The water quality index was applied to evaluate the groundwater quality of the HSB for consumption purposes. The comparative weight, quality ranking, and subindex were constructed for each parameter, and the WQI at the monitoring wells in each season was resolved. The inverse distance weight (IDW) method of a GIS technique was applied to interpolate the WQI rates, in order to create a WQI map for the HSB. The WQI fluctuated from 20.23 to 50.7 throughout the dry season, and from 24.57 to 43.62 during the wet season (Figure 10). The WQI map reveals that the groundwater aquifer in the studied basin can be divided into three classes, including excellent, good, and permissible water quality for the dry season, while for the wet season, only two classes were observed, of excellent and good water quality. The high level of good water quality of the wet season compared to the dry season might be associated with the groundwater recharge throughout the winter and spring seasons. The dilution due to rain might be the reason for improved water quality in the wet season. It was observed that at different sampling locations, the quality of water varied as well, due to the impact of different geological formations, which plays a major role in groundwater flow and quality in the study area.
4. Conclusions
The groundwater quality of the HSB has been evaluated by using physicochemical parameters, and the drinking suitability of groundwater was examined through the WQI. The dominate groundwater type in this basin is alkaline water with existing bicarbonate as well as sulfate and chloride, and this might be due to the geology of the area and water-rich ionic exchange, and the groundwater samples were in the class of hard to very hard for most of the groundwater samples.
The spatial distribution of WQI for 78 samples distributed over the studied basin ranged from 20.23 to 50.7 and 24.57 to 43.62 in the dry and the wet seasons, respectively. The results of the WQI for drinking show that the groundwater of this basin has permissible to excellent groundwater quality in the dry season, and a good to excellent groundwater quality in the wet season, for approximately all groundwater samples. The higher levels of groundwater quality in the wet season, compared to the dry season, might be expected, due to the groundwater recharge during the winter and spring periods, which leads to a dilution of chemical components, in contrast with high irrigation and agricultural activities and groundwater discharge in the dry season, which leads to increased concentrations of chemical components. The present study reveals the high competence of GIS in analyzing complicated spatial data and mapping of groundwater quality. This case study proposed an applicable method which may be relevant to other regions in the world, as part of an attempt towards achieving the goals in groundwater utilization and management. Overall, it may be inferred that the applied method may serve as a tool for describing water quality in terms of the specific water usage for water supply. The WQI may also be used as a tool for measuring trends of water quality in water resources.
Author Contributions
Field and lab work, methodology, techniques, validation and visualization, writing the first and final drafts of the paper, T.O.A.; discussions and supervision of the work and writing the final draft of the paper, S.S.A., N.A.A.-A., S.K.
Funding
This research was funded by Lulea University of Technology and Sulaimani University.
Conflicts of Interest
The authors declare no conflict of interest.
References
- Mtoni, Y.; Mjemah, I.C.; Bakundukize, C.; Van Camp, M.; Martens, K.; Walraevens, K. Saltwater Intrusion and Nitrate Pollution in the Coastal Aquifer of Dares Salaam, Tanzania. Environ. Earth Sci. 2013, 70, 1091–1111. [Google Scholar] [CrossRef]
- Yakirevich, A.; Weisbrod, N.; Kuznetsov, M.; Rivera Villarreyes, C.A.; Benavent, I.; Chavez, A.M.; Ferrando, D. Modeling the Impact of Solute Recycling on Groundwater Salinization Under Irrigated Lands: A Study of the Alto Piura Aquifer, Peru. J. Hydrol. 2013, 482, 25–39. [Google Scholar] [CrossRef]
- Zahid, A.; Hassan, M.Q.; Balke, K.D.; Flegr, M.; Clark, D.W. Groundwater chemistry and occurrence of arsenic in the Meghna flood plain aquifer, southeastern Bangladesh. Environ. Geol. 2008, 54, 1247–1260. [Google Scholar] [CrossRef]
- Gunduz, O.; Simsek, C.; Hasozbek, A. Arsenic pollution in the groundwater of Simav plain, Turkey: Its impact on water quality and human health. Water Air Soil Pollut. 2010, 205, 43–62. [Google Scholar] [CrossRef]
- Brindha, K.; Elango, L. Impact of tanning industries on groundwater quality near ametropolitan city in India. Water Resour. Manag. 2012, 26, 1747–1761. [Google Scholar] [CrossRef]
- Kraiem, Z.; Zouari, K.; Chkir, N.; Agoune, A. Geochemical characteristics of arid shallow aquifers in Chott Djerid, south-western Tunisia. J. Hydro-Environ. Res. 2014, 8, 460–473. [Google Scholar] [CrossRef]
- Bouderbala, A.; Remini, B.; Pulido-Bosch, A. Hydrogeological characterization of the Nador Plio-quaternary aquifer, Tipaza (Algeria). Bol. Geol. Min. 2014, 125, 77–89. [Google Scholar]
- Houatmia, F.; Azouzi, R.; Charef, A.; Bédir, M. Assessment of groundwater quality for irrigation and drinking purposes and identification of hydrogeochemical mechanisms evolution in northeastern, Tunisia. Environ. Earth Sci. 2016, 75, 746. [Google Scholar] [CrossRef]
- Chakraborty, S.; Kumar, R.N. Assessment of groundwater quality at a MSW landfill site using standard and AHP based water quality index: A case study from Ranchi, Jharkhand, India. Environ. Monit. Assess. 2016, 188, 1–18. [Google Scholar] [CrossRef]
- Pati, S.; Dash, M.K.; Mukherjee, C.K.; Dash, B.; Pokhrel, S. Assessment of water quality using multivariate statistical techniques in the coastal region of Visakhapatnam, India. Environ. Monit. Assess. 2014, 186, 6385–6402. [Google Scholar] [CrossRef]
- Bouderbala, A.; Remini, B.; Saaed, H.A.; Pulido-Bosch, A. Application of multivariate statistical techniques for characterization of groundwater quality in the coastal aquifer of Nador, Tipaza (Algeria). Acta Geophys. 2016, 64, 670–693. [Google Scholar] [CrossRef]
- Abdullah, T.O.; Ali, S.S.; Al-Ansari, N.A.; Knutsson, S. Groundwater Vulnerability Mapping using Lineament Density on Standard DRASTIC Model: Case Study in Halabja Saidsadiq Basin, Kurdistan Region, Iraq. Engineering 2015, 7, 644–667. [Google Scholar] [CrossRef]
- Buday, T. Regional Geology of Iraq; Volume 1, Stratigraphy; Kassab, I.I., Jassim, S.Z., Eds.; Directorate General for Geological Survey and Mineral Investigations: Baghdad, Iraq, 1980; p. 445. [Google Scholar]
- Buday, T.; Jassim, S. The Regional Geology of Iraq: Tectonis, Magmatism, and Metamorphism; Kassab, I.I., Abbas, M.J., Eds.; Geological Survey and Mineral Investigations: Baghdad, Iraq, 1987; p. 445. [Google Scholar]
- Ali, S.S. Geology and Hydrogeology of Sharazoor-Piramagroon Basin in Sulaimani Area, Northeastern Iraq. Unpublished. Ph.D. Thesis, Faculty of Mining and Geology, University of Belgrade, Beograd, Serbia, 2007; p. 317. [Google Scholar]
- Abdullah, T.O.; Ali, S.S.; Al-Ansari, N.A. Groundwater assessment of Halabja Saidsadiq Basin, Kurdistan region, NE of Iraq using vulnerability mapping. Arab. J. Geosci. 2016, 9, 223. [Google Scholar] [CrossRef]
- Jassim, S.Z. Geology of Iraq; Geological Society of London: London, UK, 2006; p. 340. [Google Scholar]
- Abdullah, T.O.; Ali, S.S.; Al-Ansari, N.A. Possibility of Groundwater Pollution in Halabja Saidsadiq Hydrogeological Basin, Iraq Using Modified DRASTIC Model Based on AHP and Tritium Isotopes. Geosciences (MDPI) 2018, 8, 236. [Google Scholar] [CrossRef]
- Hill, R.A. Geochemical Patterns in the Coachella Valley, California. Trans. Am. Geophys. Union 1940, 21, 46–49. [Google Scholar] [CrossRef]
- Durov, S.A. Natural Waters and Graphic Representation of Their Compositions. Dokl. Akad. Nauk SSSR 1948, 59, 87–90. [Google Scholar]
- Chadha, D.K. A Proposed New Diagram for Geochemical Classification of Natural Waters and Interpretation of Chemical Data. Hydrogeol. J. 1999, 7, 431–439. [Google Scholar] [CrossRef]
- APHA. Standard Methods of the Examination of Water and Wastewater; American Public Health Association: Washington, DC, USA, 2005. [Google Scholar]
- Faure, G. Principles and Application of Geochemistry, 2nd ed.; Prentice Hall Inc.: Upper Saddle River, NJ, USA, 1998; p. 600. [Google Scholar]
- WHO (World Health Organization). Guidelines for Drinking–Water Quality, 3rd ed.; WHO: Recommendations, Geneva, 2006; Volume 1, p. 515. [Google Scholar]
- Chatterjee, C.; Raziuddin, M. Studies on the water quality of a water body at Asansol Town, West Bengal. Nat. Environ. Pollut. Technol. 2007, 6, 289–292. [Google Scholar]
- Langguth, H.R. Groundwater verhaltisse in Bereiech Des Velberter. In Sattles. Der Minister Fur Eraehrung, Land Wirtsch Forste; NRW: Duesseldorf, Germany, 1966; p. 127. [Google Scholar]
- Freeze, R.A.; Cherry, J.A. Groundwater; Printice-Hall: Upper Saddle River, NJ, USA, 1979. [Google Scholar]
- Rajesh, R.; Brindha, K.; Elango, L. Groundwater Quality and its Hydrochemical Characteristics in a Shallow Weathered Rock Aquifer of Southern India. Water Qual. Expo. Health 2015, 7, 515–524. [Google Scholar] [CrossRef]
- Goyal, S.K.; Chaudhary, B.S.; Singh, O.; Sethi, G.K.; Thakur, P.K. GIS Based Spatial Distribution Mapping and Suitability Evaluation of Groundwater Quality for Domestic and Agricultural Purpose in Kaithal Distirct, Haryana State, India. Environ. Earth Sci. 2010. [Google Scholar] [CrossRef]
- Boyd, C.E. Water Quality an Introduction; Kluwer Academic Publisher: Dordrecht, The Netherlands, 2000; p. 330. [Google Scholar]
- IQS. Iraqi Standards for Drinking Water. Draft of Improving Standards No. 417/1996; Iraqi Government: Baghdad, Iraq, 1996. (in Arabic)
- Brindha, K.; Kavitha, R. Hydrochemical assessment of surface water and groundwater quality along Uyyakondan channel, south India. Environ. Earth Sci. 2014, 73, 5383–5393. [Google Scholar] [CrossRef]
Figure 1.
Site map of the Halabja Saidsadiq Basin (HSB) [16].
Figure 1.
Site map of the Halabja Saidsadiq Basin (HSB) [16].


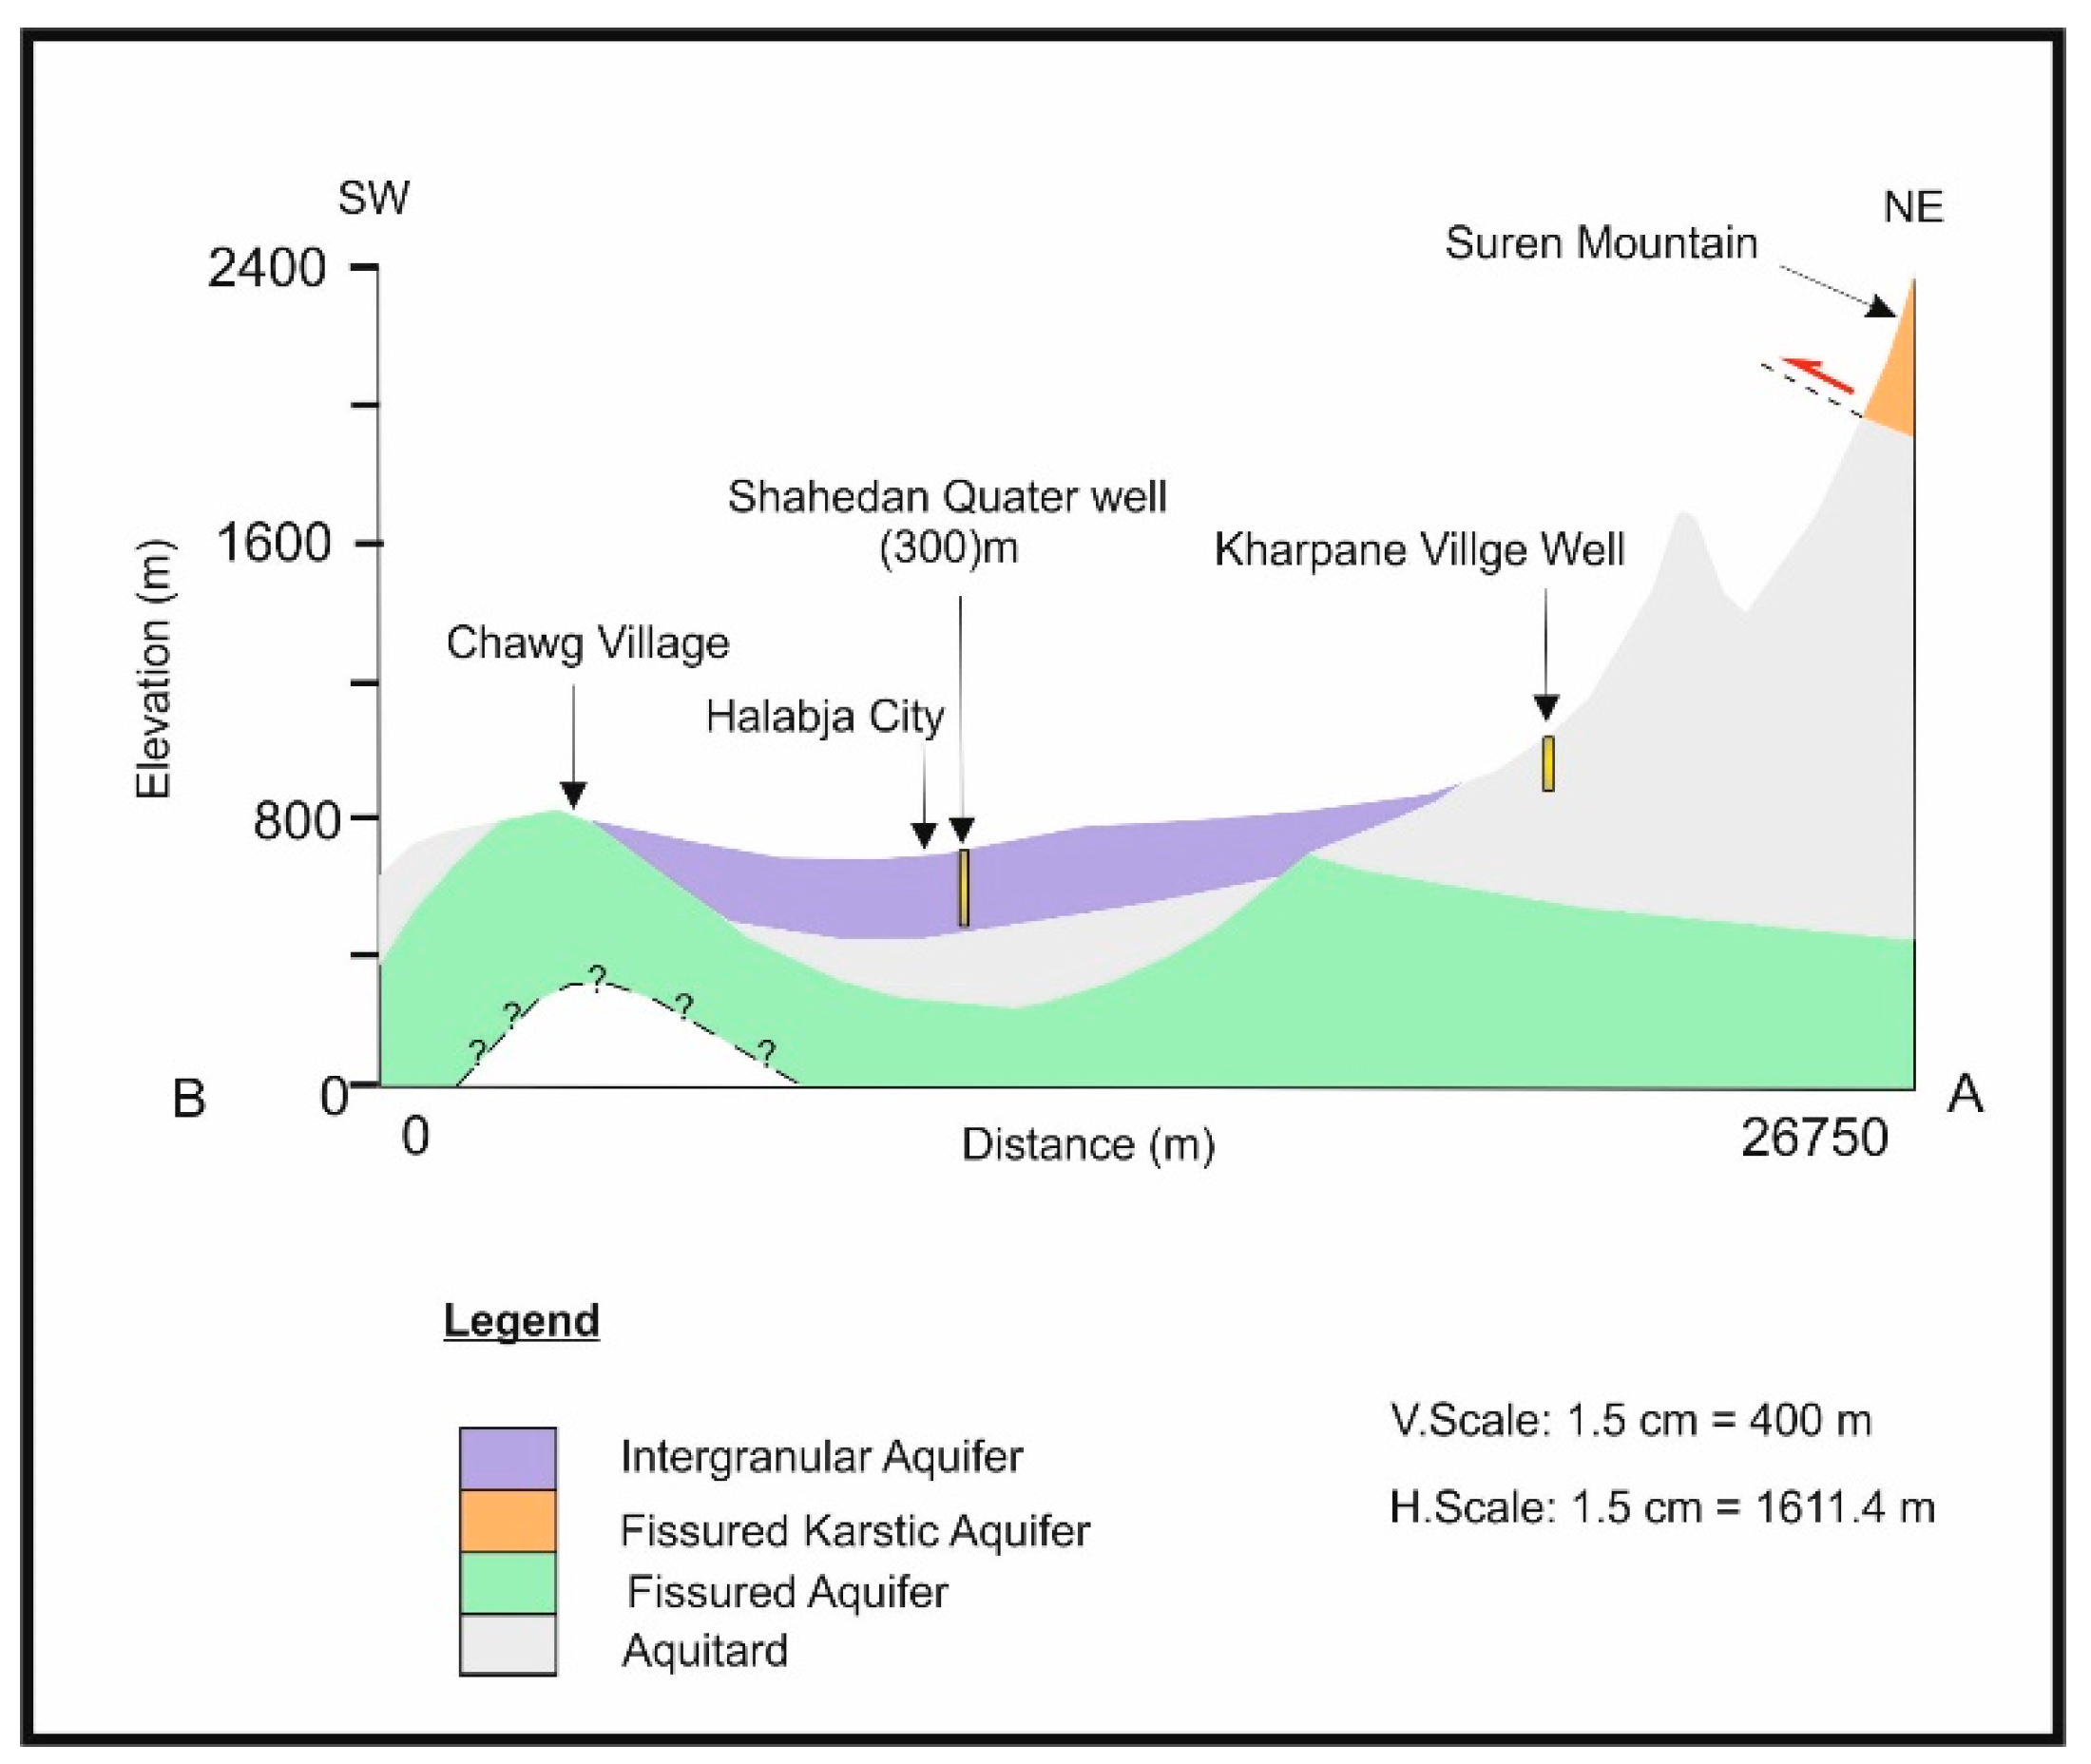
Figure 4.
Hydrogeological cross section along the A–B line for the HSB.

Figure 5.
Site map of collected groundwater samples.

Figure 6.
Hydrochemical composition of the groundwater analysis based on a Piper diagram (in % meq/L) from the HSB in the dry season.
Figure 6.
Hydrochemical composition of the groundwater analysis based on a Piper diagram (in % meq/L) from the HSB in the dry season.

Figure 7.
Hydrochemical composition of the groundwater analysis based on a Piper diagram (in % meq/L) from the HSB in the wet season.
Figure 7.
Hydrochemical composition of the groundwater analysis based on a Piper diagram (in % meq/L) from the HSB in the wet season.

Figure 8.
Suitability of groundwater for domestic purposes based on the spatial distribution of TDS: (A) dry season and (B) wet season.
Figure 8.
Suitability of groundwater for domestic purposes based on the spatial distribution of TDS: (A) dry season and (B) wet season.

Figure 9.
Groundwater suitability for domestic purposes according to the spatial distribution of TH: (A) dry season and (B) wet season.
Figure 9.
Groundwater suitability for domestic purposes according to the spatial distribution of TH: (A) dry season and (B) wet season.

Figure 10.
Map of water quality index for domestic use: (A) dry season and (B) wet season.


Table 1.
Aquifers in the HSB.
| Aquifer | Formation | Thickness (m) | References |
|---|---|---|---|
| Intergranular Aquifer (AIA) | Quaternary deposits | >300 | [12] |
| Fissured Aquifer (CFA) | Balambo Kometan | 250 | [15] |
| Fissured-Karstic Aquifer (CKFA) | Avroman Jurassic formation | 200 80–200 | [17] |
| Karstic Aquifer (TKA) and (JKA) | Avroman Jurassic | 200 80–200 | [17] |
| Non-Aquifer (Aquiclude, Aquitard, and TAT) | Qulqula Shiranish Tanjero | >500 225 2000 | [14] |
Table 2.
Hydrochemical parameters and methods of analysis conducted in the laboratory at the Sulaimani Directorate of Environment. TDS: total dissolved solid.
Table 2.
Hydrochemical parameters and methods of analysis conducted in the laboratory at the Sulaimani Directorate of Environment. TDS: total dissolved solid.
| Parameters | Methods |
|---|---|
| TDS | Gravimetric |
| HCO3−, Cl−, TH as CaCO3, Ca2+, Mg2+, Na+, K+ | Titration |
| SO42−, NO3− | Colorimetric |
Table 3.
The weight (wi) and relative weight (Wi) for each applied parameter. EC: electrical conductivity.
Table 3.
The weight (wi) and relative weight (Wi) for each applied parameter. EC: electrical conductivity.
| Parameters | Drinking Water | ||
|---|---|---|---|
| [24] | Weight (wi) | Relative Weight (Wi) | |
| EC (μS/cm) | 1500 | 5 | 0.119 |
| TDS (mg/L) | 1000 | 5 | 0.119 |
| Cl− (mg/L) | 250 | 5 | 0.119 |
| SO42− (mg/L) | 200 | 5 | 0.119 |
| Na+ (mg/L) | 150 | 5 | 0.119 |
| NO3− (mg/L) | 50 | 5 | 0.119 |
| Mg2+ (mg/L) | 75 | 4 | 0.095 |
| Ca2+ (mg/L) | 100 | 2 | 0.0048 |
| HCO3− (mg/L) | 300 | 2 | 0.048 |
| K+ (mg/L) | 12 | 1 | 0.024 |
| pH | 8.5 Total | 3 Ʃwi = 42 | 0.071 Ʃwi = 1 |
Table 4.
Recommended classes of drinking water quality according to the water quality index (WQI) standards [25].
Table 4.
Recommended classes of drinking water quality according to the water quality index (WQI) standards [25].
| Class | Range of WQI for Drinking Purposes | Type of Water Quality |
|---|---|---|
| 1 | <25 | Excellent water quality |
| 2 | 25.1–50 | Good water quality |
| 3 | 50.1–75 | Permissible water quality |
| 4 | 75.1–100 | Doubtful water quality |
| 5 | 100 | Water unsuitable for drinking uses |
Table 5.
Chemical investigation of groundwater of the HSB (both seasons). TH: total hardness.
| Parameters | Dry Season | Wet Season | ||||||
|---|---|---|---|---|---|---|---|---|
| Max. | Min. | Average | SD | Max. | Min. | Average | SD | |
| EC | 1430.00 | 356.00 | 568.03 | 236.21 | 2400.00 | 264.00 | 517.11 | 380.10 |
| TDS | 630.00 | 16.80 | 20.21 | 1.83 | 550.00 | 120.00 | 211.10 | 76.30 |
| TH | 454.60 | 210.00 | 331.20 | 50.60 | 429.00 | 190.40 | 312.30 | 47.60 |
| pH | 8.20 | 7.26 | 7.72 | 0.26 | 8.08 | 6.48 | 7.66 | 0.26 |
| Cl (mg/L) | 49.40 | 17.30 | 33.91 | 8.30 | 45.40 | 14.20 | 29.06 | 7.43 |
| SO4 (mg/L) | 116.00 | 5.90 | 34.60 | 30.10 | 110.20 | 4.00 | 30.30 | 28.22 |
| Na (mg/L) | 43.00 | 2.00 | 11.20 | 9.90 | 39.50 | 1.80 | 10.08 | 9.60 |
| NO3 (mg/L) | 51.60 | 0.00 | 11.76 | 13.67 | 58.00 | 6.10 | 31.33 | 15.52 |
| Mg (mg/L) | 79.90 | 4.32 | 31.23 | 14.50 | 76.40 | 3.00 | 28.90 | 14.10 |
| Ca(mg/L) | 145.50 | 38.50 | 78.63 | 23.96 | 140.20 | 34.30 | 75.02 | 23.30 |
| HCO3 (mg/L) | 312.50 | 180.50 | 237.61 | 37.89 | 314.20 | 182.10 | 244.20 | 38.42 |
| K (mg/L) | 6.00 | 0.02 | 2.00 | 1.40 | 4.00 | 0.02 | 1.50 | 1.10 |
© 2019 by the authors. Licensee MDPI, Basel, Switzerland. This article is an open access article distributed under the terms and conditions of the Creative Commons Attribution (CC BY) license (http://creativecommons.org/licenses/by/4.0/).
Share and Cite
MDPI and ACS Style
Abdullah, T.O.; Ali, S.S.; Al-Ansari, N.A.; Knutsson, S. Hydrogeochemical Evaluation of Groundwater and Its Suitability for Domestic Uses in Halabja Saidsadiq Basin, Iraq. Water 2019, 11, 690. https://doi.org/10.3390/w11040690
AMA Style
Abdullah TO, Ali SS, Al-Ansari NA, Knutsson S. Hydrogeochemical Evaluation of Groundwater and Its Suitability for Domestic Uses in Halabja Saidsadiq Basin, Iraq. Water. 2019; 11(4):690. https://doi.org/10.3390/w11040690
Chicago/Turabian StyleAbdullah, Twana O., Salahalddin S. Ali, Nadhir A. Al-Ansari, and Sven Knutsson. 2019. "Hydrogeochemical Evaluation of Groundwater and Its Suitability for Domestic Uses in Halabja Saidsadiq Basin, Iraq" Water 11, no. 4: 690. https://doi.org/10.3390/w11040690
Note that from the first issue of 2016, this journal uses article numbers instead of page numbers. See further details here.