Using Desalinated Water for Irrigation: Its Effect on Field Scale Water Flow and Contaminant Transport under Cropped Conditions


Department of Environmental Physics and Irrigation, Institute of Soils, Water and Environmental Sciences, Agricultural Research Organization, The Volcani Center, Rishon LeZion 7505101, Israel
*
Author to whom correspondence should be addressed.
Water 2019, 11(4), 687; https://doi.org/10.3390/w11040687
Submission received: 6 February 2019
/
Revised: 20 March 2019
/
Accepted: 27 March 2019
/
Published: 3 April 2019
(This article belongs to the Special Issue Desalination of Seawater for Agricultural Irrigation)
Abstract
:Pollution of groundwater by nitrate originating from irrigated fields was considered for this study. We hypothesized that under cropped conditions, low-salinity irrigation water (e.g., desalinated water) could reduce nitrate leaching below the root zone, due to two possible mechanisms: (i) decreased vertical water fluxes and (ii) increased nitrogen uptake by plant roots due to chloride–nitrate competition. The main goal of this study was to investigate this hypothesis. Considering a citrus grove, the investigation relied on three-dimensional (3-D) simulations of flow and transport in a variably saturated and spatially heterogeneous flow domain performed for three successive years. Results of the analyses suggest that the main mechanism responsible for the reduction in the nitrate leached below the root zone under irrigation with low-salinity water is the effect of the latter on the spatial distribution of the rate of water uptake by the roots. The latter, in turn, significantly reduces water content, hydraulic conductivity, and vertical velocity, and, consequently, solute mass fluxes along the soil profile. On the other hand, chloride–nitrate interaction has only a relatively small effect on the nitrate mass fluxes at relatively deep soil depths, far below the root zone, particularly when the irrigation water salinity decreases.
1. Introduction
The worldwide population relying on desalinated seawater is expected to increase from 5.5 × 10⁸ in 2015 to 1.7 × 10⁹ in 2050 [1], or in relative numbers: 7.5% of the world population in 2015 to a projected 18% in 2050. Global production capacity of desalinated seawater is predicted to double between 2011 and 2040 [2]. In Israel, five large desalination plants were built on the Mediterranean coast between 2005 and 2015 (production ≥ 90 × 106 m3/yr per plant; total 585 × 106 m3/yr [3]), bringing the desalinated seawater from close to 0 at 2004 to ~40% of the total Israeli freshwater consumption in 2017 [4].
The Israeli seawater desalination capacity is planned to increase to 900 × 106 m3/yr by 2024, and to 1100 × 106 m3/yr by 2030 [5], and dominate potable water production in this Mediterranean-climate country. With respect to irrigation with desalinated seawater in Israel between 2015–2017, we estimate it at 200 × 106 m3/yr, which is about 40% of the national freshwater irrigation consumption [4,6].
The shift from natural freshwater to desalinated seawater has promoted research on different downstream effects of this change, including public health (e.g., lack of magnesium in drinking water, [7,8,9]); isotope characteristics of reclaimed wastewater [10]; use of desalinated seawater for managed aquifer recharge [11]; and, the most concerning, its use for irrigation. Unease has emerged due to the lack of the major nutrients, namely, calcium, magnesium, and sulfur, in desalinated seawater [12]. Half of the irrigation water in Israel is treated wastewater. The relatively low content of calcium and magnesium in desalinated water and the high addition of sodium in household use has raised concerns about the high sodium adsorption ratio (SAR) in wastewater originating from desalinated seawater [13].
In contrast to the aforementioned concerns, the change towards lower salinity irrigation water may be regarded as an opportunity. Higher yields or smaller irrigation rates for the same yield and reduced leaching of salts below the roots are expected benefits of using more desalinated water for irrigation [14,15]. This study aims at showing that the use of low-salinity water for irrigation can also reduce the nitrate leaching to groundwater (the greatest groundwater pollution related to agriculture in Israel and worldwide, [16]). It is hypothesized here that under cropped conditions, low-salinity irrigation water may reduce nitrate leaching below the root zone, due to two mechanisms: (i) decreasing vertical water fluxes and (ii) increasing nitrogen uptake by plant roots when the latter process is affected by the competition between chloride and nitrate [17].
The general objective of the present study was to investigate the effect of the irrigation water quality (salinity) on water uptake and nitrogen uptake by the plants’ roots, and on the nitrate and the chloride mass fluxes below the root zone. Considering cropped conditions, the specific objective of this study was to identify the main mechanism responsible for the reduction of nitrate mass flux below the root zone under irrigation with low-salinity water. To pursue this goal, water flow and transport of chloride and nitrate in a three-dimensional (3-D), spatially heterogeneous, and variably saturated flow system, under cropped conditions, was investigated by means of numerical simulations. The latter, in turn, relied on physically based models of the flow and the transport, and on geostatistical methods to produce realizations of the heterogeneous soil properties in sufficient resolution.
2. Materials and Methods
2.1. The Physical Domain and its Parametrization
The case under consideration was a citrus orchard located in the central part of the coastal region of Israel, with a distinct rainy period during the winter and irrigation during the rest of the year. The orchard was planted in Hamra Red Mediterranean soil (Rhodoxeralf) whose properties relevant to flow and transport vary considerably in space [18,19]. The orchard planting space was 6 m × 4 m, with trees 4 m apart along the trees’ rows. Each tree row was irrigated every three days by a single line lateral with micro-sprinklers spaced 4 m apart, with a discharge of 75 l/h and mean spraying diameter of 2 m. Based on the temporal behavior of the potential evapotranspiration imposed on the flow system during the irrigation season, the duration of the irrigation events was taken as time-dependent.
Employing a Cartesian coordinate system (x1, x2, x3), where x1 directed downwards, a subplot of this orchard consisting of a 3-D spatially heterogeneous and variably saturated flow domain which extended over L1 = 5 m, L2 = 15 m, and L3 = 10 m along the x1, x2, and x3 axes, respectively, was considered for this study. The subplot included two adjacent tree rows, located 6 m apart, with four trees, located 4 m apart, along each row.
The van Genuchten (VG, 1980) [20] five-parameter model (i.e., saturated conductivity, Ks, shape parameters α and n, as well as the saturated, θs, and residual, θr, values of water content, θ), was implemented here for the local description of the constitutive relationships for unsaturated flow. Based on previous studies [18,19], it was assumed that each of the VG parameters was a second-order stationary, statistically anisotropic, random space function, characterized by a constant mean and a two-point covariance. Parameters of the latter, the variance, and the correlation length scales were adopted from [19]. Mean values of the VG parameters were estimated using the soil texture-based procedure suggested by [21]. Details of the generation of the 3-D cross-correlated realizations of the spatially heterogeneous VG parameters are given in [22]. Mean values and coefficients of variation (CV) of the resultant VG parameters are given in [23].
In addition, deterministic molecular diffusion coefficient for chloride and nitrate in water, D0 = 5.4 × 10⁻⁵ m2/d, dimensionless Henry’s constant, KH = 0.2, and pore-scale dispersion tensor (with longitudinal dispersivity, λL = 2 × 10⁻³ m, and transverse dispersivity, λT = 1 × 10⁻⁴ m, [24]) were considered in the simulations. First-order rate constants for nitrification and denitrification, K1 and K2, respectively, and liquid–solid partitioning coefficient for ammonium, Kd1, were taken into account as depth-dependent implementing values within the range suggested by [25]. Estimates of the root uptake coefficients for ammonium and nitrate, Ku1 and Ku2, respectively, were calculated by extending the method of [26]; for more details, see [27].
2.2. The Flow and Transport Scenarios and their Implementation
Considering water and nitrogen extraction by plant roots, water flow and solute (ammonium, nitrate, chloride, and bromide (tracer)) transport in the 3-D unsaturated and spatially heterogeneous flow system were simulated employing numerical solutions of the 3-D Richards equation, and the 3-D single-region advection dispersion equation (ADE), respectively. Following [27], the ADE was modified to account for nitrogen transformations and uptake by plants’ roots in the soil–water–plant–atmosphere system. Details of the flow and the transport equations and the numerical schemes employed to solve them are given elsewhere [27].
It is worth noting in the present study that, unlike [27], the competition between chloride and nitrate and its effect on the extraction of nitrogen by the plant roots were taken into account, considering the semi-empirical competitive Michaelis–Menten equation [28] to represent the inhibited nitrate uptake:
where RFNO3 is the relative nitrate uptake flux, CCl and CNO3 are the soil solution concentrations of chloride and nitrate, respectively, and Km1 and Km2 are the Michaelis–Menten constants accounting for the affinity of nitrate and chloride to the uptake site, respectively. Note that for CNO3 > 0, RFNO3 → 1 when CCl → 0, whereas RFNO3 → 0 when CNO3 → 0.
RFNO3 = CNO3 / [Km1(1 + CCl / Km2) + CNO3],
In addition, the inhibition of nitrification induced by chloride [29] was also considered here, adopting a linear relationship between the relative reduction in the nitrification rate coefficient, RNITC, and the chloride concentration, namely,
where KCl is a coefficient accounting for the effect of chloride to reduce the nitrification rate. Note that for CNO3 > 0, RNITC → 1 when CCl → 0.
RNITC = min {[1 − (KCl × CCl / CNO3)],1},
The values of Km1, Km2, and Kcl were determined by an optimization procedure that ensures that the selected values minimize the effect of the chloride on nitrogen uptake and nitrification when the chloride concentration approaches its concentration in the desalinated seawater (DSW). Based on this criterion, the values of Km1 = 0.0036 mg/L, Km2 = 0.0023 mg/L, and Kcl = 0.012 were employed in the present study.
A time-invariant root effectiveness function with parameters pertinent to the roots of citrus, with rooting depth of 1.5 m, was adopted from [22]. Assuming that the wetted soil surface area in the orchard is completely covered by the trees’ canopy, the physically plausible assumption of negligibly small soil evaporation rate, (i.e., τp(t) = ετp(t)) was adopted here, where ετp(t) and τp(t) are the potential evapotranspiration and transpiration rates, respectively. The maximization iterative (MI) approach proposed by [30], and applied to 3-D spatially heterogeneous flow domains by [31], was adopted here in order to calculate water uptake by the plant roots, and, concurrently, actual transpiration rate, τa(t). Uptake of nitrate and ammonium by the plants’ roots was also calculated by an MI approach described in [27].
Initial pressure head, ψi, was selected as spatially uniform, ψi(x) = −3m; spatially uniform initial solute concentrations of ammonium, nitrate, and chloride, cik(x), k=1 to 3, respectively, were selected as cik(x) = 5, 50, and 300 mg/L, for k = 1 to 3, respectively; for the tracer (bromide, k = 4), cik = 0. For the flow, a second-type upper boundary condition was imposed on the top boundary (x1=0) with flux that was determined by the time-dependent irrigation and rainfall fluxes, associated with entry zone whose size varied between the irrigation and the rainfall seasons. A unit-head-gradient boundary was specified at the bottom boundary (x1 = L1).
For the transport, a first-type upper boundary condition was imposed on the top boundary with inlet concentrations, C0k, k = 1 to 4, that varied between the irrigation and the rainfall seasons. A zero-gradient boundary was specified at the bottom boundary.
Starting at the beginning of the irrigation season (April 1st), flow and transport simulations were performed for a period of three years, using a sequence of irrigation, rainfall, and potential evapotranspiration records adopted from [23] as a surrogate for the extended period. Annual cumulative depths of irrigation, rainfall, and potential evapotranspiration were 695 mm, 495 mm, and 895 mm, respectively. Irrigation waters with ammonium and nitrate concentrations, CNH4 = 10 and CNO3 = 70 ppm, respectively, and three different chloride concentrations (Ccl = Ciw = 50, 300, and 640 ppm, for the scenarios of desalinated (D), fresh (F) and saline (S) waters, corresponding to D, F, and S, respectively, in the figures), were considered here. Chloride concentration in the rainfall water was 15 ppm, whereas ammonium and nitrate were absent. A tracer (bromide with concentration, Cbro = 10 ppm) was applied as pulse during the first irrigation event.
3. Results
3.1. Water Uptake by the Trees’ Roots
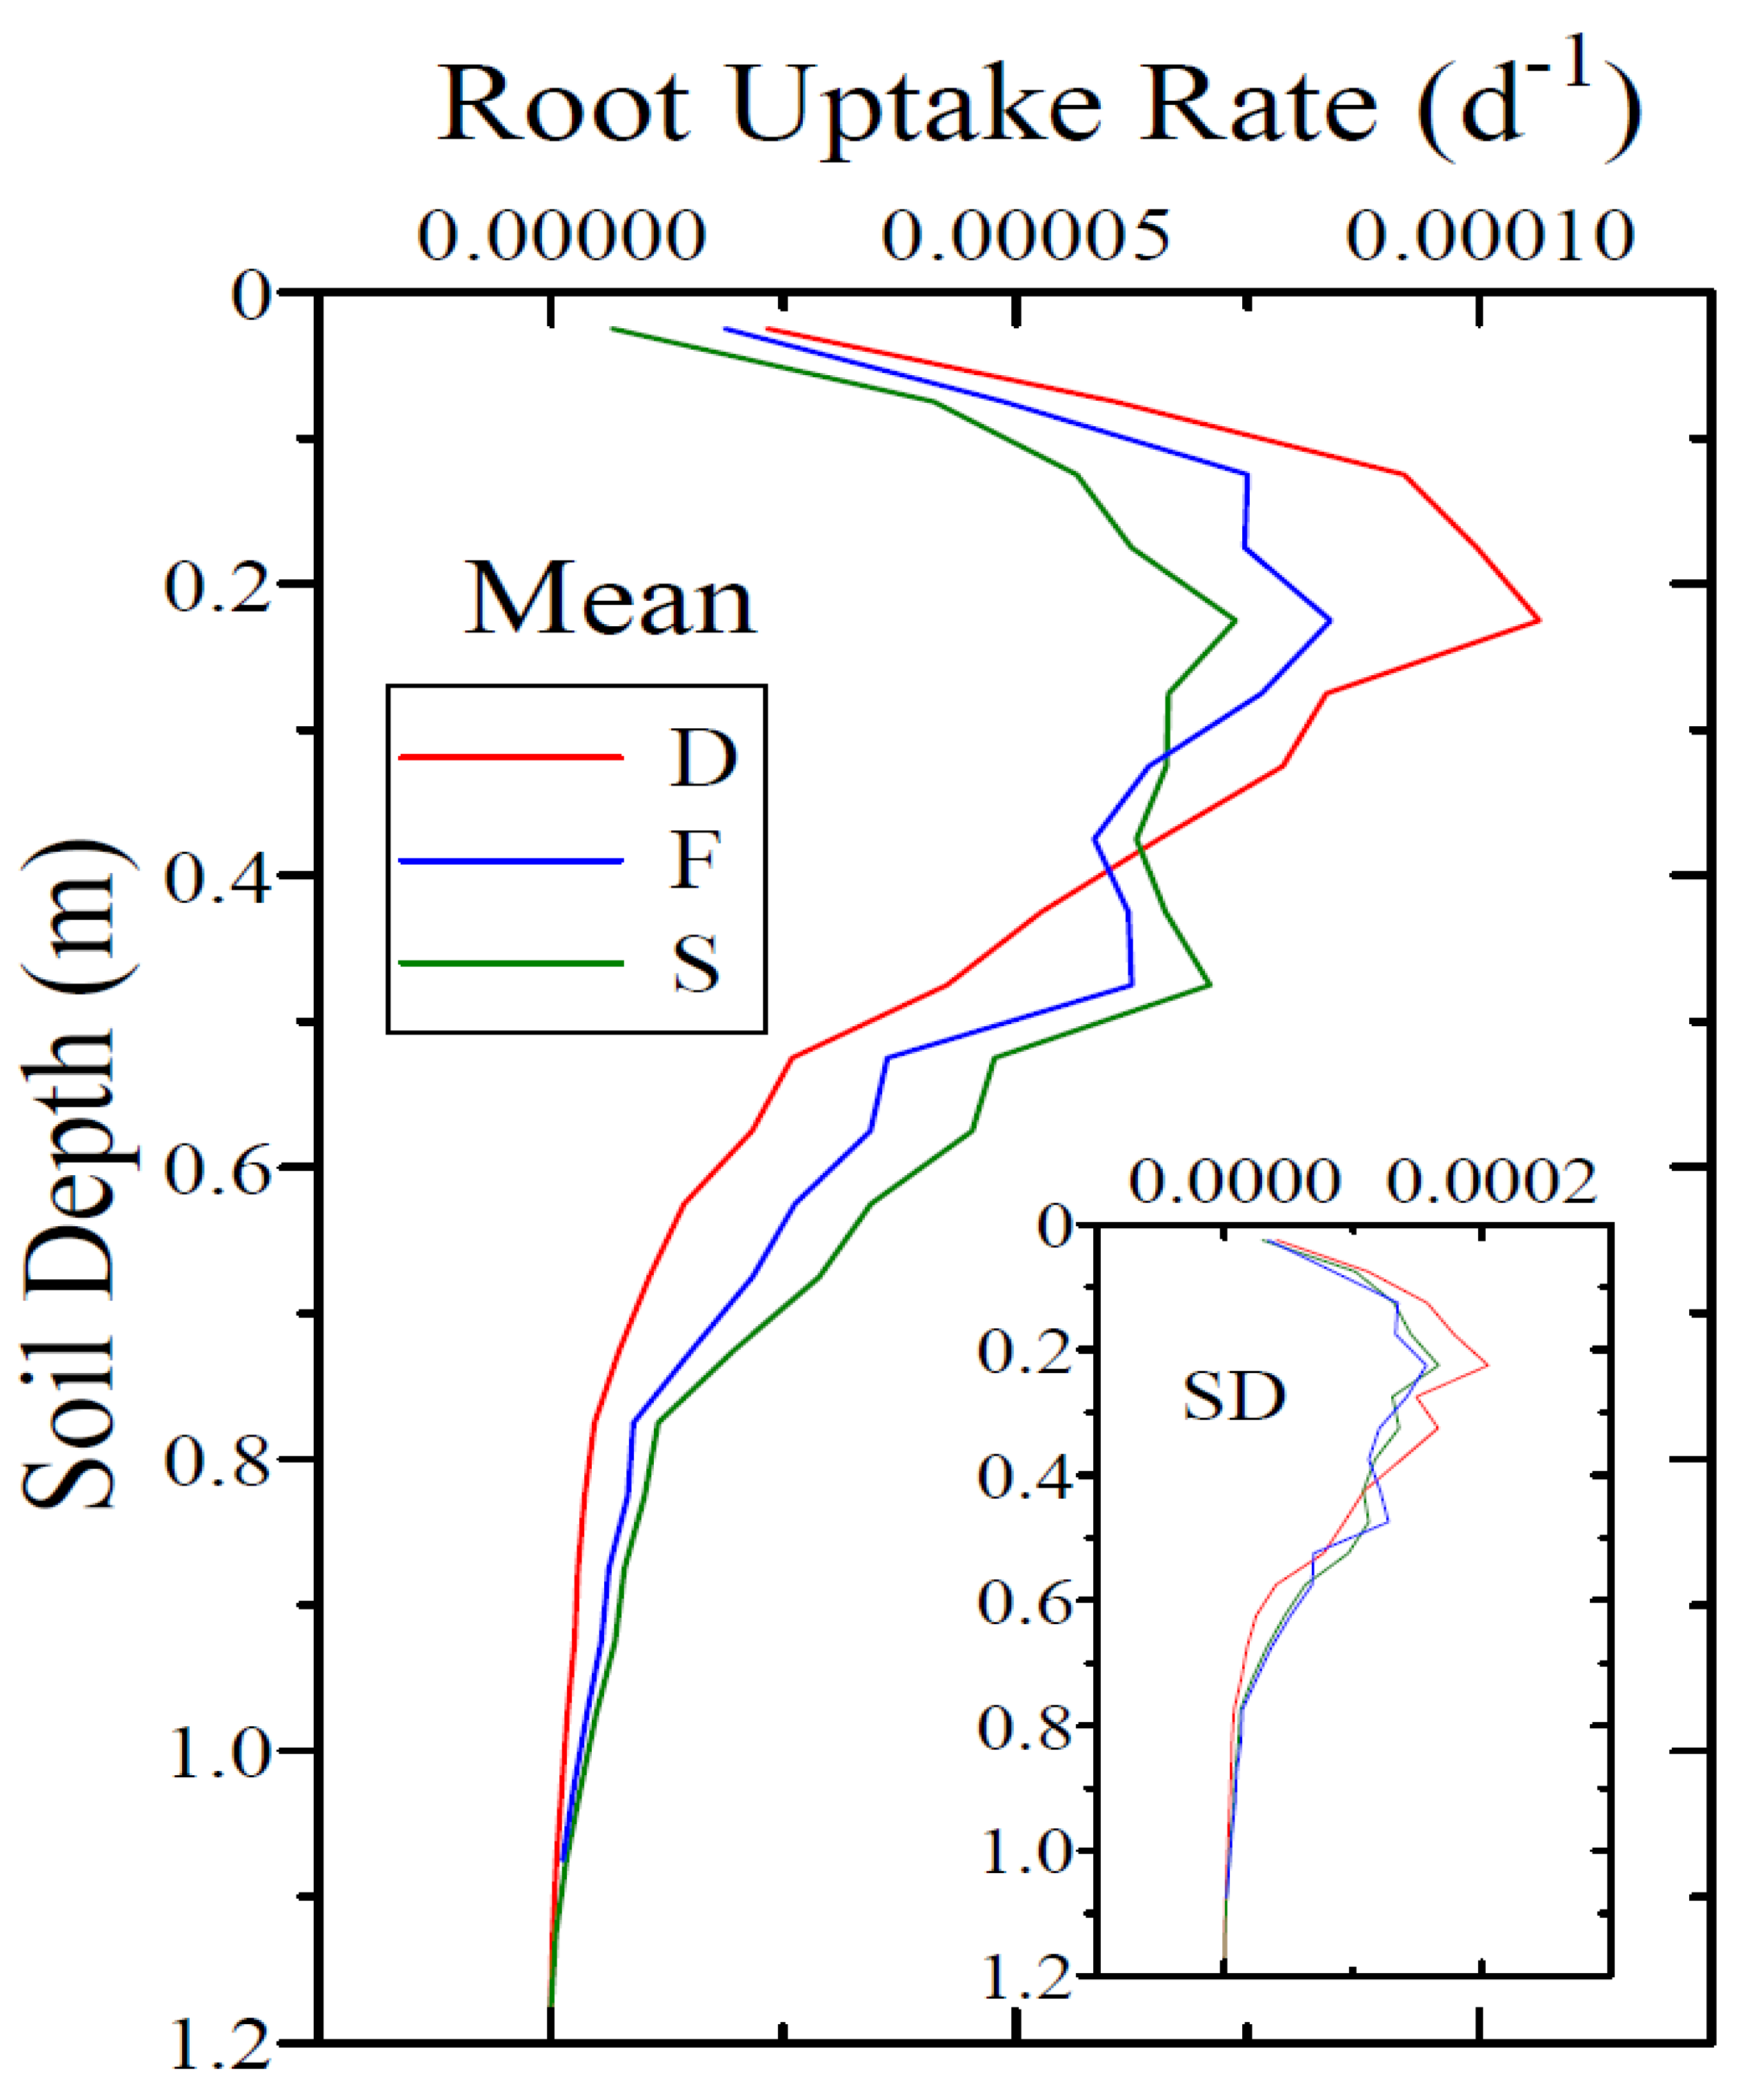
Figure 1 illustrates profiles of the horizontally averaged, mean, and standard deviation (SD) of the rate of the water uptake by the trees’ roots, WUR(x,t), at a given time, during the irrigation season. The averaging domain, which is the inner core of the horizontal plane of the flow domain, is 10 m × 8 m in size, and consists of two adjacent tree rows, each row including the two inner trees. This figure clearly demonstrates the effect of the irrigation water salinity (expressed in terms of the chloride concentration, Ciw), on the depth–distribution of WUR(x,t). As Ciw decreases, most of the water uptake by the trees’ roots occurs at shallower soil depths. This behavior is quantified by considering the vertical coordinate location, Z*up(t), of the centroid of the soil’s volume active in water uptake, V*up(t) [32].
Following [32], Z*up(t) was evaluated by integrating WUR(x,t) over the inner core of the horizontal plane of the flow domain, and over the irrigation season. The resultant seasonal averages of Z*up(t) were Zup = 0.33 m, 0.36 m, and 0.40 m, for the D, F, and S scenarios, respectively; in other words, Zup = Zup(Ciw). Note that the cumulative volume of water extracted by the trees’ roots during the irrigation seasons was essentially independent of Ciw, and approached its potential value. This suggests that as Ciw decreases, the rate of the water uptake by the roots in the upper part of the soil must increase in order to compensate for the decrease in the vertical extent of Vup(t).
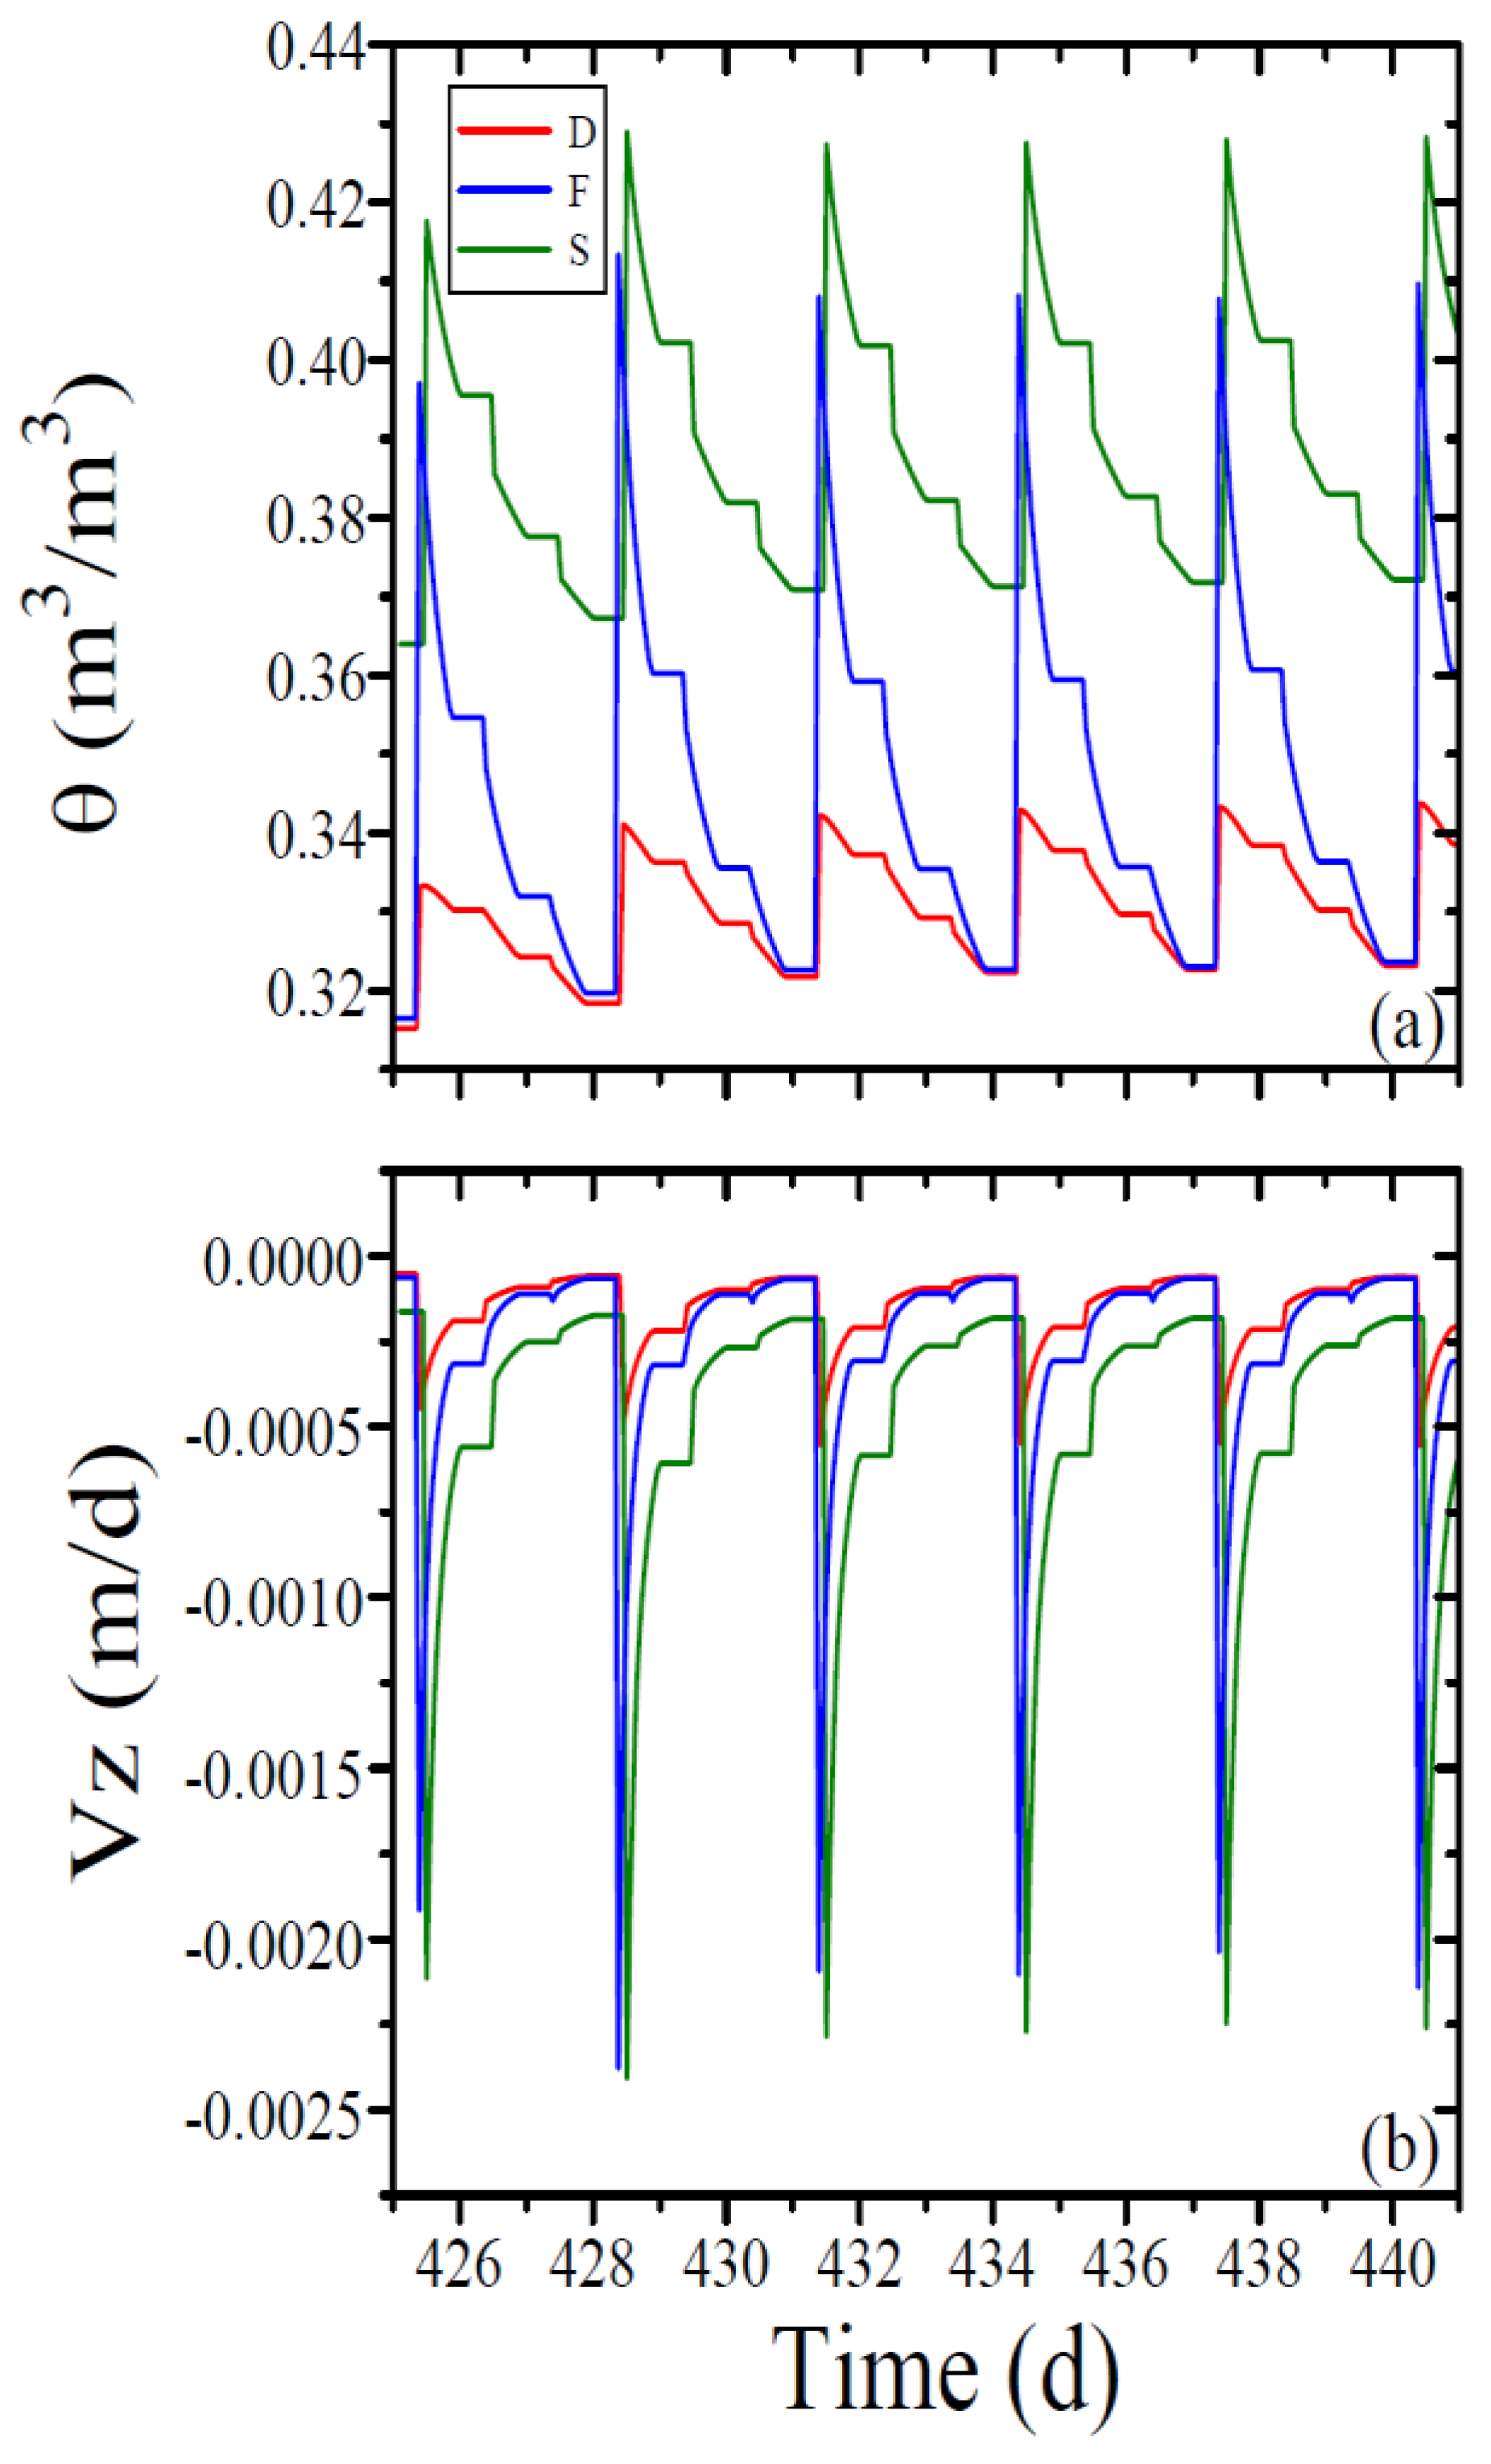
Water content, θ, and vertical component of the velocity vector, Vz, at soil depth, Zup = Zup(Ciw), obtained by averaging θ(x2p,x3p,Zup;t) and Vz(x2p,x3p,Zup;t) over the four trees in the inner core of the flow domain, are depicted as functions of time in Figure 2. Here, x2p and x3p (p = 1 to Np), are the coordinate locations of the p-th tree at the soil surface, and Np=4. This figure clearly demonstrates the effect of Ciw on the temporal variations of both water content and the vertical velocity in the most active part of the root zone.
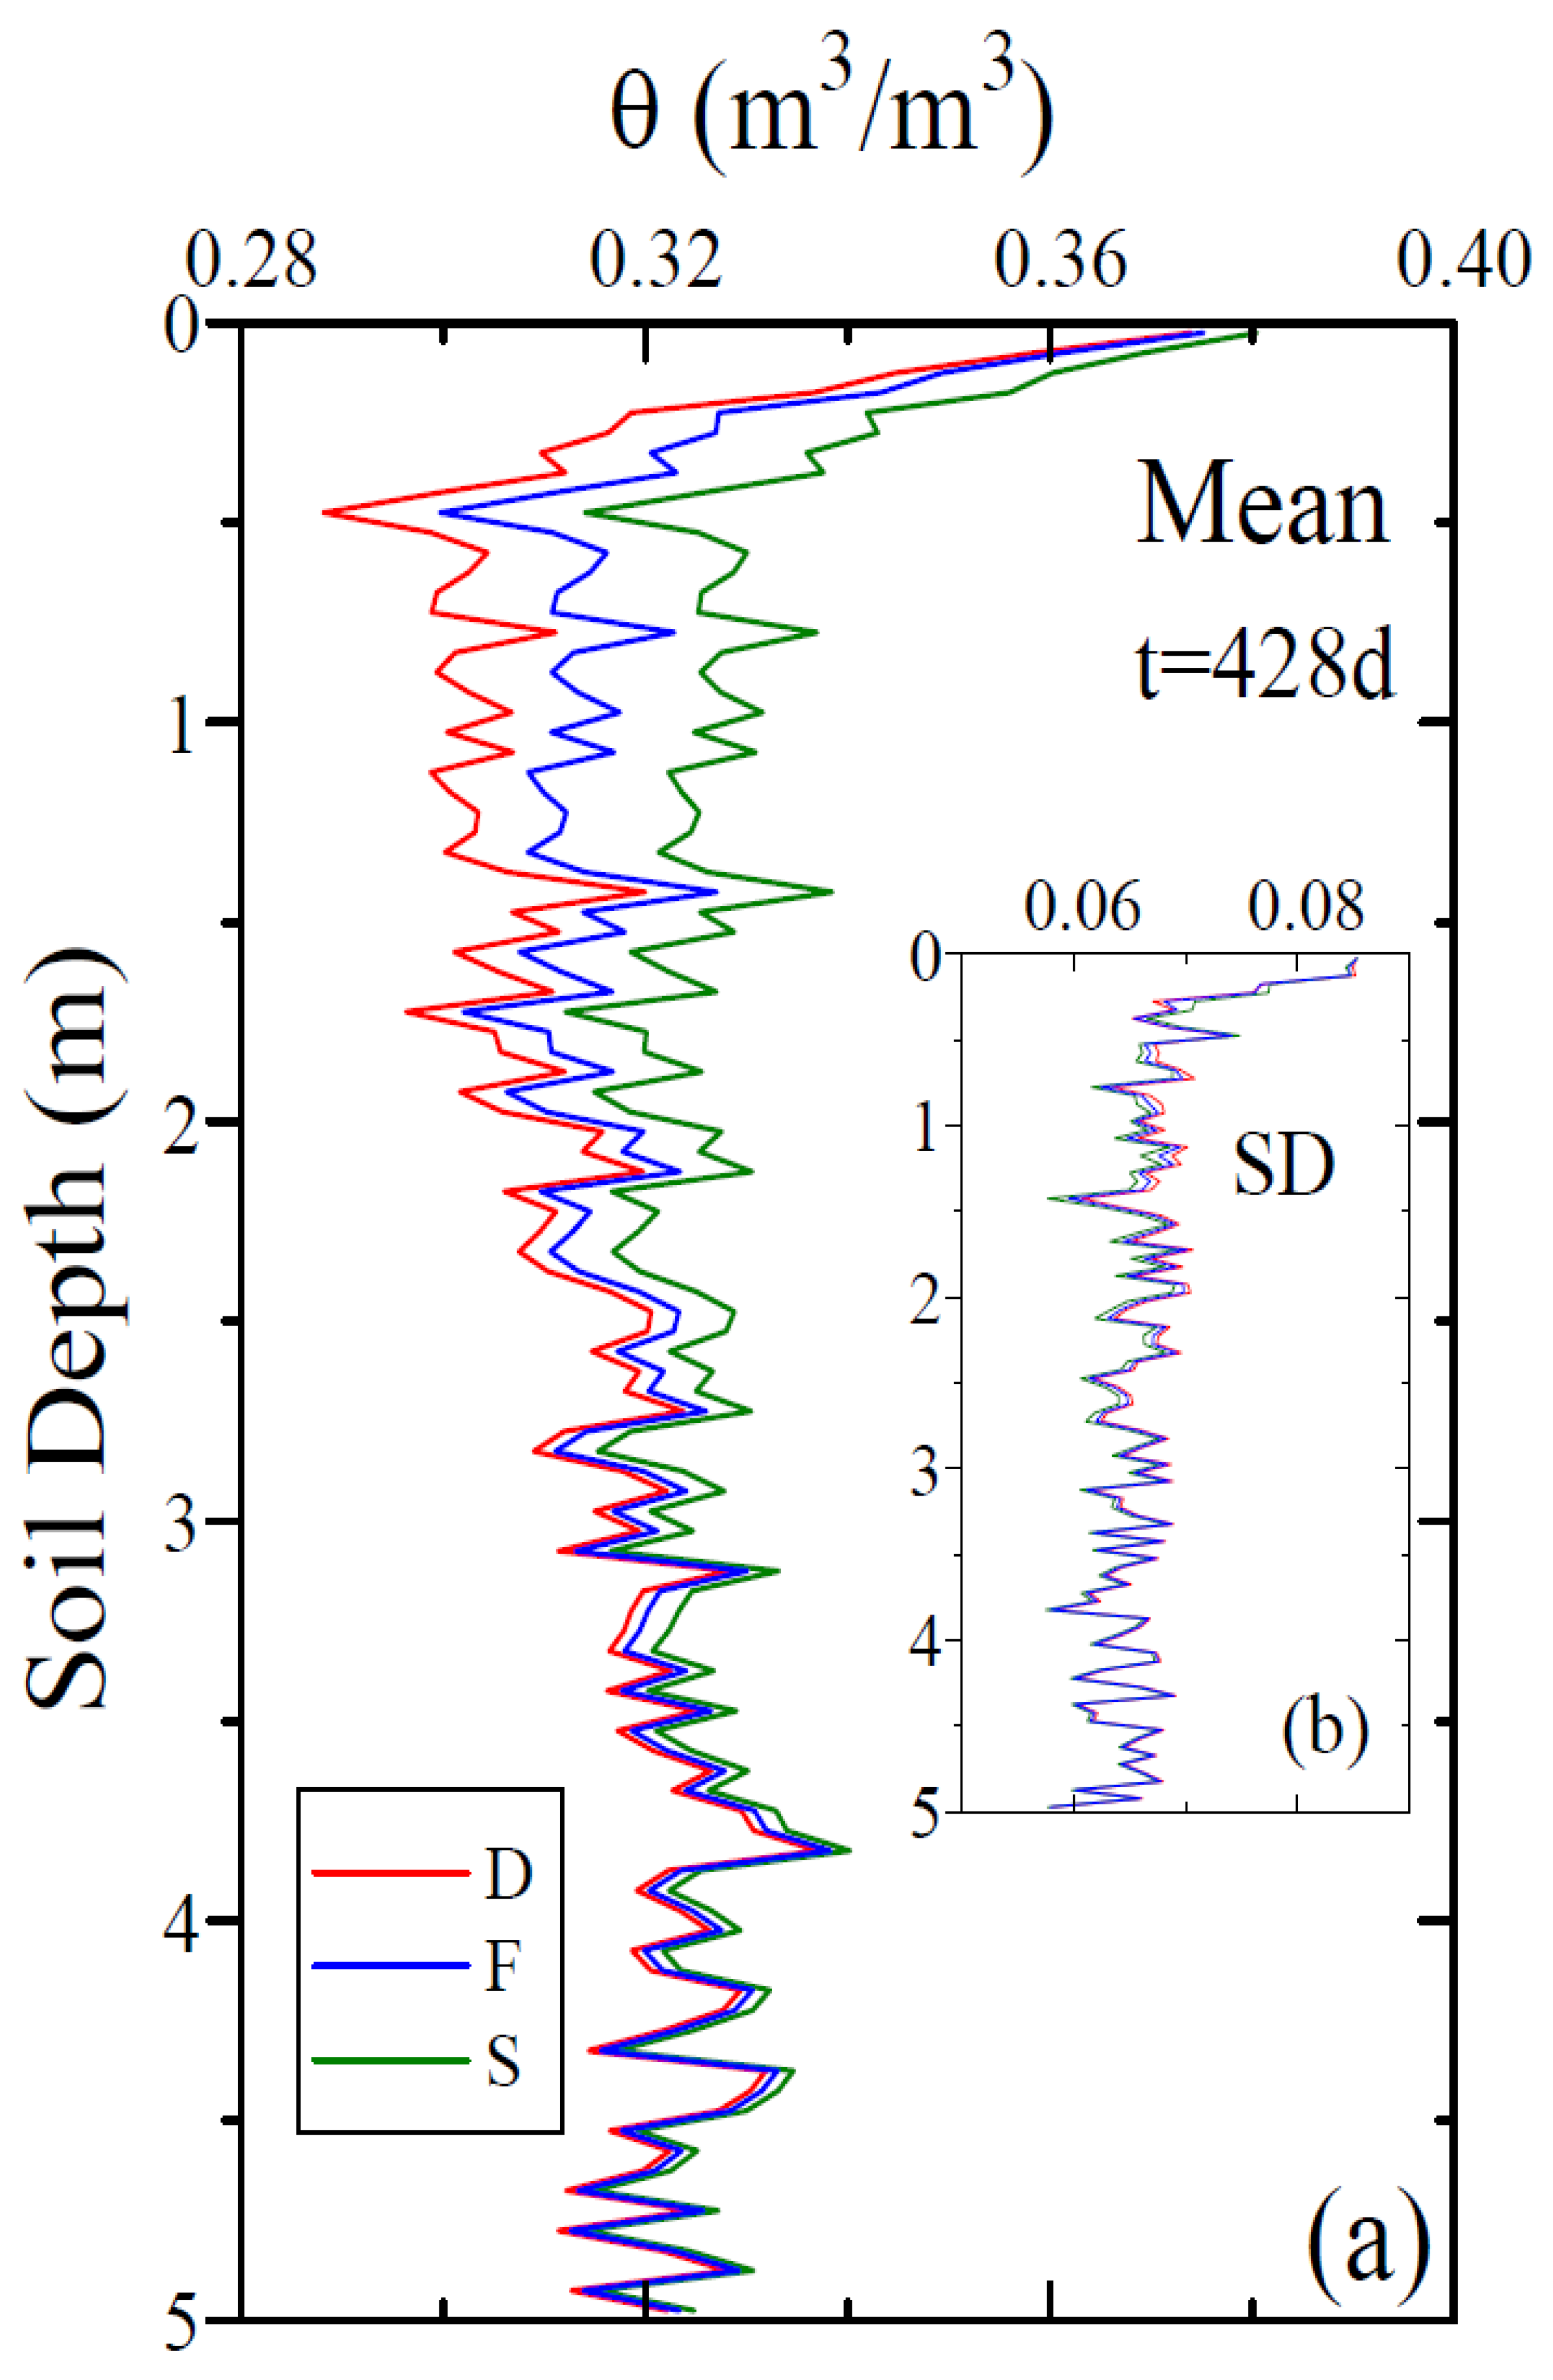
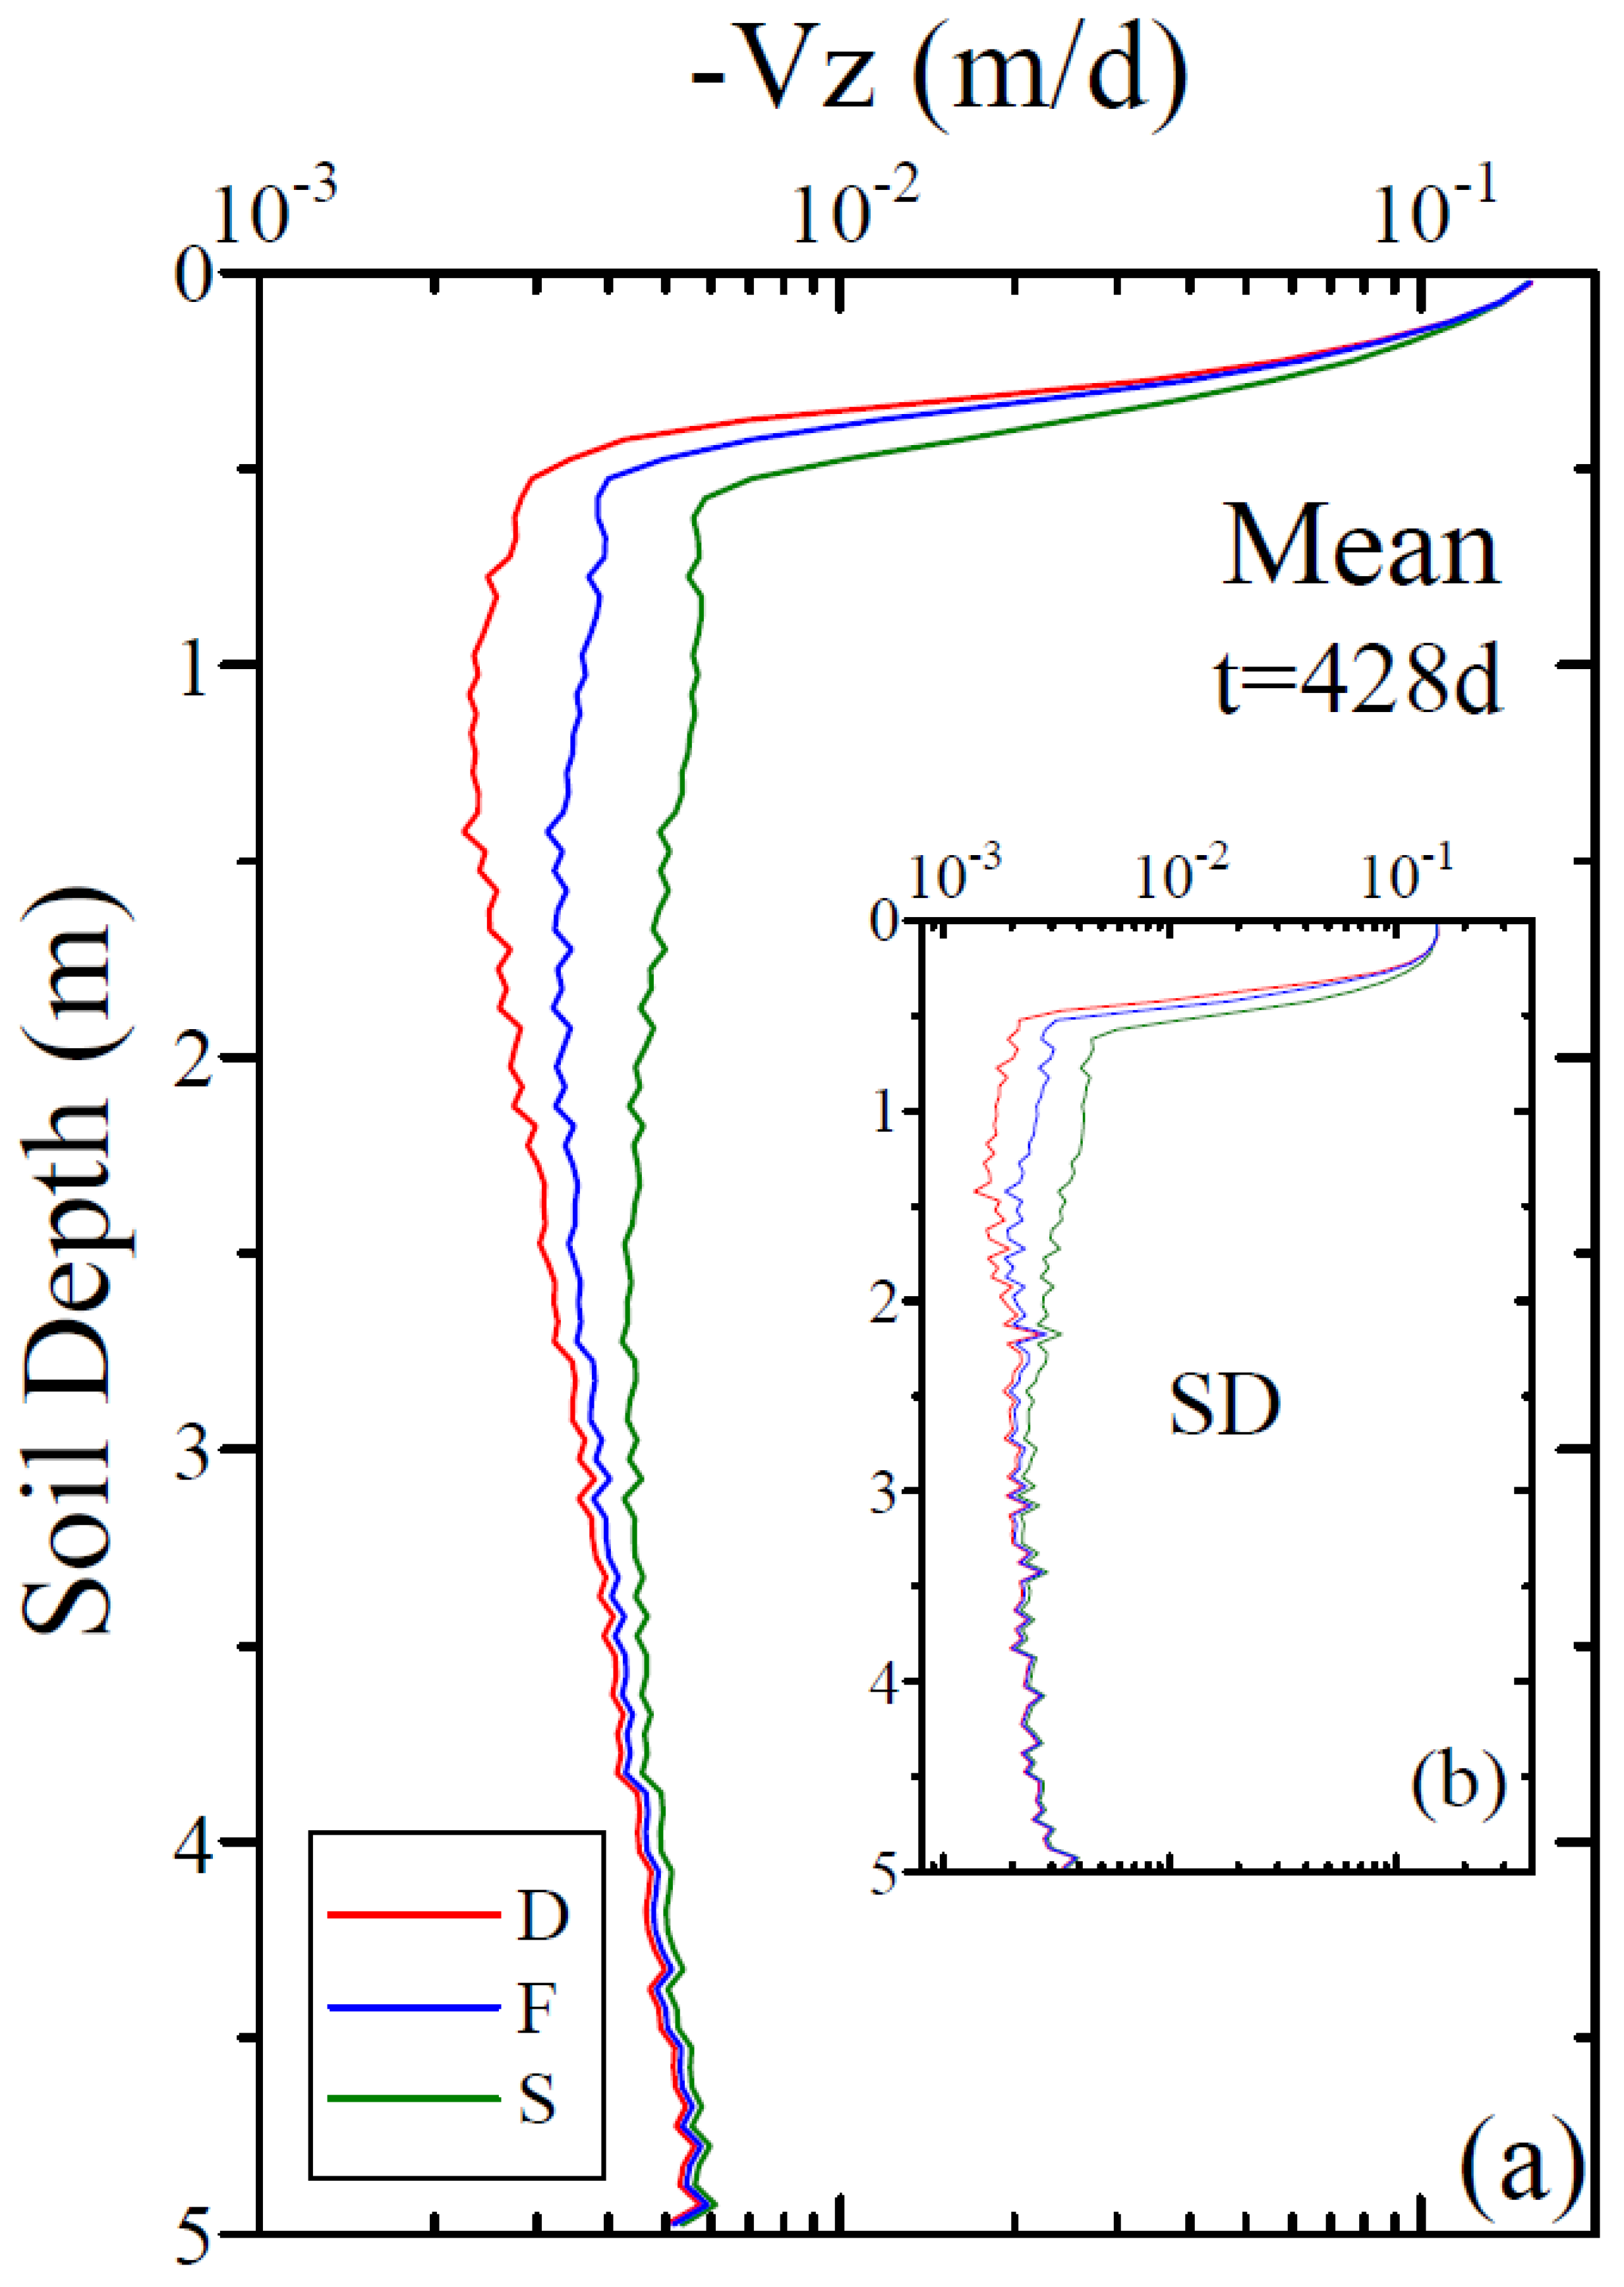
Profiles of the horizontally averaged, mean and standard deviation (SD) of θ and Vz, at a given time, after an irrigation event, are depicted in Figure 3 and Figure 4, respectively. The averaging domain is the same as in Figure 1. Figure 3 and Figure 4 clearly show that for given soil depth and time, both the mean value and the SD of θ and Vz decrease with decreasing Ciw. This phenomenon, which persists to considerable soil depths, substantially far below the root zone, is attributed to the effect of Ciw on the spatial distribution of the rate of the water uptake by the trees’ roots. In other words, decreasing Ciw leads to enhanced water uptake rates at shallower soil depths (Figure 1), and, consequently, to lower water content and lower downward velocity (Figure 2, Figure 3 and Figure 4).
3.2. Movement, Spread, and Breakthrough of a Pulse of a Solute Tracer
Analyses of the movement of a tracer solute in the soil profile provide information on the flow and the transport mechanism, and, consequently, provide estimates of the effective transport properties. An analysis of the field-scale tracer transport in the variably saturated soil profile is performed here by calculating the time-dependent spatial moments of the tracer concentrations distribution, c(x,t) [31], namely,
where M is the total mass of solute, R(t) = (R1,R2,R3) is the coordinate of the centroid of the tracer plume, and S’ij(t) (i,j = 1,2,3) are second spatial moments, proportional to the moments of inertia of the tracer plume.
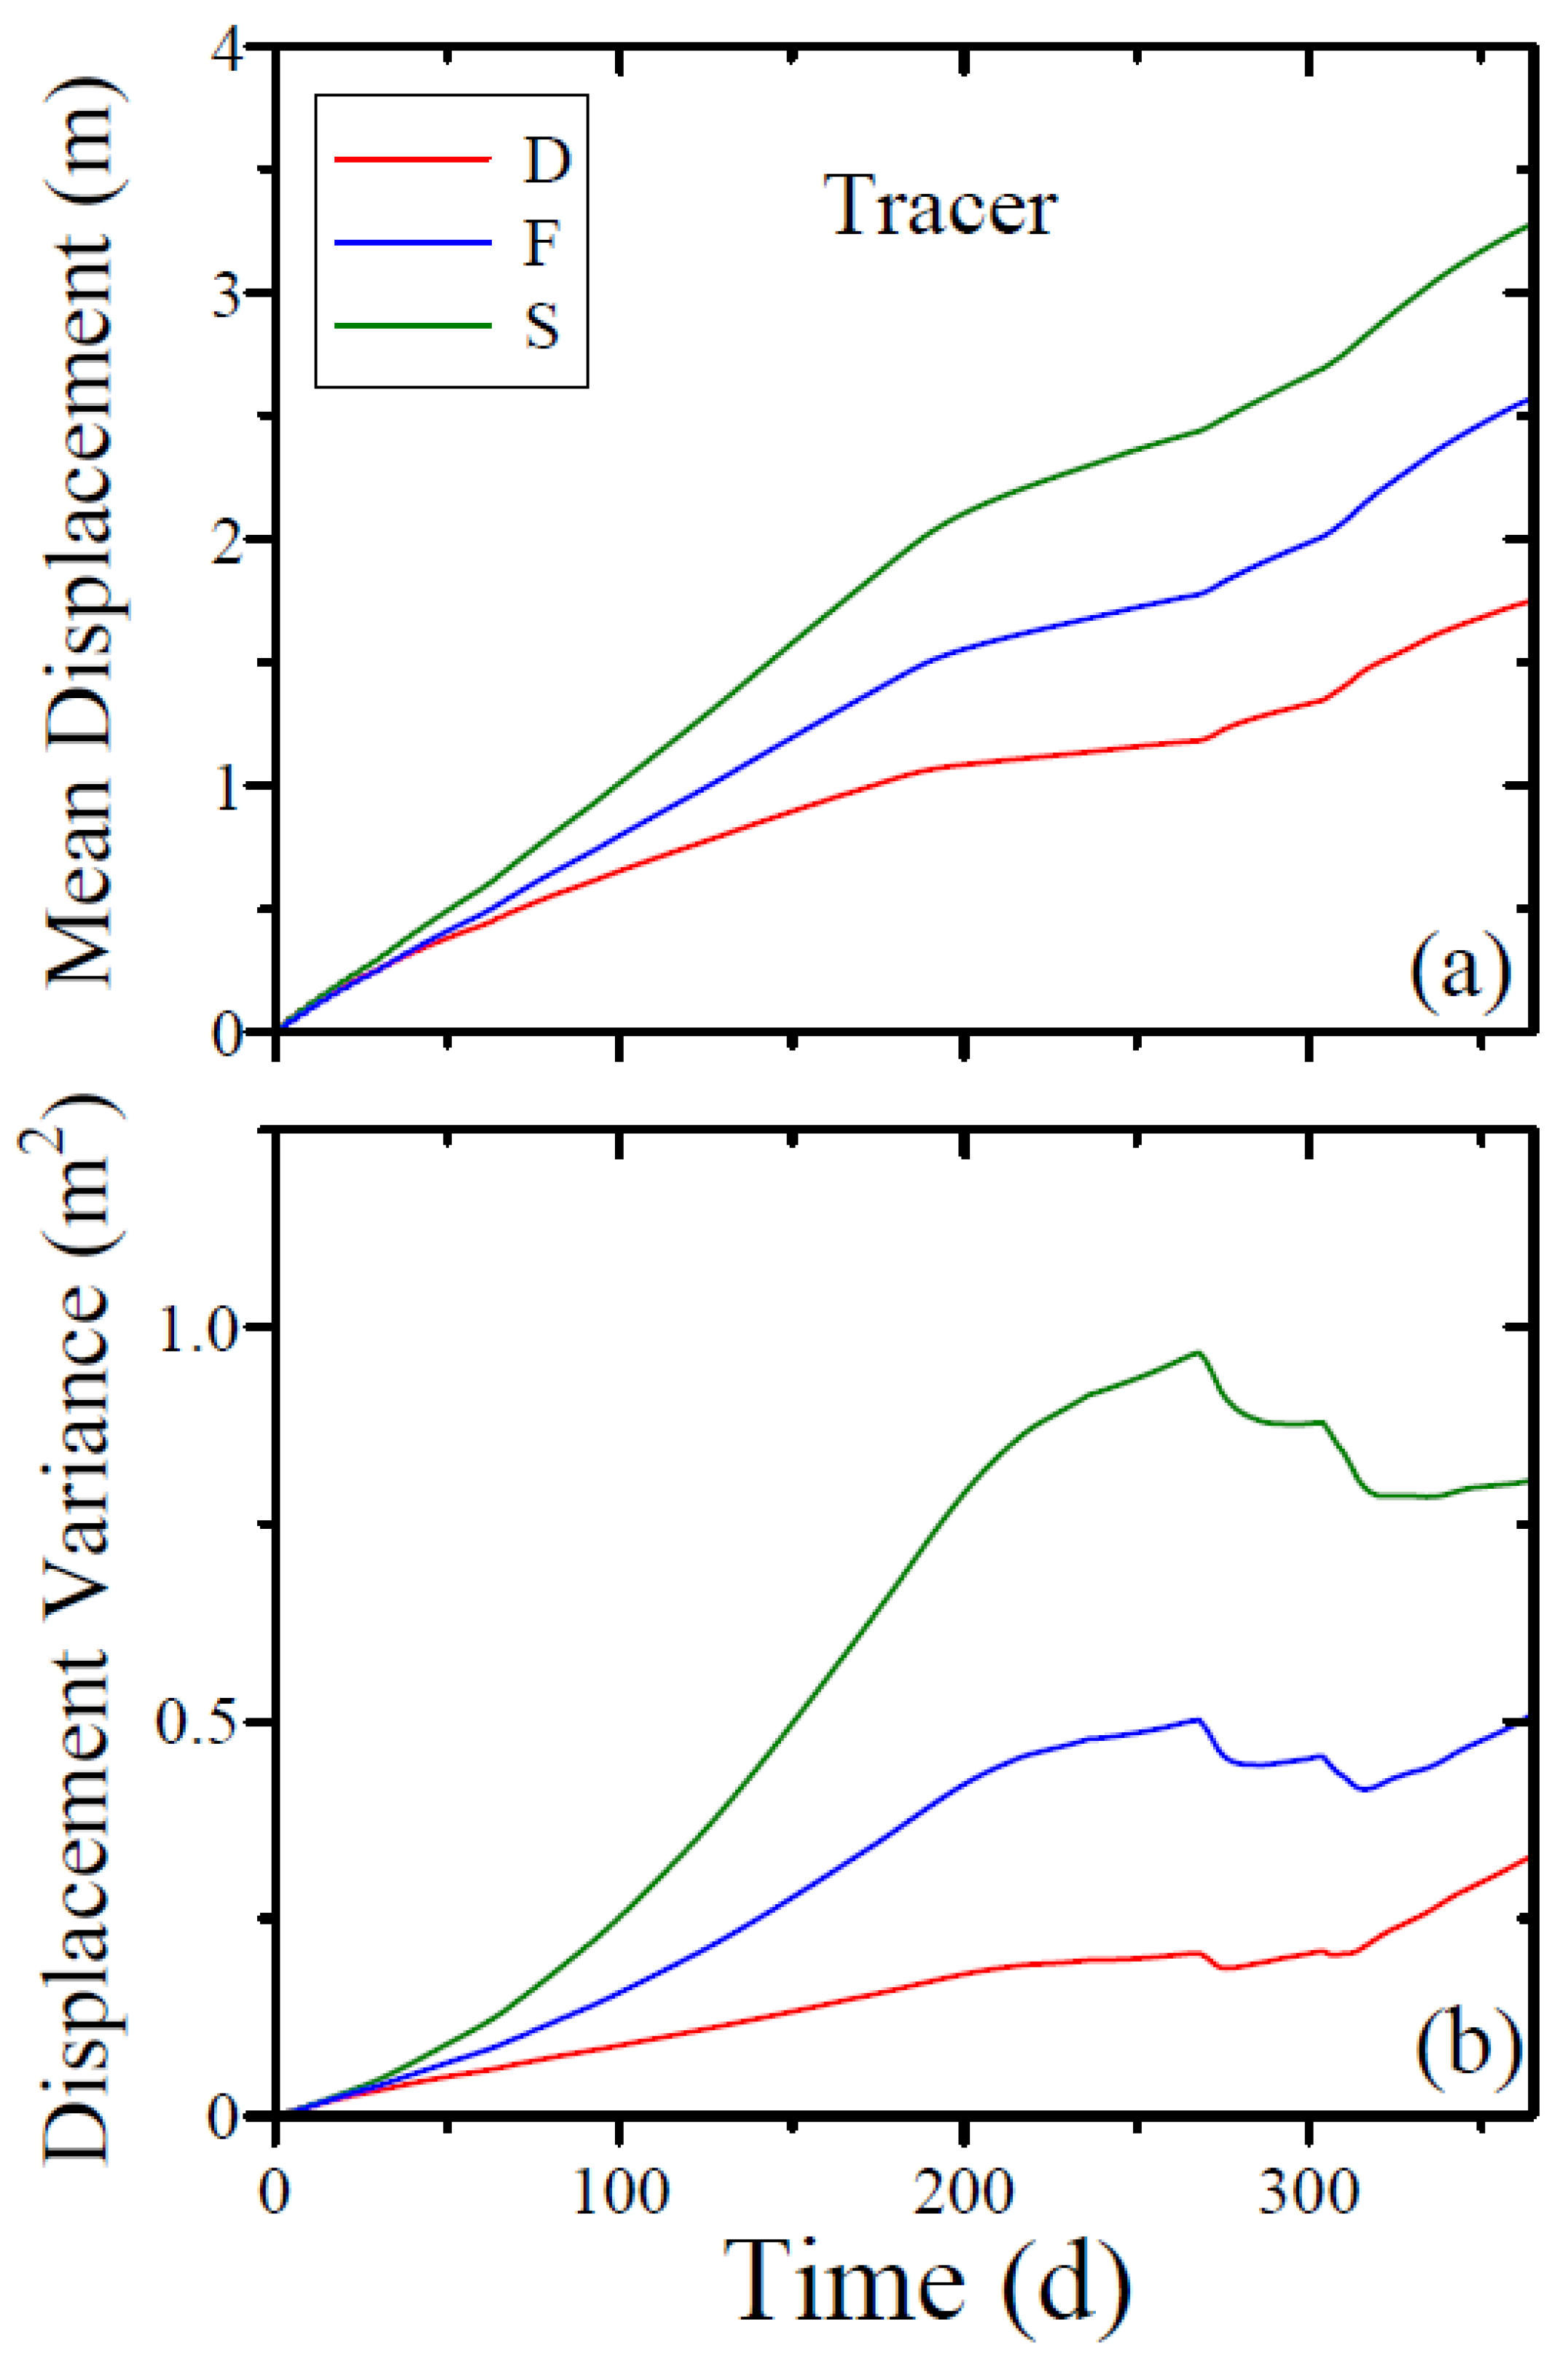
Figure 5 depicts the vertical position of the centroid of the tracer mass, R1(t), and the spread about it in the vertical direction, S11(t) = S’11(t) − S’11(0), as functions of time, for the same cases presented in the previous figures. Note that the first derivatives of R1 and S11 with respect to time provide estimates of the effective time-dependent longitudinal components of the solute velocity vector, Ve, and the macrodispersion tensor, De, respectively.
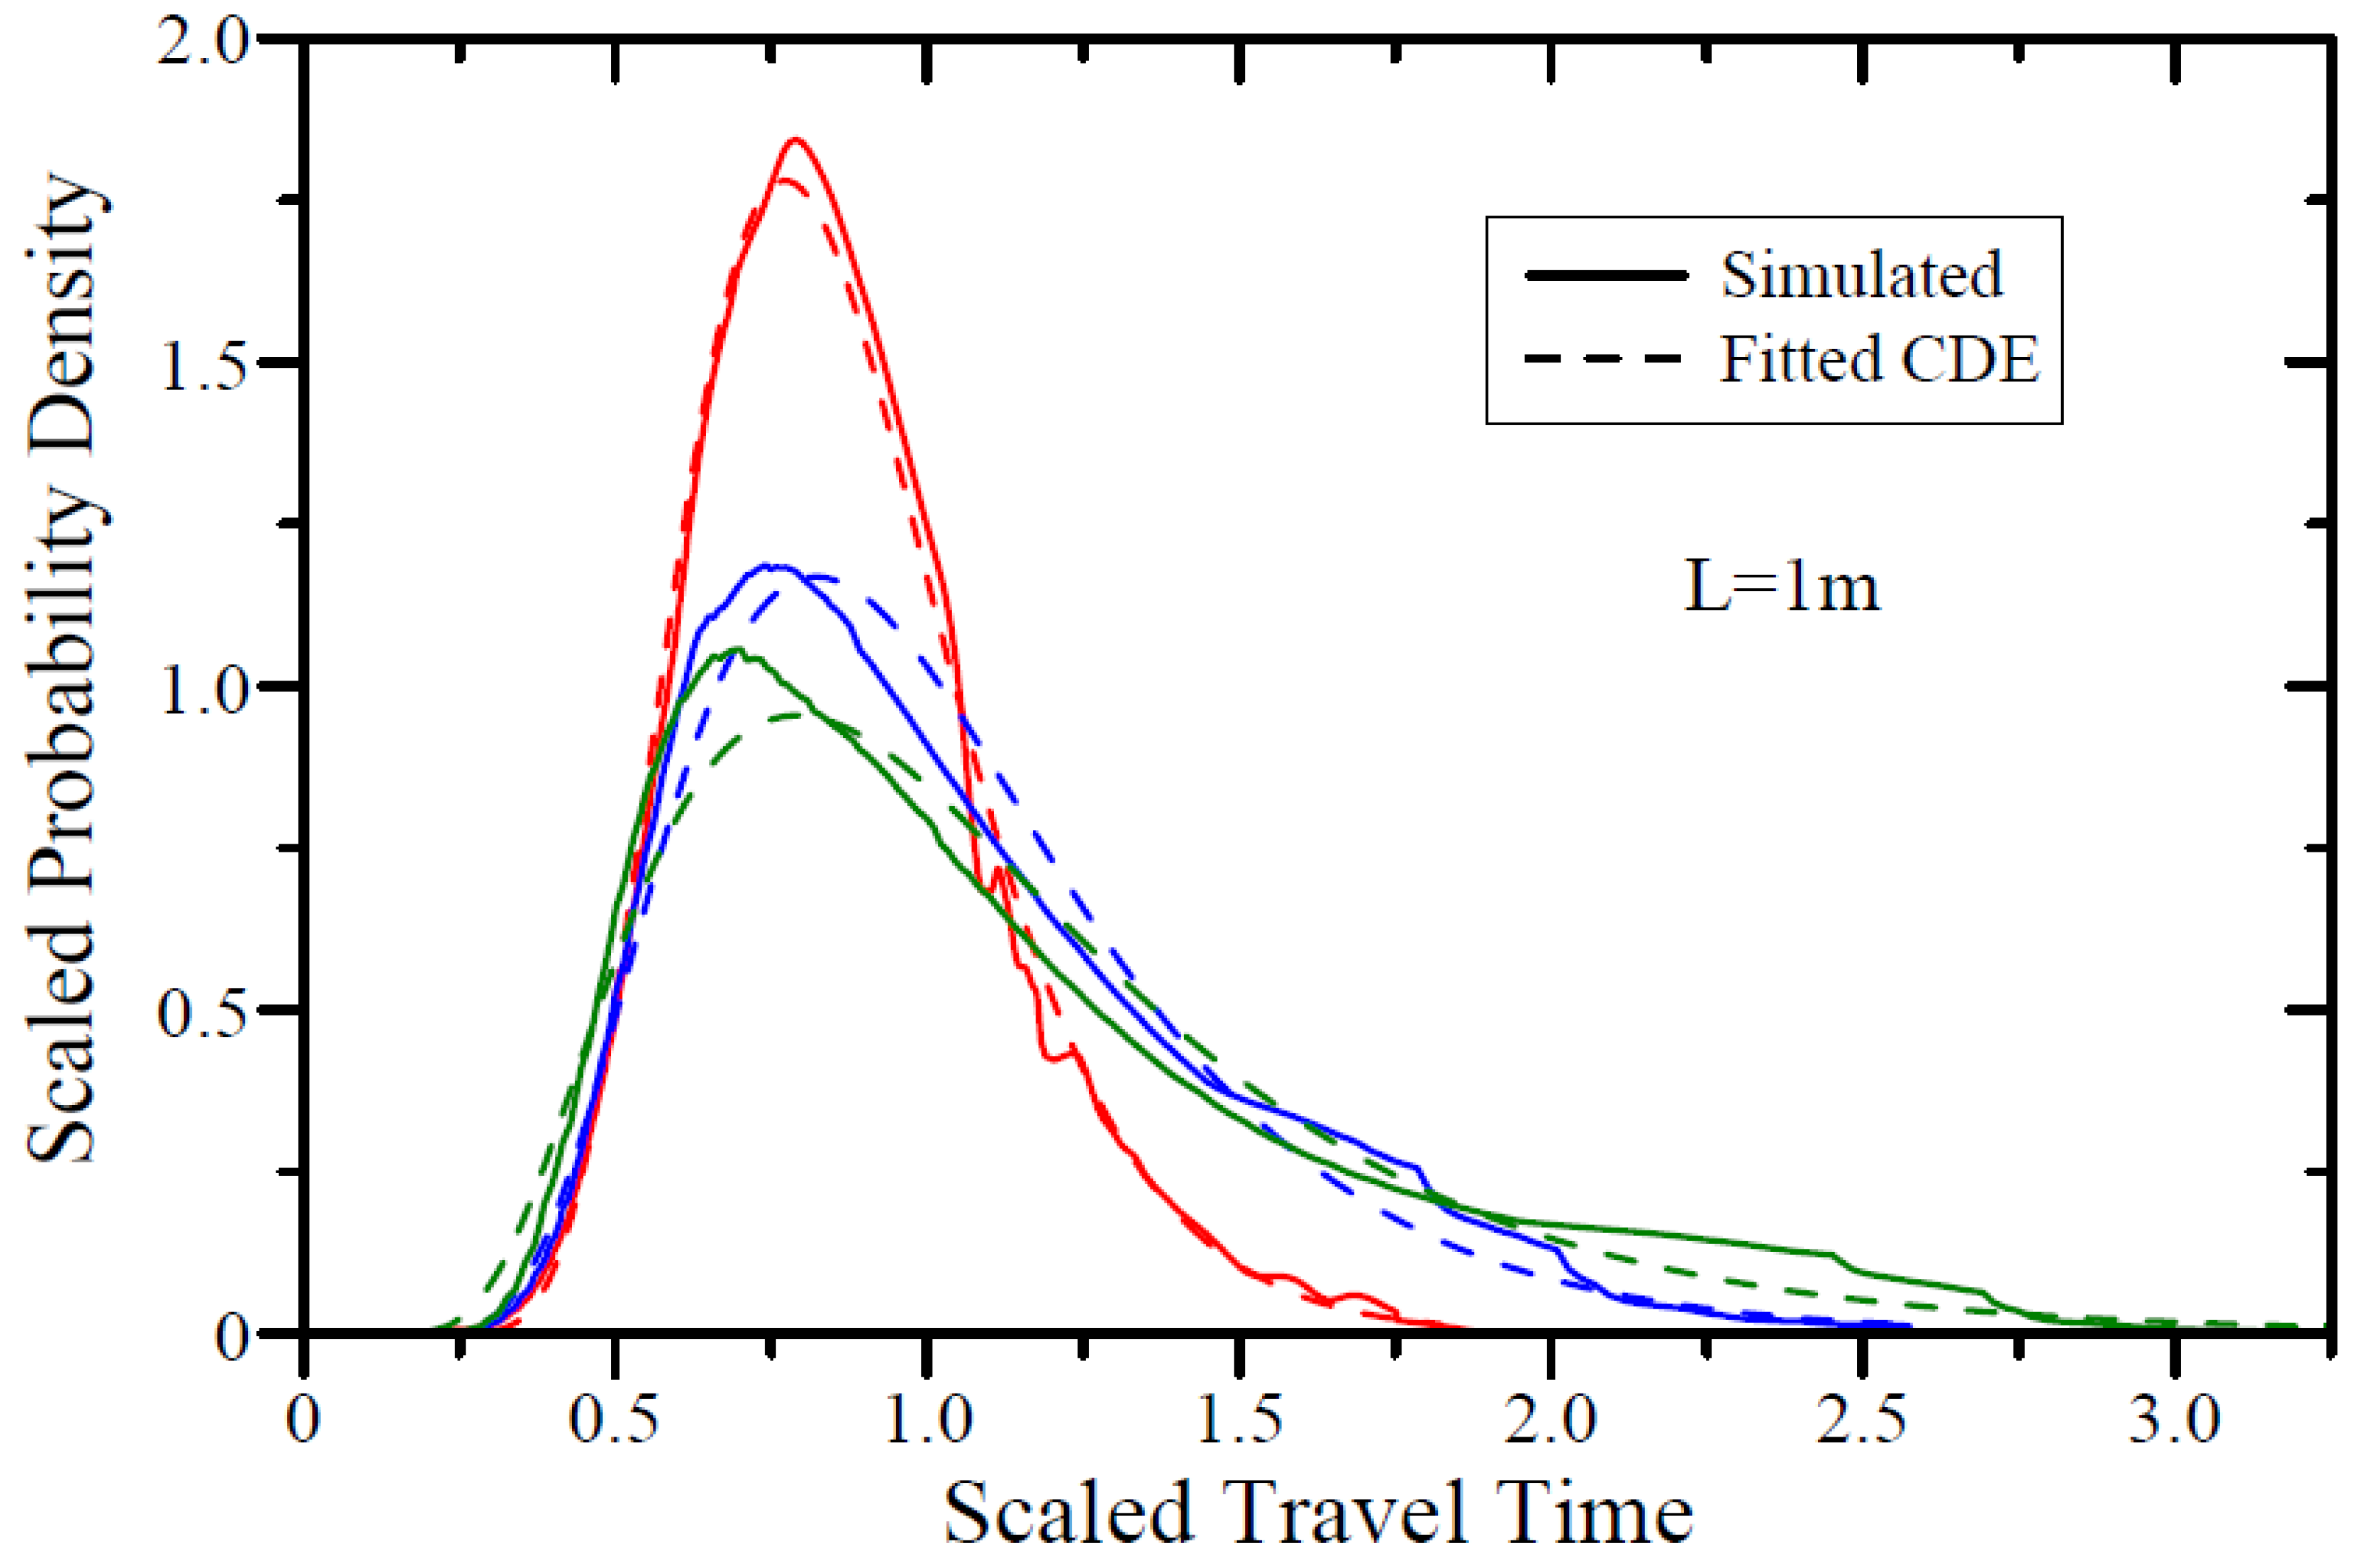
During the irrigation season, the increase of S11 with time, t, faster than linearly in t, associated with scenarios F and S, suggest that in these cases the transport is essentially a convection-dominated process, controlled by the disparity between regions of different velocities. On the other hand, in the case of scenario D, S11 tends to evolve at a linear rate, suggesting that in this case the transport is essentially a convection–dispersion process. This is also shown in Figure 6, which depicts scaled travel time probability density functions (PDFs), f(τ;L), derived from temporal changes of the mean flux-averaged concentration, cf(t;L), of the tracer, averaged over a horizontal control plane (CP) located at vertical distance, L = 1m. Figure 5 and Figure 6 suggest that the reduction in water content caused by irrigation with desalinated water (scenario D) essentially damps out the extremely fast travel times, slows down the longitudinal spreading of the tracer’s plume, and, consequently, promotes mixing between regions of differing convection, leading to a Fickian behavior.
Effective parameters can be estimated from the simulated travel time PDFs depicted in Figure 6. Adopting a Fickian PDF for the latter, and using the method of moments [33], the resultant fitted parameters are Ve = 0.00614, 0.00853, and 0.00958 m/d, De = 0.00046, 0.00125, and 0.00173 m2/d, and effective macrodispersivity, λe = De/Ve = 0.075, 0.146 and 0.180 m, for scenarios D, F, and S, respectively.
Note that these estimates are in relatively good agreement with their counterparts estimated from the spatial moment analyses. For travel times corresponding to a travel distance of 1 m, the R1(t) and the S11(t) curves depicted in Figure 5 yield Ve = dR1/dt = 0.0045, 0.0090, and 0.0110 m/d, De = (1/2) dS11/dt = 0.00052, 0.0016, and 0.0020 m2/d, and λe = De/Ve = 0.116, 0.178, and 0.182 m, for scenarios D, F, and S, respectively.
Figure 5 and Figure 6 and the aforementioned estimates of the effective transport parameters clearly demonstrate the effect of the irrigation water salinity on the movement, spread, and breakthrough of the solute tracer in the variably saturated soil under cropped conditions, due to its effect on the spatial distribution of the rate of the water uptake by the trees’ roots.
3.3. Nitrogen Uptake by the Trees’ Roots
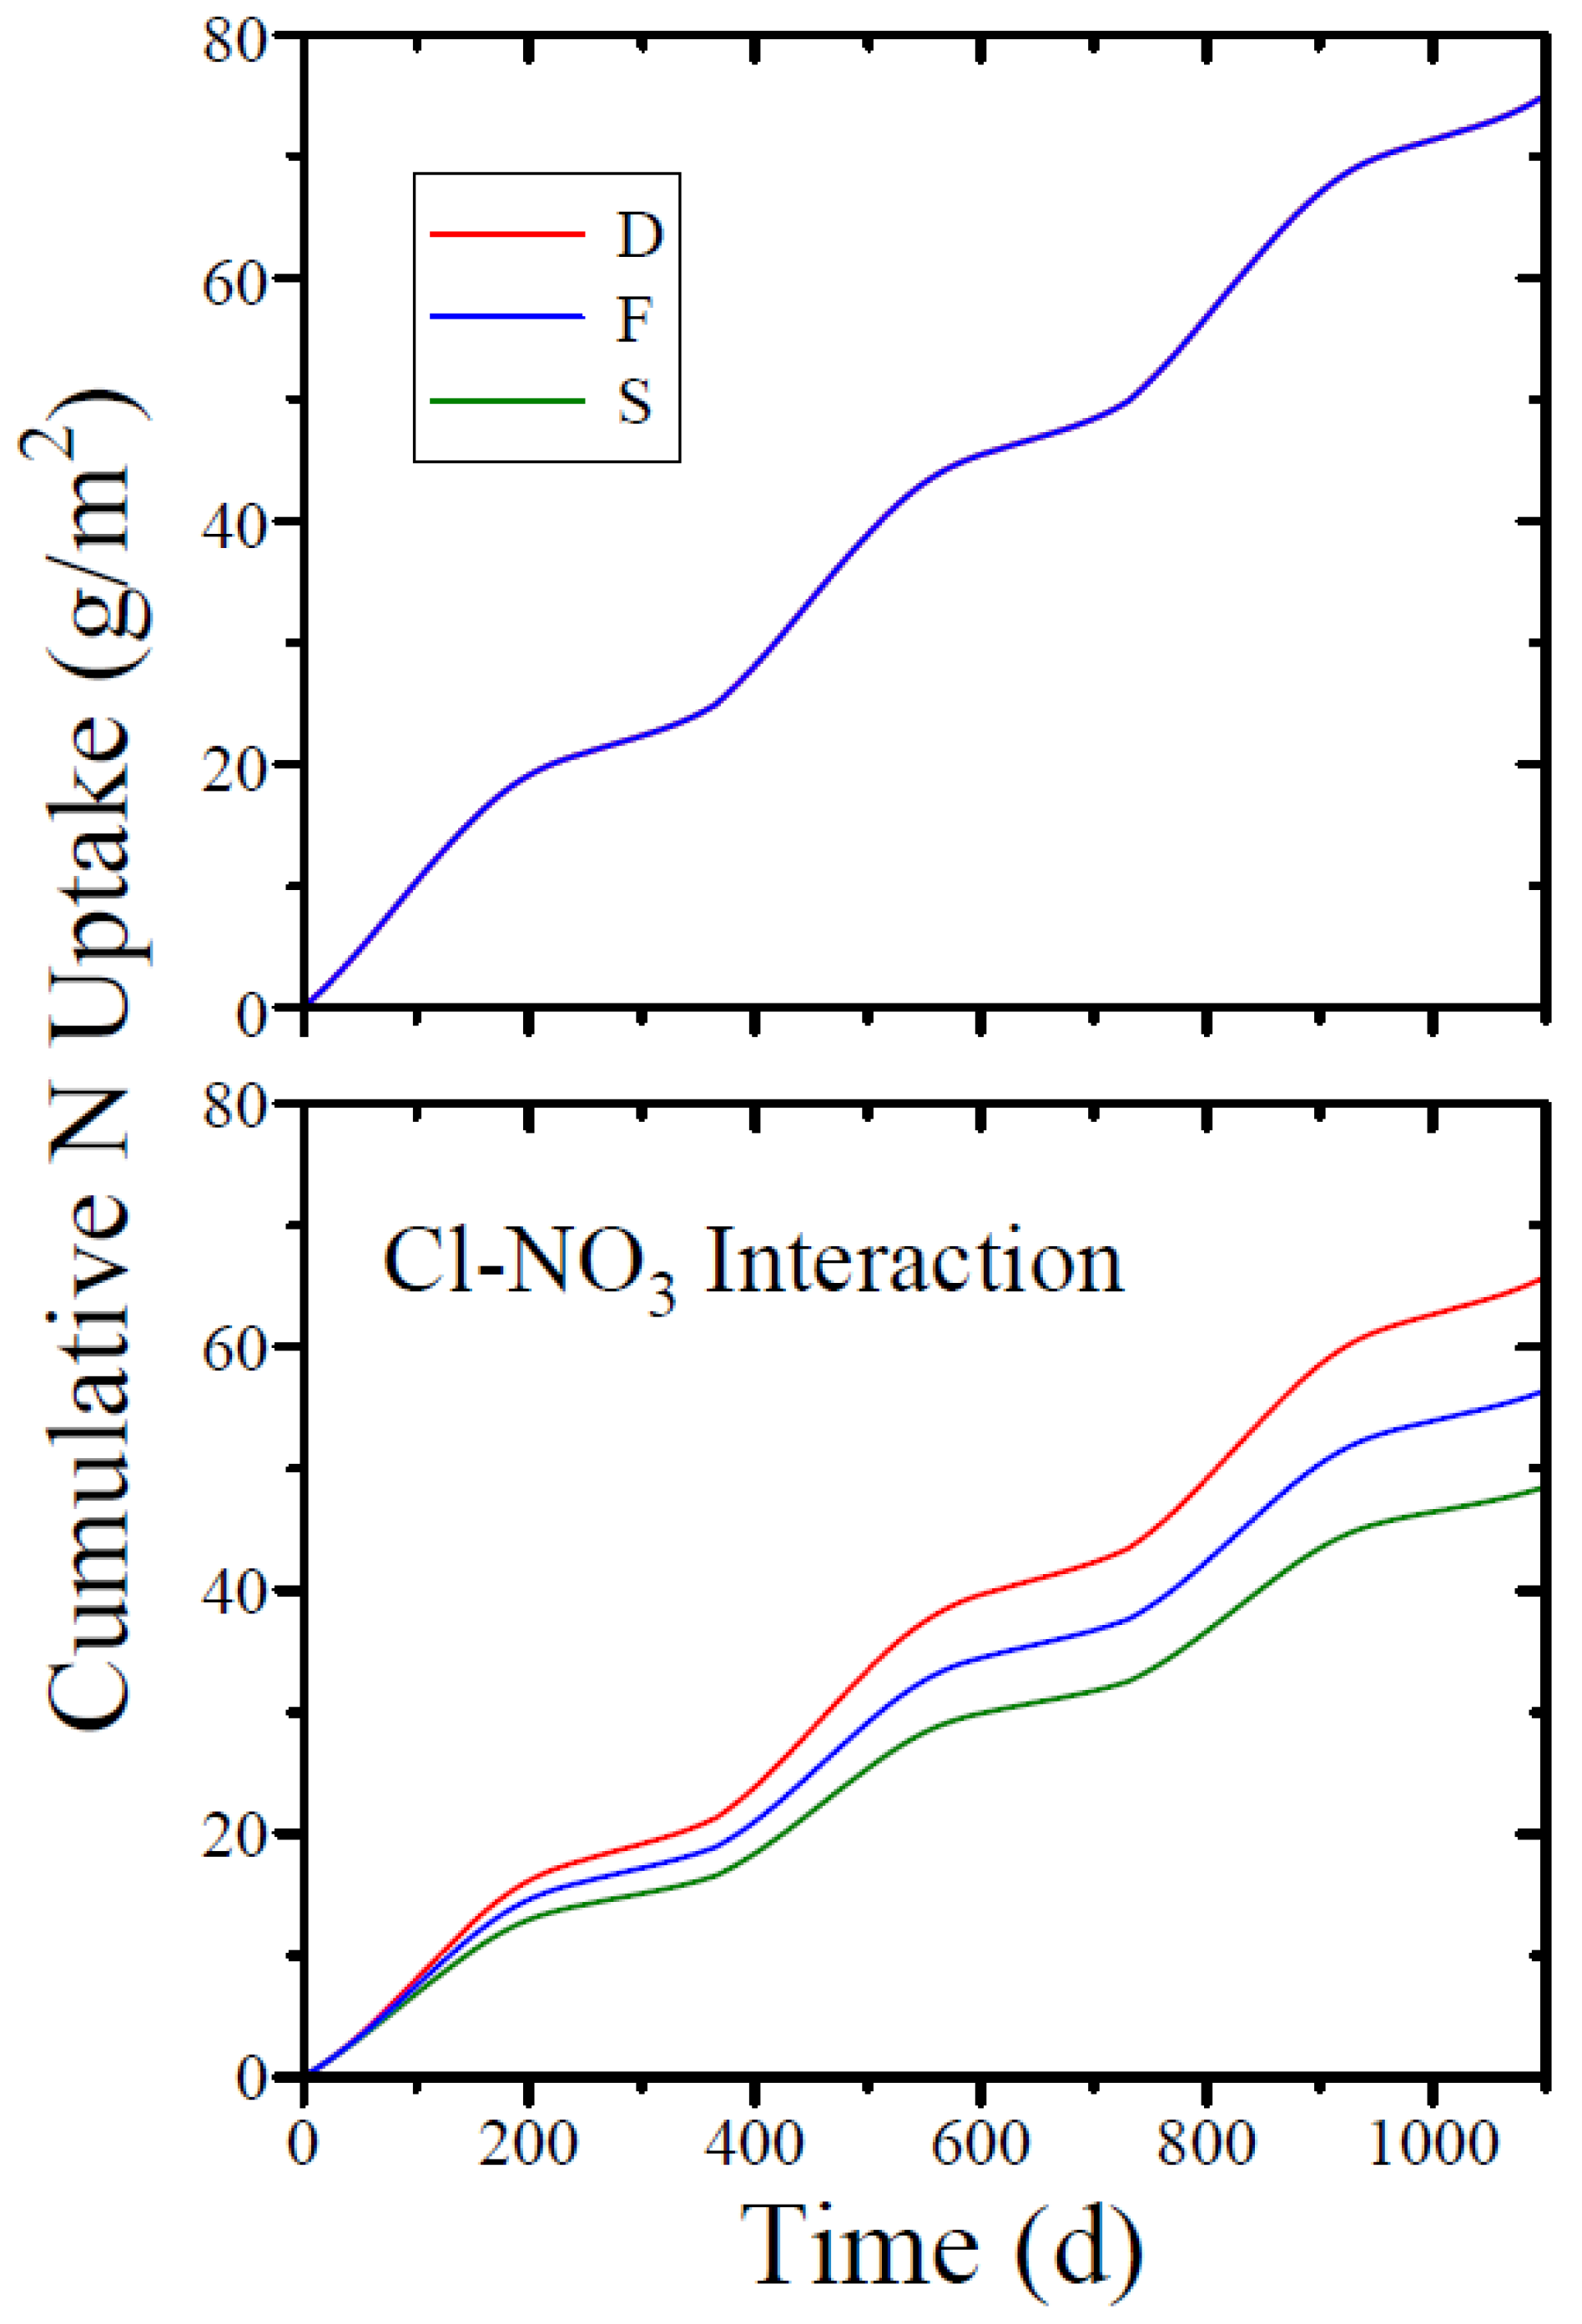
The cumulative mass of nitrogen, N (i.e., nitrate+ammonium), extracted by the trees’ roots is depicted in Figure 7 for the same cases presented in the previous figures. Results of the simulations in which the competition between chloride and nitrate and its effect on the extraction of N by the plant roots were considered (Figure 7, bottom) are compared with their counterparts in which this competition was disregarded (Figure 7, top). The results suggest that in the latter case, N uptake is independent of Ciw, and, essentially, it approached its potential value. On the other hand, as expected, the competition between chloride and nitrate decreases N uptake, particularly when Ciw increases.
3.4. Nitrification, Denitrification, and Volatilization
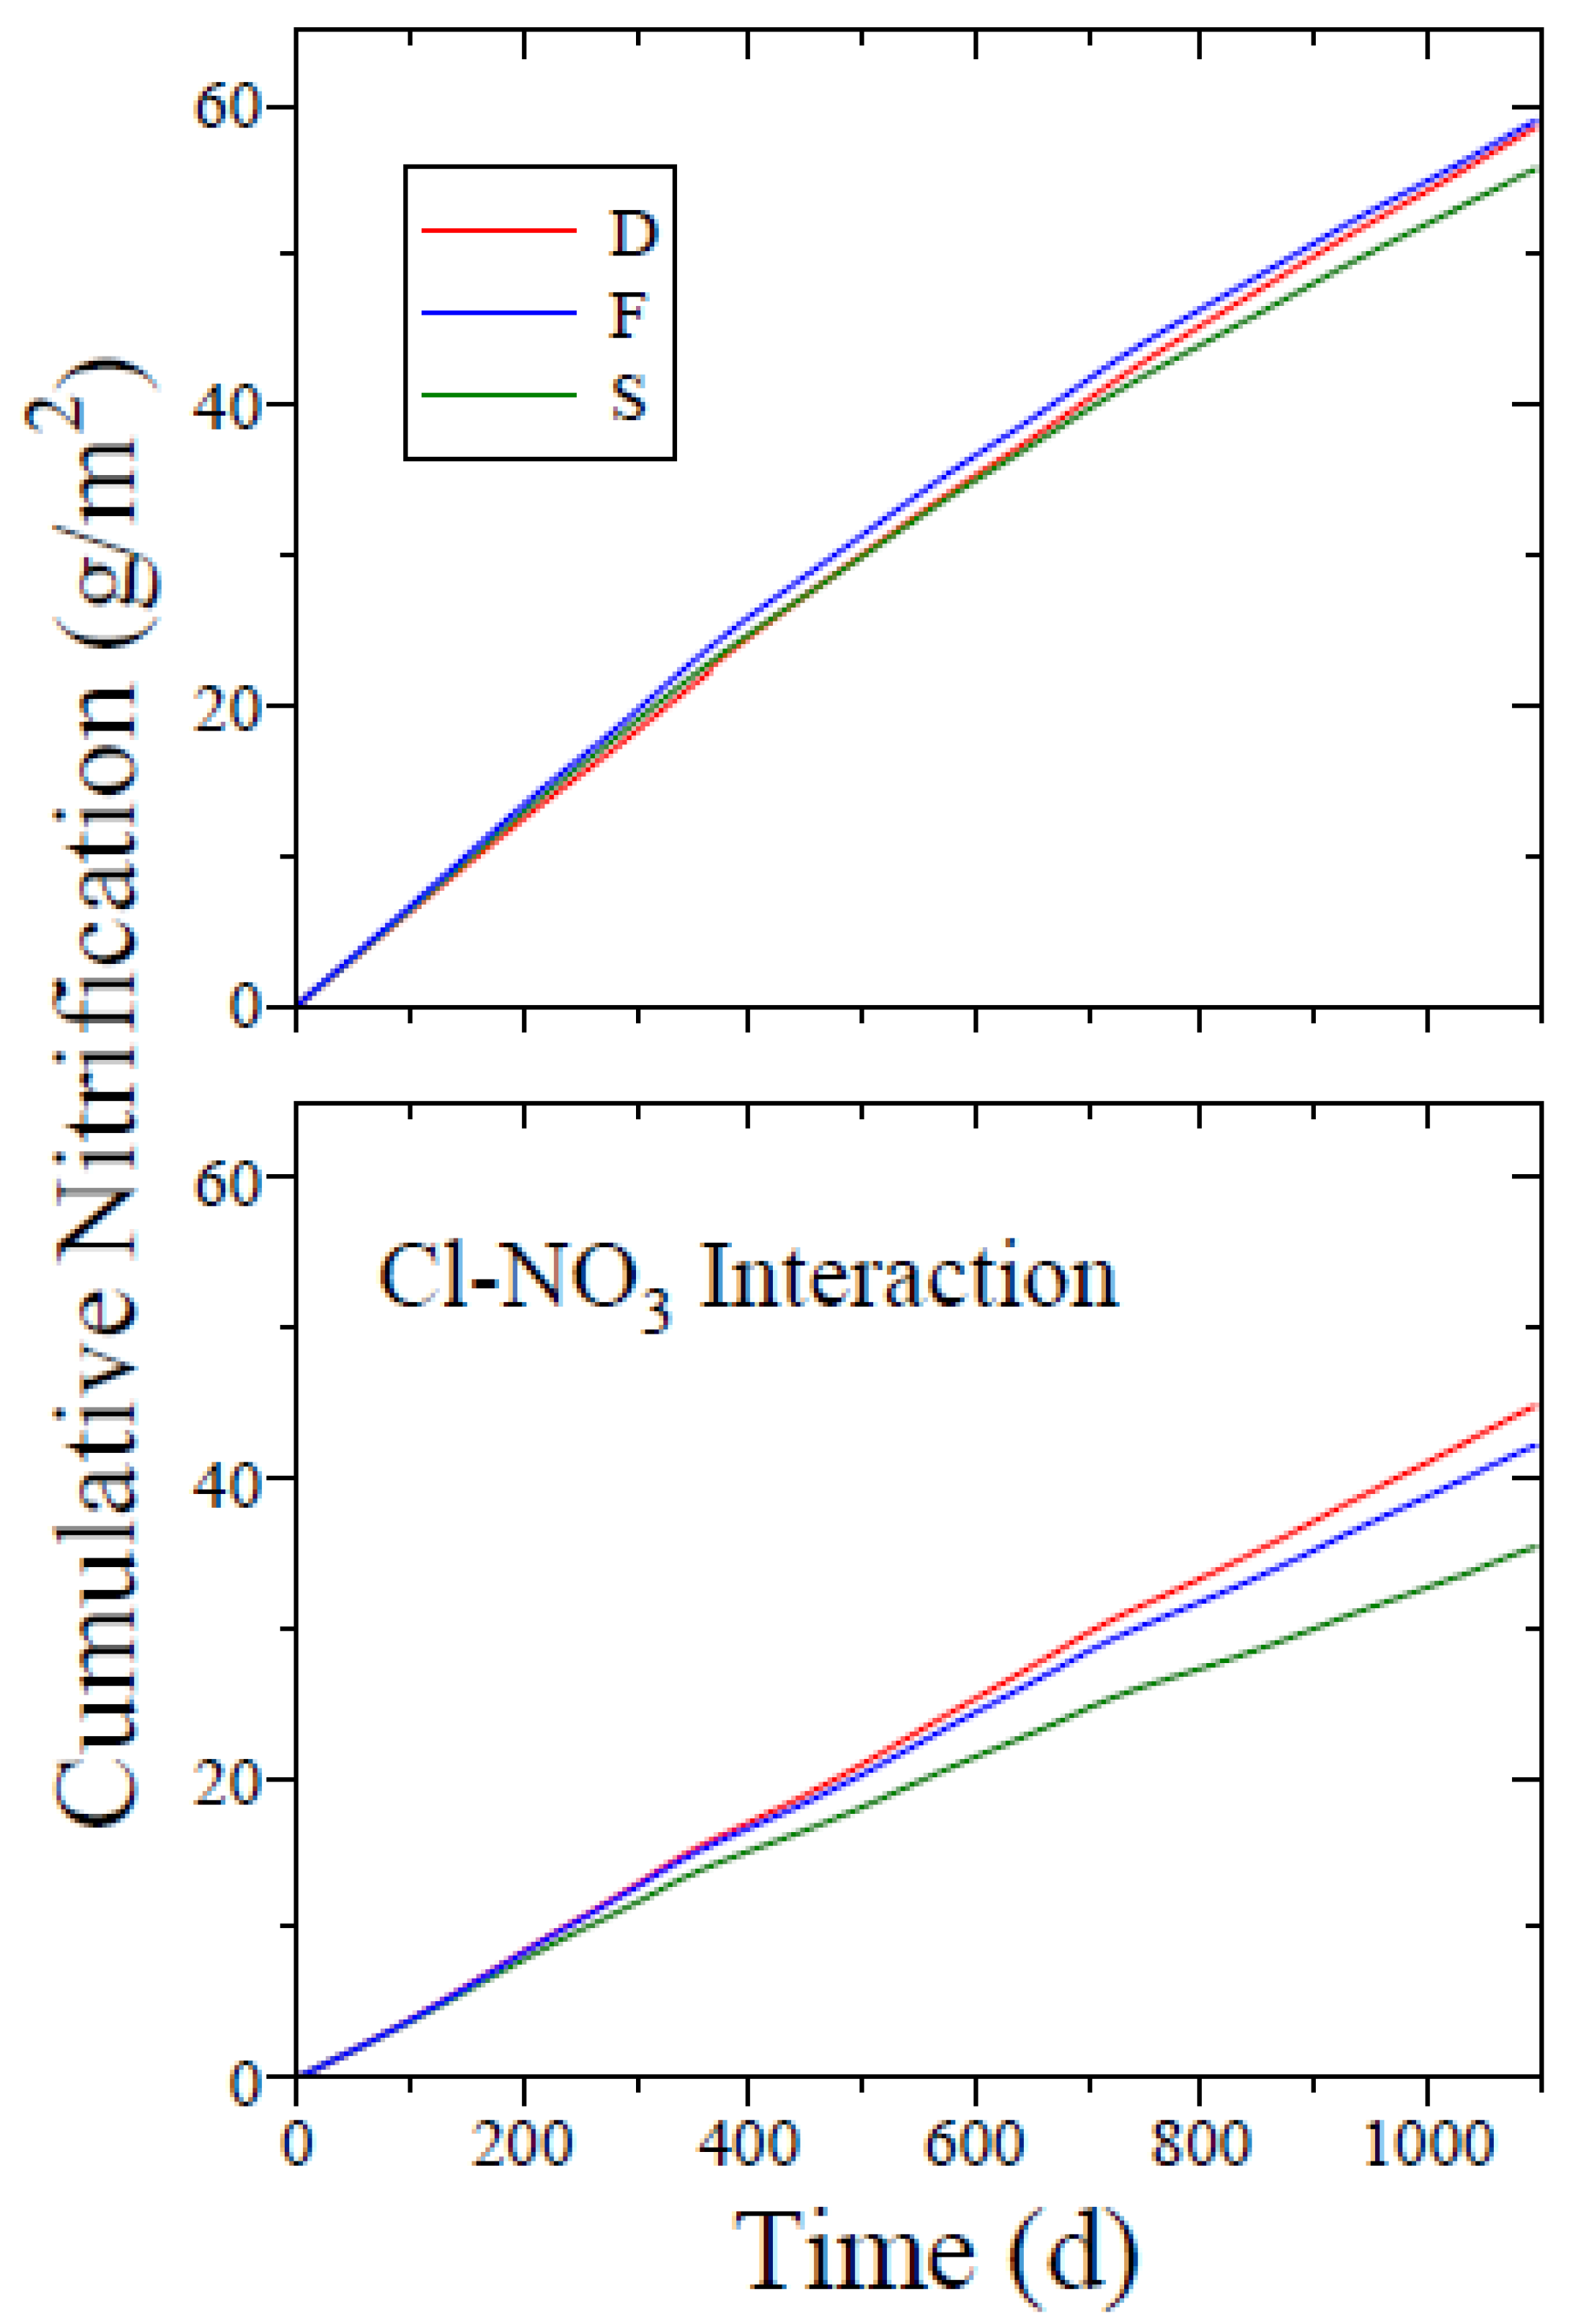
The effect of the irrigation water salinity on additional processes responsible for N loss (denitrification and ammonia volatilization) or gain (nitrification) was also analyzed. Figure 8 shows that the cumulative mass of nitrate added by nitrification decreases as Ciw increases. The interaction between chloride and nitrate further decreases nitrification, particularly when Ciw increases. Results of additional analyses (not shown here) suggest that the cumulative mass of N lost by denitrification and volatilization (which is much smaller than the cumulative mass of nitrate gained by nitrification, or the cumulative mass of N lost by root uptake) slightly increases as Ciw decreases. Both denitrification and ammonia volatilization were essentially independent of the interaction between chloride and nitrate.
3.5. Contaminant Leaching
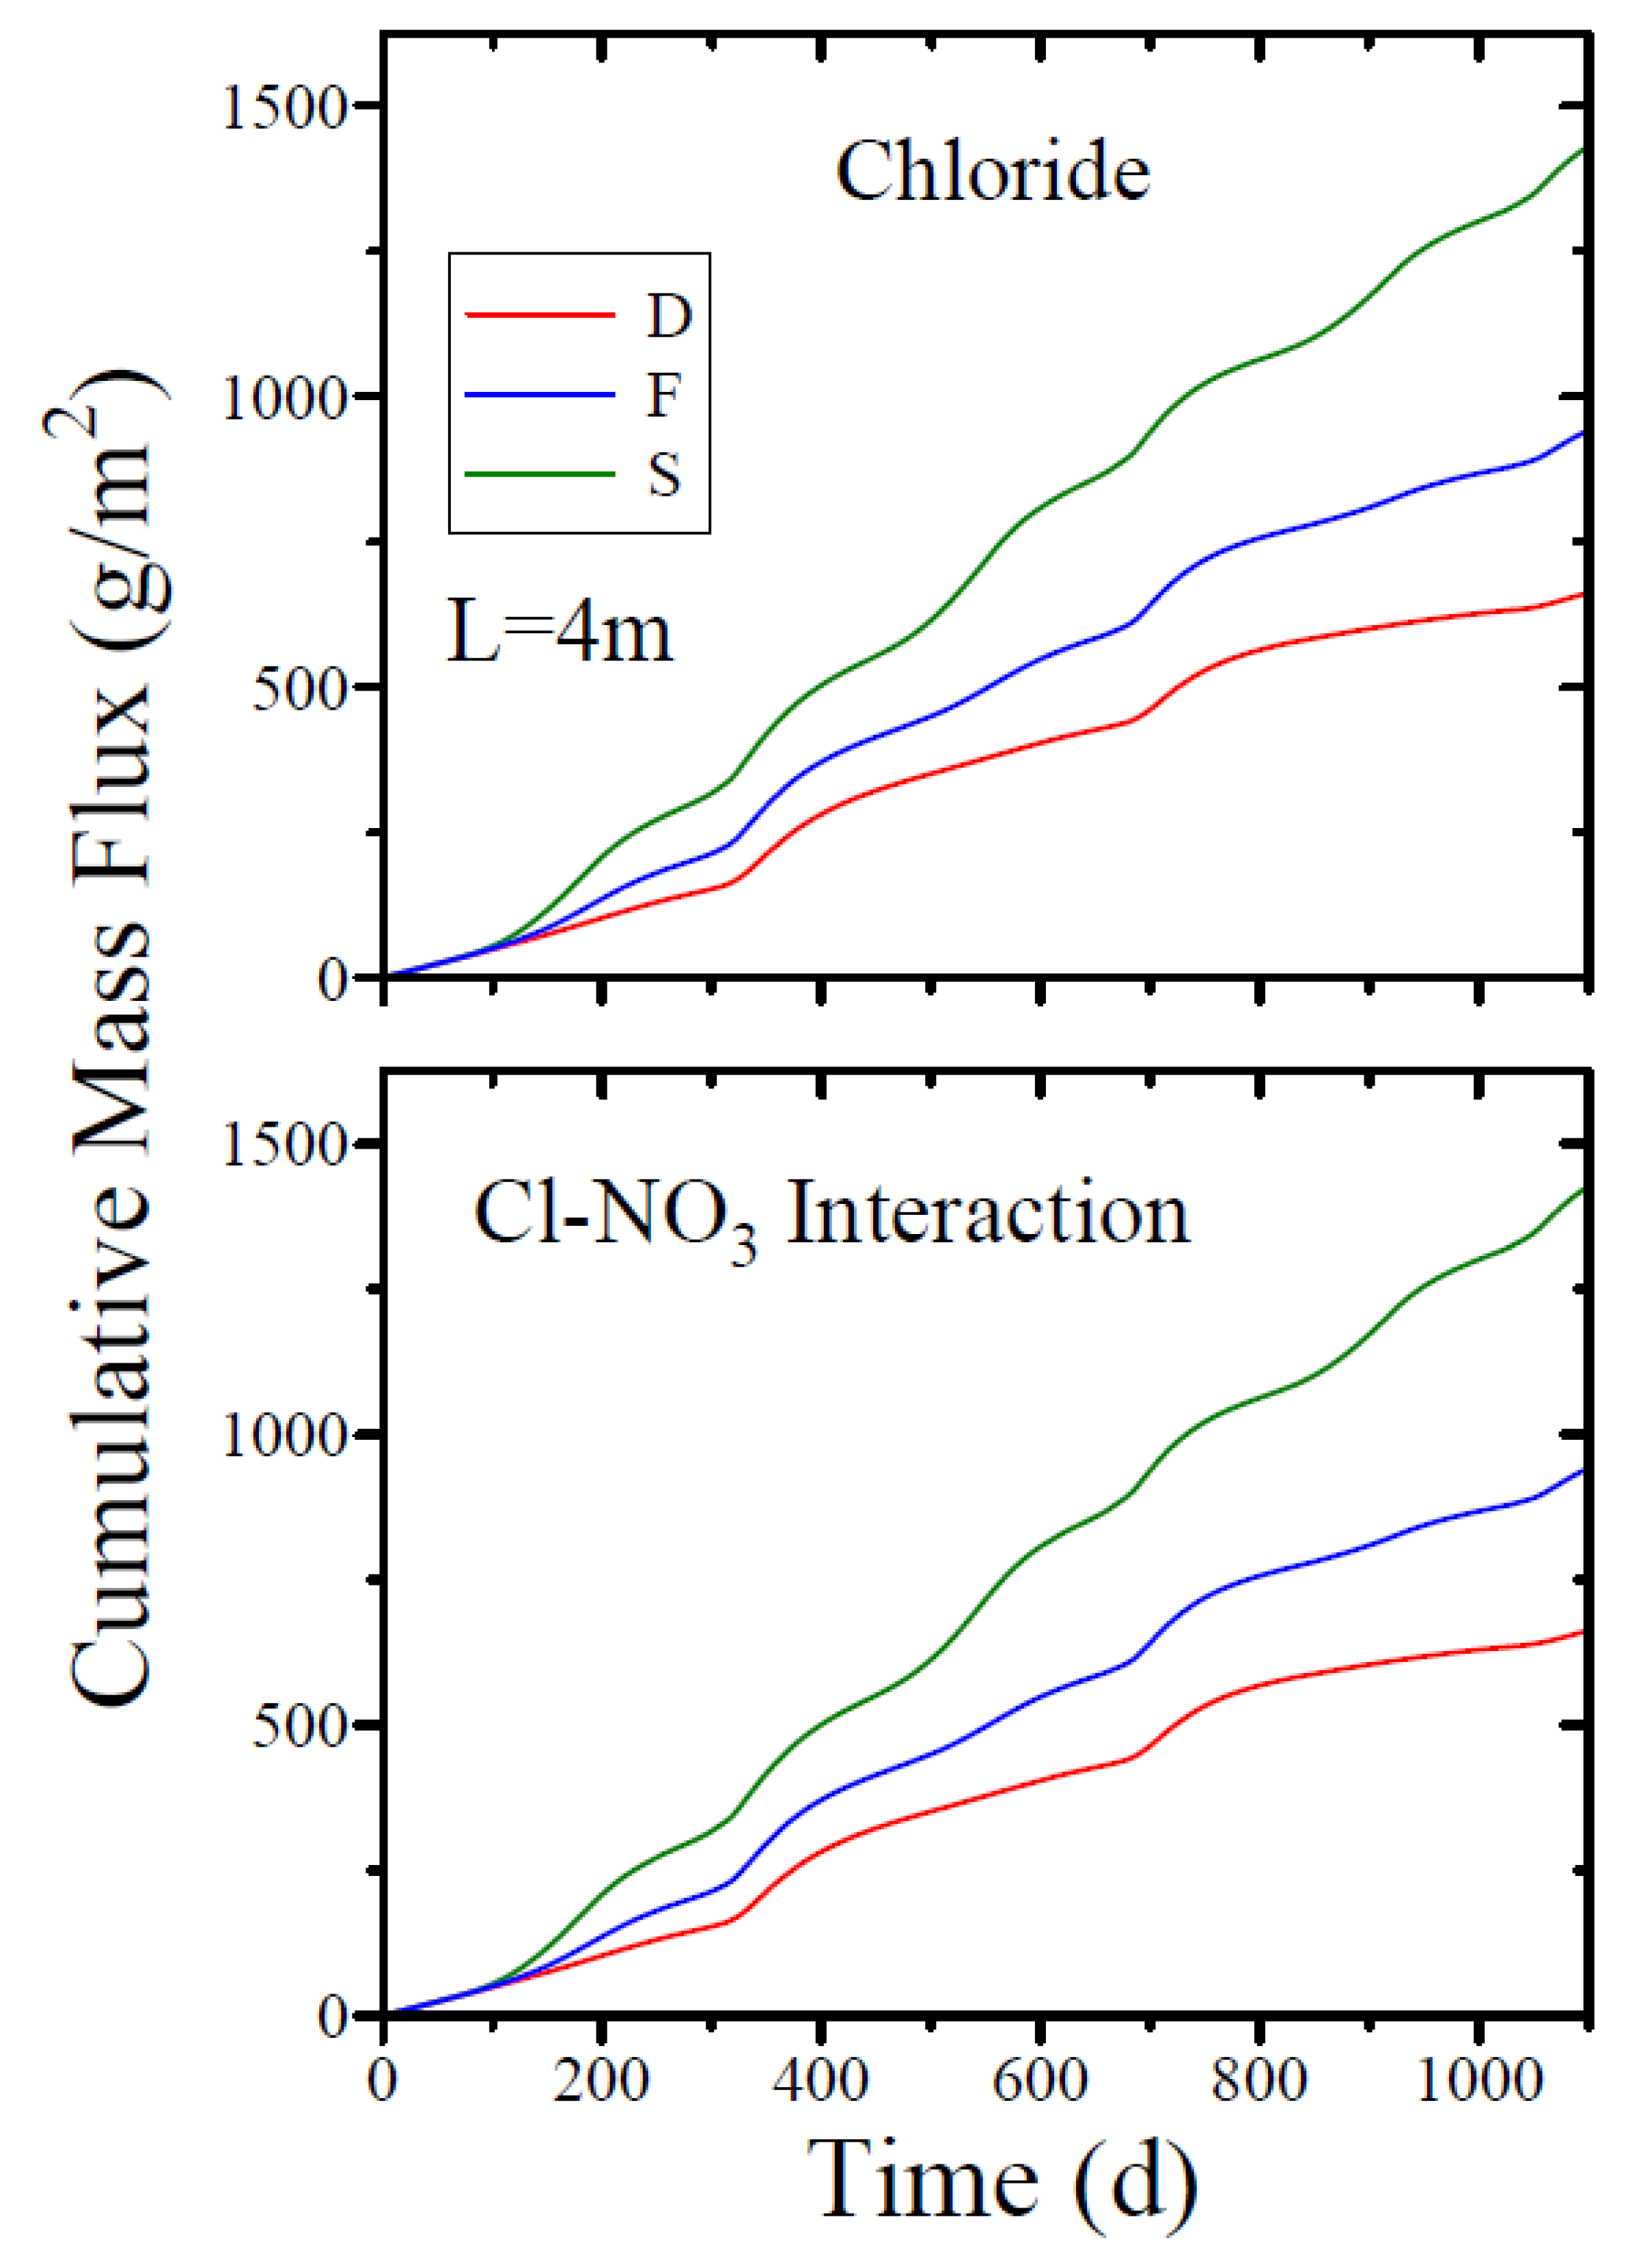
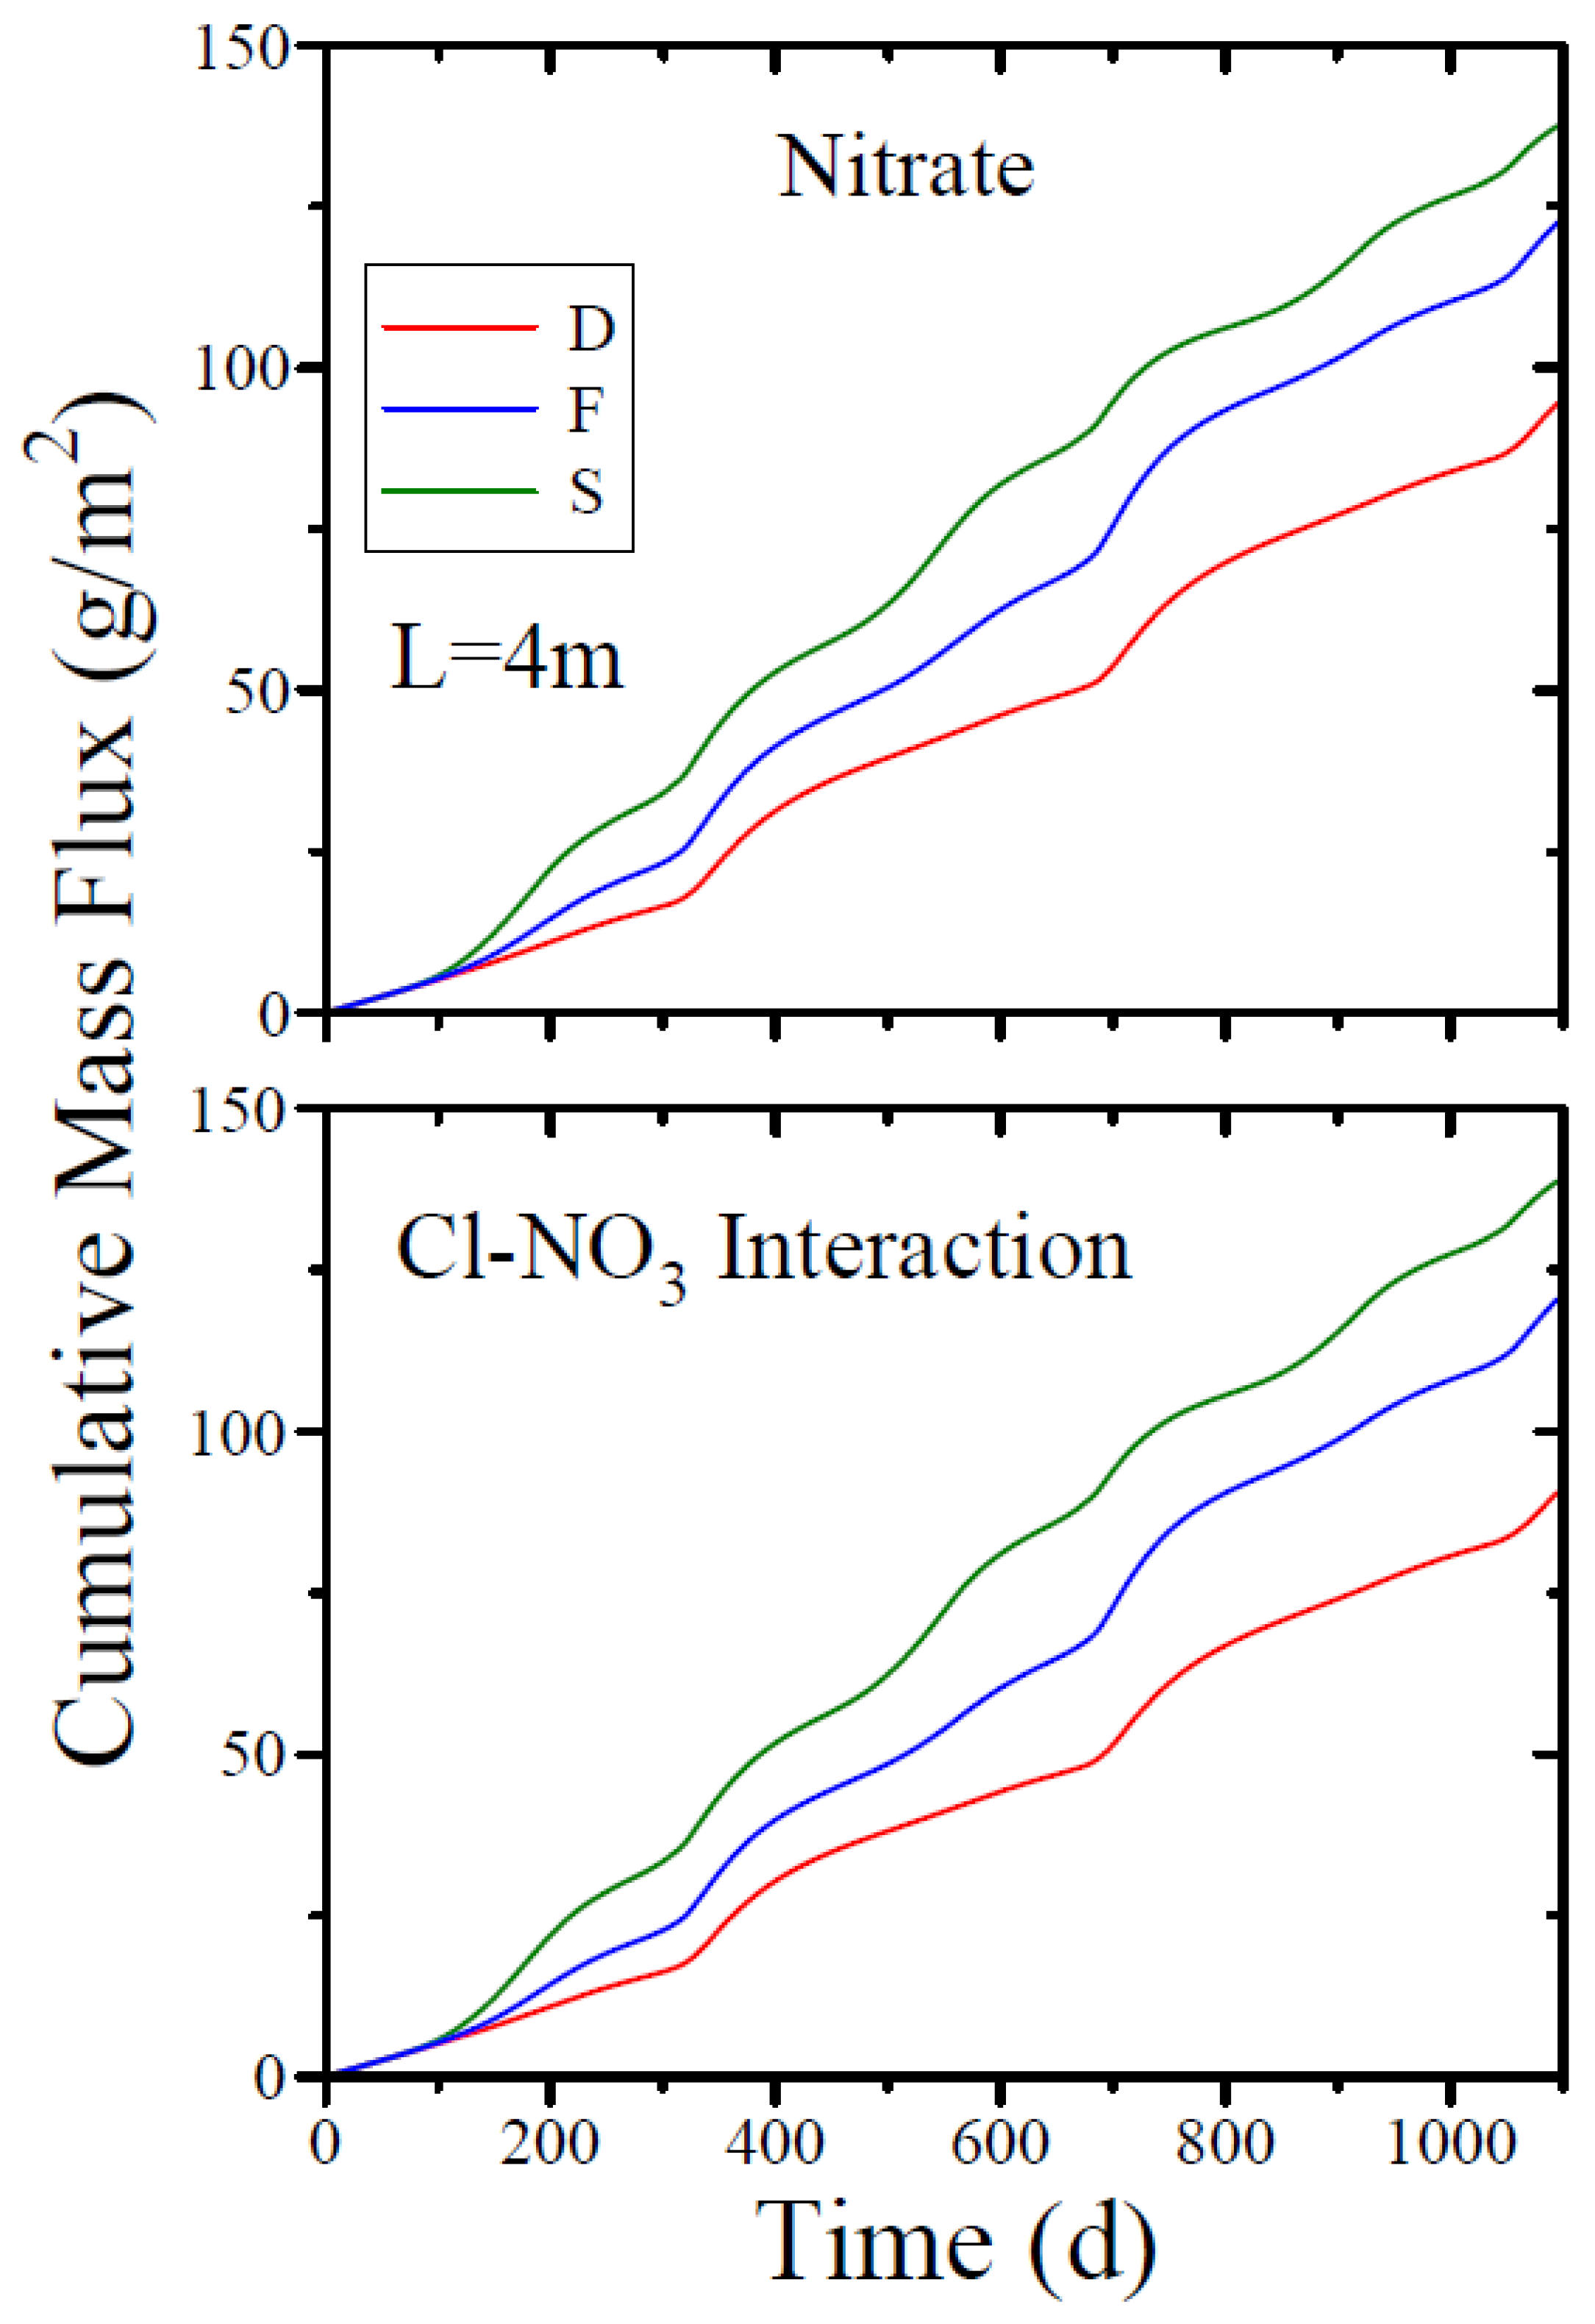
Cumulative mass fluxes of chloride and nitrate crossing a horizontal control plane (CP) located at soil depth, L = 4 m, are depicted in Figure 9 and Figure 10, respectively, for the same cases as in the previous figures. These figures show that the cumulative mass fluxes of chloride (Figure 9) and nitrate (Figure 10) leached through the horizontal CP, decreasing substantially as Ciw decreases. Furthermore, the results depicted in Figure 10 suggest that for a given Ciw, the cumulative mass flux of nitrate leached through the horizontal CP located at relatively deep soil depth, far below the active root zone, is essentially independent of the interaction between chloride and nitrate. At relatively shallower horizontal CPs located at soil depths closer to the active root zone, however, the chloride–nitrate interaction slightly increases the nitrate mass flux, particularly when Ciw increases.
Figure 9 and Figure 10 suggest that the effect of the chloride concentration in the irrigation water on the cumulative mass fluxes at relatively deep soil depth persists for a considerable period of time (3 years), which, in turn, includes substantial rainfall periods that slightly mask the effect of the salinity of the irrigation water on the contamination process.
4. Discussion
The effect of irrigation water salinity on the flow and the transport under cropped conditions was considered for this study. The results presented in Figure 1 to Figure 6 and Figure 9 and Figure 10 are explained by the direct effect of the irrigation water salinity on the soil salinity, and the mutual relationships between the extraction of water by the trees’ roots, soil salinity, and soil water content, and, consequently, soil hydraulic conductivity, water velocity, and solute mass flux.
Frequent irrigation with desalinated water decreases soil salinity close to the soil surface, and, consequently, changes the spatial pattern of the rates of the water extracted by the plant roots. Most significantly, the soil volume from which water extraction occurs is shallower and slightly wider, and it is associated with enhanced water extraction rates (Figure 1). Consequently, water content in the active root zone and, concurrently, the water content-dependent hydraulic conductivity and the vertical component of the water velocity vector decrease substantially (Figure 2). This phenomenon persists to considerable soil depths, far below the root zone (Figure 3 and Figure 4). It constitutes the main mechanism accountable for the decrease in the movement and the spread of the tracer in the soil profile (Figure 5 and Figure 6), and to the decrease in the mass fluxes of the pollutants that leached below the root zone, with decreasing irrigation water salinity (Figure 9 and Figure 10).
The effect of chloride–nitrate interactions on the fate of nitrate in the flow system was also considered. The results presented in Figure 7 and Figure 8 suggest that chloride–nitrate interactions decrease N uptake by the plant roots and decreases the mass of nitrate added to the flow system by nitrification, particularly when the salinity of the irrigation water increases. These results are the outcome of Equation (1) and are in agreement with previous studies [27].
The results presented in Figure 9 and Figure 10, however, suggest that the effect of the chloride–nitrate interactions on the mass fluxes of nitrate leached through horizontal CPs located below the root zone is relatively small, particularly when Ciw decreases, and when the horizontal CPs are located at soil depths far below the root zone. These results are explained by the following: (i) the chloride–nitrate interactions are limited to the active root zone, located in the upper part of soil profile, and (ii) the gain of the nitrate mass (because of reduced uptake by the plant roots) is essentially compensated for by the loss of the nitrate mass (because of reduced nitrification) in the active root zone.
5. Summary and Concluding Remarks
The main findings of this study are summarized as follows:
(1) The use of low-salinity desalinated water for irrigation may substantially decrease the mass fluxes of both chloride (as expected) and nitrate leached through horizontal CPs located below the root zone.
(2) The chloride–nitrate interactions affect processes that occur in the active root zone. It decreases N uptake by the plant roots and decreases the mass of nitrate added to the flow system by nitrification, particularly when the salinity of the irrigation water increases.
(3) The effect of the chloride–nitrate interactions on the mass fluxes of nitrate leached through horizontal CPs located below the root zone is relatively small, particularly when Ciw decreases, and when the horizontal CPs are located at soil depths far below the root zone.
Before concluding, we would like to emphasize the fact that this study’s results rely on physically based numerical simulations of flow and transport, which, in turn, may be viewed as “numerical experiments”. Such experiments provide detailed information (that, generally, is not attainable in practice from physical experiments) on the consequences of soil, crop, irrigation and meteorological characteristics for water flow and transport of conservative and reactive solutes under relatively realistic conditions. The findings of this study, however, are restricted to a particular site-specific application with given characteristics of soil, crop, weather, and the irrigation system.
The qualitative agreement between the results of this study and the results of a relatively large-scale field experiment conducted recently at Gilat, Israel [34], however, are very encouraging. The results of that experiment (conducted under soil, crop, irrigation, and meteorological characteristics that differ substantially from those considered in our study) showed that measured concentrations of nitrate in the relatively deep soil layers (2 to 4 m) were higher under the high-nitrate treatments, especially under the more saline treatments. Furthermore, analyses of the experiment’s results suggested that irrigation with the desalinated water had almost no effect on the crops’ yields and reduced the nitrate mass fluxes at relatively deep soil layers, far below the active root zone.
In conclusion, we believe that the scope of this study is of broad interest, and that the results of this study are relevant to environmental issues related to the interaction between irrigation water quality and groundwater contamination in semi-arid and arid zones.
Author Contributions
Conceptualization, D.R. and D.K; Numerical Analysis, D.R.; Writing D.R and D.K. Project Administration, D.K.
Funding
This is a contribution from the Institute of Soils, Water and Environmental Sciences, the Agricultural Research Organization, Israel. The research was supported in part by grants from the Chief Scientist of the Israeli Ministry of Agriculture, grant nos. 20-13-0013 and 20-03-0032.
Acknowledgments
The authors are grateful to Mr. Asher Laufer for his technical assistance during this study.
Conflicts of Interest
The authors declare no conflict of interest.
References
- Gao, L.; Yoshikawa, S.; Iseri, Y.; Fujimori, S.; Kanae, S. An Economic Assessment of the Global Potential for Seawater Desalination to 2050. Water 2017, 9, 763. [Google Scholar] [CrossRef]
- Hanasaki, N.; Yoshikawa, S.; Kakinuma, K.; Kanae, S. A seawater desalination scheme for global hydrological models. Hydrol. Earth Syst. Sci. 2016, 20, 4143–4157. [Google Scholar] [CrossRef]
- Stanhill, G.; Kurtzman, D.; Rosa, R. Estimating desalination requirements in semi-arid climates: A Mediterranean case study. Desalination 2015, 355, 118–123. [Google Scholar] [CrossRef]
- Israel Water Authority. Consumption of Potable Water in 2017 (in Hebrew). 2018. Available online: http://www.water.gov.il/Hebrew/ProfessionalInfoAndData/Allocation-Consumption-and-production/20172/shafirim_mavo_2017.pdf (accessed on 31 March 2019).
- Israeli Government Decision Number 3866, 2018. A Strategic Plan for Dealing with Drought Periods in the Years 2018–2030 (in Hebrew). 2018. Available online: https://www.gov.il/he/Departments/policies/dec3866_2018 (accessed on 31 March 2019).
- Israel Water Authority. Data on Freshwater Consumption for Agriculture from the National Water System (in Hebrew). 2018. Available online: http://www.water.gov.il/Hebrew/ProfessionalInfoAndData/Allocation-Consumption-and-production/DocLib7/agriculture-consumption-2015-2016.pdf (accessed on 31 March 2019).
- Shlezinger, M.; Amitai, Y.; Akriv, A.; Gabay, H.; Shechter, M.; Leventer-Roberts, M. Association between exposure to desalinated sea water and ischemic heart disease, diabetes mellitus and colorectal cancer; A population-based study in Israel. Environ. Res. 2018, 166, 620–627. [Google Scholar] [CrossRef]
- Lehmann, O.; Eckhaus, O.; Lahav, O.; Birnhack, L. Replenishing Mg(II) to desalinated water by seawater nanofiltration followed by magnetic separation of Mg(OH)2(s)Fe3O4 particles. Desalin. Water Treat. 2016, 57, 19903–19916. [Google Scholar] [CrossRef]
- Ganot, Y.; Holtzman, R.; Weisbrod, N.; Russak, A.; Katz, Y.; Kurtzman, D. Geochemical processes during managed aquifer recharge with desalinated seawater. Water Resour. Res. 2018, 54, 978–994. [Google Scholar] [CrossRef]
- Negev, I.; Guttman, J.; Kloppmann, W. The Use of Stable Water Isotopes as Tracers in Soil Aquifer Treatment (SAT) and in Regional Water Systems. Water 2017, 9, 73. [Google Scholar] [CrossRef]
- Ganot, Y.; Holtzman, R.; Weisbrod, N.; Nitzan, I.; Katz, Y.; Kurtzman, D. Monitoring and modeling infiltration–recharge dynamics of managed aquifer recharge with desalinated seawater. Hydrol. Earth Syst. Sci. 2017, 21, 4479–4493. [Google Scholar] [CrossRef]
- Yermiyahu, U.; Tal, A.; Ben-Gal, A.; Bar-Tal, A.; Tarchitzky, J.; Lahav, O. Rethinking desalinated water quality and agriculture. Science 2007, 318, 920–921. [Google Scholar] [CrossRef]
- Lahav, O.; Kochva, M.; Tarchitzky, J. Potential drawbacks associated with agricultural irrigation with treated wastewaters from desalinated water origin and possible remedies. Water Sci. Technol. 2010, 61, 2451. [Google Scholar] [CrossRef] [PubMed]
- Ben-Gal, A.; Yermiyahu, U.; Cohen, S. Fertilization and Blending Alternatives for Irrigation with Desalinated Water. J. Environ. Qual. 2010, 38, 529–536. [Google Scholar] [CrossRef] [PubMed]
- Russo, D.; Laufer, A.; Silber, A.; Assouline, S. Water uptake, active root volume and solute leaching under drip irrigation: A numerical study. Water Resour. Res. 2009, 45, W12413. [Google Scholar] [CrossRef]
- Kurtzman, D.; Shapira, R.; Bar-Tal, A.; Fine, P.; Russo, D. Nitrate fluxes to groundwater under citrus orchards in Mediterranean climate observations, calibrated models, simulations and agro-hydrological conclusions. J. Contam. Hydrol. 2013, 151, 93–104. [Google Scholar] [CrossRef] [PubMed]
- Massa, D.; Mattson, N.S.; Lieth, H.J. Effects of saline root environment (NaCl) on nitrate and potassium uptake kinetics for rose plants: A Michaelis–Menten modeling approach. Plant Soil 2009, 318, 101–115. [Google Scholar] [CrossRef]
- Russo, D.; Bouton, M. Statistical analysis of spatial variability in unsaturated flow parameters. Water Resour. Res. 1992, 28, 1911–1925. [Google Scholar] [CrossRef]
- Russo, D.; Russo, I.; Laufer, A. On the spatial variability of parameters of the unsaturated hydraulic conductivity. Water Resour. Res. 1997, 33, 946–956. [Google Scholar] [CrossRef]
- van Genuchten, M.T. A closed-form equation for predicting the hydraulic conductivity of unsaturated soils. Soil Sci. Soc. Am. J. 1980, 44, 892–898. [Google Scholar] [CrossRef]
- Mishra, S.; Parker, J.C.; Singhal, N. Estimation of soil hydraulic properties and their uncertainties from particle size distribution data. J. Hydrol. 1989, 108, 1–18. [Google Scholar] [CrossRef]
- Russo, D.; Zaidel, J.; Fiori, A.; Laufer, A. Numerical analysis of flow and transport from a multiple—Source system in a partially saturated heterogeneous soil. Water Resour. Res. 2006, 42, W06415. [Google Scholar] [CrossRef]
- Russo, D. On the control of solute mass fluxes and concentrations below fields irrigated with low-quality water: A numerical study. Water Resour. Res. 2017, 53, 8925–8940. [Google Scholar] [CrossRef]
- Perkins, T.K.; Johnston, O.C. A review of diffusion and dispersion in porous media. Soc. Petrol. Eng. J. 1963, 3, 70–84. [Google Scholar] [CrossRef]
- Lotse, E.G.; Jarbo, J.D.; Simmons, K.E.; Baker, D.E. Simulation of nitrogen dynamics and leaching from soil with dual pore system. J. Contam. Hydrol. 1992, 10, 183–196. [Google Scholar] [CrossRef]
- Nye, P.; Tinker, P.B. Solute Movement in the Soil-Root System; Blackwell Scientific Publications: Hoboken, NJ, USA, 1977. [Google Scholar]
- Russo, D.; Laufer, A.; Shapira, R.H.; Kurtzman, D. Assessment of solute fluxes beneath an orchard irrigated with treated sewage water: A numerical study. Water Resour. Res. 2013, 49, 657–674. [Google Scholar] [CrossRef]
- Fried, M.; Broashard, H. The Soil—Plant System; Academic Press: New York, NY, USA, 1967. [Google Scholar]
- Xu, G.; Magen, H.; Tarchitzky, J.; Kafkafi, U. Advances in chloride nutrition of plants. Adv. Agron. 2000, 68, 97–150. [Google Scholar]
- Neuman, S.P.; Feddes, R.A.; Bresler, E. Finite element analysis of two-dimensional flow in soils considering water uptake by roots, 1. Theory. Soil Sci. Soc. Am. Proc. 1975, 39, 224–230. [Google Scholar] [CrossRef]
- Russo, D.; Zaidel, J.; Laufer, A. Numerical analysis of flow and transport in a three-dimensional partially saturated heterogeneous soil. Water Resour. Res. 1998, 34, 1451–1468. [Google Scholar] [CrossRef]
- Russo, D.; Zaidel, J.; Laufer, A. Numerical analysis of flow and transport from trickle sources on a spatially heterogeneous hillslope. Vadose Zone J. 2005, 4, 838–847. [Google Scholar] [CrossRef]
- Jury, W.A.; Sposito, G. Field calibration and validation of solute transport models for the unsaturated zone. Soil Sci. Soc. Am. J. 1985, 49, 1331–1441. [Google Scholar] [CrossRef]
- Weissman, G.; Bell, G.; Dahan, O. The deep unsaturated zone under the Gilat field experiment, chapter 4 in: Reducing nitrate fluxes to groundwater under agricultural land in the desalination era (in Hebrew). A report submitted to the Chief Scientist of the Israeli Ministry of Agriculture for project no. 20-13-0013. 2019. [Google Scholar]
Figure 1.
Profiles of the horizontally averaged root’s water uptake rate for the three different irrigation scenarios (D, Ccl = 50 ppm, F, Ccl = 300 ppm, and S, Ccl = 640 ppm); in all cases, CNH4 = 10 ppm and CNO3 = 70 ppm. Results are depicted for t = 455 d (ninety days after the start of the irrigation season of the second year). D, desalinated; F, fresh; S, saline.

Figure 2.
(a)Temporal variations of the simulated soil water content, θ, and (b) vertical component of the velocity vector, Vz, at soil depth x1 = Zup, representing the vertical position of the centroid of the soil volume active in water uptake, for the different scenarios examined. Results are depicted for the irrigation season of the second year.

Figure 3.
Profiles of the (a) horizontally averaged mean and (b) SD of the water content for the different scenarios examined. Results are depicted for the irrigation season of the second year.
Figure 3.
Profiles of the (a) horizontally averaged mean and (b) SD of the water content for the different scenarios examined. Results are depicted for the irrigation season of the second year.

Figure 4.
Profiles of the (a) horizontally averaged mean and (b) SD of the vertical component of the velocity vector for the different scenarios examined. Results are depicted for the irrigation season of the second year.
Figure 4.
Profiles of the (a) horizontally averaged mean and (b) SD of the vertical component of the velocity vector for the different scenarios examined. Results are depicted for the irrigation season of the second year.

Figure 5.
(a) Vertical position of the centroid of the tracer mass, Zc, and (b) the spread about it in the vertical direction, S11, as functions of time, for the different scenarios examined.
Figure 5.
(a) Vertical position of the centroid of the tracer mass, Zc, and (b) the spread about it in the vertical direction, S11, as functions of time, for the different scenarios examined.

Figure 6.
Scaled travel time at a horizontal control plane (CP) located at soil depth, L = 1 m, for the different scenarios examined.
Figure 6.
Scaled travel time at a horizontal control plane (CP) located at soil depth, L = 1 m, for the different scenarios examined.

Figure 7.
Cumulative mass of N extracted by the trees’ roots as a function of time, for the different scenarios examined. Top panel—the effect of the competition between nitrate and chloride on N uptake was disregarded.
Figure 7.
Cumulative mass of N extracted by the trees’ roots as a function of time, for the different scenarios examined. Top panel—the effect of the competition between nitrate and chloride on N uptake was disregarded.

Figure 8.
Cumulative mass of nitrate gained by nitrification, as a function of time, for the different scenarios examined. Top panel—the effect of the chloride on nitrification was disregarded.
Figure 8.
Cumulative mass of nitrate gained by nitrification, as a function of time, for the different scenarios examined. Top panel—the effect of the chloride on nitrification was disregarded.

Figure 9.
Cumulative mass fluxes of chloride crossing a horizontal CP located at soil depth, L = 4 m, for the different scenarios examined. Top panel—the effect of the chloride on N uptake and nitrification was disregarded.
Figure 9.
Cumulative mass fluxes of chloride crossing a horizontal CP located at soil depth, L = 4 m, for the different scenarios examined. Top panel—the effect of the chloride on N uptake and nitrification was disregarded.

Figure 10.
Cumulative mass fluxes of nitrate crossing a horizontal CP located at soil depth, L = 4 m, for the different scenarios examined. Top panel—the effect of the chloride on N uptake and nitrification was disregarded.
Figure 10.
Cumulative mass fluxes of nitrate crossing a horizontal CP located at soil depth, L = 4 m, for the different scenarios examined. Top panel—the effect of the chloride on N uptake and nitrification was disregarded.

© 2019 by the authors. Licensee MDPI, Basel, Switzerland. This article is an open access article distributed under the terms and conditions of the Creative Commons Attribution (CC BY) license (http://creativecommons.org/licenses/by/4.0/).
Share and Cite
MDPI and ACS Style
Russo, D.; Kurtzman, D. Using Desalinated Water for Irrigation: Its Effect on Field Scale Water Flow and Contaminant Transport under Cropped Conditions. Water 2019, 11, 687. https://doi.org/10.3390/w11040687
AMA Style
Russo D, Kurtzman D. Using Desalinated Water for Irrigation: Its Effect on Field Scale Water Flow and Contaminant Transport under Cropped Conditions. Water. 2019; 11(4):687. https://doi.org/10.3390/w11040687
Chicago/Turabian StyleRusso, David, and Daniel Kurtzman. 2019. "Using Desalinated Water for Irrigation: Its Effect on Field Scale Water Flow and Contaminant Transport under Cropped Conditions" Water 11, no. 4: 687. https://doi.org/10.3390/w11040687
Note that from the first issue of 2016, this journal uses article numbers instead of page numbers. See further details here.