Quantification of the Evaporation Rates from Six Types of Wetland Cover in Palo Verde National Park, Costa Rica

 , and
, and
Abstract
:1. Introduction
2. Materials and Methods
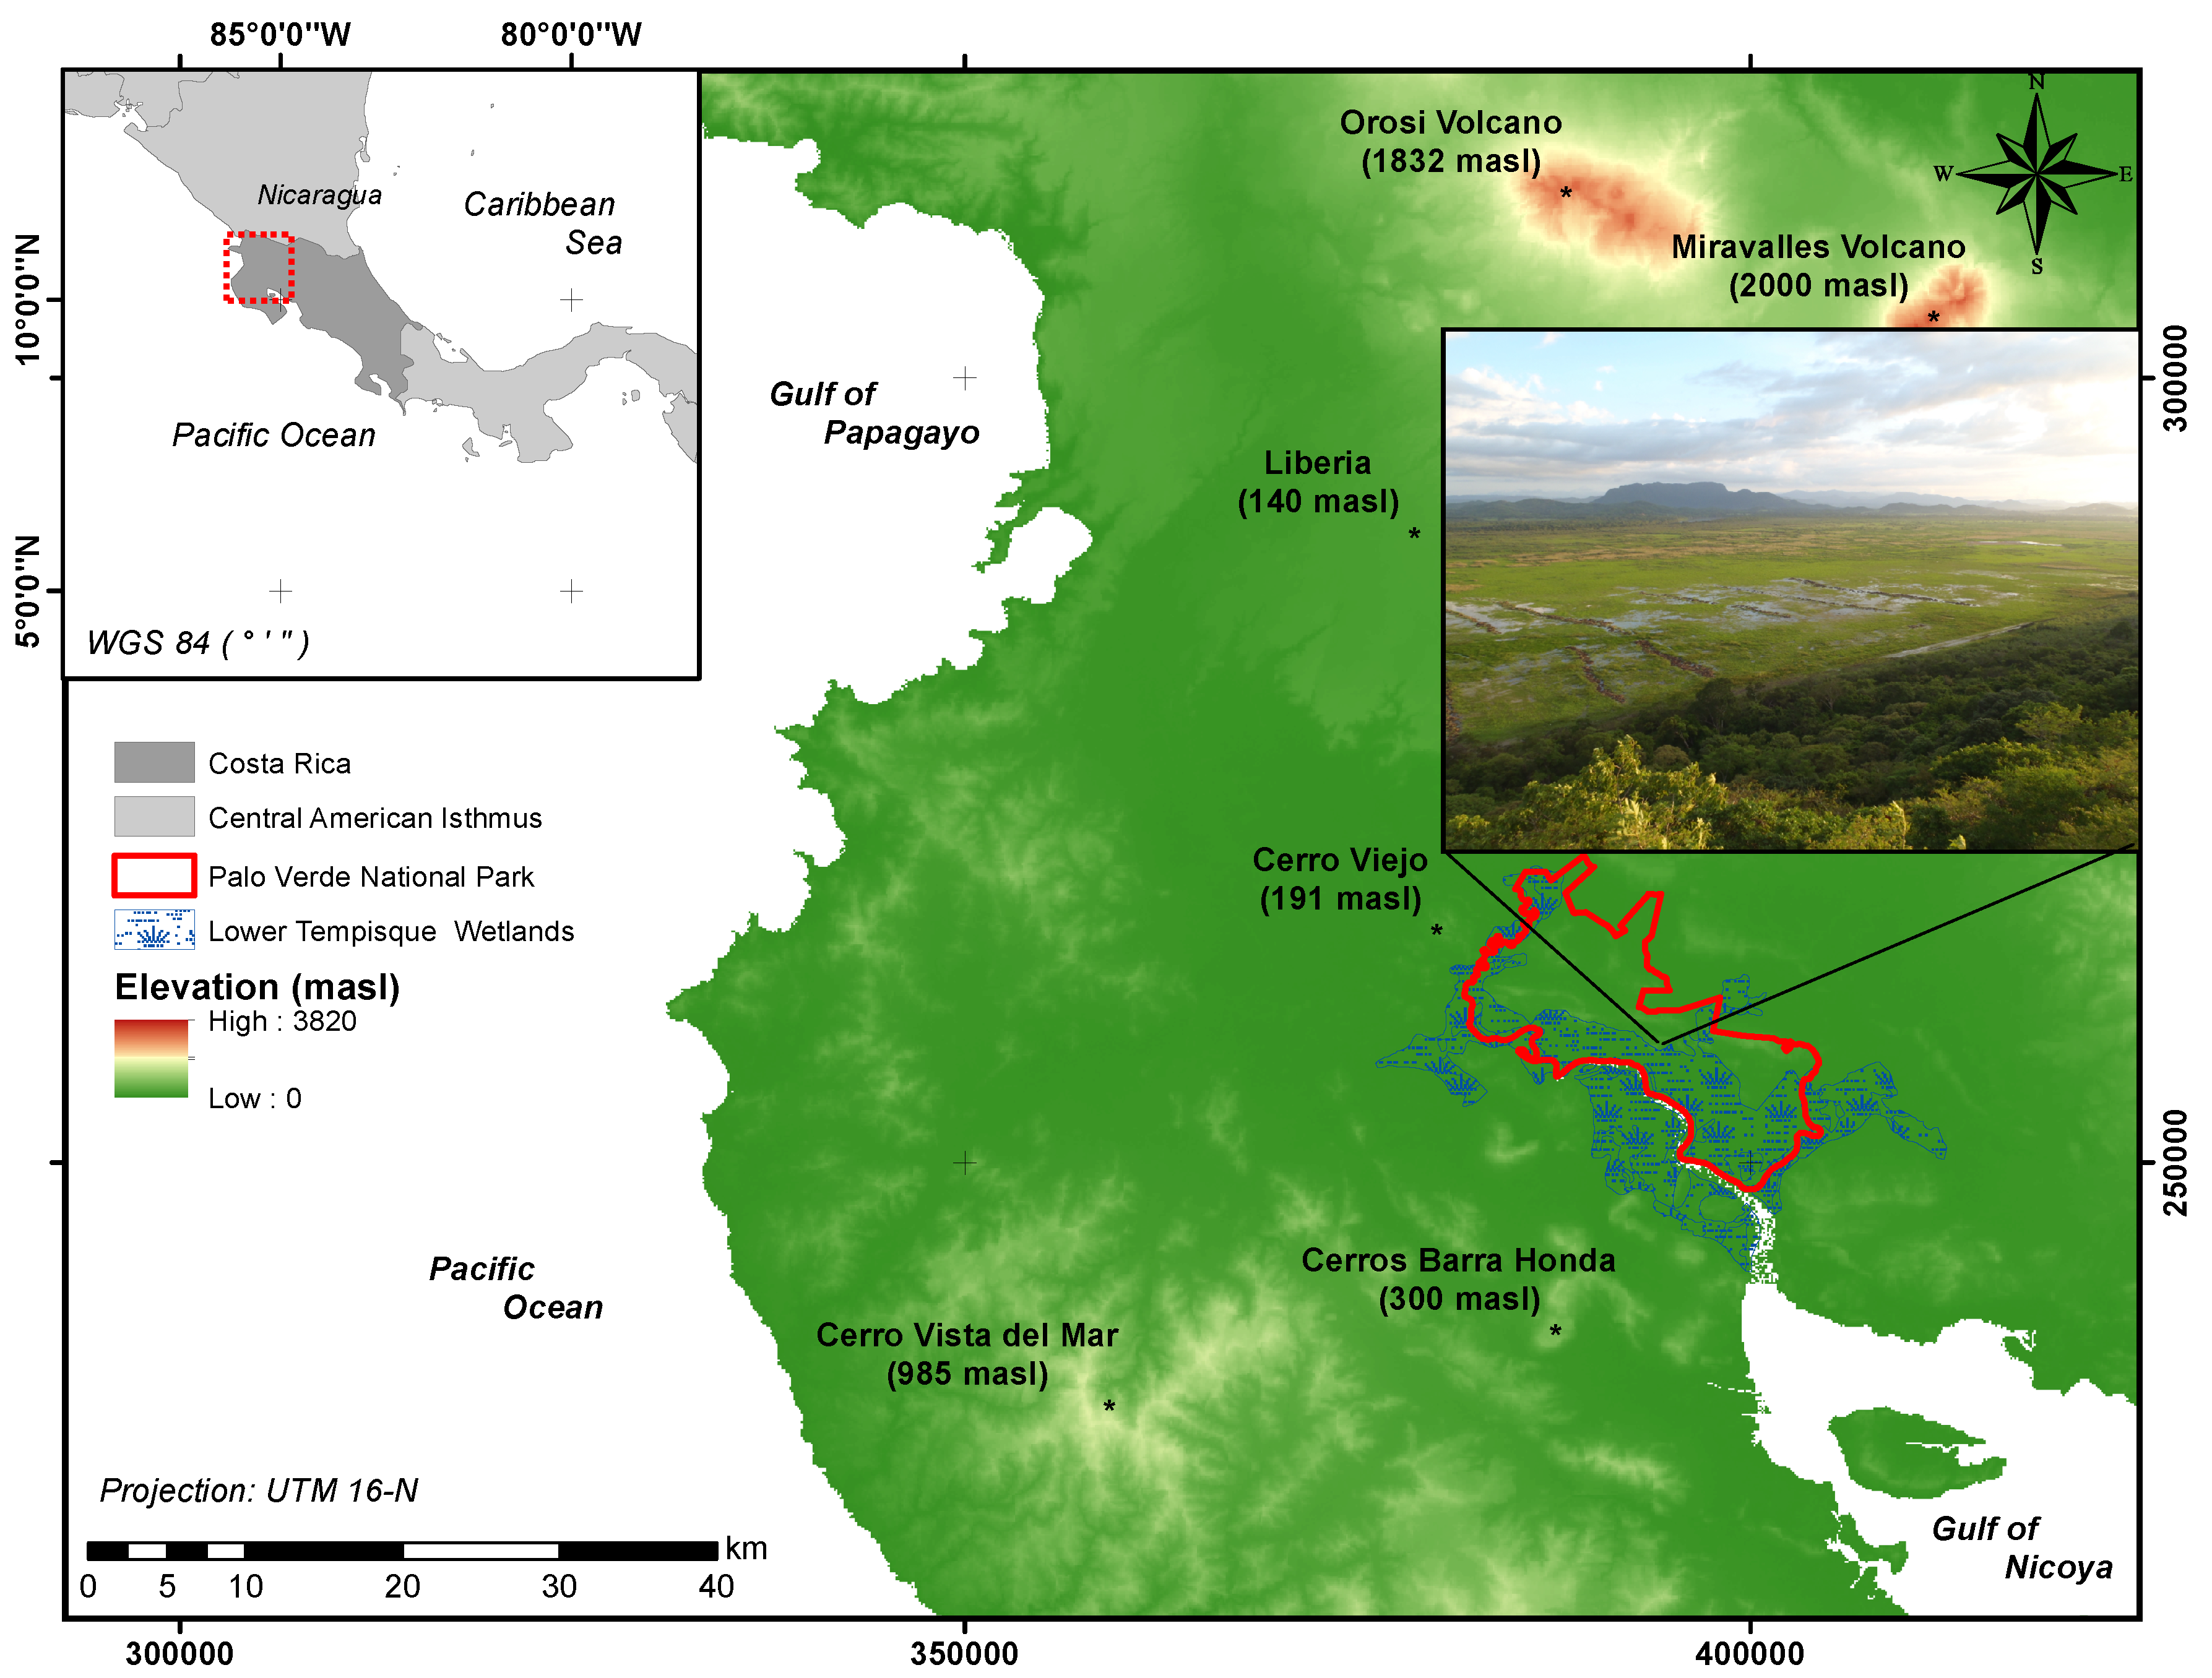
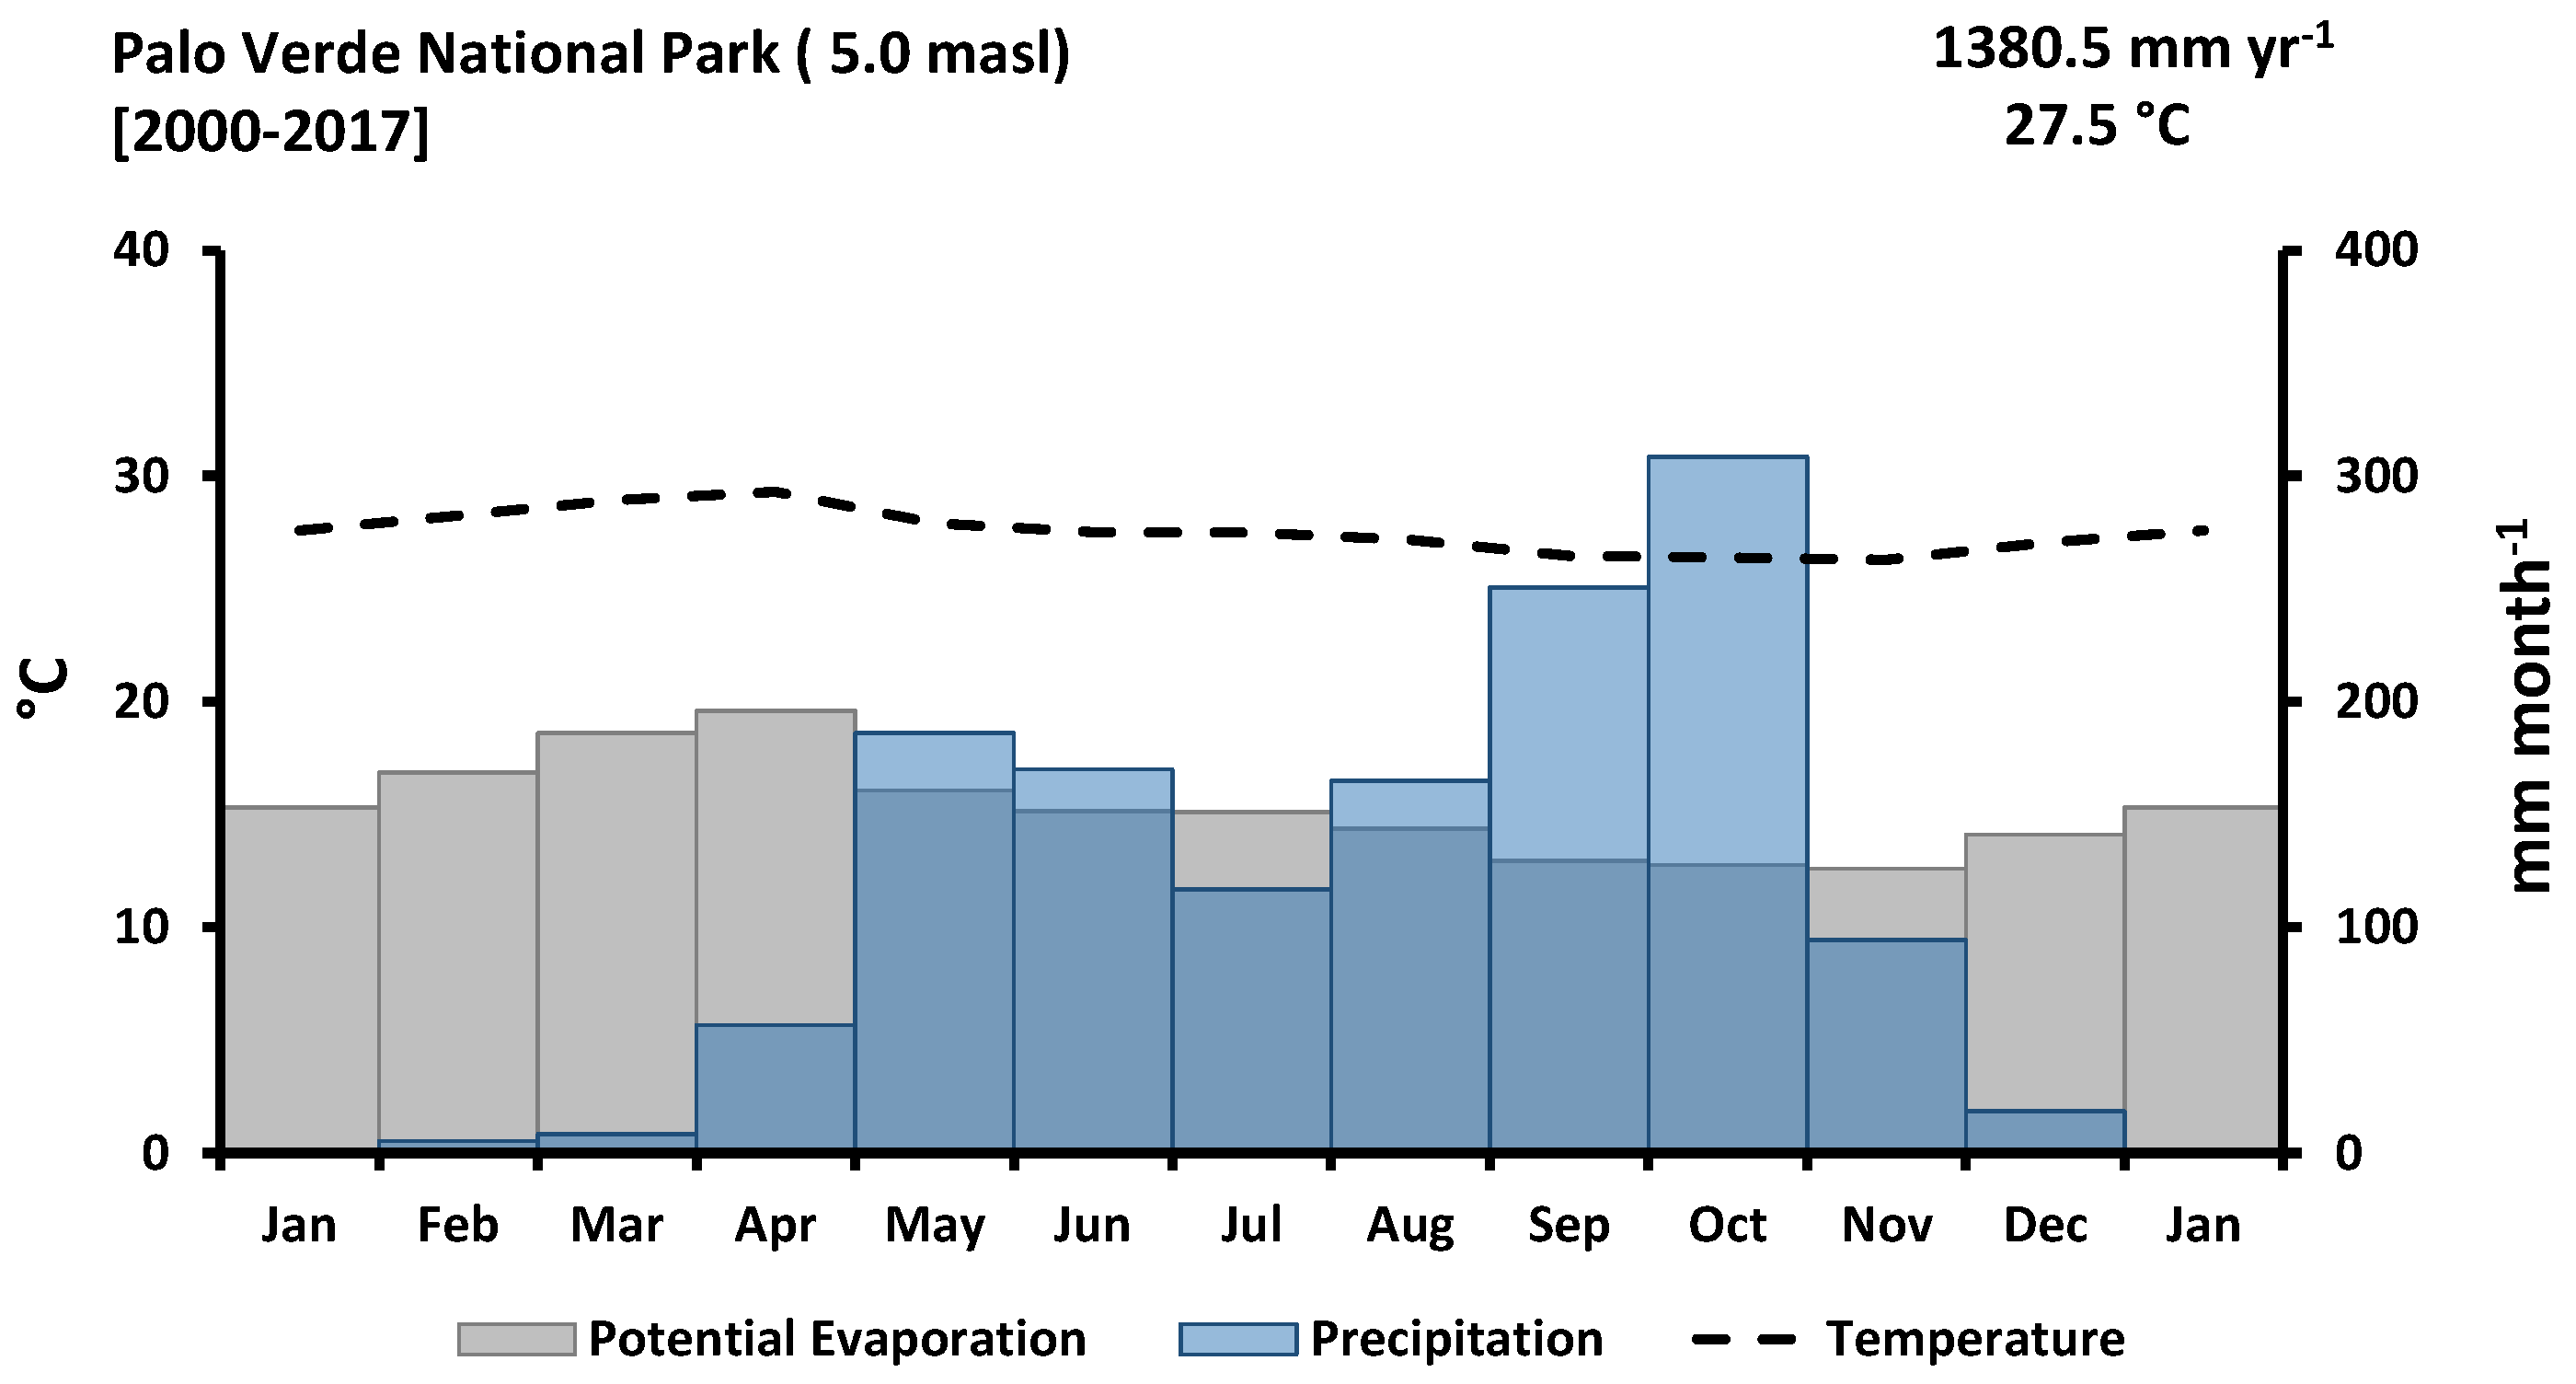
2.1. Study Site
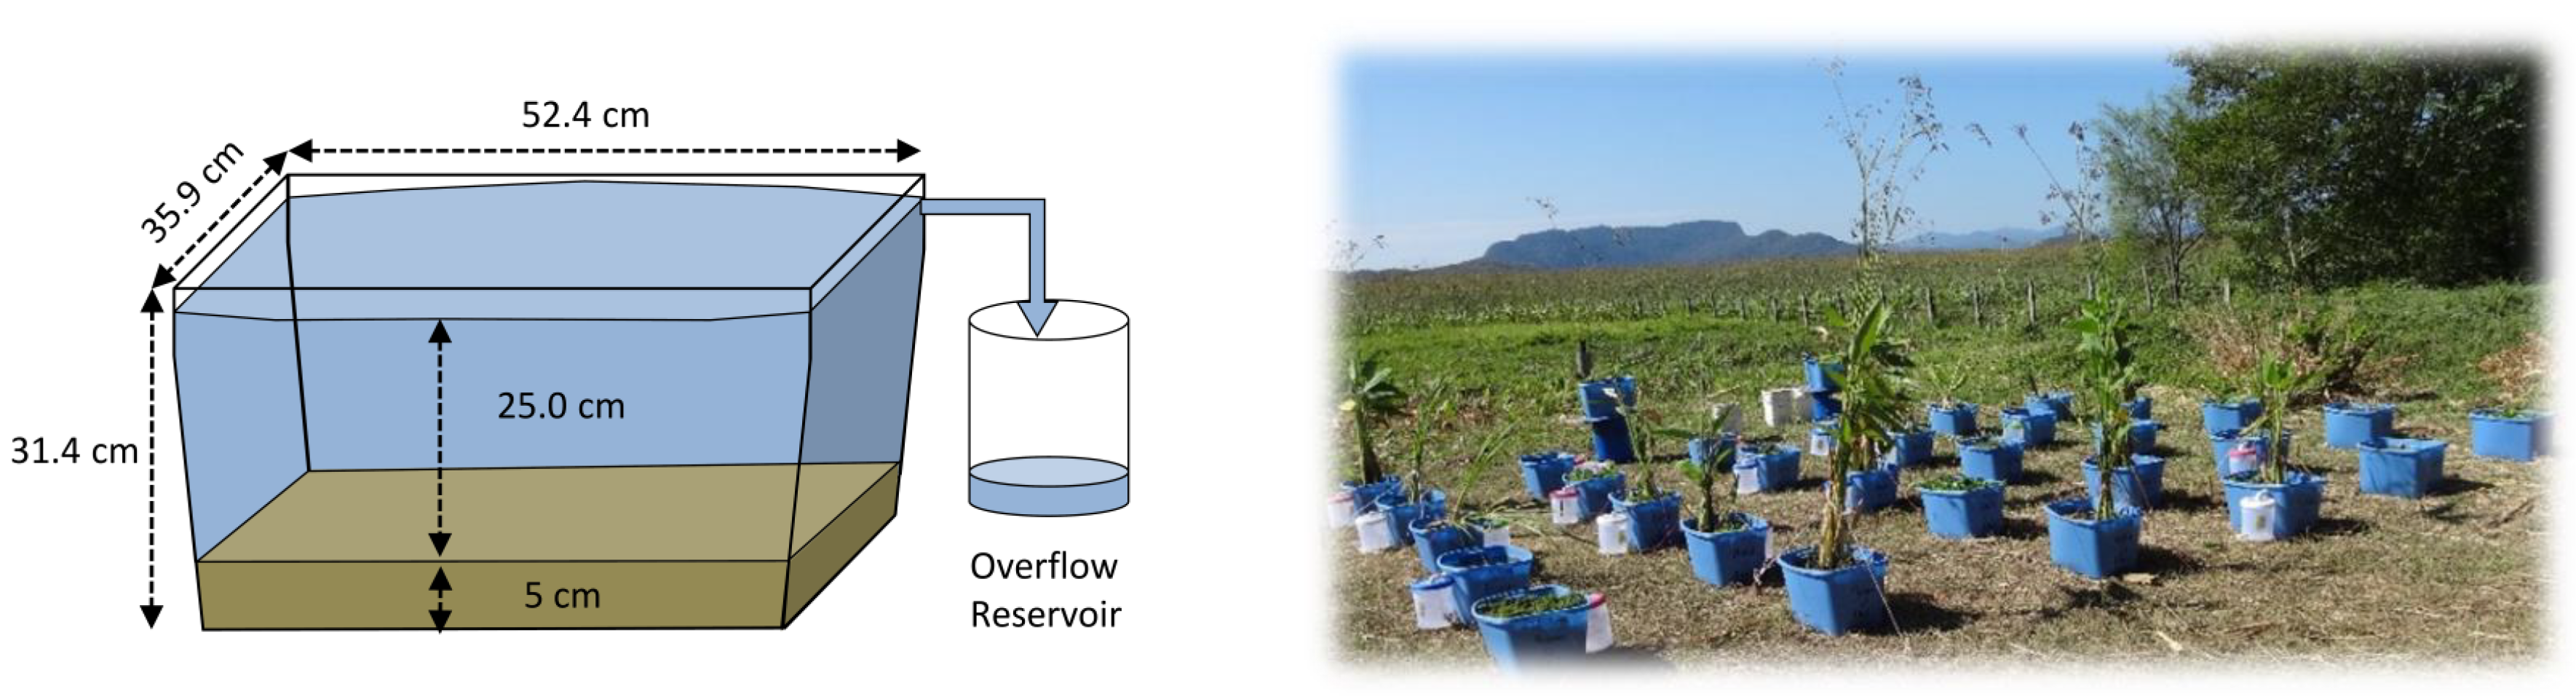
2.2. Experimental Design
2.3. Measurement and Estimation of Evaporation Rates
2.4. Data Analysis
3. Results
4. Discussion
5. Conclusions
Author Contributions
Funding
Acknowledgments
Conflicts of Interest
Appendix A


References
- Aselmann, I.; Crutzen, P.J. Global distribution of natural freshwater wetlands and rice paddies, their net primary productivity, seasonality and possible methane emissions. J. Atmos. Chem. 1989, 8, 307–358. [Google Scholar] [CrossRef]
- Goodwin, E.J. Convention on Wetlands of International Importance, Especially as Waterfowl Habitat 1971 (Ramsar). In Elgar Encyclopedia of Environmental Law; Edward Elgar Publishing Limited: Cheltenham, UK, 2017. [Google Scholar]
- McCoy, M. The seasonal, freshwater marsh at Palo Verde National Park. Regional Wildlife Management Program, National University, Costa Rica. In Wetlands, Biodiversity and the Ramsar Convention; Hails, A., Ed.; RAMSAR Convention Bureau, Ministry of Environment and Forest: New Delhi, India, 1996; Volume 133, p. 137. [Google Scholar]
- Hails, A. Wetlands, Biodiversity and the Ramsar Convention: The Role of the Convention on Wetlands in the Conservation and Wise Use of Biodiversity; Ramsar Convention Bureau: Gland, Switzerland, 1997; Volume 153. [Google Scholar]
- Ellison, A. Wetlands of Central America. Wetl. Ecol. Manag. 2004, 12, 3–55. [Google Scholar] [CrossRef]
- UICN. Seguimiento de las Directrices de la Convención RAMSAR en la Planificación de los Humedales de Importancia Internacional en Centroamérica; UICN: San José, Costa Rica, 2002. [Google Scholar]
- Hernandez Esquivel, D.; Gomez Laurito, J. La Flora Acuática del Humedal de Palo Verde; Editorial de la Universidad Nacional: Heredia, Costa Rica, 1993; 131p, ISBN 1387716048. [Google Scholar]
- Taft, O.W.; Colwell, M.A.; Isola, C.R.; Safran, R.J. Waterbird responses to experimental drawdown: Implications for the multispecies management of wetland mosaics. J. Appl. Ecol. 2002, 39, 987–1001. [Google Scholar] [CrossRef]
- Trama, F.A. Manejo Activo y Restauración del Humedal Palo Verde: Cambios en las Coberturas de Vegetación y Respuesta de las aves Acuáticas. Master’s Thesis, Universidad Nacional de Costa Rica, Heredia, Costa Rica, 2005. [Google Scholar]
- Trama, F.A.; Rizo-Patrón, F.L.; Kumar, A.; González, E.; Somma, D.; McCoy C., M.B. Wetland Cover Types and Plant Community Changes in Response to Cattail-Control Activities in the Palo Verde Marsh, Costa Rica. Ecol. Restor. 2009, 27, 278–289. [Google Scholar] [CrossRef]
- Vaughan, C.; McCoy, M.; Fallas, J.; Barboza, G.; Wong, G.; Rau, J.; Chaves, H.; Carbonell, M. Plan de Manejo de Desarrollo Parque Nacional Palo Verde y Reserva Biológica Lomas Barbudal; Technical Report; Universidad Nacional: Heredia, Costa Rica, 1994. [Google Scholar]
- Bowden, W.B.; Glime, J.M.; Riis, T. Macrophytes and Bryophytes. In Methods in Stream Ecology, 3rd ed.; Hauer, F.R., Lamberti, G.A., Eds.; Academic Press: Boston, MA, USA, 2017; Chapter 13; Volume 1, pp. 243–271. [Google Scholar] [CrossRef]
- Sculthorpe, C.D. Biology of Aquatic Vascular Plants; Edward Arnold: London, UK, 1967. [Google Scholar]
- Crow, G.; Rivera, D. Aquatic vascular plants of Palo Verde National Park, Costa Rica. Uniciencia 1986, 3, 71–78. [Google Scholar]
- Crow, G. Plantas Acuáticas del Parque Nacional Palo Verde y el Valle del río Tempisque; INBio: Heredia, Costa Rica, 2002; p. 296. [Google Scholar]
- Lot, A.; Novelo, A. Iconografía y Estudio de Plantas Acuáticas de la Ciudad de México y sus Alrededores; Universidad Nacional Autónoma de México (UNAM): Mexico City, Mexico, 2004. [Google Scholar]
- Calvo Alvarado, J.C.; Arias, O. Restauración hidrológica del humedal Palo Verde. Ambientico 2004, 129, 7–8. [Google Scholar]
- Castillo, M.; Guzman, J. Cambios en la cobertura vegetal en el humedal Palo Verde segun SIG. Ambientico 2004, 129, 4–6. [Google Scholar]
- Horn, S.; Kennedy, L. Pollen evidence of the prehistoric presence of cattail (Typha: Typhaceae) in Palo Verde National Park, Costa Rica. Brenesia 2006, 66, 85–87. [Google Scholar]
- Gallaher, C.; Stiles, C. Using soils to understand ecosystem change in wetlands in Palo Verde National Park, Costa Rica. In Proceedings of the Geologic Society of America Annual Meeting, Seattle, WA, USA, 2–5 November 2003. [Google Scholar]
- Kirksey, E. Living with Parasites in Palo Verde National Park. Environ. Humanit. 2012, 1, 23–55. [Google Scholar] [CrossRef]
- Guzmán Alvarez, J. Effect of Land Cover Changes on the Water Balance of the Palo Verde Wetland, Costa Rica. Master’s Thesis, International Institute for Geo-Information Science and Earth Observation, Enschede, The Netherlands, 2007. [Google Scholar]
- Bufford, J.L.; González, E. Manejo del humedal Palo Verde y de las comunidades de aves asociadas a sus diferentes hábitats. Rev. Cienc. Ambient. 2012, 43, 5–16. [Google Scholar] [CrossRef]
- Nahlik, A.M.; Mitsch, W.J. Methane emissions from tropical freshwater wetlands located in different climatic zones of Costa Rica. Glob. Chang. Biol. 2010, 17, 1321–1334. [Google Scholar] [CrossRef]
- Davidson, T.A.; Mackay, A.W.; Wolski, P.; Mazebedi, R.; Murray-Hudson, M.; Todd, M. Seasonal and spatial hydrological variability drives aquatic biodiversity in a flood-pulsed, sub-tropical wetland. Freshw. Biol. 2012, 57, 1253–1265. [Google Scholar] [CrossRef] [Green Version]
- Mitsch, W.J.; Nahlik, A.; Wolski, P.; Bernal, B.; Zhang, L.; Ramberg, L. Tropical wetlands: Seasonal hydrologic pulsing, carbon sequestration, and methane emissions. Wetl. Ecol. Manag. 2010, 18, 573–586. [Google Scholar] [CrossRef]
- Mao, L.M.; Bergman, M.J.; Tai, C.C. Evapotranspiration measurement and estimation of three wetland environments in the the upper St. Johns river basin, Florida. JAWRA J. Am. Water Resourc. Assoc. 2002, 38, 1271–1285. [Google Scholar] [CrossRef]
- Abtew, W.; Melesse, A. Wetland Evapotranspiration. In Evaporation and Evapotranspiration: Measurements and Estimations; Springer: Dordrecht, The Netherlands, 2013; pp. 93–108. [Google Scholar] [CrossRef]
- Savenije, H.H.G. The importance of interception and why we should delete the term evapotranspiration from our vocabulary. Hydrol. Process. 2004, 18, 1507–1511. [Google Scholar] [CrossRef]
- Anda, A.; Simon, B.; Soos, G.; da Silva, J.T.; Kucserka, T. Effect of submerged, freshwater aquatic macrophytes and littoral sediments on pan evaporation in the Lake Balaton region, Hungary. J. Hydrol. 2016, 542, 615–626. [Google Scholar] [CrossRef]
- Goulden, M.L.; Litvak, M.; Miller, S.D. Factors that control Typha marsh evapotranspiration. Aquat. Bot. 2007, 86, 97–106. [Google Scholar] [CrossRef] [Green Version]
- Medrano Gil, H.; Bota Salort, J.; Cifre Llompart, J.; Flexas Sans, J.; Ribas Carbó, M.; Gulías León, J. Eficiencia en el uso del agua por las plantas. Investig. Geogr. 2007, 63–84. [Google Scholar] [CrossRef]
- Pauliukonis, N.; Schneider, R. Temporal patterns in evapotranspiration from lysimeters with three common wetland plant species in the eastern United States. Aquat. Bot. 2001, 71, 35–46. [Google Scholar] [CrossRef]
- Snyder, R.; Boyd, C. Evapotranspiration by Eichhornia crassipes (Mart.) Solms and Typha latifolia L. Aquat. Bot. 1987, 27, 217–227. [Google Scholar] [CrossRef]
- Arp, R.; Fraser, G.; Hill, M. Quantifying the economic water savings benefit of water hyacinth (Eichhornia crassipes) control in the Vaalharts Irrigation Scheme. Water SA 2017, 43, 58–66. [Google Scholar] [CrossRef]
- Martin, J.; Hofherr, E.; Quigley, M.F. Effects of Typha latifolia transpiration and harvesting on nitrate concentrations in surface water of wetland microcosms. Wetlands 2003, 23, 835–844. [Google Scholar] [CrossRef]
- Weert, R.V.D.; Kamerling, G. Evapotranspiration of water hyacinth (Eichhornia crassipes). J. Hydrol. 1974, 22, 201–212. [Google Scholar] [CrossRef]
- Ali, Y.M.; Khedr, I.S.E.D. Estimation of water losses through evapotranspiration of aquatic weeds in the Nile River (Case study: Rosetta Branch). Water Sci. 2018, 32, 259–275. [Google Scholar] [CrossRef]
- Keller, R.P.; Masoodi, A.; Shackleton, R.T. The impact of invasive aquatic plants on ecosystem services and human well-being in Wular Lake, India. Reg. Environ. Chang. 2018, 18, 847–857. [Google Scholar] [CrossRef]
- Kriticos, D.J.; Brunel, S. Assessing and Managing the Current and Future Pest Risk from Water Hyacinth, (Eichhornia crassipes), an Invasive Aquatic Plant Threatening the Environment and Water Security. PLoS ONE 2016, 11, e0120054. [Google Scholar] [CrossRef] [PubMed]
- Al-Isawi, R.; Ray, S.; Scholz, M. Comparative study of domestic wastewater treatment by mature vertical-flow constructed wetlands and artificial ponds. Ecol. Eng. 2017, 100, 8–18. [Google Scholar] [CrossRef]
- Silvestrini, N.E.C.; Hadad, H.R.; Maine, M.A.; Sánchez, G.C.; del Carmen Pedro, M.; Caffaratti, S.E. Vertical flow wetlands and hybrid systems for the treatment of landfill leachate. Environ. Sci. Pollut. Res. 2019. [Google Scholar] [CrossRef]
- Viana, D.G.; Pires, F.R.; Filho, F.B.E.; Bonomo, R.; Martins, L.F.; Costa, K.A.; Ferreira, A.D.; Madalão, J.C.; da Rocha Junior, P.R.; Nascimento, M.C.P.; et al. Cutting frequency effect on barium phytoextraction by macrophytes in flooded environment: A field trial. J. Hazard. Mater. 2019, 362, 124–131. [Google Scholar] [CrossRef]
- Tuñón, J.; Morell, I.; Ferriols, N. Observaciones prácticas sobre el cálculo del balance de agua en el suelo. In Estudios de la Zona No Saturada del Suelo; Muñoz-Carpena, R., Ritter, A., Tascón, C., Eds.; ICIA: Tenerife, Spain, 1999; pp. 45–51. [Google Scholar]
- Rannik, Ü.; Sogachev, A.; Foken, T.; Göckede, M.; Kljun, N.; Leclerc, M.Y.; Vesala, T. Footprint Analysis. In Eddy Covariance: A Practical Guide to Measurement and Data Analysis; Aubinet, M., Vesala, T., Papale, D., Eds.; Springer: Dordrecht, The Netherlands, 2012; pp. 211–261. [Google Scholar] [CrossRef]
- Hess, A.; Wadzuk, B.; Welker, A. Evapotranspiration in Rain Gardens Using Weighing Lysimeters. J. Irrig. Drain. Eng. 2017, 143, 04017004. [Google Scholar] [CrossRef]
- Hartshorn, G. Plants. In Costa Rican Natural History; Janzen, D., Ed.; University of Chicago Press: Chicago, IL, USA, 1983; pp. 118–157. [Google Scholar]
- Holdridge, L.R. Life Zone Ecology; Tropical Science Center: San Jose, Costa Rica, 1967; p. 206. [Google Scholar]
- Ortiz-Malavassi, E. Atlas Digital de Costa Rica 2014; Tecnológico de Costa Rica: Cartago, Costa Rica, 2014. [Google Scholar]
- Soil Survey Staff. Keys to Soil Taxonomy, 11th ed.; USDA: Washington, DC, USA, 2014.
- Badilla, S. Desastres Naturales Provocados por Inundaciones: El caso de una Sección Inferior del Río Tempisque. Bachelor’s Thesis, Escuela de Ciencias Geográficas, Universidad Nacional de Costa Rica, Heredia, Costa Rica, 1988. [Google Scholar]
- Huggett, R. Fundamentals of Geomorphology, 2nd ed.; Routledge: New York, NY, USA, 2007. [Google Scholar] [CrossRef]
- Summerfield, M. Global Geomorphology; Routledge: New York, NY, USA, 1991. [Google Scholar]
- Wiersema, J.H.; León, B. World Economic Plants: A Standard Reference; CRC Press: London, UK, 2013. [Google Scholar] [CrossRef]
- Subba-Rao, N.S.; Mateos, P.F.; Baker, D.; Stuart Pankratz, H.; Palma, J.; Dazzo, F.B.; Sprent, J.I. The unique root-nodule symbiosis between Rhizobium and the aquatic legume, Neptunia natans (L.f.) Druce. Planta 1995, 196, 311–320. [Google Scholar] [CrossRef]
- Rivas, R.; Velázquez, E.; Willems, A.; Vizcaíno, N.; Subba-Rao, N.S.; Mateos, P.F.; Gillis, M.; Dazzo, F.B.; Martínez-Molina, E. A New Species of Devosia That Forms a Unique Nitrogen-Fixing Root-Nodule Symbiosis with the Aquatic Legume Neptunia natans (L.f.) Druce. Appl. Environ. Microbiol. 2002, 68, 5217–5222. [Google Scholar] [CrossRef] [PubMed]
- Mishra, S.; Maiti, A. The efficiency of Eichhornia crassipes in the removal of organic and inorganic pollutants from wastewater: A review. Environ. Sci. Pollut. Res. 2017, 24, 7921–7937. [Google Scholar] [CrossRef]
- Zimmels, Y.; Kirzhner, F.; Malkovskaja, A. Application of Eichhornia crassipes and Pistia stratiotes for treatment of urban sewage in Israel. J. Environ. Manag. 2006, 81, 420–428. [Google Scholar] [CrossRef]
- Nigam, J. Bioconversion of water-hyacinth (Eichhornia crassipes) hemicellulose acid hydrolysate to motor fuel ethanol by xylos–fermenting yeast. J. Biotechnol. 2002, 97, 107–116. [Google Scholar] [CrossRef]
- Shanab, S.M.M.; Shalaby, E.A.; Lightfoot, D.A.; El-Shemy, H.A. Allelopathic Effects of Water Hyacinth [Eichhornia crassipes]. PLoS ONE 2010, 5, e13200. [Google Scholar] [CrossRef] [PubMed]
- Sambasiva Rao, A. Evapotranspiration rates of Eichhornia crassipes (Mart.) Solms, Salvinia molesta d.s. Mitchell and Nymphaea lotus (L.) Willd. Linn. in a humid tropical climate. Aquat. Bot. 1988, 30, 215–222. [Google Scholar] [CrossRef]
- Haider, S. Recent work in Bangladesh on the utilization of water hyacinth. In CSC Technical Paper; Number 278; CSC: Dhaka, Bangladesh, 1989. [Google Scholar]
- Davis, M.A. The Role of Flower Visitors in the Explosive Pollination of Thalia geniculata (Marantaceae), a Costa Rican Marsh Plant. Bull. Torrey Bot. Club 1987, 114, 134–138. [Google Scholar] [CrossRef]
- Abtew, W. Evapotranspiraiton measurements and modeling for three wetland systems in South Florida. JAWRA J. Am. Water Resourc. Assoc. 1996, 32, 465–473. [Google Scholar] [CrossRef]
- Abtew, W. Evapotranspiration in the Everglades: Comparison of Bowen Ratio measurements and model estimations. In Proceedings of the 2005 ASAE Annual Meeting. American Society of Agricultural and Biological Engineers, Tampa, FL, USA, 17–20 July 2005; p. 1. [Google Scholar] [CrossRef]
- Wu, C.L.; Shukla, S. Eddy covariance-based evapotranspiration for a subtropical wetland. Hydrol. Process. 2014, 28, 5879–5896. [Google Scholar] [CrossRef]
- Glenn, E.; Thompson, T.; Frye, R.; Riley, J.; Baumgartner, D. Effects of salinity on growth and evapotranspiration of Typha domingensis Pers. Aquat. Bot. 1995, 52, 75–91. [Google Scholar] [CrossRef]
- Eichelmann, E.; Hemes, K.S.; Knox, S.H.; Oikawa, P.Y.; Chamberlain, S.D.; Sturtevant, C.; Verfaillie, J.; Baldocchi, D.D. The effect of land cover type and structure on evapotranspiration from agricultural and wetland sites in the Sacramento—San Joaquin River Delta, California. Agric. For. Meteorol. 2018, 256–257, 179–195. [Google Scholar] [CrossRef]
- Moors, E. Evaporation. In Climate and the Hydrological Cycle; Bierkens, M., Dolman, H., Troch, P., Eds.; IAHS Press: London, UK, 2008; pp. 23–41. [Google Scholar]
- Allen, R.G.; Pereira, L.S.; Raes, D.; Smith, M. Crop evapotranspiration-Guidelines for computing crop water requirements-FAO Irrigation and drainage paper 56. Fao Rome 1998, 300, D05109. [Google Scholar]
- Lakes Environmental Software. WRPLOT View—Air Dispersion Modelling; Lakes Environmental Software: Waterloo, ON, Canada, 2018. [Google Scholar]
- R Core Team. R: A Language and Environment for Statistical Computing; R Foundation for Statistical Computing: Vienna, Austria, 2017. [Google Scholar]
- German, E.R. Regional Evaluation of Evapotranspiration in the Everglades; US Department of the Interior, US Geological Survey: Altamonte Springs, FL, USA, 2000.
- Headley, T.; Davison, L.; Huett, D.; Müller, R. Evapotranspiration from subsurface horizontal flow wetlands planted with Phragmites australis in sub-tropical Australia. Water Res. 2012, 46, 345–354. [Google Scholar] [CrossRef]
- Zhang, J.; Zhang, S.; Zhang, W.; Liu, B.; Gong, C.; Jiang, M.; Lv, X.; Sheng, L. Partitioning daily evapotranspiration from a marsh wetland using stable isotopes in a semiarid region. Hydrol. Res. 2017, 49, 1005–1015. [Google Scholar] [CrossRef]
- Koch, M.S.; Rawlik, P.S. Transpiration and stomatal conductance of two wetland macrophytes (Cladium jamaicense and Typha domingensis) in the subtropical Everglades. Am. J. Bot. 1993, 80, 1146–1154. [Google Scholar] [CrossRef]
- Moreno-Casasola, P.; Mata, D.I.; Vigil, G.S. Veracruz, Tierra de Ciénagas y Pantanos; Gobierno del Estado Veracruz: Veracruz, Mexico, 2010.
- Jones, M. Photosynthetic Responses of C3 and C4 Wetland Species in a Tropical Swamp. J. Ecol. 1988, 76, 253–262. [Google Scholar] [CrossRef]
- Calvo Alvarado, J.C.; Arias, O. Estudio de Evapotraspiración de la Tifa (Typha domingensis) en el Parque Nacional Palo Verde, Guanacaste–Costa Rica Escuela de Ingeniería Forestal; Programa de Manejo Integrado de Recursos Naturales, Tecnológico de Costa Rica: Cartago, Costa Rica, 2006; pp. 1–15. [Google Scholar]
- Ayars, J.; Phene, C.; Hutmacher, R.; Davis, K.; Schoneman, R.; Vail, S.; Mead, R. Subsurface drip irrigation of row crops: A review of 15 years of research at the Water Management Research Laboratory. Agric. Water Manag. 1999, 42, 1–27. [Google Scholar] [CrossRef]
- Jensen, M.E.; Allen, R.G. Evaporation, Evapotranspiration, and Irrigation Water Requirements, 2nd ed.; American Society of Civil Engineers: Reston, VA, USA, 2016. [Google Scholar] [CrossRef]
- Bachand, P.; Bachand, S.; Fleck, J.; Anderson, F.; Windham-Myers, L. Differentiating transpiration from evaporation in seasonal agricultural wetlands and the link to advective fluxes in the root zone. Sci. Total Environ. 2014, 484, 232–248. [Google Scholar] [CrossRef] [PubMed]


| Wetland Cover | Foliar | Evaporation | Crop | |
|---|---|---|---|---|
| Area (cm2) | Daily Averages (mm d) | Accumulated (mm) | Coefficient (-) | |
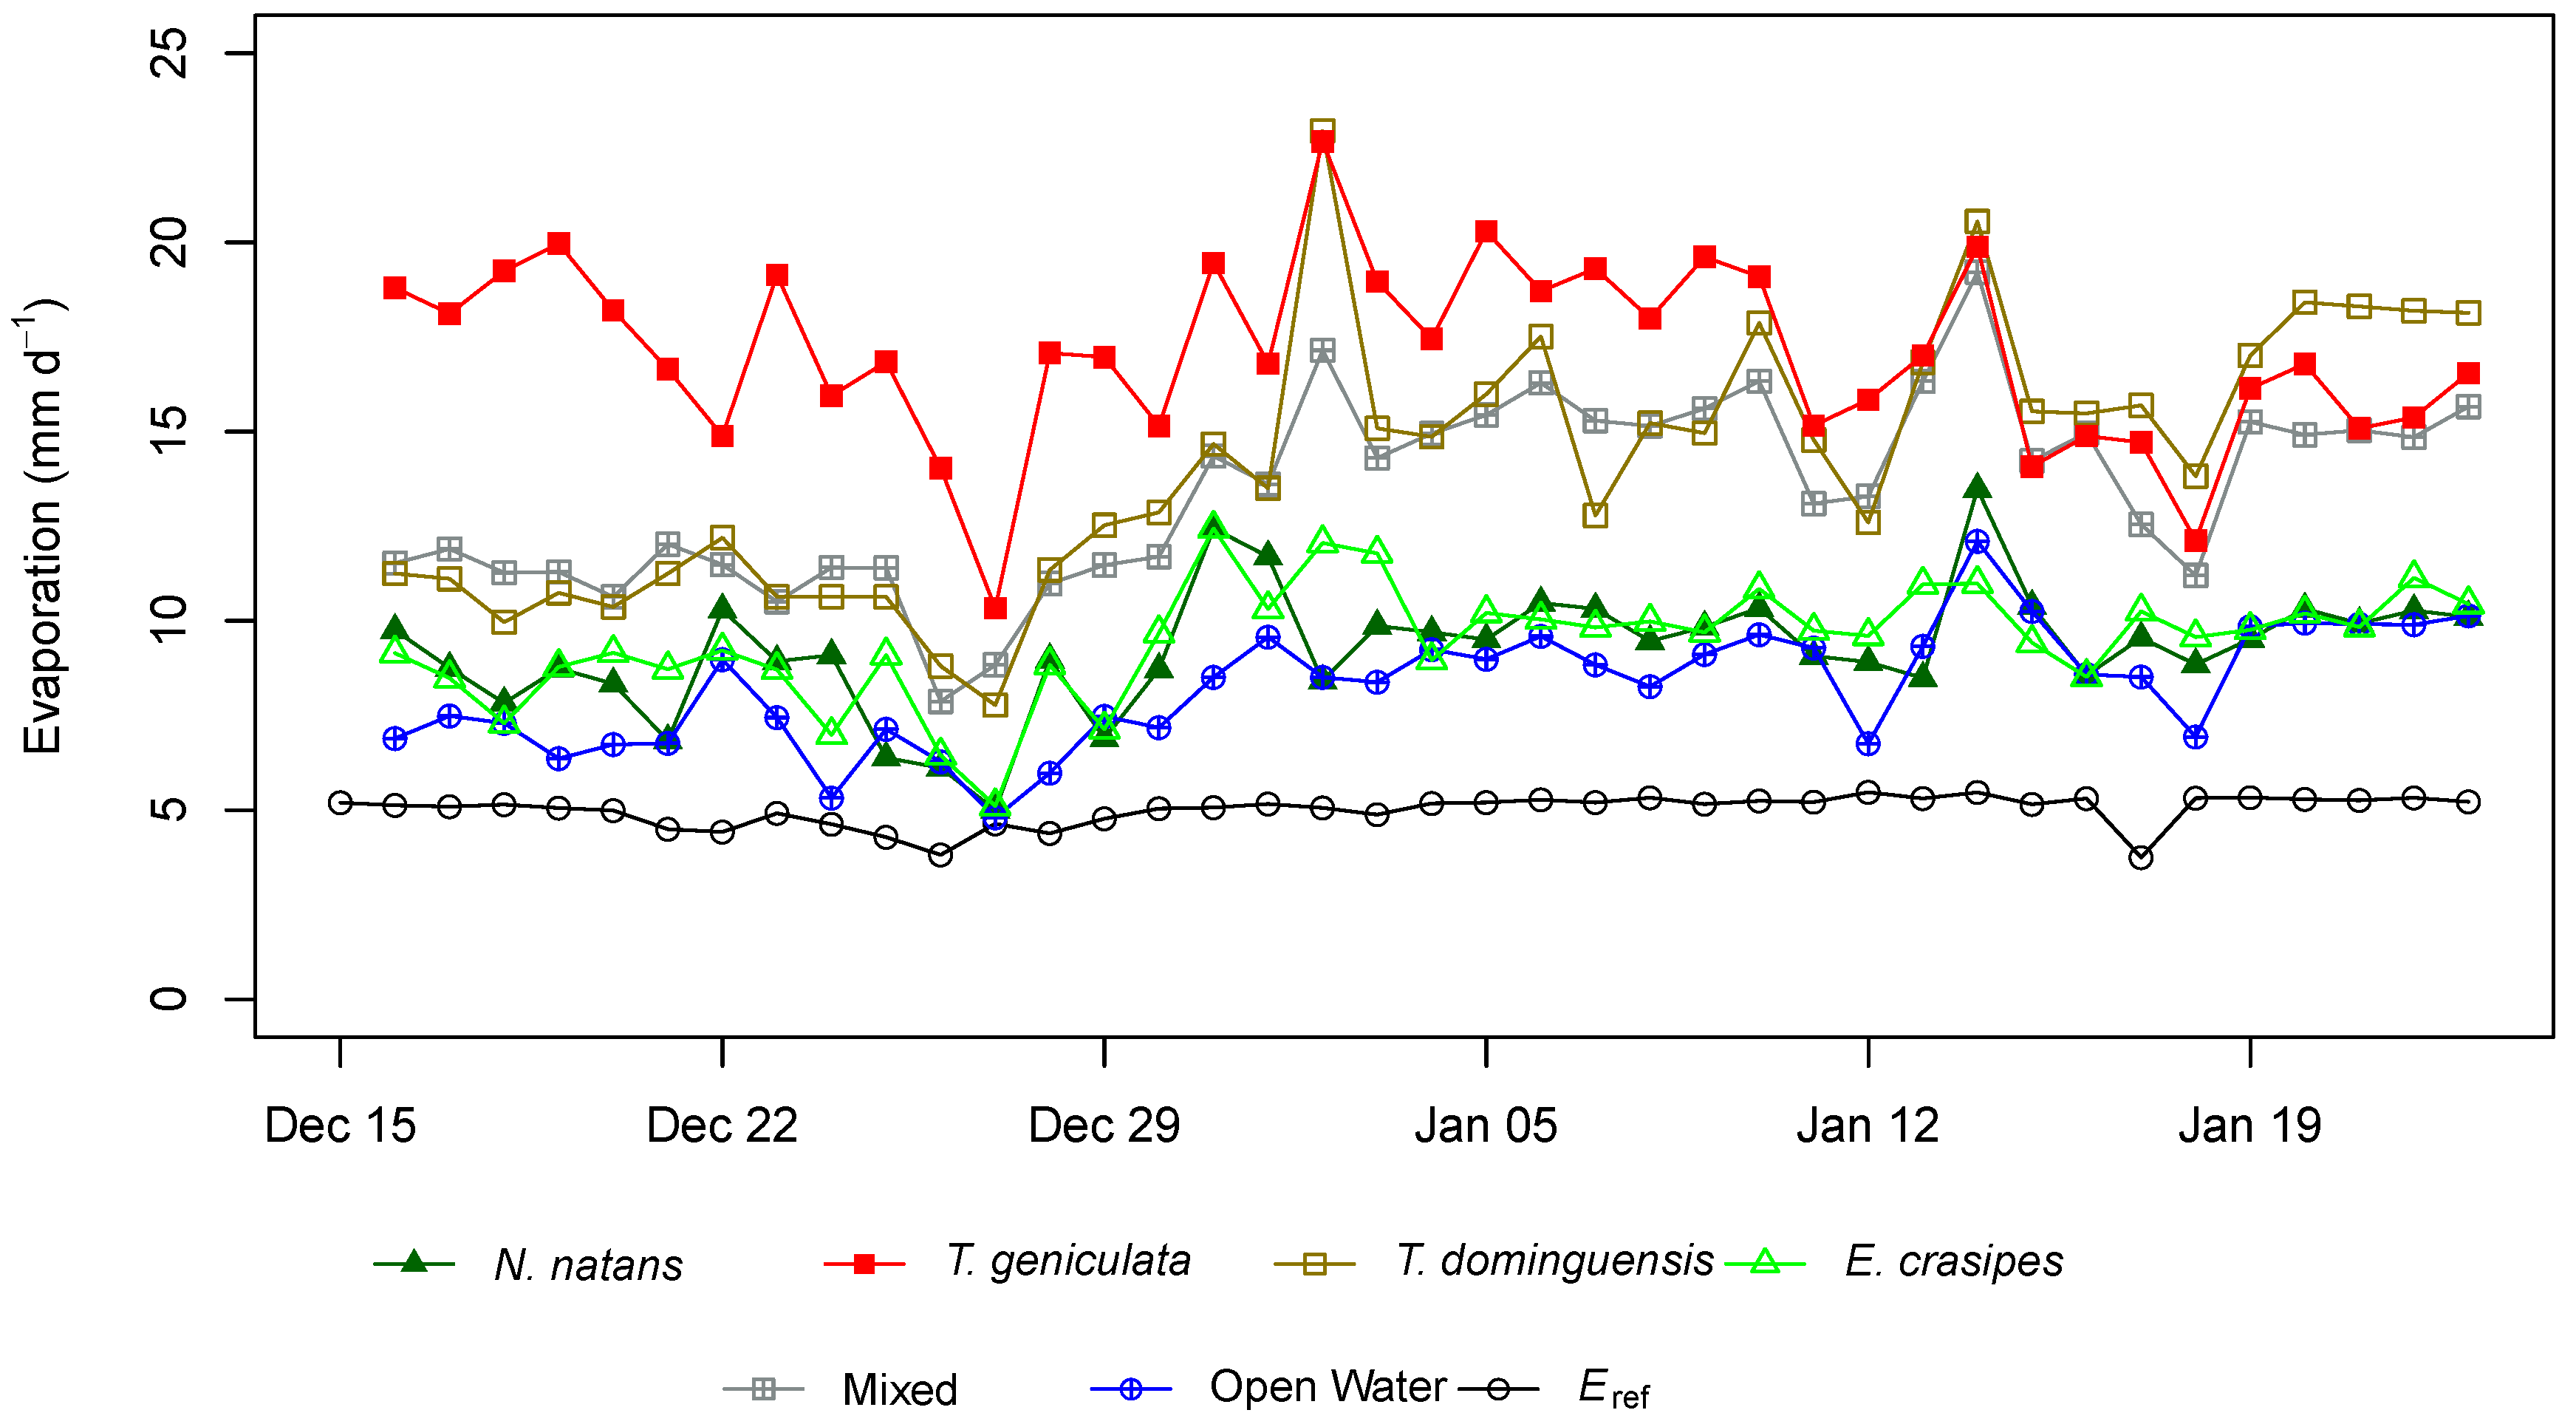
| Reference Evaporation | N.A. | 5.0 | 200.0 | 1.0 |
| Open Water | 0 | 8.2 | 329.2 | 1.65 |
| N. natans | 11.8 | 9.3 | 369.8 | 1.85 |
| E. crasipes | 61.1 | 9.5 | 379.6 | 1.90 |
| Mixed | 70.4 | 13.5 | 537.8 | 2.68 |
| T. dominguensis | 55.6 | 14.3 | 570.6 | 2.83 |
| T. geniculata | 152.9 | 17.0 | 681.0 | 3.43 |
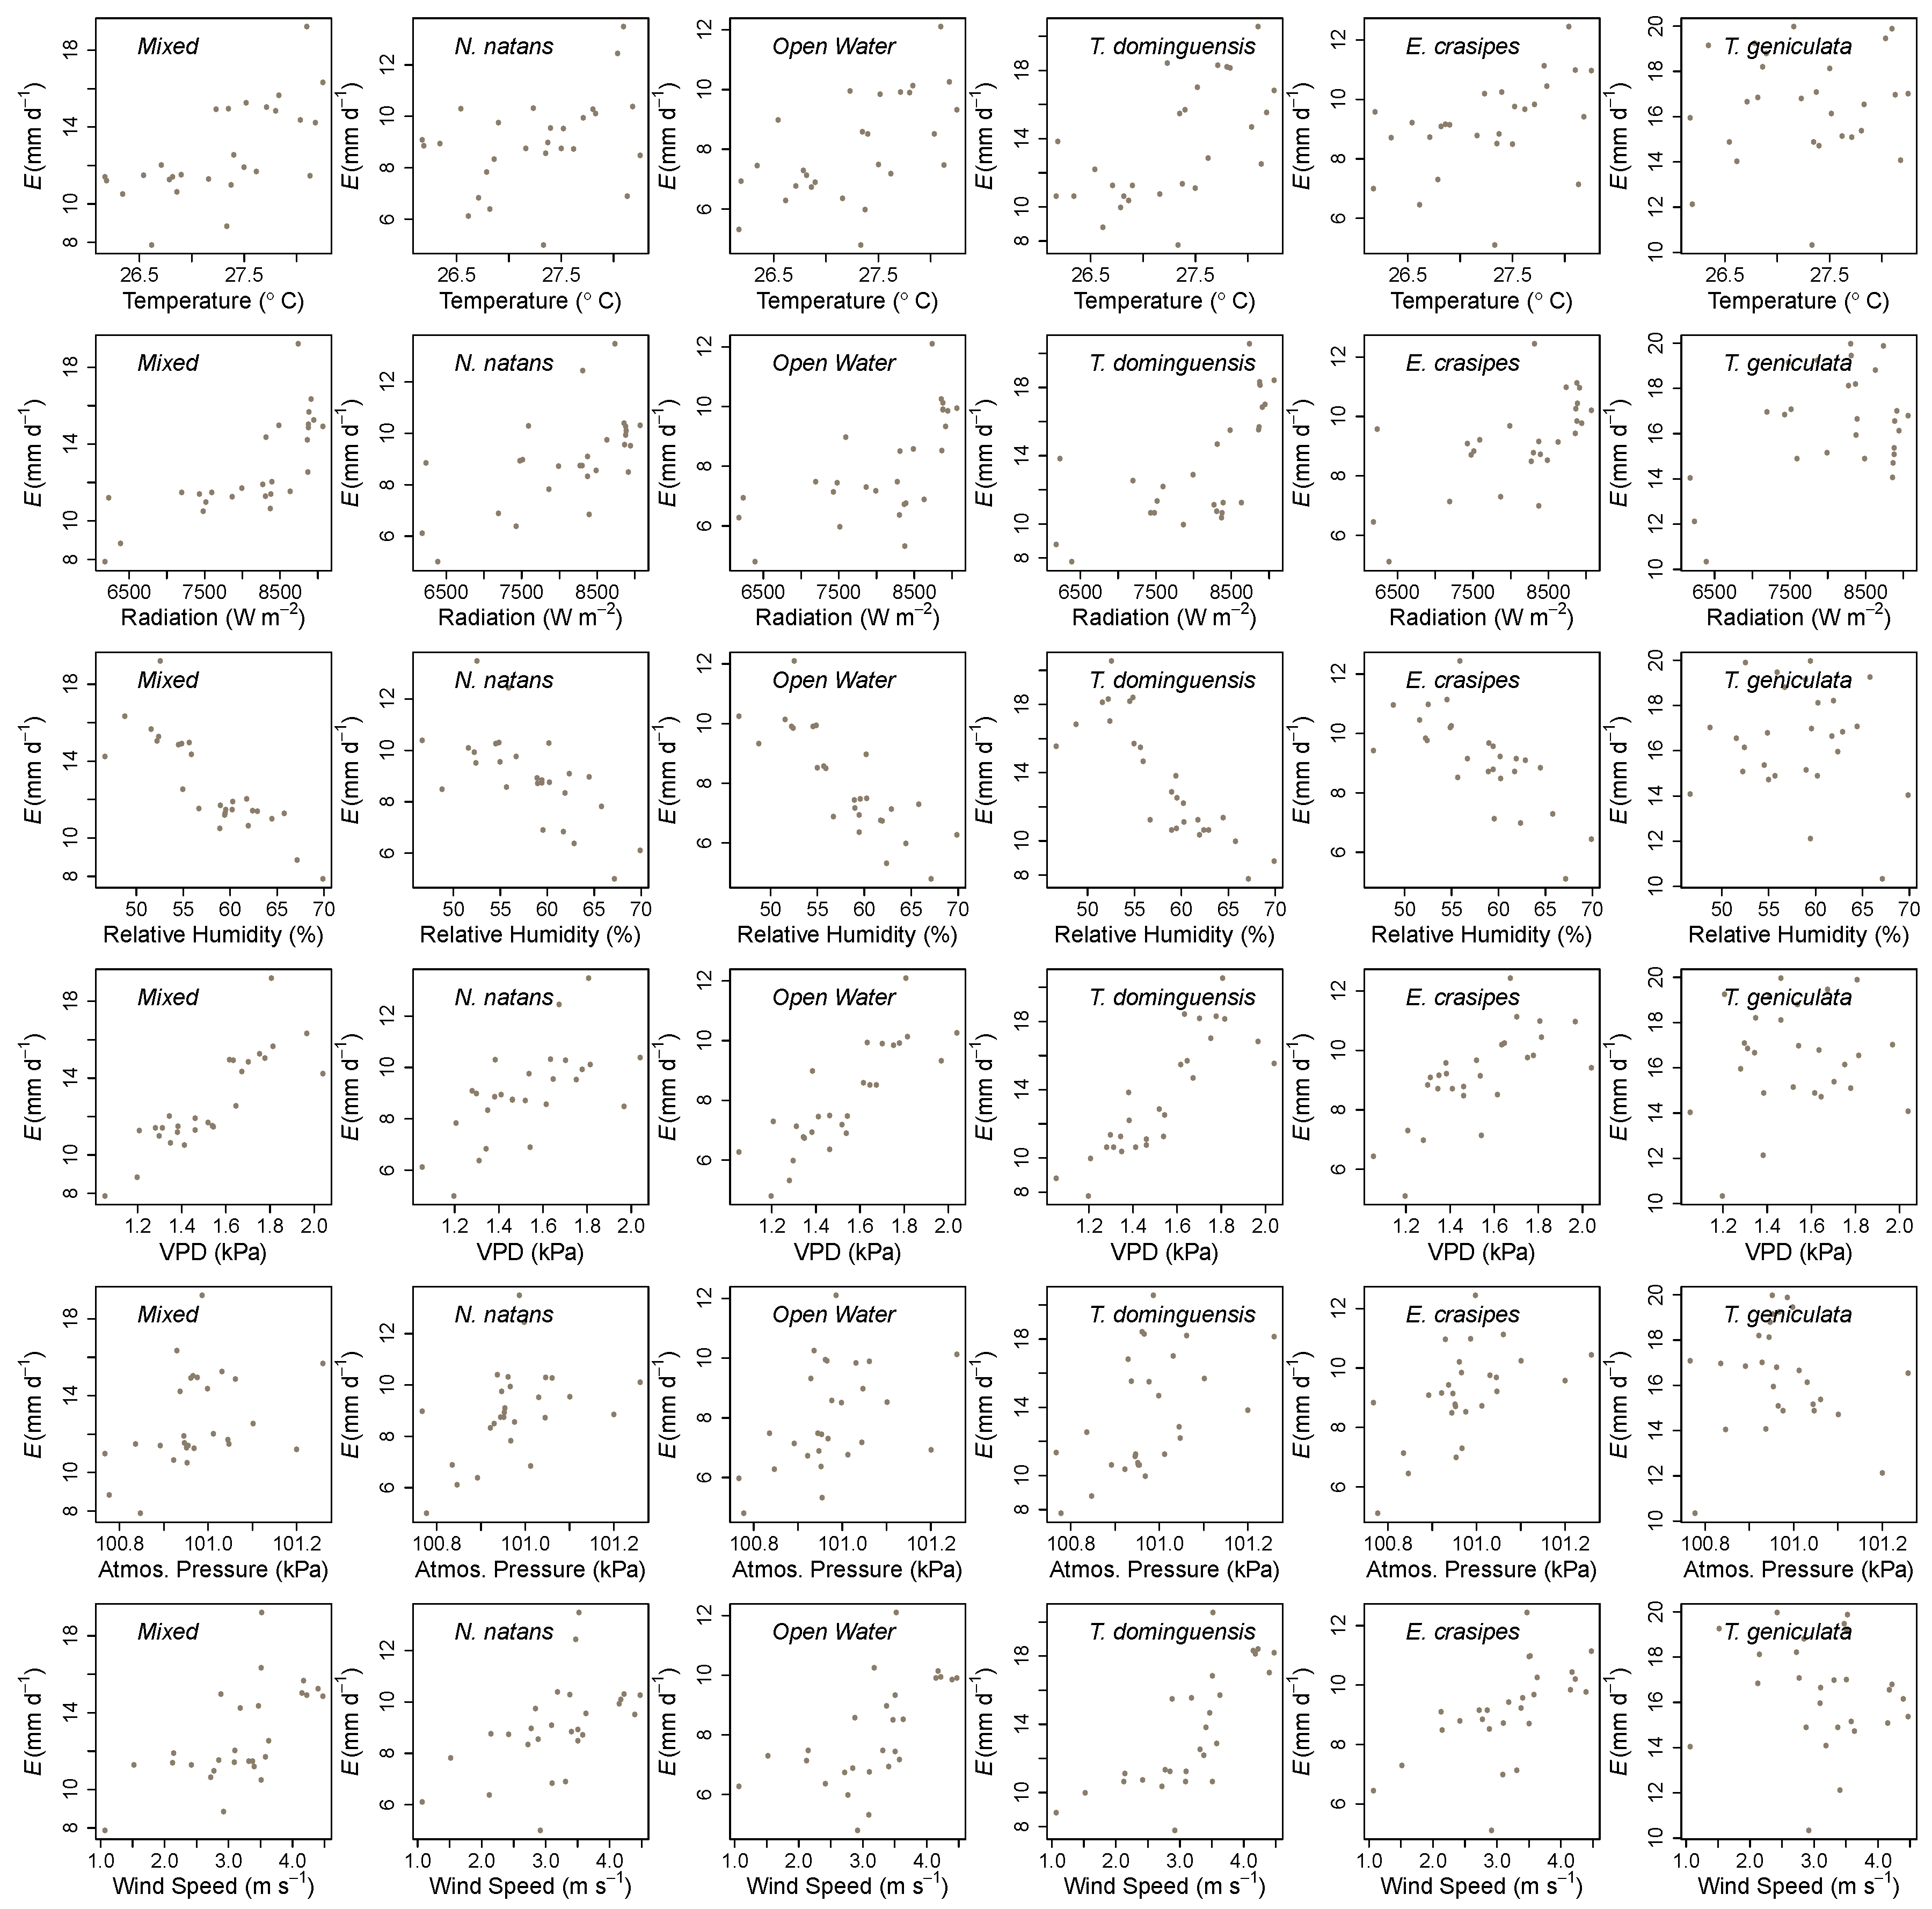
| Wetland Cover | Air Temperature | Solar Radiation | Relative Humidity | Wind Speed | Atmospheric Pressure | Vapor Pressure Deficit |
|---|---|---|---|---|---|---|
| Open Water | 0.53 *** | 0.61 *** | −0.75 *** | 0.58 *** | 0.44 * | 0.77 *** |
| N. natans | 0.38 * | 0.60 *** | −0.63 *** | 0.54 *** | 0.45 * | 0.60 *** |
| E. crasipes | 0.50 *** | 0.62 *** | −0.70 *** | 0.59 *** | 0.55 ** | 0.68 *** |
| Mixed | 0.70 *** | 0.73 *** | −0.83 *** | 0.63 *** | 0.40 * | 0.85 *** |
| T. dominguensis | 0.56 *** | 0.62 *** | −0.77 *** | 0.65 *** | 0.50 ** | 0.75 *** |
| T. geniculata | 0.32 * | 0.41 ** | −0.21 | 0.02 | −0.06 | 0.27 |
© 2019 by the authors. Licensee MDPI, Basel, Switzerland. This article is an open access article distributed under the terms and conditions of the Creative Commons Attribution (CC BY) license (http://creativecommons.org/licenses/by/4.0/).
Share and Cite
Jiménez-Rodríguez, C.D.; Esquivel-Vargas, C.; Coenders-Gerrits, M.; Sasa-Marín, M. Quantification of the Evaporation Rates from Six Types of Wetland Cover in Palo Verde National Park, Costa Rica. Water 2019, 11, 674. https://doi.org/10.3390/w11040674
Jiménez-Rodríguez CD, Esquivel-Vargas C, Coenders-Gerrits M, Sasa-Marín M. Quantification of the Evaporation Rates from Six Types of Wetland Cover in Palo Verde National Park, Costa Rica. Water. 2019; 11(4):674. https://doi.org/10.3390/w11040674
Chicago/Turabian StyleJiménez-Rodríguez, César Dionisio, Catalina Esquivel-Vargas, Miriam Coenders-Gerrits, and Mahmood Sasa-Marín. 2019. "Quantification of the Evaporation Rates from Six Types of Wetland Cover in Palo Verde National Park, Costa Rica" Water 11, no. 4: 674. https://doi.org/10.3390/w11040674