An Improved Logistic Model Illustrating Microcystis aeruginosa Growth Under Different Turbulent Mixing Conditions

1
College of Environmental Science and Engineering, Tongji University, Shanghai 200092, China
2
School of Environment and Architecture, University of Shanghai for Science and Technology, Shanghai 200093, China
*
Author to whom correspondence should be addressed.
Water 2019, 11(4), 669; https://doi.org/10.3390/w11040669
Submission received: 24 January 2019
/
Revised: 16 March 2019
/
Accepted: 22 March 2019
/
Published: 31 March 2019
(This article belongs to the Special Issue Advancing Knowledge on Cyanobacterial Blooms in Freshwaters)
Abstract
:To overcome the limitations of the normal logistic equation, we aimed to improve the logistic model under hydrodynamic conditions for the examination of the responses of cyanobacterium, coupled turbulence mixing, and growth of cyanobacterium in population dynamics models. Selecting Microcystis aeruginosa and experimenting with the ideal conditions in a laboratory beaker, the chlorophyll-a concentration reached the corresponding maximum under each turbulent condition compared with the control. According to the experiment results, the theory of mass transfer, turbulence mixing, and the logistic equation are organically combined. The improved logistic growth model of Microcystis aeruginosa and competition growth model in the symbiont Scenedesmus quadricauda under turbulent conditions were established. Using the MATLAB multi-parameter surface fitting device, both models produced good fitting effects, with R > 0.95, proving that the results fit the models, and demonstrating the relationship of the unity of nutrient transfer and algae growth affected by turbulence mixing. With continuous increases in turbulent mixing, the fitted curve became smoother and steadier. Algae stimulated by turbulence accelerate reproduction and fission to achieve population dominance. The improved logistic model quantitatively explains the Microcystis aeruginosa response to turbulence and provides a basis to represent ecological and biogeochemical processes in enclosed eutrophic water bodies.
1. Introduction
In hypertrophic freshwater lakes, turbulent mixing is increasingly thought to be a key factor in the growth, blooms, and composition of the cyanobacterium Microcystis aeruginosa [1,2,3,4]. Turbulent mixing preventing nuisance blooms of cyanobacterium has been reported at the population and ecosystem levels in a few cases [5,6,7]. Bronnenmeier and Märkl [8] found that higher turbulence can result in algal cell wall breakage, and Regel et al. [9] found that turbulence has little effect on the algae under low turbulence intensity, whereas high shear turbulence can cause cell deformation or breakage, suggesting an inhibitory effect of higher turbulence intensities on algae growth. However, due to the complex interactions between algae physiology and behavior, nutrient dynamics, and the light environment, many studies failed to accurately characterize these inhibitory effects in nature [10,11]. To qualitatively describe algae dynamics and correlation with turbulent mixing, researchers have conducted series of laboratory tests or enclosed experiments to produce more controlled environments [12,13,14]. The velocity factor has been proposed as the factor for determining the algal growth rate [15]. However, the growth responses of cyanobacterium compared to the flow velocity and corresponding nutrient uptake obtained from laboratory experiments are often contradictory [11]. These conflicting results are not only due to many studies using qualitative analyses, but also due to the adopted flow velocity, which can only represent the average algal environment rather than the environment surrounding the cells.
Several studies have reported the algae physiological responses to small-scale fluid motion and corresponding nutrients uptake at the cellular level. Grobbelaar [16] found that increased turbulence, which increased exchange rates of nutrients and metabolites between algae cells and their growth medium, together with increased light/dark frequencies, increased productivity and photosynthetic efficiency. Arin et al. [17] suggested that small-scale turbulence may affect the community response differently when nutrient conditions vary. Increased turbulence is relatively important for phytoplankton when nutrients are plentiful, whereas in nutrient-poor conditions, the effect of turbulence is negligible. A possible mechanism could be that small-scale turbulence accelerates the flowing of ions toward the surface of the algae cells; hence, the nutrients can be absorbed by algae under eutrophic conditions. However, Iversen et al. [18] found that small-scale turbulence appeared to affect diatoms and primary production rates regardless of nutrient condition. In terms of nutrient uptake of algae cells, turbulence may have a hysteresis effect on algae cell growth [19]. A reduction in turbulence affects the thickness of the cell laminar boundary layer, which increases the ion flux to the cell with increasing turbulence intensity. Hondzo and Wuest [20] proposed a conceptual model describing how to integrate fluid motion in Monod-type kinetics, accounting for the effect of turbulence on microorganism growth and nutrients uptake. However, the responses of algae to turbulence flow are species-specific. These conclusions from red tide algae, green algae, and diatoms may not be useful in explaining the effect of turbulence on cyanobacterium, which have specific physical characteristics. Xiao et al. [21] found that both Microcystis flos-aquae and Anabaena flos-aquae adjust their growth rates in response to turbulence levels via the asynchronous cellular stoichiometry of C, N, and P, and especially the phosphorus strategy, to improve the nutrient use efficiency. However, the current understanding of the direct effects of small-scale turbulence on M. aeruginosa in eutrophic water bodies remains limited. Missaghi et al. [22] quantified the influence of fluid motion on the growth rate and vertical cell distribution of M. aeruginosa.
Shallow lakes are strongly influenced by wind-driven wave turbulence [23]. Microbial communities are strongly influenced by wind waves, often resulting in the formation and persistence of cyanobacterial blooms in the surface waters [24,25]. Nutrient supply is also regarded as a main factor influencing algal mass propagation during bloom periods [26]. Although a number of studies have investigated the impacts of turbulence and mixing on the growth of several cyanobacteria, to date, the direct physical effect on the production of microcystins is still unclear [27]. In a six-day mesocosm experiment in Lake Taihu that is situated in the Changjiang (Yangtze) delta, Zhou et al. [28] demonstrated that turbulence promoted the growth of Microcystis spp., especially toxic Microcystis spp., and increased the proportion of toxic Microcystis spp. In the short term (approx. three days). Zhang [29] conducted a series of laboratory experiments in which nutrients were assumed to be plentiful and light available was identical, and found that different turbulence intensities (7.40 × 10⁻³ m2s−3 < energy dissipation rate ε < 1.50 m2s−3) promoted the growth of Microcystis aeruginosa compared with the stationary condition, despite some differences in the degree of promotion. Turbulent mixing increases diffusion rate on cell surface and enhances uptake of nutrients [20,28]. The corresponding largest algae biomass was also found in each experiments, and the algae growth rate increased with decreased biological saturation as a result of the relationship between nutrition and space for population growth [29]. Although all the trends of the growth of Microcystis aeruginosa were in agreement with the logistic growth, existing logistic models cannot characterize the effects of the different types of bloom outbreaks under different turbulence conditions.
The aim of present study was to introduce turbulence mixing into the examination of the responses of Microcystis aeruginosa to coupled turbulence flow and the growth of Microcystis aeruginosa in the models of population dynamics. In this study, we found: (1) the hybrid hydraulics can increase the space capacity of algae growth, and (2) the increased rate of algal population is directly proportional to the space amount of population. On this basis, a beaker experiment with controlled variables was conducted to study the influence of hydrodynamics on algae growth. Light, temperature, and nutrient conditions were fixed and the average water mixing rate of the beaker hydrodynamics was used as the variable in the experiments. An improved logistic model of Microcystis aeruginosa and a competition growth model with the symbiont Scenedesmus quadricauda were established based on the experimental results, among which the data for the competition model were obtained from our research team member Zhang’s masters thesis [29].
2. Materials and Methods
2.1. Experimental Procedure
Microcystis aeruginosa (FACHB-905) and Scenedesmus quadricauda (FACHB-507) were purchased from the Institute of Hydrobiology, Chinese Academy of Sciences (Wuhan, China). The algae were cultivated in BG11 culture medium for 1 week until the logarithmic growth phase at 4000 lux light intensity and a constant temperature of 26 °C. Experimental medium and utensils were all sterilized at 121 °C for 30 min and then cooled to room temperature before use. Glassware used in the experiments was prepared by soaking in 0.1 M hydrochloric acid overnight and rinsed. The experiments were conducted in an artificial climate chamber at constant temperature and light conditions. The specific volume of the medium was added to a 2 L beaker and then the M. aeruginosa in the logarithmic growth phase were added to 1800 mL of supplemented media. The date of inoculation was recorded, and algae density and chlorophyll-a (Chl-a) concentrations were measured every day. Each experiment was repeated 3 times. The experiment period was 20 days.
2.2. Sample Analysis and Date Processing
Algae growth was quantified using the number of algae cells and Chl-a concentration. Algae cells were counted using a hem cytometer under an optical microscope (Olympus CX21, Olympus Corporation, Tokyo, Japan). The Chl-a concentration was determined by phytoplankton classification using PHYTO-PAM fluorescence analyzer (Walz, Effeltrich, Germany). When the Chl-a concentration in the sample was higher than 300 μg/L, fluorescence resorption from the chlorophyll molecule could interfere with the results. To avoid this effect, when the measured Chl-a content was higher than 300 μg/L, the sample was diluted and re-measured.
A magnetic stirrer created circulation flow in the water to form a closed turbulent environment. Turbulent intensity was controlled by adjusting the speed of the magnetic stirrer. The experiments included one control and three turbulent conditions with speeds of 100 rpm, 150 rpm, and 200 rpm. The relationship between water turbulent mixing capabilities and flow velocity were tested throughout the experiments. A three-dimensional model was established using Pro Engineer wildfire 5.0 (Parametric Technology Corporation, Boston, MA, USA). The Mesh under Ansys14.0 software package (ANSYS, America) was used to calculate the unstructured mesh. Numerical analysis was fitted using the cure fitting tool in MATLAB R2013a (MathWorks, Natick, MA, USA). Image data were processed using Origin Pro 8.0 (OriginLab, Northampton, MA, USA).
2.3. Test for Hydraulic Parameter Description
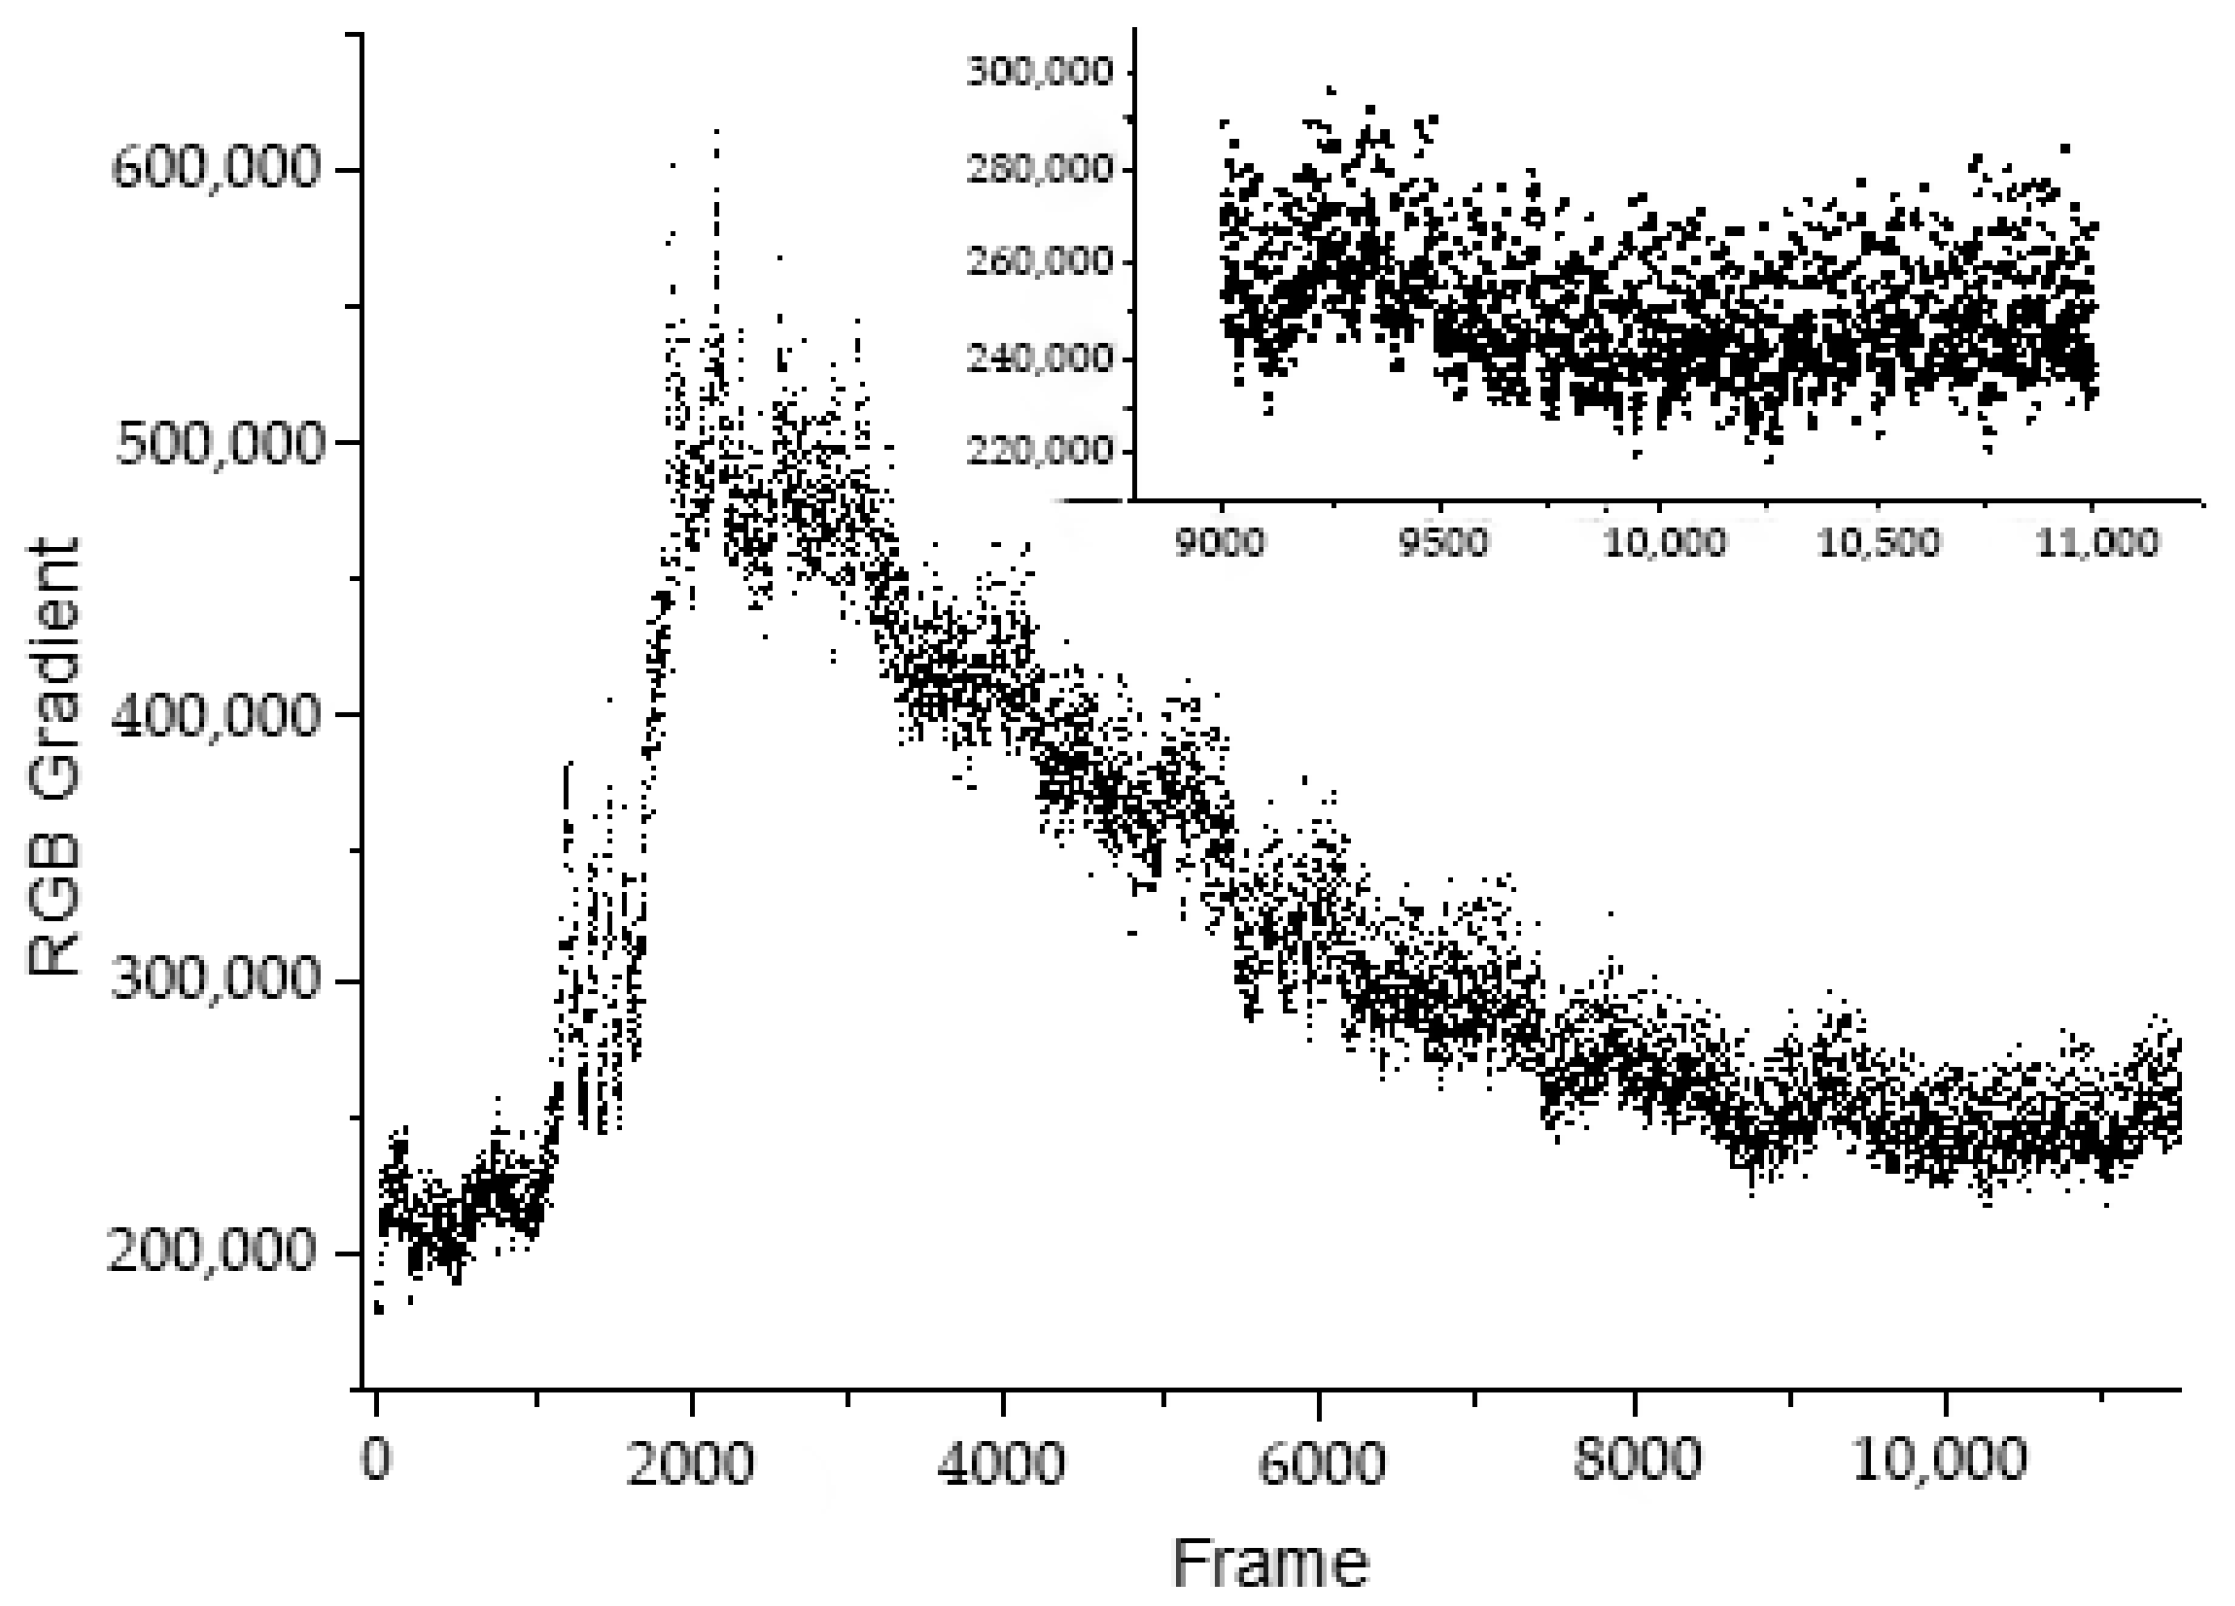
A high definition camera (Sony NEX-5N, Sony Corporation, Tokyo, Japan) with an EF S18–55 mm lens that is not used for full frame was used to observe the water mixing characteristics in the beaker. The parameter was set to 25 frames/s, shutter 1/40 s, and aperture F8. The camera focal plane was parallel to the container axis. Algae were added to 2 L of water in the test vessel and then the speed of the magnetic stirrer was adjusted. The camera was turned on when the rotational speed was stable, and 40 μL dye was added to the water on the surface in the center. The RGB color (Red-green-blue) gradient was used to record the mixing of the dye. As shown in Figure 1, the dye was completely mixed into the water. The central vortex flow path controlled the water mixture and resulted in an exchange between the upper and lower water. For example, the RGB color gradient over time in the beaker under 100 rpm stirring is shown in Figure 2.
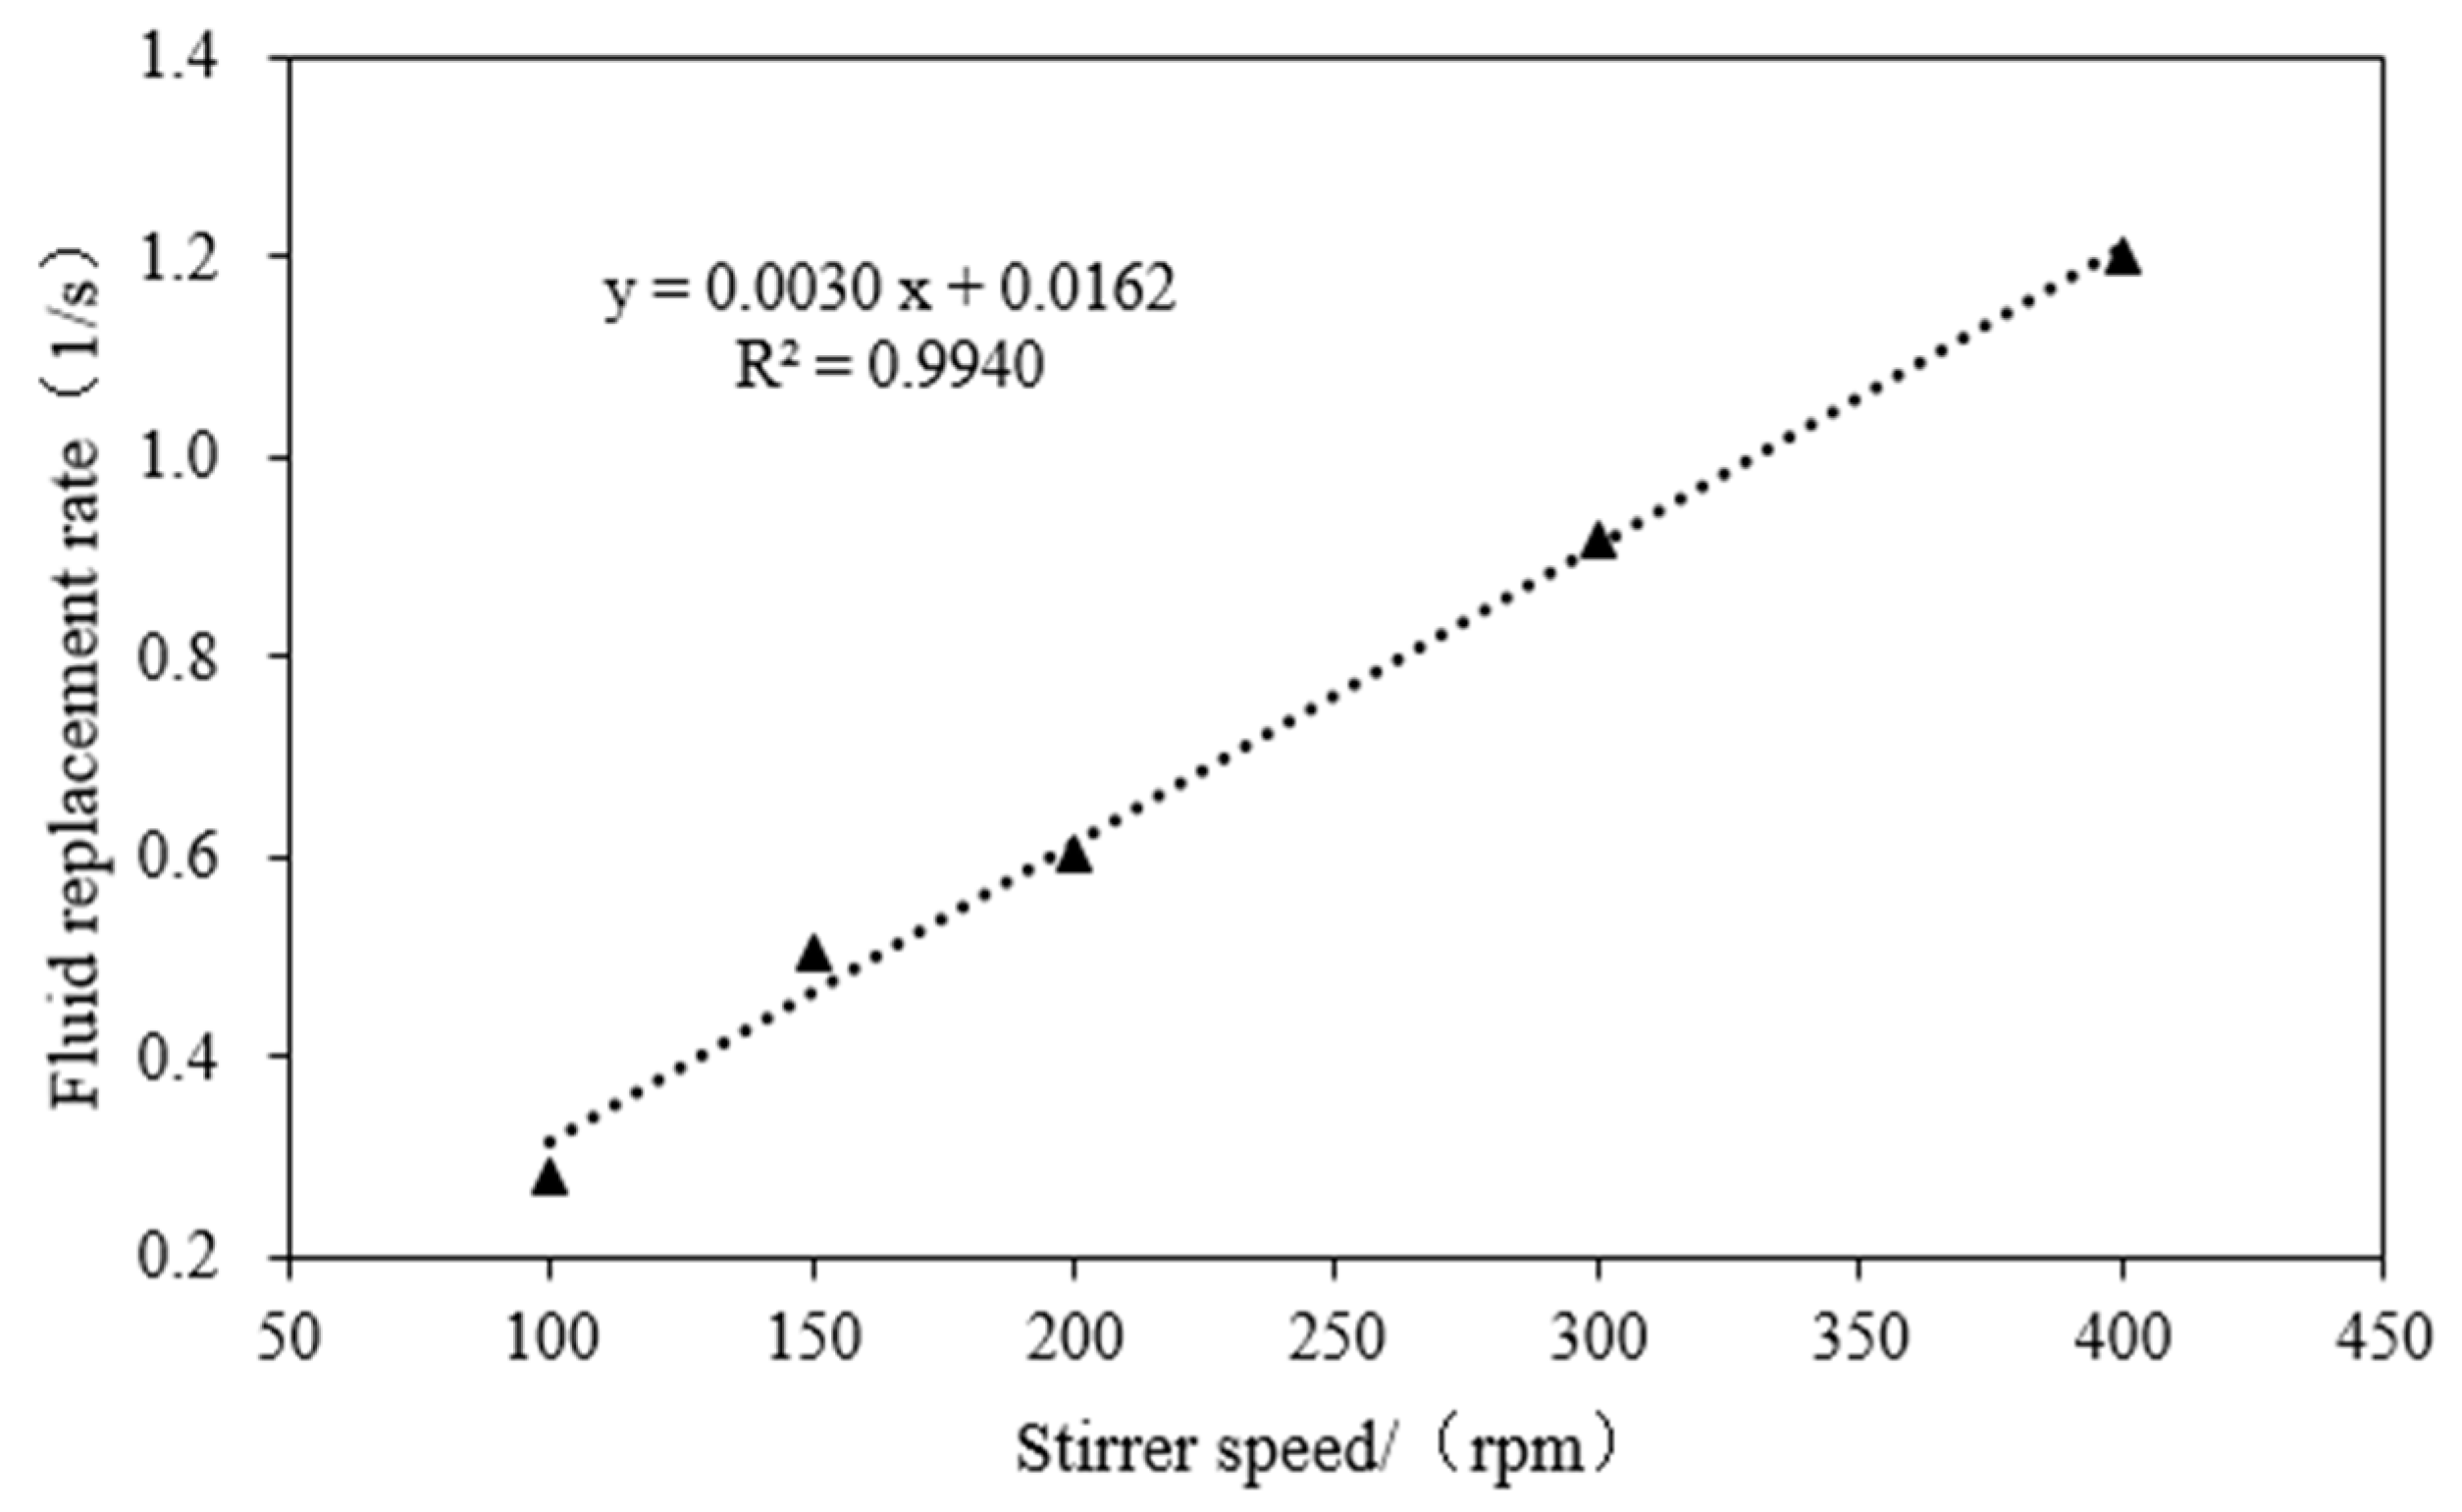
Polynomial was used for fitting discrete data to eliminate noise. The maximum value was taken as the demarcation point, and the variation of the RGB color gradient over time was divided into 2 parts. The lowest point at the front of the RGB gradient was set as a starting point and the lowest point at the tail of the RGB gradient value was set as the end point. The interval between the 2 points was the mixed frame. The mixing time was determined by frame rate. For example, for the beaker under 100 rpm stirring, the end data fitting is shown in Figure 3. According to the above numerical method, the mixing time under different stirrer speeds was calculated and the reciprocal mixing time was taken as the water mixing rate. Figure 4 shows the significant correlation (R2 = 0.9940) between the mixing time and stirrer speed. So, the mixing disturbance capacity could be described by the reciprocal mixing time in these beakers.
3. Experimental Results and Model Constructing
3.1. Effect of Turbulence Mixing on Growth of Microcystis aeruginosa
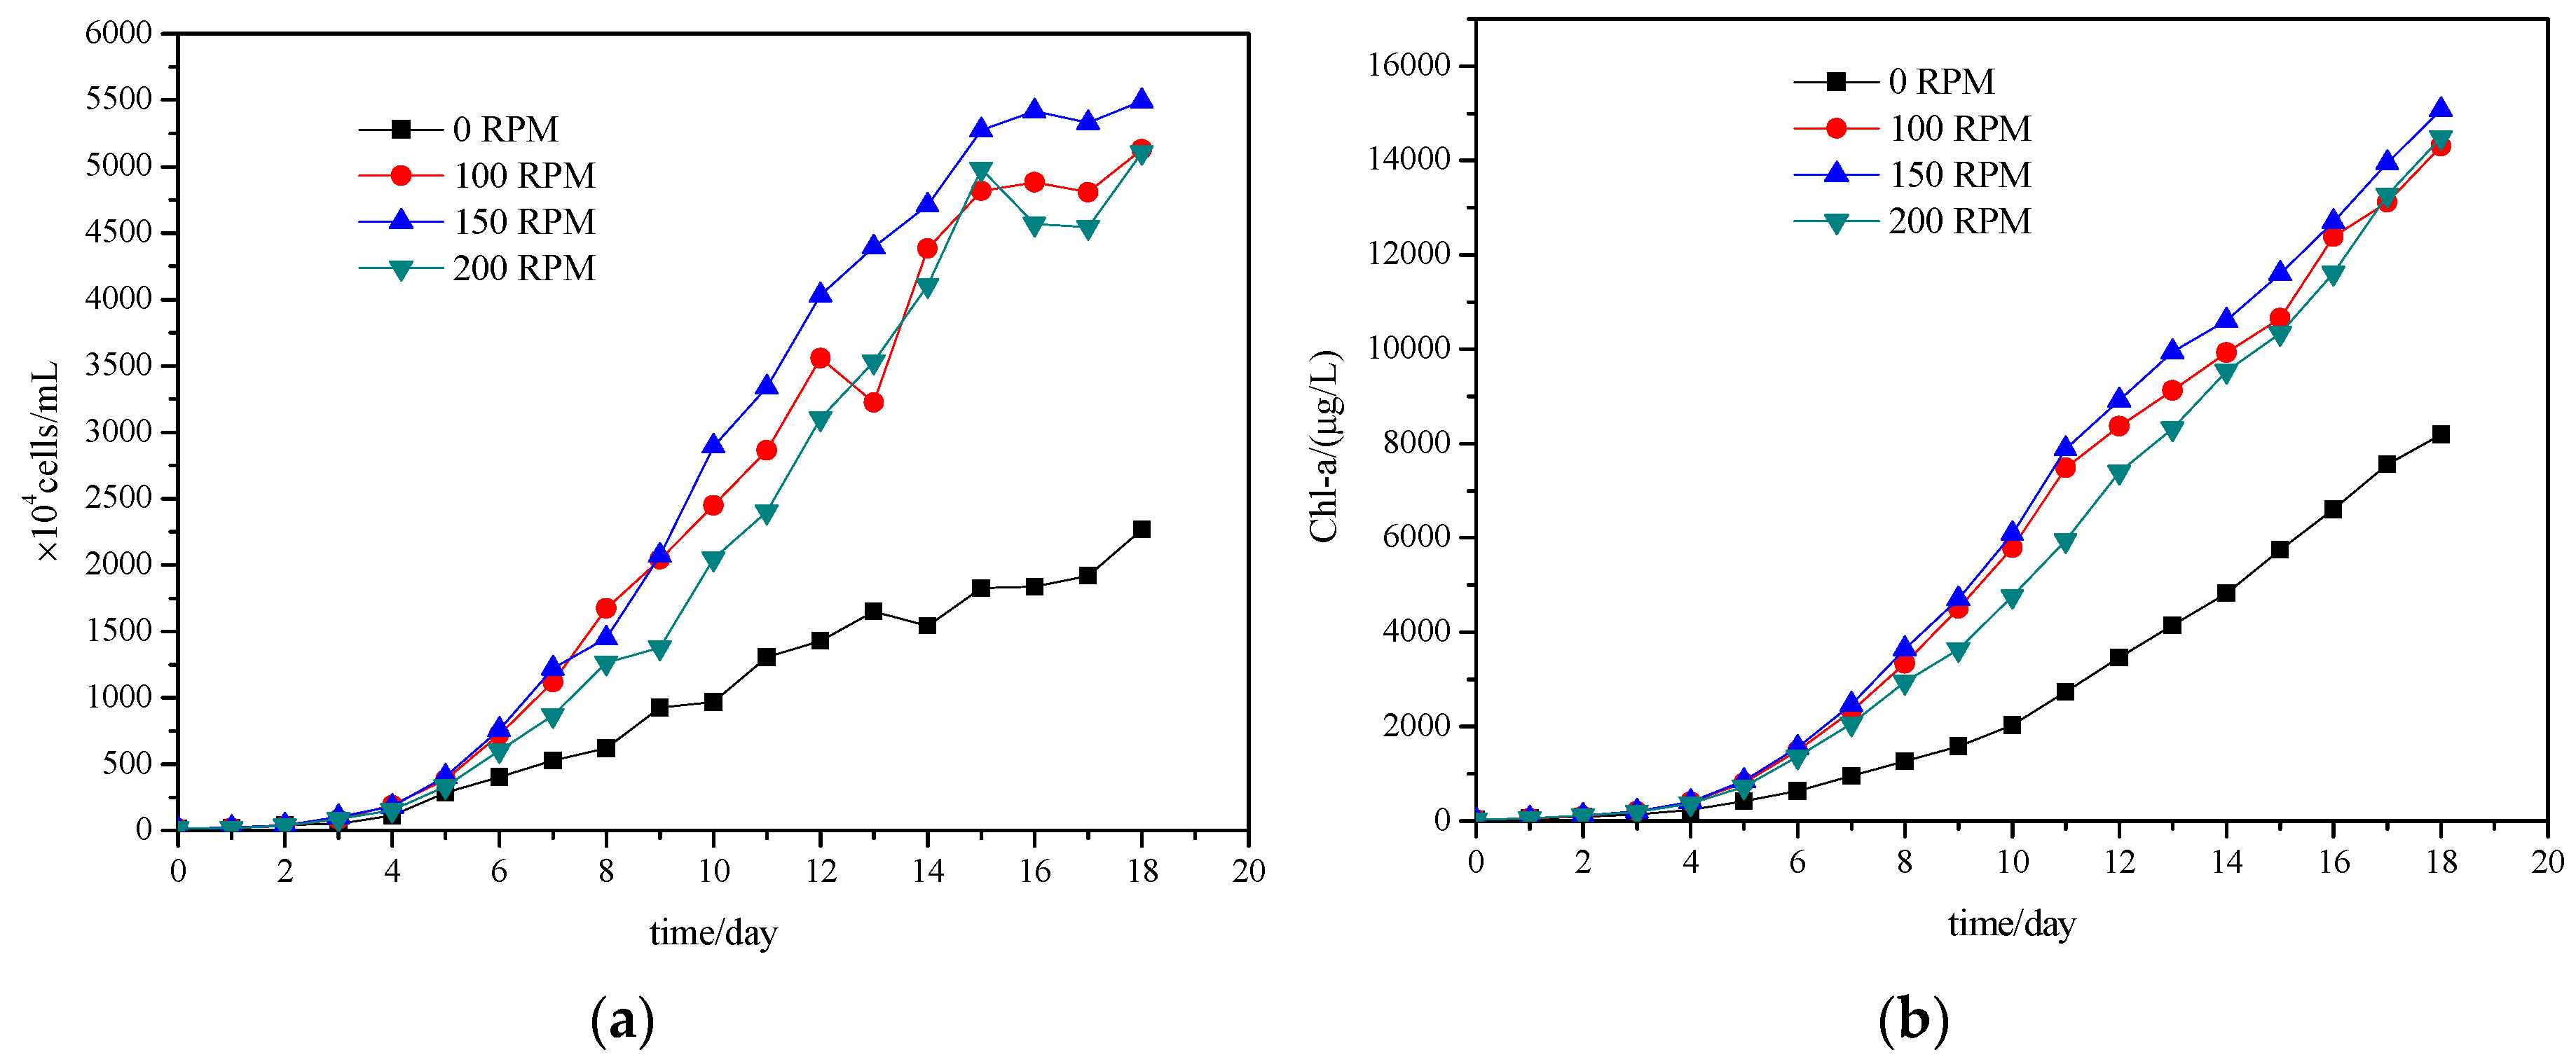
Figure 5a,b show the growth of Cyanobacteria (Microcystis aeruginosa) under different turbulence intensities. Compared to the control condition, turbulence promoted the growth of Microcystis aeruginosa. The Chl-a concentration change in Microcystis aeruginosa and the change in the number of algae cells under different turbulent mixing conditions were significantly related (r > 0.96). As the curves show, the growth trend between different turbulence conditions were approximately same: the lag phase occurs, then the logarithmic phase is entered, and finally stability is achieved, in agreement with the logistic growth model. Under the same light intensity and nutrient level conditions, this kind of algae is assumed to have the same r value (maximum growth rate). At the beginning of cultivation, M. aeruginosa was in the adaptive phase, in which the synthesis rate and concentration of Chl-a were lower than during the other phases. After six days, the growth in Microcystis aeruginosa entered into the logarithmic phase, in which the concentration of Chl-a increased logarithmically and differences between groups appeared. Based on the microscopic examination of the blood plate count to determine the cell damage rate, there was no algal cell damage. Under low hydraulic shear strengths, the hydraulic shear effect does not destroy the algae cell.
3.2. Construction of Logistic Model under Water Disturbance
3.2.1. Hypothesis
The maximum biomass or maximum abundance (M) is related to the combined homogenization effects between the nutrients and harmful substances in the water. The homogenization effect of the concentration field is based on the turbulent mixing. Based on the linear relationship between the maximum concentrations and turbulence mixing, and combining the maximum space capacity of algae growth under turbulent conditions, the logistic model can be optimized in terms of hydrodynamic force.
3.2.2. Modified Equation Deduction Based on Active M
Due to the continuous nutrient consumption and the waste discharge of the cell, the size of the biological growth space in the surroundings was affected by the mass transfer efficiency between the tiny water body (the laminar boundary layer) around the cell and the large water body (diffusion rate of nutrient and self-produced waste of the cell). This mass transfer efficiency was directly proportional to the concentration gradient between tiny water body (laminar boundary layer) and the large water body around the cell. Under eutrophication conditions, the beaker can be regarded as a large water body. Turbulent water mixing can prevent hazardous substances around the cell from accumulating and replenish nutrients around the tiny water body (Figure 6).
As described above, the material transport capacity can be characterized by the fluid replacement rate to which nutrient transport by microfluidics is related. Assuming that infinity concentration is c, complete mixture is represented as the speed at which infinite distance fluid replaces the fluid block of nutrient depletion and water stacking in the laminar boundary layer.
where V is the volume of reactor, T is the complete mixture time, and is the mixing rate.
The biochemical reaction equation is assumed to be A + B → C + D. Then the growth limitation has the following relationship:
where K(ABCD) is reaction rate, A and B are the nutrients, and C and D are the metabolites.
This relationship reflects the effect of the concentration of substances surrounding the cell on the growth of the cell in the period of balance or dynamic balance. Mass transfer is the key to a well-distributed concentration field and the limitation on increasing algae density. Under ideal growth conditions, the concentration of extracellular substances has a significant influence on the growth of algae. In the impounded body, concentration gradients can reach an equilibrium state within infinite time. However, cell biological processes are dynamic equilibrium processes, and waste accumulation and nutrient decrease lead to cell death. So, delayed extracellular diffusion of substances A, B, C, and D influence the maximum biomass, whereas the hydraulic condition decreases C and D and increases A and B by homogeneous mixing, which pushes the reaction toward the right, that is, promotes the growth of algae.
The fluid replacement ratio affects the concentration of the laminar boundary layer material, which is directly proportional to the nutrient concentration with which the cell is in contact. The fluid replacement ratio is directly proportional to the concentration of the substances in the area surrounding of the cell; therefore, the fluid replacement ratio is directly proportional to the mass of cell growth (maximum biomass or abundance).
The differential form of the logistic function is described as the following: growth speed k is directly proportional to the residual biomass (M – P):
where P is biomass or abundance, t is time, k is growth rate of the algae, and M is maximum biomass or maximum abundance.
The influence of mass transfer efficiency on maximum biomass (abundance) results in M being optimized into a linear relationship as follows:
where M0 is the maximum biomass (abundance) in static moment and KM is constant.
Then, the integral form of the logistic function is:
where r is proportional constant of growth rate and space, and t* is the time to reach half of maximum biomass (abundance).
The relationship between mass transfer efficiency and M is substituted into an integral form of the logistic function:
As such, two-dimensional fitting target formula was achieved. The parameter optimized hydrodynamic force logistic function can be achieved using the N-t-P relational formula for parameter fitting.
3.2.3. Model Verification
Multi-parameter estimation adopts least squares estimation based on the regional optimization idea. In the initial value area, the best function matching of data is found by minimizing the sum of squared errors. Parameter c is selected to minimize the weighted sum of squares of residuals (or deviations) between fitting data and actual observed values at each point. The curve is the fitting curve of data under the meaning of weighted least square. There are many methods that have been successfully used to solve fitting curves. For linear models, parameters can generally be calculated by establishing and solving equations and then a fitted curve can be obtained.
The largest iteration number was 400. The calculated cutoff point is the change of residual sum of squares between fitting data and measured data on the former and latter iteration, which is less than 10-6. The calculated cutoff point is the change of the sum of squared residuals of parameters on the former and latter iteration was less than 10−6.
3.2.4. Optimized Parameter Estimation of M
The Curve Fitting Tool in MATLAB was used for fitting data. Using a nonlinear least squares method, Robust is Bisqure and the Levenberg-Marquardt was used. Since the larger sensitivity of surface fitting to initial value of parameter, the numerical values are estimated.
For the maximum Chl-a concentration, M0 was estimated at 6000 μg/mL and kM was estimated at 8000. The specific growth rate constant was estimated to be 1.0 × 10⁻⁵ at ½ Mmax of 10 days. The parameter estimation of the abundance of the maximum algae cells number and the calculated fitting results are shown in the online Supplementary Materials.
3.2.5. Calculation Fitting Results
For the maximum Chl-a concentration, Table 1 shows the parameter estimation based on a 95% confidence interval and Table 2 shows the fitting evaluation.
Considering the universality of the function, the -t-P relation was employed for drawing to better show the relationships among turbulent mixing, time, and Chl-a concentration calculated by the fitting function (Figure 7).
3.3. Deduction of Improved Logistic Function Facing Population Competition
Assuming that there are n kinds of hydrobiontic algae in water, due to the fixed biological capacity of water body, the corresponding cell differential equation is:
The equation set of logistic function is:
where M is the maximum total biomass or maximum total abundance, is the specific growth rate of i algae, and is the time that i algae requires to reach half of maximum biomass (abundance).
Combined with N-t-P relationship, the known biomass of Microcystis aeruginosa and the competition growth formula based on the logistic function in the symbiosis with Microcystis aeruginosa and Scenedesmus quadricauda is:
where P1 reflects Scenedesmus quadricauda, in μg/mL, P2 reflects Microcystis aeruginosa in μg/mL, and kk1 is the biological plot ratio.
According to the experimental results, the average Chl-a concentration of Scenedesmus quadricauda was 33.91 μg/104 ind (individual) and the average Chl-a concentration of Microcystis aeruginosa was 2.40 μg/104 ind. Under a flow rate of 100 rpm, the maximum biomass and specific growth rate are listed in Table 3. The adjusted R2 was greater than 0.6.
The analysis of the fitted parameters suggested that the competition of different species causes a decrease in maximum biomass. The transportation and transfer due to water disturbance promotes growth space competition among cells. For instance, increasing diffusion of Microcystis aeruginosa toxins further reduces the growth space. Algae stimulated by external factors accelerate reproduction and fission to achieve population dominance. However, the results showed that algae in the same ecological niche (Microcystis aeruginosa and Scenedesmus quadricauda have similar biological plot ratios: Microcystis aeruginosa:Scenedesmus quadricauda = 1:0.9205) compete with each other and slow down the maximum growth rate. The results obtained from the model agree with observed results.
4. Discussion
Without considering the velocity of mechanical damage, small-scale turbulence strongly influences the growth of Microcystis aeruginosa. Many studies found that turbulence through water mixing affects the physico-chemical properties of the water column, increases the diffusion rate on the cell surface, and enhances the uptake of nutrients [20,30,31,32], which then promotes the growth of Microcystis spp., especially the toxic Microcystis spp. In controlled laboratory experiments, where nutrients are plentiful and available light is identical, different turbulent conditions have promoted the growth of Microcystis aeruginosa. Compared with the control condition, the Chl-a concentration reached the corresponding maximum under each turbulence condition. The growth rate of Microcystis aeruginosa decreased with increasing biological saturation in the limited beaker space, reflecting the restriction of nutrition and space on algal population growth. The population dynamics was consistent with the logistic function under each turbulence condition. The improved logistic growth model of M aeruginosa and the competition growth model with the symbiont S. quadricauda under turbulent conditions were established based these experimental results. We introduced turbulence for the examination of physiological responses of Microcystis aeruginosa, coupled turbulence, and growth of Microcystis aeruginosa in the models of population dynamics. The R value of the fitting curve was greater than 0.9, confirming the results fit the model and the unity of the nutrient and algae growth relationship affected by hydrodynamic force. With the increase in turbulence intensity, turbulence has a limited influence on algal growth space.
Phytoplankton population dynamics are controlled by the relative rather than absolute timescales of mixing [33]. Zhou et al. [28] found the short-term (approx. three days’) turbulence favored the growth of toxic Microcystis species. In an ideal environment, they assumed that same algae species have similar r values. The initial algae biomass and the r value dominate the beginning of the growth curve. The well-fitted algae curves and similar growth rates support the former hypothesis. At the end of the growth period, the algal population limit influences the size of the algal population. Algal population has a maximum biomass that can change with the turbulence conditions, which proves the feasibility of our conjecture. In the improved logistic growth model of M. aeruginosa, compared with the static conditions, water turbulence can promote the growth of M. aeruginosa and increase the concentration of chl-a under certain turbulence intensity. This conclusion fits the experiment data that showed that algae growth curves are similar to each other under the conditions of high rotational speed. Water turbulence may provide an advantage for M. aeruginosa in allowing access to more nutrients and preventing the accumulation of hazardous material around cell by changing the thickness of the extracellular laminar boundary layer. The same phenomenon has also been observed in other studies [34,35].
Under competition conditions, the fitted results confirm the maximum biomass conjecture that similar maximum biomasses occur under different hydraulic conditions and the influence of the flow rate on maximum algae biomass is similar to a linear relationship. The growth rates of algae under competition compared from single algae is larger, which conforms to the explanation that Microcystis aeruginosa toxin has a carcinogenic mechanism. Cancer due to biotoxicity leads to a decrease in total biomass but improved multiplication capacity and increased death rates. Moreover, high intensity turbulence mixing plays an important role in Scenedesmus quadricauda becoming a dominant species, in agreement with other observed data that showed that potentially toxic cyanobacteria predominate under low turbulence, whereas diatoms and green algae dominate growth under high turbulence [10]. Compared with other phytoplankton, many previous studies have suggested that Cyanobacteria can adjust their position in the water by changing their buoyancy to obtain more nutrients, causing Cyanobacteria blooms. When the turbulence intensity increases, the absorption and photosynthetic efficiency of Scenedesmus quadricauda increases in the growth space, and the competitive advantage of Microcystis aeruginosa decreases. Cyanobacteria are more sensitive to small-scale turbulence than green algae, resulting in inhibition of growth under high intensity mixing [36].
5. Conclusions
(1) According to the experimental results, the timing of the lag and logarithmic growth phases were similar between turbulence treatments. The process starts from the lag phase, then enters a logarithmic phase, and finally reaches a stable phase, which fits the logistic growth curve. However, the abundance differed between treatments, showing that increases in turbulence can increase growth rate.
(2) Based on the logistic basic function, a planktonic algae model under hydrodynamic conditions was established. When R > 0.95, well-fitted results were obtained, in which the algae growth better matched an s-shaped curved surface growth.
(3) Under the same conditions of adequate nutrients and light, the same type of planktonic algae have a logistic growth rate ratio constant r. Water changes the extracellular environment of planktonic algae through the mass transfer effect and then changes the growth limitation of algae, thus affecting the algal group size. However, water flow enhances the algae biomass. With a continuous increase in flow speed, the fitted curved surface becomes smoother and steadier.
Supplementary Materials
The following are available online at https://www.mdpi.com/2073-4441/11/4/669/s1. Table 1. The parameters estimation based on 95% confidence interval for maximum cell number of abundance. Table 2. The fitting evaluation parameters for maximum cell number of abundance.
Author Contributions
Conceptualization, H.Z.; Formal Analysis, H.Z. and F.L.; Methodology, R.C. and Y.Z.; Software, R.C. and Z.G.; Data Curation, Y.Z.; Writing-Original Draft Preparation, F.L., Z.G., and F.H.; Writing-Review & Editing, F.L. and F.H.
Funding
This research has been supported by National Natural Science Foundation of China (51409190, 51379146).
Acknowledgments
Comments and suggestions from anonymous reviewers, the Associate Editor, and the Editor are greatly appreciated.
Conflicts of Interest
The authors declare no conflict of interest.
References
- Mischke, U. Cyanobacteria associations in shallow polytrophic lakes: Influence of environmental factors. Acta Oecol. 2003, 24, S11–S23. [Google Scholar] [CrossRef]
- Peeters, F.; Straile, D.; Lorke, A.; Ollinger, D. Turbulent mixing and phytoplankton spring bloom development in a deep lake. Limnol. Oceanogr. 2007, 52, 286–298. [Google Scholar] [CrossRef] [Green Version]
- Paerl, H.W.; Huisman, J. Climate-Blooms like it hot. Science 2008, 320, 57–58. [Google Scholar] [CrossRef]
- Visser, P.M.; Ibelings, B.W.; Bormans, M.; Huisman, J. Artificial mixing to control cyanobacterial blooms: A review. Aquat. Ecol. 2016, 50, 423–441. [Google Scholar] [CrossRef]
- Berman, T.; Shteinman, B. Phytoplankton development and turbulent mixing in Lake Kinneret, 1992–1996. J. Plankton Res. 1998, 20, 709–726. [Google Scholar] [CrossRef]
- Imteaz, M.A.; Asaeda, T. Artificial mixing of lake water by bubble plume and effects of bubbling operations on algal bloom. Water Res. 2000, 34, 1919–1929. [Google Scholar] [CrossRef]
- Liu, L.; Liu, D.F.; Johnson, D.M.; Yi, Z.Q.; Huang, Y.L. Effects of vertical mixing on phytoplankton blooms in Xiangxi Bay of Three Gorges Reservoir: Implications for management. Water Res. 2012, 46, 2121–2130. [Google Scholar] [CrossRef]
- Bronnenmeier, R.; Märkl, H. Hydrodynamic stress capacity of microorganisms. Biotechnol. Bioeng. 1982, 24, 553–578. [Google Scholar] [CrossRef] [PubMed]
- Regel, R.H.; Brookes, J.D.; Ganf, G.G.; Griffiths, R. The influence of experimentally generated turbulence on the Mash01 unicellular Microcystis aeruginosa strain. Hydrobiologia 2004, 517, 107–120. [Google Scholar] [CrossRef]
- Huisman, J.; Sharples, J.; Stroom, J.M.; Visser, P.M.; Kardinaal, W.E.A.; Verspagen, J.M.H.; Sommeijer, B. Changes in turbulent mixing shift competition for light between phytoplankton species. Ecology 2004, 85, 2960–2970. [Google Scholar] [CrossRef]
- Li, F.P.; Zhang, H.P.; Zhu, Y.P.; Xiao, Y.H.; Chen, L. Effect of flow velocity on phytoplankton biomass and composition in a freshwater lake. Sci. Total Environ. 2013, 447, 64–71. [Google Scholar] [CrossRef]
- O’Brien, K.R.; Meyer, D.L.; Waite, A.M.; Ivey, G.N.; Hamilton, D.P. Disaggregation of Microcystis aeruginosa colonies under turbulent mixing: Laboratory experiments in a grid-stirred tank. Hydrobiologia 2004, 519, 143–152. [Google Scholar] [CrossRef]
- Zhang, H.P.; Chen, R.H.; Li, F.P.; Chen, L. Effect of flow rate on environmental variables and phytoplankton dynamics: Results from field enclosures. Chin. J. Oceanol. Limn. 2015, 33, 430–438. [Google Scholar] [CrossRef]
- San, L.; Long, T.Y.; Liu, C.C.K. Algal bioproductivity in turbulent water: An experimental study. Water 2017, 9, 304. [Google Scholar] [CrossRef]
- Long, T.Y.; Wu, L.; Meng, G.H.; Guo, W.H. Numerical simulation for impacts of hydrodynamic conditions on algae growth in Chongqing Section of Jialing River, China. Ecol. Model. 2011, 222, 112–119. [Google Scholar] [CrossRef]
- Grobbelaar, J.U. Turbulence in Mass Algal Cultures and the Role of Light/Dark Fluctuations. J. Appl. Phycol. 1994, 6, 331–335. [Google Scholar] [CrossRef]
- Arin, L.; Marrase, C.; Maar, M.; Peters, F.; Sala, M.M.; Alcaraz, M. Combined effects of nutrients and small-scale turbulence in a microcosm experiment. I. Dynamics and size distribution of osmotrophic plankton. Aquat. Microb. Ecol. 2002, 29, 51–61. [Google Scholar] [CrossRef] [Green Version]
- Iversen, K.R.; Primicerio, R.; Larsen, A.; Egge, J.K.; Peters, F.; Guadayol, O.; Jacobsen, A.; Havskum, H.; Marrase, C. Effects of small-scale turbulence on lower trophic levels under different nutrient conditions. J. Plankton Res. 2010, 32, 197–208. [Google Scholar] [CrossRef]
- Hondzo, M.; Warnaars, T.A. Coupled effects of small-scale turbulence and phytoplankton biomass in a small stratified lake. J. Environ. Eng-Asc. 2008, 134, 954–960. [Google Scholar] [CrossRef]
- Hondzo, M.; Wuest, A. Do Microscopic Organisms Feel Turbulent Flows? Environ. Sci. Technol. 2009, 43, 764–768. [Google Scholar] [CrossRef]
- Xiao, Y.; Li, Z.; Li, C.; Zhang, Z.; Huo, J.S. Effect of small-scale turbulence on the physiology and morphology of two bloom-forming cyanobacteria. PLoS ONE 2016, 11, e0168925. [Google Scholar] [CrossRef] [PubMed]
- Missaghi, S.; Hondzo, M.; Sun, C.; Guala, M. Influence of fluid motion on growth and vertical distribution of cyanobacterium Microcystis aeruginosa. Aquat. Ecol. 2016, 50, 639–652. [Google Scholar] [CrossRef]
- G.-Tóth, L.; Parpala, L.; Balogh, C.; Tãtrai, I.; Baranyai, E. Zooplankton community response to enhanced turbulence generated by water-level decrease in Lake Balaton, the largest shallow lake in Central Europe. Limnol. Oceanogr. 2011, 56, 2211–2222. [Google Scholar] [Green Version]
- Moreno-Ostos, E.; Cruz-Pizarro, L.; Basanta, A.; George, D. The influence of wind-induced mixing on the vertical distribution of buoyant and sinking phytoplankton species. Aquat. Ecol. 2009, 43, 271–284. [Google Scholar] [CrossRef]
- Wu, T.; Qin, B.; Zhu, G.; Luo, L.; Ding, Y.; Bian, G. Dynamics of cyanobacterial bloom formation during short-term hydrodynamic fluctuation in a large shallow, eutrophic, and wind-exposed Lake Taihu, China. Environ. Sci. Pollut. Res. 2013, 20, 8546–8556. [Google Scholar] [CrossRef]
- Huang, C.C.; Li, Y.M.; Yang, H.; Sun, D.Y.; Yu, Z.Y.; Zhang, Z.; Chen, X.; Xu, L.J. Detection of algal bloom and factors influencing its formation in Taihu Lake from 2000 to 2011 by MODIS. Environ. Earth Sci. 2014, 71, 3705–3714. [Google Scholar] [CrossRef]
- Meissner, S.; Fastner, J.; Dittmann, E. Microcystin production revisited: Conjugate formation makes a major contribution. Environ. Microbiol. 2013, 15, 1810–1820. [Google Scholar] [CrossRef] [PubMed]
- Zhou, J.; Qin, B.Q.; Han, X.X.; Zhu, L. Turbulence increases the risk of microcystin exposure in a eutrophic lake (Lake Taihu) during cyanobacterial bloom periods. Harmful Algae 2016, 55, 213–220. [Google Scholar] [CrossRef] [PubMed]
- Zhang, Y.H. The Effect of Turbulence on Microcystis Aeruginosa and Scenedesmus Quadricauda. Master’s Thesis, Tongji University, Shanghai, China, 2014. (In Chinese with English abstract). [Google Scholar]
- Bergstedt, M.S.; Hondzo, M.M.; Cotner, J.B. Effects of small scale fluid motion on bacterial growth and respiration. Freshw. Biol. 2004, 49, 28–40. [Google Scholar] [CrossRef]
- Guasto, J.S.; Rusconi, R.; Stocker, R. Fluid mechanics of planktonic microorganisms. Annu. Rev. Fluid Mech. 2012, 44, 373–400. [Google Scholar] [CrossRef]
- Prairie, J.C.; Sutherland, K.R.; Nickols, K.J.; Kaltenberg, A.M. Biophysical interactions in the plankton: A cross-scale review. Limnol. Oceanogr Fluids Environ. 2012, 2, 121–145. [Google Scholar] [CrossRef] [Green Version]
- O’Brien, K.R.; Ivey, G.N.; Hamilton, D.P.; Waite, A.M. Simple mixing criteria for the growth of negatively buoyant phytoplankton. Limnol Oceanogr. 2003, 48, 1326–1337. [Google Scholar] [CrossRef] [Green Version]
- KarpBoss, L.; Boss, E.; Jumars, P. Nutrient fluxes to planktonic osmotrophs in the presence of fluid motion. Oceanogr. Mar. Biol. 1996, 34, 71–107. [Google Scholar]
- Warnaars, T.A.; Hondzo, M. Small-scale fluid motion mediates growth and nutrient uptake of Selenastrum capricornutum. Freshw. Biol. 2006, 51, 999–1015. [Google Scholar] [CrossRef]
- Thomas, W.H.; Gibson, C.H. Effects of small-scale turbulence on microalgae. J. Appl. Phycol. 1990, 2, 71–77. [Google Scholar] [CrossRef]
Figure 1.
The dye around the beaker achieved complete mixing due to the stirring paddle, among which Fig a-f are RGB color gradient at the time of 0 s (a), 1 mim (b), 2 min (c), 4 mim (d), 6 min (e) and complete mixing (f), respectively.
Figure 1.
The dye around the beaker achieved complete mixing due to the stirring paddle, among which Fig a-f are RGB color gradient at the time of 0 s (a), 1 mim (b), 2 min (c), 4 mim (d), 6 min (e) and complete mixing (f), respectively.

Figure 2.
Variation of RGB color gradient with time in a beaker under 100 rpm stirring, among which the inset image is an enlargement of local data.
Figure 2.
Variation of RGB color gradient with time in a beaker under 100 rpm stirring, among which the inset image is an enlargement of local data.

Figure 3.
The end data fitting under 100 rpm stirring, among which the inset image is the variation of RGB color gradient with time in a beaker under 100 rpm stirring.
Figure 3.
The end data fitting under 100 rpm stirring, among which the inset image is the variation of RGB color gradient with time in a beaker under 100 rpm stirring.

Figure 4.
Correlation between the mixing time and stirrer speed.

Figure 5.
(a) Cell number density and(b) Chl-a concentration changes in Microcystis aeruginosa under different turbulence conditions.
Figure 5.
(a) Cell number density and(b) Chl-a concentration changes in Microcystis aeruginosa under different turbulence conditions.

Figure 6.
Water mixing can prevent hazardous substances around cell from accumulating and replenish nutrients around the tiny water body.
Figure 6.
Water mixing can prevent hazardous substances around cell from accumulating and replenish nutrients around the tiny water body.

Figure 7.
Relationship among hydrodynamic impact factor, time, and Chl-a concentration.


Table 1.
The parameter estimation based on 95% confidence intervals (CIs) for the maximum chlorophyll-a (Chl-a) concentration.
Table 1.
The parameter estimation based on 95% confidence intervals (CIs) for the maximum chlorophyll-a (Chl-a) concentration.
| Parameter | Calculated Value | Estimated Lower Limit | Estimated Higher Limit |
|---|---|---|---|
| M0 (μg/mL) | 9471 | 8192 | 1.075 × 10⁴ |
| km | 9779 | 7527 | 1.203 × 10⁴ |
| r | 2.899 × 10⁻⁵ | 2.059 × 10⁻⁵ | 3.738 × 10⁻⁵ |
| t* (d) | 11.53 | 10.72 | 12.33 |
Table 2.
The fitting evaluation parameters for the maximum Chl-a concentration.
| Parameter | Value |
|---|---|
| SSE (sum of squares due to error) | 9.682 × 10⁷ |
| R2 | 0.9411 |
| Adjusted R2 | 0.9386 |
| RMSE (Root mean square error) | 1160 |
Table 3.
The maximum biomass and specific growth rate under 100 rpm stirring.
| Rotation Rate (rpm) | Maximum Biomass (μg/mL) | Hybrid Effect Coefficient | Biological Plot Ratio (Microcystis aeruginosa Is Unit 1) | Specific Growth Rate | Half-Saturation Time (d) |
|---|---|---|---|---|---|
| 100 | 2620 | –2586 | 0.9205 | 1.025 × 10⁻⁴ | 21.21 |
© 2019 by the authors. Licensee MDPI, Basel, Switzerland. This article is an open access article distributed under the terms and conditions of the Creative Commons Attribution (CC BY) license (http://creativecommons.org/licenses/by/4.0/).
Share and Cite
MDPI and ACS Style
Zhang, H.; Huang, F.; Li, F.; Gu, Z.; Chen, R.; Zhang, Y. An Improved Logistic Model Illustrating Microcystis aeruginosa Growth Under Different Turbulent Mixing Conditions. Water 2019, 11, 669. https://doi.org/10.3390/w11040669
AMA Style
Zhang H, Huang F, Li F, Gu Z, Chen R, Zhang Y. An Improved Logistic Model Illustrating Microcystis aeruginosa Growth Under Different Turbulent Mixing Conditions. Water. 2019; 11(4):669. https://doi.org/10.3390/w11040669
Chicago/Turabian StyleZhang, Haiping, Fan Huang, Feipeng Li, Zhujun Gu, Ruihong Chen, and Yuehong Zhang. 2019. "An Improved Logistic Model Illustrating Microcystis aeruginosa Growth Under Different Turbulent Mixing Conditions" Water 11, no. 4: 669. https://doi.org/10.3390/w11040669
Note that from the first issue of 2016, this journal uses article numbers instead of page numbers. See further details here.