Article

Seasonal Fluxes of Dissolved Nutrients in Streams of Catchments Dominated by Swidden Agriculture in the Maya Forest of Belize, Central America

1
Shoals Marine Laboratory, University of New Hampshire, Morse Hall, Suite 113, 8 College Road, Durham, NH 03824, USA
2
U.S. Geological Survey, Great Lakes Science Center, 1451 Green Rd., Ann Arbor, MI 48105, USA
3
Department of Geography and Planning, University at Albany, State University of New York, 1400 Washington Ave., Albany, NY 12222, USA
4
Department of Geography, Ohio State University, 1169 Derby Hall, 154 North Oval Mall Columbus, Columbus, OH 43210, USA
5
Department of Geological Sciences and Land Use and Environmental Change Institute, University of Florida, 241 Williamson Hall, Gainesville, FL 32611, USA
6
Forest Resources and Conservation, University of Florida, 328 Newins-Ziegler Hall, Gainesville, FL 32611, USA
*
Author to whom correspondence should be addressed.
Water 2019, 11(4), 664; https://doi.org/10.3390/w11040664
Submission received: 12 November 2018 / Revised: 22 March 2019 / Accepted: 27 March 2019 / Published: 31 March 2019
(This article belongs to the Special Issue Current and Emerging Issues Surrounding Water in the Americas )

Abstract

:
The biogeochemistry of nitrogen (N) and phosphorus (P) in tropical streams and rivers is strongly regulated by the pronounced seasonality of rainfall and associated changes in hydrology. Land use and land cover change (LULCC) can also be a dominant driver of changes in stream biogeochemistry yet responses are not fully understood and vary across different LULCC scenarios. We measured dissolved and total nitrogen (N) and phosphorus (P) concentrations in four tributary streams of the Temash River watershed in southern Belize, Central America. The dominant land use practice in each of the four study catchments was swidden agriculture. We documented a strong seasonal control on the export of nutrients from these study systems with daily N fluxes increasing approximately 10-fold during the onset of the rainy season. P fluxes increased almost 4-fold during the same time period. Comparisons with nutrient export coefficients from other tropical streams suggest that nutrient export in streams of the Temash River watershed is similar or slightly lower. Establishing improved understanding of the terrestrial and hydrologic controls of N and P transport across the terrestrial-aquatic boundary and developing a comprehensive nutrient budget that includes inputs and outputs associated with crop production is warranted in future work.

1. Introduction

Tropical streams and rivers have long served as a nexus for rural livelihoods. They provide an array of ecosystem services to rural communities, including the replenishment of nutrient-rich floodplain soils for agriculture, protein via fish and other aquatic game, transportation, and water for drinking, washing, and irrigation [1]. These ecosystem services are closely linked to the seasonal hydrological variability (i.e., dry vs. wet seasons) across the Neotropics, which is associated with seasonal migrations of the intertropical convergence zone [2] and the El Niño Southern Oscillation [3]. During the dry season river discharge is low and groundwater is an important component of overall flow. The onset of the wet season brings greater discharge and increased connectivity between the stream channel and the adjacent riparian zone, especially during flood periods [4].
Human-induced environmental changes have a disproportionately large effect on the structure and function of tropical freshwater ecosystems and their ability to provide ecosystem services [1,5,6]. Such impacts include altered hydrologic regimes [7], biodiversity loss [8], and disruption of biogeochemical cycles [9,10]. Disruption of nitrogen (N) and phosphorus (P) biogeochemical cycles is of particular concern because it can lead to eutrophication of freshwater ecosystems and their downstream estuaries [10,11,12,13].
One of the primary drivers of altered nutrient biogeochemical cycles in tropical freshwater ecosystems is land use and land cover change (LULCC) associated with agricultural expansion. There is an extensive literature on the impacts of tropical forest conversion to pasture that documents reduced rates of N and P cycling and concomitant reductions in stream nitrate (NO3) concentrations coupled with increases in dissolved organic N and P [14,15,16,17,18]. In contrast to pasture, recent expansion of large-scale agriculture in South America, particularly for soybean cultivation, has not caused large increases in dissolved N and P concentrations in adjacent surface waters relative to forested catchments [19,20].
Largely missing from the literature, however, are assessments of the impacts of swidden agriculture on freshwater ecosystems. Small-scale farmers who practice swidden agriculture have long been characterized as primary agents of conversion of forest to agriculture in the tropics [21,22,23]. Swidden is one of the dominant land use systems in the tropics [24]; more than 250 million people are thought to practice swidden agriculture as their primary livelihood [25]. At its core, swidden agriculture includes clearing forest patches, burning the fallen biomass, cultivating food crops, and then fallowing the area before reclearing and planting again. In the Maya forest of northern Central America, swidden agriculture, locally referred to as ‘milpa’, has been the region’s most pervasive land use strategy for millennia [26]. Whereas the impact of ancient land use practices and milpa agriculture on both terrestrial and aquatic ecosystems in the Maya forest area has been the focus of research for many years [27], limited attention has been given to the impact of contemporary swidden agriculture on aquatic ecosystems in the Maya forest region. To our knowledge, only three studies from this region have examined soil erosion vulnerability and loss of riparian forests within a landscape of mixed land uses that include swidden agriculture, pasture, and commercial agriculture [28,29,30].
The current study contributes to the literature on terrestrial–aquatic interactions within a landscape dominated by swidden agriculture by establishing baseline in-stream nutrient concentrations (N and P) in four tributary streams of the Temash River watershed, in southern Belize. Our specific objectives were to (i) characterize discharge patterns in relation to precipitation and catchment characteristics for each study catchment, (ii) examine differences in seasonal and longitudinal in-stream nutrient concentrations and nutrient fluxes within each study catchment, and (iii) compare estimates of nutrient export from the study catchments with estimates from other tropical catchments.

2. Materials and Methods
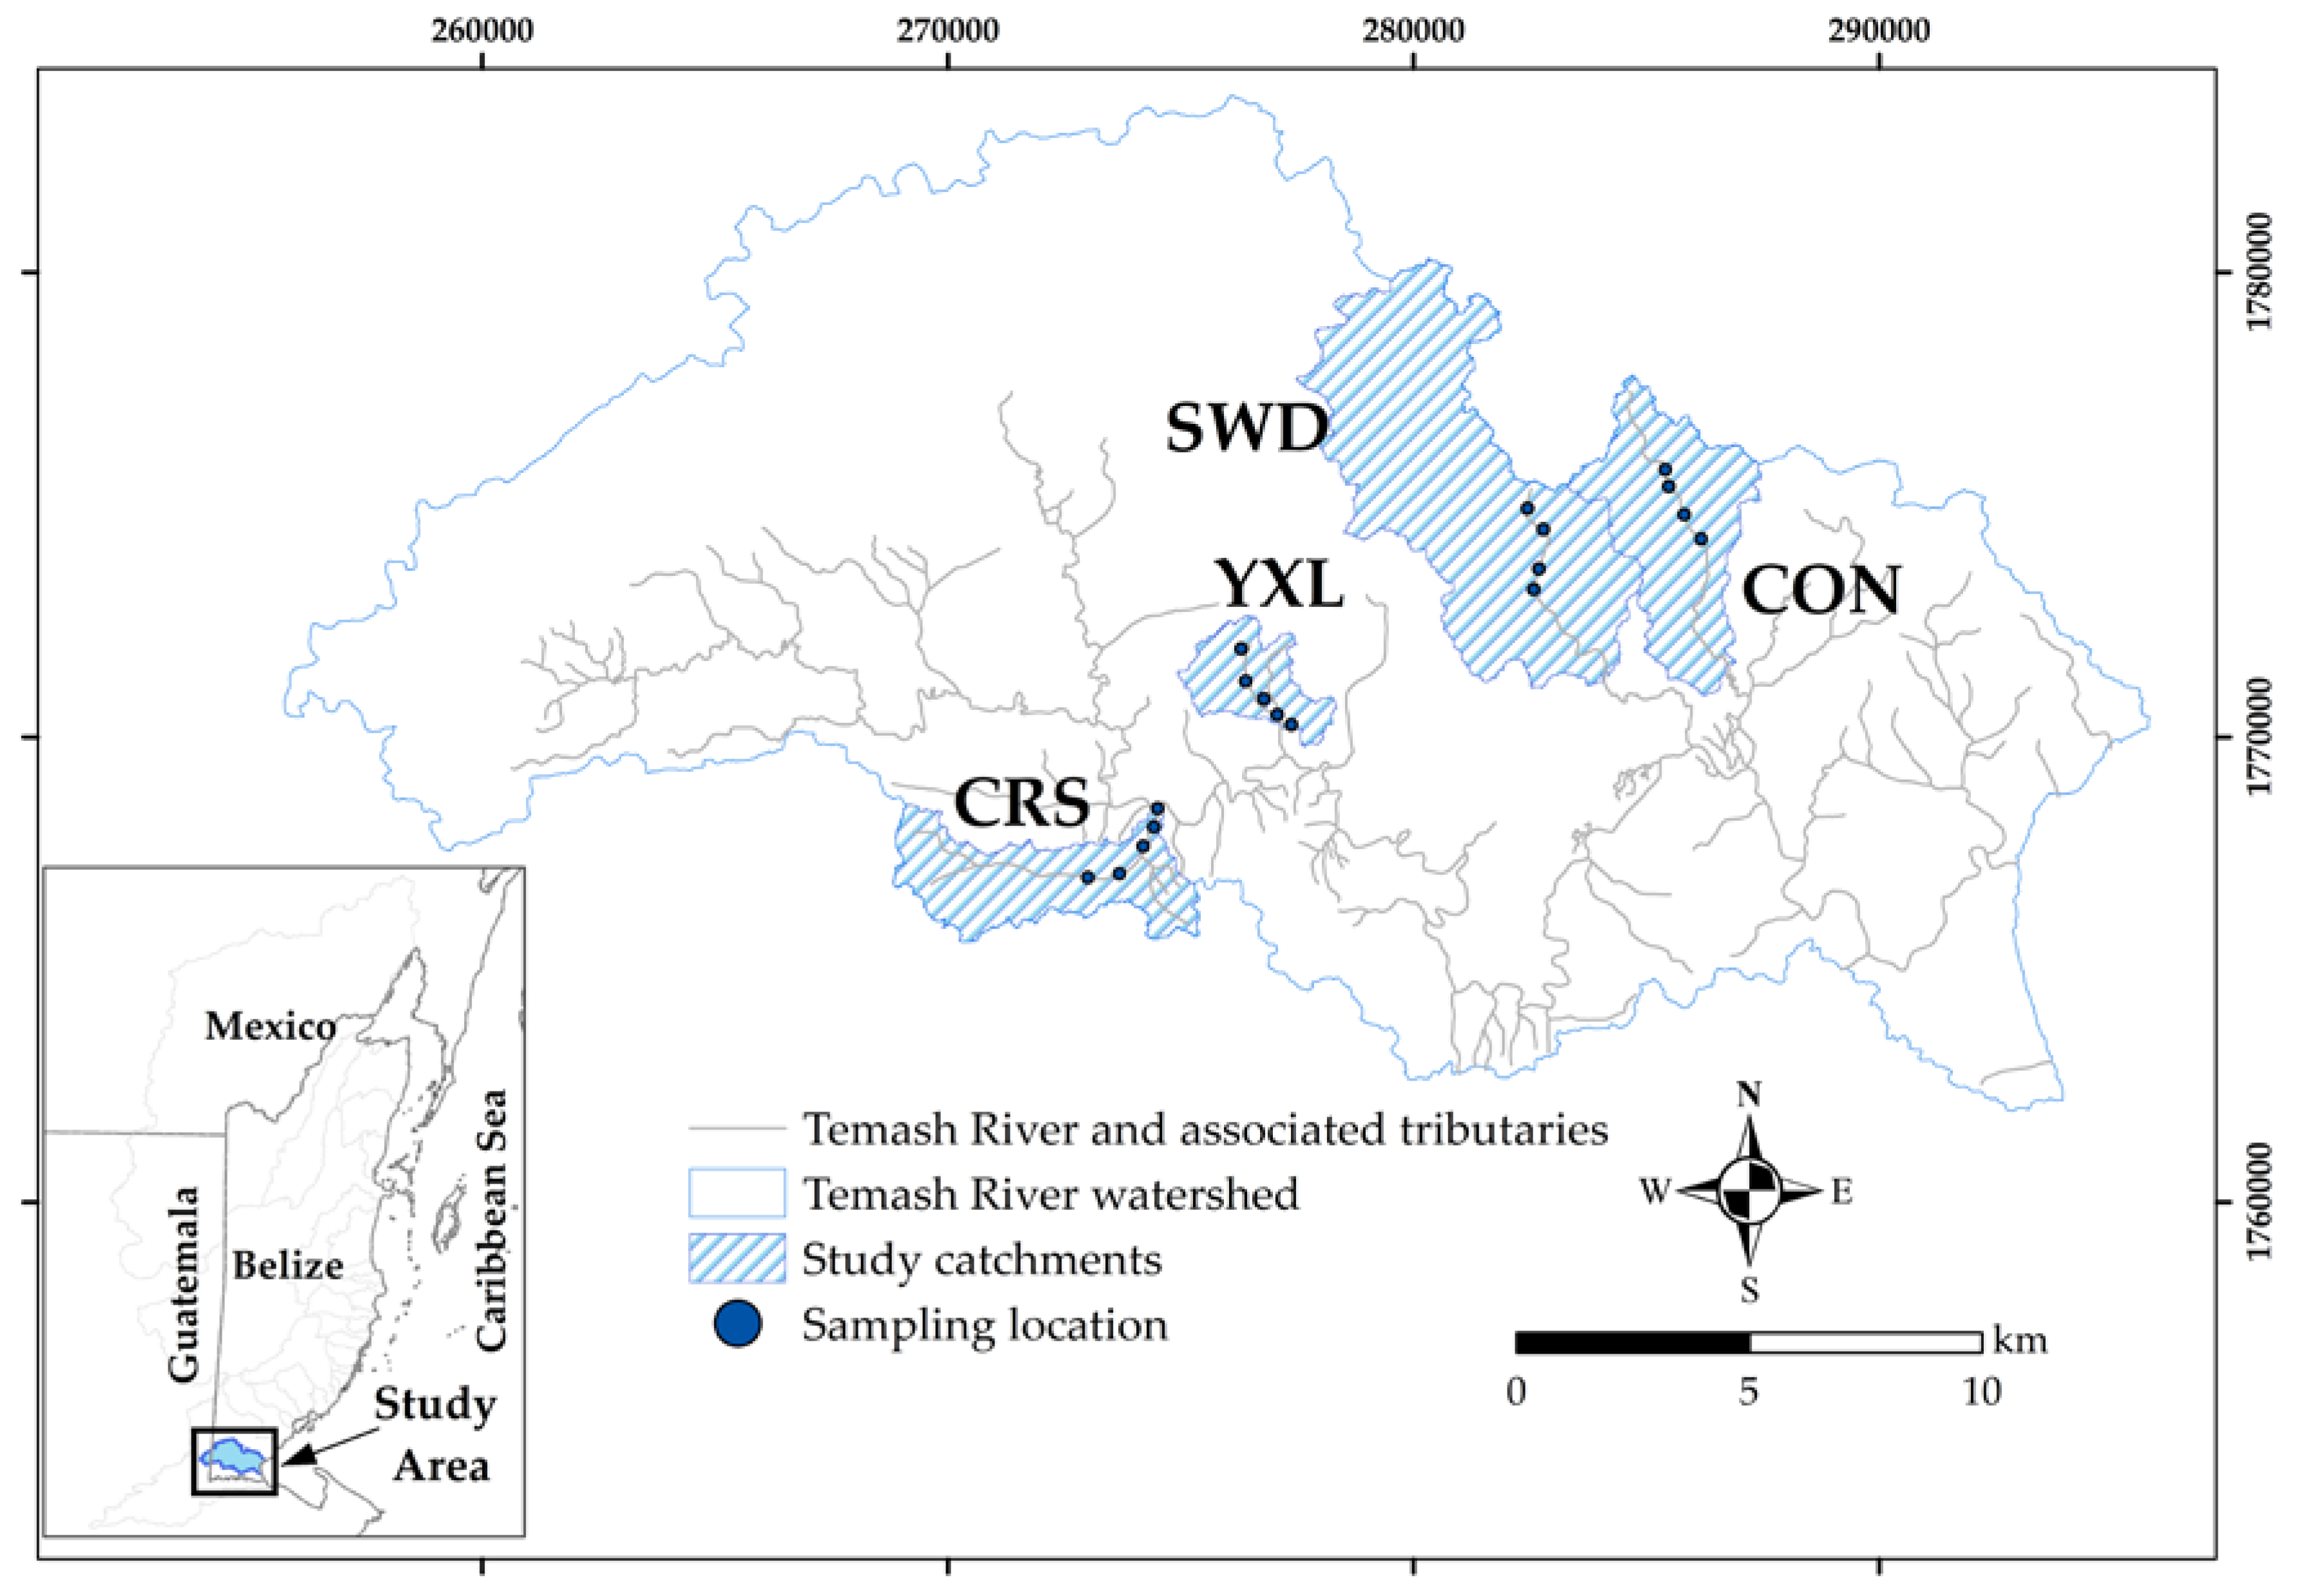
2.1. Study Site

The headwaters of the binational Temash River begin in Guatemala and flow eastward across southern Belize to the Caribbean Sea and Gulf of Honduras (Figure 1). Its watershed is part of the larger watershed of the Mesoamerican Barrier Reef, the 2nd largest barrier reef in the world. Approximately 400 km2 of the watershed’s 460 km2 are in Belize, and the Temash is one of 16 major watersheds in Belize. It is one of only two such major watersheds in Belize that have never been instrumented with a stream gauge or other hydrologic monitoring equipment [31].
The lower reaches of the Temash River lie within the Sarstoon-Temash National Park. The national park is comanaged by the government of Belize and the local communities within the park’s buffer zone. The lower reaches of the watershed also possess large stands of red mangrove (Rhizophora mangle) and the only documented Sphagnum bogs in lowland Central America [32].

2.2. Catchment Selection, Delineation, and Characterization

We delineated the catchments of four major 2nd order tributaries of the Temash River. Crique Sarco Creek (CRS) and Yax Cal Creek (YXL) drain into the middle reaches of the Temash River. Sunday Wood Creek (SWD) and Conejo Creek (CON) drain into the large R. mangle estuary within the lower reaches of the Temash River. Upstream sampling sites (e.g., YXL01, CRS01, SWD01, and CON01) were selected during the dry season and represent the farthest upstream reaches that retained water during the dry season. Downstream sites are near the confluence with the Temash River for CRS and YXL and upstream of the lowland mangrove swamp for SWD and CON.
A geographic information system (ArcView and ArcInfo, ESRI, Redlands, CA, USA) was used to delineate watershed boundaries for each study stream within the Temash River watershed using a 30-m resolution SRTM-derived digital elevation model produced jointly by the U.S. Geological Survey and Inter-American Biodiversity Information Network. Smaller catchments were delineated above each sampling point within the larger stream watershed. Distributions of soil types within each catchment were derived from a digitized version of the 1:250,000 map of the soils of Belize [33].

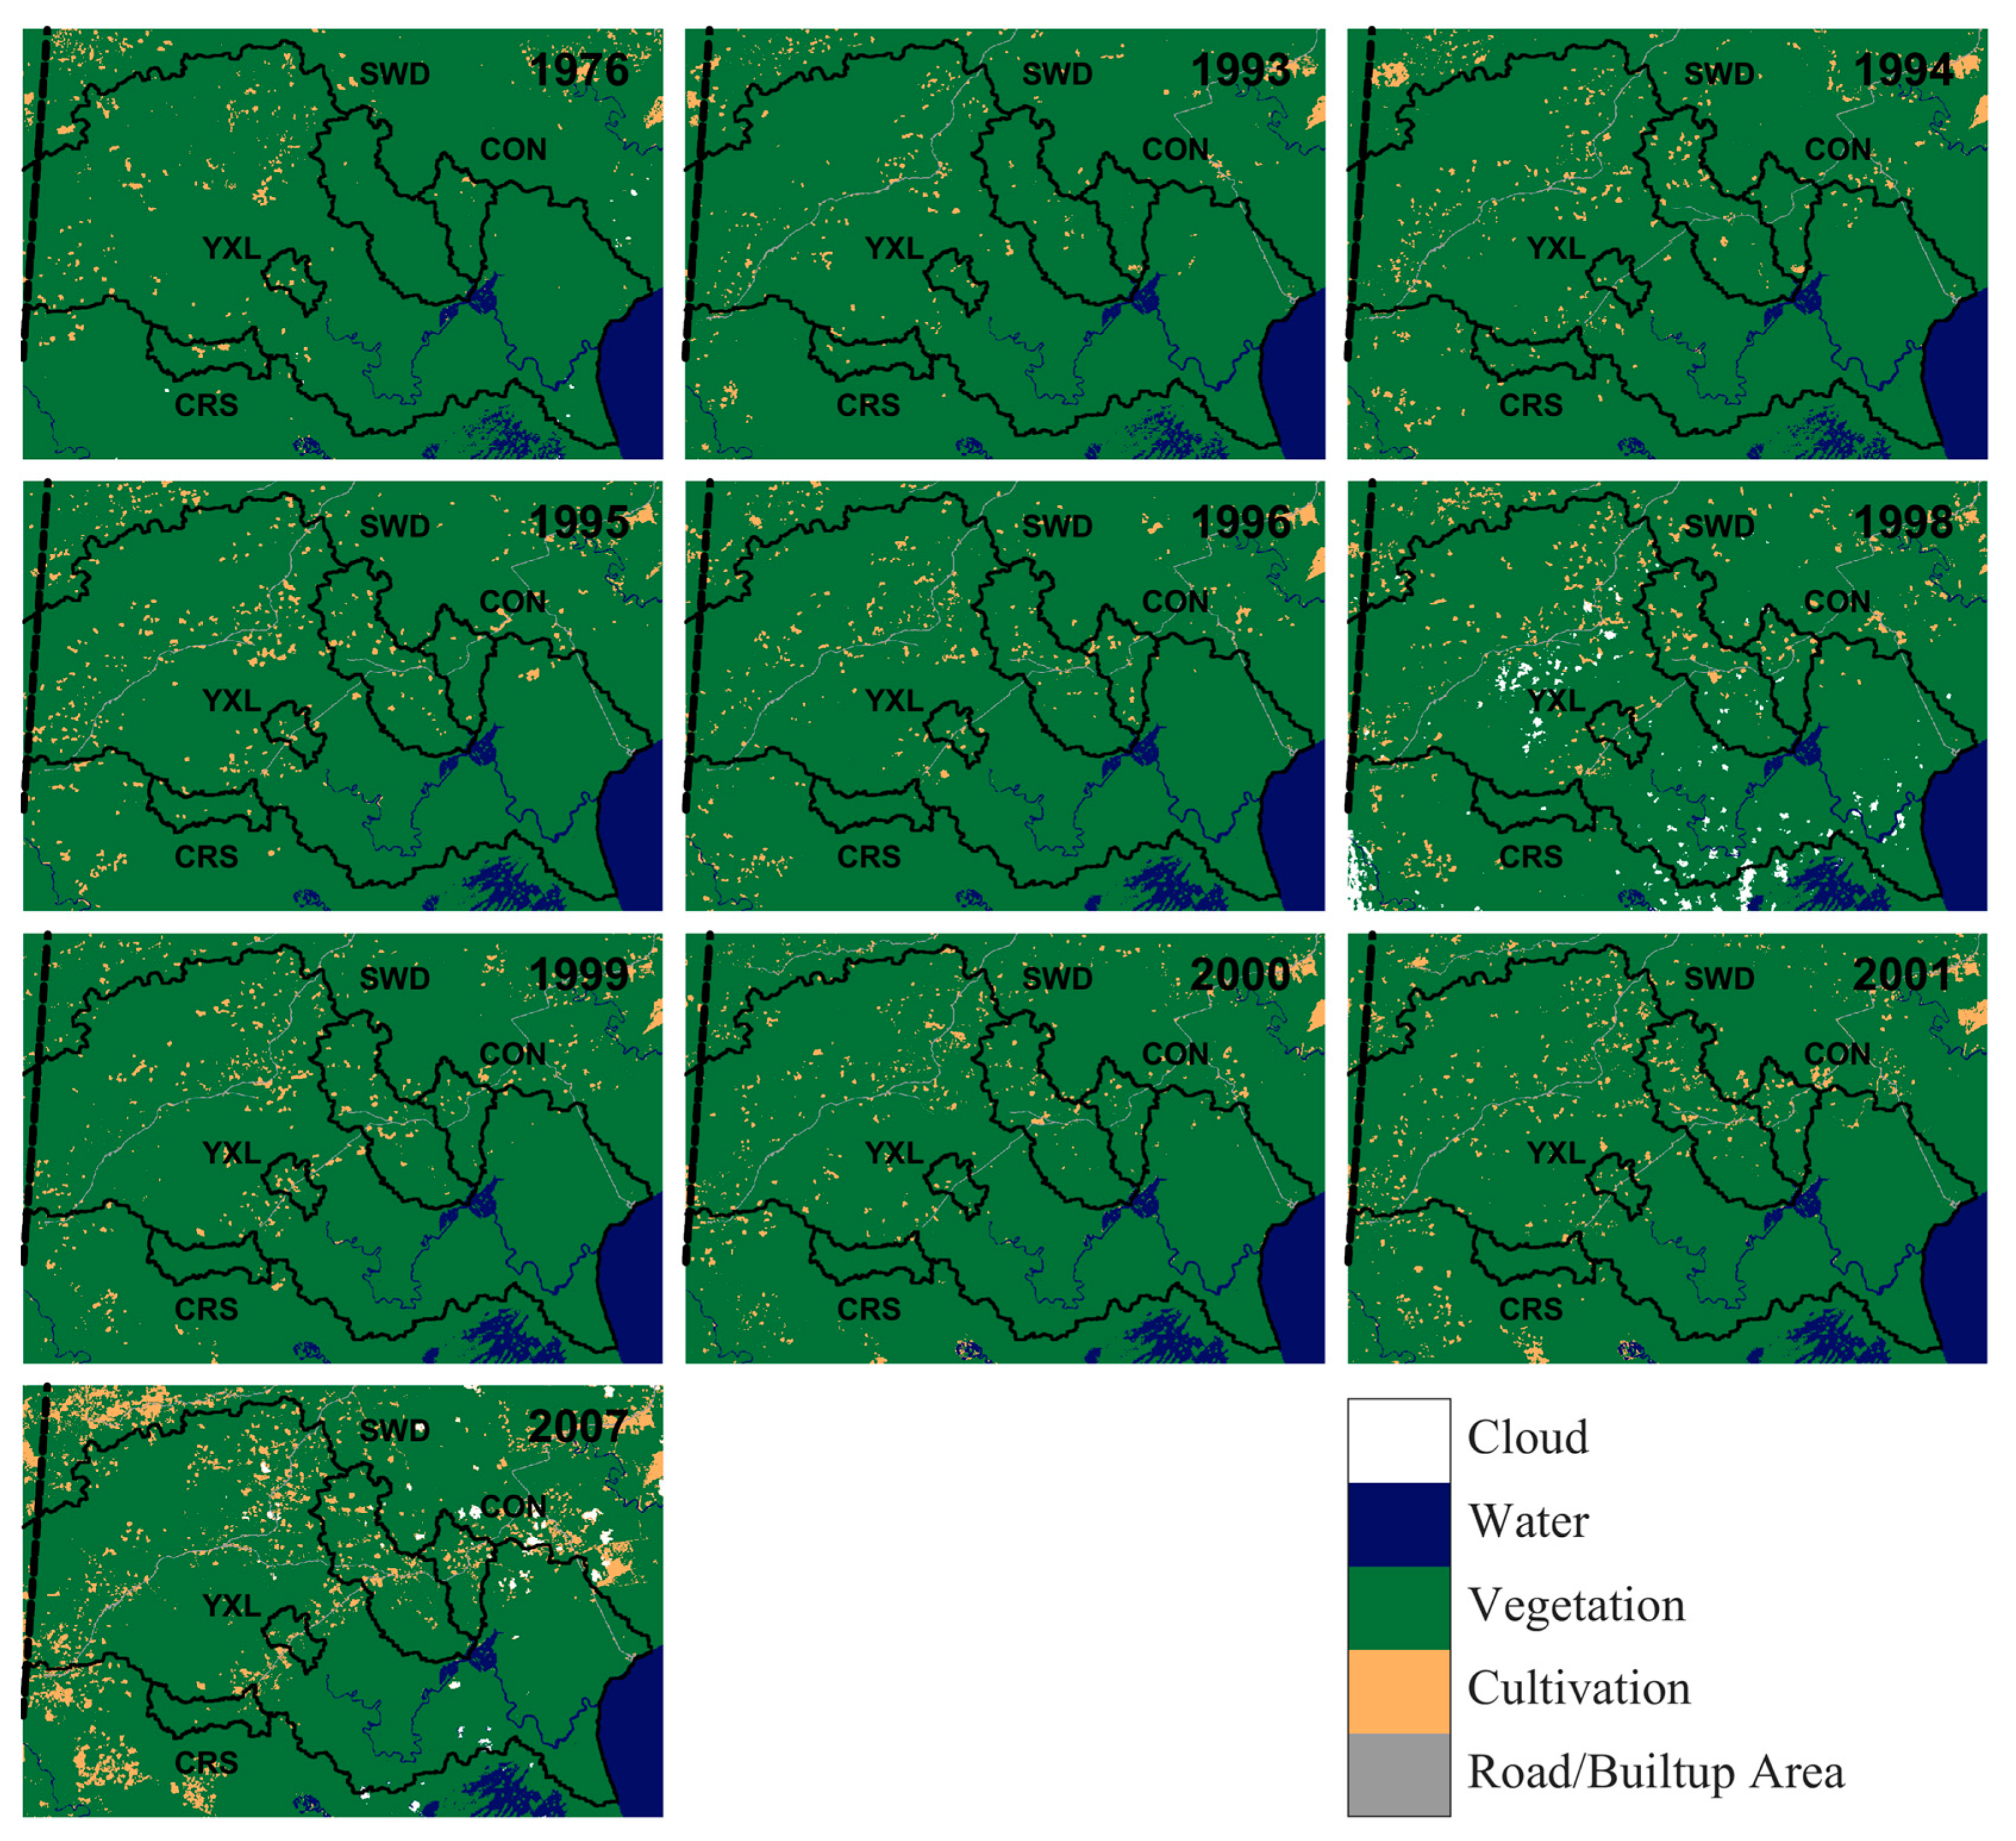
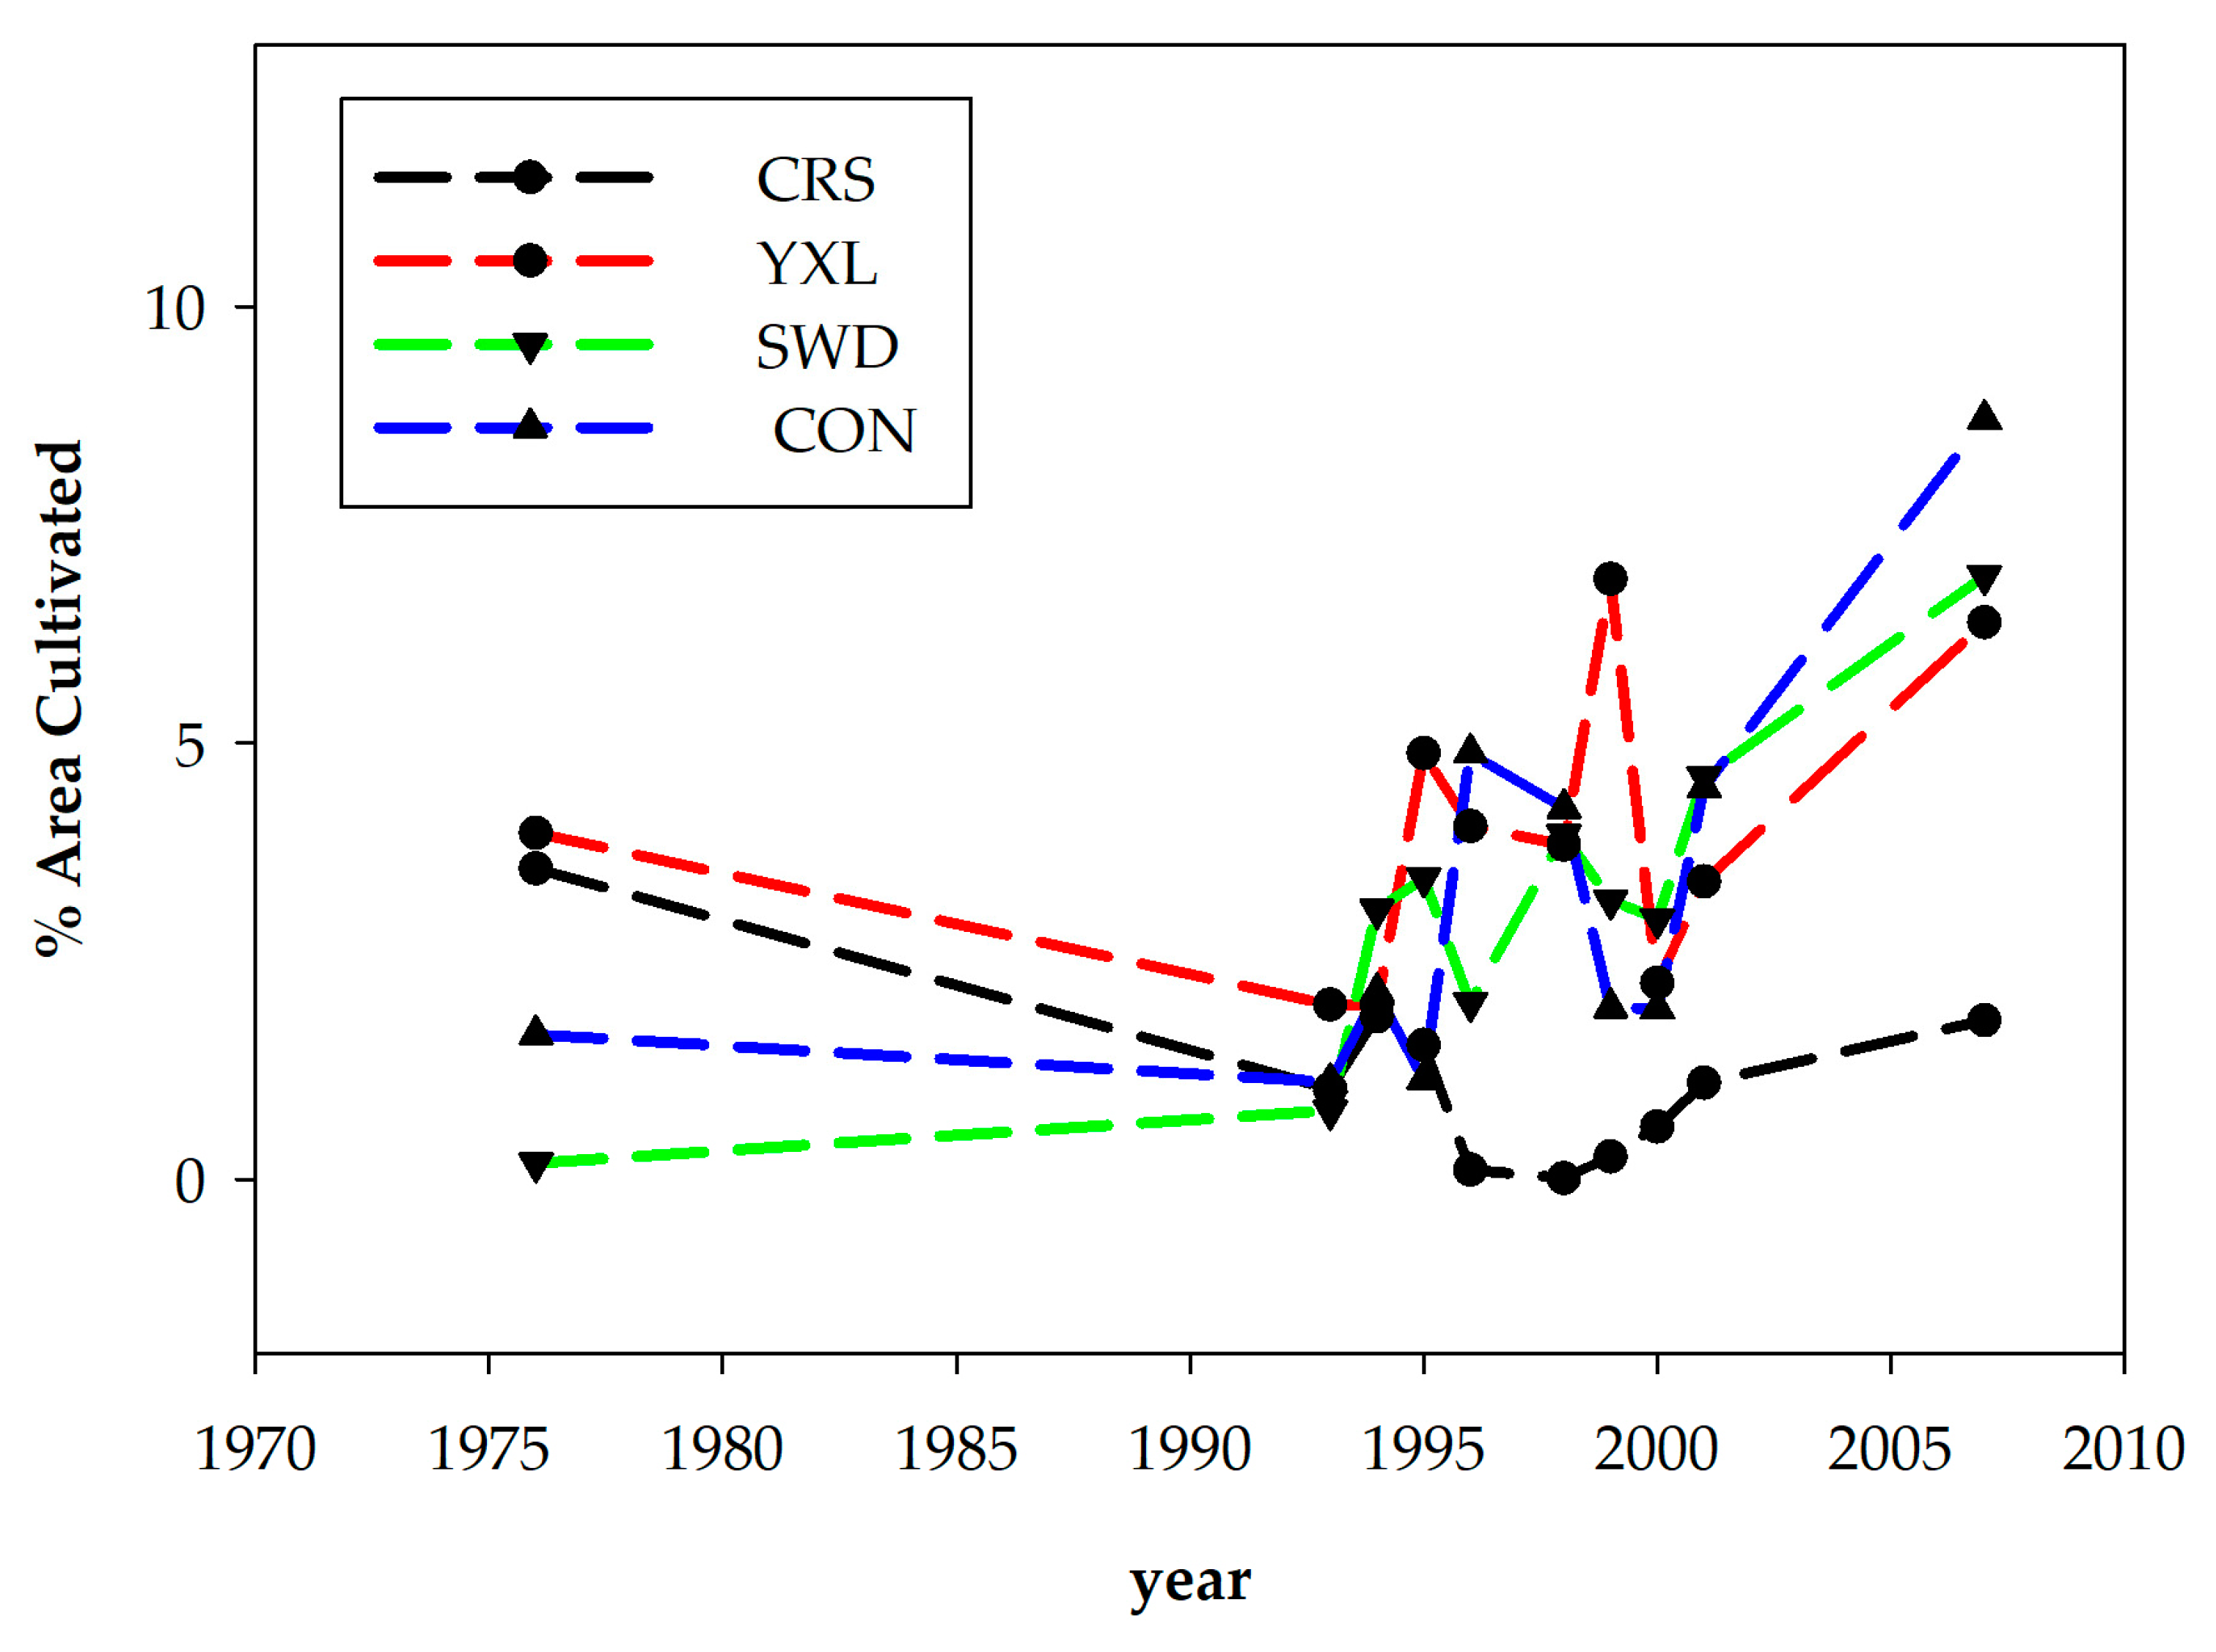
2.3. Land Use and Land Cover Analysis

To quantify the amount of active swidden agriculture we analyzed remote sensing imagery for the study area. We obtained remote sensing images from the online Landsat archive of the U.S. Geological Survey [34] and a SPOT (Satellite Pour l’Observation de la Terre) image from the time period from 1976 to 2007, selecting a total of nine Landsat images and 1 SPOT image with minimal cloud cover (Table S1). To avoid issues associated with vegetation phenology, all images were taken from a 10-week window during the height of the dry season, a time when Maya farmers cut and dry their forest patches in preparation for burning and planting.
The Landsat images (Level 1 product) have a spatial resolution of 30 m. The SPOT image (Level 1B product) has a spatial resolution of ~23 m, which is georeferenced and resampled to 30 m, matching the Landsat images. To carry out remote-sensing image classification, training, and test data were selected randomly and verified through visual interpretation of the Landsat images and comparing Google Earth images as well as with field data. Details of the methods used for image classification are provided elsewhere [30,35,36]. In summary, we tested two classifiers: maximum likelihood classification (MLC) using MATLAB discriminant analysis [37] and support vector machine (SVM) implemented through the Library for Support Vector Machines (LIBSVM) MATLAB tool [38]. The two classifiers—MLC and SVM—returned similar classification accuracies, ranging from 93 to 98% for MLC and 96 to 99% for SVM. The SVM classification tended to overestimate cultivation area for this region. Thus, further processing was based on the results of MLC. For this analysis, we did not apply the median filter to the class maps because the individual patches under cultivation in the study watersheds and the larger Temash River watershed are relatively small and very sensitive to the median filter. The final class maps contained five land cover types: road/built-up area, cultivation, vegetation, water, and cloud (for some years).

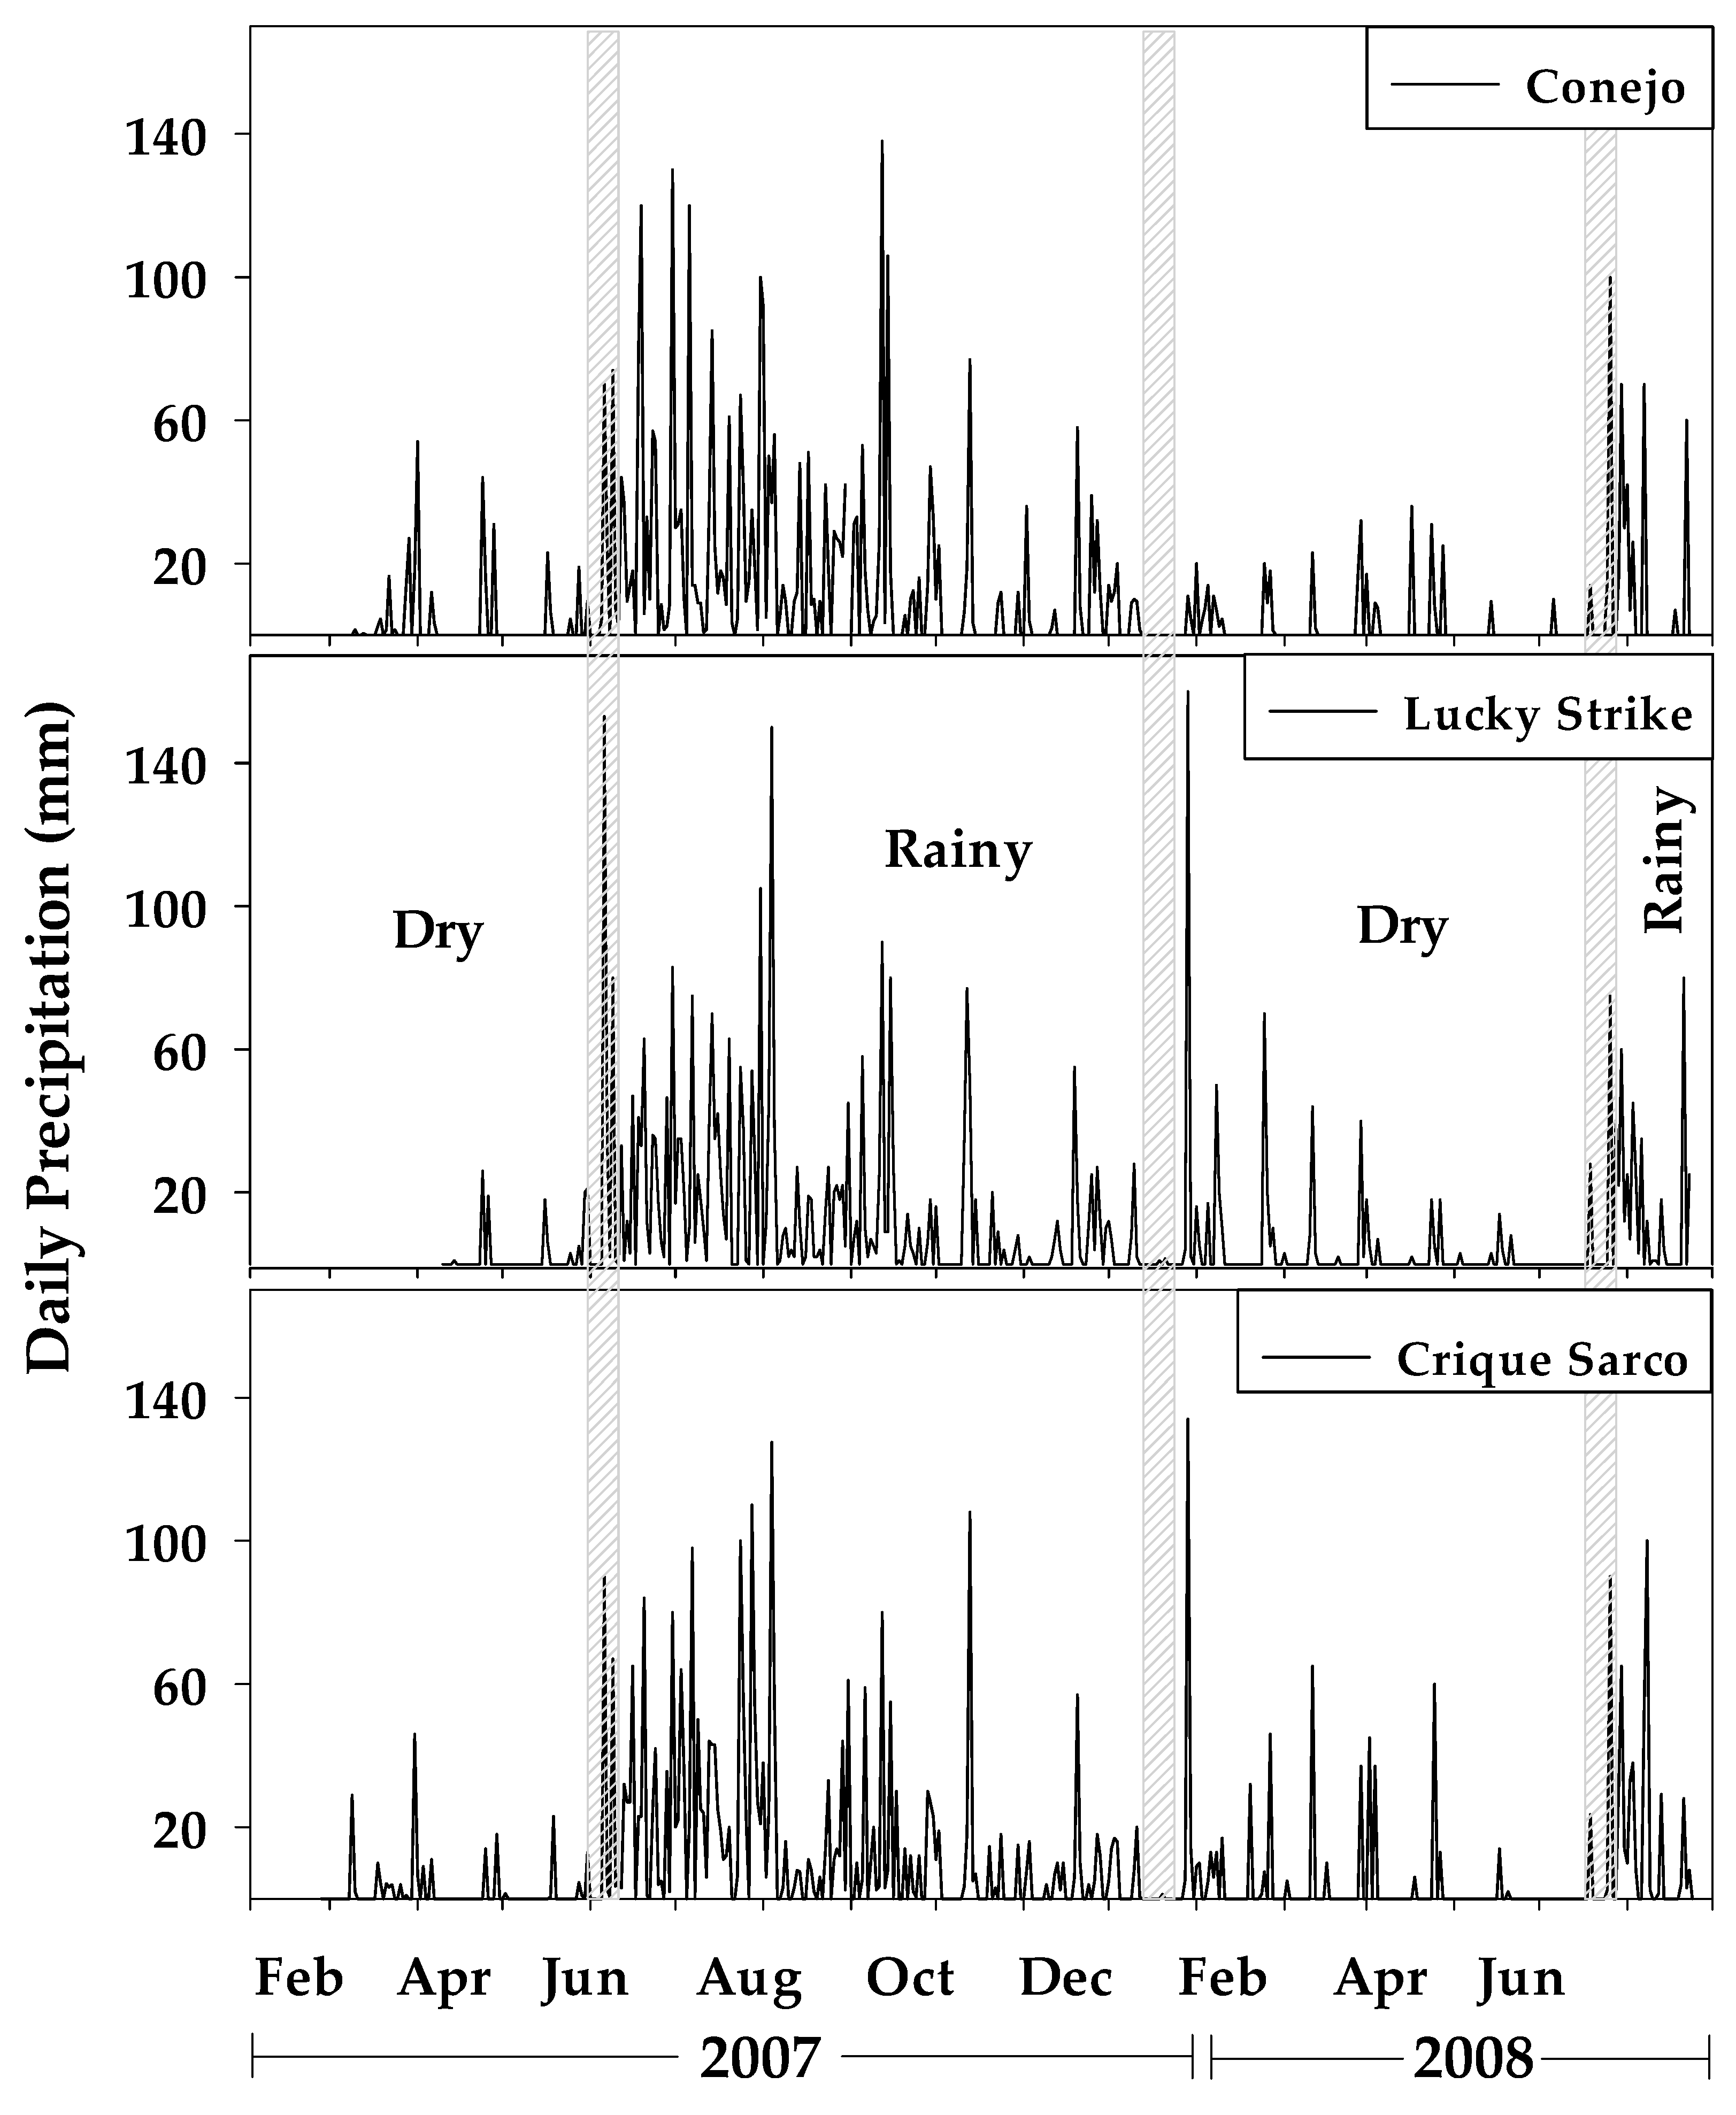
2.4. Annual Rainfall Pattern

A rain gauge (Tru-Chek® (supplier, city, country), graduated 1–150 mm) was installed in each of three communities within the CRS, SWD and CON catchments (Figure 1) in February 2007, and monitored through June 2008. Rain gauges were positioned in the open, >5 m from thatch-roofed structures. Total rainfall was recorded daily. The transition between the dry and rainy seasons in the Temash River watershed was determined using methods described in [39]. A 5-day running mean was calculated for total rainfall at each station. The onset (or end) of the rainy season had to satisfy three criteria: (1) mean daily precipitation was more (or less) than 4.0 mm; (2) six out of eight of the preceding (or subsequent) days must have had mean precipitation less (or more) than 3.5 mm; and (3) six out of eight subsequent (or preceding) days must have had mean precipitation more (or less) than 4.5 mm [39].

2.5. Instantaneous Discharge

Instantaneous discharge (m3 s−1) at each sampling site was estimated during each sampling event using the float method [40]. Measurements were made irrespective of flow conditions and as such, do not represent a full expression of the hydrograph during flood events. Mean surface flow velocity (m s−1) was measured with a surface float and adjusted (multiplied by 0.85) to estimate mean velocity. The average flow velocity of two to four floats was used to estimate mean velocity. The mean velocity was then multiplied by the cross-sectional area of the stream channel (m2) at the time of sampling to calculate the instantaneous discharge rate (m3 s−1) [40].

2.6. Sample Collection and Laboratory Analysis

Water samples were collected using a modified synoptic sampling design [41] to achieve both spatial coverage and longitudinal sampling within each of the study catchments. Samples were collected twice per month between April 2007 and June 2008, except during October 2007. Each sampling event included longitudinal samples collected along the length of each stream, separated by approximately 1 stream kilometer. Individual streams were sampled within 1 to 3 days of one another. Water samples for dissolved nutrients were filtered in the field through 0.7-μm glass fiber filters and collected in acid-washed 60-mL high-density polyethylene bottles. Samples for dissolved inorganic N (DIN) analyses were preserved with ~20 μL of sulfuric acid to bring sample pH to <2. Samples for total soluble N (TSN) and P (TSP) and soluble reactive phosphorus (SRP) were not treated with acid. Whole (unfiltered) water samples for total nitrogen (TN) and total phosphorus (TP) were collected during three dry season months and four rainy season months. Samples were placed on ice in the field, frozen within 24 h and analyzed in the Land Use and Environmental Change Institute’s lab at the University of Florida within 3 months of collection.
Nutrient concentrations were analyzed on a Technicon Autoanalyzer II with a single-channel colorimeter using standard colorimetric techniques. DIN (NO3 + NO2) was measured by cadmium reduction, and SRP concentrations were analyzed using the ascorbic acid–ammonium molybdate method [42]. TSP and TP were measured on filtered (and unfiltered) samples by ascorbic acid–ammonium molybdate colorimetry following acidic persulfate digestion. TSN and TN was measured by cadmium reduction, after persulfate digestion on filtered and unfiltered samples, respectively [42].
Instrument response was evaluated immediately following calibration, and thereafter, following every 10 samples and at the end of each analytical run by analyzing a calibration standard and check blank. Instrument detection limit for each analyte was calculated based on International Conference on Harmonisation (ICH) guidelines using the standard deviation of the response and the slope of the calibration curve. Precision was estimated from duplicate analyses. Detection limits and analytical precision estimates for each analyte were SRP detection limit = 0.3 ppb, precision = 9%; TSP and TP detection limit = 0.5 ppb, precision = 6.5%; DIN detection limit = 2.0 ppb, precision = 6.5%; and TSN and TN detection limit = 16.9 ppb, precision = 2.9%.

2.7. Nutrient Fluxes and Annualized Nutrient Export

Instantaneous nutrient fluxes were calculated for each sampling event by multiplying the instantaneous discharge (m3 s−1) by the nutrient concentration (mg L−1 = g m−3) to obtain g s−1 and are expressed as load (kg day−1). Instantaneous discharge rates and instantaneous nutrient fluxes were assumed to represent the average discharge and flux for each sampling interval (~15 days except in months when only a single sample was collected). Annual nutrient export (kg ha−1 year−1) from each study catchment was calculated by multiplying instantaneous fluxes (kg day−1) by the number of days in each sampling interval, summing the resulting nutrient load (kg) over the year, and dividing by catchment area (ha).

2.8. Statistical Analyses

Seasonal discharge estimates were not normally distributed (Shapiro–Wilk normality test; W = 0.616; p < 0.050). Differences in discharge between the dry and rainy seasons were determined using the nonparametric Mann–Whitney U statistic (p-value ≤ 0.05). Correlations between discharge and antecedent rainfall (1-day, 7-day, 14-day, and 28-day prior) were determined using Spearman’s rank order correlation coefficient.
Seasonal differences in nutrient concentrations within each catchment were tested by pooling the dry season and rainy season nutrient concentrations from the most upstream (e.g., YXL01) and farthest downstream (e.g., YXL05) sampling sites. Significant differences were assessed using t-tests (p-value ≤ 0.05). In cases for which nutrient concentrations were not normally distributed, the nonparametric Mann–Whitney U statistic (p-value ≤ 0.05) was used to test for significant differences between seasons. Within-stream differences between upstream and downstream sampling sites were also assessed for the dry and rainy seasons using the same test parameters.

3. Results

3.1. Catchment Characteristics and Land Cover Change

The four study catchments differ in size, geology, and soils. Geology varies across the catchments and includes clastic sedimentary rocks, limestone, and alluvial deposits (Table 1). Land cover in the four catchments is dominated by agricultural lands [43]. The classification system used to identify agricultural lands by [43] included areas under active cultivation, abandoned fields, and areas of secondary forest growth previously used for cultivation. We refer to this as historical agricultural lands for this study (Table 1). YXL and CRS Creeks have the highest overall percent land cover in agriculture (77% and 75%, respectively). Agricultural lands in SWD and CON catchments comprise approximately 60% of the total land cover (Table 1).
Whereas overall available historic agricultural land, as quantified by [43], dominated land cover in the four study catchments, the total amount of actively cultivated fields during any given year between 1976 and 2007 was low (Figure 2 and Figure 3). The area under cultivation (as a % of the total area) was close to 5% across all study catchments except CRS during 2007 (Table 1, Figure 3). Although an increase in the area under active cultivation was observed between 2001 and 2007 (Figure 3), this total area remains less than 10% of the total area in the study catchments.

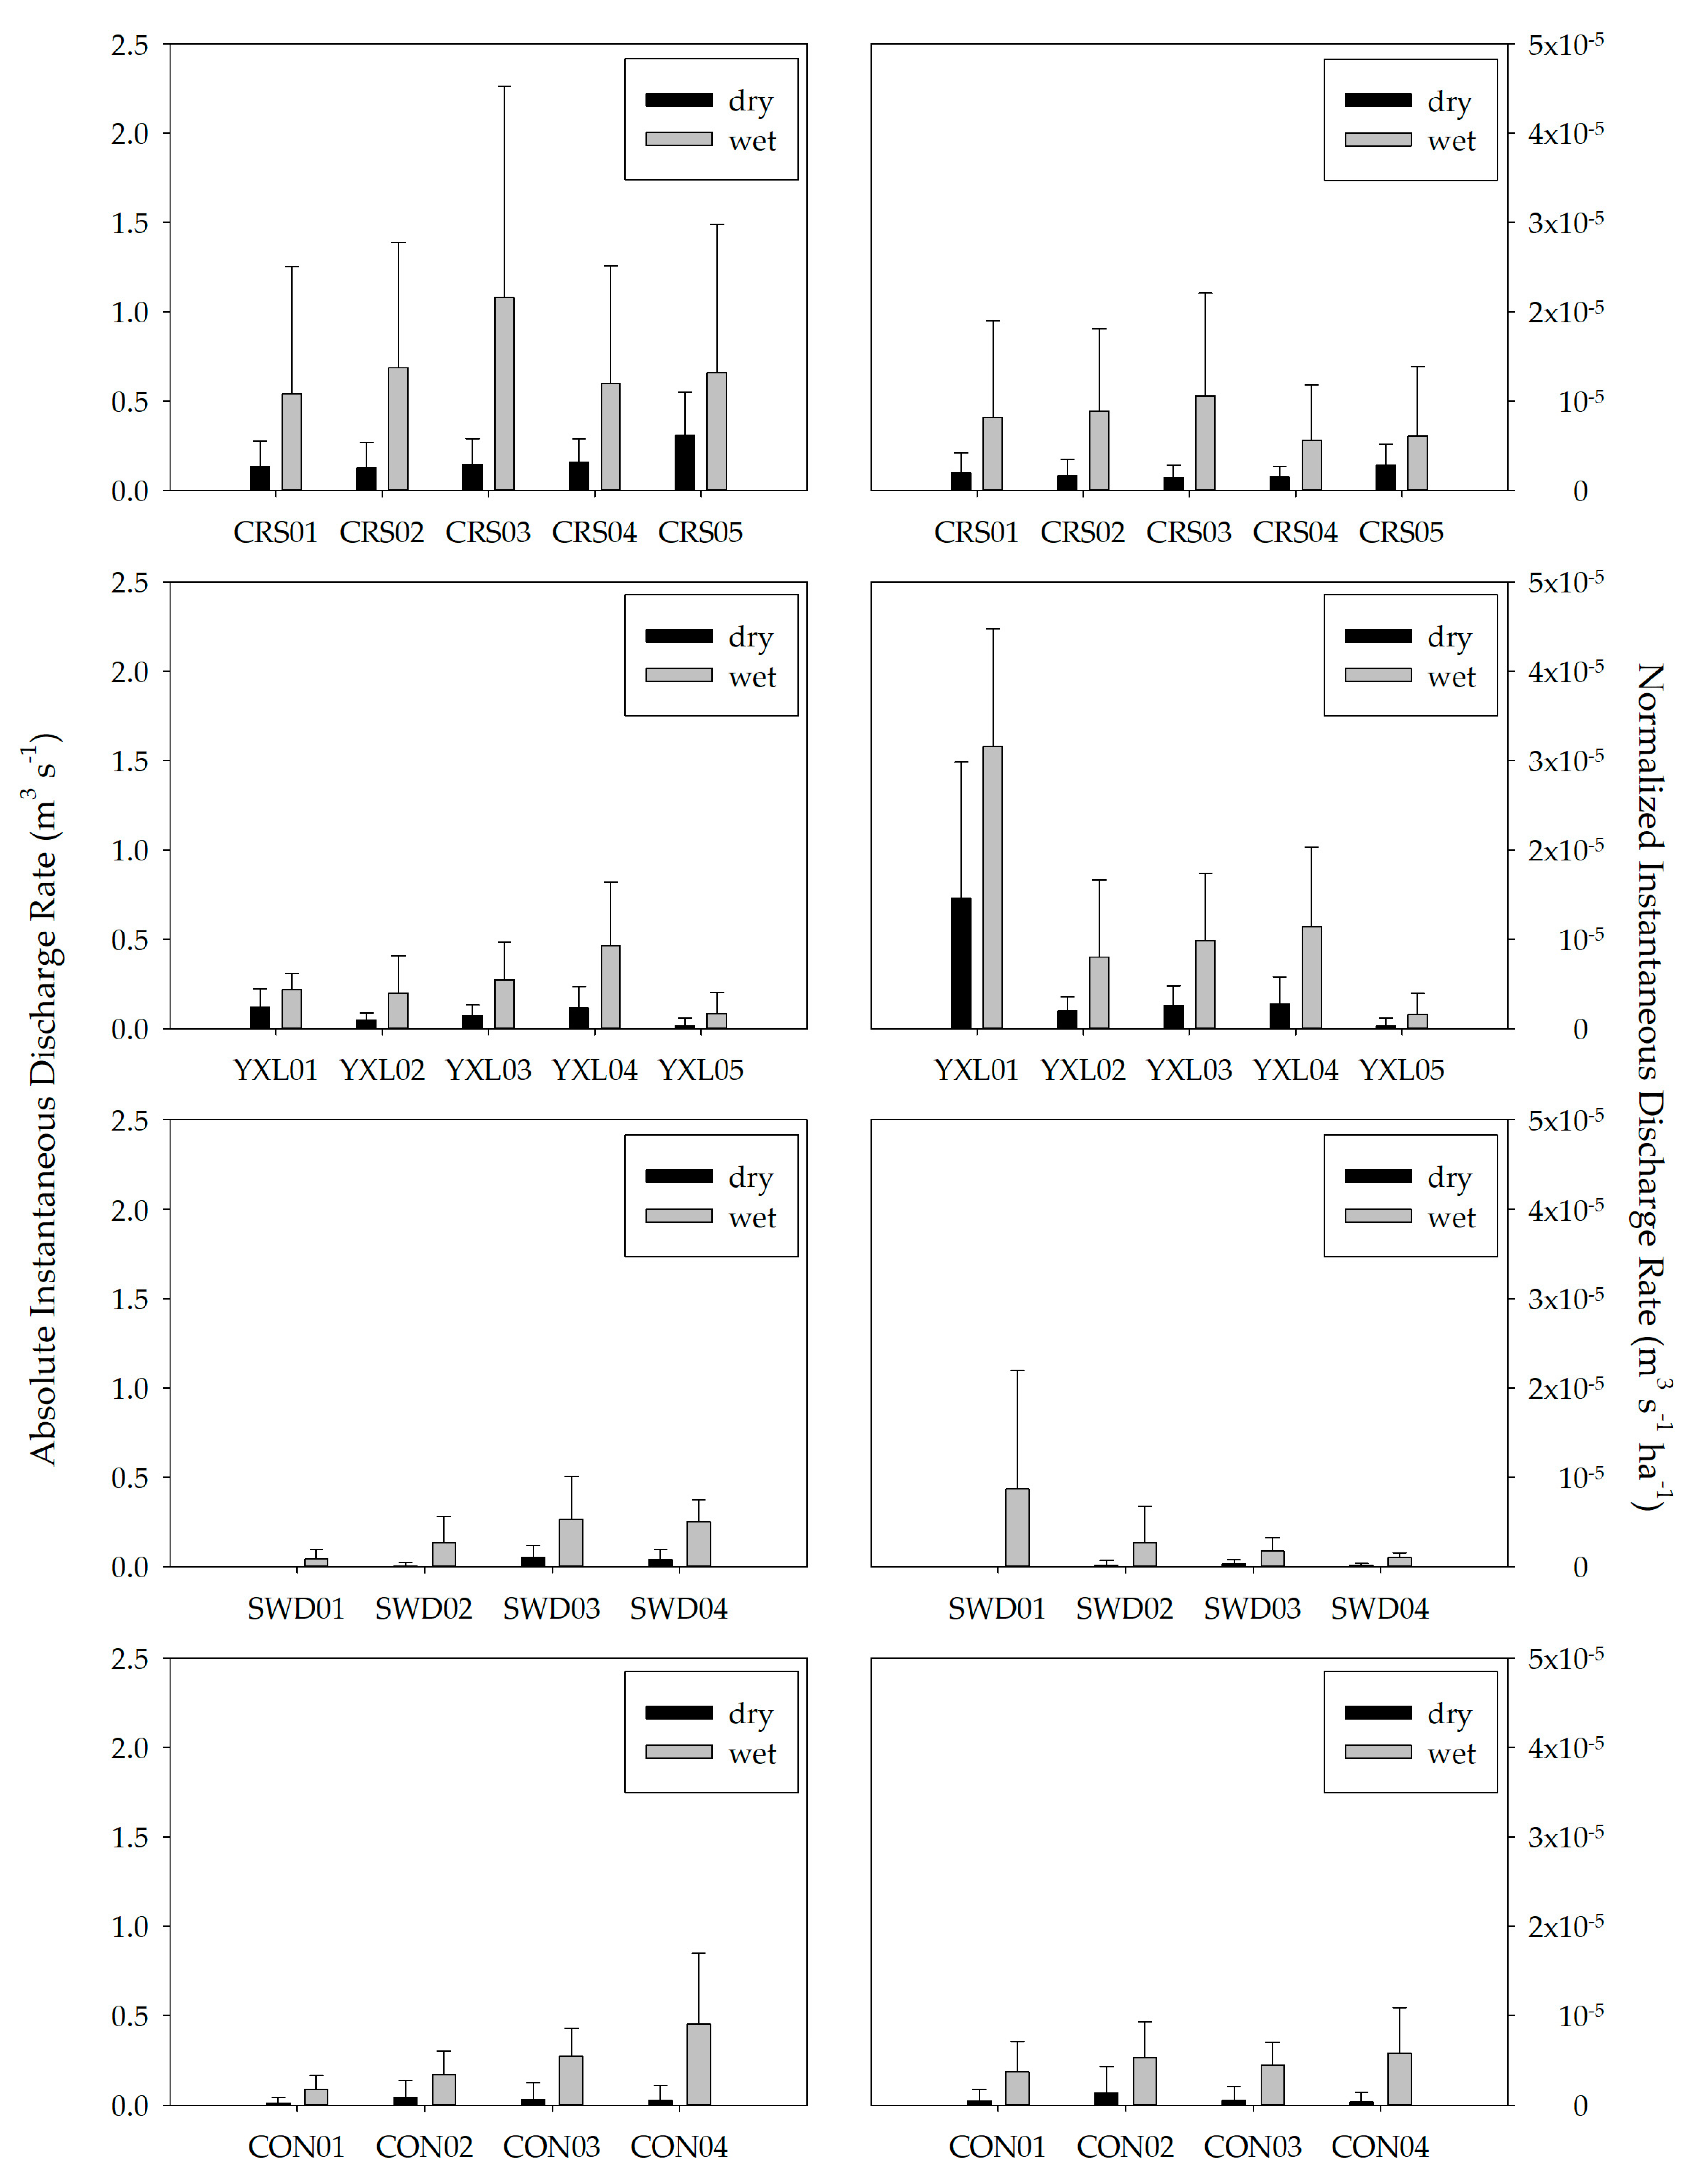
3.2. Precipitation and Seasonal Stream Discharge

The rainy season began on June 4 and the dry season started on 19 December 2007 (Figure 4). The 2007–2008 dry season lasted until 20 May 2008. Total precipitation from the onset of the rainy season in 2007 to the onset of the rainy season in 2008 at each of the three rain gauge stations was >3600 mm, and >80% of the total annual rainfall fell during the rainy season.
Instantaneous discharge rates were averaged seasonally (e.g., dry vs. wet) at each sampling site within each catchment (Figure 5). Mean dry season instantaneous discharge from each catchment (i.e., the farthest downstream sampling point) ranged from 0.015 ± 0.04 m3 s−1 (YXL05) to 0.31 ± 0.24 m3 s−1 (CRS05). Wet season instantaneous discharge was greatest from the CRS catchment (0.66 ± 0.83 m3 s−1). Dry season and wet season discharge rates were significantly different across all sampling sites with the exception of CRS05, YXL01, and YXL05 (Table 2). Absolute discharge rates generally increased from upstream sites to downstream sites within each catchment (Table 2, Figure 5). Mean instantaneous discharge rates were positively correlated with antecedent rainfall, although the strength of the correlation with respect to length of the antecedent rainfall period (i.e., 1 day, 7 days, 14 days, and 28 days) differed among catchments (Table 3). Discharge rates were normalized by catchment area to remove the effect of catchment size and presented as seasonal averages (Figure 5). Normalized seasonal mean discharge rates at upstream sampling sites vary by more than three orders of magnitude during the dry season with similar variability during the wet season (Figure 5). Seasonal mean normalized discharge rates vary much less at the most downstream sampling sites (Figure 5).

3.3. Seasonal and Longitudinal Variation of In-Stream Nutrient Concentrations

Mean nutrient concentrations for the sampling sites in each study catchment are shown in Table 4 (N species) and Table 5 (P species). In the upper reaches of CRS (CRS01), TN concentrations were higher during the dry season than in the wet season (U = 0.0, p-value = 0.024). Seasonal differences in DIN, TSN, SRP, TSP, and TP were not statistically significant (p-value > 0.05) (Table 4 and Table 5). In the lower reaches of CRS (CRS05), TSN concentrations were significantly higher during the dry season than during the wet season (U = 18.5, p = 0.020). During the dry season, nutrient concentrations at upstream and downstream sites in CRS were not statistically different. During the rainy season, SRP and TSP concentrations at CRS05 were greater than at CRS01 (t = −2.824, p = 0.010 (SRP); U = 16.5, p = 0.005(TSP)). No other differences between upstream and downstream wet season nutrient concentrations in CRS were observed.
In YXL, no seasonal differences in N-species were observed at the upstream sampling site (YXL01). However, dry season concentrations of SRP (t = 4.969, p <0.001), TSP (t = 3.669, p = 0.001) and TP (t = 4.687, p < 0.001) were all significantly higher than wet season concentrations at YXL01. These seasonal differences were not observed at the downstream site, with only dry season TSN concentrations being significantly higher than wet season TSN concentrations at YXL05 (U = 28, p = 0.038). During the dry season, DIN and TSN concentrations were greater at YXL05 than at YXL01 (U = 37, p = 0.046; U = 29, p = 0.014, respectively), whereas the opposite occurred with P. Dry season concentrations at YXL01 of SRP (U = 12, p < 0.001), TSP (U = 12, p < 0.001) and TP (U = 7, p = 0.026) were all significantly greater than at YXL05. No differences in nutrient concentrations were observed between the upstream and downstream sites during the rainy season.
Nutrient concentrations in SWD varied little between the seasons. At SWD01, dry season TN was significantly greater than wet season TN (U = 1.0, p = 0.048). No other seasonal differences in nutrient concentrations were observed at the upstream or downstream sites. In addition, no longitudinal differences in nutrient concentrations were observed during the wet or dry season (Table 4 and Table 5). In CON, dry season TN concentrations were significantly greater than wet season TN concentrations at the downstream CON04 site (U = 0.0, p = 0.017). Significant differences between upstream and downstream nutrient concentrations were only observed during the wet season, with TP being significantly greater at the downstream site (t = −3.50, p = 0.025). No other longitudinal differences in nutrient concentrations were observed in CON (Table 4 and Table 5).
The contribution of DIN to the TSN pool was highly variable across seasons and across study catchments. In CRS, DIN comprised 58% of both the dry season and rainy season TSN pool at both upstream and downstream sites. TSN comprised 60% of the TN pool on average during the dry season and contributed 86% during the wet season. In YXL the average contribution of DIN to the TSN pool was between 64% and 88%. The TN pool in YXL averaged more than 60% TSN during the dry season and during the rainy season included 91% TSN. In SWD, DIN comprised 49% of the TSN pool during the dry season and more than 75% during the rainy season, with a similar pattern of DIN:TSN observed in CON. During the rainy season in both SWD and CON, DIN contributed more than 70% to the TSN pool on average. TSN comprised approximately 90% of the TN pool during the rainy season in SWD and averaged between 73% and 100% in CON.
In CRS, SRP comprised between 17% and 46% of TSP, on average, during the dry season. During the wet season, SRP averaged between 30% and 44% of TSP in CRS. TSP contributed a larger portion to the TP pool in CRS, with TSP:TP averaging between 50% and 90%. During the dry season in YXL, SRP contributed more than 85% to the TSP pool at the upstream site (YXL01). Lower ratios of SRP:TSP were observed downstream. Dry season average contributions of TSP to the TP pool were similar to SRP:TSP, whereas rainy season TSP comprised more than 90% of the TP pool. In SWD, SRP averaged between 30% and 53% of the TSP pool, regardless of season. The TSP contribution to the TP pool averaged between 38% and 63% during the dry season and between 75% and 97% during the rainy season. Dry season and wet season SRP:TSP ratios were similar among sites in CON, averaging between 32% and 55%. During the dry season, TSP contributions to the TP pool averaged between 30% and 53%, whereas the contribution averaged between 58% and 76% during the rainy season.

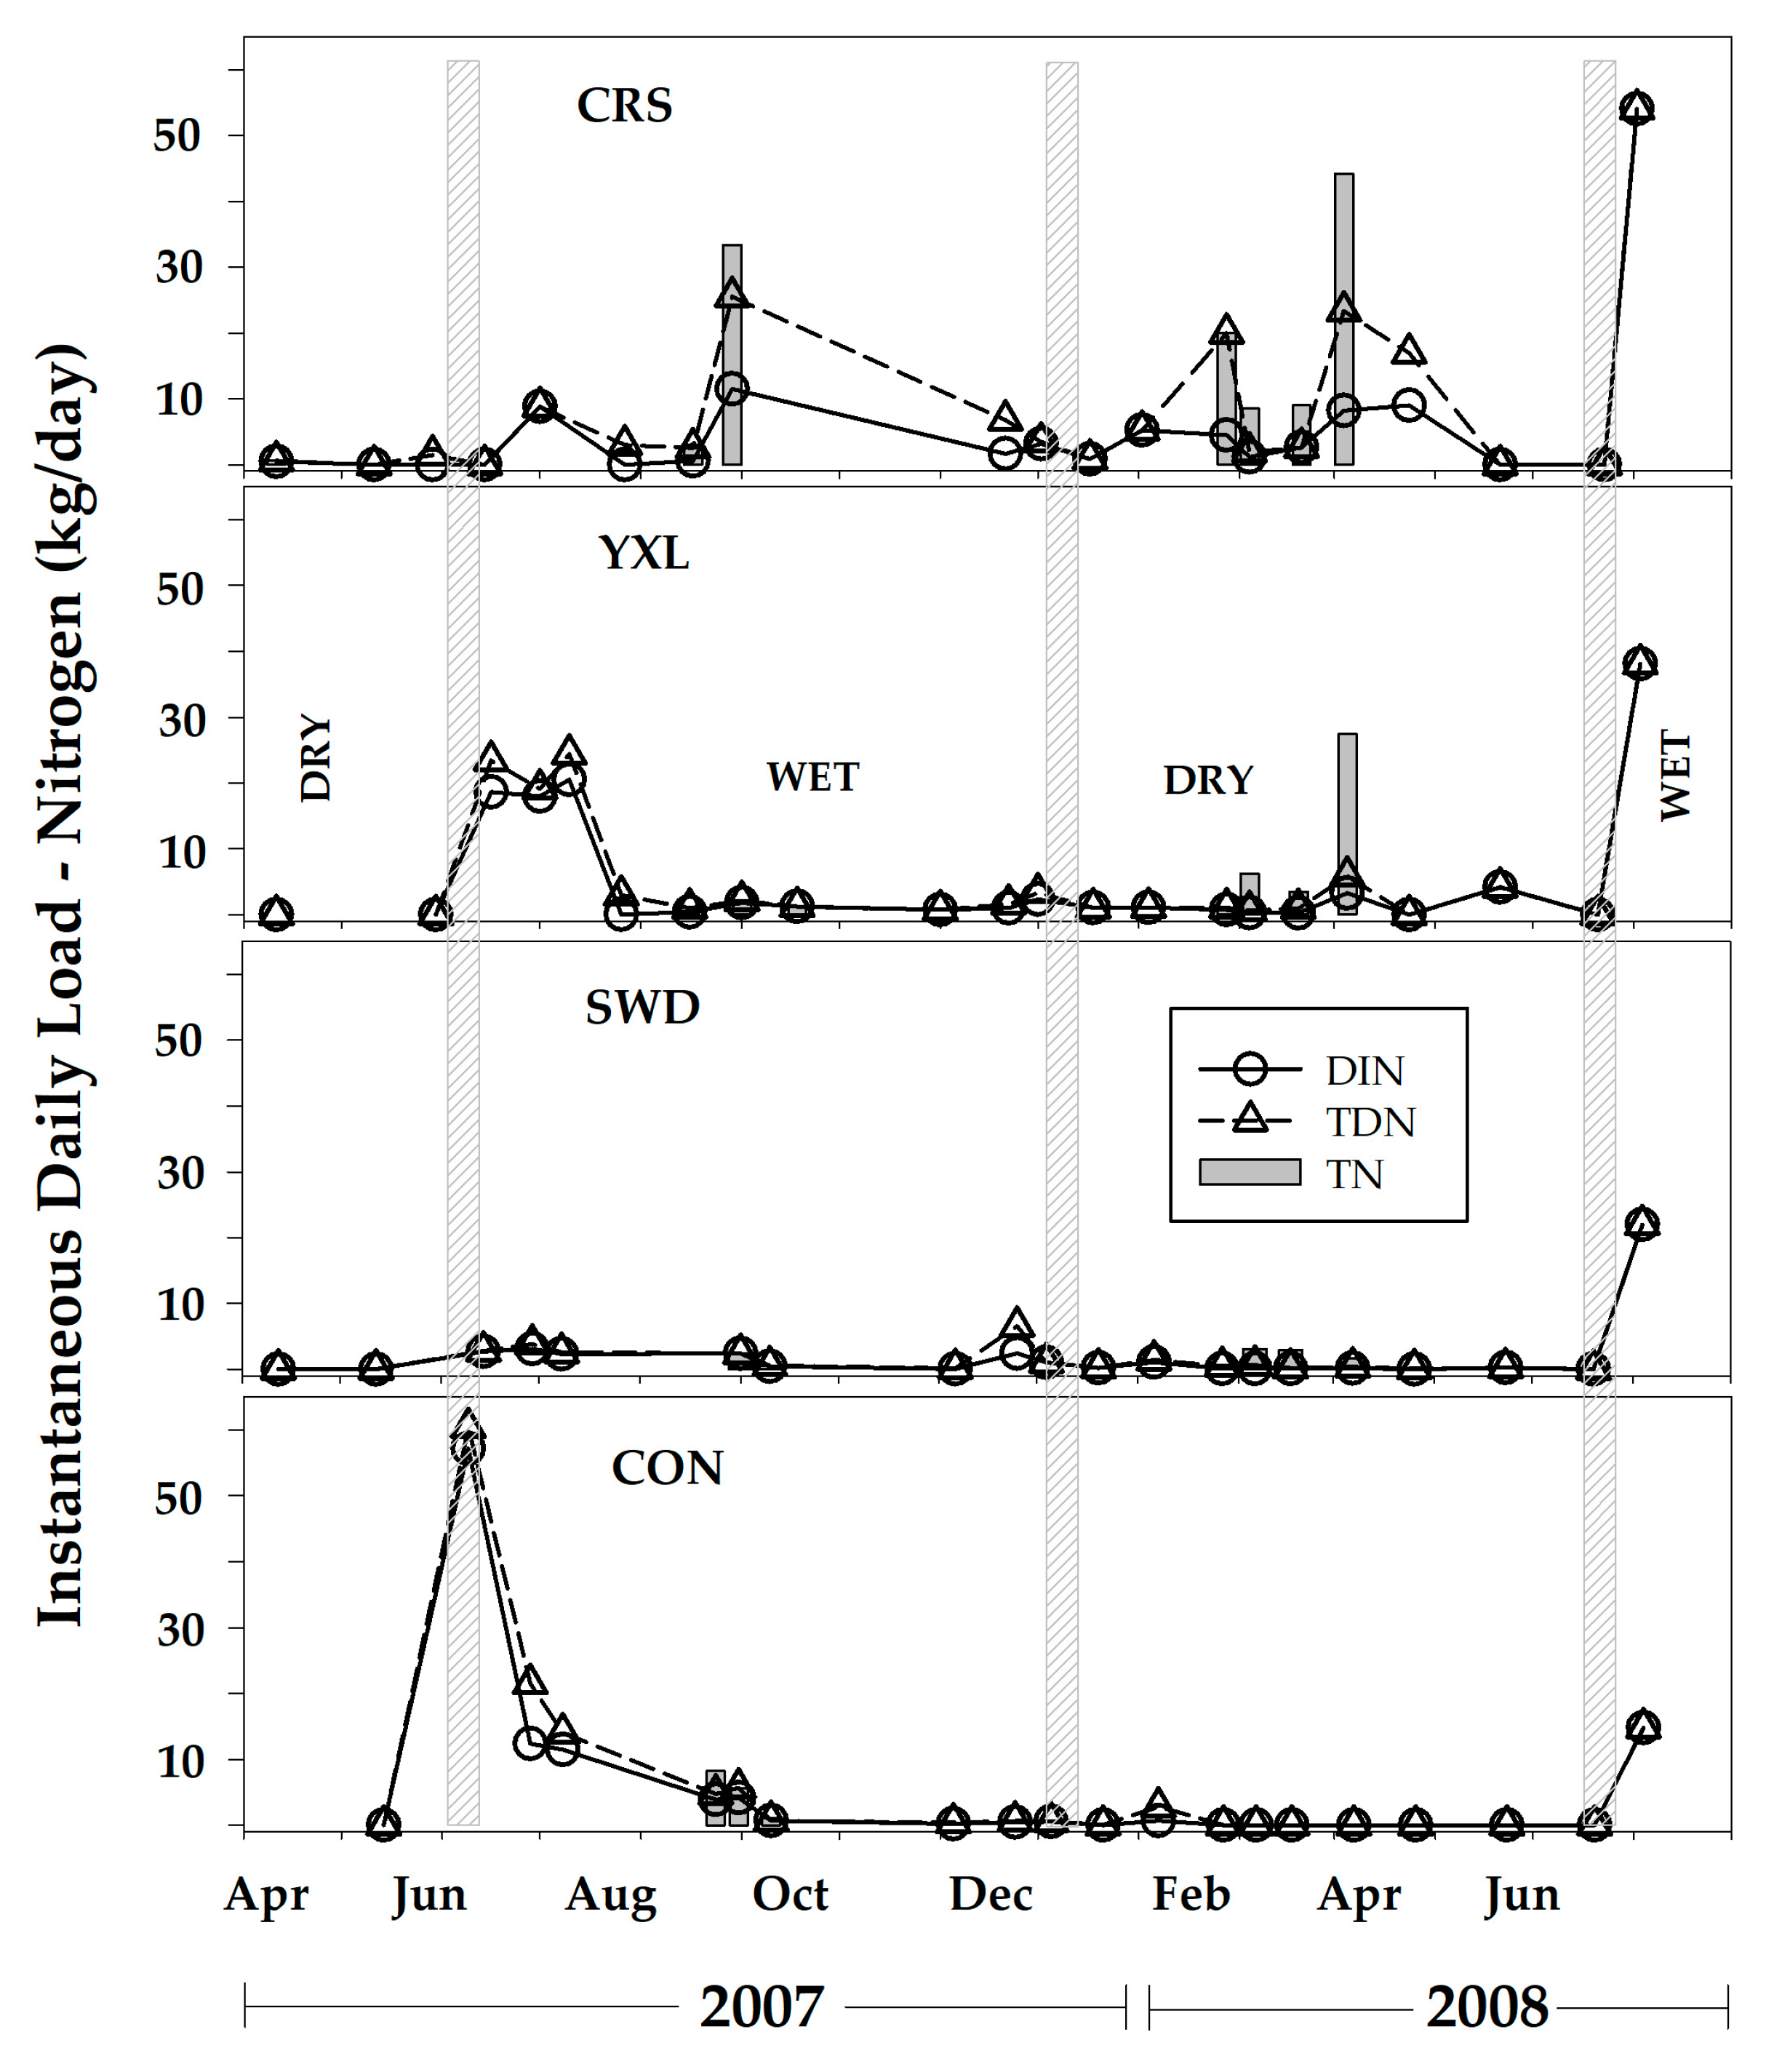
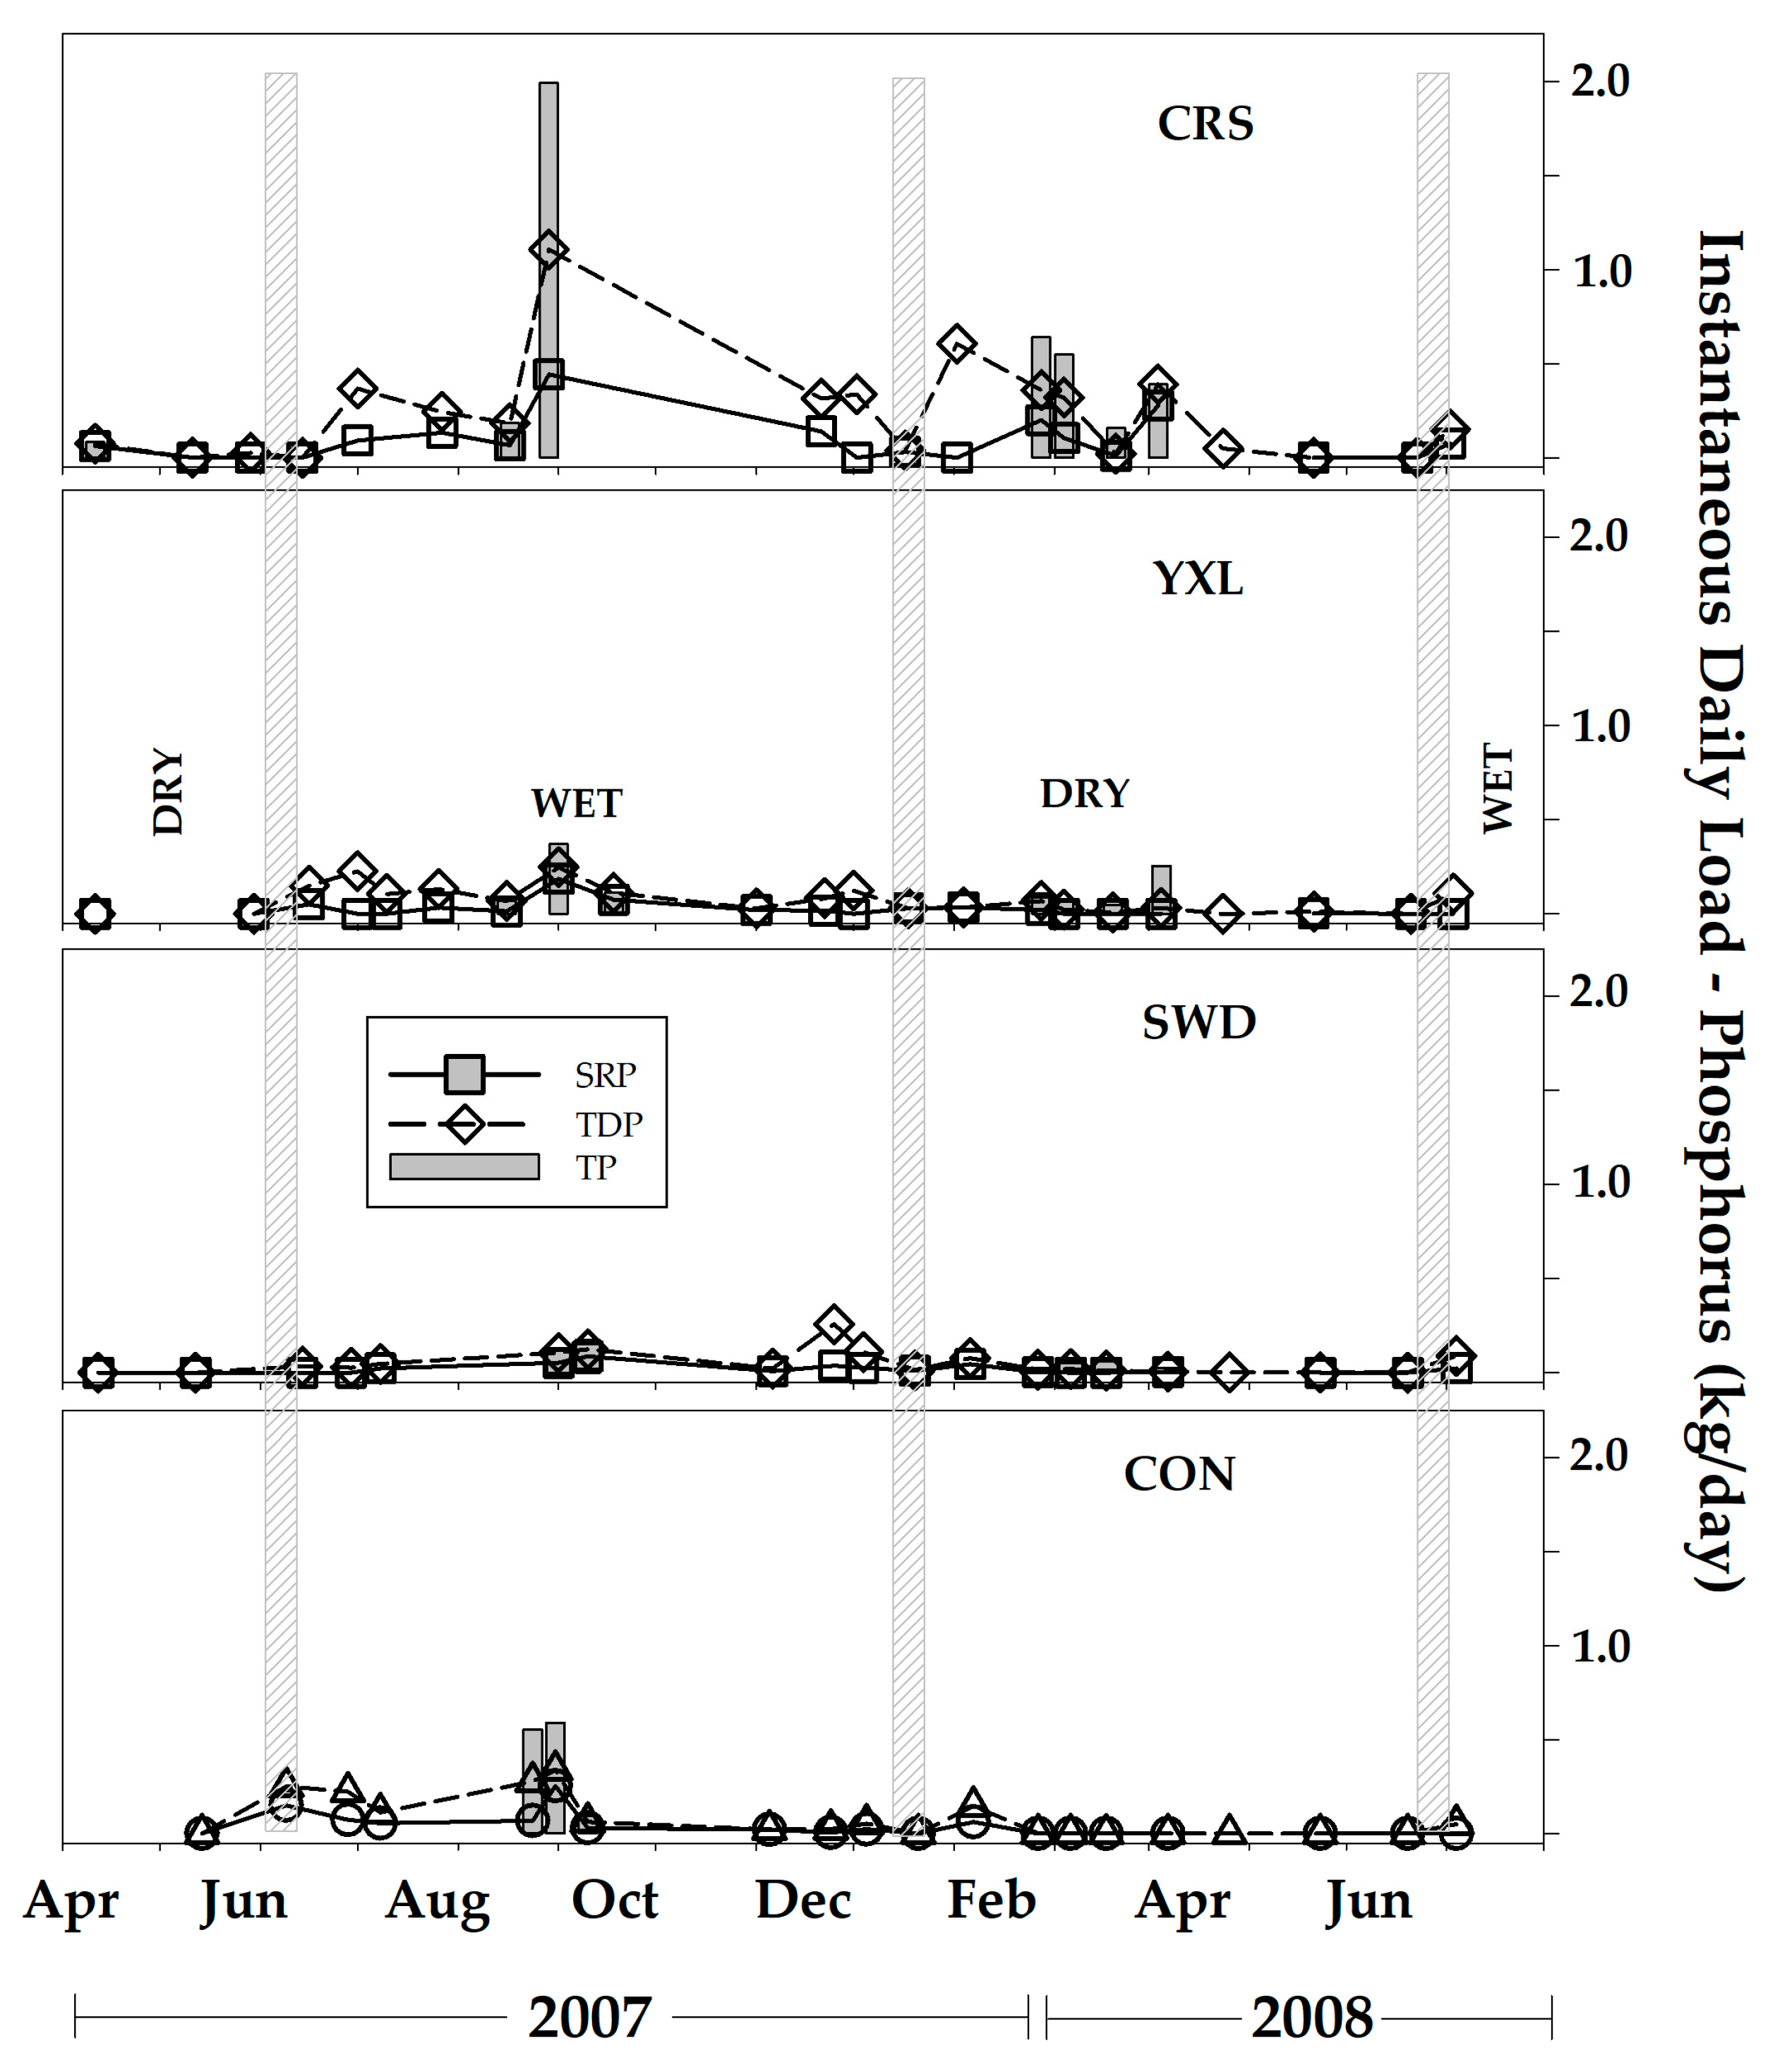
3.4. Nutrient Fluxes and Annual Export

Nutrient fluxes (kg day−1) varied over time and across catchments within the Temash River watershed (Figure 6 and Figure 7). In all catchments, daily loads were low at the end of the 2007 dry season. An increase (or pulse) in daily N flux was observed at the onset of the 2007 rainy season, although its timing and duration varied across catchments. In CRS, the first increase in N flux, from < 1 kg day−1 to almost 10 kg day−1, was observed between the June and July sampling period (Figure 6). A second, much larger pulse of N flux occurred in CRS later in the rainy season, at the end of August. Subsequent N fluxes remained low throughout the rainy season in CRS (Figure 6). In YXL, a pulse of N was observed during June and persisted through the July sampling period. In SWD, N fluxes were low throughout the 2007 sampling period (Figure 6). In CON, the initial pulse of N was observed in June 2007, declined in July 2007, and then remained low throughout the year. The final sampling event (June 2008) occurred within 3 days of the onset of the 2008 rainy season and all study catchments showed a large change in nutrient flux at that time.
Daily phosphorus loads were low across all study catchments, rarely exceeding 0.5 kg day−1 (Figure 7). A small increase was observed following the onset of the rainy season (late June 2007) in CRS, YXL, and CON. A large pulse of TP, TSP, and SRP was observed in CRS in late August, with a TP flux of ~2.0 kg day−1. Sampling in CRS after the onset of the dry season (January 2008) revealed additional fluxes of P. P fluxes remained low through the dry season, with the onset of the rainy season in June 2008 showing a small increase in P flux that occurred at the end of the sampling (Figure 7).
Annual nitrogen export coefficients from the study catchments displayed ranges of 0.12 to 2.04 kg DIN ha−1 year−1 and 0.18 to 2.25 kg TSN ha−1 year−1. These values are similar to or slightly lower than N exports reported from other tropical catchments (Table 6). Dissolved inorganic N accounted for 46−82% of the total dissolved N export from these catchments. Export of TSP from the study catchments was an order of magnitude lower than those reported elsewhere across the tropics (Table 6), except Luquillo Forest, Puerto Rico [44]. Although not directly measured, export of dissolved organic N (DON) and dissolved organic P (DOP) can be estimated from the data in Table 6. DON constitutes 18–53% of the overall dissolved N export from these catchments. DOP represents 30–67% of the total dissolved P export.

4. Discussion

4.1. Seasonal Hydrologic Changes and Nutrient Pulses

Stream discharge data presented here are the first reported from the Temash River watershed. Discharge estimates remained low across all study sites during the dry season and increased by an order of magnitude or more at the onset of the rainy season (Table 2). Seasonality of rainfall and associated fluctuations in discharge exerts a strong control on the ecosystem structure and function of tropical streams and rivers. The flood pulse concept [50] highlights the importance of seasonal hydrologic variability and associated changes in the connectivity between terrestrial and aquatic ecosystems in the tropics in regulating nutrient fluxes and aquatic food webs [51].
In-stream nutrient concentrations in our study catchments also reflect this nutrient pulsing with large increases (2–10-fold) in nutrient fluxes relative to base flow conditions occurring at the onset of the rainy season (Figure 5 and Figure 6). Although the source of this nutrient pulse is beyond the scope of this study, we hypothesize two interacting mechanisms. Multiple studies have documented high nitrification rates and weak NO3 retention within forested tropical catchments (e.g., [14]). In our study catchments, burning of above ground biomass that is central to swidden agricultural practices likely further exacerbates this weak N retention. Local customary practice of swidden agriculture is to clear the forest and allow vegetation to dry (ca. February–April), then burn the biomass (ca. May) before planting prior to the onset of the rainy season (June). Burning the vegetation releases nutrients into the atmosphere and the soil. The capacity of the soil to retain nutrients is reduced because of the felling of trees and death of root systems, but remaining organic matter decomposes and remineralized nutrients enter the soil [52]. Leached nutrients accumulate, and at the onset of the rainy season, nutrients can be released into adjacent waterbodies via subsurface and overland flow [10].
The initial pulse of N in streams, dominated by dissolved N, was observed at the onset of the rainy season in three of the four study catchments. This pattern was not observed in samples collected from SWD. Sunday Wood Creek is the largest of the four study catchments and it is possible that its catchment size, longer river network, and lower discharge relative to the other study catchments may enable greater retention of nutrients [53]. SWD also has the highest percentage of forested land cover (Table 1), it also had a well intact riparian corridor (Buck, personal observation) that may be facilitating retention of N across the terrestrial–aquatic flow path [53,54].
A pulse in P in the streams was also observed although it was less pronounced at the onset of the rainy season across all catchments except CRS where instantaneous P loads were 2–4 times larger than in the other study catchments (Figure 7). The source of elevated P in CRS is unknown. Soils in the Temash River watershed are generally clayey with high iron (Fe) and aluminum (Al) content [55] and adsorption/desorption of phosphorus to Fe- and Al- oxides in the soils may influence P availability across the study sites. Weathering rates were not determined as part of this study, but it is possible that more rapid weathering is occurring in CRS relative to the other study streams. In the upper reaches of YXL, dry season P concentrations were elevated relative to wet season P concentrations. Other mechanisms that may account for elevated P include a connection to groundwater enriched in P [56], or point-source pollution associated with human activities in the catchment.

4.2. Swidden, Land Cover Change, and Nutrient Dynamics

Most Q’eqchi Maya households in our study area produce a livelihood through customary land use practices, rooted in swidden agricultural production of corn, beans, and squash (principally for home consumption), as well as rice and cacao (cash crops). Previous scholars have studied these customary agricultural practices [33,57,58]. Recent research has examined local indigenous environmental knowledge [59], the socioecological resilience of shifting cultivation [60], plant–soil interactions in the milpa [61], and the consequences of road network improvements for forest clearing and use [35,62].
Swidden land use practices are dynamic, resulting in varied patterns of land cover change [63]. Across Central and South America, the predominant drivers of forest losses are road expansion and conversion for industrial-scale agriculture and pasture [64]. To date, these processes have not redefined the landscape within our study area. In southern Belize outside of our study area - where Maya customary practices no longer define land use - forest cover has declined, dramatically in some places [35]. By contrast, LULCC between 1976 and 2007 within the four study catchments had minimal impact on forest cover (Figure 2). Short-lived ventures into commercial farming have followed several waves of commodity production in our study area—e.g., banana, chicle, pig, and rice—earlier in the 20th century [57,58] and more recently, the expansion of cacao agroforestry [65]. Yet the predominant land use today remains customary swidden for household consumption.
Although farmers rely on a large area of available land for agriculture, the rate of clearing during any given year remains low (Figure 3). The average size of an individual swidden field in southern Belize is between 2 and 3 ha [36,66]. Farmers actively rotate cultivated fields within a patchy landscape of abandoned and fallowed fields of varying ages. The fallow period varies for a variety of reasons including weed control, availability of nontimber forest products and socioeconomic pressures related to food production [67].
The success of swidden agriculture as a livelihood strategy is dependent on nutrient availability in cultivated soils [68]. The size of the carbon stock (i.e., grams of C m−2) in soils following repeated cycles of clearing and burning can remain relatively stable [69], and a return to pre-swidden N concentrations in soils can take 15 years or more [55]. Burning aboveground biomass releases a pulse of plant-available nutrients [70], but these nutrients can easily be volatized and lost during the burn or leached away following a rain event [71,72]. The loss of nutrients, particularly N, can be reduced during the early successional stages in abandoned fields, as aboveground biomass helps to immobilize and eventually accumulate nutrients [73]. However, the fate of these nutrients as they move across the terrestrial–aquatic boundary is less well understood.
In our study, the low percentage of actively cultivated land across all four catchments (Figure 3) precludes a robust assessment of the impact of swidden agriculture on in-stream nutrient concentrations. Across the tropics swidden and other types of smallholder agricultural practices have been shown to have different (and sometimes undetectable) impacts on stream nutrients. In a small catchment (0.25 km2), 80% deforested by slash-and-burn, high concentrations of TN and TP were observed in overland flow [52], yet no significant increases in NO3, NH4+, or PO43− were observed in streams within these deforested catchments when compared with streams in a forested catchment [45]. In contrast, Malmer and Grip [74] observed a 10-fold increase in N concentrations that persisted during both wet and dry seasons in streams where forest had been cleared and burned for subsequent planting and elevated N concentrations persisted for several years afterwards. The duration of our study was too short to enable year-over-year inferences or an assessment of long-term changes in nutrient dynamics in the study streams, but such studies should be considered in the future. Future studies would also benefit from expanding the spatial scale of the study to include similar size catchments in neighboring Guatemala, where LULCC is occurring at a much faster pace and larger scale [30].
Although agricultural lands are generally considered to exert a strong influence on nutrient concentrations in streams, relative to forest-dominated sites [75], detection of a response to land cover change sometimes cannot be observed until a threshold deforestation level in the watershed (66–75%) is reached [9]. Transformations of forest cover to large-scale agricultural practices is thought to have a long-lasting impact on stream nutrients, for example transitions from forest to pasture [17] or plantation-style crops [76]. Perhaps of greater concern for freshwater ecosystems is urban expansion and the potential for eutrophication and cyanobacterial blooms in aquatic ecosystems downstream of such urban areas and wastewater treatment facilities [47].

4.3. Nutrient Exports

Our approach for estimating nutrient export likely underestimates the true export values. Our study streams are ungauged, and thus extrapolation of concentrations by linear interpolation or regression against discharge values [77] is not feasible. Other studies have documented high nutrient export during initial flood events [44,78] and our data captured at least one of these flushing events. The remoteness of the study area and the sampling strategy used, however, did not permit sampling during each flood pulse. Thus, our estimates are conservative.
Even given the sampling constraints, calculated annual exports from our study catchments were comparable to or slightly lower than those reported in other studies. Variation in the proportional contribution of DIN (to TSN) in our study catchments may reflect differences in N-limitation among the four study catchments, with N-rich catchments exporting greater amounts of DIN than N-limited catchments [47]. Although not directly measured, estimated DON and DOP exports from our study catchments are comparable to those reported from other studies of undisturbed catchments in the tropics [44,47]. DON and DOP export from urban streams in the tropics can, however, be several orders of magnitude higher [47].

5. Conclusions

We observed strong seasonal controls on in-stream N and P concentrations and associated export of these nutrients from each of our four study streams. Dry season concentrations of all N and P species were low, increased significantly at the onset of the rainy season, and returned to comparable base flow concentrations after rains and associated discharge declined. The pulsing nature of nutrient export from these small catchments reflects a strong terrestrial–aquatic linkage, with nutrients likely entering the streams via subsurface and surface flow, following large rainfall events. Our results do not clearly identify any response of stream nutrient concentrations to the presence of swidden agriculture in the catchments, but do provide a general characterization of N and P dynamics within catchments dominated by swidden agriculture. Further work on this topic in the Maya forest would benefit from a larger gradient of LULCC. Our results highlight the need for more research in understudied regions such as the Maya forest where strongly seasonal climate plays an important role in the nutrient biogeochemistry and overall food web structure [79].

Supplementary Materials

The following are available online at https://www.mdpi.com/2073-4441/11/4/664/s1, Table S1: In-stream nutrient concentrations for the four study catchments.

Author Contributions

Conceptualization, D.G.B., M.B., P.C.E., J.D.W., and M.J.C.; Methodology, D.G.B., M.B., S.J., P.C.E., and M.J.C.; Software, D.G.B. and S.J.; Validation, D.G.B. and M.B.; Formal Analysis, D.G.B. and S.J.; Investigation, D.G.B.; Resources, D.G.B., M.B.; Data Curation, D.G.B.; Writing–Original Draft Preparation, D.G.B., M.B., P.C.E., J.D.W., S.J. and M.C.; Writing–Review & Editing, D.G.B., M.B., P.C.E., J.D.W. and M.J.C.; Visualization, D.G.B. and S.J.; Supervision, D.G.B.; Project Administration, D.G.B.; Funding Acquisition, D.G.B., M.B.

Funding

A portion of this work was funded by an NSF Doctoral Dissertation Research Improvement Grant (NSF-BSE 0825278) and a Sigma Xi Grants-in-Aid of Research (Grant ID# G2006351230333459) to D. Buck.

Acknowledgments

The authors thank the people of the Temash River watershed and the villages of Crique Sarco, Conejo, and Sundaywood, in particular Juan Pop, Anisario Cal, Josiah Bo, and Mauricio Tush. The Sartsoon-Temash Institute for Indigenous Management (SATIIM) and the Toledo Institute for Development and the Environment (TIDE) provided institutional support during the field work in southern Belize. William Kenney of the Land Use and Environmental Change Institute (University of Florida) provided advice and supervision on nutrient analyses. Sean Downey provided rain gauges for rainfall data collection. Three anonymous reviewers provided constructive feedback and suggestions that greatly improved the final version of this manuscript. Any use of trade, firm, or product names is for descriptive purposes only and does not imply endorsement by the U.S. Government.

Conflicts of Interest

The authors declare no conflict of interest.

References

  1. Tortajada, C.; Landry, C.; Rodriguez, E.M.; Meinzen-Dick, R.; Moellendorf, S.; Porras, I.; Ratner, B.; Shea, A.; Swallow, B.; Thomich, T.; et al. Freshwater Ecosystem Services. In Millennium Ecosystem Assessment: Current State & Trends Assessment; Island Press: Washington, DC, USA, 2005; pp. 213–254. [Google Scholar]
  2. Lewis, W.M. Physical and Chemical Features of Tropical Flowing Waters. In Tropical Stream Ecology; Elsevier: Amsterdam, The Netherlands, 2008; pp. 1–21. ISBN 978-0-12-088449-0. [Google Scholar]
  3. Amarasekera, K.N.; Lee, R.F.; Williams, E.R.; Eltahir, E.A.B. ENSO and the natural variability in the flow of tropical rivers. J. Hydrol. 1997, 200, 24–39. [Google Scholar] [CrossRef]
  4. Hunt, R.J.; Jardine, T.D.; Hamilton, S.K.; Bunn, S.E. Temporal and spatial variation in ecosystem metabolism and food web carbon transfer in a wet-dry tropical river. Freshw. Biol. 2012, 57, 435–450. [Google Scholar] [CrossRef]
  5. Sala, O.E.; Chapin, F.S.; Armesto, J.J.; Berlow, E.; Bloomfield, J.; Dirzo, R.; Huber-Sanwald, E.; Huenneke, L.F.; Jackson, R.B.; Kinzig, A.; et al. Global Biodiversity Scenarios for the Year 2100. Science 2000, 287, 1770–1774. [Google Scholar] [CrossRef]
  6. McClain, M.E. The application of ecohydrological principles for better water resources management in South America. In The Ecohydrology of South American Rivers and Wetlands; IAHS Special Publication No. 6; IAHS Press: Wallingford, UK, 2002. [Google Scholar]
  7. Castello, L.; Macedo, M.N. Large-scale degradation of Amazonian freshwater ecosystems. Glob. Chang. Biol. 2016, 22, 990–1007. [Google Scholar] [CrossRef]
  8. Dudgeon, D.; Arthington, A.H.; Gessner, M.O.; Kawabata, Z.-I.; Knowler, D.J.; Lévêque, C.; Naiman, R.J.; Prieur-Richard, A.-H.; Soto, D.; Stiassny, M.L.J.; et al. Freshwater biodiversity: Importance, threats, status and conservation challenges. Biol. Rev. 2006, 81, 163–182. [Google Scholar] [CrossRef]
  9. Biggs, T.W.; Dunne, T.; Martinelli, L.A. Natural controls and human impacts on stream nutrient concentrations in a deforested region of the Brazilian Amazon basin. Biogeochemistry 2004, 68, 227–257. [Google Scholar] [CrossRef]
  10. Downing, J.A.; McClain, M.; Twilley, R.; Melack, J.M.; Elser, J.; Rabalais, N.N.; Lewis, W.M.; Turner, R.E.; Corredor, J.; Soto, D.; et al. The impact of accelerating land-use change on the N-cycle of tropical aquatic ecosystems: Current conditions and projected changes. Biogeochemistry 1999, 46, 109–148. [Google Scholar] [CrossRef]
  11. Carpenter, S.R.; Caraco, N.F.; Correll, D.L.; Howarth, R.W.; Sharpley, A.N.; Smith, V.H. Nonpoint pollution of surface waters with phosphorus and nitrogen. Ecol. Appl. 1998, 8, 559–568. [Google Scholar] [CrossRef]
  12. Caraco, N.F.; Cole, J.J. Human Impact on Nitrate Export: An Analysis Using Major World Rivers. Ambio 1999, 28, 167–170. [Google Scholar]
  13. Tappin, A.D. An Examination of the Fluxes of Nitrogen and Phosphorus in Temperate and Tropical Estuaries: Current Estimates and Uncertainties. Estuar. Coast. Shelf Sci. 2002, 55, 885–901. [Google Scholar] [CrossRef]
  14. Neill, C.; Deegan, L.A.; Thomas, S.M.; Cerri, C.C. Deforestation for pasture alters nitrogen and phosphorus in small Amazonian streams. Ecol. Appl. 2001, 11, 1817–1828. [Google Scholar] [CrossRef]
  15. Thomas, S.M.; Neill, C.; Deegan, L.A.; Krusche, A.V.; Ballester, V.M.; Victoria, R.L. Influences of land use and stream size on particulate and dissolved materials in a small Amazonian stream network. Biogeochemistry 2004, 68, 135–151. [Google Scholar] [CrossRef]
  16. Markewitz, D.; Davidson, E.; Moutinho, P.; Nepstad, D. Nutrient Loss and Redistribution After Forest Clearing on a Highly Weathered Soil in Amazonia. Ecol. Appl. 2004, 14, 177–199. [Google Scholar] [CrossRef]
  17. Figueiredo, R.O.; Markewitz, D.; Davidson, E.A.; Schuler, A.E.; Dos S Watrin, O.; de Souza Silva, P. Land-use effects on the chemical attributes of low-order streams in the eastern Amazon. J. Geophys. Res. Biogeosci. 2010, 115. [Google Scholar] [CrossRef] [Green Version]
  18. Nóbrega, R.L.B.; Guzha, A.C.; Lamparter, G.; Amorim, R.S.S.; Couto, E.G.; Hughes, H.J.; Jungkunst, H.F.; Gerold, G. Impacts of land-use and land-cover change on stream hydrochemistry in the Cerrado and Amazon biomes. Sci. Total Environ. 2018, 635, 259–274. [Google Scholar] [CrossRef] [PubMed] [Green Version]
  19. Neill, C.; Jankowski, K.; Brando, P.M.; Coe, M.T.; Deegan, L.A.; Macedo, M.N.; Riskin, S.H.; Porder, S.; Elsenbeer, H.; Krusche, A.V. Surprisingly modest water quality impacts from expansion and intensification of large-scale commercial agriculture in the Brazilian Amazon-Cerrado Region. Trop. Conserv. Sci. 2017, 10, 1940082917720669. [Google Scholar] [CrossRef]
  20. Riskin, S.H.; Neill, C.; Jankowski, K.; Krusche, A.V.; McHorney, R.; Elsenbeer, H.; Macedo, M.N.; Nunes, D.; Porder, S. Solute and sediment export from Amazon forest and soybean headwater streams. Ecol. Appl. 2017, 27, 193–207. [Google Scholar] [CrossRef] [PubMed] [Green Version]
  21. Myers, N. Tropical forests: Present status and future outlook. Clim. Chang. 1991, 19, 3–32. [Google Scholar] [CrossRef]
  22. Houghton, R.A. The worldwide extent of land-use change. BioScience 1994, 44, 305–313. [Google Scholar] [CrossRef]
  23. Laurance, W.F.; Sayer, J.; Cassman, K.G. Agricultural expansion and its impacts on tropical nature. Trends Ecol. Evol. 2014, 29, 107–116. [Google Scholar] [CrossRef]
  24. van Vliet, N.; Mertz, O.; Heinimann, A.; Langanke, T.; Pascual, U.; Schmook, B.; Adams, C.; Schmidt-Vogt, D.; Messerli, P.; Leisz, S.; et al. Trends, drivers and impacts of changes in swidden cultivation in tropical forest-agriculture frontiers: A global assessment. Glob. Environ. Chang. 2012, 22, 418–429. [Google Scholar] [CrossRef]
  25. Attiwill, P.M. The disturbance of forest ecosystems: The ecological basis for conservative management. For. Ecol. Manag. 1994, 63, 247–300. [Google Scholar] [CrossRef]
  26. Turner, B.L., II; Villar, S.C.; Foster, D.; Geoghegan, J.; Keys, E.; Klepeis, P.; Lawrence, D.; Mendoza, P.M.; Manson, S.; Ogneva-Himmelberger, Y.; et al. Deforestation in the southern Yucatan peninsular region: An integrative approach. For. Ecol. Manag. 2001, 154, 353–370. [Google Scholar] [CrossRef]
  27. Brenner, M.; Rosenmeier, M.F.; Hodell, D.A.; Curtis, J.H. Paleolimnology of the Maya Lowlands: Long-term perspectives on interactions among climate, environment, and humans. Anc. Mesoam. 2002, 13, 141–157. [Google Scholar] [CrossRef]
  28. Buck, D.G.; Esselman, P.C.; Villafranco, J. Monitoring land use changes along riparian corridors in lowland tropical watersheds: Application of human impact mapping and estimation of local stress intensity. Mesoamericana 2011, 15, 51–62. [Google Scholar]
  29. Chicas, S.D.; Omine, K.; Ford, J.B. Identifying erosion hotspots and assessing communities’ perspectives on the drivers, underlying causes and impacts of soil erosion in Toledo’s Rio Grande Watershed: Belize. Appl. Geogr. 2016, 68, 57–67. [Google Scholar] [CrossRef]
  30. Esselman, P.; Jiang, S.; Peller, H.; Buck, D.; Wainwright, J. Landscape drivers and social dynamics shaping microbial contamination risk in three Maya communities in Southern Belize, Central America. Water 2018, 10, 1678. [Google Scholar] [CrossRef]
  31. Lee, M.D.; Stednick, J.D.; Gilbert, D.M. Belize Environmental Water Quality Monitoring—Final Report and Annexes; Natural Resources Management and Protection Project; USAID: Belize City, Belize, 1995; p. 298.
  32. Meerman, J.C.; Herrera, P.; Howe, A. Rapid Ecological Assessment: Sarstoon Temash National Park, Toledo District, Belize; Sartstoon Temash Institute for Indigenous Management: Toledo, Belize, 2003; p. 73. [Google Scholar]
  33. Wright, A.C.S.; Romney, D.H.; Arbuckle, R.H. Land in British Honduras: Report of the Land Use Survey Team; Colonial Research Publication; HMSO: London, UK, 1959.
  34. U.S. Geological Survey Earth Explorer. 2017. Available online: https://earthexplorer.usgs.gov (accessed on 1 June 2018).
  35. Wainwright, J.; Jiang, S.; Mercer, K.; Liu, D. The political ecology of a highway through Belize’s forested borderlands. Environ. Plan. A 2015, 47, 833–849. [Google Scholar] [CrossRef]
  36. Wainwright, J.; Jiang, S.; Liu, D. Deforestation and the world-as-representation: The Maya forest of southern Belize. In Land Change Science, Political Ecology, and Sustainability: Synergies and Divergences; Brannstrom, C., Vadjunec, J., Eds.; Routledge: New York, NY, USA, 2013; pp. 169–190. [Google Scholar]
  37. The MathWorks. MATLAB 2018a; The MathWorks, Inc.: Natick, MA, USA, 2018. [Google Scholar]
  38. Chang, C.C.; Lin, C.J. A library for support vector machines. ACM Trans. Intell. Syst. Technol. 2011, 2, 1–27. [Google Scholar] [CrossRef]
  39. Marengo, J.A.; Liebmann, D.; Kousky, V.E.; Filizola, N.P.; Wainer, I.C. Onset and end of the rainy season in the Brazlian Amazon Basin. J. Clim. 2001, 14, 833–852. [Google Scholar] [CrossRef]
  40. Gore, J.A. Discharge measurements and streamflow analysis. In Methods in Stream Ecology; Elsevier: London, UK, 2006; pp. 51–78. [Google Scholar]
  41. Grayson, R.B.; Gippel, C.J.; Finlayson, B.L.; Hart, B.T. Catchment-wide impacts on water quality: The use of “snapshot” sampling during stable flow. J. Hydrol. 1997, 199, 121–134. [Google Scholar] [CrossRef]
  42. APHA. Standard Methods for the Examination of Water and Wastewater, 17th ed.; American Public Health Association: Washington, DC, USA, 1989. [Google Scholar]
  43. Meerman, J.C.; Sabido, W. Central American Ecosystems Map-Belize (Vol. 1); Program for Belize: Belize City, Belize, 2001; p. 58. [Google Scholar]
  44. McDowell, W.H.; Asbury, C.E. Exports of carbon, nitrogen, and major ions from three tropical montane watersheds. Limnol. Oceanogr. 1994, 39, 111–125. [Google Scholar] [CrossRef]
  45. Williams, M.R.; Melack, J.M. Solute export from forested and partially deforested catchments in the central amazon. Biogeochemistry 1997, 38, 67–102. [Google Scholar] [CrossRef]
  46. Newbold, J.D.; Sweeney, B.W.; Jackson, J.K.; Kaplan, L.A. Concentrations and export of solutes from six mountain streams in northwestern Costa Rica. J. North Am. Benthol. Soc. 1995, 14, 21–37. [Google Scholar] [CrossRef]
  47. Gücker, B.; Silva, R.C.S.; Graeber, D.; Monteiro, J.A.F.; Brookshire, E.N.J.; Chaves, R.C.; Boëchat, I.G. Dissolved nutrient exports from natural and human-impacted Neotropical catchments. Glob. Ecol. Biogeogr. 2016, 25, 378–390. [Google Scholar] [CrossRef]
  48. Young, W.J.; Marston, F.M.; Davis, J.R. Nutrient exports and land use in Australian catchments. J. Environ. Manag. 1996, 47, 165–183. [Google Scholar] [CrossRef]
  49. Borbor-Cordova, M.J.; Boyer, E.W.; McDowell, W.H.; Hall, C.A. Nitrogen and phosphorus budgets for a tropical watershed impacted by agricultural land use: Guayas, Ecuador. Biogeochemistry 2006, 79, 135–161. [Google Scholar] [CrossRef]
  50. Junk, W.J.; Bayley, P.B.; Sparks, R.E. The flood pulse concept in river-floodplain systems. Can. Spec. Publ. Fish Aquat. Sci. 1989, 106, 110–127. [Google Scholar]
  51. Douglas, M.M.; Bunn, S.E.; Davies, P.M. River and wetland food webs in Australia’s wet-dry tropics: General principles and implications for management. Mar. Freshw. Res. 2005, 56, 329–342. [Google Scholar] [CrossRef]
  52. Williams, M.R.; Fisher, T.R.; Melack, J.M. Solute dynamics in soil water and groundwater in a central Amazon catchment undergoing deforestation. Biogeochemistry 1997, 38, 303–335. [Google Scholar] [CrossRef]
  53. Wollheim, W.M.; Vörösmarty, C.J.; Peterson, B.J.; Seitzinger, S.P.; Hopkinson, C.S. Relationship between river size and nutrient removal. Geophys. Res. Lett. 2006, 33, L06410. [Google Scholar] [CrossRef]
  54. Naiman, R.J.; Decamps, H. The ecology of interfaces: Riparian zones. Annu. Rev. Ecol. Syst. 1997, 28, 621–658. [Google Scholar] [CrossRef]
  55. Buck, D.G. Linking Land Use-Land Cover Change and Ecosystem Function in Tropical Lowland Watersheds of Belize, Central America. Ph.D. Thesis, University of Florida, Gainesville, FL, USA, 2012. [Google Scholar]
  56. Pringle, C.M.; Triska, F.J. Effects of geothermal groundwater on nutrient dynamics of a lowland Costa Rican stream. Ecology 1991, 72, 951–965. [Google Scholar] [CrossRef]
  57. Wilk, R.R. Household Ecology: Economic Change and Domestic Life among the Kekchi Maya in Belize; Northern Illinois University Press: Dekalb, IL, USA, 1997. [Google Scholar]
  58. Wainwright, J. Decolonizing Development: Colonial Power and the Maya; Blackwell Publishing: Hoboken, NJ, USA, 2008. [Google Scholar]
  59. Grandia, L. Enclosed: Conservation, Cattle and Commerce among the Qeqchi Maya Lowlanders; University of Washington Press: Seattle, WA, USA, 2012. [Google Scholar]
  60. Downey, S.S. Can properties of labor-exchange networks explain the reslience of swidden agriculture? Ecol. Soc. 2010, 15, 15. [Google Scholar] [CrossRef]
  61. Cortez, C.J. Intensive Smallholding Farming in the Belizean Maya Milpa and Matahambre Agro-Ecosystems. Ph.D. Thesis, University of California, Davis, CA, USA, 2016. [Google Scholar]
  62. Chomitz, K.M.; Gray, D.A. Roads, Lands, Markets and Deforestation: A Spatial Model of Land Use in Belize; The World Bank: Washington, DC, USA, 1995. [Google Scholar]
  63. Zarger, R.K. Mosaics of Maya Livelihoods: Readjusting to Global and Local Food Crises. Napa Bull. 2009, 32, 130–151. [Google Scholar] [CrossRef]
  64. Curtis, P.G.; Slay, C.M.; Harris, N.L.; Tyukavina, A.; Hansen, M.C. Classifying drivers of global forest loss. Science 2018, 361, 1108–1111. [Google Scholar] [CrossRef]
  65. Emch, M. The human ecology of Mayan Cacao farming in Belize. Hum. Ecol. 2003, 31, 111–132. [Google Scholar] [CrossRef]
  66. Downey, S.S. Q’eqchi’ Maya Swidden Agriculture, Settlement History, and Colonial Enterprise in Modern Belize. Ethnohistory 2015, 62, 751–779. [Google Scholar] [CrossRef]
  67. Steinberg, M.K. Political Ecology and Cultural Change: Impacts on Swidden-fallow Agroforestry Practices among the Mopan Maya in Southern Belize. Prof. Geogr. 1998, 50, 407–417. [Google Scholar] [CrossRef]
  68. Sánchez, P.A. Nitrogen in shifting cultivation systems of Latin America. In Nitrogen Cycling in Ecosystems of Latin America and the Caribbean; Robertson, G.P., Herrera, R., Rosswall, T., Eds.; Developments in Plant and Soil Sciences; Springer: Dordrecht, The Netherlands, 1982; pp. 91–103. ISBN 978-94-009-7639-9. [Google Scholar]
  69. Eaton, J.M.; Lawrence, D. Loss of carbon sequestration potential after several decades of shifting cultivation in the Southern Yucatán. For. Ecol. Manag. 2009, 258, 949–958. [Google Scholar] [CrossRef]
  70. Ewel, J.; Berish, C.; Brown, B.; Price, N.; Raich, J. Slash and Burn Impacts on a Costa Rican Wet Forest Site. Ecology 1981, 62, 816–829. [Google Scholar] [CrossRef]
  71. Giardina, C.P.; Sanford, R.L.; Døckersmith, I.C.; Jaramillo, V.J. The effects of slash burning on ecosystem nutrients during the land preparation phase of shifting cultivation. Plant Soil 2000, 220, 247–260. [Google Scholar] [CrossRef]
  72. Sommer, R.; Vlek, P.L.G.; Deane De Abreu Sá, T.; Vielhauer, K.; De Fátima Rodrigues Coelho, R.; Fölster, H. Nutrient balance of shifting cultivation by burning or mulching in the Eastern Amazon—Evidence for subsoil nutrient accumulation. Nutr. Cycl. Agroecosyst. 2004, 68, 257–271. [Google Scholar] [CrossRef]
  73. Lambert, J.D.H.; Arnason, J.T. Nutrient dynamics in milpa agriculture and the role of weeds in initial stages of secondary succession in Belize, C.A. Plant Soil 1986, 93, 303–322. [Google Scholar] [CrossRef]
  74. Malmer, A.; Grip, H. Converting tropical rainforest to forest plantation in sabah, malaysia. Part II. Effects on nutrient dynamics and net losses in streamwater. Hydrol. Process. 1994, 8, 195–209. [Google Scholar] [CrossRef]
  75. Ferreira Marmontel, C.V.; Lucas-Borja, M.E.; Rodrigues, V.A.; Zema, D.A. Effects of land use and sampling distance on water quality in tropical headwater springs (Pimenta creek, São Paulo State, Brazil). Sci. Total Environ. 2018, 622–623, 690–701. [Google Scholar] [CrossRef]
  76. Jacobs, S.R.; Breuer, L.; Butterbach-Bahl, K.; Pelster, D.E.; Rufino, M.C. Land use affects total dissolved nitrogen and nitrate concentrations in tropical montane streams in Kenya. Sci. Total Environ. 2017, 603–604, 519–532. [Google Scholar] [CrossRef] [PubMed]
  77. Bücker, A.; Crespo, P.; Frede, H.-G.; Breuer, L. Solute behaviour and export rates in neotropical montane catchments under different land-uses. J. Trop. Ecol. 2011, 27, 305–317. [Google Scholar] [CrossRef] [Green Version]
  78. Mitchell, A.W.; Bramley, R.G.V.; Johnson, A.K.L. Export of nutrients and suspended sediment during a cyclone-mediated flood event in the Herbert River catchment, Australia. Mar. Freshw. Res. 1997, 48, 79. [Google Scholar] [CrossRef]
  79. Taniwaki, R.; Piggott, J.; Ferraz, S.; Matthaei, C. Climate change and multiple stressors in small tropical streams. Hydrobiologia 2017, 793, 41–53. [Google Scholar] [CrossRef]
Figure 1. Locator map showing the study watershed (Temash River watershed) in southern Belize and the four catchments selected for in-stream nutrient monitoring-Crique Sarco (CRS), Yax Cal (YXL), Sunday Wood (SWD), and Conejo (CON). Coordinate system is Universal Transverse Mercator (UTM).
Water 11 00664 g001
Figure 2. Time series of land use and land cover change (LULCC) classification results between 1976 and 2007 showing minimal expansion of cultivated areas within the greater Temash River watershed or the four smaller study catchments (CRS = Crique Sarco Creek; YXL = Yax Cal Creek; SWD = Sunday Wood Creek; CON = Conejo Creek).
Water 11 00664 g002
Figure 3. Percent of total land area under cultivation within the four study catchments, during the time period 1976 to 2007 (CRS = Crique Sarco Creek; YXL = Yax Cal Creek; SWD = Sunday Wood Creek; CON = Conejo Creek).
Water 11 00664 g003
Figure 4. Precipitation record for three stations in the Temash River watershed from 2 February 2007 through 24 June 2008. Shaded vertical bars mark the seasonal boundaries between dry and rainy seasons. Conejo village is located within CON. Lucky Strike village is located within SWD. Crique Sarco village is located within CRS.
Water 11 00664 g004
Figure 5. Seasonal mean (+/−1 std dev) of absolute and normalized (by catchment area) discharge rates for the study catchments.
Water 11 00664 g005
Figure 6. Daily nitrogen fluxes from the study catchments.
Water 11 00664 g006
Figure 7. Daily phosphorus fluxes from the study catchments.
Water 11 00664 g007
Table 1. Catchment characteristics of the four study catchments in the Temash River watershed (all data are for the catchment area of the farthest downstream sampling site).
Crique Sarco (CRS05)Yax Cal (YXL05)Sunday Wood (SWD04)Conejo (CON04)
Area (ha)108446932041384
Elevation (m)53264128
Slope (%)6.62.95.42.9
Geology (%)
Alluvial006027
Limestone230150
Clastic Sedimentary771002573
Soils (%)
Cambisol79953052
Fluvisol056148
Leptosol11090
Leptosol–vertisol10000
Land Cover (%)^
Semideciduous/evergreen forest
23234036
Lowland swamp forest0005
Waterbody2000
Land Use (%)
Historic agricultural lands^75776059
Actively cultivated lands+1.86.46.98.7
^ data on land cover and historic agricultural lands are from [43]; + data on actively cultivated lands reflect the area under cultivation at the time of study (2007). See Figure 2 and Figure 3 for additional detail.
Table 2. Comparison of dry and wet season discharge rates (m3 s−1) across all sampling sites. (Mann–Whitney U statistic, p-value ≤ 0.05). * denotes significant difference (p-value ≤ 0.05).
Dry Season Discharge (m3 s−1)Wet Season Discharge (m3 s−1)
Sampling SiteMedian (N)25%75%Median (N)25%75%U
Statistic
p-Value
CRS010.047 (9)0.0170.2480.353 (11)0.0880.64215.00.037*
CRS020.060 (9)0.0000.2630.446 (10)0.1670.97010.00.017*
CRS030.123 (9)0.0000.2340.680 (10)0.2571.54110.00.017*
CRS040.181 (10)0.0470.2570.383 (10)0.1710.85914.00.045*
CRS050.288 (9)0.1160.5390.365 (9)0.1420.92623.50.613
YXL010.095 (10)0.0360.1990.210 (11)0.1550.29115.00.079
YXL020.037 (10)0.0190.0880.148 (11)0.0560.24616.00.046*
YXL030.053 (10)0.0330.1130.236 (11)0.0890.4038.00.007*
YXL040.088 (8)0.0350.1330.382 (11)0.1370.7168.00.007*
YXL050.000 (9)0.0000.0004.2 × 10−5 (8)0.0000.22217.00.232
SWD010.000 (9)0.0000.0000.031 (9)0.0000.08013.50.029*
SWD020.000 (9)0.0000.0000.135 (9)0.0100.2646.00.013*
SWD030.019 (10)0.0110.0830.250 (9)0.1000.2997.00.006*
SWD040.031 (9)0.0060.0430.293 (8)0.1690.3162.00.002*
CON010.000 (9)0.0000.0060.059 (10)0.0170.1559.50.005*
CON020.009 (9)0.0000.0250.124 (9)0.0570.2807.00.006*
CON030.000 (9)0.0000.0000.260 (9)0.1290.4065.00.002*
CON040.000 (9)0.0000.0000.380 (9)0.0760.8444.00.001*
Table 3. Spearman’s rank order correlation coefficients for instantaneous discharge and antecedent rainfall †.
Antecedent Rainfall
Catchment1-day7-day14-day28-day
CRS *0.730.750.770.74
YXL *0.580.650.730.70
SWD ^0.550.660.650.62
CON ^0.520.820.760.72
† all correlations are significant at p-value ≤ 0.01; * CRS and YXL correlated with the CRS rain gauge station; ^ SWD and CON correlated with the CON rain gauge station.
Table 4. Mean seasonal nutrient concentrations for dissolved inorganic nitrogen (DIN), total soluble nitrogen (TSN), and total nitrogen (TN) for all sampling sites within each study catchment. Values are mean ± 1 standard deviation (sample size in parentheses).
DIN (mg/L)TSN (mg/L)TN (mg/L)
DryWetDrywetDryWet
Crique Sarco
CRS010.276 ± 0.442 (10)0.142 ± 0.269 (13)0.391 ± 0.401 (10)0.207 ± 0.267 (13)0.586 ± 0.298 (6)0.097 ± 0.063 (3)
CRS020.291 ± 0.443 (11)0.159 ± 0.342 (11)0.351 ± 0.416 (11)0.219 ± 0.330 (11)0.496 ± 0.377 (6)0.106 ± 0.065 (2)
CRS030.292 ± 0.452 (11)0.178 ± 0.360 (11)0.355 ± 0.421 (11)0.218 ± 0.350 (11)0.513 ± 0.364 (6)0.108 ± 0.079 (3)
CRS040.270 ± 0.407 (12)0.169 ± 0.355 (11)0.406 ± 0.386 (11)0.204 ± 0.346 (11)0.517 ± 0.323 (7)0.093 ± 0.051 (3)
CRS050.329 ± 0.434 (11)0.218 ± 0.457 (9)0.507 ± 0.374 (11)0.275 ± 0.437 (9)0.602 ± 0.275 (6)0.124 ± 0.038 (2)
Yax Cal
YXL010.154 ± 0.259 (12)0.214 ± 0.511 (12)0.179 ± 0.252 (12)0.225 ± 0.508 (12)0.378 ± 0.401 (7)0.058 ± 0.026 (3)
YXL020.227 ± 0.374 (12)0.204 ± 0.309 (12)0.255 ± 0.360 (12)0.227 ± 0.305 (12)0.405 ± 0.408 (7)0.040 ± 0.027 (3)
YXL030.216 ± 0.428 (12)0.205 ± 0.293 (12)0.314 ± 0.408 (12)0.220 ± 0.296 (12)0.446 ± 0.371 (7)0.047 ± 0.040 (3)
YXL040.278 ± 0.483 (12)0.191 ± 0.291 (12)0.334 ± 0.459 (12)0.222 ± 0.288 (12)0.432 ± 0.401 (7)0.047 ± 0.023 (3)
YXL050.272 ± 0.399 (12)0.170 ± 0.315 (10)0.357 ± 0.366 (12)0.201 ± 0.306 (10)0.491 ± 0.342 (7)0.082 ± 0.055 (3)
Sunday Wood
SWD010.120 ± 0.204 (11)0.161 ± 0.401 (10)0.143 ± 0.187 (11)0.183 ± 0.394 (10)0.424 ± 0.405 (6)0.027 ± 0.009 (3)
SWD020.118 ± 0.190 (10)0.163 ± 0.369 (11)0.240 ± 0.230 (10)0.177 ± 0.364 (11)0.431 ± 0.395 (6)0.064 ± 0.052 (3)
SWD030.121 ± 0.198 (11)0.219 ± 0.480 (11)0.308 ± 0.163 (10)0.246 ± 0.472 (11)0.522 ± 0.300 (7)0.057 ± 0.037 (3)
SWD040.143 ± 0.219 (11)0.286 ± 0.630 (9)0.213 ± 0.192 (11)0.306 ± 0.623 (9)0.494 ± 0.341 (6)0.063 ± 0.039 (2)
Conejo
CON010.178 ± 0.302 (11)0.381 ± 0.723 (11)0.353 ± 0.477 (11)0.402 ± 0.714 (11)0.556 ± 0.369 (6)0.071 ± 0.033 (3)
CON020.123 ± 0.191 (11)0.932 ± 0.764 (10)0.216 ± 0.207 (10)0.432 ± 0.760 (10)0.435 ± 0.348 (5)0.087 ± 0.050 (3)
CON030.117 ± 0.171 (11)0.313 ± 0.465 (10)0.226 ± 0.181 (11)0.348 ± 0.482 (10)0.556 ± 0.328 (6)0.080 ± 0.020 (3)
CON040.128 ± 0.176 (11)0.303 ± 0.450 (10)0.280 ± 0.167 (11)0.338 ± 0453 (10)0.636 ± 0.258 (6)0.086 ± 0.028 (3)
Table 5. Mean seasonal nutrient concentrations for soluble reactive phosphorus (SRP), total soluble phosphorus (TSP), and total phosphorus (TP) for all sampling sites within each study catchment. Values are mean ± 1 standard deviation (sample size in parentheses).
SRP (mg/L)TSP (mg/L)TP (mg/L)
DryWetDryWetDryWet
Crique Sarco
CRS010.001 ± 0.002 (9)0.001 ± 0.001 (13)0.004 ± 0.005 (10)0.003 ± 0.003 (13)0.009 ± 0.004 (6)0.006 ± 0.003 (3)
CRS020.002 ± 0.002 (10)0.002 ± 0.003 (11)0.004 ± 0.003 (11)0.005 ± 0.003 (11)0.009 ± 0.003 (6)0.010 ± 0.003 (2)
CRS030.001 ± 0.001 (10)0.001 ± 0.001 (11)0.003 ± 0.002 (11)0.005 ± 0.005 (11)0.007 ± 0.003 (3)0.007 ± 0.003 (3)
CRS040.004 ± 0.004 (10)0.005 ± 0.008 (11)0.006 ± 0.004 (11)0.009 ± 0.007 (11)0.009 ± 0.004 (7)0.015 ± 0.012 (3)
CRS050.005 ± 0.006 (10)0.002 ± 0.001 (9)0.010 ± 0.010 (11)0.006 ± 0.003 (9)0.023 ± 0.017 (6)0.008 ± 0.001 (2)
Yax Cal
YXL010.019 ± 0.008 (12)0.006 ± 0.006 (12)0.022 ± 0.008 (12)0.010 ± 0.007 (12)0.029 ± 0.010 (7)0.011 ± 0.010 (3)
YXL020.004 ± 0.002 (11)0.004 ± 0.005 (12)0.006 ± 0.003 (12)0.006 ± 0.004 (12)0.011 ± 0.004 (7)0.010 ± 0.008 (3)
YXL030.002 ± 0.002 (11)0.001 ± 0.001 (12)0.006 ± 0.005 (12)0.004 ± 0.002 (12)0.011 ± 0.005 (7)0.004 ± 0.002 (3)
YXL040.001 ± 0.001 (11)0.001 ± 0.001 (12)0.004 ± 0.003 (12)0.004 ± 0.001 (12)0.008 ± 0.003 (7)0.005 ± 0.002 (3)
YXL050.005 ± 0.014 (11)0.005 ± 0.014 (10)0.007 ± 0.013 (12)0.011 ± 0.015 (10)0.011 ± 0.017 (7)0.018 ± 0.023 (3)
Sunday Wood
SWD010.002 ± 0.003 (10)0.002 ± 0.002 (10)0.004 ± 0.005 (10)0.005 ± 0.003 (10)0.009 ± 0.006 (6)0.007 ± 0.003 (3)
SWD020.011 ± 0.022 (9)0.002 ± 0.001 (10)0.012 ± 0.025 (10)0.003 ± 0.002 (11)0.009 ± 0.012 (6)0.006 ± 0.002 (3)
SWD030.007 ± 0.008 (9)0.002 ± 0.002 (11)0.014 ± 0.018 (10)0.007 ± 0.004 (11)0.020 ± 0.020 (7)0.008 ± 0.003 (3)
SWD040.001 ± 0.001 (10)0.002 ± 0.002 (9)0.005 ± 0.002 (11)0.005 ± 0.003 (9)0.010 ± 0.005 (6)0.009 ± 0.005 (2)
Conejo
CON010.010 ± 0.019 (10)0.004 ± 0.009 (11)0.012 ± 0.020 (11)0.005 ± 0.008 (11)0.017 ± 0.021 (6)0.005 ± 0.001 (3)
CON020.001 ± 0.002 (9)0.002 ± 0.001 (10)0.004 ± 0.003 (10)0.014 ± 0.033 (10)0.006 ± 0.001 (5)0.039 ± 0.059 (3)
CON030.010 ± 0.020 (10)0.003 ± 0.002 (10)0.013 ± 0.018 (11)0.006 (0.003) (10)0.028 ± 0.010 (6)0.007 ± 0.002 (3)
CON040.002 ± 0.003 (10)0.002 ± 0.002 (10)0.005 ± 0.004 (11)0.004 ± 0.001 (10)0.017 ± 0.009 (6)0.007 ± 0.001 (3)
Table 6. Comparison of annual nutrient export values (kg ha−1 year−1) from the study catchments with values from other tropical catchments.
Yield
Stream/RiverSize (ha)Land CoverDINTSNTNSRPTSPTPLocation/Reference
kg ha−1 year−1
Crique Sarco Creek10842% agriculture1.042.25 0.030.09 southern Belize/this study
Yax Cal Creek4696% agriculture0.280.53 0.030.04 southern Belize/this study
Sundaywood Creek32047% agr0.120.18 0.000.01 southern Belize/this study
Conejo Creek13849% agr2.042.48 0.020.03 southern Belize/this study
Braco do Mota23.480% agr3.646.449.140.080.330.48central Amazon (A)
Igarape de Mota18>95% forest2.673.614.310.020.050.08central Amazon (A)
Tempisquito319>95% forest6.10 0.57 Costa Rica (B)
Tempisquito Sur311>95% forest4.90 0.33 Costa Rica (B)
Kathia264>95% forest5.60 0.34 Costa Rica (B)
Marilin36>95% forest4 0.46 Costa Rica (B)
El Jobo55>95% forest4.3 0.34 Costa Rica (B)
Zompopa37>95% forest6 0.43 Costa Rica (B)
Icacos326>95% forest3.28.019.8 0.07 Puerto Rico (C)
Sonadora262>95% forest1.695.435.9 0.05 Puerto Rico (C)
Toronja16.2>95% forest1.163.964.4 0.03 Puerto Rico (C)
Rio das Mortes Cerrado3.9 0.54Brazil (D)
multiple basins various 0.17 0.04 SE Brazil (D)
multiple basins104–106forested 2 1.2Queensland, Australia (E)
Guayas3.2 × 10629% forest; 52% Agriculture 10.1 2.4Ecuador (F)
(A) [45]; (B) [46]; (C) [44]; (D) [47]; (E) [48]; (F) [49].

