Expanding Rubber Plantations in Southern China: Evidence for Hydrological Impacts


1
Yunnan Institute of Environmental Sciences, Kunming 650034, China
2
World Agroforestry Centre (ICRAF), East Asia, Kunming 650204, China
3
International Water Management Institute (IWMI), Vientiane PO BOX 4199, Laos
4
World Agroforestry Centre (ICRAF), East & Southern Africa Region, 13 Elm Road, Woodlands, Lusaka 999134, Zambia
5
World Agroforestry Centre (ICRAF), Southeast Asia, Bogor 16001, Indonesia
*
Author to whom correspondence should be addressed.
Water 2019, 11(4), 651; https://doi.org/10.3390/w11040651
Submission received: 21 January 2019
/
Revised: 5 March 2019
/
Accepted: 23 March 2019
/
Published: 29 March 2019
(This article belongs to the Special Issue Multiscale Impacts of Anthropogenic and Climate Changes on Tropical and Mediterranean Hydrology)
Abstract
:While there is increasing evidence concerning the detrimental effects of expanding rubber plantations on biodiversity and local water balances, their implications on regional hydrology remain uncertain. We studied a mesoscale watershed (100 km2) in the Xishuangbanna prefecture, Yunnan Province, China. The influence of land-cover change on streamflow recorded since 1992 was isolated from that of rainfall variability using cross-simulation matrices produced with the monthly lumped conceptual water balance model GR2M. Our results indicate a statistically significant reduction in wet and dry season streamflow from 1992 to 2002, followed by an insignificant increase until 2006. Analysis of satellite images from 1992, 2002, 2007, and 2010 shows a gradual increase in the areal percentage of rubber tree plantations at the watershed scale. However, there were marked heterogeneities in land conversions (between forest, farmland, grassland, and rubber tree plantations), and in their distribution across elevations and slopes, among the studied periods. Possible effects of this heterogeneity on hydrological processes, controlled mainly by infiltration and evapotranspiration, are discussed in light of the hydrological changes observed over the study period. We suggest pathways to improve the eco-hydrological functionalities of rubber tree plantations, particularly those enhancing dry-season base flow, and recommend how to monitor them.
1. Introduction
Over recent decades, commercial plantations of rubber trees (Hevea brasiliensis) have expanded rapidly across tropical areas around the world, especially in the uplands of Southeast Asia. These plantations have largely encroached on lands that were covered by forests, including land used for annual cropping as part of rainfed rice-based shifting cultivation systems [1,2]. Between 2003 and 2010, about 15,000 km2 of land were converted to rubber plantations in Cambodia, Southern China, Thailand, and Vietnam [3]. This massive land-cover conversion is threatening biodiversity [4,5,6,7], resulting in the loss of ecosystem services [1,8,9,10,11,12]. One important environmental effect of land conversion on rubber plantations is the modification of local and regional water balances [13,14,15,16,17,18]. Hevea brasiliensis is an equatorial species indigenous to the Amazon rain forest. Rubber trees are bigger water consumers than native forest species in Southeast Asia, due in part to their large xylem vessels [19] and an extended root system allowing a wide part of the soil to be explored for water uptake [20,21,22]. Depending on the season and the zoning of soil moisture, the tree is able to shift from the shallow to the deep soil layer to extract water from where it is most abundant at that point in time, indicating significant plasticity in sources of water uptake [18,19,20,21,22,23]. These key features enable rubber trees to thrive through the period of greatest water demand. As opposed to the original primary or secondary forest, which exhibit diverse timing in phenology, rubber trees show strong synchronicity for flushing and shedding [17].
The effect of rubber plantations on water balance has been assessed at the plot level [13]. Using measured soil moisture profiles and above-canopy radiations, the authors showed that the rates and timing of water consumption by rubber trees and traditional land-cover types (tea, secondary forest, and grassland) are drastically different. Deep root water uptake of rubber during the dry season is controlled by leaf phenology (leaf loss and renewal), which is determined by day-length, whereas the increased water demand of native vegetation starts with the arrival of the first monsoon rainfall. At the basin level, simulations with a rubber evapotranspiration (ET) model suggested greater water losses through ET from rubber-dominated landscapes than from traditional vegetation cover [14]. Fifteen years of paired watershed rainfall and runoff measurements and one year of paired eddy covariance water flux data from a primary tropical rain forest (51.1 ha) and a tropical rubber plantation (19.3 ha) in the Xishuangbanna prefecture in Southern China helped assessing how rubber plantations affect local water resources [15]. The mean annual ET from the rubber plantation (about 1130 mm) surpassed that of the indigenous forest (about 950 mm), despite a similar rainfall input. A drying up of the streamflow was observed downstream of the rubber plantation in the dry season, while the stream coming from the tropical forest remained perennial. When soil water is limited, rubber trees can regulate stomatal conductance to prevent excessive xylem cavitation [24]. This adaptive capacity to cope with a temporary water shortage enhances the aptitude of rubber trees to deplete soil water resources when they become available again, at the beginning of the wet season. However, the replacement of native forest vegetation with rubber can increase run-off variability and the magnitude of storm streamflow. This situation is observed in tree plantations subject to soil compaction that reduces the soil permeability, despite a greater potential of root water uptake [16]. This analysis indicates that the hydrologic impact of tropical forest conversion to rubber plantation is controlled not only by the different phenology of the trees, but also by the land management, which can strongly influence soil hydraulic properties and lead to greatly modified soil infiltration capacity, as has been observed elsewhere in Southeast Asia [25].
The effects of land-cover change on watershed hydrology are often compounded by climate variability [26]. Several methods exist to separate the relative contributions of climate variability and land-use/land-cover change to watershed hydrological changes, with the most robust ones combining modeling and statistical approaches [27]. Two main techniques are usually applied in small- to medium-size watersheds (i.e., <1000 km2). Paired watershed studies establish the statistical relationships for outflow variables between two neighboring watersheds, ideally similar in geomorphology, area, land cover, and climate. Following calibration, land-cover treatments are applied to one watershed, and changes in the statistical relationships are indicative of the land treatment effect on hydrology. Important limitations of this approach are the relatively few samples used for model development, and the spatial variability of rainfall events between the two watersheds [28]. A second approach involves the calibration of a rainfall-runoff model in one single watershed. The model is first calibrated before a land-cover treatment occurs. The model is then used as a virtual control watershed, along with the rainfall observed after the land-cover treatment, in order to reconstitute runoff as if no change in the watershed had occurred. An underlying assumption for this approach is that the watershed behaviour is stationary in each of the pre-treatment and post-treatment periods. This assumption is seldom tested. In addition, very few studies have tested the statistical significance of observed hydrological changes [28].
Our objectives were twofold: (a) verify if the conversion of forest to rubber tree plantations in a second-order tributary of the Mekong River in Southern China actually reduced seasonal streamflow, as can be expected from local water balances and larger-scale predictive modeling studies, and (b) assess how this relationship is influenced by land use and geomorphological heterogeneities. For these aims, the following steps were undertaken:
- Select a watershed (about 100 km2) which has been subject to intense land conversion to rubber tree plantations during a long period, with available rainfall and streamflow records,
- Map land-cover types and their changes over time and according to elevations and slopes,
- Quantify the spread of rubber trees and the recession of other land-cover types, and see how this is influenced by geomorphology,
- Model the rainfall–runoff relationship, assess the statistical significance of its temporal variations, and verify if they are consistent with observed changes in land cover, particularly those related to the spread of rubber tree plantations,
- Interpret the correlations between observed land-use changes and hydrological changes.
2. Materials and Methods
2.1. Study Site
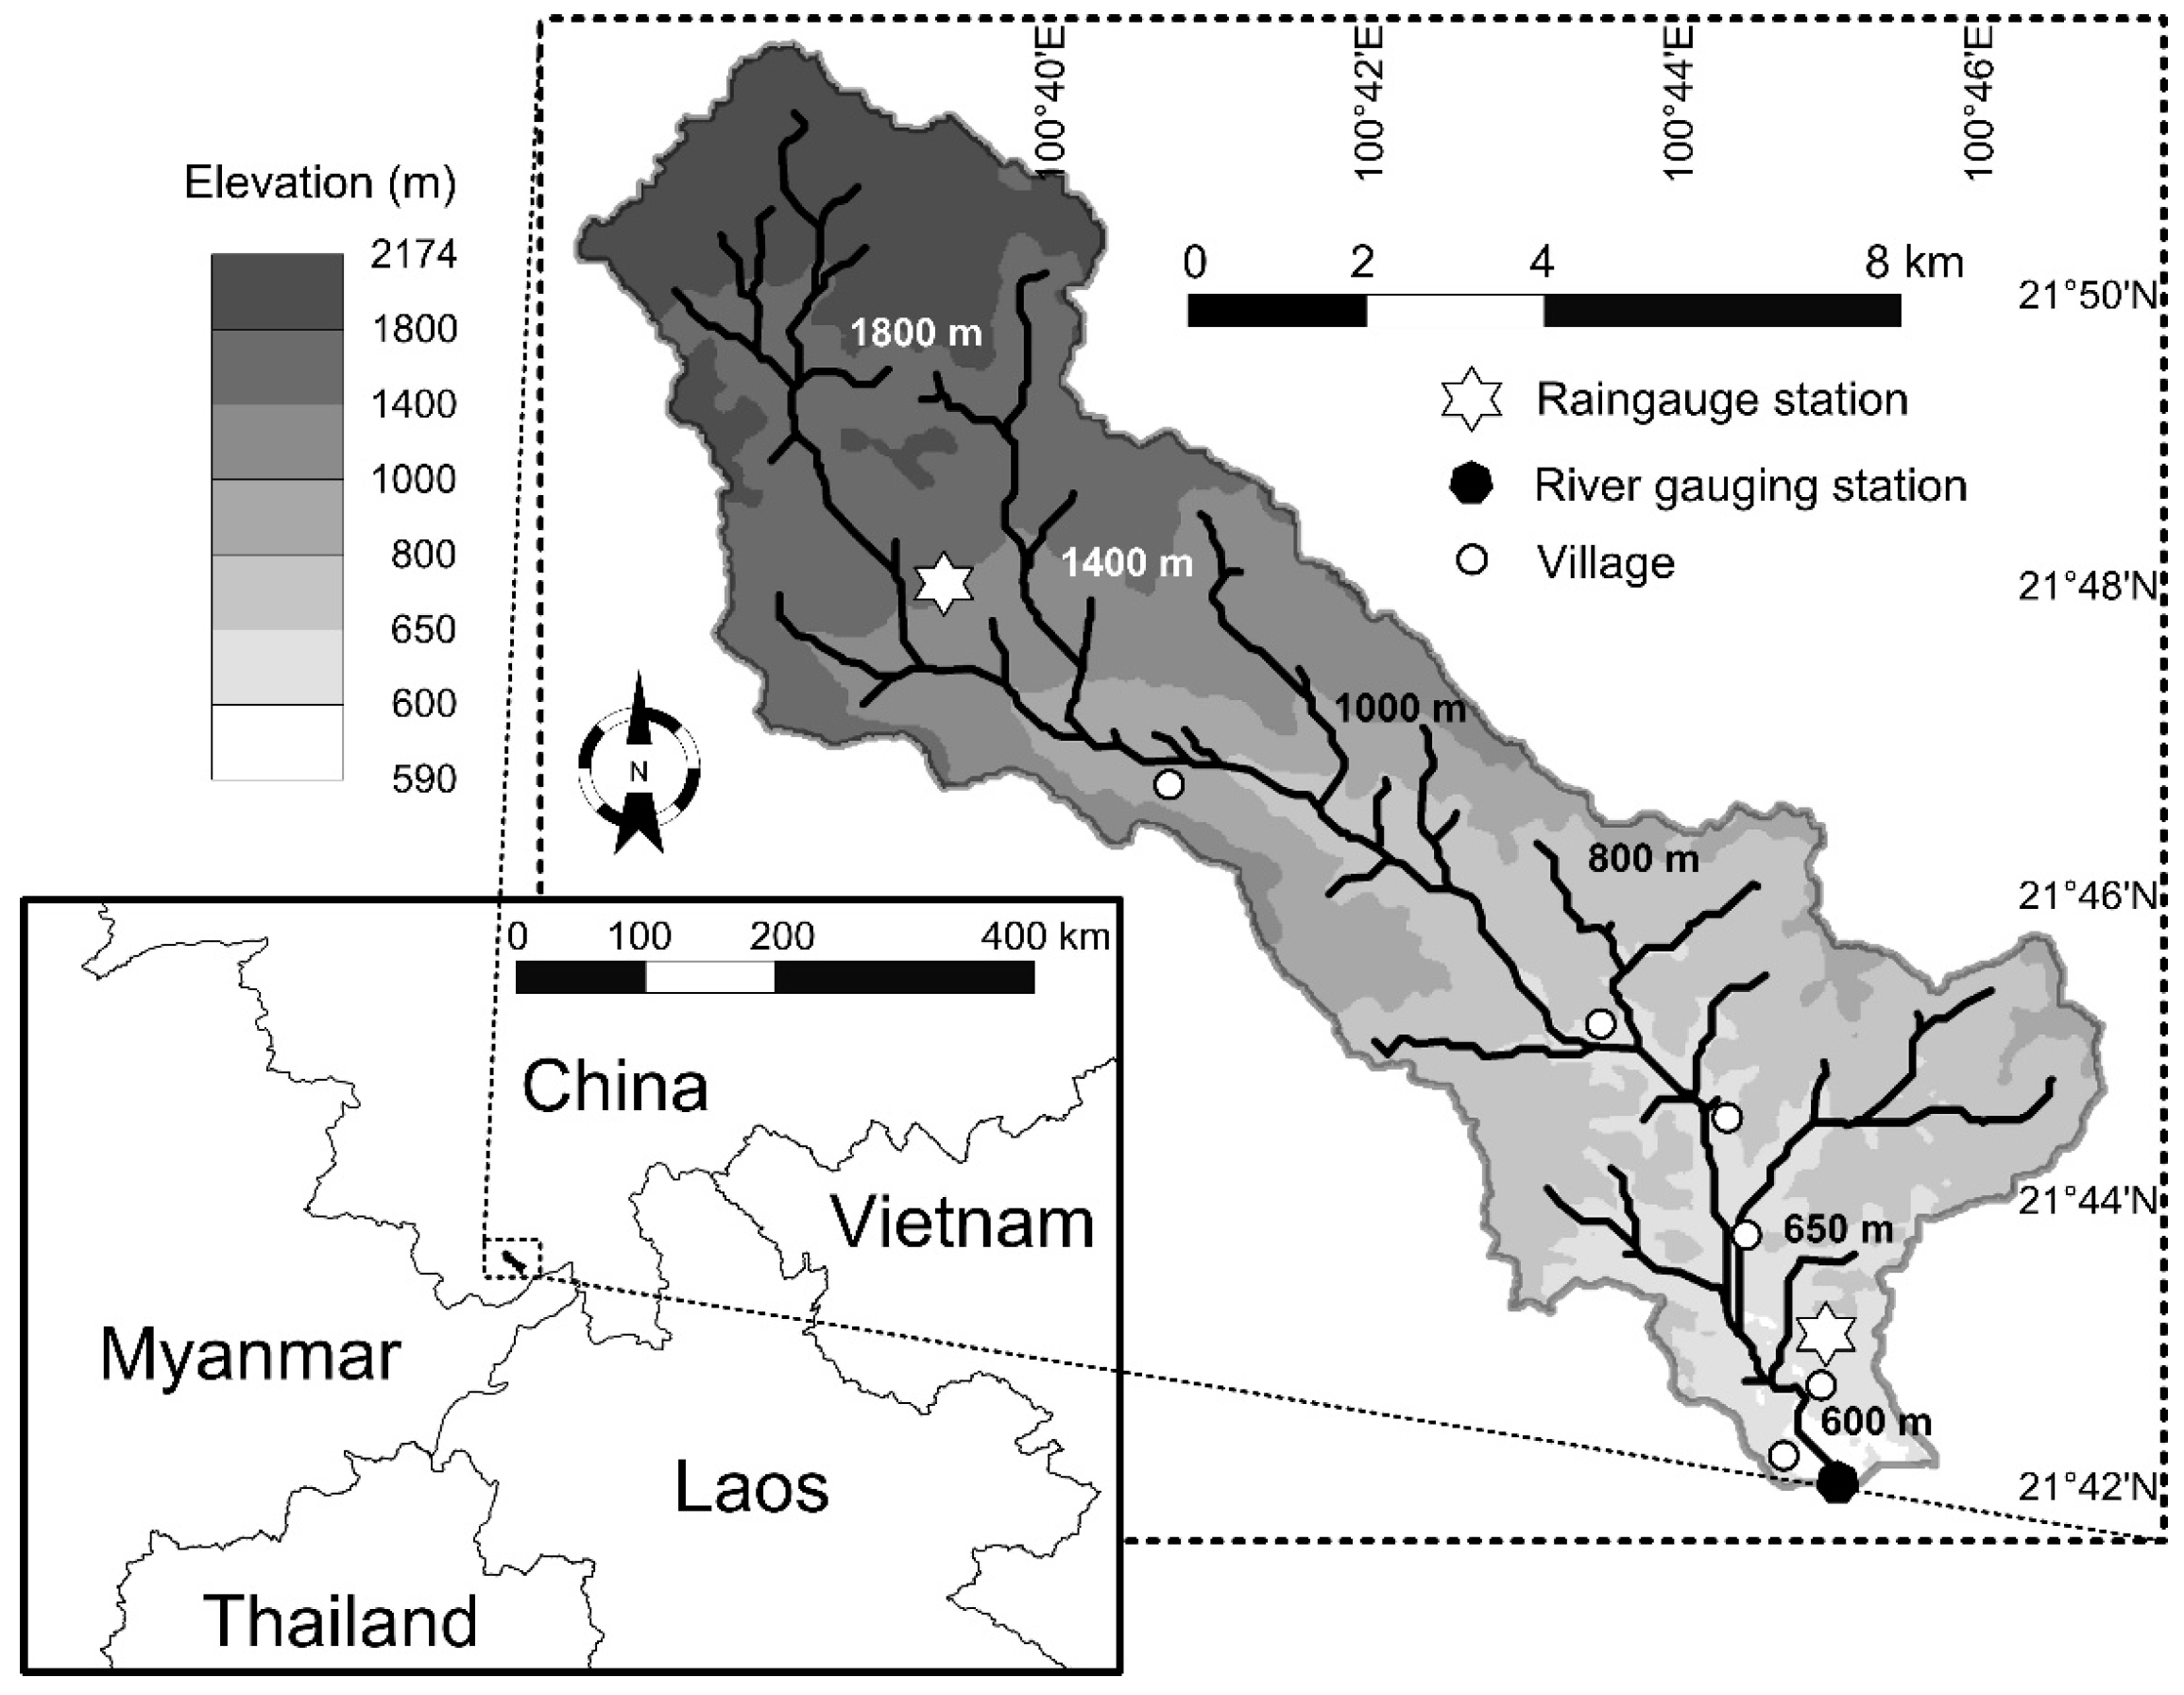
In the Xishuangbanna prefecture, about 80% of rubber plantations are located at elevations below 1000 m, on slopes varying between 8 and 25 degrees [29]. More recently, rubber trees were planted in the less suitable remaining areas, with steeper slopes at a higher elevation [30].
The watershed of the Nan’a River (95.1 km2) in the Upper Mekong Basin, is located in the southwestern part of the Xishuangbanna prefecture, Yunnan Province, China, about 11 km from Myanmar. The elevation and annual average temperature range from 590 to 2174 m [31] (Figure 1) and from 30.4 to 22.2 °C, respectively. According to the hydrometeorological data recorded by the Xishuangbanna Water Resources and Hydrological Bureau, mean annual rainfall (1992–2005) varied from 1373 mm in the lower part of the basin to 1767 mm in the upper part; over the same period, mean annual streamflow yielded 754 mm. About 85% of annual rainfall occurs in the wet season (May–October). The mean lowest flow (26.1 mm·mo−1) and highest flow (132.3 mm·mo−1) are generally observed in April and August, respectively. In 2013, the watershed included six villages inhabited by 2860 persons whose main income originated from rubber. Before rubber plantations started expanding in the watershed in the late 1980s, farmland in the lower part of the watershed included paddy rice and vegetables. Farmland in the upper part of the watershed included rainfed rice and corn. Most of the farmland in the lowland was converted to banana plantations in the 2010s, following a drop in rubber price. No major water infrastructures, such as dams, existed in the watershed during the study period.
2.2. Hydrometeorological Data
The two rain gauges installed by the Xishuangbanna Water Resources and Hydrological Bureau are located in the downstream and upstream parts of the watershed (Figure 1) and have been recording daily rainfall since 1992. The watershed-scale daily areal rainfall was derived from the point measurements using the Thiessen polygons method. The daily stream water level has been measured at the outlet of the watershed since 1992 with a water level recorder at 10-minute time intervals (Figure 1). Due to the stability of the river cross section at the watershed outlet, the rating curve (relationship between water level and discharge) was determined only once, when measurements were initiated in 1992. The streamflow gauging station was abandoned in 2006. These hydrometeorological data underwent quality control by the Yunnan Water Resources and Hydrological Bureau. Inter-annual means of areal monthly reference evapotranspiration (ET0) were derived from the Climate Research Unit database [32].
2.3. Land-Cover Mapping
A visual interpretation of three Landsat products (TM1992, ETM2002, and TM2007) with 30 m resolution [33], and one RapidEye product from 2010 with 5 m resolution [34] resampled to 30 m resolution allowed the mapping of six major land-cover types inside the watershed: forest, rubber, grassland, farmland, settlement, and open water bodies. The overall accuracy of this classification was assessed by calculating an error matrix applied to 59 ground control points for the 2010 land-cover map and by computing the Kappa coefficient. Land-cover transitions between 1992 and 2002 and between 2002 and 2007 were quantified using the intersection method available in ArcGIS [35,36]. The spatial distribution of rubber plantations across elevations and slopes in 1992, 2002, and 2007 was analyzed using a 30 m digital elevation model [31] and standard algorithms available in ArcMap 10.2.
2.4. Assessment of Hydrological Changes
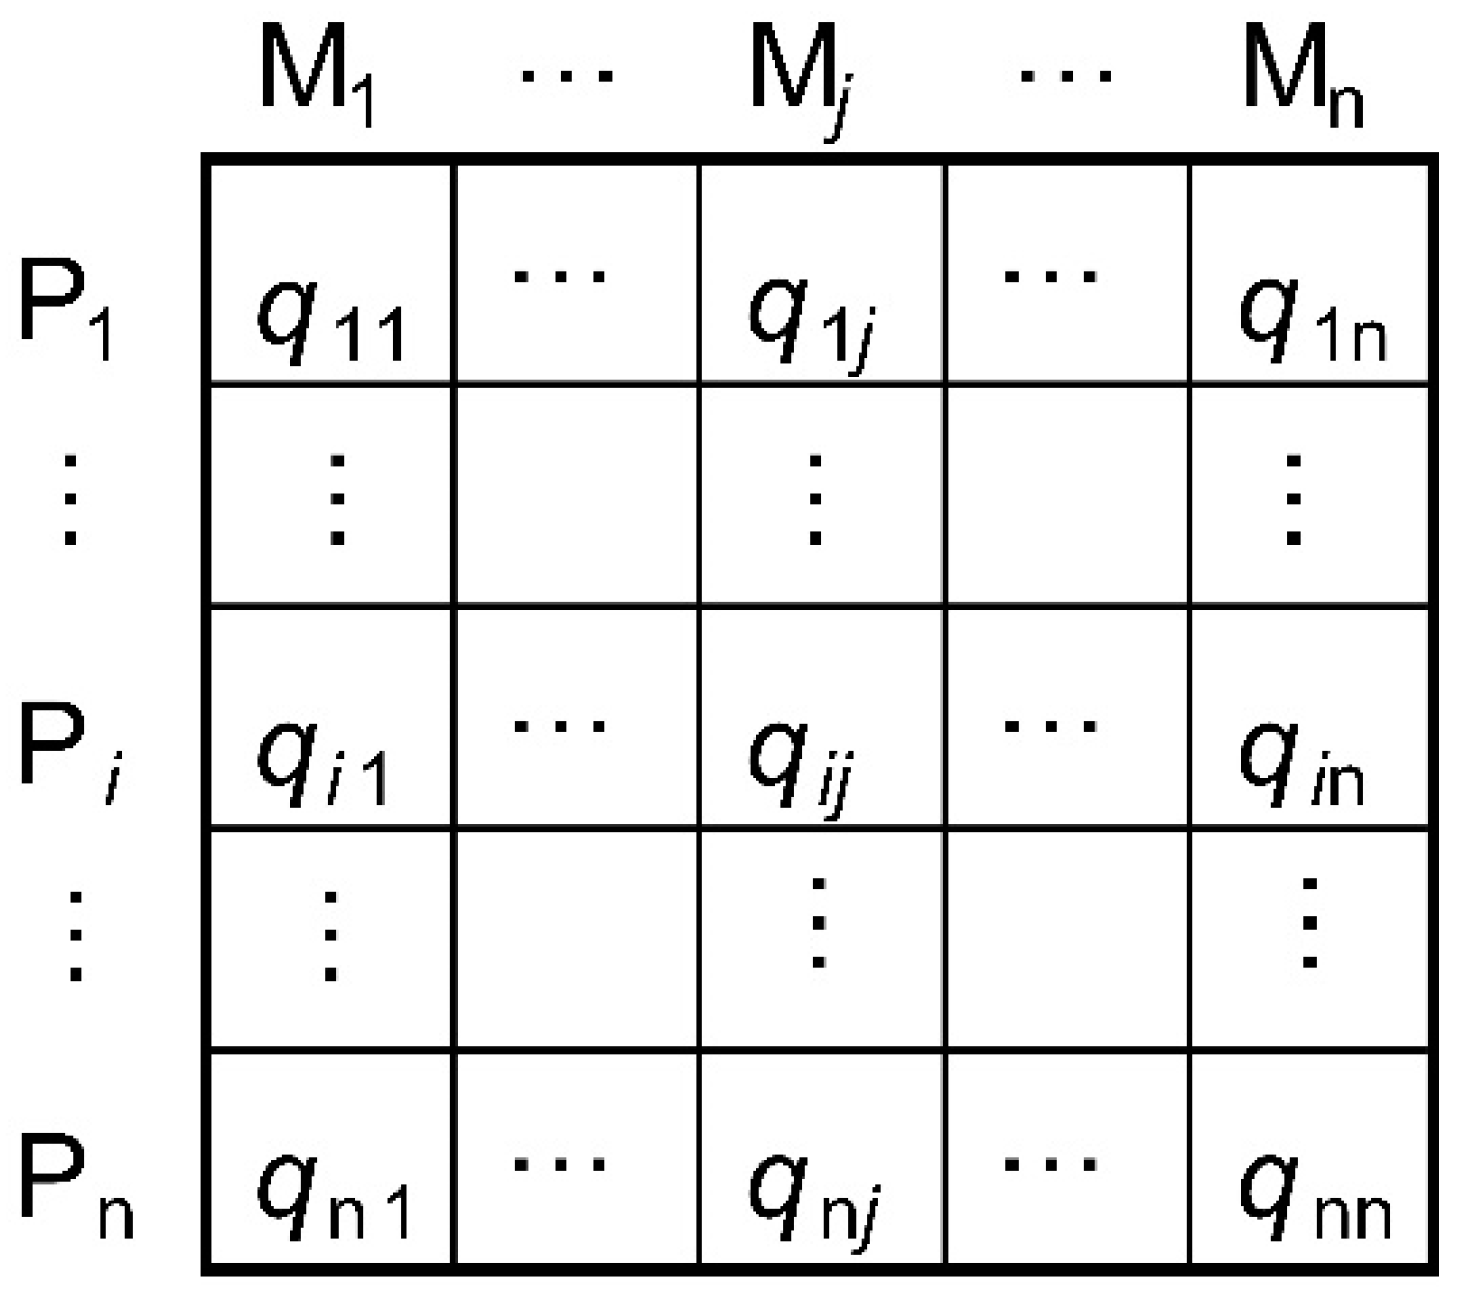
Inter-annual variation in the rainfall–runoff relationship was quantified by producing cross-simulation matrices using the model GR2M [37]. GR2M is a monthly lumped conceptual water balance model that was empirically developed using a sample of 410 basins under a wide range of climate conditions. GR2M requires areal rainfall and ET0 to estimate streamflow. The model includes a soil moisture accounting production store and a routine store that empties following a quadratic function. The two parameters of the model determine the capacity of the production store and the value of an underground water exchange coefficient applied to the routine store. Compared with several widely used water balance models, GR2M ranks amongst the most reliable and robust [37]. For this analysis, like in most hydrological analyses performed in the Mekong Basin, each hydrological year starts in April and ends in March of the following year, so as to group rainfall and related streamflow in the same year. The model was repeatedly calibrated over each hydrological year of the study period. The first year (April 1992–March 1993) was dedicated to model warming for the adjustment of the initial water levels in the model reservoirs. Thirteen model calibrations were produced from April 1993 to March 2006. Over each hydrological year, the model was calibrated by maximizing the Nash-Sutcliffe efficiency criteria (NSEq) applied to streamflow q (mm·mo−1) for the evaluation of hydrological changes during the wet season. The Nash-Sutcliffe efficiency criteria calculated on the logarithm of q (NSElnq) was used for the evaluation of hydrological changes during the dry season [38]. While each of these two efficiency criteria are calculated with the 12 monthly flow values of each 1-year calibration period (including wet- and dry-season streamflow), NSEq and NSElnq give more weight to high- and low-flow values, respectively. The constraint of a less than 10% bias on cumulated streamflow over each sub-period was applied to the calibrations. Each model Mj calibrated over the hydrological year j (1 < j < 13) was run in simulation mode over the whole study period, April 1993–March 2006, to produce a cross-simulation matrix (Figure 2). This process was performed twice to produce two matrices: one matrix of wet season streamflow (cumulated from May to October) simulated with models optimized with NSEq, and one matrix of dry season streamflow (cumulated from November to April) simulated with models optimized with NSElnq.
Streamflow qij is simulated with the model Mj capturing the watershed behaviour of hydrological year j, using rainfall from the hydrological year i (i ∈ [1 − n]). In a given row i, streamflow variations between columns are due to non-climatic changes (e.g., land-cover changes). In a given column j, streamflow variations between rows reflect inter-annual rainfall variability under stable watershed conditions. Variations in simulated streamflow between the columns of the matrices were plotted against time to illustrate temporal changes in the hydrological behaviour of the watershed. In these simulations, the monthly rainfall input to the model is used in loop each year and corresponds to the rainfall of the hydrological year April 1996–March 1997, exhibiting median annual depth over the studied period. Similar modeling framework was successfully performed in a previous study [25].
To assess the statistical significance of changes in the rainfall–runoff relationship over any multi-year sub-period, the non-parametric test proposed by [39] was applied to the corresponding cross-simulation matrix. Following the prescribed methodology, the cross-simulations matrices (one for wet season streamflow and one for dry season streamflow) were re-sampled by permuting columns. The statistic S was calculated for the original matrix and for each re-sampled one using Equation (1):
Under the null hypothesis H0 of an absence of unidirectional trend in the hydrological behavior of the watershed over the studied period, the value of S associated to the original matrix should be close to zero. A negative (resp., positive) value denotes a decreasing (resp., increasing) trend in the basin water yield. The p-value of a negative (resp., positive) trend is assessed by calculating the non-exceedance (resp., exceedance) frequency of the original S values compared to the range of S values derived from the permuted matrices.
3. Results
3.1. Land-Cover Change
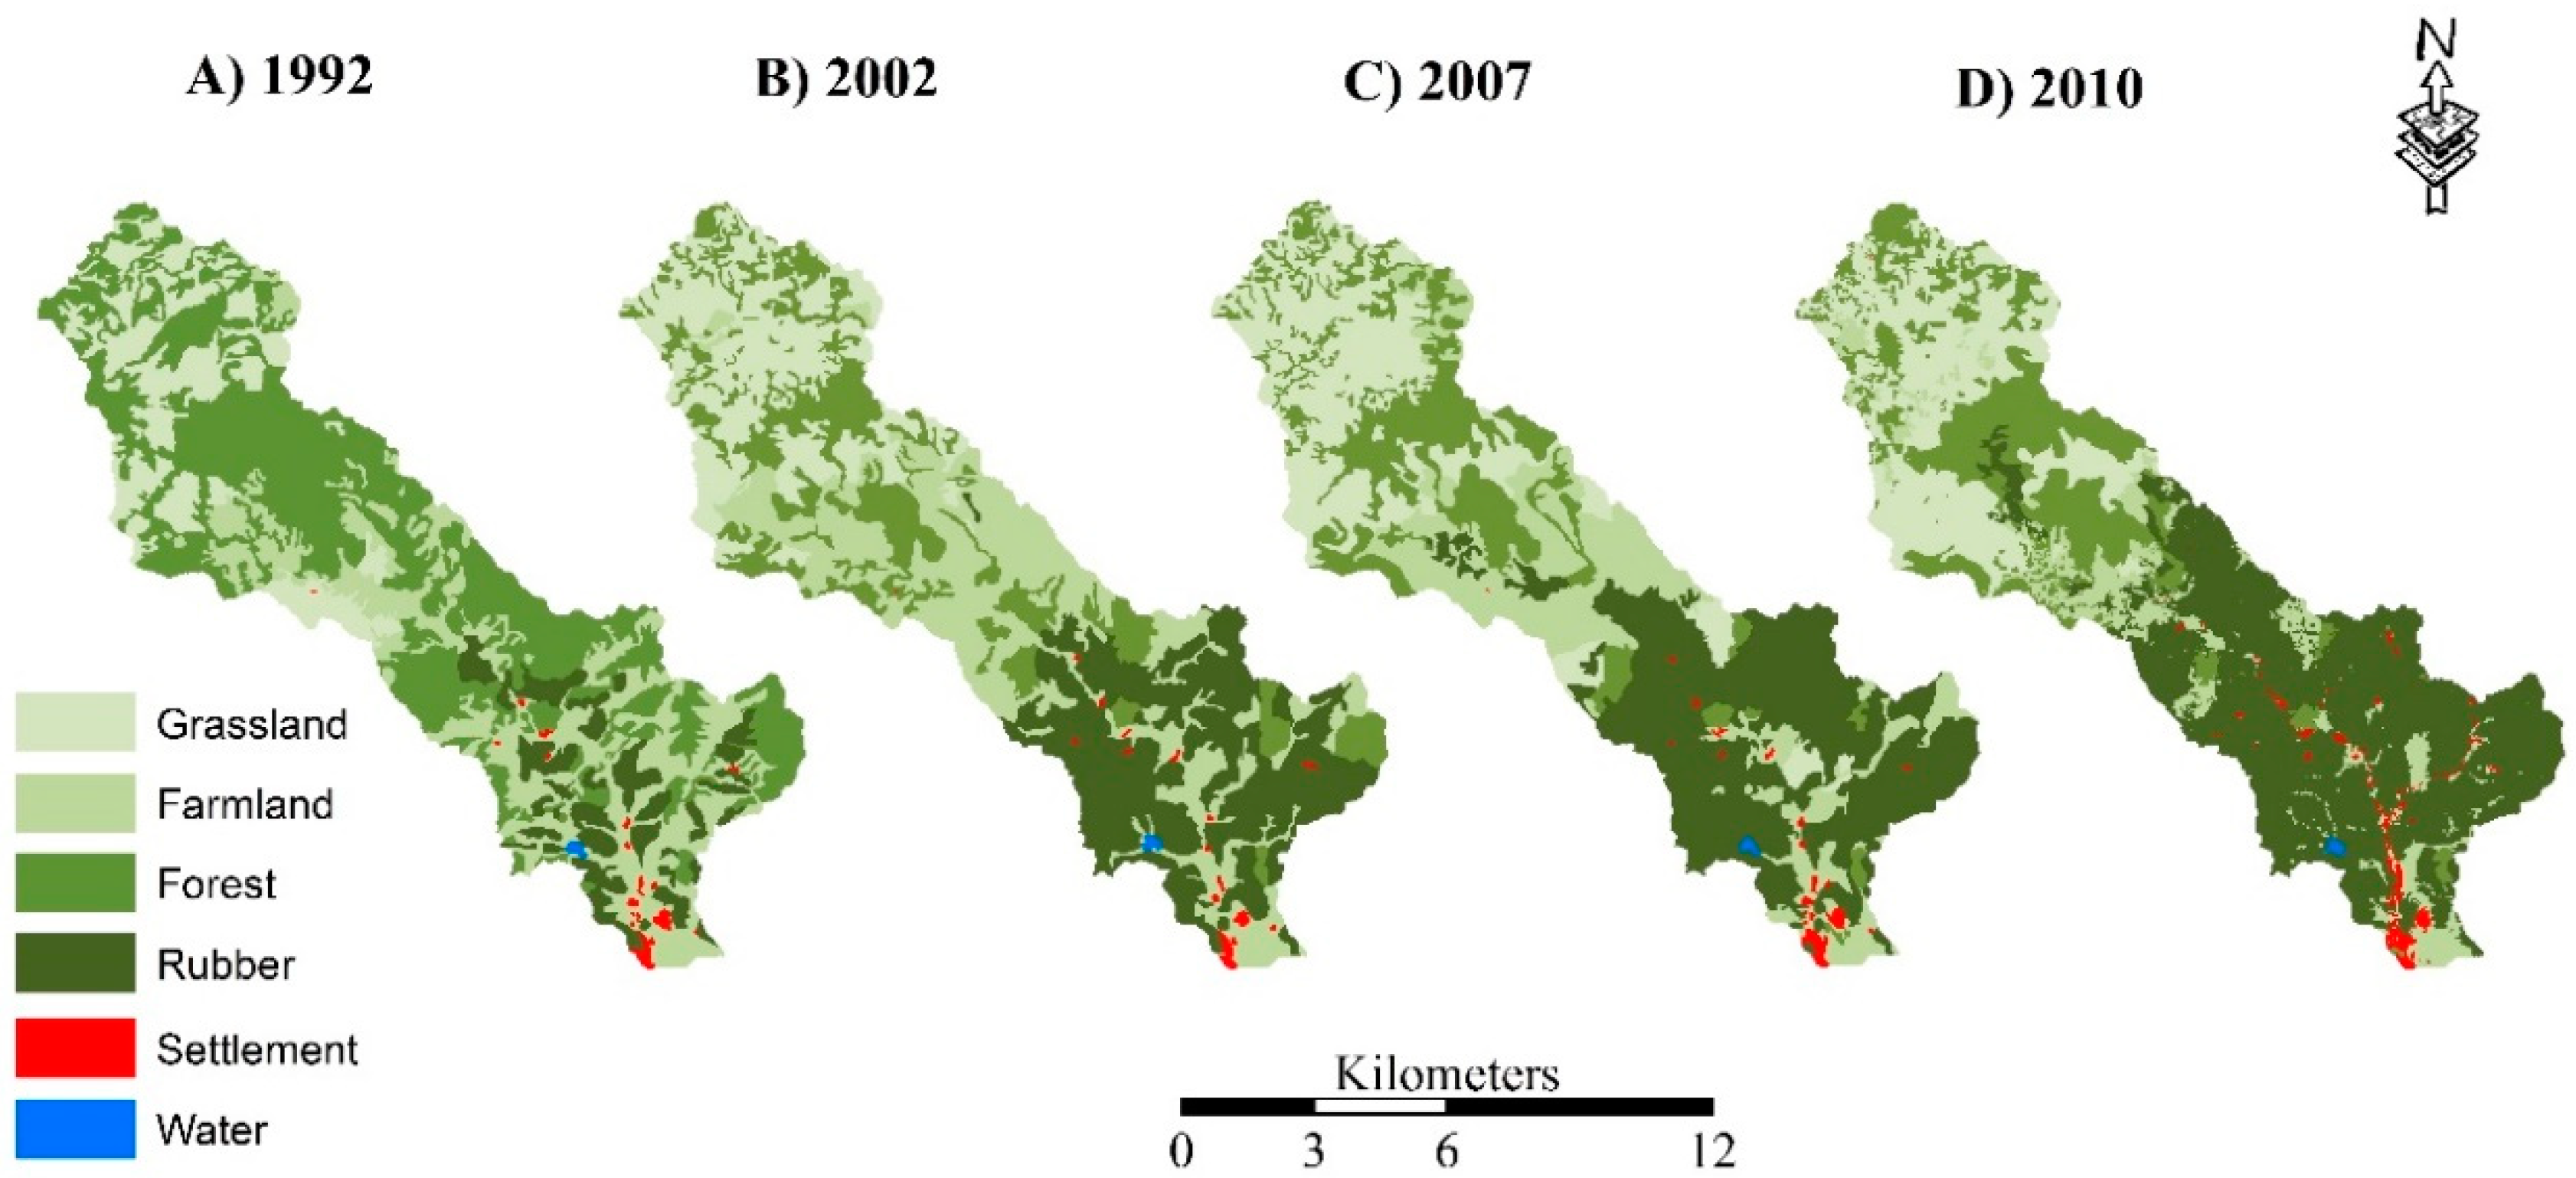
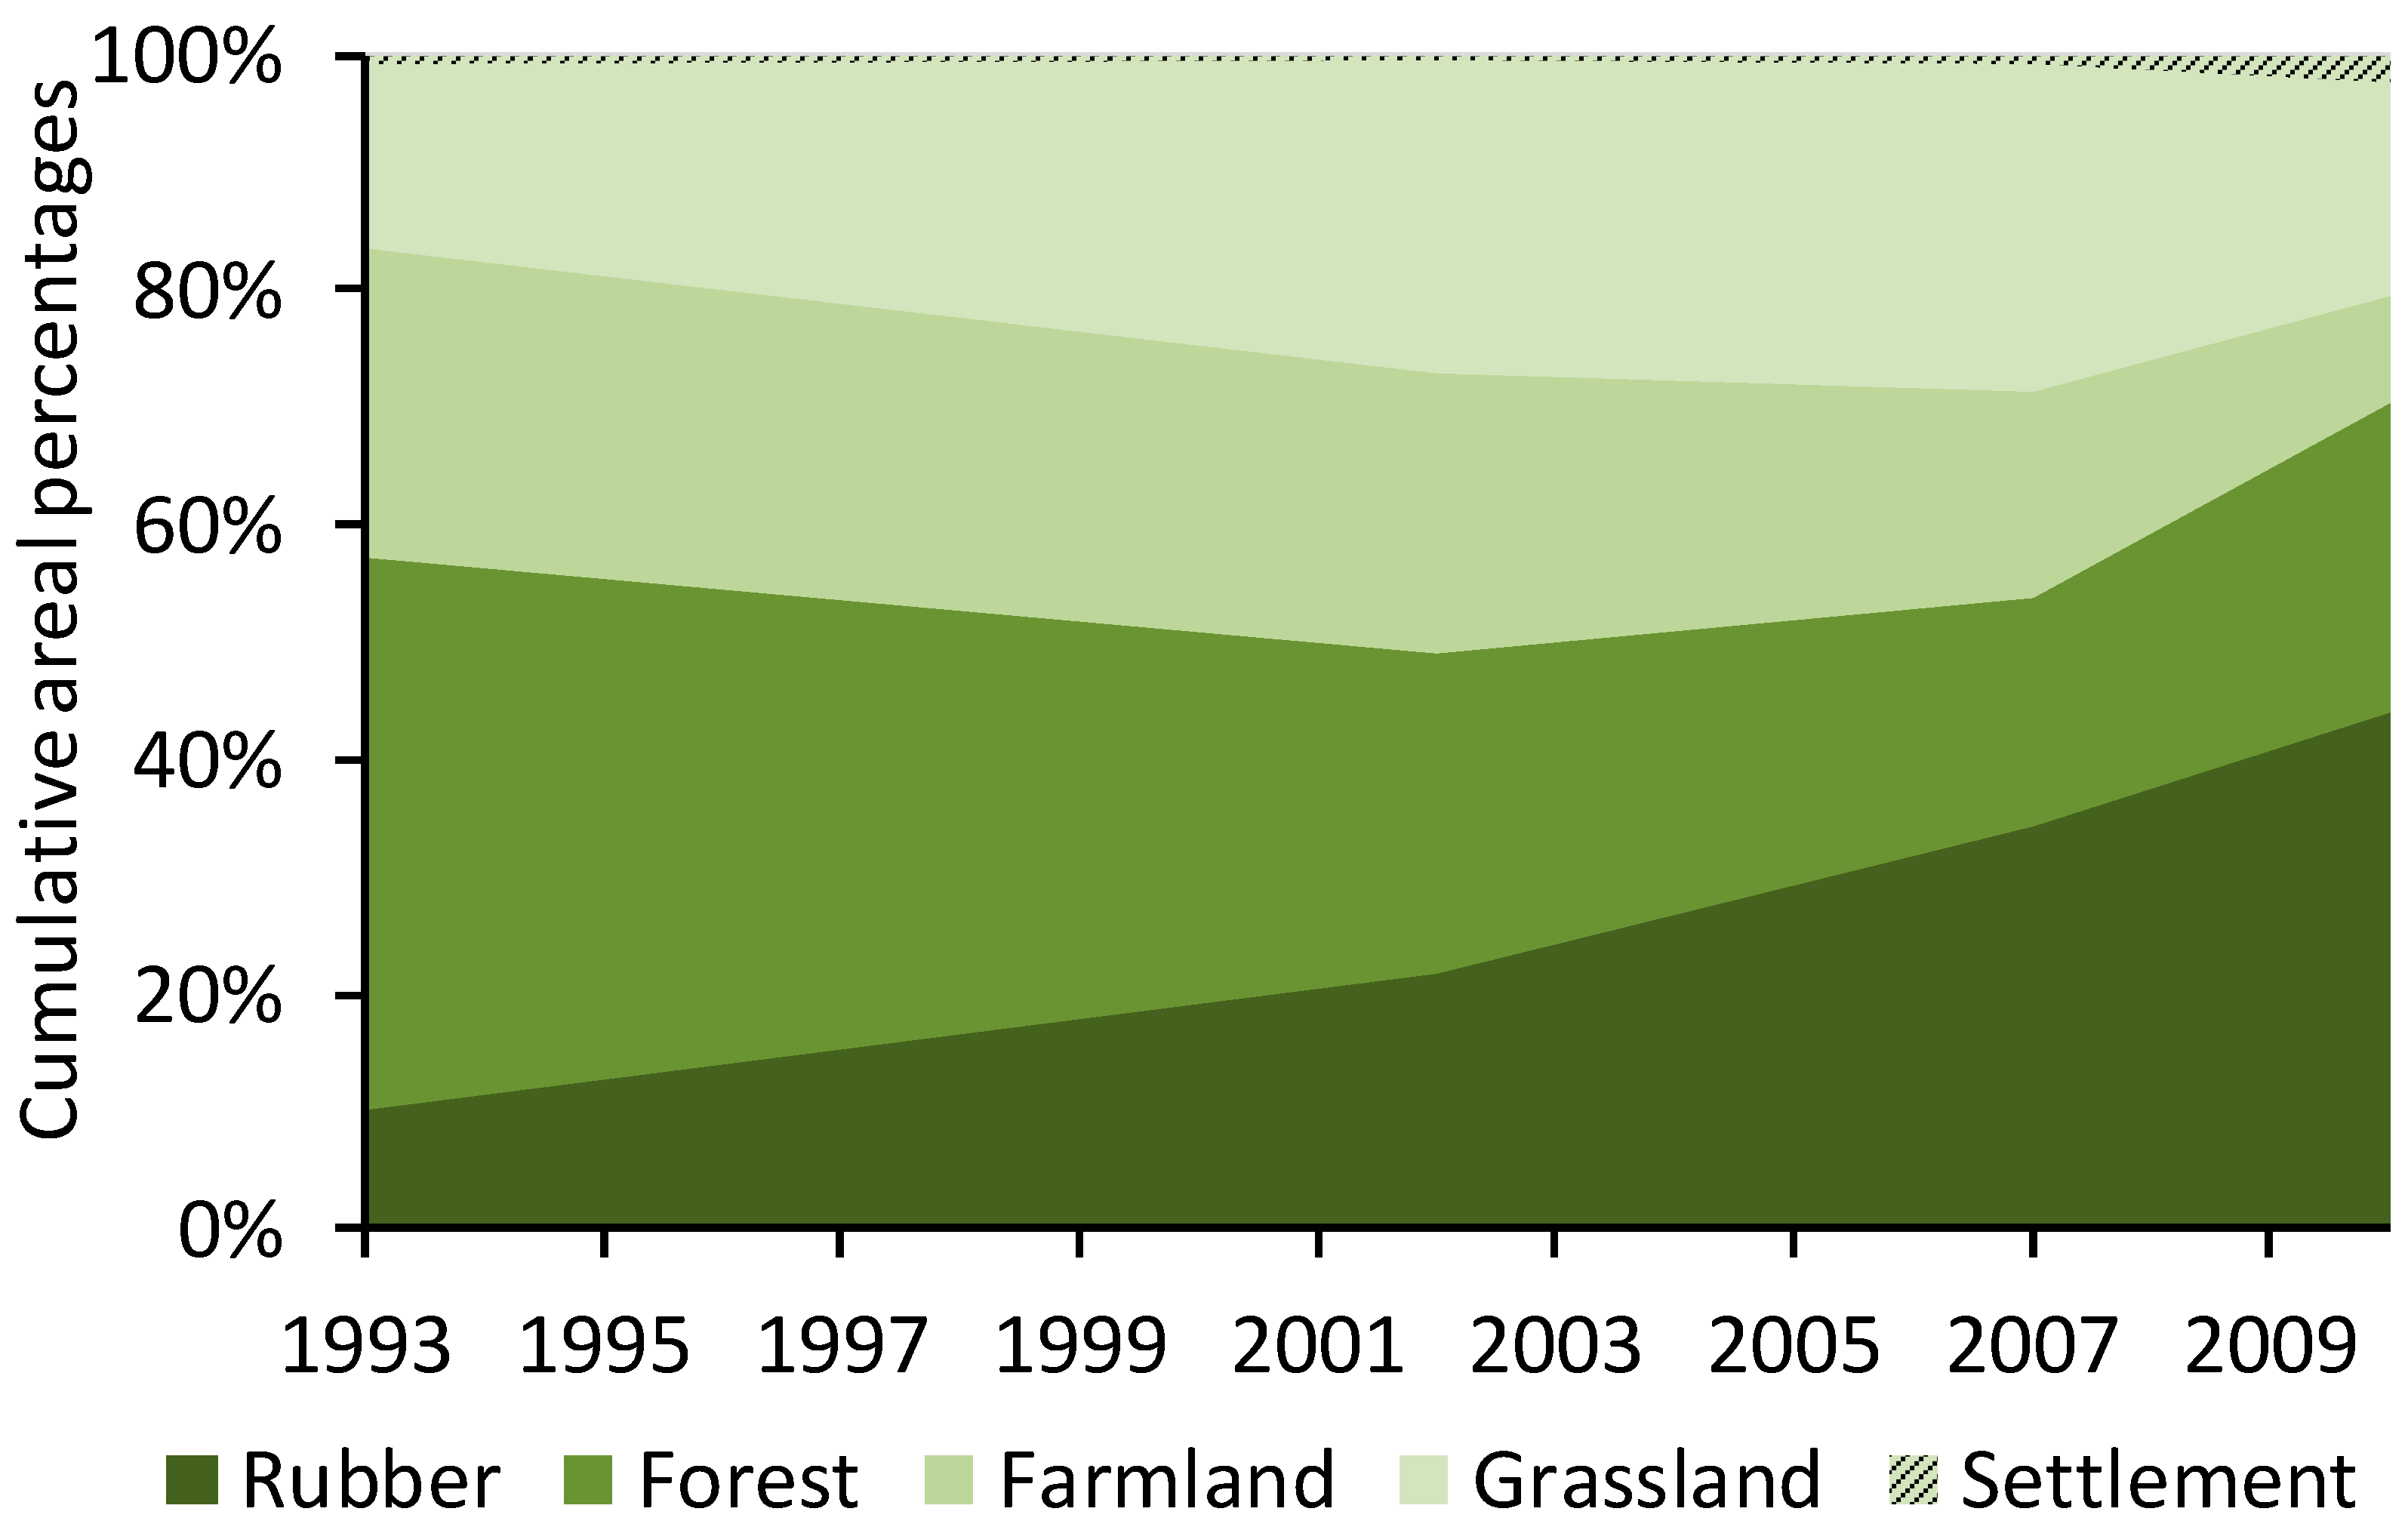
The land-cover classification was found to be reliable, with an overall accuracy of 89.1% and a Kappa coefficient of 0.85. Figure 3 shows spatial and temporal changes in the spatial distribution of land-cover types between 1992 and 2010. Temporal changes in the cumulative areal percentages of each land-cover type are displayed in Figure 4. Rubber plantations appeared first in the downstream part of the watershed nearby the six main villages and gradually spread upstream, replacing farmland and forest. From 1992 to 2010, the areal percentage of rubber tree plantations in the watershed increased from 10% to 44%, while forest area declined from 47% to 21% and farmland declined from 26% to 12%. Changes in grassland area (from 16% to 21%) and settlement area (from 0.7% to 1.2%) were moderate.
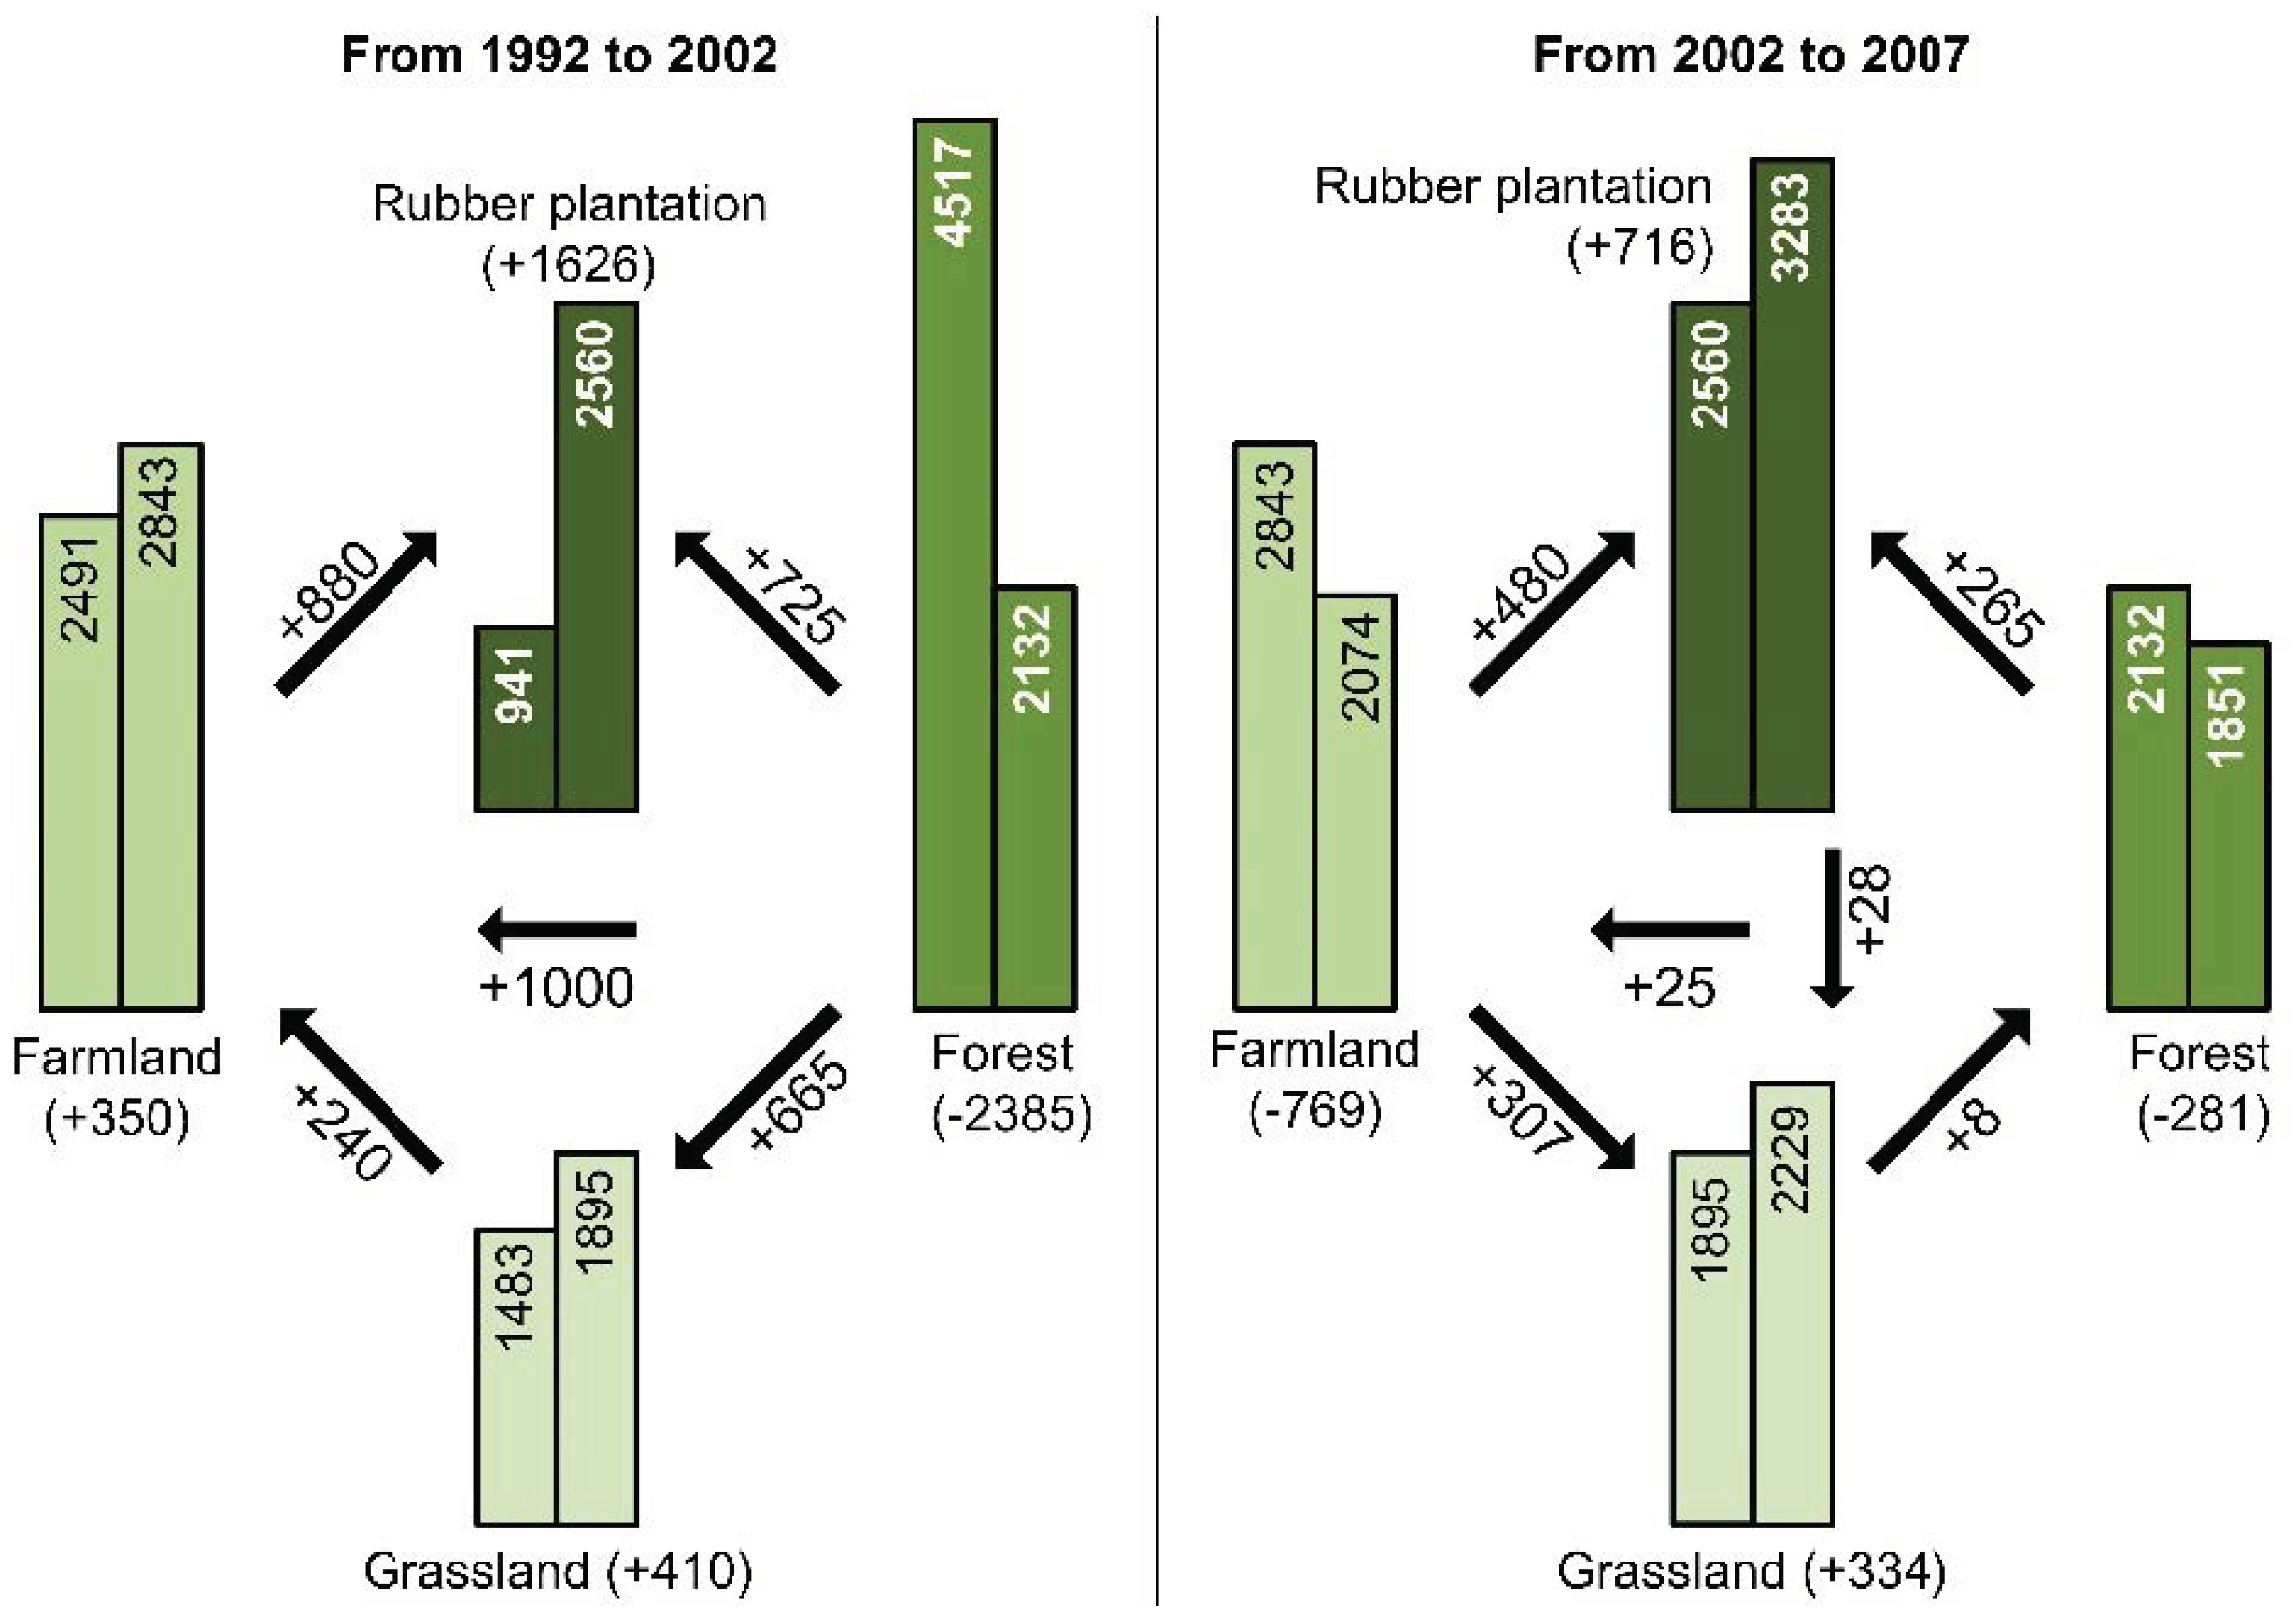
Figure 5 quantifies land-cover transitions. From 1992 to 2002, the forested area declined drastically from 4517 ha to 2132 ha. About 42%, 30%, and 28% of the deforested area was converted to farmland, rubber plantations, and grassland, respectively. While this land conversion increased the farmland area by 1000 ha of fertile land, another 880 ha of more degraded farmland were planted with rubber trees as a strategy to maintain the soil productivity. Over the same period, the grassland areas gained 665 ha from deforestation and lost 240 ha allocated to farmland. Land-cover dynamics were different from 2002 to 2007. Rubber tree plantations continued expanding at the expense of other areas, primarily farmland, and secondarily forest. About 300 ha of farmland reverted to grassland as a result of a land-use policy targeting slopping land for vegetation regeneration [40]. Over the whole period 1992–2007, rubber tree plantations and forest constantly expanded and declined, respectively.
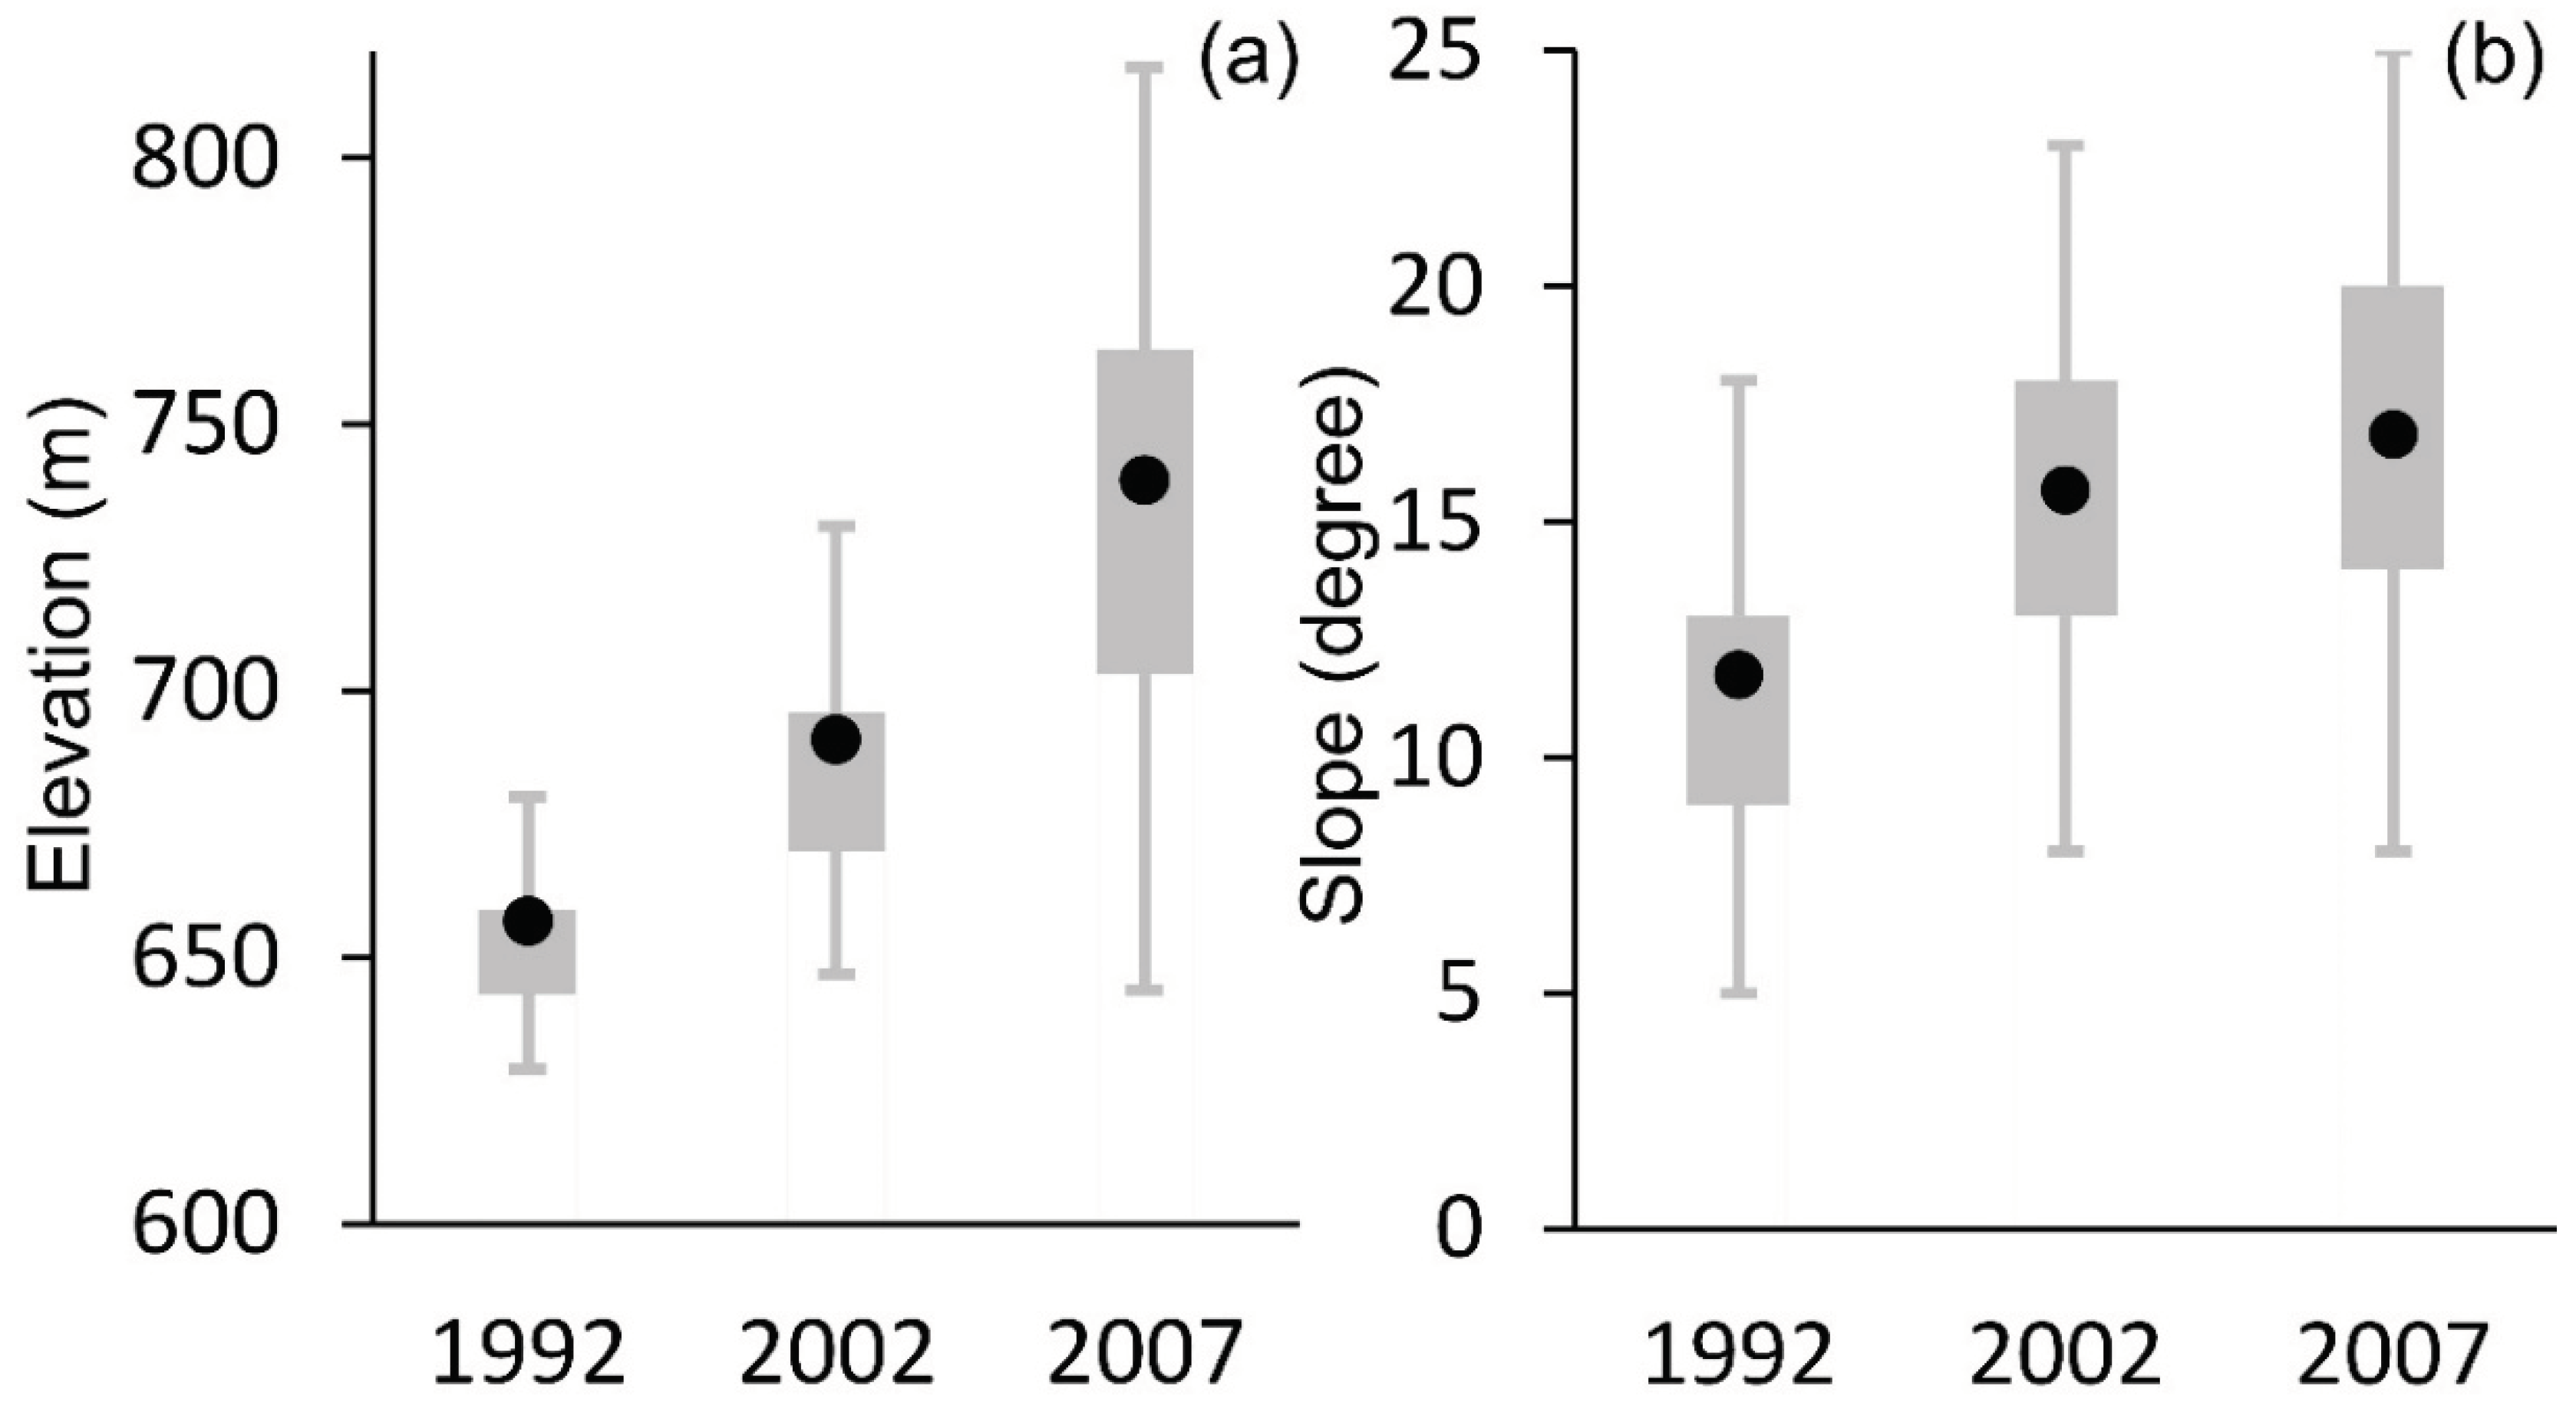
Figure 6 shows the temporal changes in the spatial distribution of rubber tree plantations in the watershed, according to elevation and slope. From 1992 to 2007, rubber plantations first occupied the most suitable and convenient land near the villages and roads in the lower part of the watershed, on gentle slopes and flat land. As the plantations continued expanding, the most suitable land became rarer and new rubber trees were planted on higher and steeper land. Between 1992 and 2007, the average elevation of rubber tree plantations increased from 657 m to 740 m (Figure 6a). Over the same period, the mean slope of rubber tree plantations increased from 12 to 17 degrees (Figure 6b).
3.2. Hydrological Change
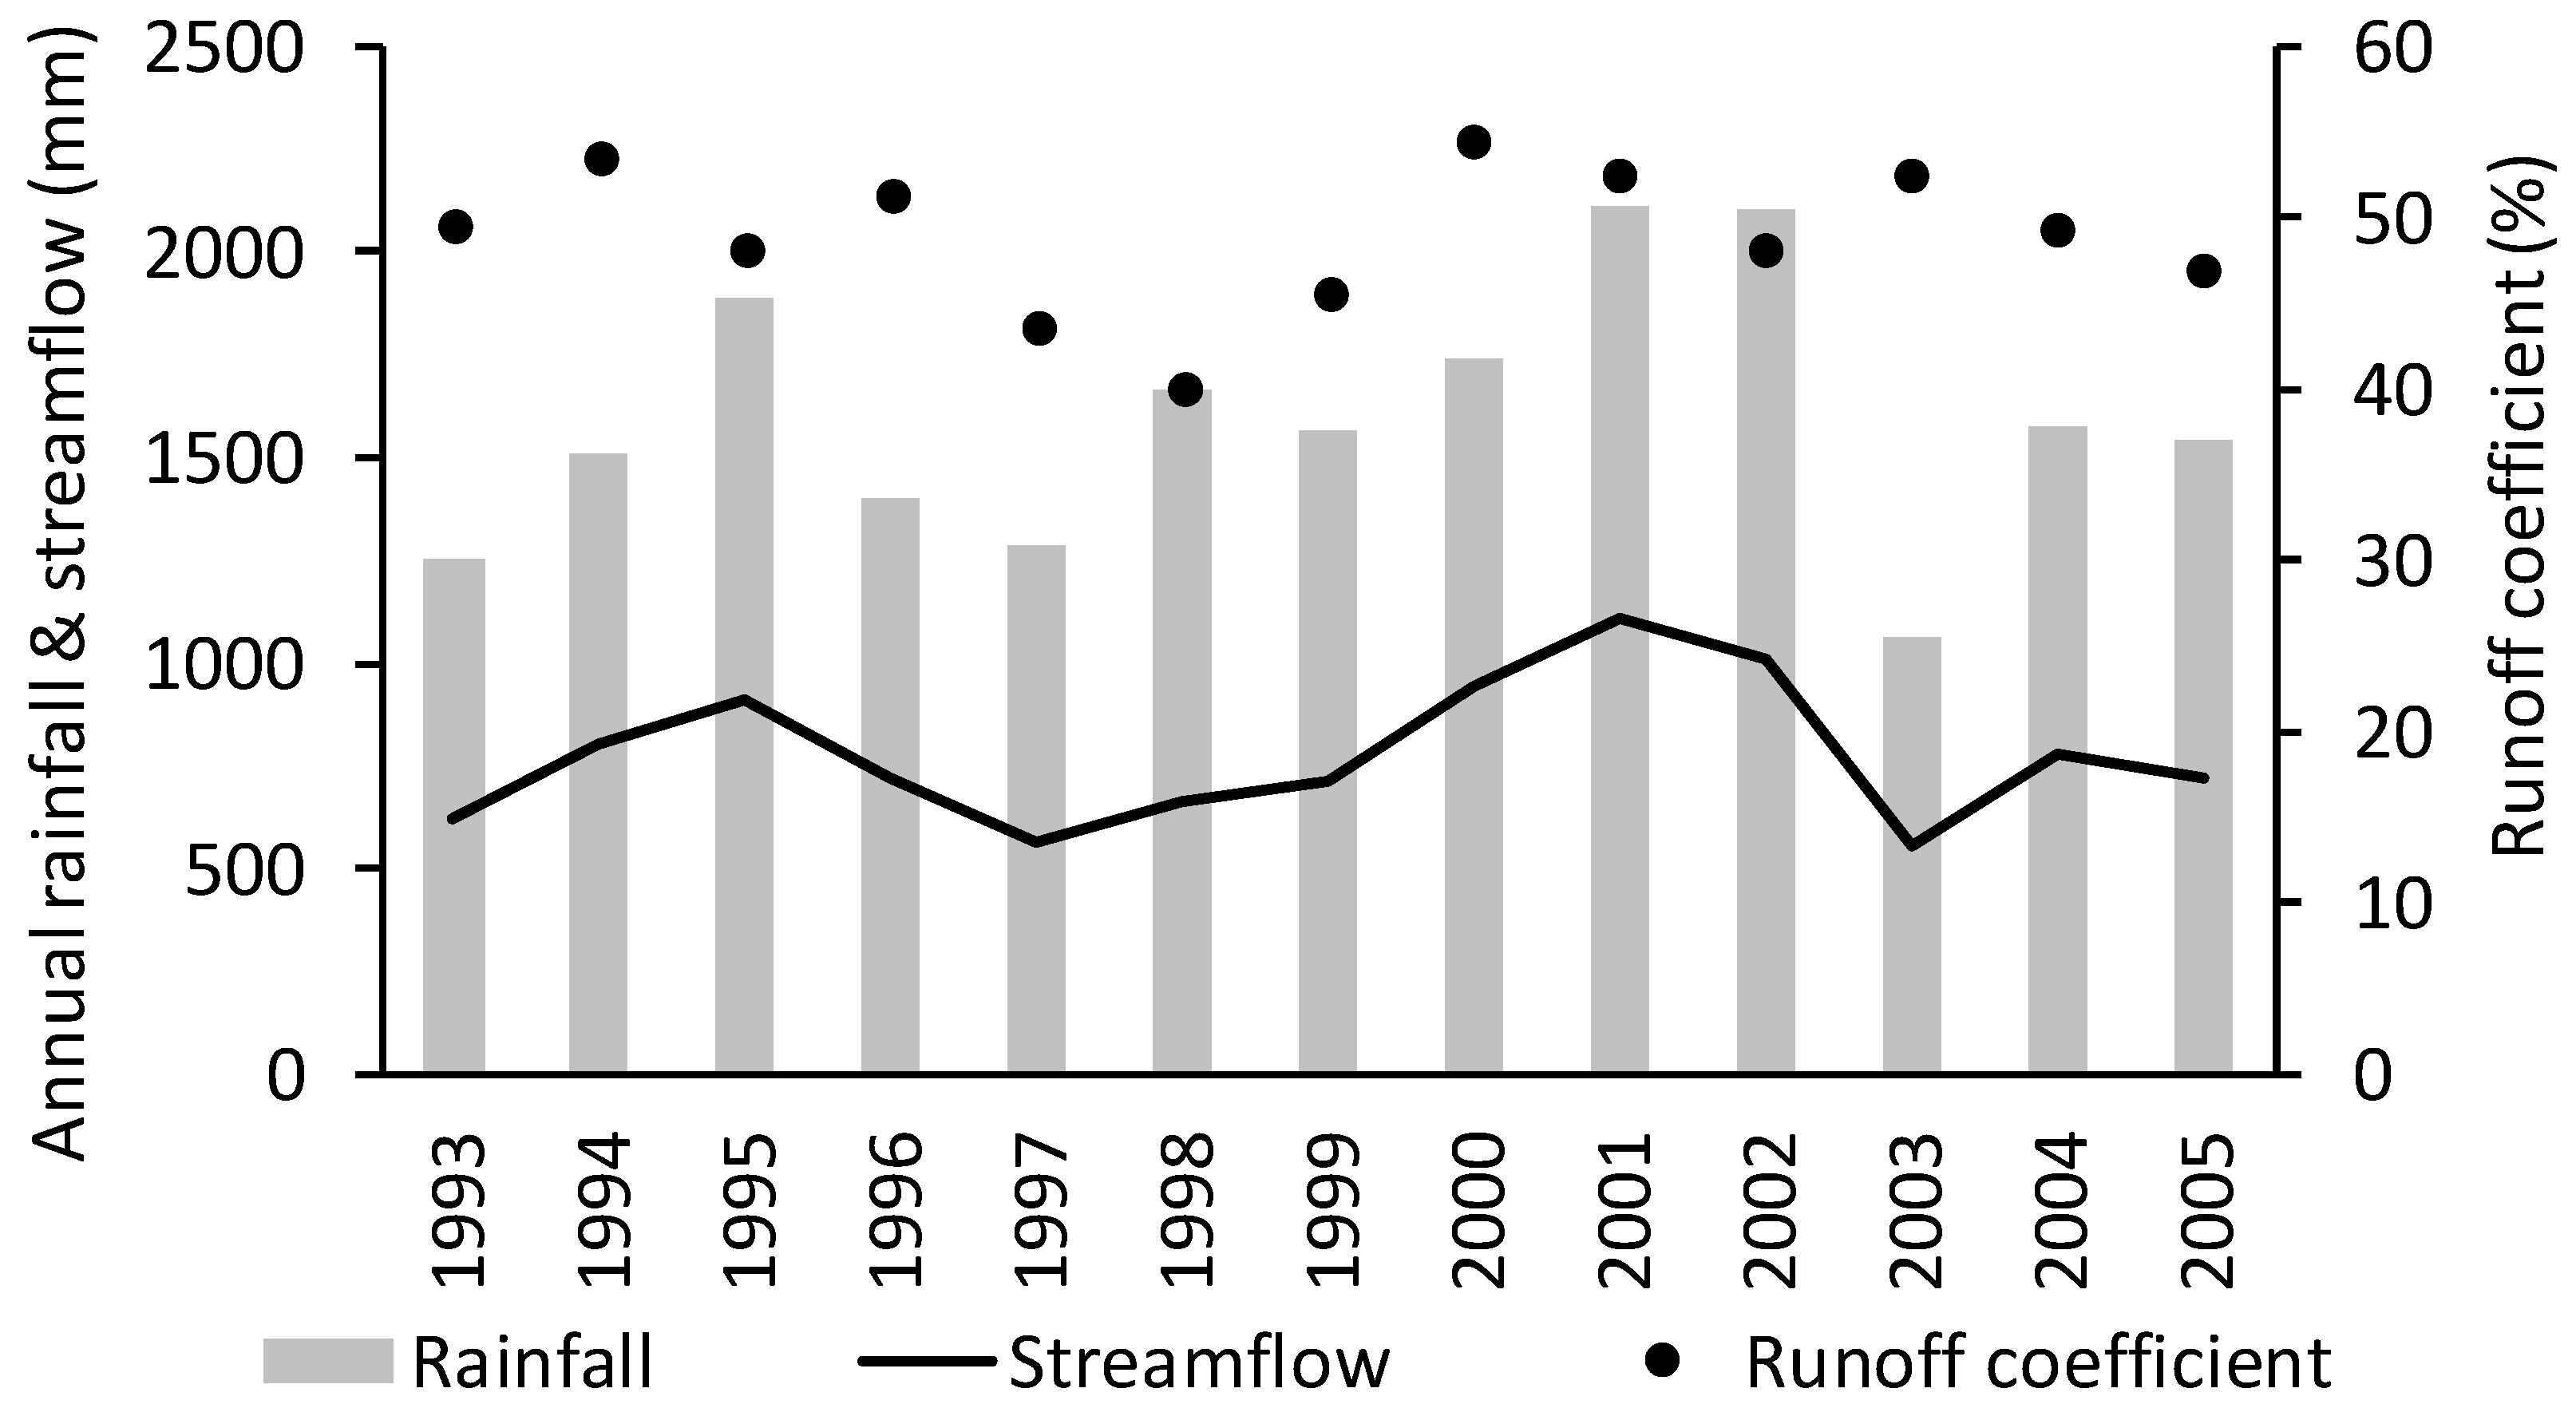
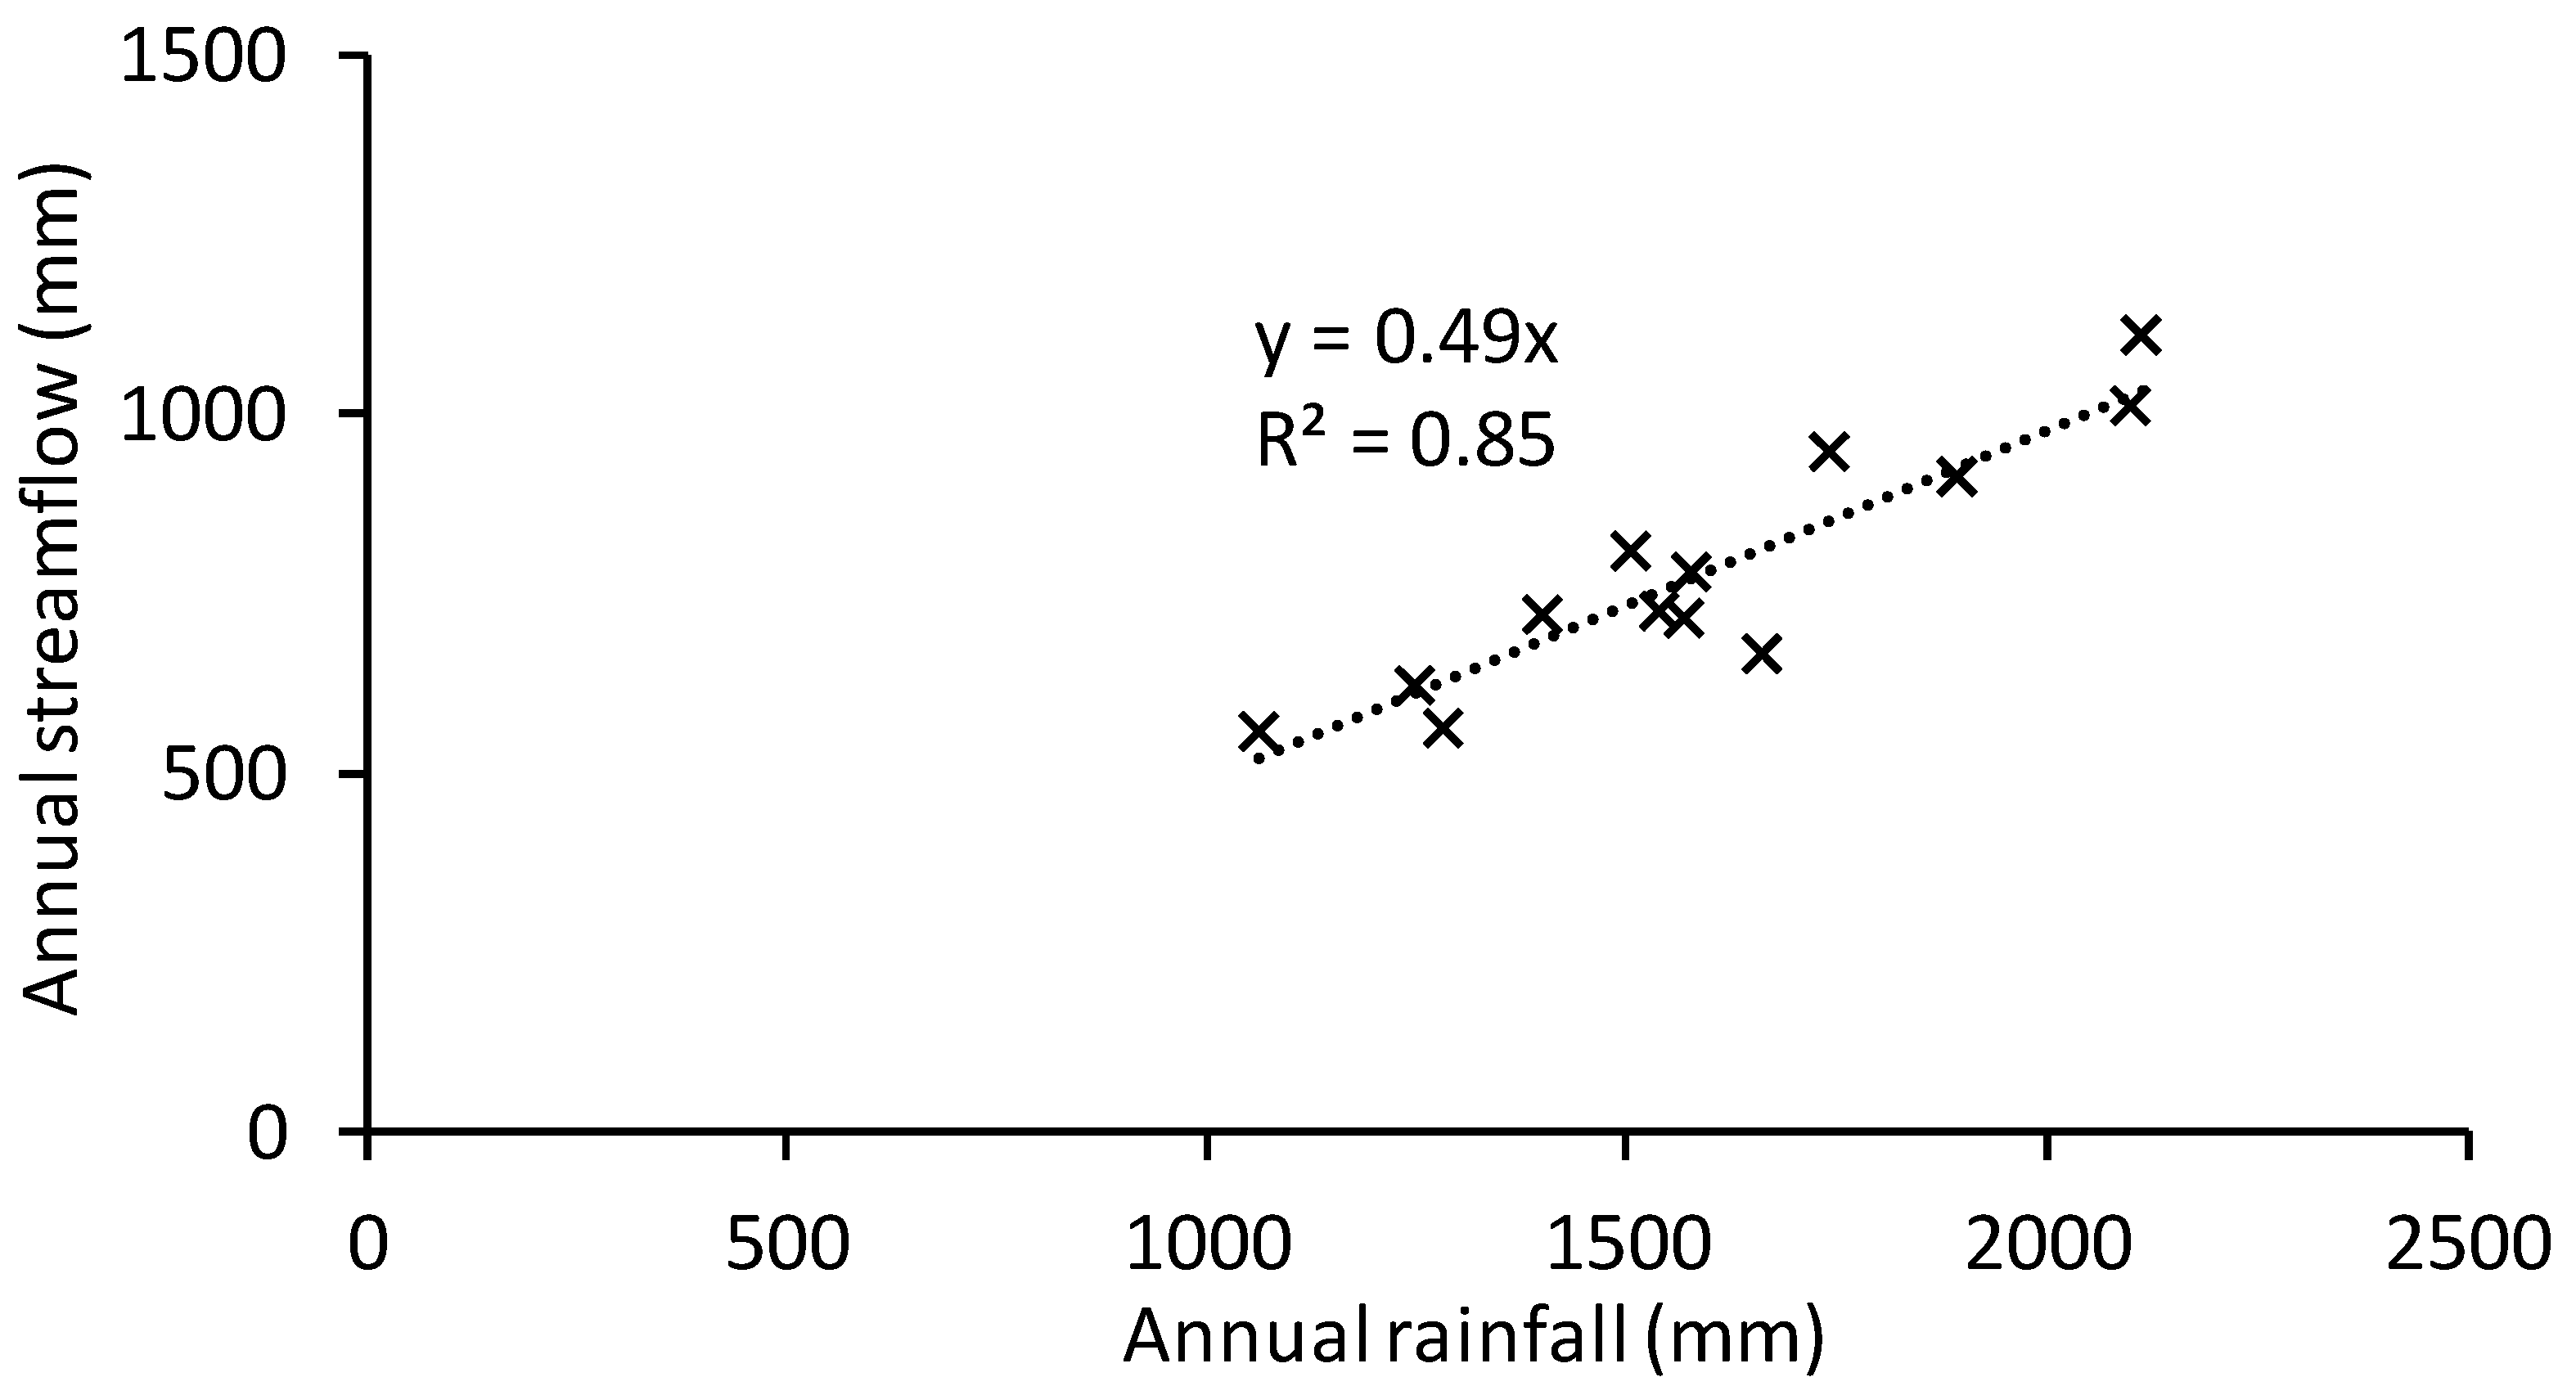
Figure 7 shows the temporal variation in annual rainfall, streamflow, and the runoff coefficient in the Nan’a watershed from 1993 to 2005. Inter-annual variability of rainfall exhibits 3- to 6-year cycles of gradual increase, with maximums in 1995 (1893 mm) and 2001 (2114 mm, the wettest year), and minimums in 1993 (1250 mm), 1997 (1285 mm), and 2003 (1063 mm, the driest year). While annual streamflow correlated with annual rainfall (r2 = 0.85, p = 0.00) (Figure 8), no correlation (r2 = 0.00) was observed between annual rainfall and annual runoff coefficient, yielding an inter-annual mean of 0.49.
The annual values of NSEQ and NSElnQ averaged over the whole study period are high: 88.8% and 90.2%, respectively. The lowest values were obtained for hydrological years 2004 (NSElnQ = 81.7%) and 1994 (NSEQ = 80.9%). All these values exceed 0.75, confirming that the performance of GR2M is very good in the studied watershed [41].
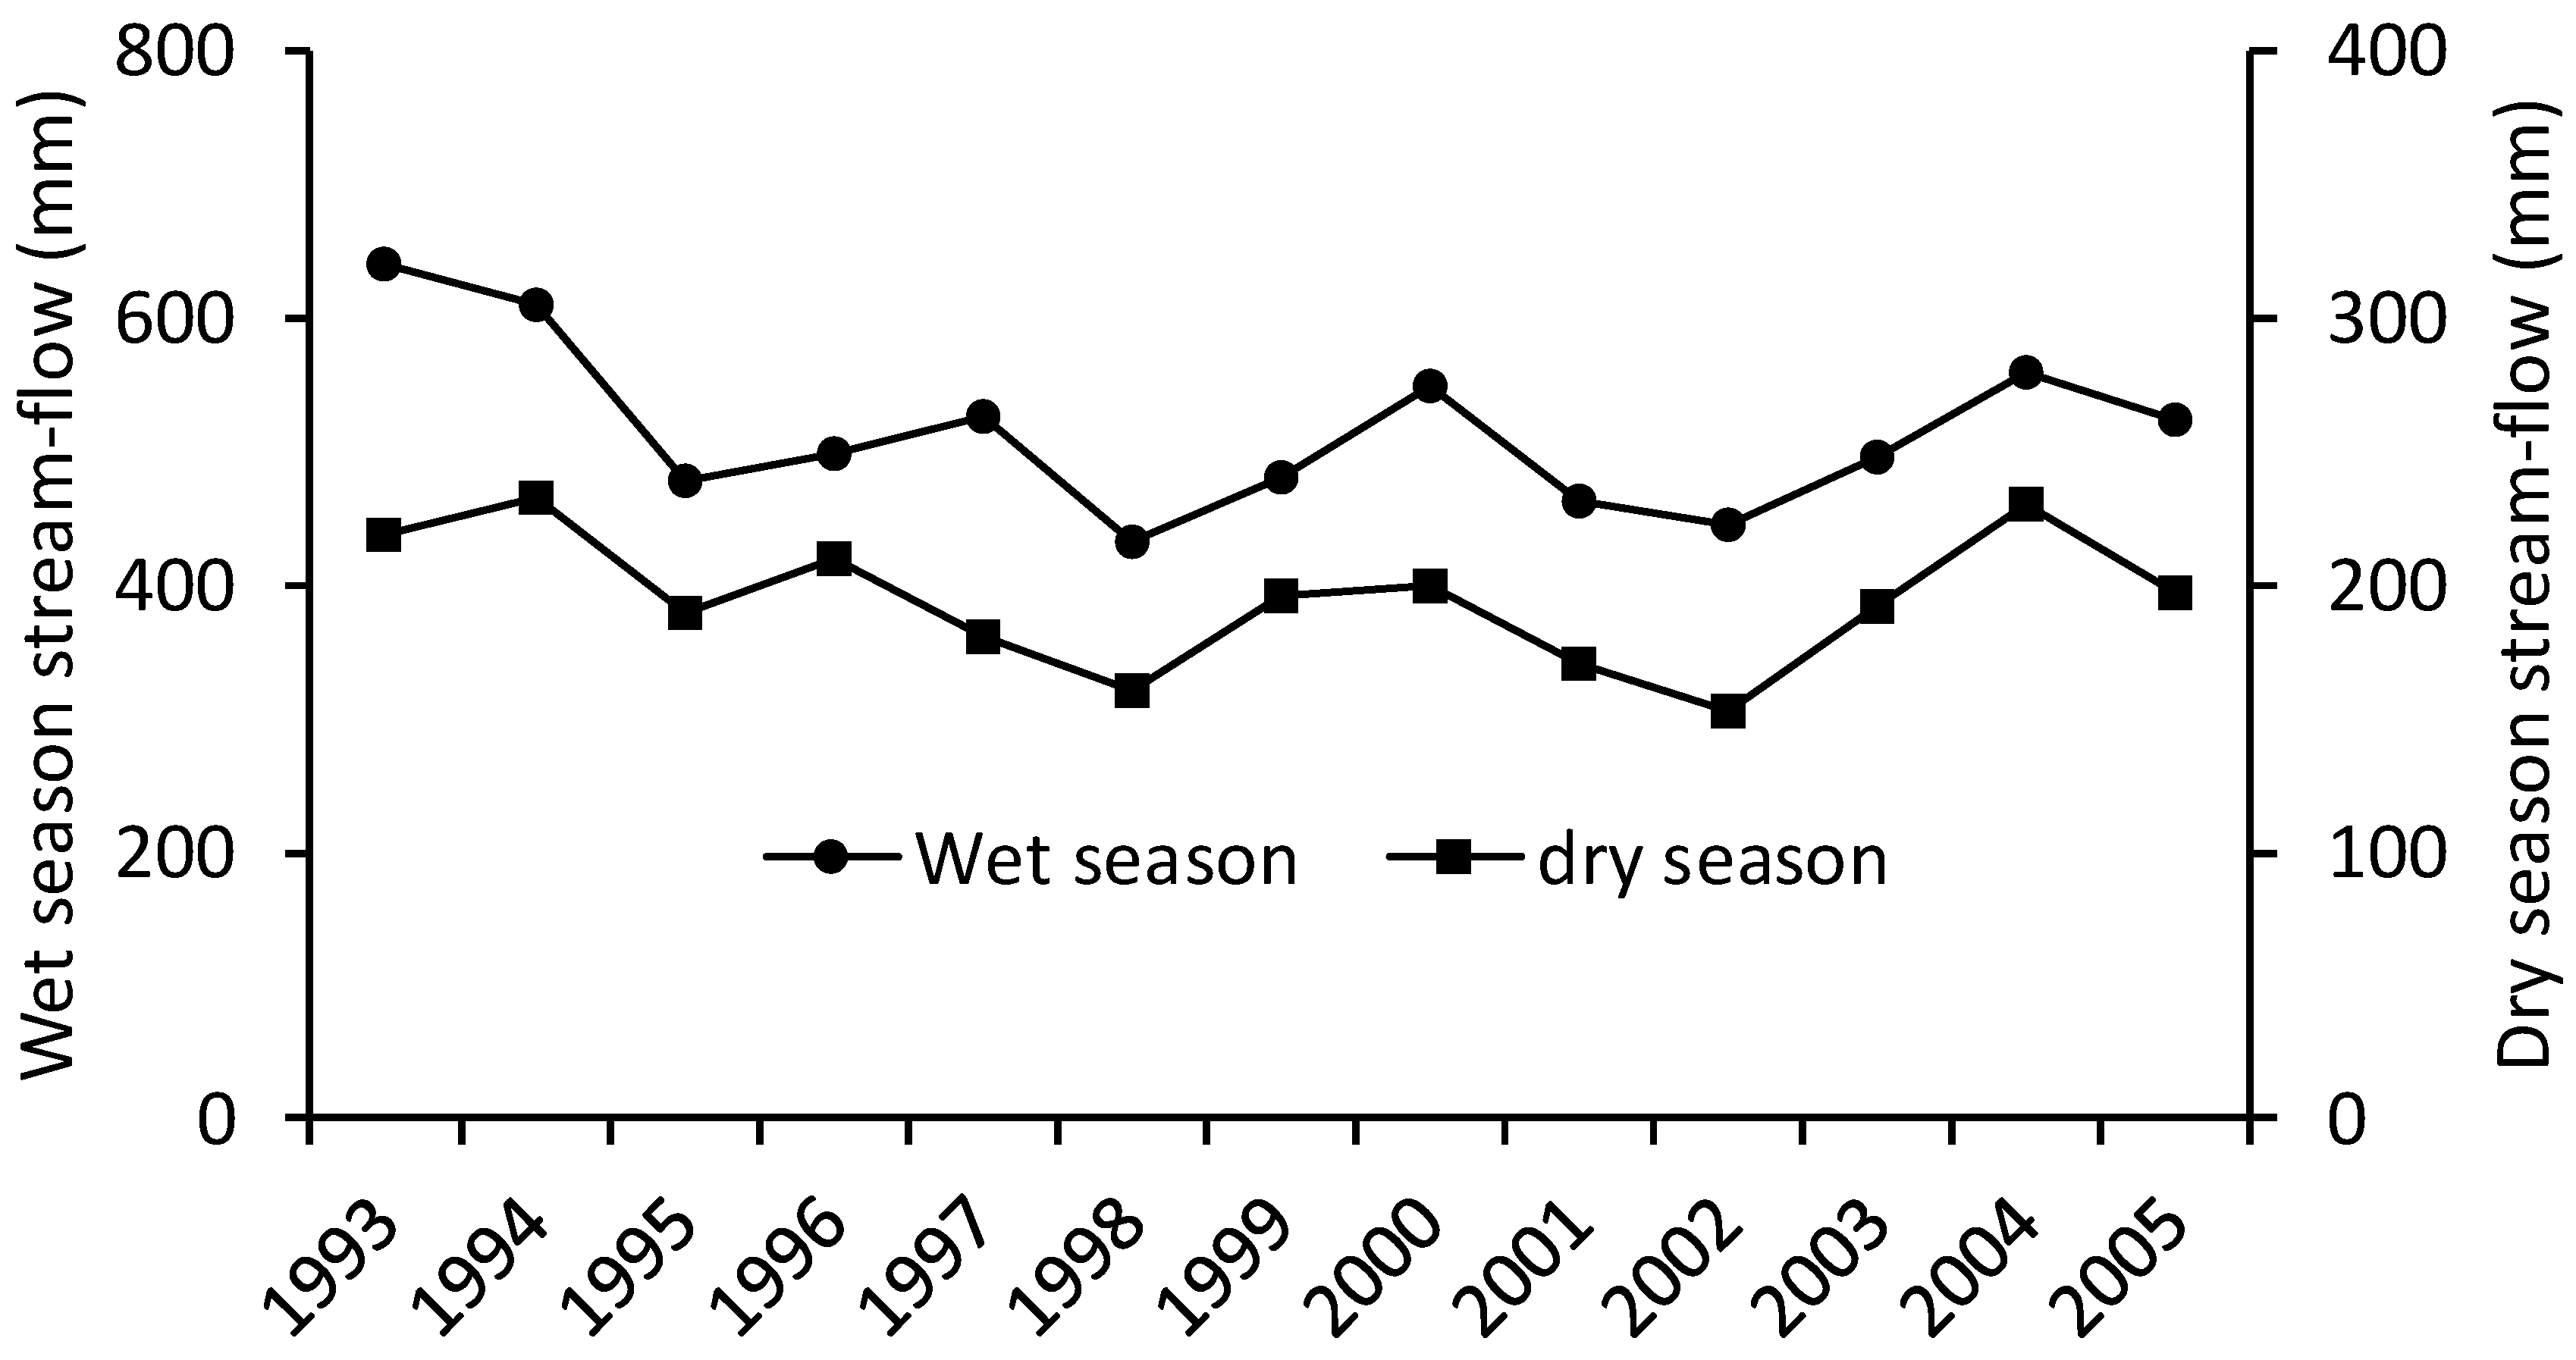
Figure 9 depicts the temporal variation in streamflow, simulated under stable rainfall conditions. Unlike Figure 7, where streamflow variation is mainly caused by inter-annual rainfall variability, the variation shown in Figure 9 is caused by non-climatic factors, such as land-cover changes. Wet season and dry season streamflow follow the same patterns, with a reduction from 1993 to 2002 (−196 mm and −65 mm, respectively) followed by an increase from 2002 to 2005 (+80 mm and +44 mm, respectively). The cross-simulation test [39] applied to seasonal streamflow over the whole study period revealed no significant hydrological change at the 90% confidence level. However, a significant decline was observed from 1993 to 2002, with p-values of 0.09 and 0.01 for wet season and dry season streamflow respectively. The same test applied to any other sub-periods yielded higher (i.e., less significant) p-values except for the period 1993–1998, which exhibits the most significant trend of decline (p-values of 0.06 and 0.03 for wet season and dry season streamflow, respectively). In contrast, no significant change was observed from 2002 to 2005.
4. Discussion
4.1. Relationships between Hydrological Changes and Land-Cover Changes
Between 1993 and 2002, the basin water yield significantly decreased by 30%. The wet season and dry season streamflow simulated under stable rainfall conditions reduced by 196 mm and 65 mm, respectively (Figure 9). Over the same period, the areal percentage of the rubber tree plantations increased by 1626 ha—equivalent to 17.1% of the watershed area—at the expense of forest and farmland, mainly in the lower part of the watershed (Figure 3, Figure 4, Figure 5 and Figure 6). As in the rest of the region [42], the resulting loss of food-productive land was compensated by converting forest to farmland at elevations higher than 800 m, where rubber trees are less productive and more prone to frost damage. The 30% streamflow reduction likely reflects an increase in ET, caused by greater root water abstraction in relation to the replacement of natural forest and farmland by rubber trees [22]. Indeed, compared to natural forest and farmland, due to a denser and deeper root system, rubber trees have the ability to absorb a larger amount of water in the soil [15,18,23], ultimately reducing watershed streamflow [14]. The transpiration of rubber trees is greater in the wet season than in the dry season [43]. However, the decreased dry season streamflow quantified in the present study could be caused by the ability of rubber trees to shift from the shallow to deep soil layer to extract water where it is the most abundant [18,22,23]. The lower part of the watershed, where rubber trees were planted between 1992 and 2002, is where the water table is likely the shallowest. This increase in ET may have been partially compensated by the concurrent conversion of forest to farmland in the upper part of the basin. This conversion to a sparser vegetation cover, limiting root water uptake, likely increased streamflow production. However, this counteracting change could not fully compensate the hydrological effect of rubber expansion for the following two reasons: (1) Forest conversion to farmland occurred at a higher elevation in the watershed (Figure 3) where the water table is deeper, thereby limiting root water uptake. This means that any change in the vegetation water demand for evapotranspiration would have a smaller effect on the local water balance than the land-cover changes happening in the lower part of the basin. (2) The conversion of forest to farmland involved an area half that of the conversion of forest to rubber tree plantations (Figure 5).
Between 2002 and 2006, the simulated wet and dry season streamflow increased by 80 mm and 44 mm, respectively (Figure 9). These changes were found to be statistically insignificant at the 90% confidence level. Over the same period, the area of rubber tree plantations increased by 716 ha (about 7.5% of the watershed area) at the expense of farmland and forest (Figure 5). On average, these new rubber trees were planted at elevations about 83 m higher and on slopes steeper (by about 5 degrees) than existing rubber trees. Concurrently, about 300 ha of farmland were converted to grassland. These two types of land conversion correspond to a theoretical increase in ET, resulting from a land conversion to a denser vegetation cover with a deeper root system. However, both wet and dry season streamflow simulated under stable rainfall conditions increased during this period, although insignificantly. This hydrological change is likely to happen when soil permeability is reduced, despite a greater evapotranspiration water demand. This situation typically happens on steep slopes exposed to the erosive power of incident rainfall [44]. This is the case where soils under the canopy of tree plantations are cleared and not protected from throughfall by any understory [25,45]. In this environment, enhanced throughfall accelerates soil surface crusting, soil erosion, and surface runoff. Greater rates for these processes were observed under rubber trees planted on steeper slopes in an experimental site nearby the study area [45]. Similarly, a lower soil infiltration capacity is observed where grassland forms on eroded soils [46], as observed in the study area. Although terracing practiced on steep hillslopes under rubber plantations aims to promote runoff infiltration, in some instances such interventions led to soil compaction, reducing soil permeability and ultimately leading to increased runoff [16]. Further field investigations in the studied watershed are required to verify these hypotheses.
4.2. Limitations of the Approach and Recommendations
This study relied on two types of data: continuous hydro-meteorological records collected from one river water level gauging station and two rain gauges, and four land-cover maps at different dates, partly overlapping the period of streamflow records. While plausible explanations could be proposed to explain the succession of two opposite hydrological changes, they could not be ascertained for several reasons. The first one is intrinsically linked to the nature of observed land-cover changes and to their variations according to the watershed geomorphology. The attribution of hydrological trends was complicated by concurrent counteracting changes in vegetation cover. In addition, successive land-cover changes occurred in different parts of the watershed, where surface–groundwater interactions were likely influenced by variations in slope, elevation, and other soil and geological features not reported in this study. The effects of this heterogeneity on the watershed hydrology could not be captured by the limited available data, which provided snapshots of land-cover patterns for a few years only. However, the figures and literature review suggest a continuous increase and decrease in areas of rubber tree plantations and forest, respectively [1,2,3], with a gradual shift of the land-cover changes toward areas at greater elevations and with steeper slopes [30], supporting our interpretations.
In this study, hydrological modeling was performed at a monthly time step. It could be argued that a daily time step would have provided more precise results. As shown in previous modeling studies performed with a conceptual-lumped rainfall-runoff model in the Mekong Basin [25,47,48], GR2M has several advantages compared to daily models. Aggregating daily rainfall and streamflow in monthly steps avoids the risk of shifting errors between daily rainfall and streamflow time series. This temporal aggregation results in Nash coefficients of GR2M calibrations (>80%) greater than those obtained with models working at a daily time step [47]. This high performance enables GR2M to capture inter-annual variations of the catchment behavior for comparison with long-term changes in land cover, which was the main aim of this study and others [25,47,48].
Future investigations of the hydrological impact of rubber tree plantations at watershed scales should pay particular attention to their effect on streamflow during the dry season. Indeed, when the monsoon recedes, streamflow often becomes the only available water resource that sustains biodiversity and enhances ecosystem services, such as water supply for domestic uses. Rubber plantations may lead to either a reduction or an increase in dry season streamflow, depending on the previous land cover, and the effects of the land conversion on soil permeability and root water uptake. If the gain in infiltration surpasses the increase in ET, groundwater recharge and the related base-flow will increase [49,50]. The effectiveness of rubber plantation in promoting water infiltration will vary according to the management of its understory. Enhanced levels of soil organic matter from litter inputs improve soil structure, enhance aggregate stability, and promote faunal activity, leading to higher macro porosity, thereby creating preferential pathways for infiltration [51]. Permitting understory vegetation to grow increases litter input and reduces over-land flow rates. Roots also create preferential pathways for water infiltration. In contrast, a systematic clearing of vegetation under the tree canopy reduces litter input and increases soil exposure to rainfall intensity, promoting soil crusting that will, in turn, reduce infiltration and increase runoff during the rainy season [45], ultimately leading to a reduction of dry season streamflow [25]. Moreover, increased runoff accelerates soil detachment, erosion, and soil organic carbon depletion, which compromises crop yield over the long term [52]. Another factor influencing the infiltration trade-off is tree density. At a low to intermediate tree cover density, each new tree can improve soil hydraulic properties beyond its canopy edge, which means that the infiltration gains can be proportionally higher than the additional losses from increased transpiration and interception [53]. This process is upper bounded by a tree density, over which any additional tree will further increase ET, while infiltration has already reached a maximum [54]. Optimal tree density is therefore not only a question of yield maximization, but also an ecological consideration.
To improve infiltration under the canopy of monoculture rubber tree plantations, intercropping with understory species is another solution with potential economic return [55]. Before the fourth year of the rubber plantation, young trees are intercropped with fruit species (e.g., pineapples, mangosteen, mangos, and durian), which contribute to maintaining soil organic matter, faunal activity, and permeability. After the closure of the rubber tree canopy, intercrops are replaced by shade-tolerant varieties, such as tea, coffee, cacao, or slow-growing timber species [56,57]. Over time, timber-based systems could become highly diverse and are analogous to advanced secondary forests [58].
Future research should pay particular attention to the trade-off between infiltration and ET, and its relationship to plantation management. Proper measurement devices should be put in place accordingly. They should include microplots to survey soil surface structures and permeability [59], piezometers, river water level gauging stations, and rain gauges. Most importantly, the size of the gauged watershed should be small enough to capture homogeneous land-cover changes. Ideally, it should be positioned downstream of a small headwater watershed likely to experience homogenous land conversion to rubber tree plantation.
5. Conclusions
The capacity of rubber trees to deplete groundwater resources was previously evidenced locally. But the regional hydrological effects of the rapid expansion of rubber tree plantations across southern montane China have not been quantified. In an attempt to address this shortfall, our investigations focused on a 100 km2 gauged watershed where rubber tree plantations increased from 10% to 44% between 1992 and 2010. While it was possible to isolate hydrological changes from those caused by rainfall variability, their attribution to land-cover changes, and specifically to rubber tree plantations, was compounded by the heterogeneity of land-cover transitions occurring in the watershed, and their variations across a contrasted geomorphology. The processes that explain the lack of unequivocal linkage between tree rubber planting and watershed hydrological change were reviewed, and we formulated practical recommendations in terms of monitoring devices and data collection to improve the strength of trend attribution in future studies. While the spread of rubber tree plantations is likely to continue in the humid tropics—although at a pace moderated by market fluctuations—it is important that the largest number of tree growers adopt sustainable practices. Such techniques should aim at maximizing rainwater infiltration on planted hillslopes, while maintaining biodiversity and diversifying crop productions. Related ecosystem services include the provision of dry season water resources in the form of stream base-flow. Promoting intercropping in rubber tree plantations appears to be a suitable technique to reach these objectives.
Author Contributions
Conceptualization, X.M. and G.L.; methodology, X.M. and G.L.; validation, X.M., G.L. and R.H.; formal analysis, X.M.; investigation, X.M.; resources, X.M.; data curation, X.M. and G.L.; writing—original draft preparation, G.L. and X.M.; writing—review and editing, G.L., R.H., M.v.N., and X.M.; visualization, G.L. and X.M.; supervision, G.L., J.X., M.v.N. and R.H.; project administration, R.H.; funding acquisition, R.H and J.X.
Funding
This research was funded by the CGIAR research program on Integrated Systems for the Humid Tropics, the ICRAF Post-doctoral Program (2012–2014) and the Bundesministerium für Wirtschaftliche Zusammenarbeit und Entwicklung/Deutsche Gesellschaft für Internationale Zusammenarbeit research program that supported the Green Rubber project No. 13.1432.7-001.00.
Acknowledgments
We are grateful to the Xishuangbanna Water Resources and Hydrological Bureau for the provision of Hydro-Meteorological data.
Conflicts of Interest
The authors declare no conflict of interest.
References
- Ziegler, A.D.; Fox, J.M.; Xu, J. The Rubber Juggernaut. Science 2009, 324, 1024–1025. [Google Scholar] [CrossRef] [PubMed]
- Fox, J.M.; Castella, J.C. Expansion of rubber (Hevea brasiliensis) in Mainland Southeast Asia: What are the prospects for smallholders? J. Peasant Stud. 2013, 40, 155–170. [Google Scholar] [CrossRef]
- Association of Natural Rubber Producing Countries Home Page. Natural Rubber Trends and Statistics Archive. Available online: http://www.anrpc.org/ (accessed on 17 January 2019).
- Yi, Z.F.; Cannon, C.H.; Chen, J.; Ye, C.X.; Swetnam, R.D. Developing indicators of economic value and biodiversity loss for rubber plantations in Xishuangbanna, Southwest China: A case study from Menglun township. Ecol. Indic. 2014, 36, 788–797. [Google Scholar] [CrossRef]
- Warren-Thomas, E.; Dolman, P.M.; Edwards, D.P. Increasing demand for natural rubber necessitates a robust sustainability initiative to mitigate impacts on tropical biodiversity. Conserv. Lett. 2015, 8, 230–241. [Google Scholar] [CrossRef]
- Ahrends, A.; Hollingsworth, P.M.; Ziegler, A.D.; Fox, J.M.; Chen, H.; Su, Y.; Xu, J. Current trends of rubber plantation expansion may threaten biodiversity and livelihoods. Glob. Environ. Chang. 2015, 34, 48–58. [Google Scholar] [CrossRef]
- Sreekar, R.; Huang, G.; Yasuda, M.; Quan, R.C.; Goodale, E.; Corlett, R.T.; Tomlinson, K.W. Effects of forests, roads and mistletoe on bird diversity in monoculture rubber plantations. Sci. Rep. 2016, 6. [Google Scholar] [CrossRef] [PubMed]
- Wu, Z.L.; Lia, H.M.; Liu, L.Y. Rubber cultivation and sustainable development in Xishuangbanna, China. Int. J. Sustain. Dev. World Ecol. 2001, 8, 337–345. [Google Scholar] [CrossRef]
- Hu, H.B.; Liu, W.J.; Cao, M. Impact of land use and land cover changes on ecosystem services in Menglun, Xishuangbannan, Southwest China. J. Environ. Monit. Assess. 2008, 146, 147–156. [Google Scholar] [CrossRef] [PubMed]
- Mann, C.C. Addicted to rubber. Science 2009, 325, 564–566. [Google Scholar] [CrossRef] [PubMed]
- Qiu, J. Where the rubber meets the garden. Nature 2009, 457, 246–247. [Google Scholar] [CrossRef] [Green Version]
- Fox, J.M.; Castella, J.C.; Ziegler, A.D.; Westley, S.B. Rubber Plantations Expand in Mountainous Southeast Asia: What Are the Consequences for the Environment? East-West Center: Honolulu, HI, USA, 2014; 8p. [Google Scholar]
- Guardiola-Claramonte, M.; Troch, P.A.; Ziegler, A.D.; Giambelluca, T.W.; Vogler, J.B.; Nullet, M.A. Local hydrologic effects of introducing non-native vegetation in a tropical catchment. Ecohydrology 2008, 1, 13–22. [Google Scholar] [CrossRef]
- Guardiola-Claramonte, M.; Troch, P.A.; Ziegler, A.D.; Giambelluca, T.W.; Durcik, M.; Vogler, J.B.; Nullet, M.A. Hydrologic effects of the expansion of rubber (Heveabrasiliensis) in a tropical catchment. Ecohydrology 2010, 3, 306–314. [Google Scholar] [CrossRef]
- Tan, Z.H.; Zhang, Y.P.; Song, Q.H.; Liu, W.J.; Deng, X.B.; Tang, J.W.; Deng, Y.; Zhou, W.J.; Yang, L.Y.; Yu, G.R.; et al. Rubber plantations act as water pumps in tropical China. Geophys. Res. Lett. 2011, 38, L24406. [Google Scholar] [CrossRef]
- Liu, W.J.; Liu, W.Y.; Lu, H.J.; Duan, W.P.; Li, H.M. Runoff generation in small catchments under a native rain forest and a rubber plantation in Xishuangbanna, Southwestern China. Water Environ. J. 2011, 25, 138–147. [Google Scholar] [CrossRef]
- Carr, M.K.V. The water relations of rubber (Hevea Brasiliensis): A review. Exp. Agric. 2012, 48, 176–193. [Google Scholar] [CrossRef]
- Liu, W.J.; Li, J.T.; Lu, H.J.; Wang, P.Y.; Luo, Q.P.; Liu, W.Y.; Li, H.M. Vertical patterns of soil water acquisition by non-native rubber trees (Hevea brasiliensis) in Xishuangbanna, southwest China. Ecohydrology 2013, 7, 1234–1244. [Google Scholar] [CrossRef]
- Ayutthaya, S.I.N.; Do, F.C.; Pannangpetch, K.; Junjittakarn, J.; Maeght, J.L.; Rocheteau, A.; Cochard, H. Water loss regulation in mature Hevea brasiliensis: Effects of intermittent drought in the rainy season and hydraulic regulation. Tree Phys. 2011, 31, 751–762. [Google Scholar] [CrossRef]
- Srinivasan, K.; Kunhamu, T.K.; Mohan Kumar, B. Root excavation studies in a mature rubber (Hevea brasiliensis Muell. Arg.) plantation. Nat. Rubber Res. 2004, 17, 18–22. [Google Scholar]
- van Noordwijk, M.; Rahayu, S.; Williams, S.E.; Hairiah, K.; Khasanah, N.; Schroth, G. Crop and tree root-system dynamics. In Belowground Interactions in Tropical Agroecosystems; van Noordwijk, M., Cadisch, G., Ong, C.K., Eds.; CAB International: Wallingford, UK, 2004; pp. 83–107. [Google Scholar]
- Giambelluca, T.W.; Mudd, R.G.; Liu, W.; Ziegler, A.D.; Kobayashi, N.; Kumagai, T.; Miyazawa, Y.; Lim, T.K.; Huang, M.; Fox, J.; et al. Evapotranspiration of rubber (Hevea brasiliensis) cultivated at two plantation sites in Southeast Asia. Water Resour. Res. 2016, 52, 1–20. [Google Scholar] [CrossRef]
- Maeght, J.C.; Gonkhamdee, S.; Clément, C.; Isarangkool Na Ayutthaya, S.; Stokes, A.; Pierret, A. Seasonal patterns of fine root production and turn over in a mature rubber tree (Hevea brasiliensis Müll. Arg.) Stand differentiation with soil depth and implications for soil carbon stocks. Front. Plant Sci. 2015, 6, 1022. [Google Scholar] [CrossRef] [PubMed]
- Kumagai, T.; Mudd, R.G.; Giambelluca, T.W.; Kobayashi, N.; Miyazawa, Y.; Lim, T.K.; Liu, W.; Huang, M.; Fox, J.M.; Ziegler, A.D.; et al. How do rubber (Hevea brasiliensis) plantations behave under seasonal water stress in northeastern Thailand and central Cambodia. Agric. For. Meteorol. 2015, 213, 10–22. [Google Scholar] [CrossRef]
- Lacombe, G.; Ribolzi, O.; de Rouw, A.; Pierret, A.; Latsachak, K.; Silvera, N.; Pham Dinh, R.; Orange, D.; Janeau, J.L.; Soulileuth, B.; et al. Contradictory hydrological impacts of afforestation in the humid tropics evidenced by long-term field monitoring and simulation modelling. Hydrol. Earth Syst. Sci. 2016, 20, 2691–2704. [Google Scholar] [CrossRef] [Green Version]
- Zhang, M.; Liu, N.; Harper, R.; Li, Q.; Liu, K.; Wei, X.; Ning, D.; Hou, Y.; Liu, S. A global review on hydrological responses to forest change across multiple spatial scales: Importance of scale, climate, forest type and hydrological regime. J. Hydrol. 2017, 546, 44–59. [Google Scholar] [CrossRef]
- Wei, X.; Liu, W.; Zhou, P. Quantifying the relative contributions of forest change and climatic variability to hydrology in large watersheds: A critical review of research methods. Water 2013, 5, 728–746. [Google Scholar] [CrossRef]
- Zégre, N.; Skaugset, A.E.; Som, N.A.; McDonnell, J.J.; Ganio, L.M. In lieu of the paired catchment approach: Hydrologic model change detection at the catchment scale. Water Resour. Res. 2010, 46, W11544. [Google Scholar] [CrossRef]
- Liu, X.N.; Feng, Z.M.; Jiang, L.G.; Li, P.; Liao, C.H.; Yang, Y.Z.; You, Z. Rubber plantation and its relationship with topographical factors in the border region of China, Laos and Myanmar. J. Geogr. Sci. 2013, 23, 1019–1040. [Google Scholar] [CrossRef]
- Chen, H.; Yi, Z.F.; Schmidt-Vogt, D.; Ahrends, A.; Beckschäfer, P.; Kleinn, C.; Ranjitkar, S.; Xu, J. Pushing the limits: The pattern and dynamics of rubber monoculture expansion in Xishuangbanna, SW China. PLoS ONE 2016, 11, e0150062. [Google Scholar] [CrossRef] [PubMed]
- ASTER GDEM Validation Team. ASTER Global Digital Elevation Model Validation Summary Report; METI & NASA: Washington, DC, USA, 2009; 28p.
- Harris, I.; Jones, P.D.; Osborn, T.J.; Lister, D.H. Updated high-resolution grids of monthly climatic observations—The CRUTS3.10 Dataset. Int. J. Climatol. 2014, 34, 623–642. [Google Scholar] [CrossRef]
- USGS (U.S. Geological Survey). Earth Explorer. 2019. Available online: https://earthexplorer.usgs.gov/ (accessed on 26 March 2019).
- DLR (German Aerospace Center). The RapidEye Earth observation system. 2019. Available online: https://www.dlr.de/ (accessed on 26 March 2019).
- Long, H.; Tang, G.; Li, X.; Heilig, G.K. Socio-economic driving forces of land-use change in Kunshan, the Yangtze River Delta economic area of China. J. Environ. Manag. 2007, 83, 351–364. [Google Scholar] [CrossRef]
- Ma, X.; Xu, J.C.; Luo, Y.; Prasad Aggarwal, S.; Li, J.T. Response of hydrological processes to land-cover and climate changes in Kejie watershed, South-West China. Hydrol. Process. 2009, 23, 1179–1191. [Google Scholar] [CrossRef]
- Mouelhi, S.; Michel, C.; Perrin, C.; Andréassian, V. Stepwise development of a two-parameter monthly water balance model. J. Hydrol. 2006, 318, 200–214. [Google Scholar] [CrossRef]
- Pushpalatha, R.; Perrin, C.; Le Moine, N.; Andréassian, V. A review of efficiency criteria for evaluating low-flow simulations. J. Hydrol. 2012, 420–421, 171–182. [Google Scholar] [CrossRef]
- Andréassian, V.; Parent, E.; Michel, C. A distribution-free test to detect gradual changes in watershed behavior. Water Resour. Res. 2003, 39. [Google Scholar] [CrossRef] [Green Version]
- Wang, G.; Innes, J.L.; Lei, J.; Dai, S.; Wu, S.W. China’s Forestry Reforms. Science 2007, 318, 1556–1557. [Google Scholar] [CrossRef]
- Moriasi, D.N.; Arnold, J.G.; Van Liew, M.W.; Bingner, R.L.; Harmel, R.D.; Veith, T.L. Model evaluation guidelines for systematic quantification of accuracy in watershed simulations. Trans. ASABE 2007, 50, 885–900. [Google Scholar] [CrossRef]
- Li, H.; Mitchell Aide, T.; Ma, Y.; Liu, W.; Cao, M. Demand for rubber is causing the loss of high diversity rain forest in SW China. Biodivers. Conserv. 2007, 16, 1731–1745. [Google Scholar] [CrossRef]
- Kobayashi, N.; Kumagai, T.; Miyazawa, Y.; Matsumoto, K.; Taterishi, M.; Lim, T.K.; Mudd, R.G.; Ziegler, A.D.; Giambelluca, T.W.; Yin, S. Transpiration characteristics of a rubber plantation in central Cambodia. Tree Phys. 2014, 34, 285–301. [Google Scholar] [CrossRef] [PubMed] [Green Version]
- Liu, W.J.; Zhu, C.J.; Wu, J.; Chen, C.F. Are rubber-based agroforestry systems effective in controlling rain splash erosion? Catena 2016, 147, 16–47. [Google Scholar] [CrossRef]
- Lacombe, G.; Valentin, C.; Sounyafong, P.; de Rouw, A.; Soulileuth, B.; Silvera, N.; Pierret, A.; Sengtaheuanghoung, O.; Ribolzi, O. Linking crop structure, throughfall, soil surface conditions, runoff and soil detachment: 10 land uses analyzed in Northern Laos. Sci. Total Environ. 2018, 616–617, 1330–1338. [Google Scholar] [CrossRef]
- Hill, R.D.; Peart, M.R. Land use, runoff, erosion and their control: A review for Southern China. Hydrol. Process. 1999, 12, 2029–2042. [Google Scholar] [CrossRef]
- Lacombe, G.; Pierret, A.; Hoanh, C.T.; Sengtaheuanghoung, O.; Noble, A. Conflict, migration and land-cover changes in Indochina: A hydrological assessment. Ecohydrology 2010, 3, 382–391. [Google Scholar] [CrossRef]
- Lyon, S.W.; King, K.; Polpanich, O.; Lacombe, G. Assessing hydrologic changes across the Lower Mekong Basin. J. Hydrol. Reg. Stud. 2017, 12, 303–314. [Google Scholar] [CrossRef]
- Bruijnzeel, L.A. (de)forestation and dry season flow in the tropics: A closer look. J. Trop. For. Sci. 1989, 1, 229–243. [Google Scholar]
- Bruijnzeel, L.A. Hydrological functions of tropical forests: Not seeing the soil for the trees? Agric. Ecosyst. Environ. 2004, 104, 185–228. [Google Scholar] [CrossRef]
- Bargués Tobella, A.; Rees, H.; Almaw, A.; Bayala, J.; Malmer, A.; Laudon, H.; Ilstedt, U. The effect of trees on preferential flow and soil infiltrability in an agroforestry parkland in semiarid Burkina Faso. Water Resour. Res. 2014, 50, 3342–3354. [Google Scholar] [CrossRef] [Green Version]
- Ribolzi, O.; Evrard, O.; Huon, S.; de Rouw, A.; Silvera, N.; Latsachack, K.O.; Soulileuth, B.; Lefèvre, I.; Pierret, A.; Lacombe, G.; et al. From shifting cultivation to teak plantation: Effect on overland flow and sediment yield in a montane tropical catchment. Sci. Rep. 2017, 7. [Google Scholar] [CrossRef] [PubMed]
- Beven, K.; Germann, P. Macropores and water flow in soils. Water Resour. Res. 1982, 18, 1311–1325. [Google Scholar] [CrossRef]
- Ilstedt, U.; Bargués Tobella, A.; Bazié, H.R.; Bayala, J.; Verbeeten, E.; Nyberg, G.; Sanou, J.; Benegas, L.; Murdiyarso, D.; Laudon, H.; et al. Intermediate tree cover can maximize groundwater recharge in the seasonally dry tropics. Sci. Rep. 2016, 6, 21930. [Google Scholar] [CrossRef] [PubMed] [Green Version]
- Penot, E.; Courbet, P.; Chambon, B.; Ilahang, K. Improved rubber agroforests in Indonesia: Myth of reality? Plant. Rech. Dév. 1999, 6, 400–414. [Google Scholar]
- Min, S.; Huang, J.; Bai, J.; Waibel, H. Adoption of intercropping among smallholder rubber farmers in Xishuangbanna, China. Int. J. Agric. Sustain. 2017, 15, 223–237. [Google Scholar] [CrossRef]
- Langenberger, G.; Cadisch, G.; Martin, K.; Min, S.; Waibel, H. Rubber intercropping: A viable concept for the 21st century? Agrofor. Syst. 2017, 91, 577–596. [Google Scholar] [CrossRef]
- Lacombe, G.; Bolliger, A.M.; Harrison, R.D.; Ha, T.T.T. Integrated tree, crop and livestock technologies to conserve soil and water, and sustain smallholder farmers’ livelihoods in Southeast Asian uplands. In Integrated Systems Research for Sustainable Smallholder Agriculture in the Central Mekong: Achievements and Challenges; Hiwasaki, L., Bolliger, A.M., Lacombe, G., Raneri, J., Schut, M., Staal, S., Eds.; World Agroforestry Center: Hanoi, Vietnam, 2016; pp. 41–63. ISBN 978-604-943-434-1. [Google Scholar]
- Casenave, A.; Valentin, C. A runoff capability classification system based on surface features criteria in semi-arid areas of West Africa. J. Hydrol. 1992, 130, 231–249. [Google Scholar] [CrossRef]
Figure 1.
Location of the Nan’a watershed and measurement devices. Contour lines were derived from the ASTER Global Digital Elevation Model [31].
Figure 1.
Location of the Nan’a watershed and measurement devices. Contour lines were derived from the ASTER Global Digital Elevation Model [31].

Figure 2.
Cross-simulation matrix. Mj (j ∈ [1 − n]) defines the set of model parameters calibrated over the hydrological year j. Pi (i ∈ [1 − n]) defines the rainfall that occurred over the hydrological year i. Streamflow qij is simulated by model Mj with rainfall Pi.
Figure 2.
Cross-simulation matrix. Mj (j ∈ [1 − n]) defines the set of model parameters calibrated over the hydrological year j. Pi (i ∈ [1 − n]) defines the rainfall that occurred over the hydrological year i. Streamflow qij is simulated by model Mj with rainfall Pi.

Figure 3.
Land-cover change in the Nan’a watershed, based on Landsat (years 1992, 2002, and 2007) and RapidEye (year 2010) imagery [33,34].

Figure 4.
Areal percentages of each land-cover type in the Nan’a watershed.

Figure 5.
Land-cover conversions in the Nan’a watershed. Numbers refer to areas in hectares. “+” = gain. “−“ = loss. Histograms quantify the areas in the first year (left bar) and last year (right bar) of each period.
Figure 5.
Land-cover conversions in the Nan’a watershed. Numbers refer to areas in hectares. “+” = gain. “−“ = loss. Histograms quantify the areas in the first year (left bar) and last year (right bar) of each period.

Figure 6.
Distribution of rubber trees according to elevation (a) and slope (b) in the Nan’a watershed. Boxes: 40–60% quantiles. Whiskers: 20–80% quantiles. Black dots: averages.
Figure 6.
Distribution of rubber trees according to elevation (a) and slope (b) in the Nan’a watershed. Boxes: 40–60% quantiles. Whiskers: 20–80% quantiles. Black dots: averages.

Figure 7.
Annual rainfall, streamflow, and runoff coefficient in the Nan’a watershed.

Figure 8.
Relationship between annual rainfall and annual streamflow in the Nan’ a watershed. Slope of the regression line is equivalent to the inter-annual mean of the annual runoff coefficient.
Figure 8.
Relationship between annual rainfall and annual streamflow in the Nan’ a watershed. Slope of the regression line is equivalent to the inter-annual mean of the annual runoff coefficient.

Figure 9.
Wet season and dry season streamflow simulated with GR2M calibrated over each hydrological year (indicated on x-axis) and run with the same rainfall input (hydrological year April 1996–March 1997).
Figure 9.
Wet season and dry season streamflow simulated with GR2M calibrated over each hydrological year (indicated on x-axis) and run with the same rainfall input (hydrological year April 1996–March 1997).

© 2019 by the authors. Licensee MDPI, Basel, Switzerland. This article is an open access article distributed under the terms and conditions of the Creative Commons Attribution (CC BY) license (http://creativecommons.org/licenses/by/4.0/).
Share and Cite
MDPI and ACS Style
Ma, X.; Lacombe, G.; Harrison, R.; Xu, J.; van Noordwijk, M. Expanding Rubber Plantations in Southern China: Evidence for Hydrological Impacts. Water 2019, 11, 651. https://doi.org/10.3390/w11040651
AMA Style
Ma X, Lacombe G, Harrison R, Xu J, van Noordwijk M. Expanding Rubber Plantations in Southern China: Evidence for Hydrological Impacts. Water. 2019; 11(4):651. https://doi.org/10.3390/w11040651
Chicago/Turabian StyleMa, Xing, Guillaume Lacombe, Rhett Harrison, Jianchu Xu, and Meine van Noordwijk. 2019. "Expanding Rubber Plantations in Southern China: Evidence for Hydrological Impacts" Water 11, no. 4: 651. https://doi.org/10.3390/w11040651
Note that from the first issue of 2016, this journal uses article numbers instead of page numbers. See further details here.