Risk Assessment and Decision-Making Based on Mean-CVaR-Entropy for Flood Control Operation of Large Scale Reservoirs


College of Hydropower & Information Engineering, Huazhong University of Science & Technology, Wuhan 430074, China
*
Author to whom correspondence should be addressed.
Water 2019, 11(4), 649; https://doi.org/10.3390/w11040649
Submission received: 11 January 2019
/
Revised: 8 March 2019
/
Accepted: 26 March 2019
/
Published: 28 March 2019
(This article belongs to the Section Water Resources Management, Policy and Governance)
Abstract
:The risk inevitably exists in the process of flood control operation and decision-making of reservoir group, due to the hydrologic and hydraulic uncertain factors. In this study different stochastic simulation methods were applied to simulate these uncertainties in multi-reservoir flood control operation, and the risk caused by different uncertainties was evaluated from the mean value, extreme value and discrete degree of reservoir occupied storage capacity under uncertain conditions. In order to solve the conflict between risk assessment indexes and evaluate the comprehensive risk of different reservoirs in flood control operation schemes, the subjective weight and objective weight were used to construct the comprehensive risk assessment index, and the improved Mahalanobis distance TOPSIS method was used to select the optimal flood control operation scheme. The proposed method was applied to the flood control operation system in the mainstream and its tributaries of upper reaches of the Yangtze River basin, and 14 cascade reservoirs were selected as a case study. The results indicate that proposed method can evaluate the risk of multi-reservoir flood control operation from all perspectives and provide a new method for multi-criteria decision-making of reservoir flood control operation, and it breaks the limitation of the traditional risk analysis method which only evaluated by risk rate and cannot evaluate the risk of the multi-reservoir flood control operation system.
1. Introduction
Flood is one of the most damaging natural disasters, which leads to a great loss of life and property [1]. From 1998 to 2017, floods affected more than 2 billion people worldwide, causing losses of US$ 656 billion, far more harmful than other disasters [2]. At present, with the increase of the number of reservoirs built in the basin, multi-reservoir flood control operation has been widely used and has become an important non-project measure to control flood and reduce disasters [3]. To achieve the full potential of flood control in the multi-reservoir group, judicious multi-reservoir joint operation scheme is needed. Different methods were developed to extract the feasible flood control operation schemes [4,5,6]. However, there are many hydrological and hydraulic uncertain factors in the joint flood control operation, such as flood forecasting errors, water level at flood conditions, outflow discharge capacity, delay time of operation and so on [7,8]. These uncertainties will lead to the risk of exceeding the limit of safety water level and discharge volume in the reservoir [7]. How to quantify the risk of different flood control schemes under the influence of various uncertainties and making decisions to select the optimal scheme is worth to study [9].
The main uncertainty in flood control operation is the flood forecast uncertainty [10,11,12,13,14]. Since the flood forecast provides future streamflow information to guide flood control operation, the uncertainty of flood forecast information may lead to flood control risk. At the same time, the uncertainties in the water level-storage curve and the discharge capacity curve may also influence reservoir flood control operation [8,9].
In order to analyze the risk caused by various uncertainties in flood control operation, theoretical research has been carried out and several methods for flood control risk analysis have been developed [7,10,15,16,17]. Among them, the Monte-Carlo method, which is widely used in risk assessment of multi-reservoir flood control operation, due to its simple theory and practicability [18], was widely applied for risk assessment. This method mainly simulates various uncertainties by different mathematical methods, on this basis, simulation scheduling is performed to obtain the possible states of different risk assessment objects (reservoir water level and discharge flow), and the probability of failure was calculated to measure the risk of flood control operation. Li et al. [15] used a Monte Carlo simulation method to calculate the flood control risk for reservoir operation considering the uncertainties of inflow forecasting error and flood hydrograph shape. Zhang et al. [19] evaluated the flood overtopping risk from the view of probability theories, synthesized disciplines of reliability math, stochastic hydrology, stochastic hydraulics and so on.
However, the concept of the probability of failure ignores the consequences of extreme situations under the influence of uncertainties. The conditional value at risk (CVaR), which could quantify the losses that might be encountered in the tail, is widely applied to the risk assessment in the flood control system [20,21]. Xu et al. [21] applied the CvaR criterion to reservoir real-time operation under the extremely dry hydrological conditions. At the same time, the discreteness of analog evaluation results after simulation scheduling are equally deserving of attention. The greater the dispersion of the evaluation result, the influence of the uncertainties on the flood control operation is greater, and the corresponding risk is increased. In financial risk assessment, the variance is often used to measure the dispersion of data to characterize the risk [22]. However, when the probability distribution of risk variable is asymmetrical, it is obviously not enough to measure flood control risk only by variance, the information of higher moments, such as the probability of occurrence of small probability extreme events, cannot be ignored. The information entropy theory proposed by Shannon, as an alternative method, has widely applied to the risk analysis file. For instance, Yang et al. [23] established a framework for risk analysis on cascade reservoir system using the brittle risk entropy method. Fan et al. [24] advanced a coupled entropy-copula method for flood peak-duration risk analysis in the Xiangxi River. Huang et al. [25] evaluated the flood risk, due to different uncertainties in Three Gorges Revision (TGR) during the flood season based on the entropy method.
In this study, the mean value, information entropy and CVaR of risk variable were used to assess flood control risk from multiple perspectives. The three indicators represent the most likely value and the dispersion of risk variable, and the consequence of the extreme situation caused by uncertainties. However, it is necessary to analyze the impact of uncertainties on each reservoir participating in the flood control operation when evaluating the risk of a multi-reservoir joint operation scheme. The analytic hierarchy process (AHP), which is an effective multi-target decision method combing qualitative analysis with quantitative analysis, was employed to determine the weights of each reservoir, the weighted mean value, CvaR and entropy of different flood control schemes were obtained to assess the flood risk from the perspective of the whole basin.
Finally, in order to directly assess the risk of flood control operation, the above risk index values should be converted into a single quantitative value. The technique for order preference by similarity to ideal solution (TOPSIS) method [26,27,28,29,30,31], a multi-criteria decision making method, with the improved Mahalanobis distance, was introduced to evaluate and arrange all schemes combining subjective and objective weights.
The objective of this study is to establish a multi-index risk assessment framework for evaluating the flood risk of multi-reservoir joint flood control operation schemes and decision-making. In this study, a Copula-based method and the Latin hypercube sampling (LHS) method were used to simulate the uncertainties in flood forecast errors, discharge capacity and water level-storage, respectively. The simulated uncertainties series can be used for flood control risk analysis. Combing with the extracted flood control operation schemes, multiple risk indicators were used to assess flood control risk from multiple perspectives. The mean value of a variable was used to represent the possible value of the occurrence of a variable. In order to describe the extreme value of variables, the conditional value at risk (CVaR) was used to evaluate the extreme risk. For the discrete degree of variable distribution, entropy theory was applied to characterize the disorder risk of a variable. Finally, the improved Mahalanobis distance TOPSIS method was used to transform multiple criteria values into a single overall measure with the combination of subjective and objective weights, and then the optimal flood control operation scheme was selected. The proposed methodology is applied to a multi-reservoir flood control operation case study to demonstrate its applicability.
The remainder of this paper is organized as follows: Section 2 firstly extracts flood control operation schemes of reservoir groups by using the method in Supplementary Materials, and simulated the uncertainties in reservoir operation. Then, a risk analysis and decision making model for flood control operation are proposed. Finally, describes the data sets used in the study. The results of flood risk analysis using the proposed method are shown in Section 3. Finally, the conclusions and discussions of this work are presented in Section 4.
2. Methodology
In this paper, the risk of reservoir group flood control operation was measured by analyzing the influence of uncertainties on the maximum occupied storage capacity of reservoir participating in the operation. The proposed method firstly derived a set of feasible multi-reservoir flood control operation schemes and simulated different uncertainties in flood control operation and then, multi-index analysis and multi-attribute decision-making are carried out for the risk in multi-reservoir flood control operation. Figure 1 shows the flow chart of the proposed methodology, and the specific descriptions of each step are presented in the following subsections.
2.1. Extraction of Joint Flood Control Operation Schemes for Reservoir Groups
In order to fully develop the flood control capacity of reservoir group, a simulation-optimization method is proposed by establishing the framework of routine operation and combining the particle swarm optimization (PSO) algorithm to derive a set of feasible multi-reservoir flood control operation schemes. For a more detailed examination of this method to extract the operation schemes please see Supplementary Materials.
2.2. Stochastic Simulation of Uncertainties
There are many complex uncertainties, which lead to the risk in reservoir flood control operation, such as data accuracy, hydrological and hydraulic models, human factors and so on [32,33]. This study mainly considers the uncertainties of flood forecast, water level-storage and discharge capacity curves, which have been widely concerned and are considered to have a greater impact on flood control operation [8,9,14,34]. These uncertainties quantified methods are as follows:
(1) Flood forecast uncertainty
Flood forecast information should be taken into account in real-time flood control operation for releasing the water stored in the reservoir before the arrival of a large flood [31]. However, there are some errors in the forecasting information, which need to be quantified for reasonably analyzing the impact of flood forecast on flood control operation. The relative flood forecast error was expressed as:
where n is the number of reservoir; h is the lead time of flood forecast; Qi,t+j is the predicted streamflow of the ith reservoir at time t for time t + j; qi,t+j is the observed streamflow of the ith reservoir at time t + j; eij is the relative error between predicted and observed streamflow of the ith reservoir at time t for time t + j.
(2) The reservoir discharge uncertainty
The uncertainty of discharge capacity refers to the error between the actual discharge and the set discharge which is mainly measured by the reservoir discharge coefficient λ [7]. The relation between observed discharge and set discharge can be expressed as
where and are the actual discharge and set discharge of the ith reservoir at time t, respectively; is the discharge coefficient, assumed to follow a normal distribution [8].
(3) Water level-storage uncertainty
The storage and water level of the ith reservoir are a functional relationship [7]: based on the water level-storage curve. Since there is an error between the actual storage and the measured storage, the functional relationship between water level and storage can be expressed as follows:
where is the set storage of the ith reservoir at time t; is defined as storage error between the actual storage and the measured storage of the ith reservoir at time t, and assumed to follow a normal distribution .
In order to consider the randomness of these uncertainties in flood control operation model, different stochastic simulation methods were used. Since there are some correlations among forecast errors with different lead times, a copula-based simulation method was used to simulate flood forecast errors [25,31]. For the uncertainties in discharge capacity, water level-storage, the LHS method was applied to simulate other uncertainties for ensuring the uniformity of the sampling.
2.3. Risk Analysis of Flood Control Operation Using Multiple Risk Assessment Indicators
Risk is typically defined as the probability of failure when the load (L) on the system exceeds the resistance (R) [14,30], Pf = P (L > R). However, the results of flood control operation considering uncertainties are usually random and discrete. Therefore, multiple risk assessment indicators should be considered to assess flood control risk. The mean value of flood control operation results was used to represent the expected value. In order to describe the extreme value risk of flood control operation results, the conditional value at risk (CVaR) was used to evaluate the extreme risk. For the discrete degree of risk variable distribution, entropy theory was applied to characterize the disorder risk.
(1) Mean value
In order to analyze the maximum occupied storage capacity of the reservoir, the mean value was used to evaluate the risk of this possible value.
(2) Conditional Value at Risk (CVaR)
Since the extreme situation may appear in the result of multiple simulation operations, in order to reasonably analyze the extreme value situation, CVaR can be used to evaluate the extreme value risk, due to the uncertainties in flood control operation [20].
(3) Information Entropy
Since different possible values may appear in the simulated operation result and the result shows a discrete state, and the magnitude of the discrete degree represents the degree of uncertainties affecting flood control operation. Therefore, the standard deviation is generally used to measure the risk, however, the standard deviation may not be applicable to the asymmetric result [35]. In order to reasonably assess the flood control risk, the entropy theory was used to evaluate the risk of flood control operation [25].
The smaller the values of these risk indicators, the smaller the flood control operation risk, and the more reasonable the allocation of water resources; on the contrary, the greater the risk of flood control operation, and the less fully utilized the water resources.
2.4. Optimal Selection of Decision for Different Flood Control Operation Schemes
2.4.1. Weight Analysis of Reservoir based on Analytic Hierarchy Process
The Analytic Hierarchy Process (AHP) was used to analyze the weight of each reservoir, and the multi-attribute decision matrix of the flood control operation of reservoir group was constructed by the weighted evaluation index of each reservoir. The steps of the Analytical hierarchy process are as follows:
(1) The hierarchical model is built according to the flood control capacity and average annual runoff of each reservoir;
(2) Comparing the flood control capacity and average annual runoff of each reservoir and constructing judgment matrix A;
where aij is the important scale of reservoir i relative to reservoir j; and aij can be determined by 1–9 ratio scaling method.
(3) Consistence test;
The constituency index (CI) of the judgment matrix is calculated by using the eigenvalue , which is shown as follows:
where n is the matrix size. The consistency of the judgment matrix can be checked by calculating the constituency ratio (CR) of CI with a random index (RI) [36].
(4) Indicator weight was determined;
The weight vector can be used to weight evaluation index for different reservoirs, and the comprehensive value of the indicators are obtained.
2.4.2. Decision Making of Flood Control Operation Schemes Using the Improved TOPSIS Assessment Method
The original index data of each scheme in decision matrix Sm×n should be processed as dimensionless standardization [37].
Entropy weight method is used to determine the comprehensive weights of each index [37]. According to the definition of entropy, the information entropy of the jth indicator of the decision matrix can be expressed as
The entropy weight of evaluation index can be expressed as
Because there are many factors considered in flood control decision-making, in order to avoid weight distortion in the decision-making process of the scheme, the subjective weight of the decision maker and entropy weight should be combined, and the combined weight can be obtained, .
The TOPSIS evaluation method based on improved Mahalanobis distance is used to select different flood control operation schemes [37]. The positive ideal solution and negative ideal solution are constructed based on the standardized decision matrix :
where is benefit attribute set; is cost attribute set.
where is weight matrix; are weight of each index, respectively; is the covariance matrix between attribute indices.
According to the relative closeness degree of different schemes calculated from large to small the order of each scheme is counted and the order before represents the better of the scheme. Finally, the optimal scheme for joint flood control operation of reservoir groups is selected.
2.5. Data
The Yangtze River, traversing the West, Middle and East China, is the third largest river in the world. With its complex drainage system, abundant rainfall but uneven spatial and temporal distribution, flood disaster occurs frequently. To solve this problem, a lot of reservoirs had been built. At present, the number of reservoirs currently involved in the joint dispatch of the Yangtze River Basin has increased to about 40, and the capacity of flood control reservoirs can reach 57 billion cubic meters, which constitutes the largest flood control system of giant reservoirs in the world. In this study, 14 large reservoirs on various tributaries of the Yangtze River Basin were selected as a case study. The reason for choosing the upper reach of the Yangtze River is that the upstream reservoirs have more remaining flood control capacity, and the flood control pressure of Three Gorges Reservoir (TGR) can be reduced by making full use of them. The schematic of the regional main rivers and gauging stations is shown in Figure 2, and the selected rivers are shown in Table 1.
3. Result
3.1. Risk Analysis of Flood Control Operation
3.1.1. Extraction Results of Flood Control Operation Schemes
The multi-reservoir in the upper reach of the Yangtze River was incorporated to reduce flood control pressure on the middle and lower reaches of the Yangtze River. To date, the joint operation scheme of reservoirs mentioned above had not been formulated yet. Li et al. [38] made the operation scheme of Xiluodu-Xiangjiaba cascade reservoirs cooperated with the TGR for the flood control of the middle and lower reaches of the Yangtze River in the condition of guaranteeing the safety of Lizhuang (LZ) and Zhutuo (ZT) station. Based on this paper, a similar form of the operation scheme of the whole reservoirs was made. The water level and inflow of the TGR were selected to determine when the upstream reservoirs began to impound flood. Moreover, according to the principles that larger inflow mean larger impoundment, the different fixed release was determined on a different magnitude of the reservoir inflow. The form of the operation scheme was shown in Table S1. More details, such as the constraints and objective of the optimization model are shown in Supplementary Materials (Equations (S1)–(S4)).
Seven typical flood hydrographs, which caused huge disasters in the Yangtze River Basin in the past 100 years, were selected from the perspective of flood magnitude, disaster severity, occurring time and flood composition. Most of the selected typical floods occurred in July or August, in terms of the region distribution, the types of the typical flood, which include the upstream type, downstream type and whole basin type. Most of the typical flood peak types are multi-peak and double-peak. The flood process of the typical flood lasted a long time, which is the characteristics of the floods in the middle and lower reaches of the Yangtze River. However, the single-peak flood with a shorter duration was also chosen. The selected design flood hydrographs were input in the combined simulation-optimization model and seven optimal operation schemes which are suitable for different types of flood, were obtained (Tables S3–S9). For example, Scheme 1 and Scheme 7 are suitable for dealing with flood in the whole basin, and Scheme 4 is suitable for dealing with flood types with larger inflow in the interval. Scheme 8 (Table S10) is obtained by synthetically considering seven typical flood processes, and Scheme 9 (Table S11) is the existing joint operation scheme. All feasible schemes (Tables S3–S11) are used for risk analysis and decision-making in the next step.
3.1.2. Simulation of Uncertainties
In this study, the forecast errors of LZ, ZT, Cuntan (CT) and Three Gorges Reservoir (with a lead time of three days), as well as the uncertainties in discharge capacity curve, water level-storage curve of the 14 reservoirs were considered at the same time, and a copula-based simulation method and LHS method was applied to sample the correlated and unrelated uncertainties, respectively.
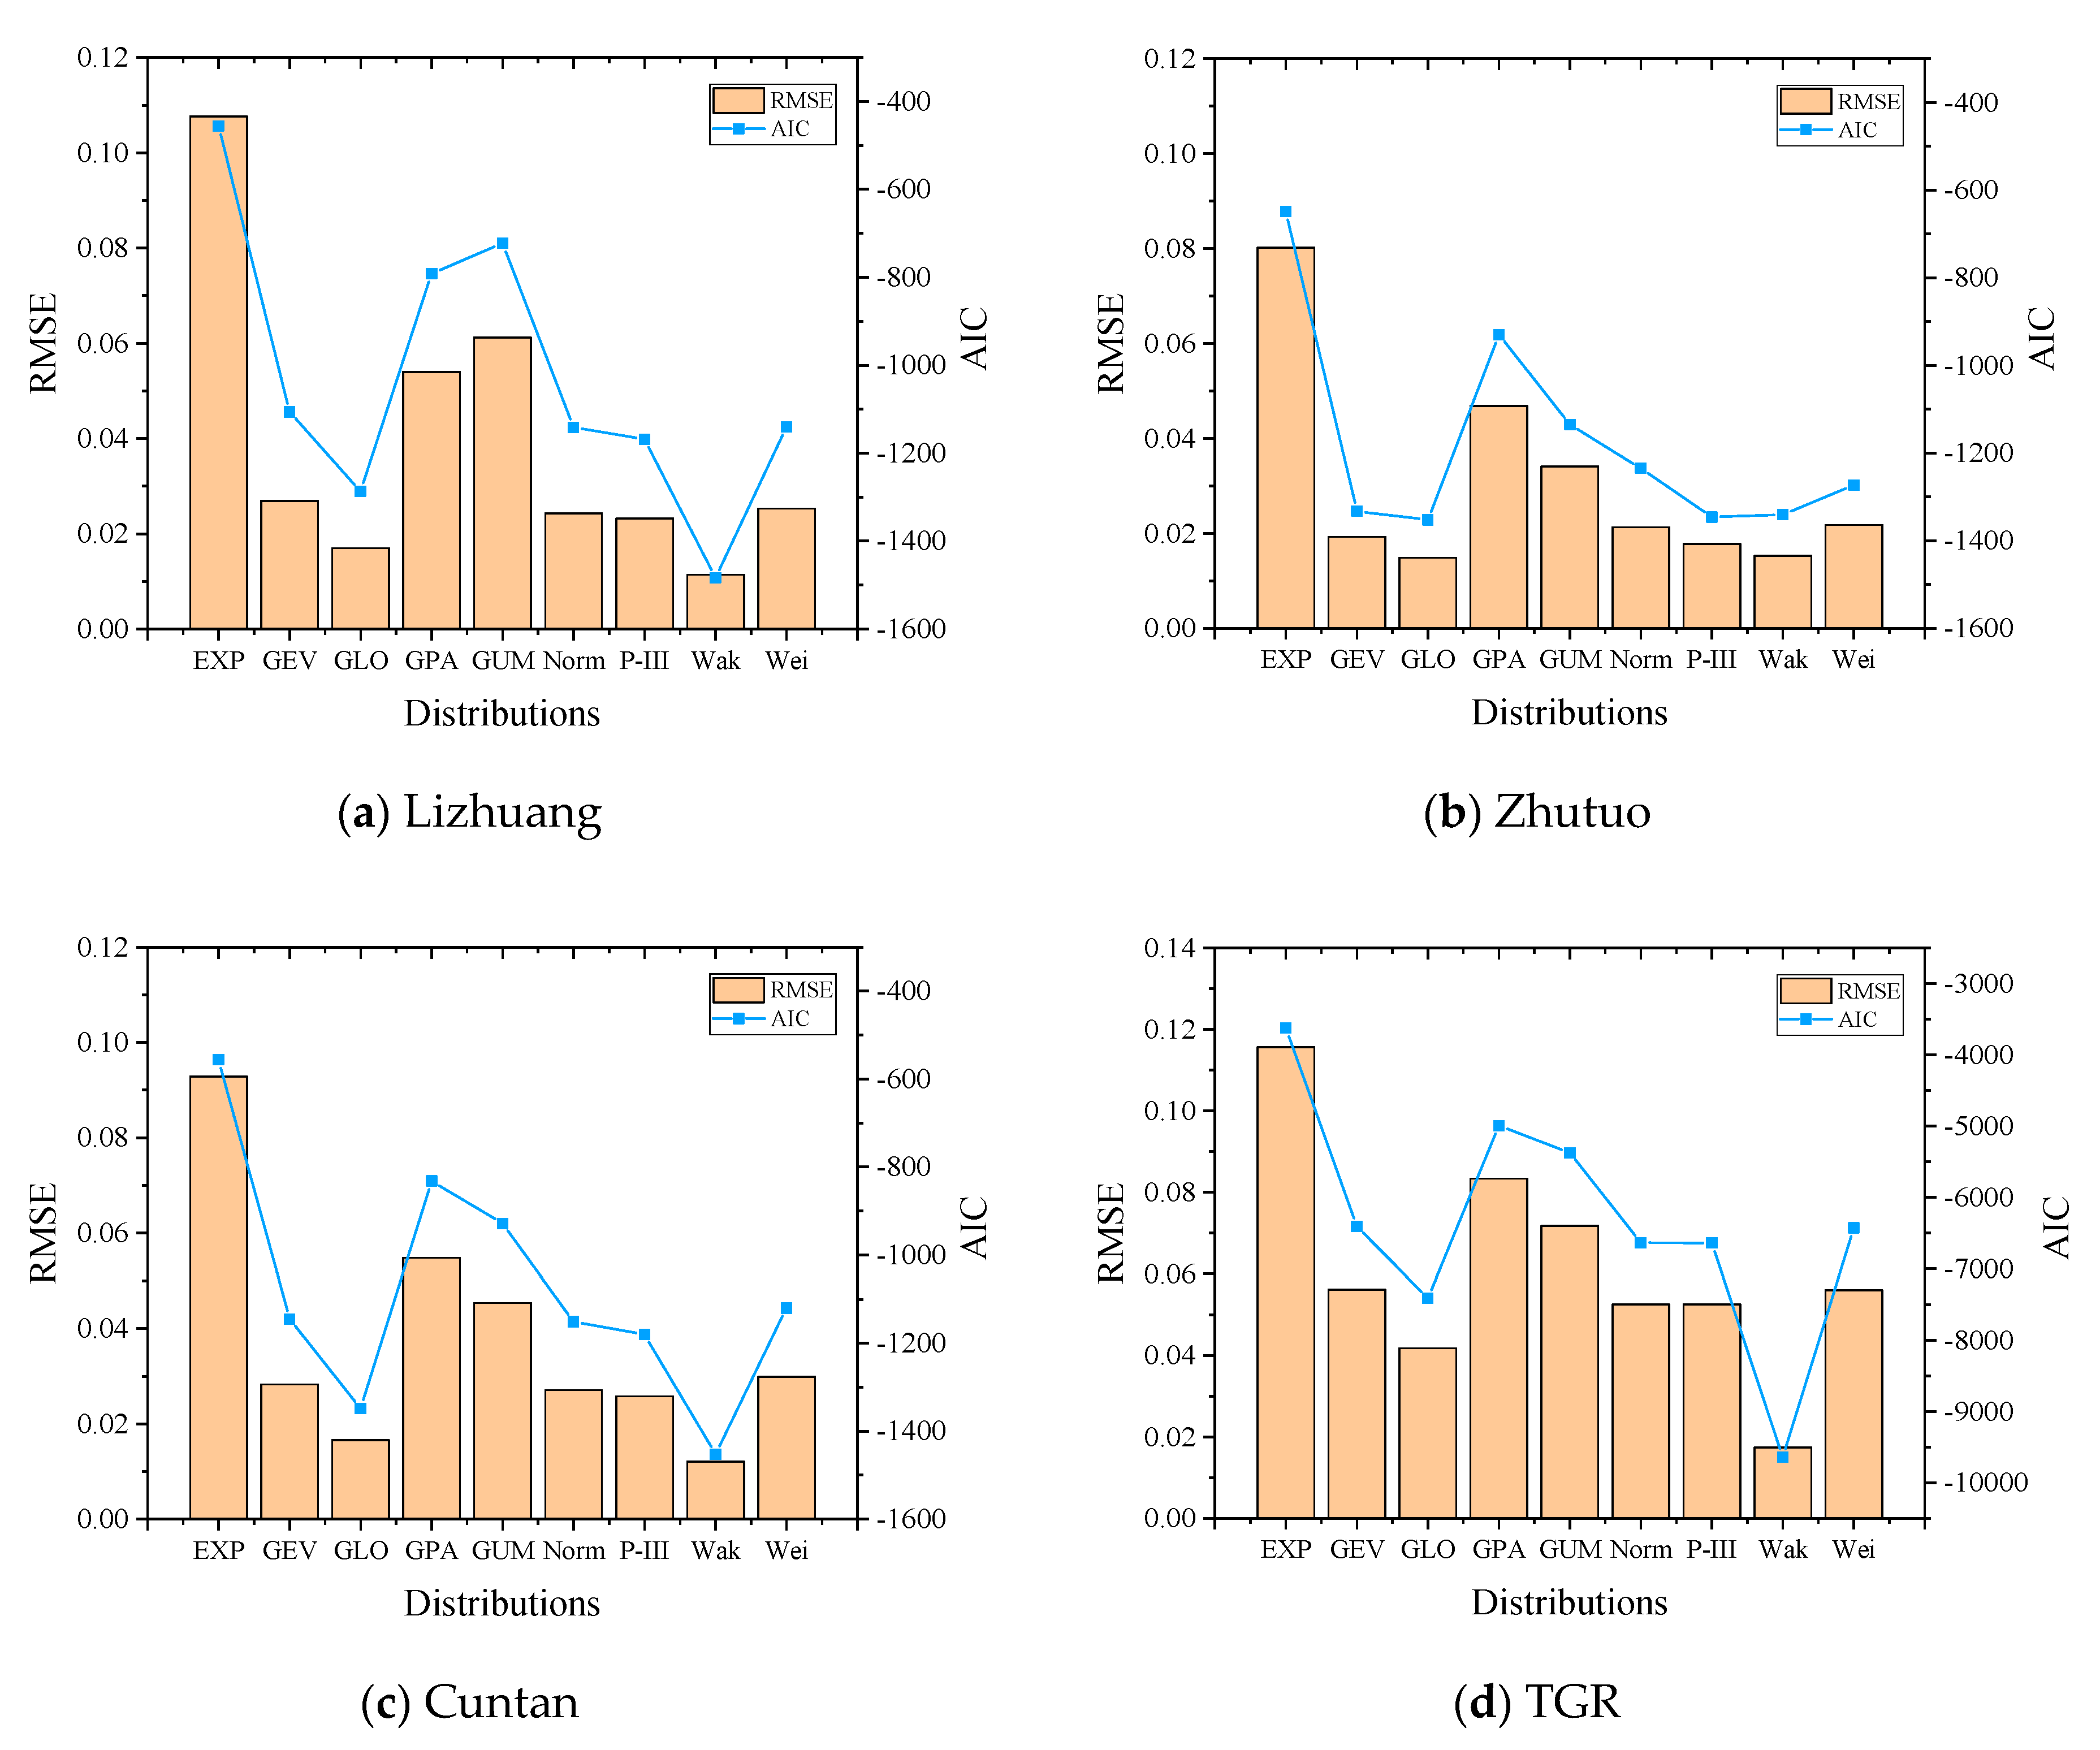
For the uncertainties of flood forecast errors, different candidate distributions, including Exponential distribution (EXP), Generalized Extreme Value distribution (GEV), Generalized Logistic distribution (GLO), Generalized Pareto distribution (GPA), Gumbel distribution (Gumbel), Pearson Type III distribution (P-III), Wakeby distribution (Wakeby), Weibull distribution (Weibull) and Normal distribution are used to fit the flood uncertainty data, and the RMSE and AIC were calculated to select the best fitting distributions. As shown in Figure 3 and Table 2, the values of RMSE and AIC corresponding to Wakeby distribution are the smallest. Therefore, the Wakeby distribution was the best fitted distribution for flood forecast errors. The errors in discharge coefficient λ and storage error v of each reservoir were fitted using the normal distribution with a mean of 1, and a variance of 0.2 and 0.02, respectively.
There are some correlations among forecast errors with different lead times during the flood control operation in TGR. Thus, the three-dimensional copula function was selected to construct the joint distribution of flood forecast errors in TGR, and the three-dimensional forecast series was simulated based on the Student t copula. The specific steps of the stochastic simulation method for the uncertainty of flood forecasting is referred to in Huang et al. [25]. For the forecast errors of the three flood control points (LZ, ZT, CT) and the errors in discharge coefficient λ and storage error v of each reservoir were sampled by LHS method.
3.1.3. Risk Analysis of Flood Control Operation Based on Different Risk Assessment Indicators
Based on different typical 1% design flood hydrograph as the input of the joint operation model, 10,000 simulation operations were carried out considering various uncertainties at the same time, and the mean value, CVaR (the confidence level α is set to 99%), and the entropy of the maximum occupied storage capacity of each reservoir are calculated. Taking 1% design flood in 1998 as an example, the calculation results of the three risk indicators are shown in Table 3, Table 4 and Table 5, respectively, and the weighted risk indicators are shown in Figure 4.
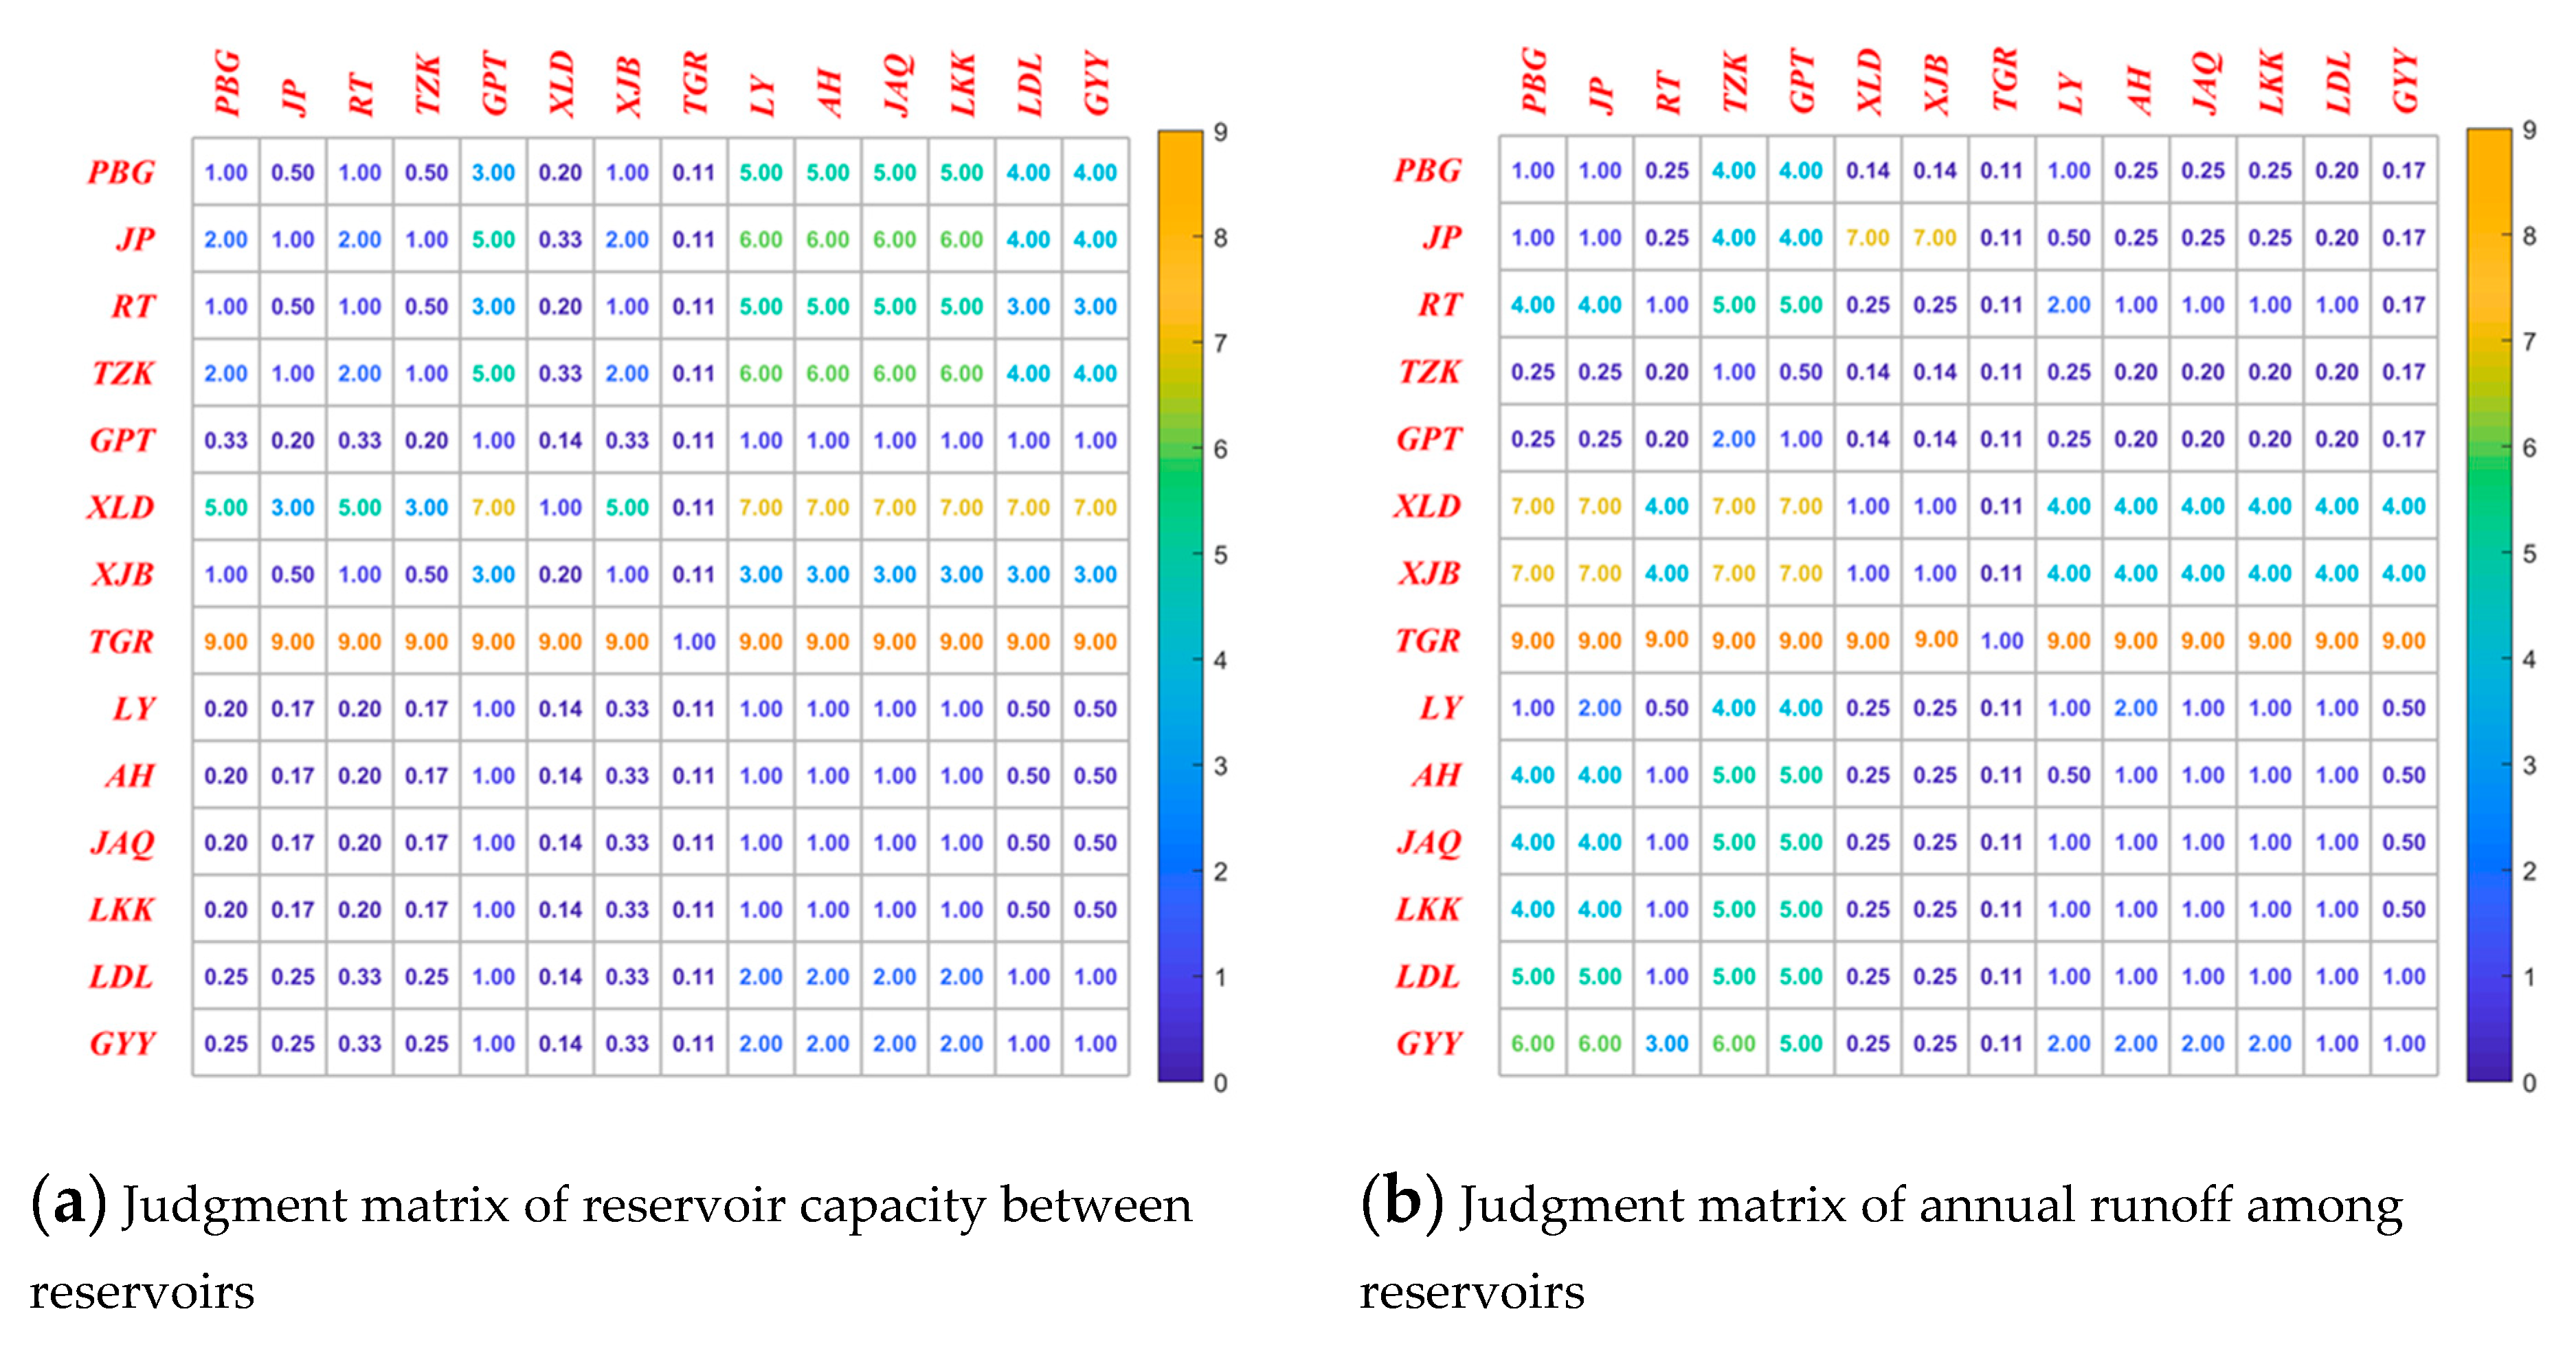
According to the average annual runoff and flood control capacity of each reservoir in Table 6, a hierarchical topological graph is established based on the flood capacity and the average annual runoff of each reservoir. The judgment matrices of the attribute of reservoirs were shown in Figure 5, the index number of the matrices were calculated by using pair-wise comparison using the 1-9 scale of AHP. The CR of these two judgment matrices is 0.049 and 0.054, which indicates that the judgment matrices have passed the consistence test. The weight vector of the reservoir’s storage capacity and runoff is defined as {0.5, 0.5}, and the weight of each reservoir is calculated as {0.0181, 0.0246, 0.0243, 0.0255, 0.0284, 0.0304, 0.0476, 0.0439, 0.1639, 0.1079, 0.0360, 0.0453, 0.0138, and 0.3901}.
The risk indexes are weighted by the weight of each reservoir, as shown in Table 3, Table 4 and Table 5. It is seen from Table 3 and Table 4 that Scheme 7 is the optimal scheme from the point of view of weighted mean value and CVAR. It shows that Scheme 7 could make full use of the flood control capacity of each reservoir, and it is more likely to reduce the risk of overtopping when encountering extreme conditions caused by uncertainties. However, from the perspective of entropy, Scheme 2 is the optimal one, as shown in Table 5. The weighted entropy of Scheme 7 is larger than that of most other schemes, which denotes that Scheme 7 is more affected by the uncertainties and the corresponding risk is greater. It is unreliable to evaluate the multi-reservoir flood control operation scheme only from any one indicator, the three indicators should be taken into account comprehensively.
3.2. Decision Making for Different Schemes
Based on the weighted mean value, CVaR and entropy of maximum occupied storage capacity, a decision-making matrix could be established. The entropy weight of the three indicators is calculated as , the subjective weight is set to = (0.45, 0.45, 0.1), so that the combined weight is (0.2921, 0.3741, 0.3365). Finally, TOPSIS evaluation method based on improved Mahalanobis distance is used to evaluate and arrange all schemes. The result was shown in Table 7.
According to the proposed method, the optimal scheme can be selected. For example, for the 1% design flood in 1998, it is seen from Table S9 that the flood control effect of Scheme 7 is better than other schemes. Under the operation of Scheme 7, the mean risk and CVaR of reservoirs flood control operation are the smallest. Although risk entropy of operation result is on the high side, Scheme 7, which takes subjective weight and objective weight into account, is selected as the optimal flood control operation scheme. For the design flood in different typical years, the corresponding optimal selection schemes are also different when the uncertainties are considered. The excellent and inferior order between operation schemes is calculated by the proposed model when the typical design flood is different, as shown in Table 8 and Figure 6. The sum of orders of Scheme 5 and Scheme 6 are the smallest among all the schemes, which means that these two schemes can effectively deal with different typical flood processes when the uncertainties considered.
4. Conclusions and Discussions
The main axis of the proposed method is the stochastic simulation of uncertainty, flood control risk assessment and decision making. The proposed method realizes the reasonable optimization selection of flood control operation scheme. The main conclusions of this study are summarized as follows:
- (1)
- In this study, a Copula-based method and LHS method were used to simulate the uncertainties in flood forecast errors, discharge capacity and water level-storage which have great influence on flood control operation, respectively. Then, in order to cope with the problem that the traditional reservoir risk assessment index is too single, a multi-index evaluation system with mean, CVaR and entropy was constructed to assess flood control risk from multiple perspectives. In addition, the improved Mahalanobis distance TOPSIS was used to solve the conflict between risk indexes and take into account the risk of each reservoir. The proposed method provides a new way for multi-criteria risk analysis and decision-making of multi-reservoir flood control operation.
- (2)
- The proposed method can effectively simulate the uncertainties in flood control operation, and accurately quantify the risk of the subsystems (single reservoir) and the overall risk of the flood control system. For the 100-year design flood hydrograph in 1998, it is obvious that the XLD, XJB and TGR reservoir which undertake larger flood control task, have a greater risk under the influence of uncertainties after calculation with the proposed model. At the same time, different flood control operation schemes have different corresponding risks under the 1998 flood conditions. The optimal scheme is different according to different evaluation indicators. The risk of Scheme 7 is lowest after weighted by subjective and objective weights.
- (3)
- The multi-reservoir flood control operation system in the upper reaches of the Yangtze River, which has many flood sources and complicated flood region composition. With this condition, different flood control operation schemes are needed to cope with different reservoir inflow discharge. On the basis of multiple perspective risk analysis, the proposed model can further select an optimal scheme under different design flood hydrographs. For example, among the alternative schemes, the Scheme 7 is optimal when the coming water from the whole basin (1998) and downstream reaches (1996) is large, but this scheme is relatively worse for other typical design floods. Considering all kinds of typical design floods, Scheme 5 and Scheme 6 are relatively optimal.
The proposed method can be applied to many cases of multi-attribute decision making problems in multi-reservoir flood control operation, due to the following advantages. First, the Copula-based method and the LHS method can effectively simulate the related and unrelated uncertainties existed in flood control operation. Second, the proposed method could be used to quantify the partial and overall risk of multi-reservoir flood control operation from multiple perspectives. In this sense, the decision makers will obtain a clear idea of the risk in the multi-reservoir flood control system and can make a decision according to their preferences. Third, this proposed method is based on a Monte-Carlo framework, which eliminates the complicated mathematical derivation and calculation process to describe the complex relationship between uncertainties and risk. Therefore, in real-life applications, the proposed methodology can be easily applied to risk analysis and decision making for multi-reservoir flood control operation under uncertainties.
Furthermore, on the basis of this model, the relationship between uncertainty and risk in reservoir flood control operation could be studied in the future, and the risk transfer mechanism under the influence of uncertainties in flood control operation can be further explored.
Supplementary Materials
The following are available online at https://www.mdpi.com/2073-4441/11/4/649/s1. Figure S1: Schematics of the combined simulation-optimization model of multi-reservoir joint flood control operation. Table S1: The form of the operation scheme of multi-reservoir joint flood control. Table S2: The range of the decision variable of the optimization model. Table S3: Multi reservoir joint flood control operation Scheme 1 in the upper reach of Yangtze River. Table S4: Multi reservoir joint flood control operation Scheme 2 in the upper reach of Yangtze River. Table S5: Multi reservoir joint flood control operation Scheme 3 in the upper reach of Yangtze River. Table S6: Multi reservoir joint flood control operation Scheme 4 in the upper reach of Yangtze River. Table S7: Multi reservoir joint flood control operation Scheme 5 in the upper reach of Yangtze River. Table S8: Multi reservoir joint flood control operation Scheme 6 in the upper reach of Yangtze River. Table S9: Multi reservoir joint flood control operation Scheme 7 in the upper reach of Yangtze River. Table S10: Multi reservoir joint flood control operation Scheme 8 in the upper reach of Yangtze River. Table S11: Multi reservoir joint flood control operation Scheme 9 in the upper reach of Yangtze River.
Author Contributions
This research was carried out in collaboration between all authors; Q.W. and J.Z. designed this paper; and Q.W., J.Z. and K.H. guided the experiments and wrote most parts of the paper; K.H., L.D., G.Z., L.C., H.Q. collected the data, prepared the manuscript and made some corrections; all authors did the calculation work and prepared the figures.
Funding
This study was supported by the National Natural Science Foundation of China (91547208, U1865202, 51579107).
Acknowledgments
The authors greatly appreciate the anonymous reviewers and academic editor for their careful comments and valuable suggestions to improve the manuscript.
Conflicts of Interest
The authors declare no conflict of interest.
References
- Pham, T.V. Tracking the uncertainty in streamflow prediction through a hydrological forecasting system. Master’s Thesis, University of Twente, Enschede, The Netherlands, August 2011. [Google Scholar]
- EM-DAT, The International Disaster Database. Available online: http://www.emdat.be (accessed on 27 March 2019).
- Chen, J.; Shi, H.Y.; Sivakumar, B.; Peart, M.R. Population, water, food, energy and dams. Renew. Sustain. Energy Rev. 2016, 56, 18–28. [Google Scholar] [CrossRef]
- Karamouz, M.; Ahmadi, A.; Moridi, A. Probabilistic reservoir operation using Bayesian stochastic model and support vector machine. Adv. Water Resour. 2009, 32, 1588–1600. [Google Scholar] [CrossRef]
- Ji, C.; Zhou, T.; Huang, H. Operating rules derivation of Jinsha reservoirs system with parameter calibrated support vector regression. Water Res. Manag. 2014, 28, 2435–2451. [Google Scholar] [CrossRef]
- Zhang, D.; Lin, J.Q.; Peng, Q.D.; Wang, D.S.; Yang, T.T.; Sorooshlan, S.; Liu, X.F.; Zhuang, J.B. Modeling and simulating of reservoir operation using the artificial neural network, support vector regression, deep learning algorithm. J. Hydrol. 2018, 565, 720–736. [Google Scholar] [CrossRef]
- Zhu, F.; Zhong, P.; Sun, Y. Multi-criteria group decision making under uncertainty: Application in reservoir flood control operation. Environ. Model. Soft. 2018, 100, 236–251. [Google Scholar] [CrossRef]
- Diao, Y.F.; Wang, B.D. Risk analysis of flood control operation mode with forecast information based on a combination of risk sources. Sci. China Technol. Sci. 2010, 53, 1949–1956. [Google Scholar] [CrossRef]
- Chen, J.; Zhong, P.A.; Zhang, Y.; Navar, D.; Yeh, W.W. A decomposition-integration risk analysis method for real-time operation of a complex flood control system. Water Resour. Res. 2017, 53, 2490–2506. [Google Scholar] [CrossRef]
- Chen, J.; Zhong, P.A.; Xu, B.; Zhao, Y.F. Risk analysis for real-time flood control operation of a reservoir. Energy Convers. Manag. 2015, 141, 04014092. [Google Scholar] [CrossRef]
- Ding, W.; Zhang, C.; Peng, Y.; Zeng, R.; Zhou, H.; Cai, X. An analytical framework for flood water conservation considering forecast uncertainty and acceptable risk. Water Resour. Res. 2015, 51, 4702–4726. [Google Scholar] [CrossRef]
- Shi, H.; Li, T.; Liu, R.; Chen, J.; Li, J.; Zhang, A.; Wang, G.Q. A service-oriented architecture for ensemble flood forecast from numerical weather prediction. J. Hydrol. 2015, 527, 933–942. [Google Scholar] [CrossRef]
- Zhang, J.; Chen, L.; Singh, V.P.; Cao, W.; Wang, D. Erratum to: Determination of the distribution of flood forecasting error. Nat. Hazard. 2015, 75, 2065. [Google Scholar] [CrossRef]
- Zhu, F.; Zhong, P.; Sun, Y.; Yeh, W.W. Real-time optimal flood control decision making and risk propagation under multiple uncertainties. Water Resour. Res. 2017, 53, 10635–10654. [Google Scholar] [CrossRef]
- Li, X.; Guo, S.L.; Liu, P.; Chen, G.Y. Dynamic control of flood limited water level for reservoir operation by considering inflow uncertainty. J. Hydrol. 2010, 391, 124–132. [Google Scholar] [CrossRef]
- Tung, Y.K.; Yen, B.C.; Melching, C.S. Hydrosystems Engineering Reliability Assessments and Risk Analysis; McGraw-Hill: New York, NY, USA, 2006; Available online: ftp://nozdr.ru/biblio/kolxoz/E/Tung%20Y.K.,%20Yen%20B.C.,%20Melching%20C.%20Hydrosystems%20engineering%20reliability%20assessment%20and%20risk%20analysis%20(MGH,%202006)(ISBN%200071451587)(514s)_E_.pdf (accessed on 26 March 2019).
- Yan, B.W.; Guo, S.L.; Chen, L. Estimation of reservoir flood control operation risks with considering inflow forecasting errors. Stoc. Environ. Res. Risk Assess. 2014, 28, 359–368. [Google Scholar] [CrossRef]
- Charalambous, J.; Rahman, A.; Carroll, D. Application of Monte Carlo simulation technique to design flood estimation: A case study for north Johnstone River in Queensland, Australia. Water Resour. Manag. 2013, 27, 4099–4111. [Google Scholar] [CrossRef]
- Zhang, S.; Tan, Y. Risk assessment of earth dam overtopping and its application research. Natl. Hazard. 2014, 74, 717–736. [Google Scholar] [CrossRef]
- Zhang, X.Q.; Liu, P.; Xu, C.Y.; Ming, B.; Xie, A.L.; Feng, M.Y. Conditional Value-at-Risk for Nonstationary Streamflow and Its Application for Derivation of the Adaptive Reservoir Flood Limited Water Level. J. Water Resour. Plann. Manag. 2018, 144, 04018005. [Google Scholar] [CrossRef]
- Xu, B.; Zhong, P.A.; Huang, Q.Y.; Wang, J.Q.; Yu, Z.B.; Zhang, J.Y. Optimal hedging rules for water supply reservoir operations under forecast uncertainty and conditional value-at-risk criterion. Water 2017, 9, 568. [Google Scholar] [CrossRef]
- Chiara, N.; Garvin, M.J. Variance models for project financial risk analysis with applications to Greenfield bot highway projects. Constr. Manag. Econ. 2008, 26, 925–939. [Google Scholar] [CrossRef]
- Yang, Y.; Ren, Q.W.; Tian, Y.; Xiong, Y. Risk analysis for a cascade reservoir system using the brittle risk entropy method. Sci. China Technol. Sci. 2016, 59, 882–887. [Google Scholar] [CrossRef]
- Fan, Y.R.; Huang, W.W.; Huang, G.H.; Huang, K.; Li, Y.P.; Kong, X.M. Bivariate hydrologic risk analysis based on a coupled entropy-copula method for the Xiangxi river in the Three Gorges Reservoir area, China. Theor. Appl Climatol. 2016, 125, 381–397. [Google Scholar] [CrossRef]
- Huang, K.D.; Ye, L.; Chen, L.; Wang, Q.S.; Dai, L.; Zhou, J.Z.; Singh, V.P.; Huang, M.T.; Zhang, J.H. Risk analysis of flood control reservoir operation considering multiple uncertainties. J. Hydrol. 2018, 565, 672–684. [Google Scholar] [CrossRef]
- Chen, S.Y.; Hou, Z.C. Multi-criterion decision making for flood control operations: Theory and applications. J. Am. Water Resour. Assoc. 2004, 40, 67–76. [Google Scholar] [CrossRef]
- Yu, Y.B.; Wang, B.D.; Wang, G.L.; Li, W. Multi-person multiobjective fuzzy decision-making model for reservoir flood control operation. Water Resour. Manag. 2004, 18, 111–124. [Google Scholar] [CrossRef]
- Fu, G.T. A fuzzy optimization method for multicriteria decision making: An application to reservoir flood control operation. Expert. Syst. Appl. 2008, 34, 145–149. [Google Scholar] [CrossRef]
- Wang, X.J.; Zhao, R.H.; Hao, Y.W. Flood control operations based on the theory of variable fuzzy sets. Water Resour. Manag. 2011, 25, 777–792. [Google Scholar] [CrossRef]
- Zhu, F.; Zhong, P.; Wu, Y.; Sun, Y.; Chen, J.; Jia, B. SMAA-based stochastic multi-criteria decision making for reservoir flood control operation. Stoch. Environ. Res. Risk Assess. 2017, 31, 1485–1497. [Google Scholar] [CrossRef]
- Chen, L.; Singh, V.P.; Lu, W.; Zhang, J.; Zhou, J.; Guo, S.L. Streamflow forecast uncertainty evolution and its effect on real-time reservoir operation. J. Hydrol. 2016, 540, 712–726. [Google Scholar] [CrossRef]
- Zazo, S.; Rodríguez-Gonzálvez, P.; Molina, J.-L.; González-Aguilera, D.; Agudelo-Ruiz, C.; Hernández-López, D. Flood hazard assessment supported by reduced cost aerial precision photogrammetry. Remote Sens. 2018, 10, 1566. [Google Scholar] [CrossRef]
- Apel, H.; Merz, B.; Thieken, A.H. Quantification of uncertainties in flood risk assessments. Int. J. River Basin Manag. 2008, 6, 149–162. [Google Scholar] [CrossRef]
- Dai, L.; Zhou, J.Z.; Chen, L.; Huang, K.D.; Wang, Q.S.; Zha, G. Flood-risk analysis based on a stochastic differential equation method. J. Flood Risk Manag. 2018, 1–10. [Google Scholar] [CrossRef]
- Yang, L. Study on Cumulative Residual Entropy and Variance as Risk Measure. In Proceedings of the Fifth International Conference on Business Intelligence & Financial Engineering, Milan, Italy, 18–21 August 2012; pp. 210–213. [Google Scholar]
- Al, H.K.B. Application of the ahp in project management. Int. J. Project Manag. 2001, 19, 19–27. [Google Scholar]
- Wang, Z.X.; Li, D.D.; Zheng, H.H. The External Performance Appraisal of China Energy Regulation: An Empirical Study Using a TOPSIS Method Based on Entropy Weight and Mahalanobis Distance. Int. J. Environ. Res. Public Health 2018, 15, 236. [Google Scholar] [CrossRef] [PubMed]
- Li, A.Q.; Zhang, J.Y.; Zhong, Z.Y.; Ding, Y. Study on joint flood control operation for leading reservoirs in the upper Changjiang River. Shuili Xuebao (J. Hydraul. Eng.) 2013, 44, 59–66. (In Chinese) [Google Scholar]
Figure 1.
The flow chart of this study. Notes: PSO: Particle swarm optimization, LHS: Latin hypercube sampling, AHP: Analytic hierarchy process, CVaR: Conditional value at risk, TOPSIS: The technique for order preference by similarity to the ideal solution.
Figure 1.
The flow chart of this study. Notes: PSO: Particle swarm optimization, LHS: Latin hypercube sampling, AHP: Analytic hierarchy process, CVaR: Conditional value at risk, TOPSIS: The technique for order preference by similarity to the ideal solution.

Figure 2.
Schematic of the regional main rivers and gauging stations of the Yangtze River in China.

Figure 3.
Test results of fitting flood forecasting errors with different distributions (Notes: The Wak and Wei in the picture represent the Wakeby distribution and Weibull distribution respectively).
Figure 3.
Test results of fitting flood forecasting errors with different distributions (Notes: The Wak and Wei in the picture represent the Wakeby distribution and Weibull distribution respectively).

Figure 4.
Weighted risk indicators.

Figure 5.
Judgment matrix between reservoirs.

Figure 6.
Ranking order of different schemes in different typical years.


Table 1.
The selected rivers and reservoirs.
| Reservoir | River | Average Annual Runoff (108 m3) | Flood Control Capacity (108 m3) | Flood Limit Water Level (m) | Normal Water Level (m) |
|---|---|---|---|---|---|
| Liyuan (LY) | Middle reaches of the Jinsha River | 445 | 1.73 | 1605 | 1618 |
| Ahai (AH) | 510 | 2.15 | 1493.3 | 1504 | |
| Jinanqiao (JAQ) | 527 | 1.58 | 1410 | 1418 | |
| Longkaikou (LKK) | 533 | 1.26 | 1289 | 1298 | |
| Ludila (LDL) | 558 | 5.64 | 1212 | 1223 | |
| Guanyinyan (GYY) | 585 | 5.42/2.53 | 1122.3/1128.8 | 1134 | |
| Jinping (JP) | Yalong River | 385 | 16 | 1859 | 1880 |
| Ertan (ET) | 527 | 9 | 1190 | 1200 | |
| Xiluodu (XLD) | Lower reaches of the Jinsha River | 1436 | 46.5 | 560 | 600 |
| Xiangjiaba (XJB) | 1440 | 9.03 | 370 | 380 | |
| Pubugou (PBG) | Min River | 388 | 11/7.3 | 790 | 850 |
| Tingzikou (TZK) | Jialing River | 189 | 14.4 | 447 | 458 |
| Goupitan (GPT) | Wujiang River | 226 | 4/2 | 626.24/628.12 | 630 |
| Three Gorges Revision (TGR) | Yangtze River | 4510 | 221.5 | 145 | 175 |
Notes: The water level is expressed in meters above sea level.
Table 2.
Estimated parameters of distributions of flood forecast uncertainties.
| Flood Control Point | Distributions | Estimated Parameters | ||||
|---|---|---|---|---|---|---|
| LZ | Wakeby | −19.1882 | 66.1897 | 4.8950 | 4.4513 | 0.0106 |
| ZT | Wakeby | −14.6374 | 152.6950 | 14.5047 | 7.5326 | −0.2849 |
| CT | Wakeby | −8.5206 | 80.3935 | 11.7899 | 3.3197 | −0.1374 |
| YC (day 1) | Wakeby | −19.60 | 170.01 | 10.25 | 2.91 | 0.20 |
| YC (day 2) | Wakeby | −25.1 | 204.14 | 9.80 | 4.5 | 0.06 |
| YC (day 3) | Wakeby | −33.36 | 254.49 | 9.43 | 7.43 | −0.14 |
Notes: The parameters , and are shape parameters; and the parameters and are location parameters.
Table 3.
The mean values of the maximum occupied capacity of each reservoir under the operation of different schemes.
Table 3.
The mean values of the maximum occupied capacity of each reservoir under the operation of different schemes.
| Reservoir | Schemes | ||||||||
|---|---|---|---|---|---|---|---|---|---|
| 1 | 2 | 3 | 4 | 5 | 6 | 7 | 8 | 9 | |
| LY | 1.7226 | 1.7229 | 1.7228 | 1.7222 | 1.7228 | 1.7230 | 1.7213 | 1.7230 | 1.7223 |
| AH | 2.1645 | 2.1649 | 2.1647 | 2.1641 | 2.1648 | 2.1650 | 2.1631 | 2.1649 | 2.1642 |
| JAQ | 1.5760 | 1.5766 | 1.5763 | 1.5755 | 1.5765 | 1.5767 | 1.5744 | 1.5767 | 1.5760 |
| LKK | 1.2748 | 1.2756 | 1.2753 | 1.2744 | 1.2754 | 1.2757 | 1.2733 | 1.2757 | 1.2749 |
| LDL | 5.7722 | 5.7825 | 5.7755 | 5.7673 | 5.7807 | 5.7851 | 5.7623 | 5.7851 | 5.7761 |
| GYY | 5.4344 | 5.4346 | 5.4344 | 5.4341 | 5.4344 | 5.4348 | 5.4316 | 5.4348 | 5.4329 |
| JP | 16.063 | 16.065 | 16.065 | 16.063 | 16.065 | 16.064 | 16.060 | 16.064 | 16.062 |
| ET | 9.4443 | 9.4460 | 9.4461 | 9.4444 | 9.4459 | 9.4450 | 9.4419 | 9.4450 | 9.4440 |
| XLD | 46.548 | 46.546 | 46.549 | 46.548 | 46.544 | 46.547 | 44.866 | 46.453 | 35.998 |
| XJB | 9.0888 | 9.0836 | 9.0886 | 9.0888 | 9.0828 | 9.0850 | 9.0730 | 9.0785 | 9.0629 |
| PBG | 11.075 | 11.089 | 11.079 | 11.057 | 11.082 | 11.089 | 11.057 | 11.083 | 11.082 |
| TZK | 8.2328 | 6.3602 | 5.6930 | 6.0640 | 8.5366 | 6.0088 | 4.4825 | 7.5567 | 9.0532 |
| GPT | 3.9711 | 3.9719 | 3.9709 | 3.9717 | 3.9723 | 3.9712 | 3.9710 | 3.9718 | 3.9724 |
| SX | 95.577 | 95.472 | 99.622 | 93.820 | 94.249 | 95.722 | 83.545 | 91.107 | 101.888 |
| Weighted | 48.389 | 48.263 | 49.853 | 47.605 | 47.884 | 48.345 | 43.246 | 46.599 | 49.157 |
Table 4.
The CVaR values of the maximum occupied capacity of each reservoir under the operation of different schemes.
Table 4.
The CVaR values of the maximum occupied capacity of each reservoir under the operation of different schemes.
| Reservoir | Schemes | ||||||||
|---|---|---|---|---|---|---|---|---|---|
| 1 | 2 | 3 | 4 | 5 | 6 | 7 | 8 | 9 | |
| LY | 1.7355 | 1.7355 | 1.7351 | 1.7362 | 1.7363 | 1.7360 | 1.7334 | 1.7352 | 1.7345 |
| AH | 2.1779 | 2.1770 | 2.1774 | 2.1780 | 2.1784 | 2.1778 | 2.1759 | 2.1774 | 2.1759 |
| JAQ | 1.5898 | 1.5893 | 1.5894 | 1.5897 | 1.5894 | 1.5897 | 1.5865 | 1.5892 | 1.5883 |
| LKK | 1.2888 | 1.2883 | 1.2885 | 1.2882 | 1.2878 | 1.2889 | 1.2857 | 1.2883 | 1.2867 |
| LDL | 5.8893 | 5.8943 | 5.8969 | 5.8851 | 5.8918 | 5.8973 | 5.8842 | 5.8964 | 5.8932 |
| GYY | 5.4503 | 5.4499 | 5.4499 | 5.4504 | 5.4498 | 5.4510 | 5.4450 | 5.4503 | 5.4459 |
| JP | 16.078 | 16.080 | 16.080 | 16.079 | 16.080 | 16.079 | 16.076 | 16.079 | 16.078 |
| ET | 9.4578 | 9.4595 | 9.4590 | 9.4590 | 9.4598 | 9.4587 | 9.4550 | 9.4584 | 9.4576 |
| XLD | 46.586 | 46.584 | 46.587 | 46.584 | 46.584 | 46.585 | 46.566 | 46.578 | 46.088 |
| XJB | 9.1539 | 9.1519 | 9.1559 | 9.1554 | 9.1526 | 9.1518 | 9.1447 | 9.1513 | 9.1418 |
| PBG | 11.195 | 11.200 | 11.198 | 11.181 | 11.199 | 11.201 | 11.183 | 11.203 | 11.202 |
| TZK | 10.595 | 10.592 | 9.971 | 10.588 | 10.596 | 10.591 | 6.266 | 10.595 | 10.596 |
| GPT | 3.9815 | 3.9820 | 3.9810 | 3.9820 | 3.9831 | 3.9822 | 3.9808 | 3.9826 | 3.9837 |
| SX | 107.76 | 105.35 | 113.39 | 102.04 | 102.99 | 107.01 | 91.33 | 97.46 | 111.55 |
| Weighted | 53.273 | 52.333 | 55.441 | 51.040 | 51.412 | 52.982 | 46.663 | 49.253 | 54.668 |
Table 5.
The entropy values of the maximum occupied capacity of each reservoir under the operation of different schemes.
Table 5.
The entropy values of the maximum occupied capacity of each reservoir under the operation of different schemes.
| Reservoir | Schemes | ||||||||
|---|---|---|---|---|---|---|---|---|---|
| 1 | 2 | 3 | 4 | 5 | 6 | 7 | 8 | 9 | |
| LY | −4.213 | −4.262 | −4.236 | −4.176 | −4.220 | −4.242 | −4.238 | −4.272 | −4.277 |
| AH | −4.182 | −4.238 | −4.202 | −4.165 | −4.202 | −4.218 | −4.209 | −4.269 | −4.271 |
| JAQ | −4.158 | −4.225 | −4.187 | −4.122 | −4.216 | −4.215 | −4.208 | −4.241 | −4.246 |
| LKK | −4.165 | −4.232 | −4.186 | −4.153 | −4.219 | −4.229 | −4.202 | −4.251 | −4.261 |
| LDL | −1.877 | −1.937 | −1.898 | −1.847 | −1.926 | −1.935 | −1.826 | −1.944 | −1.894 |
| GYY | −4.027 | −4.065 | −4.052 | −4.001 | −4.048 | −4.049 | −4.175 | −4.052 | −4.196 |
| JP | −3.888 | −3.948 | −3.950 | −3.885 | −3.946 | −3.906 | −3.836 | −3.913 | −3.894 |
| ET | −4.031 | −4.081 | −4.110 | −4.038 | −4.086 | −4.072 | −4.034 | −4.061 | −4.046 |
| XLD | −3.043 | −3.011 | −3.017 | −3.058 | −2.980 | −3.018 | 2.539 | 1.128 | 2.878 |
| XJB | −2.478 | −2.426 | −2.458 | −2.473 | −2.426 | −2.431 | −2.332 | −2.367 | −2.196 |
| PBG | −1.859 | −1.930 | −1.889 | −1.595 | −1.897 | −1.935 | −1.350 | −1.898 | −1.885 |
| TZK | 1.985 | 1.917 | 1.459 | 1.733 | 1.942 | 1.765 | 1.067 | 2.055 | 1.812 |
| GPT | −4.335 | −4.364 | −4.330 | −4.351 | −4.368 | −4.324 | −4.357 | −4.345 | −4.339 |
| SX | 2.701 | 2.301 | 2.888 | 2.288 | 2.354 | 2.419 | 2.147 | 2.470 | 2.742 |
| Weighted | −0.674 | −0.838 | −0.629 | −0.835 | −0.807 | −0.796 | 0.013 | −0.079 | 0.320 |
Table 6.
Implication of importance scale.
| Importance Index | Implication |
|---|---|
| 1 | The two elements are equally important |
| 3 | The former is slightly important than the latter |
| 5 | The former is obviously important than the latter |
| 7 | The former is very important than the latter |
| 9 | The former is extremely important than the latter |
| 2, 4, 6, 8 | Intermediate values of the above indexes |
Table 7.
Risk indexes and precedence of flood control operation scheme.
| Index | Flood Control Operation Schemes | ||||||||
|---|---|---|---|---|---|---|---|---|---|
| 1 | 2 | 3 | 4 | 5 | 6 | 7 | 8 | 9 | |
| Mean | 48.389 | 48.263 | 49.853 | 47.605 | 47.884 | 48.345 | 43.246 | 46.599 | 49.157 |
| CVaR | 53.273 | 52.333 | 55.441 | 51.040 | 51.412 | 52.982 | 46.663 | 49.253 | 54.668 |
| Entropy | −0.674 | −0.838 | −0.629 | −0.835 | −0.807 | −0.796 | 0.013 | −0.079 | 0.320 |
| Relative closeness degree | 0.4970 | 0.5332 | 0.4039 | 0.5551 | 0.5334 | 0.5315 | 0.6284 | 0.4446 | 0.0759 |
| Precedence | 6 | 4 | 8 | 2 | 3 | 5 | 1 | 7 | 9 |
Table 8.
Ranking order of different schemes in different typical years.
| Scheme | Typical Year (1% Design Flood) | Sum of Order | |||||||
|---|---|---|---|---|---|---|---|---|---|
| 1954 | 1968 | 1969 | 1980 | 1983 | 1988 | 1996 | 1998 | ||
| 1 | 4 | 6 | 6 | 1 | 6 | 3 | 8 | 6 | 40 |
| 2 | 3 | 3 | 2 | 3 | 4 | 5 | 4 | 4 | 28 |
| 3 | 2 | 5 | 5 | 6 | 5 | 6 | 7 | 8 | 44 |
| 4 | 6 | 7 | 7 | 5 | 7 | 4 | 9 | 2 | 47 |
| 5 | 5 | 4 | 4 | 2 | 3 | 1 | 3 | 3 | 25 |
| 6 | 1 | 2 | 1 | 7 | 1 | 2 | 6 | 5 | 25 |
| 7 | 9 | 9 | 9 | 9 | 9 | 9 | 1 | 1 | 56 |
| 8 | 7 | 1 | 3 | 4 | 2 | 7 | 5 | 7 | 36 |
| 9 | 8 | 8 | 8 | 8 | 8 | 8 | 2 | 9 | 59 |
© 2019 by the authors. Licensee MDPI, Basel, Switzerland. This article is an open access article distributed under the terms and conditions of the Creative Commons Attribution (CC BY) license (http://creativecommons.org/licenses/by/4.0/).
Share and Cite
MDPI and ACS Style
Wang, Q.; Zhou, J.; Huang, K.; Dai, L.; Zha, G.; Chen, L.; Qin, H. Risk Assessment and Decision-Making Based on Mean-CVaR-Entropy for Flood Control Operation of Large Scale Reservoirs. Water 2019, 11, 649. https://doi.org/10.3390/w11040649
AMA Style
Wang Q, Zhou J, Huang K, Dai L, Zha G, Chen L, Qin H. Risk Assessment and Decision-Making Based on Mean-CVaR-Entropy for Flood Control Operation of Large Scale Reservoirs. Water. 2019; 11(4):649. https://doi.org/10.3390/w11040649
Chicago/Turabian StyleWang, Quansen, Jianzhong Zhou, Kangdi Huang, Ling Dai, Gang Zha, Lu Chen, and Hui Qin. 2019. "Risk Assessment and Decision-Making Based on Mean-CVaR-Entropy for Flood Control Operation of Large Scale Reservoirs" Water 11, no. 4: 649. https://doi.org/10.3390/w11040649
Note that from the first issue of 2016, this journal uses article numbers instead of page numbers. See further details here.