Phosphorus Fluxes from Three Coastal Watersheds under Varied Agriculture Intensities to the Northern Gulf of Mexico


1
School of Renewable Natural Resources, Louisiana State University Agricultural Center, Baton Rouge, LA 70803, USA
2
Coastal Studies Institute, Louisiana State University, Baton Rouge, LA 70803, USA
*
Author to whom correspondence should be addressed.
Water 2018, 10(6), 816; https://doi.org/10.3390/w10060816
Submission received: 21 May 2018
/
Revised: 3 June 2018
/
Accepted: 16 June 2018
/
Published: 20 June 2018
(This article belongs to the Special Issue Recent Progress in River Biogeochemistry Research)
Abstract
:This study aims to evaluate recent total phosphorus (TP) and dissolved inorganic phosphorus (DIP) transport from three coastal rivers—the Calcasieu, Mermentau, and Vermilion Rivers—that drain watersheds with varied agriculture intensities (21%, 67%, and 61%, respectively) into the northern Gulf of Mexico, one of the world’s largest summer hypoxic zones. The study also examined the spatial trends of TP and DIP from freshwater to saltwater along an 88-km estuarine reach with salinity increasing from 0.02 to 29.50. The results showed that from 1990–2009 to 2010–2017, the TP fluxes for one of the agriculture-intensive rivers increased while no significant change was found for the other two rivers. Change in river discharge was the main reason for this TP flux trend. The two more agriculture-intensive river basins showed consistently higher TP and DIP concentrations and fluxes, as well as higher DIP:TP ratios than the river draining less agriculture-intensive land, confirming the strong effect of land uses on phosphorus input and speciation. Longitudinal profiles of DIP along the salinity gradient of the estuarine reach displayed characteristic input behavior. Desorption of DIP from suspended solids and river bed sediments, urban inputs, as well as stronger calcium carbonate and phosphorus co-precipitation at the marine endmember could be the reasons for such mixing dynamics.
1. Introduction
Excess nitrogen and phosphorus loads in rivers from both point sources and diffuse sources have been considered one of the main causes for eutrophication and harmful algal blooms of world’s coastal and lake waters [1,2,3] because these two elements strongly affect biological activity in aquatic environments. Over the past few decades, a conceptual model of nitrogen versus phosphorus limitation for terrestrial ecosystems has emerged based on the difference between nitrogen and phosphorus inputs, especially abiotic phosphorus inputs and nitrogen inputs from the atmosphere. Abiotic phosphorus inputs decline over time because phosphorus weathers out of rocks, whereas nitrogen inputs from the atmosphere do not change much as soil develops. Such declining phosphorus inputs during pedogenesis has been termed by Walker and Syers [4] as a “terminal steady state” of phosphorus deficiency. This depletion-driven phosphorus model has been recently tested in two long-term studies [5,6]. It is interesting to know if pedogenic dynamics of phosphorus is also reflected in river waters that drain watersheds with different dominant land uses. Such information can be useful for predicting long-term riverine phosphorus transport from large drainage areas to their receiving basins.
Results from a previous study [7] on nutrient inputs from four coastal rivers in southwest Louisiana found that two of the four rivers that drained pasture- and forest-dominated lands showed increasing or no clear trend of total phosphorus (TP) over a period of 30 years from 1980 to 2009, while the other two rivers that drained intensive agricultural lands had a declining trend of TP input. A significant reduction occurred in the 1990s and stayed through the 2000s and, therefore, has been attributed to the implementation of agricultural best management practices (BMPs) which began in the early 1990s. There is a growing interest in the research community as well as with policy makers to review if such decadal trends of riverine phosphorus fluxes in these rivers have been maintained in the past decade. Such information will provide insights into long-term BMP effectiveness as well as the pedogenic dynamics of phosphorus, which can help to develop science-based nutrient management plans to protect coastal water quality.
The near-shore coastal waters of Louisiana in the northern Gulf of Mexico (NGOM) have experienced severe oxygen depletion each summer since the mid-1980s [8,9,10]. Nutrient enrichment, including phosphorus enrichment, is considered one of the major causes for the summer hypoxic conditions in the NGOM [11,12]. As the largest river system in North America, the Mississippi-Atchafalaya River System (MARS) has been investigated intensively. Fluxes of nutrients from the MARS to the NGOM have been estimated for the past several decades [13,14,15]. Due to its large discharge volume and power, the MARS has strong off-shore effects on water quality and nutrient availability. In contrast, the coastal rivers of southwest Louisiana entering the NGOM may have strong seasonal effects on near-shore water quality and nutrient availability in the region’s estuaries. While many studies have focused on nutrient input from MARS, little is known about the transport and transformation of phosphorus from the major coastal rivers of southwest Louisiana, which discharge a considerable amount of freshwater and sediment to the NGOM [16].
Phosphorus transport and transformation in an estuary can depend on phosphorus speciation [17]. Total phosphorus can be divided into dissolved and particulate organic phosphorus (DOP and POP) and dissolved and particulate inorganic phosphorus (DIP and PIP) pools. The DIP fraction is composed of phosphate (PO43−), phosphoric acid (HPO42−), orthophosphate (H2PO4−), and triprotic phosphoric acid (H3PO4). The relative abundance of these species will vary with pH in aquatic systems, making H2PO4− and HPO42− the more common species in freshwater and seawater, respectively [17]. An important consideration in phosphorus dynamics is the within-stream transformation between various phosphorus forms. Depending on the initial concentration, the equilibrium phosphorus concentrations of the suspended sediments, the composition of streambed sediments and stream bank material, and the adsorption-desorption interaction between soluble and particulate phosphorus adsorbed on sediments can increase or decrease the soluble phosphorus concentration [18,19,20]. Rivers draining watersheds with differing land uses may have important impacts on phosphorus speciation due to the differences in phosphorus sources.
This study aimed to revisit phosphorus transport in three previously studied estuarine rivers in southwest Louisiana over the recent decade. One river drains a pasture/forest-dominated watershed and two rivers drain intensive agricultural lands. The study included the following specific objectives: (1) determining recent total and dissolved inorganic phosphorus (DIP) fluxes from rivers with different land use types entering one of the world’s largest hypoxic zone; (2) investigating spatial and temporal variations of TP and DIP in an estuarine river; (3) assessing mixing dynamics across salinity gradients for TP and DIP in an estuary with steep salinity gradients.
2. Methods
2.1. Calcasieu, Mermentau, and Vermilion Rivers
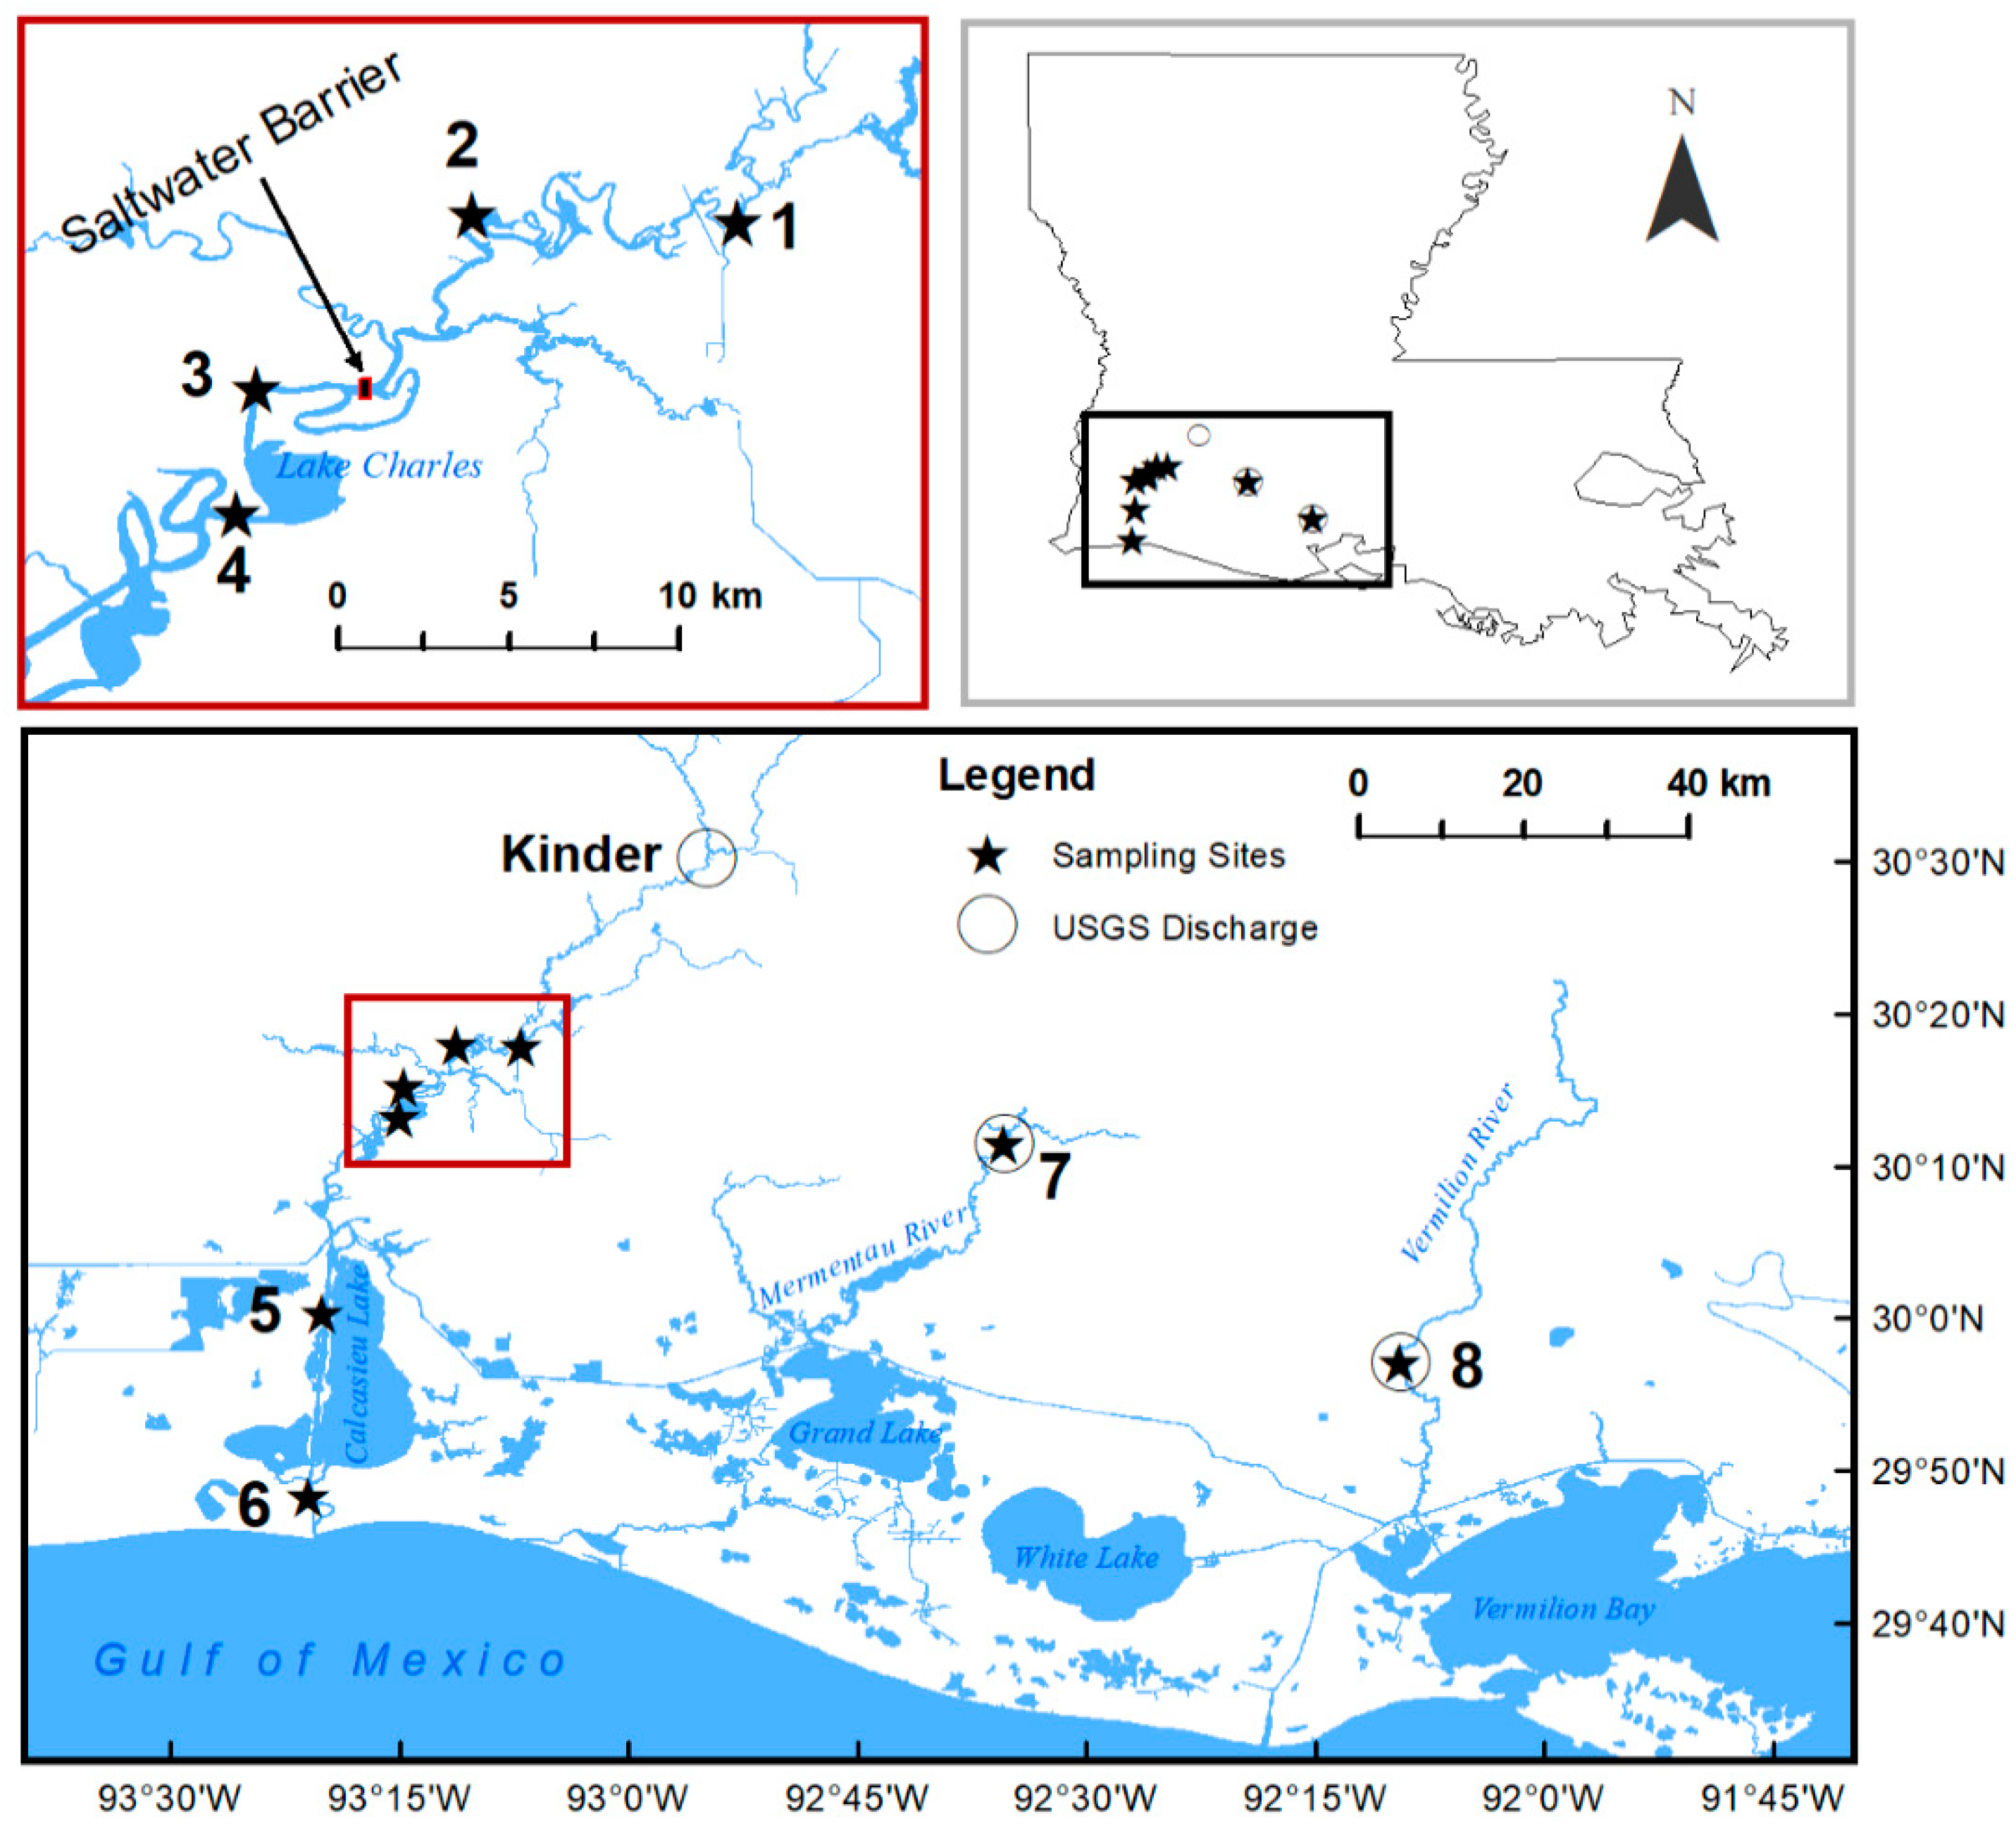
The three coastal rivers investigated in this study are the Calcasieu, Mermentau, and Vermilion Rivers, all of which enter the NGOM in southwest Louisiana, USA (Figure 1). The Calcasieu River flows 322 km through a low-lying Chenier Plain in Southwest Louisiana, USA, before entering the northern Gulf of Mexico. This study has focused on the river’s last 88-km reach (Figure 1) that has a clear salinity gradient and tidal water influence. In the late 1940s, the U.S. Army Corps of Engineers was authorized by the U.S. Congress to construct a deep-draft channel in the Calcasieu River from Lake Charles to the Gulf of Mexico (GOM). The channel deepening allowed saltwater intrusion from the Gulf, threatening the upper Calcasieu River, a source of water for agricultural irrigation. In the 1960s, a saltwater barrier dam was constructed upstream of Lake Charles [21,22], to prevent saltwater from traveling further upstream, as well as to regulate freshwater outflow. The Mermentau and Vermilion Rivers are two shorter rivers. The Mermentau River drains a land area of 16,997 km2 with a length of 115 km [23], and discharges into the Grand Lake before reaching the NGOM. The Vermilion River is 116 km long with a basin area of 4470 km2 [16,24], draining into the Vermilion Bay. Except for some navigational locks, no dams were constructed along the main channels of these two rivers. The Vermilion River is heavily human-modified with canals for agriculture irrigation.
The climate of the study area is subtropical, characterized by long, hot, and humid summers and generally short, mild winters. During the sampling period from April 2014 to February 2016, the average monthly temperature ranged from 9.6 °C in January 2015 to 28.5 °C in August 2014, with a mean of 20.9 °C for the twenty-three-month study period (National Oceanic and Atmospheric Administration (NOAA) station: Calcasieu Pass, LA—Station ID: 8768094). Land use conditions are different among the three river basins. The Mermentau and Vermilion River Basins are dominated much more by agricultural land uses (67% and 61%, respectively) when compared with the Calcasieu River Basin (26%) [16,25,26,27]. The difference in land use dominance may have profound effects on nutrient input from the river basins.
2.2. Field Measurements and Laboratory Analysis
From April 2014 to February 2016, seventeen sampling events were conducted, taking place at eight sampling sites: sites 1 to 6 along an 88-km reach of the Calcasieu River from freshwater to saltwater, site 7 near the mouth the Mermentau River, and site 8 near the mouth of Vermilion River (Figure 1). Among the seventeen sampling events, four of them had both sediment and water samples collected from the Calcasieu River, which were in July 2014, December 2014, March 2015, and August 2015. Note that site 3 was only sampled from August 2014 to February 2016, and sites 7 and 8 were only sampled from April 2014 to July 2015. Sites 1 and 2 were located above the saltwater barrier dam; therefore, water samples collected from the two sites were freshwater. All sampling sites on the Calcasieu below the barrier (i.e., sites 3, 4, 5, and 6) were saltwater-affected to varied degrees, depending on river discharge and tidal mixing at the time of field sampling. During each trip, water temperature, dissolved oxygen (DO) concentration, pH, and salinity were measured using an YSI 556 multi-probe meter (YSI Inc., Yellow Springs, OH, USA). Fluorescence was measured with an AquaFluor® handheld fluorometer (Turner Designs, CA, USA) and was reported as arbitrary fluorescence units (AFUs). Turbidity was measured with a Turbidimeter (Hach, Loveland, CO, USA).
In addition, surface water samples were collected at each site approximately 30–50 cm below the water surface. The samples were collected from piers reaching out about 8–15 m into the river channel with a grab sampler. The sampler consists of a 3.7 m aluminum pole with a polyethylene bottle attached at the end of the pole. High Density Polyethylene (HDPE) bottles (250 mL and 1000 mL) were used to store water samples for TP, DIP and total suspended solids (TSS) analysis. All bottles were thoroughly acid-cleaned and rinsed using river water before use. Duplicate samples were collected at one site per trip for quality control purposes.
Surface sediment samples from the riverbed surface were collected using a sediment sampler (AMS Inc., American Falls, ID, USA) at the six sites on the Calcasieu River. Sediment samples were collected at three locations from the pier at each site and then combined to represent that site. All water and sediment samples were stored in a cooler with wet ice during transportation and refrigerated until chemical analysis.
Water samples were analyzed for TP at the W. A. Callegari Environmental Center, Louisiana State University Agricultural Center. The analyses were done with a LaChat Flow Injection Analyzer, QuikChem 8500, Series II (Hach, Loveland, CO, USA) using EPA Methods 365.3. Concentrations of DIP were measured using a segmented flow auto-analyzer (Flow Solution IV, O.I Analytical, College Station, TX, USA) at the Louisiana State University School of the Coast and Environment Wetland Biogeochemistry Analytical Services after samples were filtered through 0.45 µm syringe filters. Additional water samples were filtered for TSS determination with gravimetric method at the W. A. Callegari Environmental Center, Louisiana State University Agricultural Center. Field and lab blanks were used for quality control to ensure that the samples were not contaminated, and that all sample analyses were within control limits. Duplicate analyses of water samples typically yielded an error less than 6%. The recovery rates of lab control samples for TP were from 84% to 108%. The method detection limits for TP, DIP, and TSS were 0.01, 0.000279, and 4 mg L−1, respectively. In addition to the data collected for this study, dissolved organic carbon (DOC) (data available in He and Xu 2017a and 2017b [28,29]) and total silicon (Si) concentrations in water samples collected during the same study period were processed, and results are included here where applicable.
Sediment samples were digested and analyzed for TP, calcium (Ca), zinc (Zn) and manganese (Mn) using method EPA 200.7. All the analysis was done at the W. A. Callegari Environmental Center, Louisiana State University Agricultural Center using inductively coupled plasma-atomic emission spectroscopy. The detailed sample analysis for total silicon (Si) in water samples as well as TP and cations in sediment samples was the same as the method used in He and Xu [30].
2.3. Riverine Phosphorus Flux Calculation
To estimate TP and DIP mass input from freshwater of the Calcasieu, Mermentau, and Vermilion Rivers into their mixing zones near the NGOM, daily discharge records for the three rivers were collected from the United States Geological Survey (USGS). The gauge stations were chosen based on availability and their proximity to the sampling sites for optimal representation. Specifically, the locations with their USGS gauge station numbers were Calcasieu River near Kinder, LA (USGS 08015500), Mermentau River at Mermentau, LA (USGS 08012150), and Vermilion River at Perry, LA (USGS 07386980).
Fluxes of TP and DIP are the product of the river’s discharge and concentrations of TP and DIP; therefore, there often exists a close relationship between nutrient fluxes and discharge. In this study, we estimated freshwater daily nutrient fluxes of the three rivers using a rating curve that can be described as the following log-linear regression model [15]:
where b0 and b1 are parameter estimates, Q(t) represents the discharge in m3 s−1, and S(t) is the nutrient flux in g s−1. Application of the equation yielded satisfactory results for both TP and DIP (Table 1).
There are different approaches in estimating element loading in rivers. These approaches are all associated with some uncertainties. Since the main goal of this study is to compare P fluxes among the three watersheds, estimation errors using the rating curve method in the present paper should be systematic, allowing the comparison of the loading estimates for the rivers valid.
In the previous report on TP fluxes of the Calcasieu River for 1990–2009, He and Xu [7] used water quality measurements conducted at Kinder, about 40 km upstream from site 1 in this study, by the Louisiana Department of Environmental Quality (LDEQ). To compare the change in TP flux for this river in the past decade, we compiled water quality data from 2010 to 2017 from LDEQ. Only for this comparison, Kinder was used to represent the Calcasieu River, and TP concentration data from LDEQ were used. For all other comparisons, site 1 was used to represent the Calcasieu River, and all TP and DIP concentrations were from this study, as described below.
Since DIP concentration is not available from LDEQ, to calculate the contribution of DIP flux to TP flux, TP and DIP concentrations from this study were used to calculate TP and DIP fluxes during the study period. Here, concentrations of TP and DIP at site 1 were used to calculate daily TP and DIP fluxes from the Calcasieu River freshwater. Because site 1 and the USGS discharge gage station at Kinder were about 40 km apart, we used an area weighting to estimate the runoff from the land between the two locations. Detailed calculations are available in He and Xu [29]. All discharge for the Calcasieu River presented in this study were the calculated discharge at site 1. Phosphorus concentrations and river discharges at sites 7 and 8 were used to calculate daily TP and DIP fluxes from the Mermentau and Vermilion Rivers. Because the fluxes calculated in the study will be considered as freshwater phosphorus loading to the studied estuaries, all negative discharges were excluded in flux calculations. A comparison between measured phosphorus fluxes and estimated phosphorus fluxes are shown in Appendix A Figure A1 and Figure A2. Statistical performance of the rating curves (Table 1) for estimating phosphorus daily fluxes of the Calcasieu (Site 1), Mermentau, and Vermilion Rivers are shown in Appendix A Figure A3 and Figure A4. Nutrient yield for the three rivers (mass per unit area per unit time) were calculated by dividing the nutrient flux by the basin drainage areas at the gauge stations. This normalized nutrient flux so that comparison between river basins could be made. Note that all fluxes and yields calculated in this study only represent phosphorus inputs from freshwater of the Calcasieu, Mermentau, and Vermilion Rivers into their mixing zones. The amount of TP and DIP that will eventually reach the NGOM may differ due to the mixing effects of the estuaries and the impacts of lakes and wetlands.
2.4. Mixing Analysis
Mixing analysis was performed for TP and DIP in the Calcasieu River. Concentrations of TP and DIP expected by the conservative-mixing model were calculated using the following formula [31,32]:
where C denotes concentration, the subscripts r and m indicate river and marine endmembers, respectively, and represents the fraction of freshwater in each sample calculated from salinity assuming salinity is mainly controlled by conservative mixing [31,32]:
where S is the salinity at the sampling point and the subscripts are the same as Equation (2). and are salinity at the marine and river endmembers. Site 1 in this study generally has a salinity around 0.03 (Table 2), which can be considered as freshwater. Therefore, site 1 is considered as the river endmember. As the closest site to the GOM, site 6 had the highest salinity among all sites. To simplify the situation, site 6 was used as the marine endmember.
2.5. Statistical Analysis
A two-way analysis of variance (ANOVA) comparing water sample values was performed separately for TP concentration, DIP concentration, DIP:TP, DOC:TP, DOC:DIP, Si:TP, Si:DIP, as well as environmental parameters, including salinity, pH, water temperature, DO concentration, TSS, Fluorescence, and Turbidity based on the sampling sites. Tukey-Kramer’s adjustment was used to group sampling sites when ANOVA shows significant differences among sites. For the Calcasieu River, Pearson Correlation Coefficients were calculated to analyze the relationships among TP, DIP, and environmental parameters, including salinity, pH, water temperature, DO concentration, TSS, Fluorescence, Turbidity, river discharge, and river gage height, as this coefficient measures the strength of a linear relationship between two parameters [33]. While being a useful and straightforward way to investigate potential factors affecting nutrient concentrations, the Pearson Correlation Coefficient only considers one factor at a time, which can lead to large p values due to a large number of factors. To explore potential factors affecting nutrient concentrations, backward stepwise linear regressions were also performed between TP, DIP, and environmental parameters that had significant correlations with TP and DIP. Correlation analysis between TP concentration and concentrations of calcium (Ca), zinc (Zn) and manganese (Mn) were also performed in sediment samples collected in the Calcasieu River. All statistical analyses were performed with the SAS Statistical Software package (SAS Institute Inc., Cary, NC, USA).
3. Results
3.1. Hydrology and Ambient Conditions
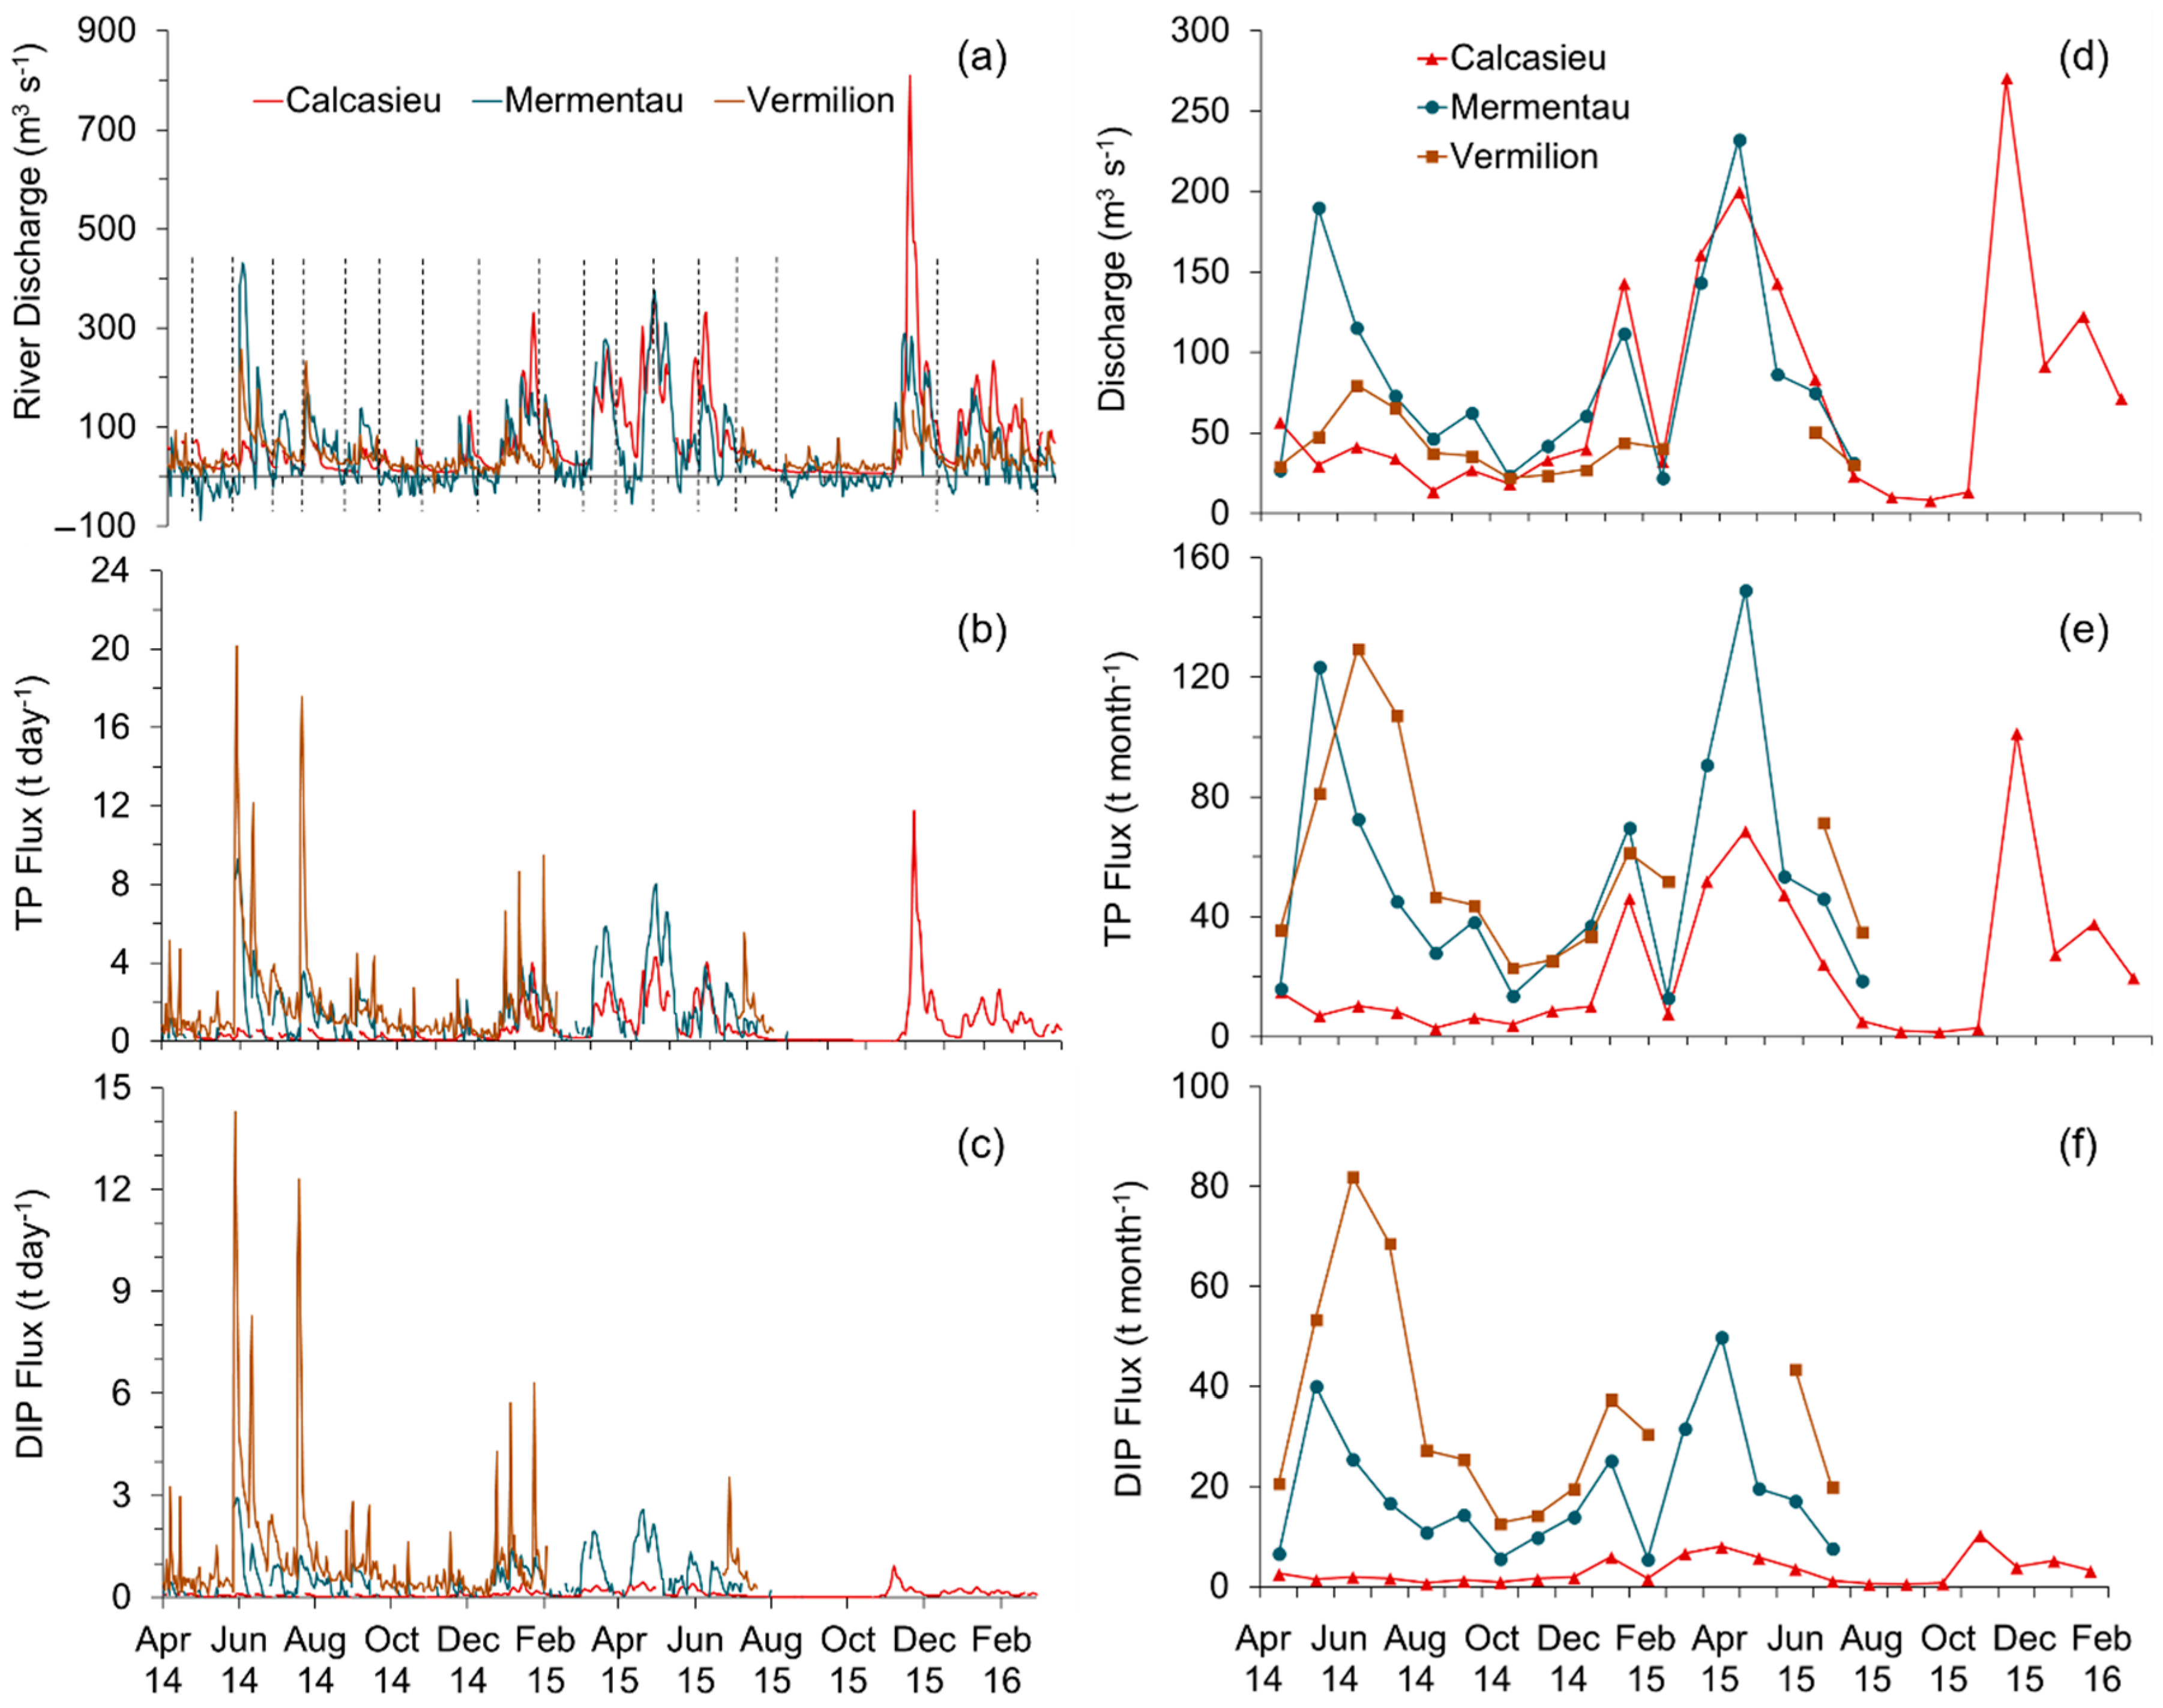
From April 2014 to February 2016, the Calcasieu River showed an average daily discharge of 73 m3 s−1 (std: ±91), ranging from 6 to 809 m3 s−1 (Figure 2), with November 2015 having the highest average discharge (271 m3 s−1) and September 2015 the lowest (8 m3 s−1). The large seasonal variation of discharge during the sampling period had clear impacts on salinity and pH along the estuarine river. For instance, the salinity and pH during the April 2015 sampling event were the lowest for most sites due to the high discharge when compared with other sampling trips a and Figure 3a). The Mermentau and Vermilion Rivers showed a similar seasonal trend in river discharge (Figure 2a) but with a much lower average daily discharge than the Calcasieu river, at 53 (±83) m3 s−1 and 40 (±33) m3 s−1, respectively.
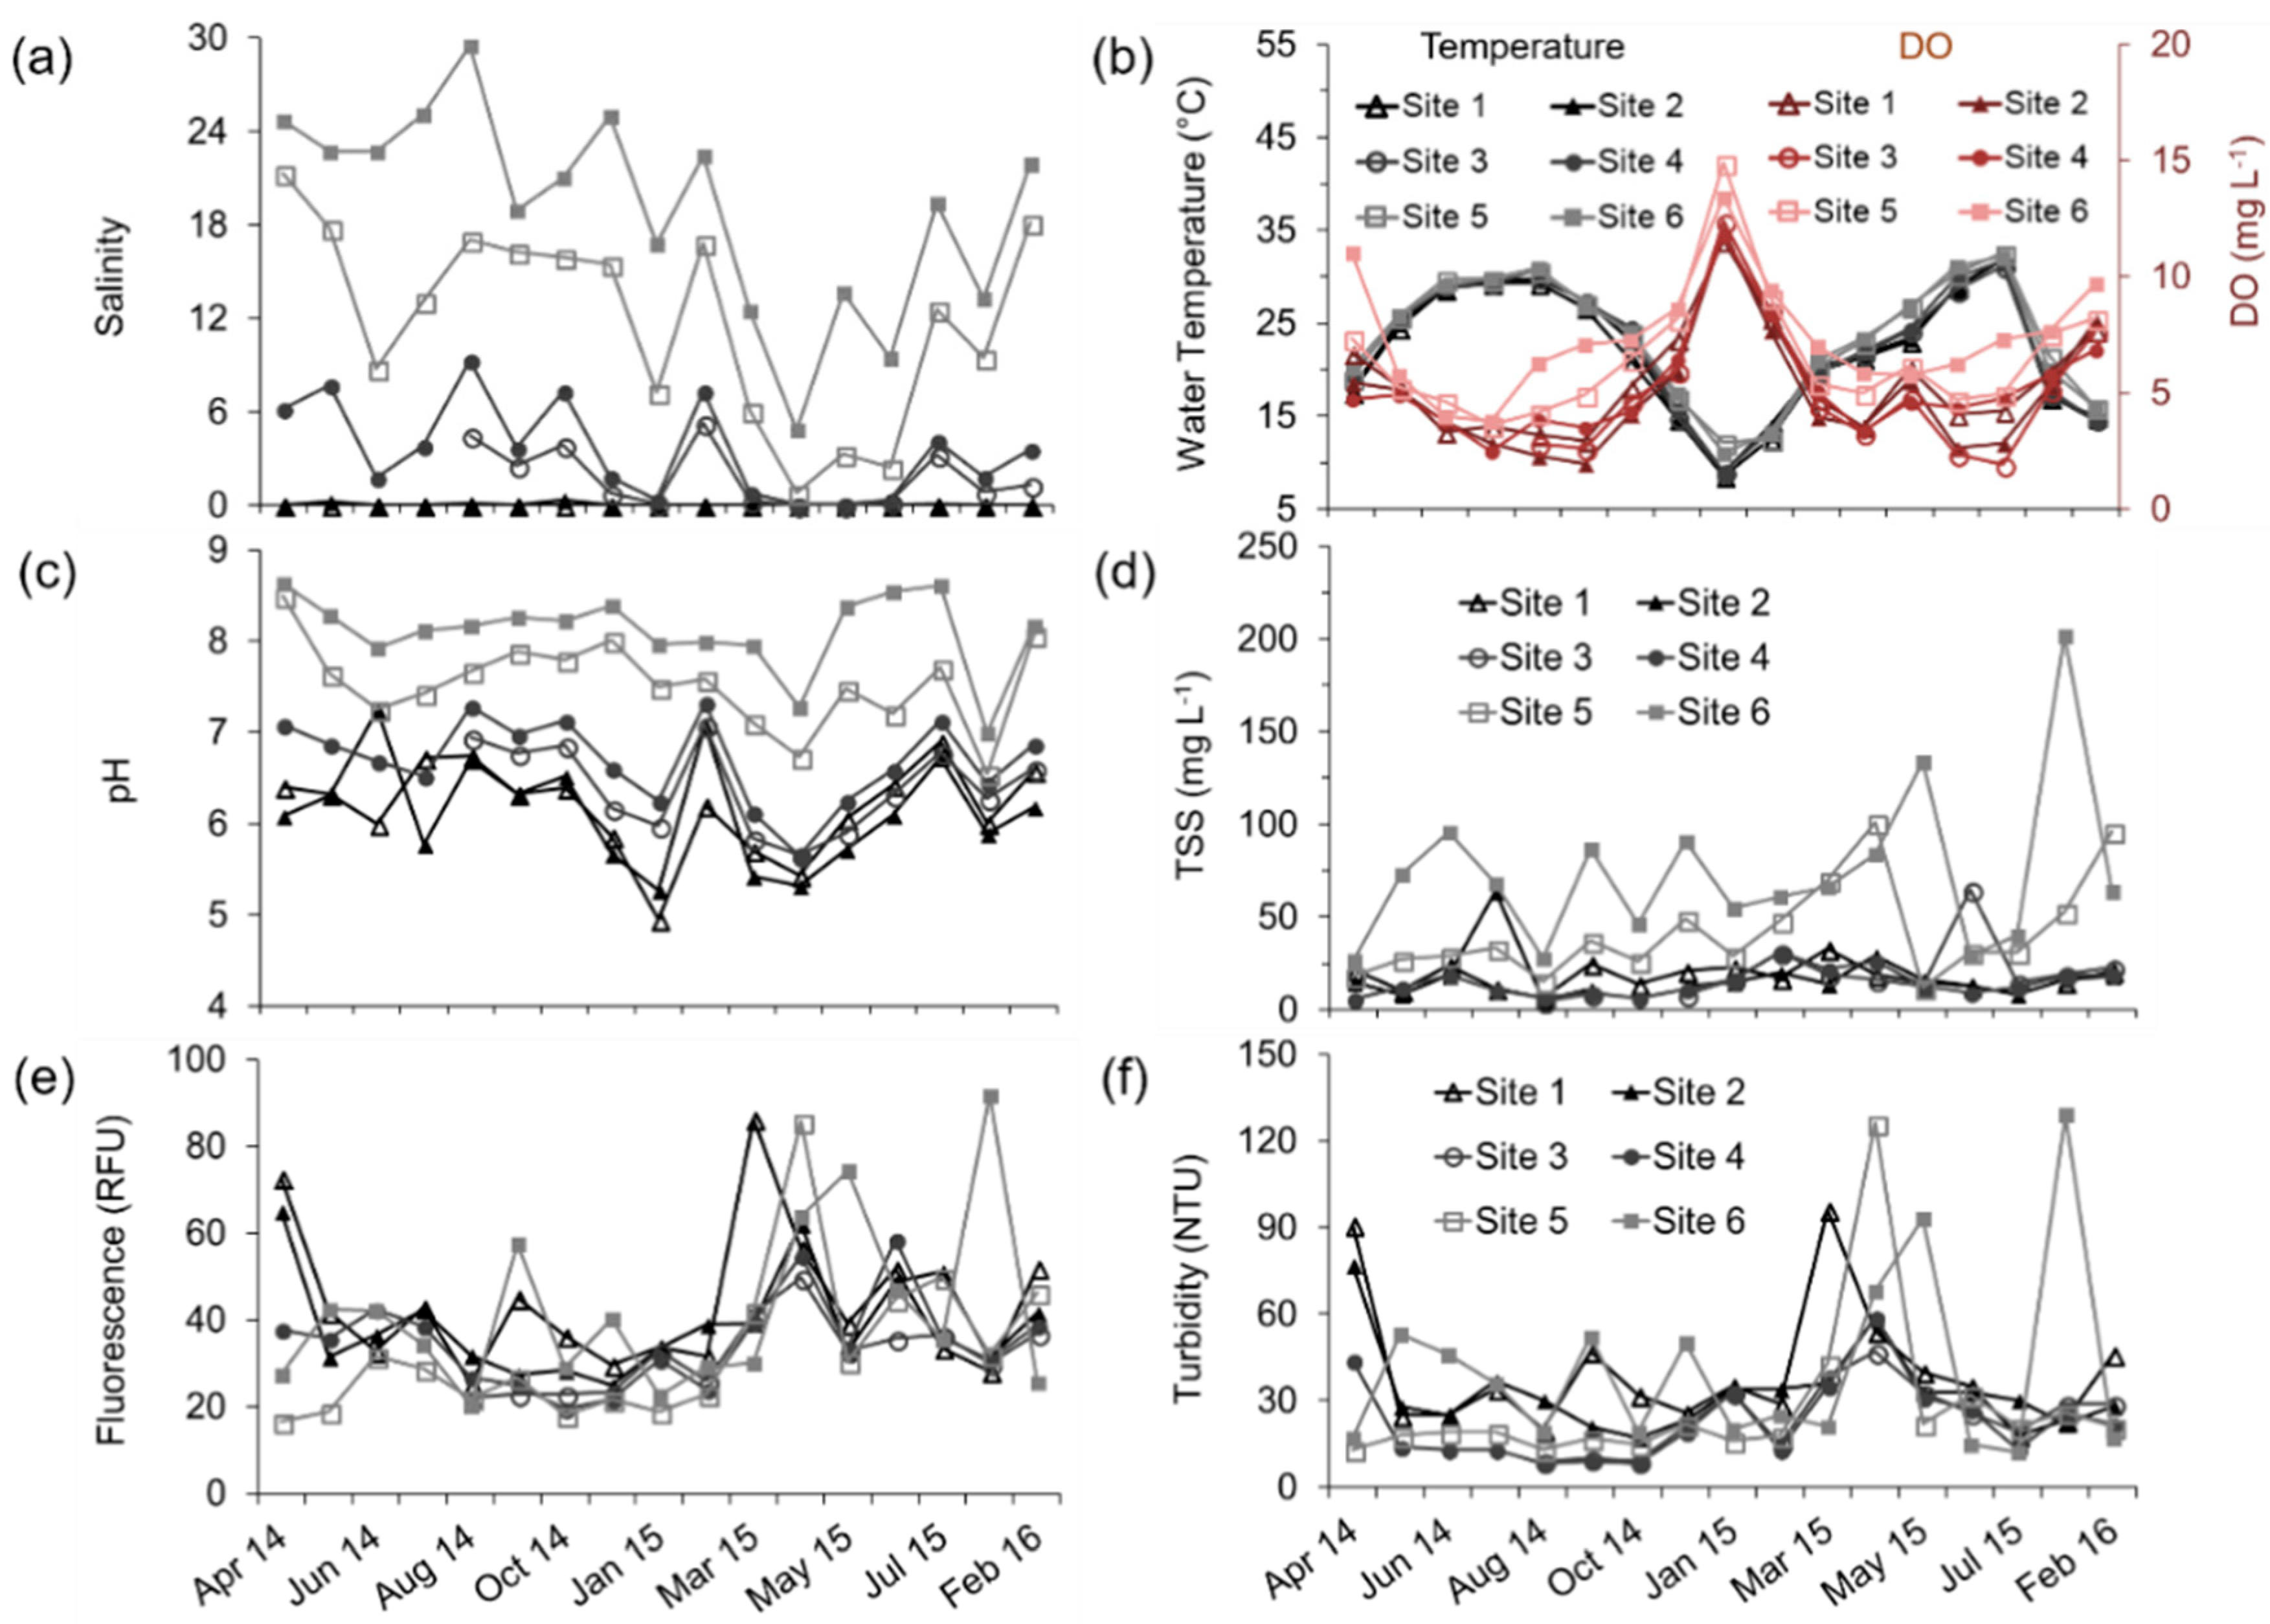
The ambient conditions at the six sampling sites along the Calcasieu River varied largely (Table 2 and Figure 3). Salinity levels at site 6, the closest location to the Gulf of Mexico, ranged from 4.80 to 29.50, with an average of 19.05, which was more than 700 times higher than that of site 1, the most upstream location. The salinity levels increased with decreasing distance from the GOM (Table 2 and Figure 3a) and, as expected, pH was positively correlated to salinity (Table 3). However, pH at sites 1 and 2 had a larger variation than salinity did (Figure 3). The average dissolved oxygen and total suspended solids concentrations at sites 5 and 6 were much higher than those of the other sites (Table 2 and Figure 3). Being nearest to the GOM, sites 5 and 6 were strongly impacted by saltwater. The stronger tidal movement at these two sites may have aerated the water, as reflected by the higher DO levels at the sites. Due to the negative relationship between temperature and DO (Table 3), the DO concentrations were higher during winter and spring months and lower during summer and fall months (Figure 3). When compared with the Calcasieu River, the Mermentau and Vermilion Rivers clearly had lower DO concentrations, but higher fluorescence and turbidity (Table 2).
3.2. Freshwater Phosphorus Concentrations, Fluxes and Yields
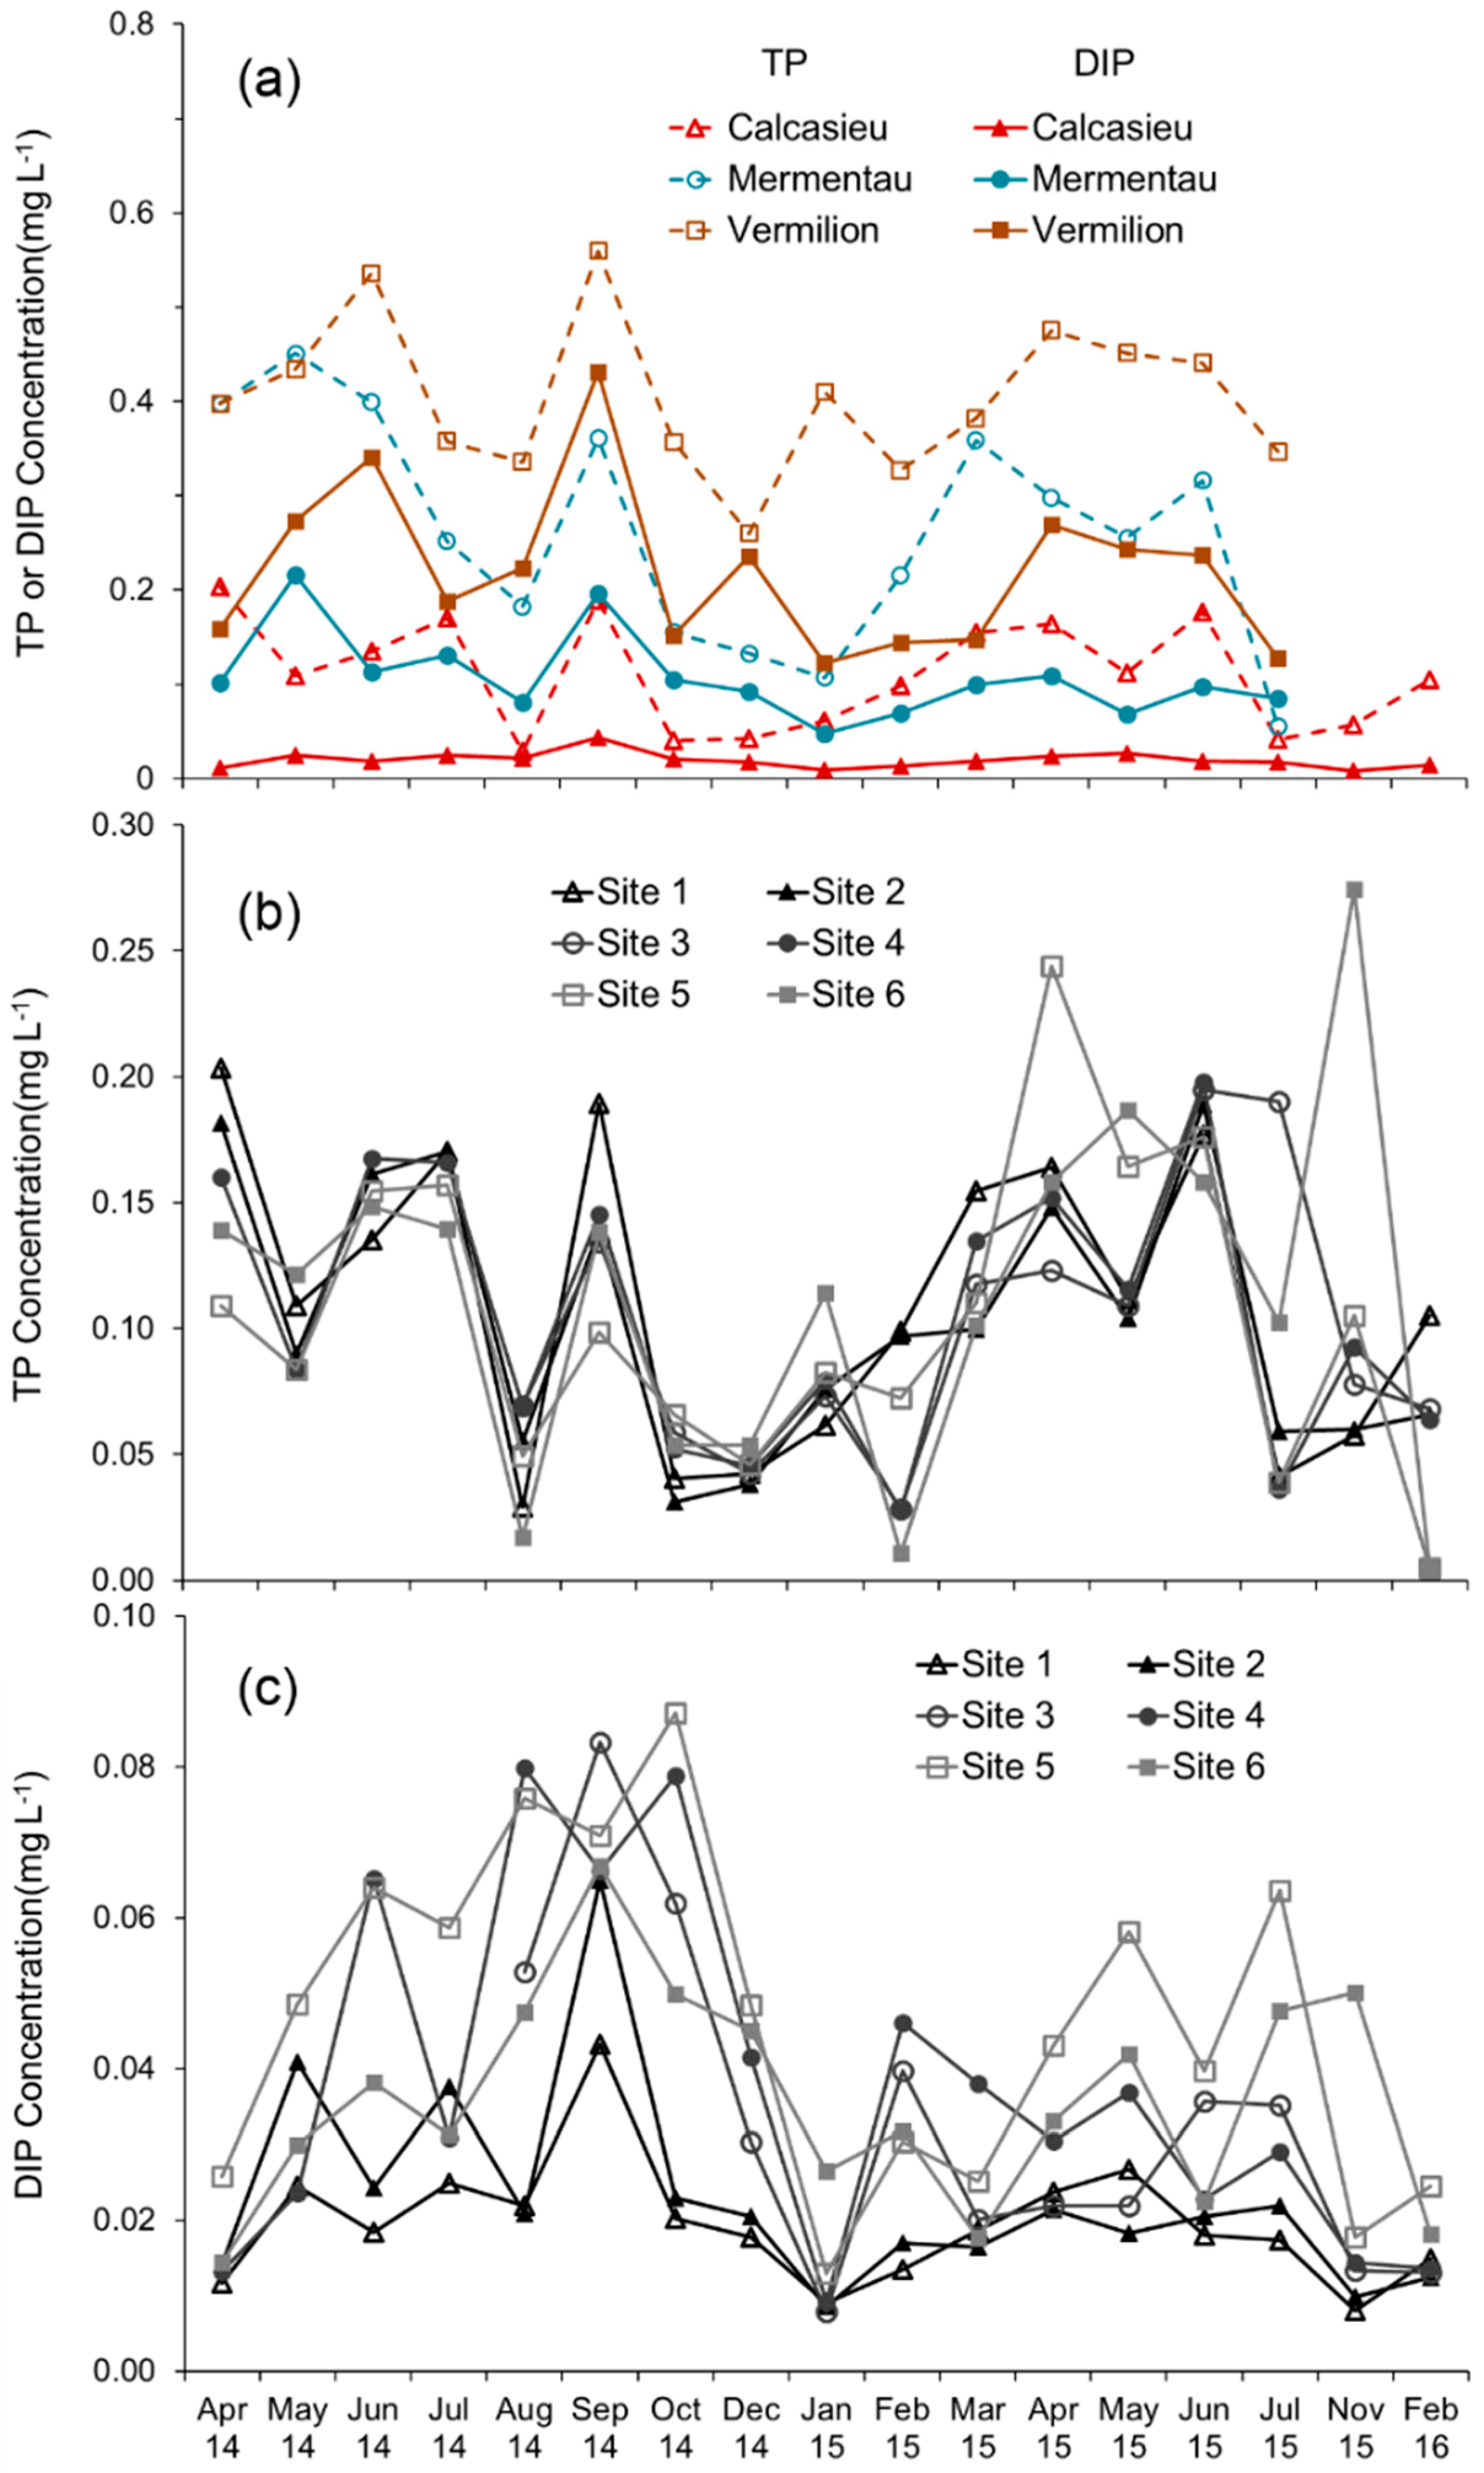
Both total phosphorus and dissolved inorganic phosphorus concentrations showed the same trend among the three rivers: Vermilion > Mermentau > Calcasieu (Table 4 and Figure 4). The average total phosphorus concentrations at Calcasieu (site 1), Mermentau, and Vermilion were 0.11, 0.26, and 0.40 mg L−1, and the average dissolved inorganic phosphorus concentrations were 0.020, 0.11, and 0.22 mg L−1, respectively. DIP concentration accounted for 24% (site 1) to 34% (site 6) of the TP concentration in the Calcasieu River, but made a much higher proportion in the Mermentau River (42%) and Vermilion River (54%). Molar ratios of DOC:TP, DOC:DIP, Fe:TP, and Fe:DIP in the three rivers showed opposite trends: Calcasieu > Mermentau > Vermilion (Table 4 and Figure 4).
For this study period, the Calcasieu River discharged 273 t of TP each year from its freshwater into coastal waters, of which 38 tonnes (t) were DIP. When normalized to the drainage basin area, the fluxes represent an annual TP yield of 46 kg km−2 year−1, and an annual DIP yield of 6 kg km−2 year−1. The Mermentau and Vermilion Rivers discharged distinctively more TP and DIP into their estuaries than the Calcasieu River did. For the Mermentau River, the average annual fluxes of TP and DIP were 663 t year−1 and 185 t year−1, respectively. The Vermilion River had similar TP flux (693 t year−1) to the Mermentau River, but more DIP flux (550 t year−1). When normalized to the drainage basin area, the differences in phosphorus yield between the Calcasieu River and the two agricultural intensive rivers (the Mermentau and Vermilion Rivers) were even more apparent. The TP and DIP yields of the Mermentau River were 238 and 67 kg km−2 year−1, while the TP and DIP yields of the Vermilion River were 425 and 337 kg km−2 year−1, respectively.
Seasonally, freshwater of the Calcasieu River showed the highest mean monthly fluxes of TP and DIP in November 2015, and the lowest in September 2015, corresponding to the river discharge regime (Figure 2). In November 2015, the Calcasieu River discharged 101 t TP and 7 t DIP into its estuary, contributing 20% and 15% of their average total annual exports, respectively. The Mermentau and Vermilion Rivers had a similar seasonal trend in TP and DIP fluxes. However, due to the data availability, the highest monthly phosphorus fluxes in the Mermentau and Vermilion Rivers were in April 2015 and June 2014, respectively (Figure 2).
3.3. Comparison between TP Loading during 1990–2009 and 2010–2017
When compared with the total phosphorus exports for 1990–2009 from the Calcasieu and Mermentau Rivers (0.51 t day−1 and 1.87 t day−1; He and Xu 2015), the recent average daily TP fluxes of these two rivers were only slightly lower (i.e., 0.48 t day−1 and 1.78 t day−1, respectively) (Table 5). For the Calcasieu River, the insignificant change in TP flux could be affected by both a significant decrease in river discharge and a significant increase in TP concentration in the past eight years. The insignificant change in TP flux from the Mermentau River reflected the insignificant change in both river discharge and TP concentration. The Vermilion River had statistically significant increase in river discharge from 1990–2009 period to 2010–2017 period, while the increase in TP concentration was not statistically significant (Table 5), resulting in a moderate but statistically significant increase in daily TP fluxes.
3.4. Phosphorus Concentration Change in a Mixing Zone
From the freshwater site to the saltwater sites along the 88-km Calcasieu River reach, no clear longitudinal trend in total phosphorus was found. The average TP concentration for the six sites ranged from 0.10 to 0.11 mg L−1 (Table 4 and Figure 4). Generally, the two upstream fresh water sites (sites 1 and 2) had lower dissolved inorganic phosphorus concentrations than the four downstream sites, with site 5 having the highest DIP concentrations for more than half of the sampling trips (Table 4 and Figure 4). There was a large temporal variation in TP and DIP concentrations at all six sites in the Calcasieu River. Both TP and DIP concentrations were in general lower in winter months, and higher in summer and fall months (Figure 4). This trend was confirmed by the positive relationship between temperature and concentrations of TP and DIP (Table 3).
4. Discussion
4.1. Flow and Rainfall Effects on Phosphorus Fluxes
This study found that the Vermilion River, draining agriculture intensive land, had an increased total phosphorus export from the 1990–2009 period to the 2010–2017 period. However, the increase should not be attributed to land use effects because the river discharge increased during the past eight years while the TP concentration in the river was relatively unchanged (Table 5). The Vermilion River receives partial flow from the Atchafalaya River through river diversion [16] and it is not clear whether the discharge increase was caused by an increased diversion from the Atchafalaya River or an increased rainfall within the drainage area. In any case, the findings indicate the important role of river discharge in TP export.
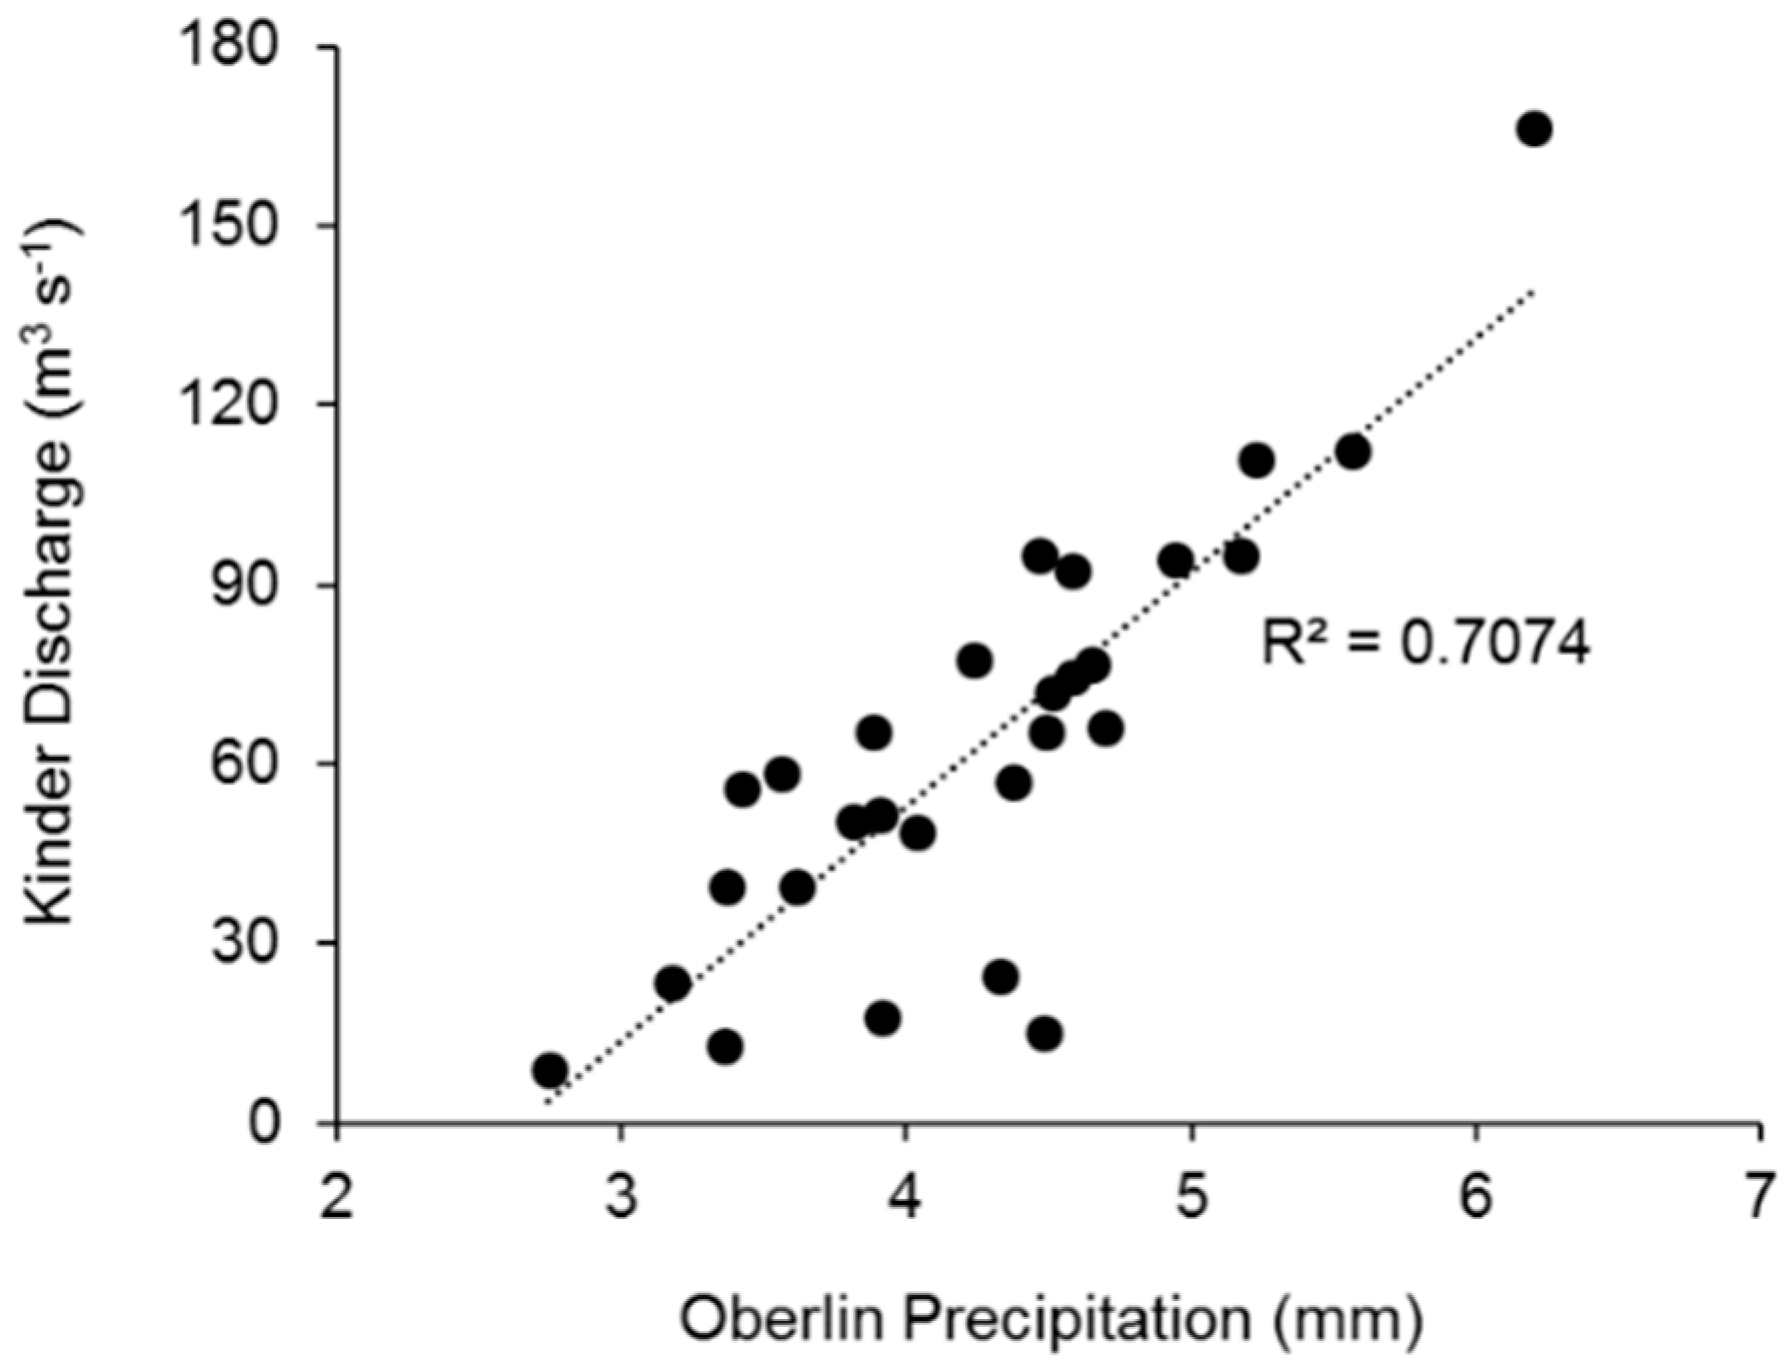
From 1990–2009 period to 2010–2017 period, the variation of river discharge in the Calcasieu River was mainly caused by precipitation change. For instance, daily precipitation from a NOAA weather station (station number: USC00166938 Oberlin fire tower, LA, USA) which is about 16 km upstream of Kinder can explain 71% variance of the river discharge at Kinder during 1990–2017 (Appendix A Figure A5). Other studies have shown that climate condition such as precipitation has a critical impact on riverine phosphorus export. Chen et al. [34] showed that in the six catchments of the Yongan River watershed in eastern China will have an 8–18% increase from 2000–2010 in riverine TP flux by 2030 due to a 4% increase in precipitation with no changes in anthropogenic phosphorus inputs and land use condition. As future climate change drives an increase in hydrologic variability, the predictability of the response of nutrient flux such as TP flux to discharge may be important in understanding ecosystem responses to climatic change.
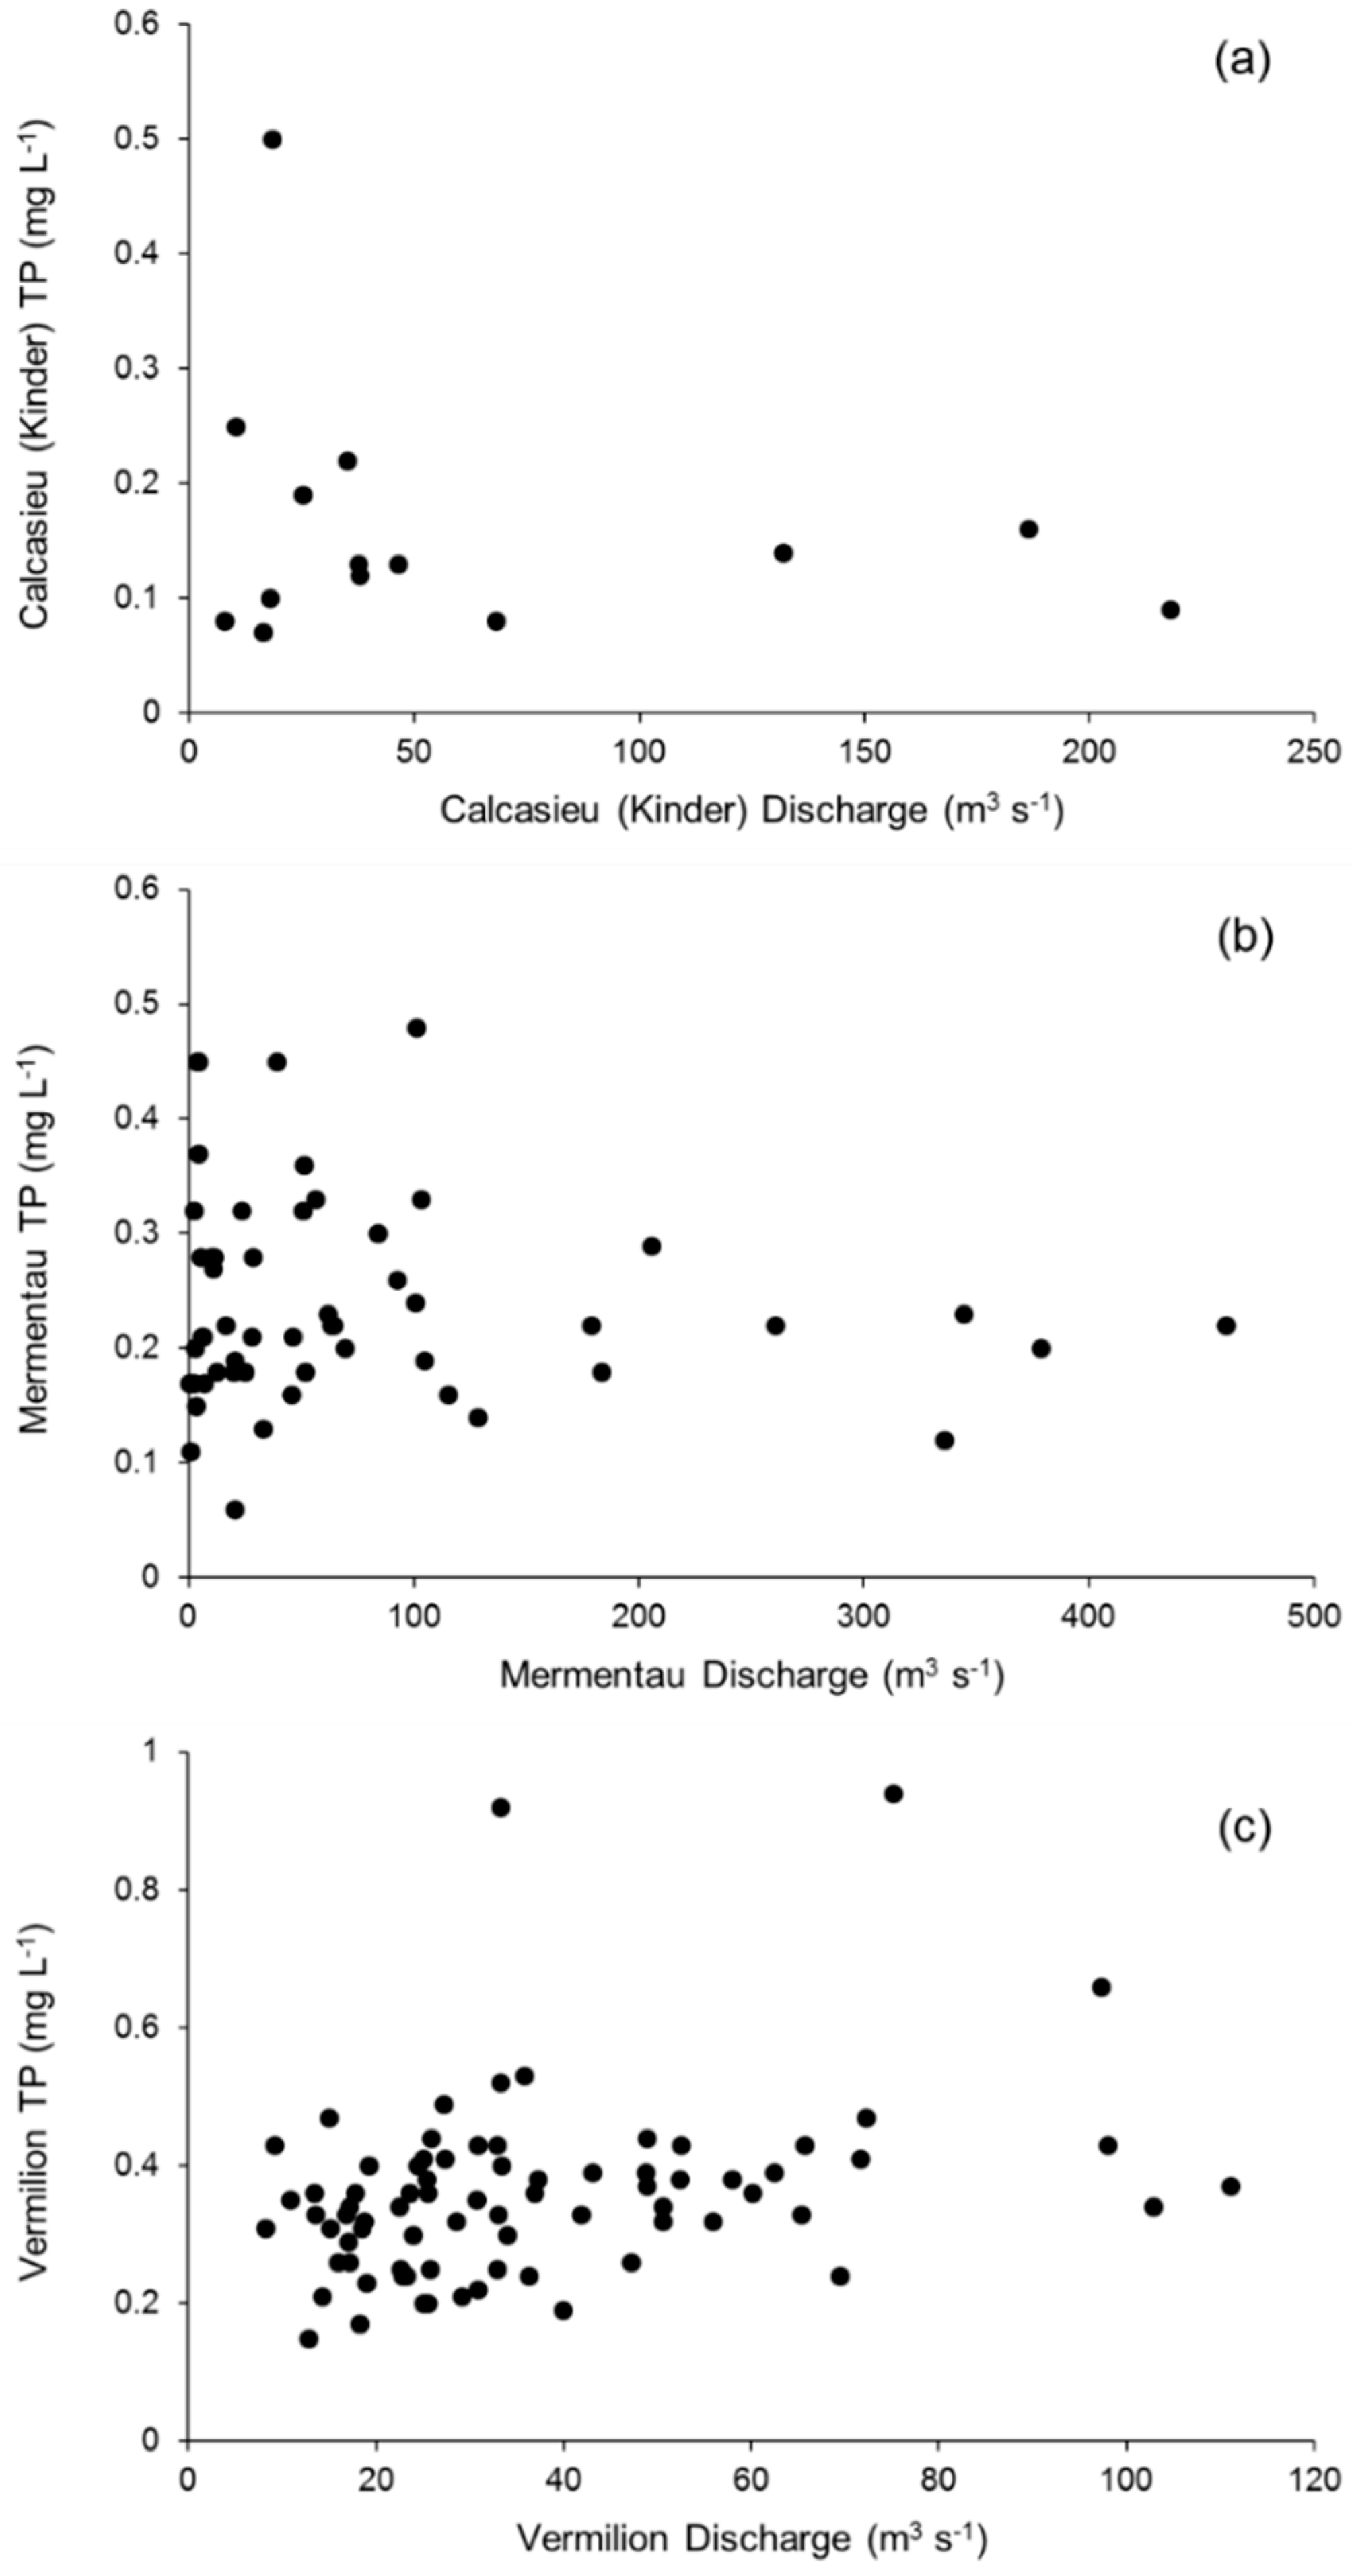
River discharge impacts TP flux not only because TP flux is the product of the river’s discharge and TP concentration in river water, but also because discharge influences TP concentration. In the Calcasieu and Mermentau Rivers, low discharges were not always accompanied by high TP concentrations, but high TP concentrations were usually accompanied by low discharges, suggesting the dilution effect of river discharge. For example, in the Calcasieu River, all samples with TP concentrations >0.18 mg L−1 were collected when discharges were below 50 m3 s−1 (Appendix A Figure A6). In the Mermentau River, all samples with TP concentrations >0.30 mg L−1 were collected when discharges were below 105 m3 s−1. The Vermilion River did not exhibit such trend, and we believe this is caused by the high nutrient availability in the Vermilion drainage basin due to the agricultural intensive land use conditions. In this river, discharge could have a dilution effect as well as have the ability to bring in more nutrients into the river surface water due to soil erosion.
River discharge could also affect phosphorus flux by changing the water depth of the river, potentially causing vertical profile differences in phosphorus concentration. Therefore, even though surface water sampling is a very common practice, profiled water sampling might be a more appropriate way to determine phosphorus flux. However, since we only collected surface water samples, discussion on this subject is beyond the scope of this study.
4.2. Land Use Effects on Phosphorus Fluxes
The TP and DIP fluxes and yields from the Mermentau and Vermilion Rivers were clearly higher than those from the Calcasieu River, further confirming the strong effect of land uses on phosphorus input to estuaries in coastal river basins. Phosphorus in surface waters arises from various sources, including drainage from agricultural soils, domestic, farm, and industrial effluents, groundwater discharge, and atmospheric deposition [19,35,36]. Numerous studies have demonstrated the strong effect of agricultural practices in coastal river basins on the quantity and quality of nutrient input to estuaries [7,37]. The concentration of phosphorus in drainage water from agricultural land is a complex function of soil characteristics, land use, and management practices [19,38]. Due to the non-existence of gaseous phase and phosphorus adsorption on oxides and clay mineral, phosphorus is less mobile in the soil-plant-atmosphere system than nitrogen [37]. One consequence of this lower phosphorus mobility throughout the soil profile is that when phosphorus fertilizers are applied, they tend to increase soil phosphorus concentration on the surface, which makes phosphorus more available by loss through soil erosion and surface runoff [37,39]. The high availability of phosphorus by loss explains the strong impact of agriculture on river water TP and DIP concentrations and fluxes.
Land uses not only change the quantity of phosphorus loadings to estuarine rivers, but also change the forms and availability of phosphorus. The higher DIP contribution in rivers draining agricultural-intensive watersheds may be due to the soluble phosphorus fertilizer used in these river basins. The Mermentau and Vermilion Rivers also had lower DOC:TP, DOC:DIP, Si:TP, and Si:DIP ratios than the Calcasieu River. The differences in those ratios can influence primary production and the composition of plankton communities in these rivers, individually or in combination, as such influence was found by other researchers [40,41].
4.3. Phosphorus in Fresh-Saltwater Mixing
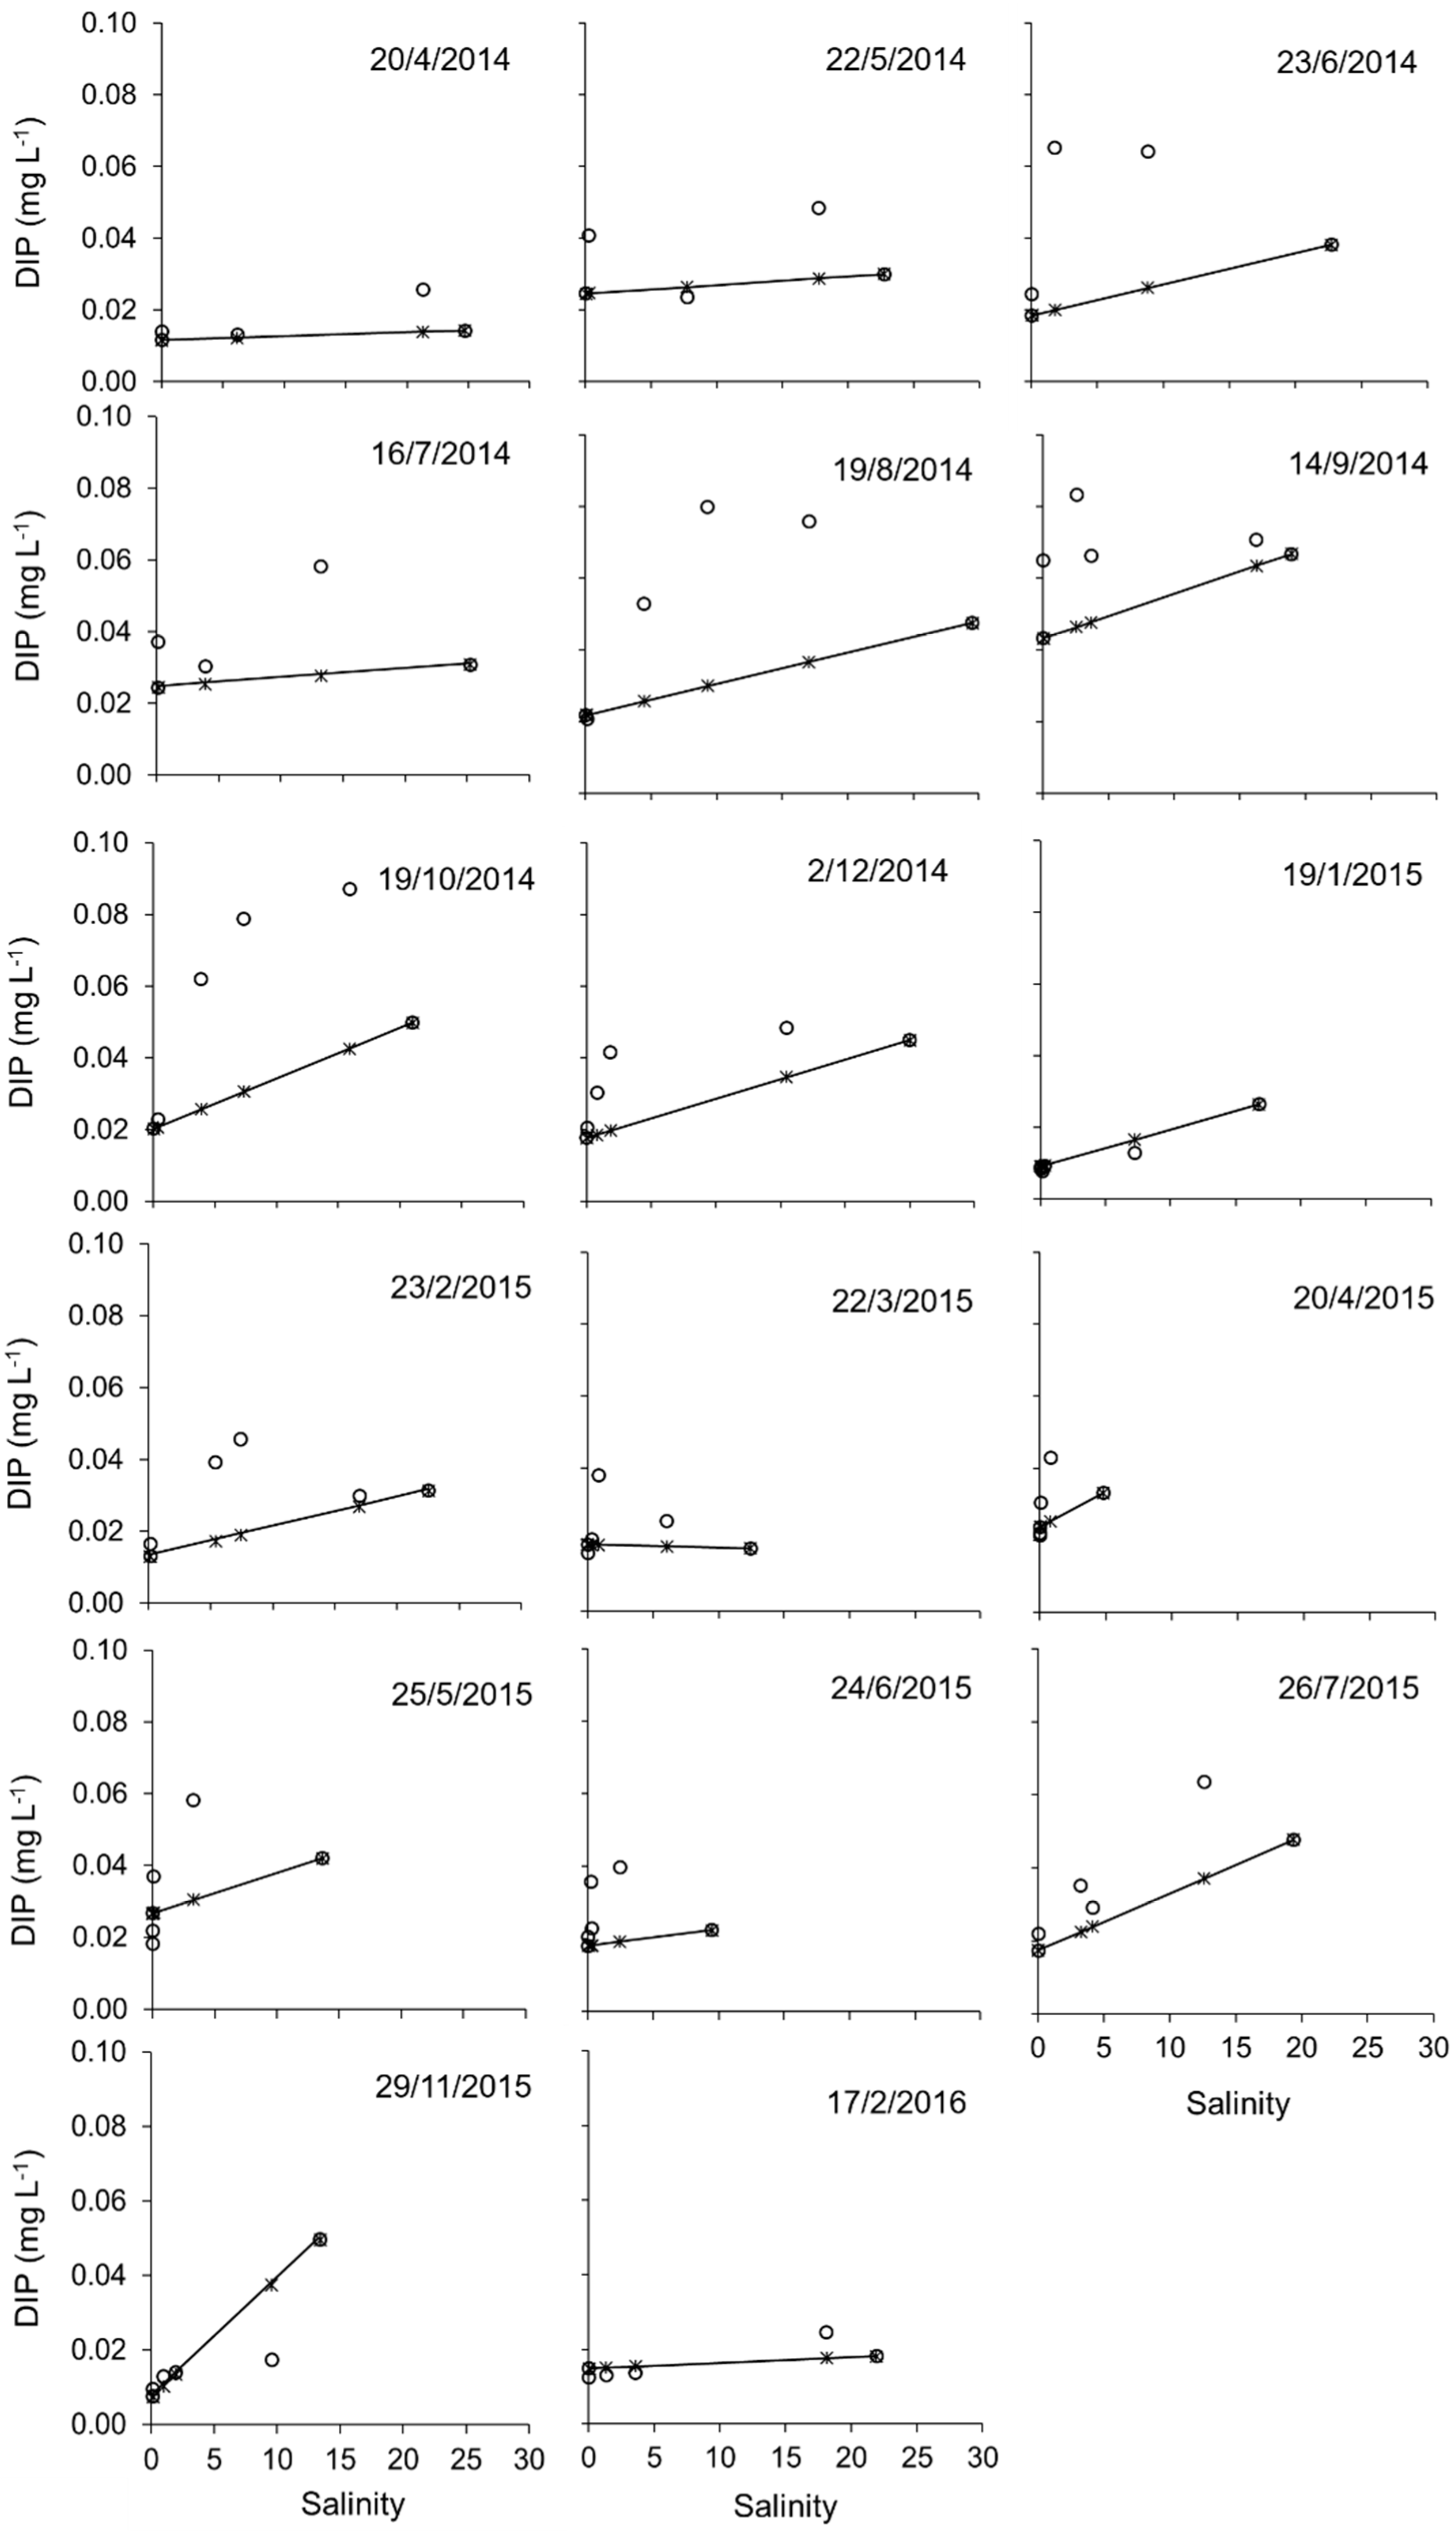
In this study, we found no clear mixing dynamics of total phosphorus (Figure 5). The average TP concentrations at the six sites from upstream to downstream were fairly consistent. The mixing dynamics of DIP concentration versus salinity plots suggest a source was present throughout the Calcasieu Estuary since measured DIP concentration was usually higher than those predicted by conservative mixing (Figure 6), and this source is not related to seasonal change. The ultimate source of biologically available DIP is the weathering of continental rocks. However, only about 5% to 10% of the phosphorus eroded from continental rocks is thought to be carried to the oceans in dissolved form, and the rest is presumably carried as inert phosphorus in fluvial detrital grains [42,43]. Therefore, the forms of phosphorus have important impact on phosphorus transport and transformation dynamics in a river system.
The interaction between water and sediment has important impacts on phosphorus concentration in water. In solution, DIP reacts quickly with a wide variety of surfaces, being taken up by and released from particles through a complex series of sorption reactions [42,44]. For instance, desorption of DIP from aluminum and iron oxides is an important source for DIP in estuarine waters, while adsorption of DIP on sediments is an important sink for some estuaries. Hobbie et al. [45] reported that 60% of the DIP entering the Pamlico River estuary (USA) was scavenged by particulates and stored in sediments, while Evans et al. [46] showed that sediment plays an important role in supplying phosphorus to the river channel. In both freshwater and estuarine systems, concentrations of DIP have been strongly linked with the suspended sediment load. In fact, a stable or “equilibrium” concentration range of DIP, between 0.5 µM (0.015 mg L−1) and 2 µM (0.062 mg L−1), has been reported for several estuarine systems [42,47], including the Calcasieu Estuary in this study. These stable DIP concentrations are believed to be controlled by a “buffering” of DIP through the adsorption and desorption onto metal oxide surfaces [48,49].
The release of phosphorus from estuarine sediment is a common and important process that varies spatially and temporally [17]. Metal oxyhydroxide adsorption of phosphorus in sediment is an important control upon phosphorus mobility, while the re-suspension of phosphorus-rich particles from the river bed, combined with high pH and low oxygen concentrations, can cause desorption of particulate phosphorus into the water column via hydroxyl group exchange mechanisms [50]. Concentration of DIP in bottom water in the Baltic Sea was correlated with an area of the bottom covered by hypoxic water, and also shown to be negatively correlated with oxygen concentration, indicating the release of DIP from sediments [51]. Increases in pH can enhance the release of adsorbed P that is hydrated to Fe and Al oxides, through ligand exchange mechanisms involving competition between OH− and PO43− [17,48]. In the Calcasieu River, desorption from suspended solids and sediments may be one of the sources of DIP in the estuary. The negative relationship between DO and DIP as well as the positive relationship between pH and DIP (Table 3 and Table 6) can partially explain this. Further, correlation analysis showed significant relationships between TP and total Mn (Table 1; n = 25, R2 = 0.50, p < 0.01), and total zinc (n = 25, R2 = 0.92; p < 0.01) in sediment samples (data available at Appendix A Table A1) collected from the Calcasieu River. With that, however, release of P from estuarine sediment may not the only source of DIP in the Calcasieu River.
There may be other anthropogenic DIP point sources around the study area that could contribute to the riverine DIP level, especially the lower Calcasieu as a heavy industry area, such as wastewater treatment plants, paper plants, and chemical refineries. Unfortunately, in this study, we did not design to trace the different sources of riverine phosphorus, which has limited us to quantify point source of P from the study watershed. Therefore, discussing potential point sources of Pinputs to the Calcasieu Estuary is beyond our data as well as the scope of this study. On the other hand, it is reasonable to consider this as many studies have shown that anthropogenic DIP sources could be important factors controlling the phosphorus dynamics in an estuary [20,52]. If this is the case for the Calcasieu Estuary, then the dynamics of phosphorus might have been modified due to anthropogenic phosphorus input. Further studies are needed to accurately distinguish the riverine DIP from anthropogenic sources.
Calcium carbonate and phosphorus co-precipitation, as reported in other river systems [46,50], could be another mechanism controlling the phosphorus dynamics in the Calcasieu River. Concentrations of TP and calcium in sediment samples collected from the Calcasieu River were statistically correlated (sample size n = 23, R2 = 0.68, p < 0.01). Furthermore, sites 5 and 6 had higher correlations (n = 8, R2 = 0.89, p < 0.01) than sites 1 to 4 did (n = 15, R2 = 0.73, p < 0.01), suggesting that calcium carbonate and phosphorus co-precipitation was a more significant mechanism that could decrease phosphorus concentration at sites 5 and 6 when compared with the four upstream sites. Therefore, the observed mixing dynamics for DIP could be caused by using site 6 as the marine endmember.
As discussed above, riverine transport of phosphorus is controlled by a number of physical, chemical, and biotic mechanisms which are in turn dependent upon interactions between the water column and riverbed. The release and uptake of phosphorus by both suspended and bed sediments provide a critical control on in-stream phosphorus transport. Phosphorus transport and transformation dynamics in rivers can only be fully understood when considering both the water and sediment phases [50]. While we are confident that the discussions here are well supported by our results, a more detailed sampling design focusing on suspended sediment, river bed sediment, and water column interactions will provide us with a deeper understanding on the dynamics of phosphorus in our studied river systems.
5. Conclusions
This study investigated total phosphorus and dissolved inorganic phosphorus loadings from three coastal rivers that drain watersheds under varied agriculture intensities (i.e., 67%, 61%, and 26%) into the northern Gulf of Mexico, one of the world’s largest summer hypoxic zones. The study also examined the TP and DIP changes along an 88-km reach, from freshwater to saltwater, to discern mixing effects on phosphorus dynamics. The TP fluxes from one of the rivers (Vermilion River) draining an agriculture-intensive watershed increased from the 1990–2009 period to the 2010–2017 period, while no significant change was found in the other two rivers. River discharge variability caused by precipitation change, and probably river diversion as well, was the main reason for this TP flux trend. The two rivers draining more agriculture-intensive watersheds (67% and 61%) showed consistently higher TP and DIP concentrations and fluxes than the one that drains a pasture-forest dominated area, confirming the strong effect of land uses on phosphorus input to estuaries in coastal river basins. The DIP concentration versus salinity plots in the Calcasieu River suggest some sources were present throughout the Calcasieu Estuary, since measured DIP concentrations were usually higher than those predicted by conservative mixing. Such mixing dynamics were probably caused by desorption of DIP from suspended solids and river bed sediments, urban inputs, as well as stronger calcium carbonate and phosphorus co-precipitation at the marine endmember. To fully understand the phosphorus transport and transformation dynamics in a freshwater—saltwater mixing zone, a more detailed sampling design focusing on suspended sediment, estuarine bed sediment, and water column interactions is necessary.
Author Contributions
S.H. carried out the study, analyzed the data, and wrote the first manuscript draft. Y.J.X. developed the study concept, provided oversight throughout the study, and revised the manuscript. All authors read and approved the final manuscript.
Funding
This study was supported through a grant from the National Fish and Wildlife Foundation (Project #: 8004.12.036402). The study also benefited from a United States Department of Agriculture Hatch Fund grant (Project #: LAB94230), which provided partial field trip support. During the preparation of the manuscript Songjie He received a Dissertation Year Fellowship from the Louisiana State University.
Acknowledgments
Thanks go to the United States Geological Survey for making the river discharge and gage height data available for this study and to Thomas P. Blanchard for DIP analyses at the Wetland Biogeochemistry Analytical Services and the Department of Oceanography and Coastal Sciences, Louisiana State University. The authors thank Jeff Corkern for laboratory TP and TSS analyses at the Louisiana State University Agricultural Center W.A. Callegari Environmental Center. The authors are grateful to Kaci Fisher, Daniel Cohen, Sanjeev Joshi, and Zhen Xu for their outstanding field assistance.
Conflicts of Interest
The authors declare no conflict of interest.
Appendix A

Table A1.
Concentration of TP, Ca, Mn, and Zn in sediment samples collected at the Calcasieu River.
| Site | Date | TP | Ca | Mn | Zn |
|---|---|---|---|---|---|
| mg L−1 | |||||
| Site 1 | 16 July 2014 | 84 | 2201 | 91 | 16 |
| 2 December 2014 | 140 | 18,143 | 96 | 26 | |
| 22 March 2015 | 244 | 2164 | 174 | 28 | |
| 20 August 2015 | 88 | 1990 | 166 | 18 | |
| Site 2 | 16 July 2014 | 47 | 14,229 | 60 | 10 |
| 2 December 2014 | 35 | 1521 | 133 | 10 | |
| 22 March 2015 | 23 | 1724 | 61 | 14 | |
| 20 August 2015 | 28 | 1920 | 63 | 45 | |
| Site 3 | 2 December 2014 | 443 | 121,021 | 248 | 103 |
| 22 March 2015 | 121 | 7005 | 110 | 23 | |
| 20 August 2015 | 64 | 18,723 | 93 | 14 | |
| Site 4 | 16 July 2014 | 83 | 1226 | 31 | 20 |
| 2 December 2014 | 71 | 1172 | 53 | 17 | |
| 22 March 2015 | 80 | 986 | 38 | 10 | |
| 20 August 2015 | 48 | 806 | 65 | 13 | |
| Site 5 | 16 July 2014 | 1366 | 138,547 | 488 | 196 |
| 2 December 2014 | 233 | 10,380 | 166 | 45 | |
| 22 March 2015 | 270 | 41,157 | 201 | 50 | |
| 20 August 2015 | 104 | 1818 | 128 | 26 | |
| Site 6 | 16 July 2014 | 385 | 22,017 | 440 | 61 |
| 2 December 2014 | 332 | 16,627 | 642 | 72 | |
| 22 March 2015 | 429 | 28,450 | 481 | 69 | |
| 20 August 2015 | 474 | 10,734 | 350 | 58 | |
Figure A1.
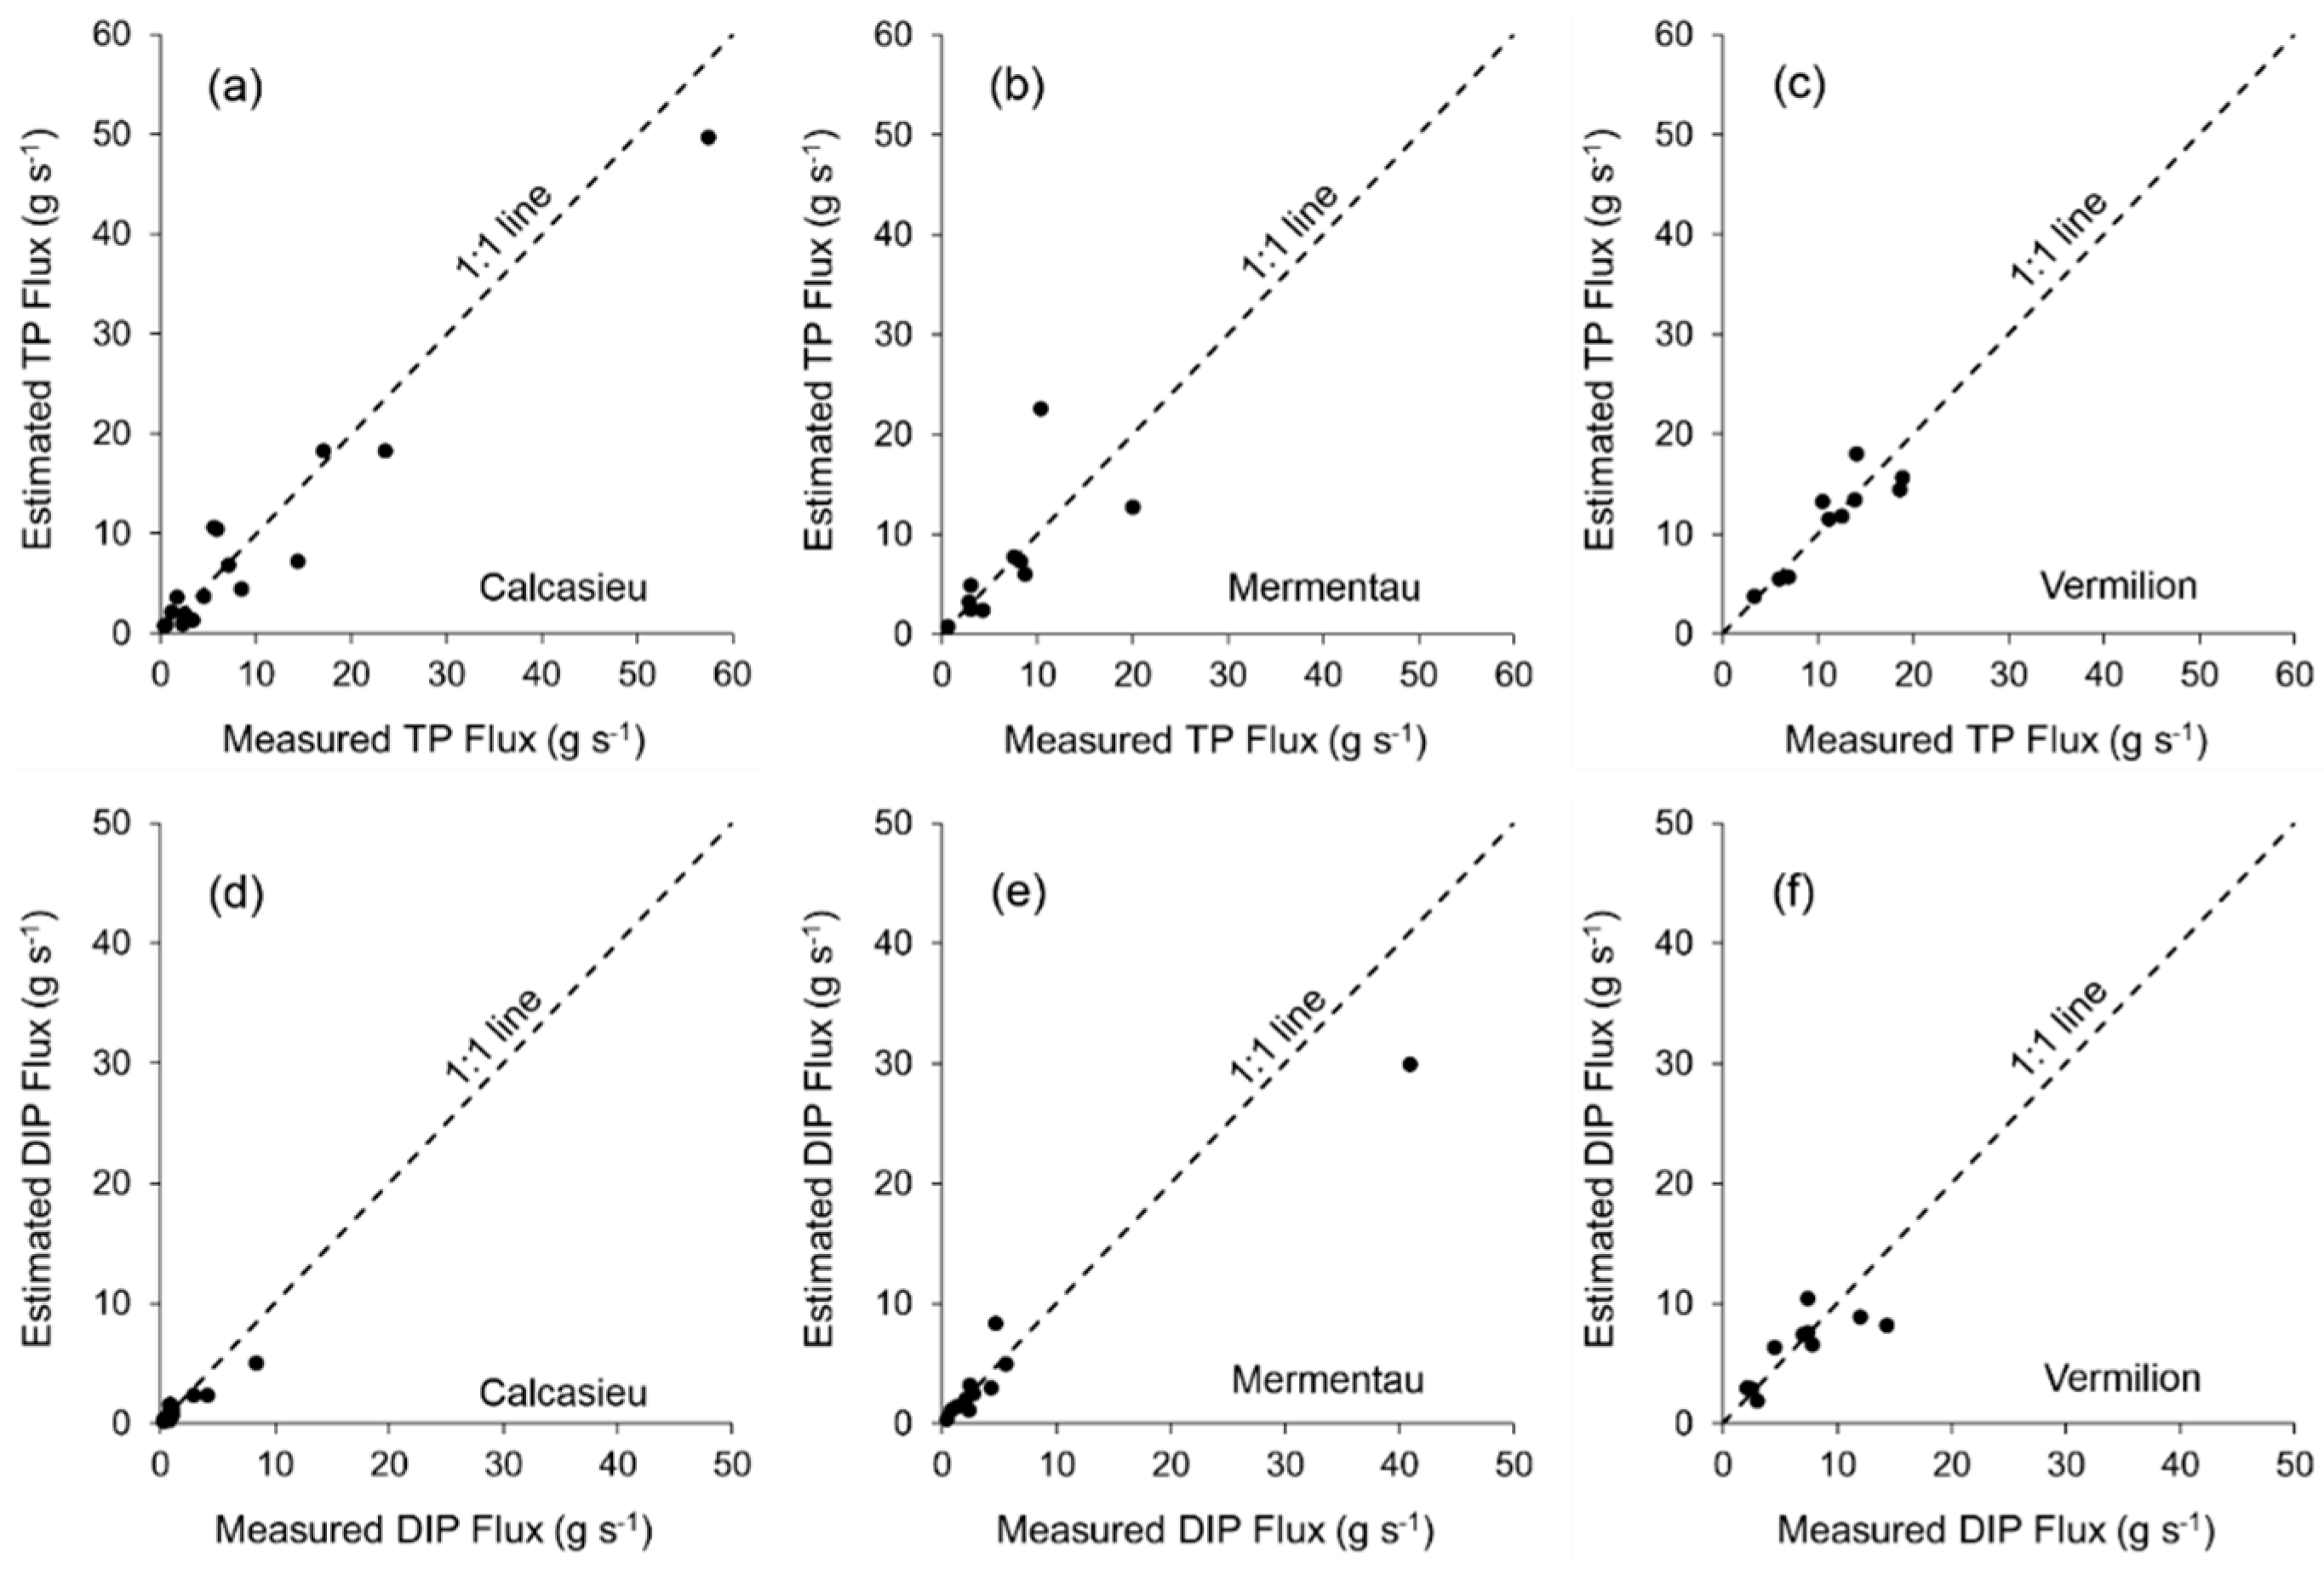
Relationship between measured TP and DIP fluxes and estimated TP and DIP fluxes using regression equations (Equation (1)) for the Calcasieu (Site 1), Mermentau, and Vermilion Rivers from April 2014 to February 2016. (a) Relationship between measured and estimated TP flux in the Calcasieu River; (b) Relationship between measured and estimated TP flux in the Mermentau River; (c) Relationship between measured and estimated TP flux in the Vermilion River; (d) Relationship between measured and estimated DIP flux in the Calcasieu River; (e) Relationship between measured and estimated DIP flux in the Mermentau River; (f) Relationship between measured and estimated DIP flux in the Vermilion River.
Figure A1.
Relationship between measured TP and DIP fluxes and estimated TP and DIP fluxes using regression equations (Equation (1)) for the Calcasieu (Site 1), Mermentau, and Vermilion Rivers from April 2014 to February 2016. (a) Relationship between measured and estimated TP flux in the Calcasieu River; (b) Relationship between measured and estimated TP flux in the Mermentau River; (c) Relationship between measured and estimated TP flux in the Vermilion River; (d) Relationship between measured and estimated DIP flux in the Calcasieu River; (e) Relationship between measured and estimated DIP flux in the Mermentau River; (f) Relationship between measured and estimated DIP flux in the Vermilion River.

Figure A2.
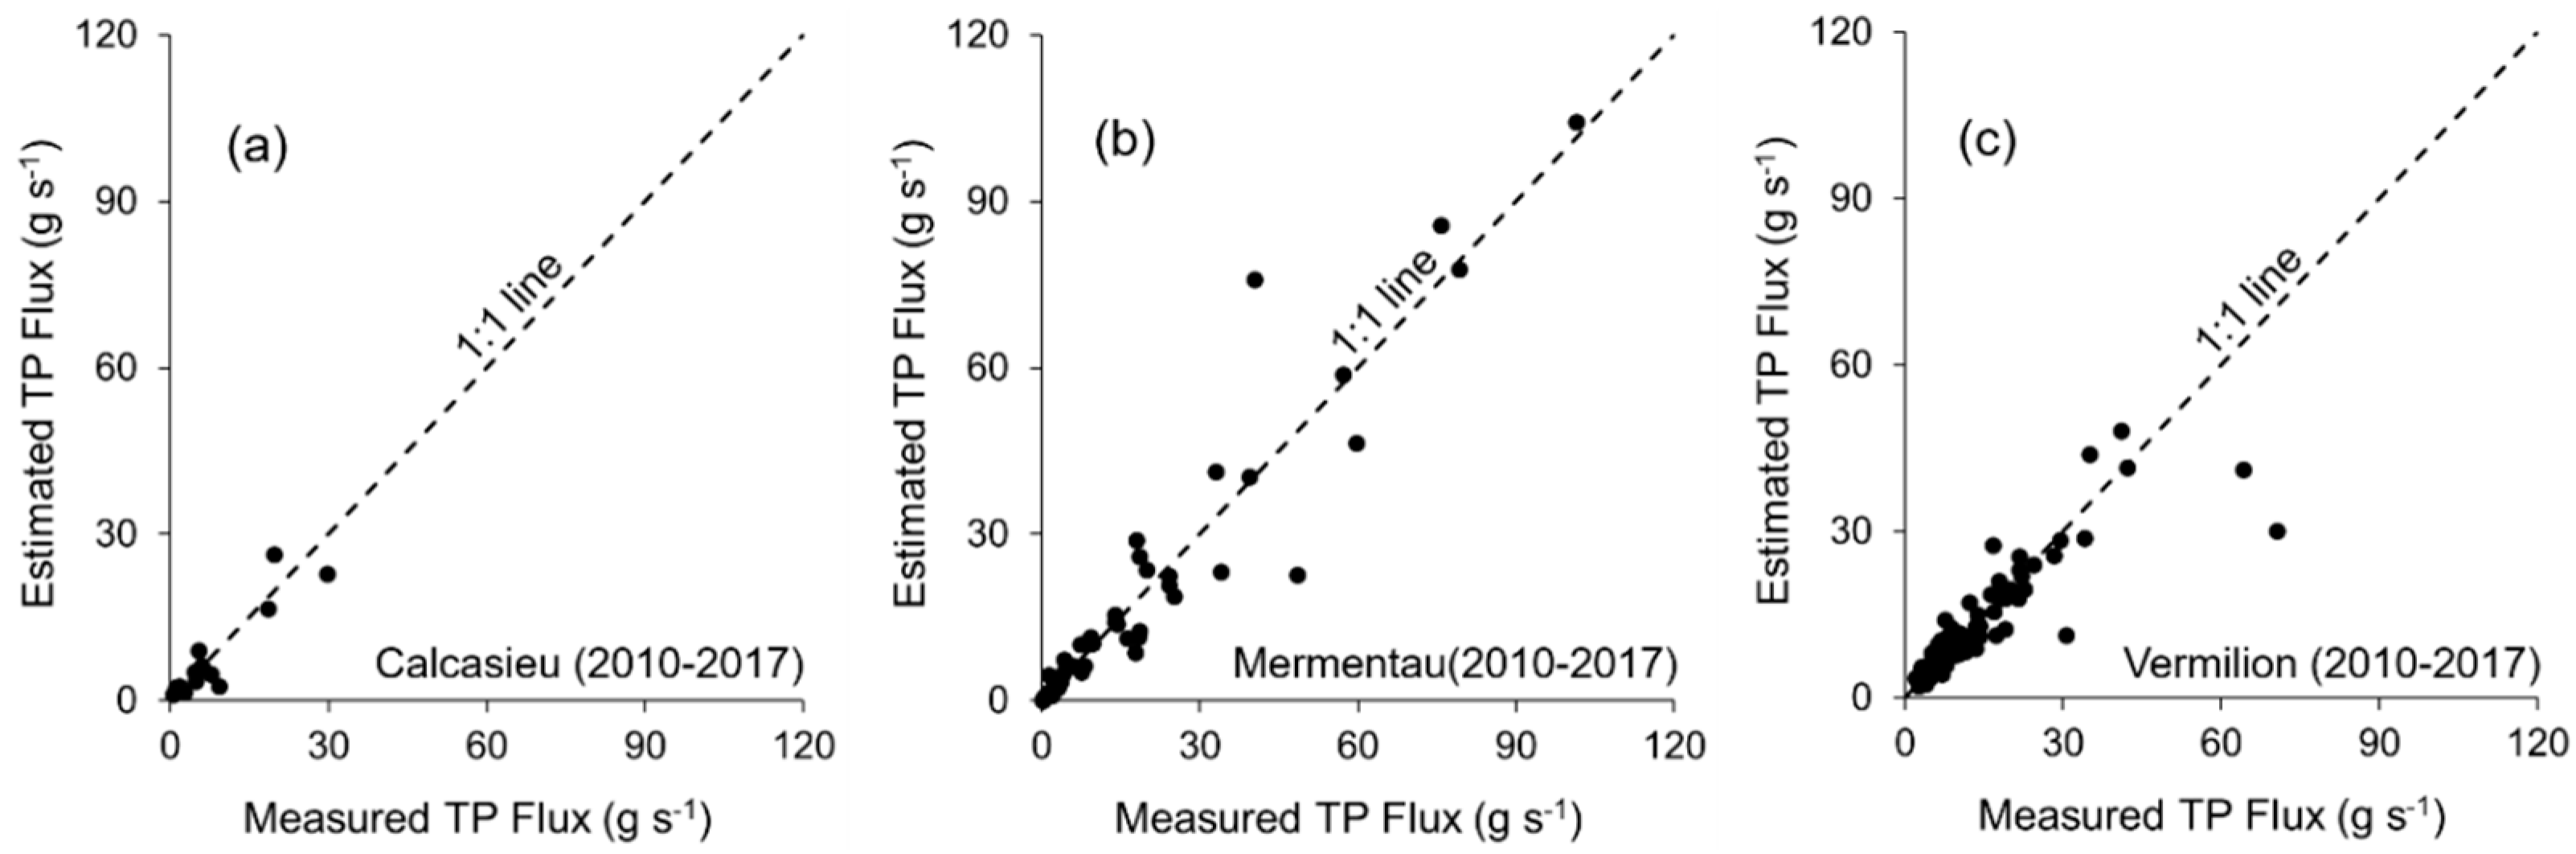
Relationship between measured TP fluxes and estimated TP fluxes using regression equations (Equation (1)) for the Calcasieu (Kinder, (a)), Mermentau (b), and Vermilion (c) Rivers from 2010 to 2017.
Figure A2.
Relationship between measured TP fluxes and estimated TP fluxes using regression equations (Equation (1)) for the Calcasieu (Kinder, (a)), Mermentau (b), and Vermilion (c) Rivers from 2010 to 2017.

Figure A3.
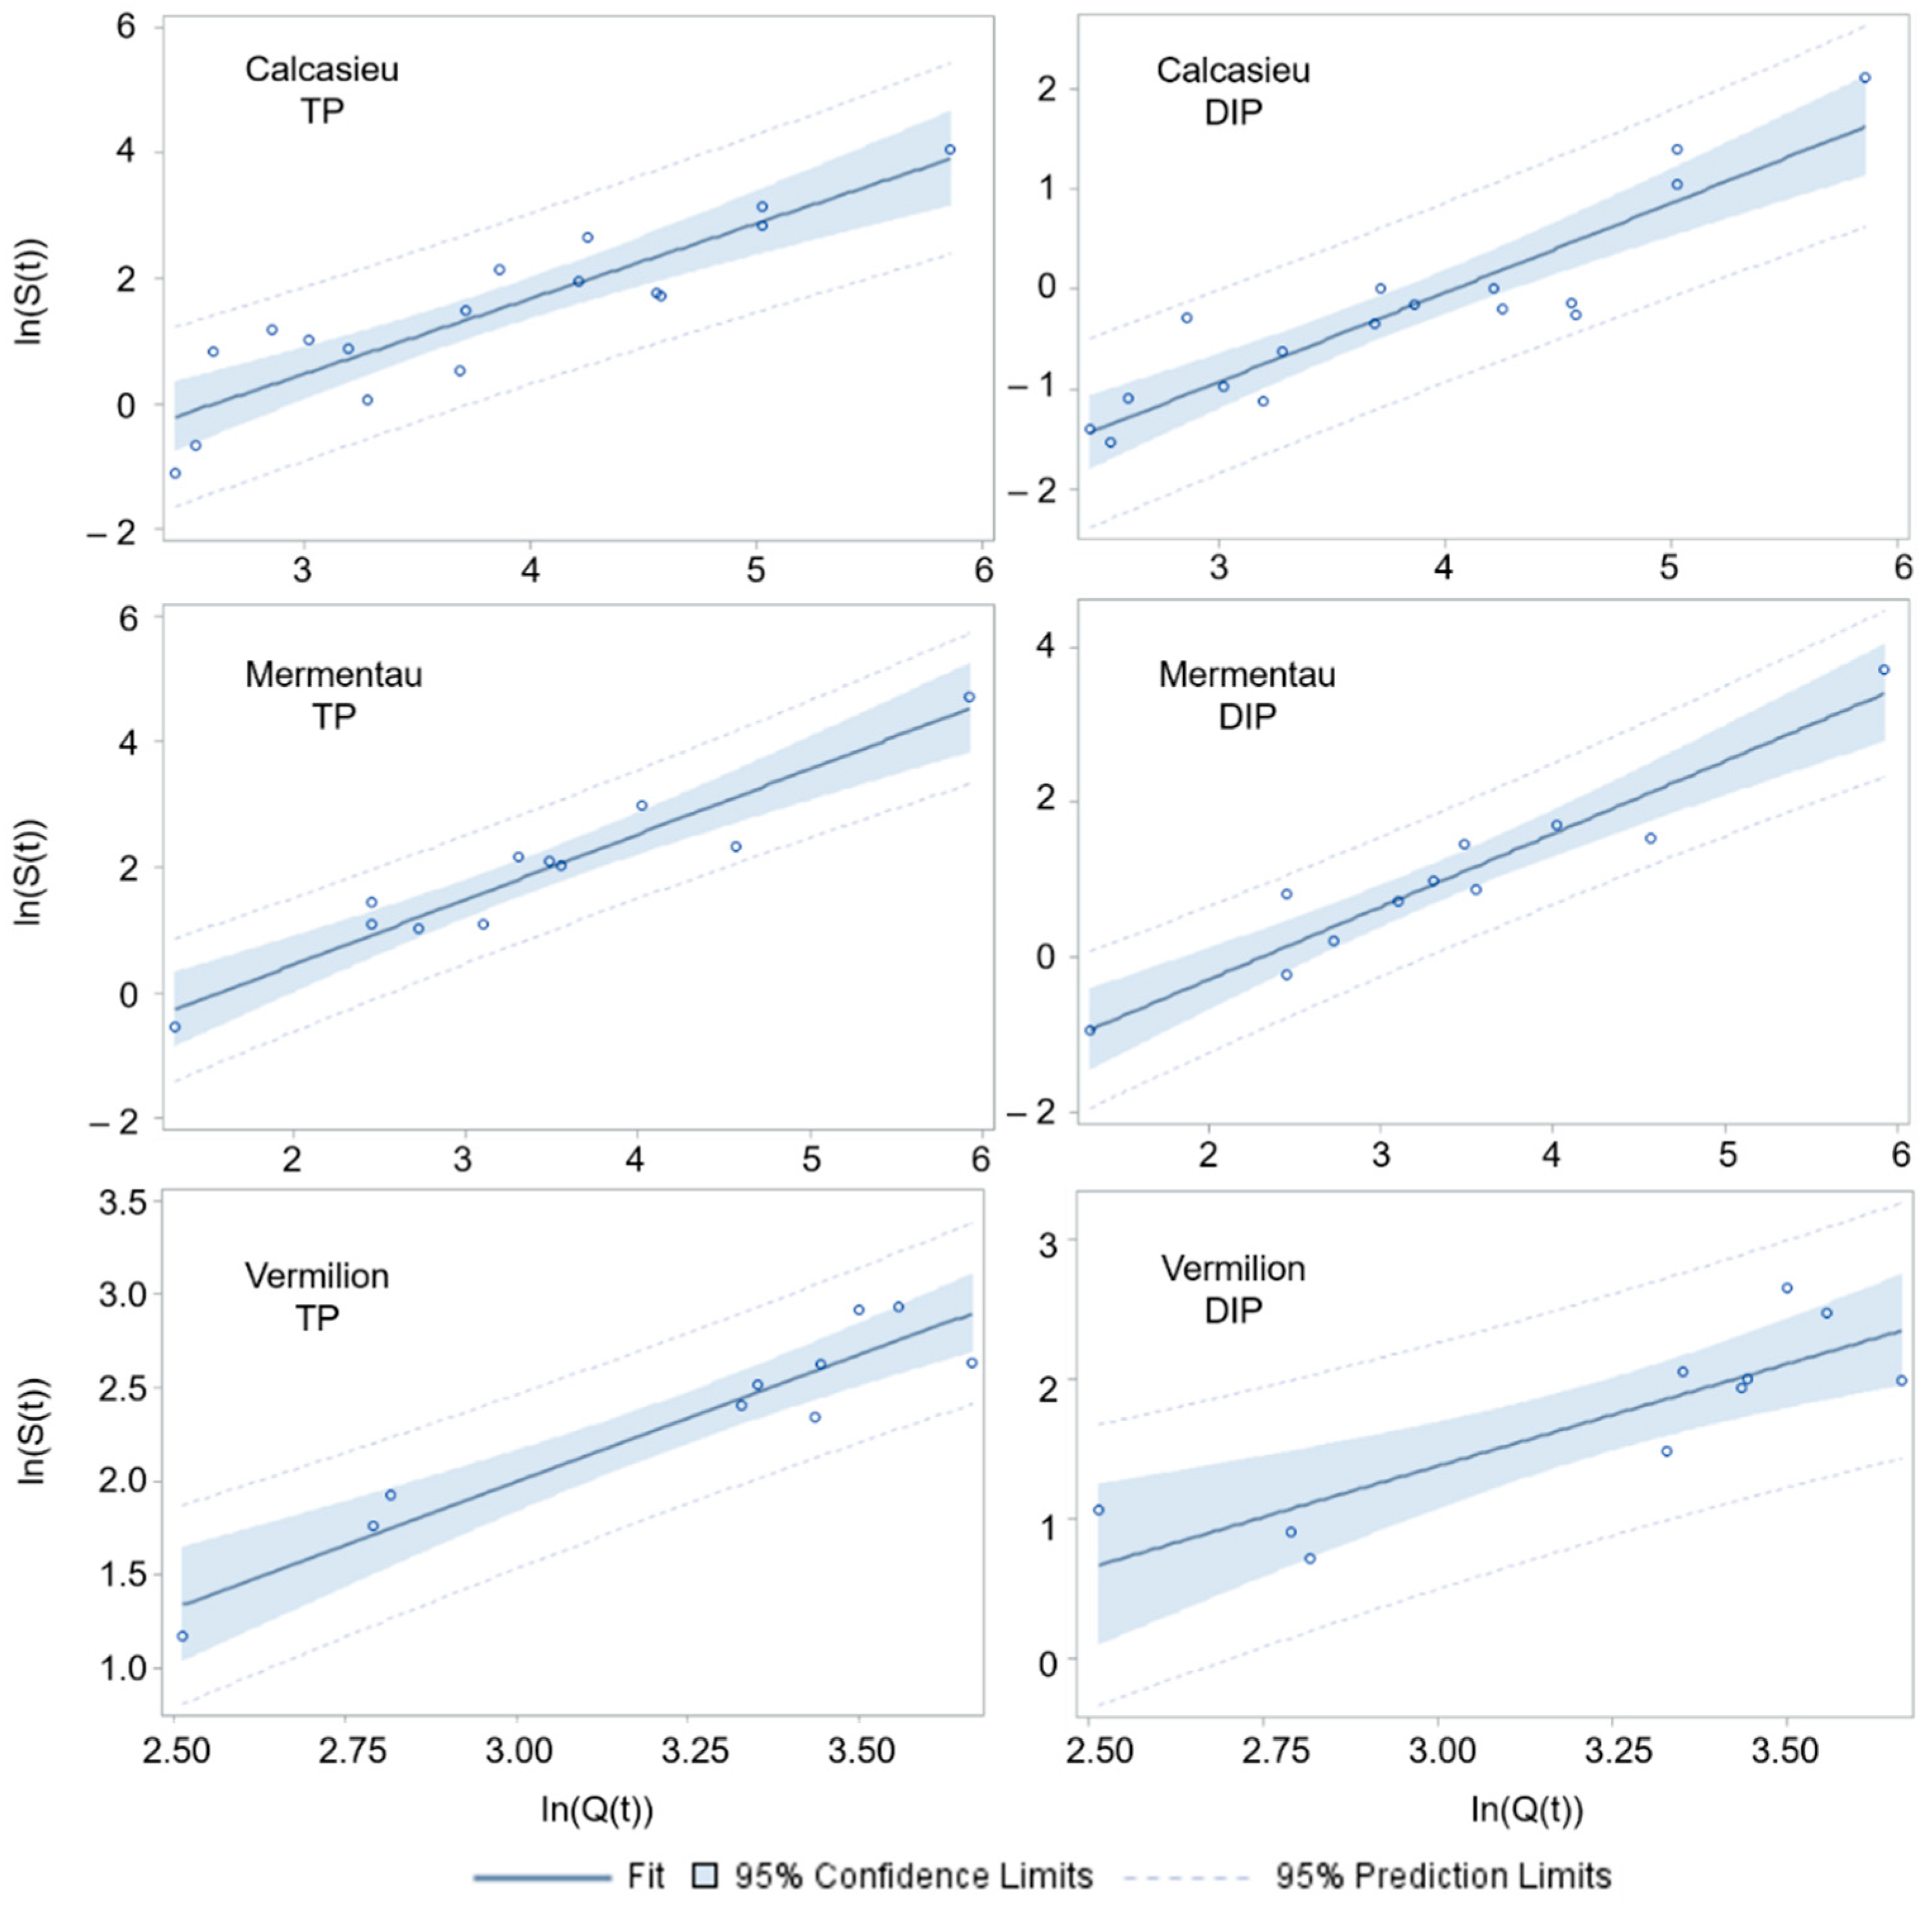
Statistical performance of the rating curves (Table 1) for estimating TP and DIP daily fluxes of the Calcasieu (Site 1), Mermentau, and Vermilion Rivers from April 2014 to February 2016 using data collected from this study.
Figure A3.
Statistical performance of the rating curves (Table 1) for estimating TP and DIP daily fluxes of the Calcasieu (Site 1), Mermentau, and Vermilion Rivers from April 2014 to February 2016 using data collected from this study.

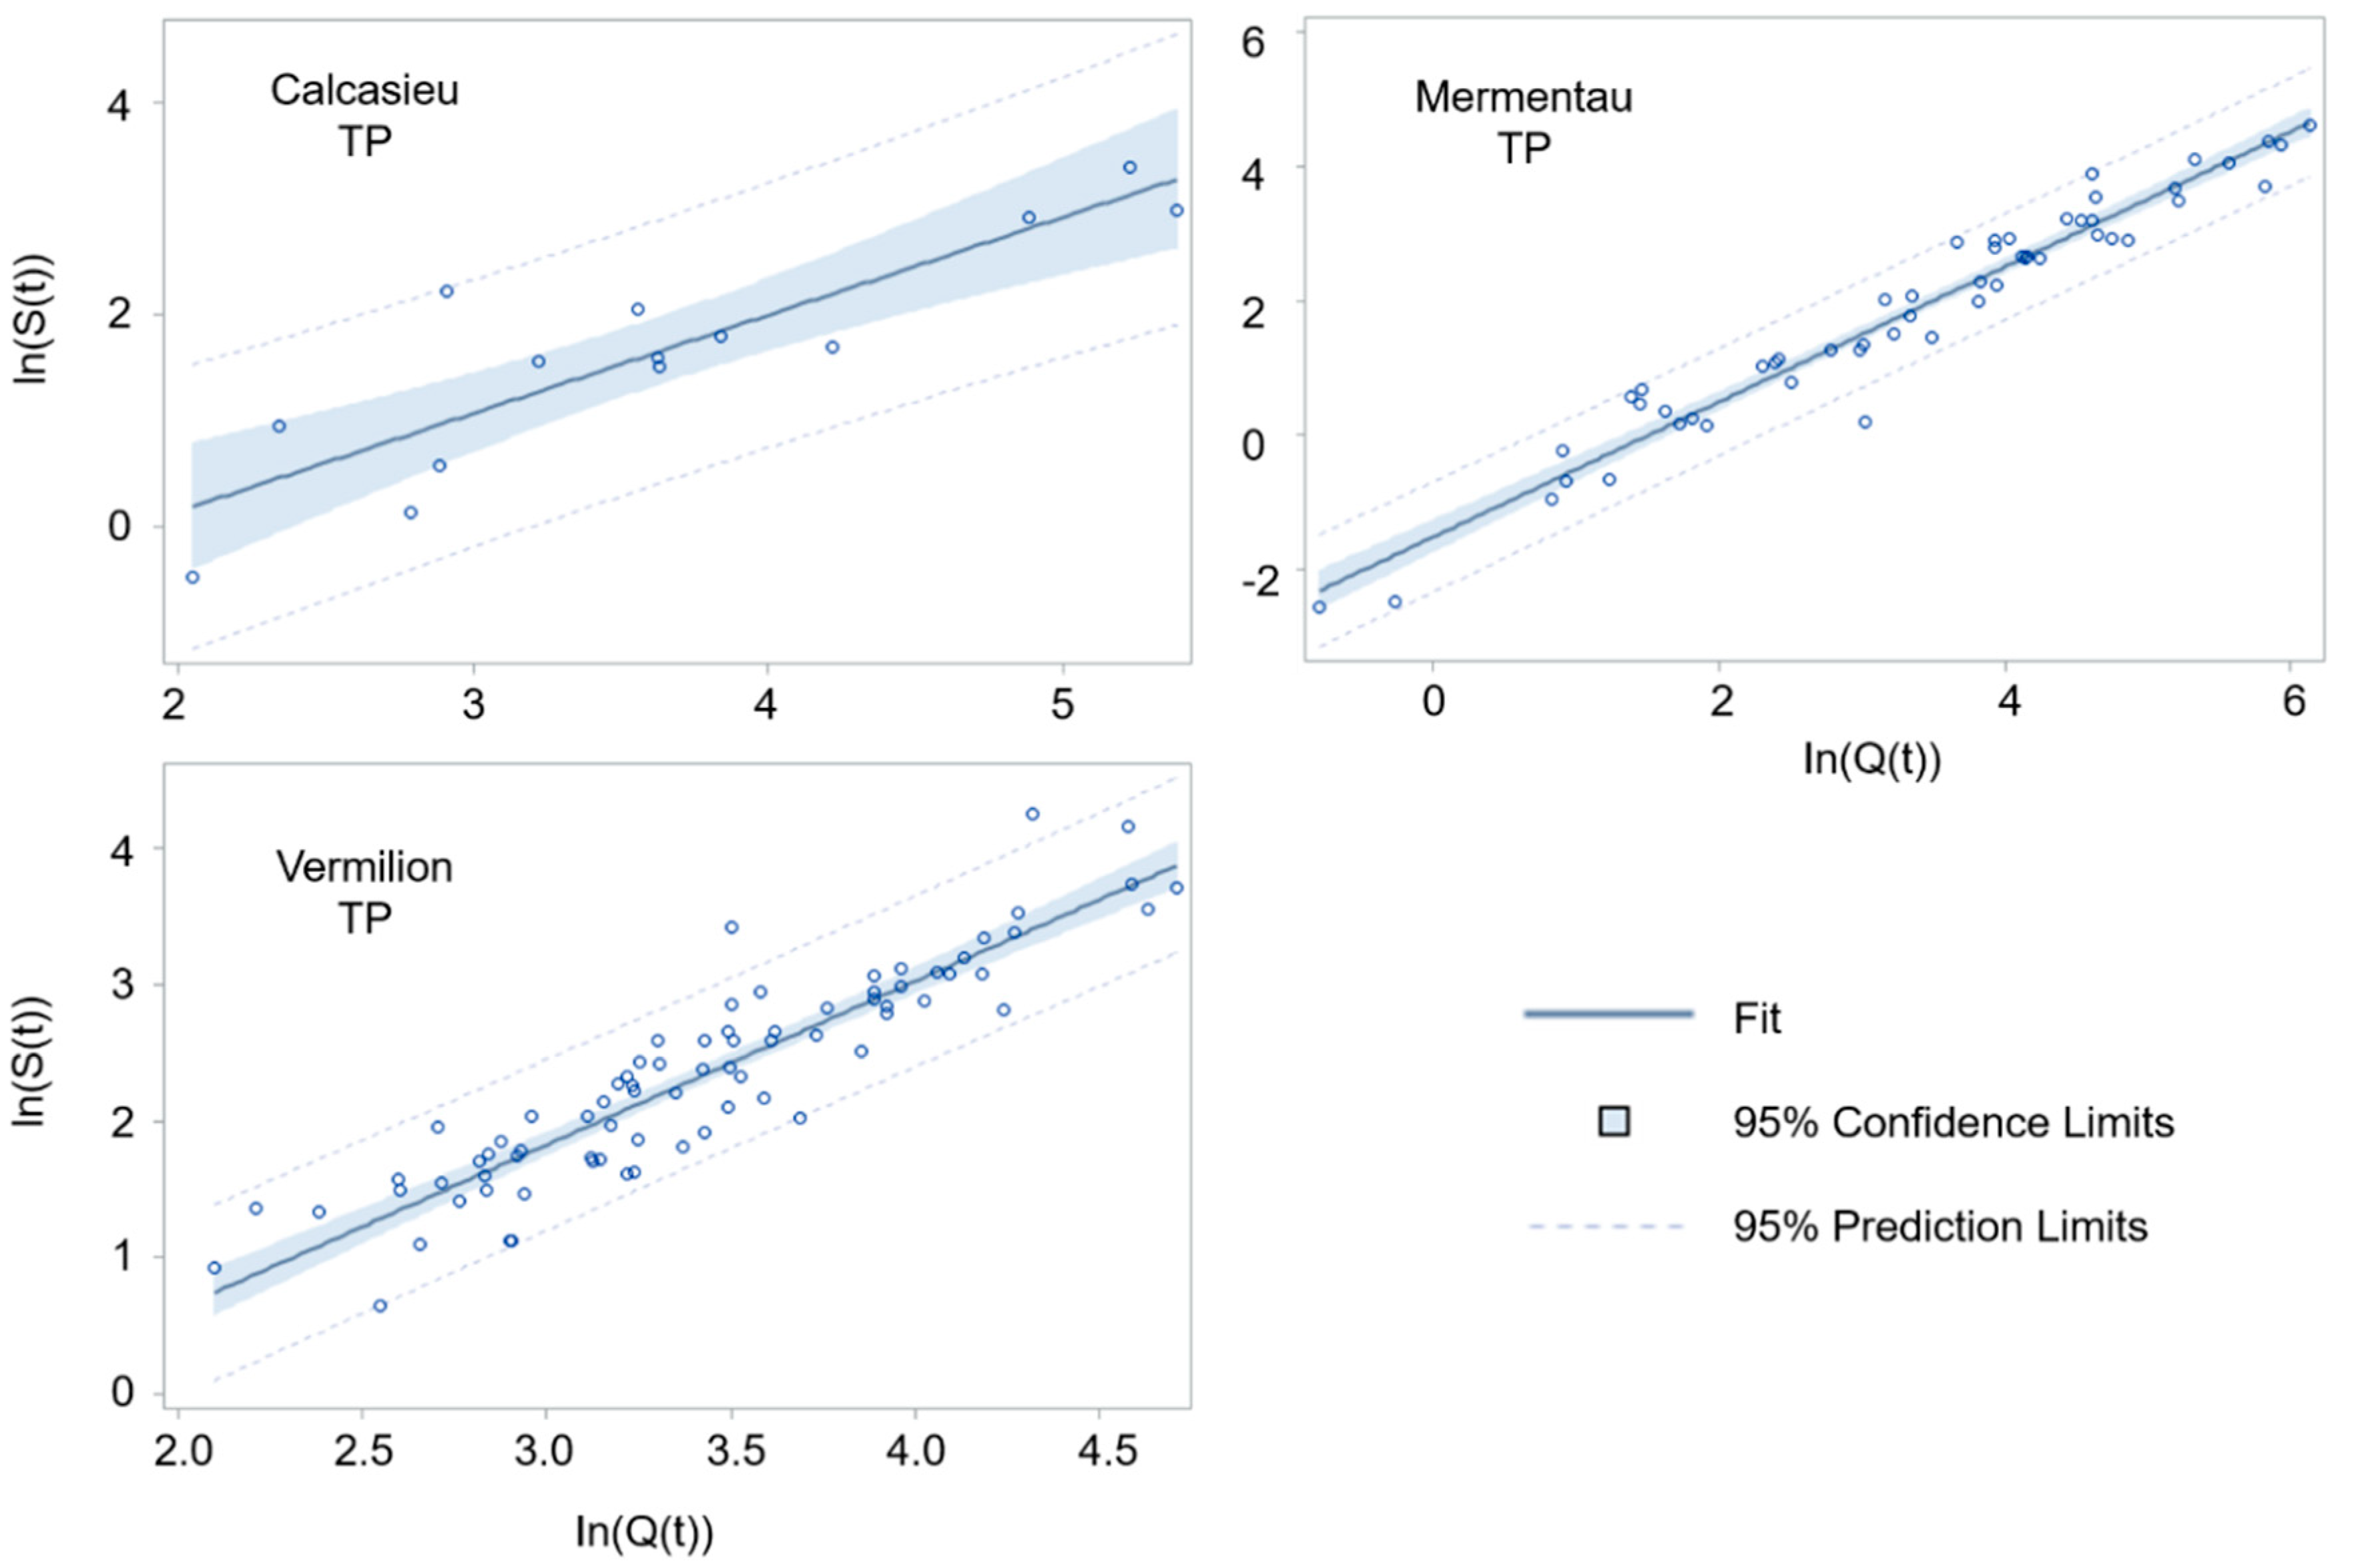
Figure A4.
Statistical performance of the rating curves (Table 1) for estimating TP daily fluxes of the Calcasieu (Kinder), Mermentau, and Vermilion Rivers from 2010 to 2017 using data collected from LDEQ.
Figure A4.
Statistical performance of the rating curves (Table 1) for estimating TP daily fluxes of the Calcasieu (Kinder), Mermentau, and Vermilion Rivers from 2010 to 2017 using data collected from LDEQ.

Figure A5.
The relationship between discharge at Kinder (United States Geological Survey (USGS) station number: 08015500) and precipitation at Oberlin (National Oceanic and Atmospheric Administration (NOAA) station number: USC00166938). Each dot in the figure represent a pair of mean discharge and precipitation during a certain year from 1990 to 2017.

Figure A6.
The relationship between discharge and TP concentration for the Calcasieu (a), Mermentau (b), and Vermilion (c) Rivers from 2010 to 2017 using discharge data from USGS and TP concentration data from Louisiana Department of Environmental Quality (LDEQ).
Figure A6.
The relationship between discharge and TP concentration for the Calcasieu (a), Mermentau (b), and Vermilion (c) Rivers from 2010 to 2017 using discharge data from USGS and TP concentration data from Louisiana Department of Environmental Quality (LDEQ).

References
- Carpenter, S.R.; Caraco, N.F.; Correll, D.L.; Howarth, R.W.; Sharpley, A.N.; Smith, V.H. Nonpoint pollution of surface waters with phosphorus and nitrogen. Ecol. Appl. 1998, 8, 559–568. [Google Scholar] [CrossRef]
- Smith, V.H. Eutrophication of freshwater and coastal marine ecosystems—A global problem. Environ. Sci. Pollut. Res. 2003, 10, 126–139. [Google Scholar] [CrossRef]
- Conley, D.J.; Paerl, H.W.; Howarth, R.W.; Boesch, D.F.; Seitzinger, S.P.; Havens, K.E.; Lancelot, C.; Likens, G.E. Controlling eutrophication: Nitrogen and phosphorus. Science 2009, 323, 1014–1015. [Google Scholar] [CrossRef] [PubMed]
- Walker, T.W.; Syers, J.K. The fate of phosphorus during pedogenesis. Geoderma 1976, 15, 1–19. [Google Scholar] [CrossRef]
- Boyle, J.F.; Chiverrell, R.C.; Norton, S.A.; Plater, A.J. A leaky model of long-term soil phosphorus dynamics. Glob. Biogeochem. Cycles 2013, 27, 516–525. [Google Scholar] [CrossRef] [Green Version]
- Izquierdo, J.E.; Houlton, B.Z.; van Huysen, T.L. Evidence for progressive phosphorus limitation over long-term ecosystem development: Examination of a biogeochemical paradigm. Plant Soil 2013, 367, 135–147. [Google Scholar] [CrossRef]
- He, S.; Xu, Y.J. Three decadal inputs of nitrogen and phosphorus from four major coastal rivers to the summer hypoxic zone of the northern Gulf of Mexico. Water Air Soil Pollut. 2015, 226, 311. [Google Scholar] [CrossRef]
- Rabalais, N.N.; Turner, R.E.; Sen Gupta, B.K.; Boesch, D.F.; Chapman, P.; Murrell, M.C. Hypoxia in the northern Gulf of Mexico: Does the science support the plan to reduce, mitigate, and control hypoxia? Estuaries Coasts 2007, 30, 753–772. [Google Scholar] [CrossRef]
- Rabalais, N.N.; Díaz, R.J.; Levin, L.A.; Turner, R.E.; Gilbert, D.; Zhang, J. Dynamics and distribution of natural and human-caused hypoxia. Biogeosciences 2010, 7, 585–619. [Google Scholar] [CrossRef] [Green Version]
- Turner, R.E.; Rabalais, N.N.; Justic, D. Gulf of Mexico hypoxia: Alternate states and a legacy. Environ. Sci. Technol. 2008, 42, 2323–2327. [Google Scholar] [CrossRef] [PubMed]
- Turner, R.E.; Rabalais, N.N. Coastal eutrophication near the Mississippi river delta. Nature 1994, 368, 619–621. [Google Scholar] [CrossRef]
- Turner, R.E.; Rabalais, N.N.; Justić, D. Predicting summer hypoxia in the northern gulf of Mexico: Redux. Mar. Pollut. Bull. 2012, 64, 319–324. [Google Scholar] [CrossRef] [PubMed]
- Goolsby, D.A.; Battaglin, W.A.; Aulenbach, B.T.; Hooper, R.P. Nitrogen input to the Gulf of Mexico. J. Environ. Qual. 2001, 30, 329–336. [Google Scholar] [CrossRef] [PubMed]
- Turner, R.E.; Rabalais, N.N.; Alexander, R.B.; McIsaac, G.; Howarth, R.W. Characterization of nutrient, organic carbon, and sediment yields and concentrations from the mississippi river into the northern gulf of mexico. Estuaries Coasts 2007, 30, 773–790. [Google Scholar] [CrossRef]
- Xu, Y.J. Transport and retention of nitrogen, phosphorus and carbon in North America’s largest river swamp basin, the Atchafalaya river basin. Water 2013, 5, 379–393. [Google Scholar] [CrossRef]
- Rosen, T.; Xu, Y.J. Riverine sediment inflow to Louisiana Chenier Plain in the Northern Gulf of Mexico. Estuar. Coast. Shelf Sci. 2011, 95, 279–288. [Google Scholar] [CrossRef]
- Bianchi, T.S. Biogeochemistry of Estuaries; Oxford University Press: Oxford, UK, 2007. [Google Scholar]
- Sharpley, A.N.; Menzel, R.G. The impact of soil and fertilizer phosphorus on the environment. Adv. Agron. 1987, 41, 297–324. [Google Scholar]
- Hooda, P.S.; Moynagh, M.; Svoboda, I.F.; Thurlow, M.; Stewart, M.; Thomson, M.; Anderson, H.A. Soil and land use effects on phosphorus in six streams draining small agricultural catchments in scotland. Soil Use Manag. 1997, 13, 196–204. [Google Scholar] [CrossRef]
- Sonoda, K.; Yeakley, J.A. Relative effects of land use and near-stream chemistry on phosphorus in an urban stream. J. Environ. Qual. 2007, 36, 144–154. [Google Scholar] [CrossRef] [PubMed]
- LDWF. Part VI A—Waterbody Management Plan Series—Calcasieu River, Louisiana. 2012. Available online: http://www.wlf.louisiana.gov/sites/default/files/pdf/document/38698-calcasieu-river/calcasieu_river_mp-a_update_2014.pdf (accessed on 19 June 2018).
- USACE. The Calcasieu Saltwater Barrier. Available online: http://www.mvn.usace.army.mil/Portals/56/docs/PAO/Brochures/CalcasieuSWB.pdf (accessed on 19 June 2018).
- USACE. The Mermentau Basin Project. 2015. Available online: http://www.mvn.usace.army.mil/Portals/56/docs/PAO/Brochures/mermentau.pdf (accessed on 19 June 2018).
- USEPA. Total Maximum Daily Yield (TMDL) for TSS, Turbidity, and Siltation for the 15 Subsegments in the Vermilion River Basin. 2001. Available online: https://ofmpub.epa.gov/waters10/attains_impaired_waters.show_tmdl_document?p_tmdl_doc_blobs_id=74265 (accessed on 19 June 2018).
- Baker, J.T. Mermentau River Watershed TMDL to Address Dissolved Oxygen and Nutrients Including WLAS for Two Treatment Facilities. 1999. Available online: http://deq.louisiana.gov/assets/docs/Water/TMDL/Mermentau-River.pdf (accessed on 19 June 2018).
- LDEQ. Calcasieu River TMDL for Dissolved Lead-Subsegment 030101, 030102, & 030103. 2001. Available online: https://ofmpub.epa.gov/waters10/attains_impaired_waters.show_tmdl_document?p_tmdl_doc_blobs_id=74503 (accessed on 19 June 2018).
- LDEQ. Vermilion River Watershed Subsegment 060801 & 060802. 2002. Available online: http://nonpoint.deq.louisiana.gov/wqa/links/watershedplan/Vermilion-Teche/Vermilion%20River%20Plan.pdf (accessed on 19 June 2018).
- He, S.; Xu, Y.J. Assessing dissolved carbon transport and transformation along an estuarine river with stable isotope analyses. Estuar. Coast. Shelf Sci. 2017, 197, 93–106. [Google Scholar] [CrossRef]
- He, S.; Xu, Y.J. Freshwater-saltwater mixing effects on dissolved carbon and CO2 outgassing of a coastal river entering the northern gulf of Mexico. Estuaries Coasts 2018, 41, 734–750. [Google Scholar] [CrossRef]
- He, S.; Xu, Y.J. Spatiotemporal distributions of Sr and Ba along an estuarine river with a large salinity gradient to the Gulf of Mexico. Water 2016, 8, 323. [Google Scholar] [CrossRef]
- Fry, B. Conservative mixing of stable isotopes across estuarine salinity gradients: A conceptual framework for monitoring watershed influences on downstream fisheries production. Estuaries 2002, 25, 264–271. [Google Scholar] [CrossRef]
- Kaldy, J.E.; Cifuentes, L.A.; Brock, D. Using stable isotope analyses to assess carbon dynamics in a shallow subtropical estuary. Estuaries 2005, 28, 86–95. [Google Scholar] [CrossRef]
- Kim, Y.; Kim, T.-H.; Ergün, T. The instability of the pearson correlation coefficient in the presence of coincidental outliers. Financ. Res. Lett. 2015, 13, 243–257. [Google Scholar] [CrossRef]
- Chen, D.; Hu, M.; Guo, Y.; Dahlgren, R.A. Influence of legacy phosphorus, land use, and climate change on anthropogenic phosphorus inputs and riverine export dynamics. Biogeochemistry 2015, 123, 99–116. [Google Scholar] [CrossRef]
- Ryding, S.-O.; Enell, M.; Wennberg, L. Swedish agricultural nonpoint source pollution: A summary of research and findings. Lake Reserv. Manag. 1990, 6, 207–217. [Google Scholar] [CrossRef]
- Alexander, R.B.; Smith, R.A.; Schwarz, G.E.; Boyer, E.W.; Nolan, J.V.; Brakebill, J.W. Differences in phosphorus and nitrogen delivery to the gulf of Mexico from the Mississippi River Basin. Environ. Sci. Technol. 2008, 42, 822–830. [Google Scholar] [CrossRef] [PubMed]
- Groppo, J.D.; Lins, S.R.M.; Camargo, P.B.; Assad, E.D.; Pinto, H.S.; Martins, S.C.; Salgado, P.R.; Evangelista, B.; Vasconcellos, E.; Sano, E.E.; et al. Changes in soil carbon, nitrogen, and phosphorus due to land-use changes in Brazil. Biogeosciences 2015, 12, 4765–4780. [Google Scholar] [CrossRef] [Green Version]
- Shen, Z.; Chen, L.; Hong, Q.; Qiu, J.; Xie, H.; Liu, R. Assessment of nitrogen and phosphorus loads and causal factors from different land use and soil types in the three gorges reservoir area. Sci. Total Environ. 2013, 454–455, 383–392. [Google Scholar] [CrossRef] [PubMed]
- Messiga, A.J.; Ziadi, N.; Bélanger, G.; Morel, C. Soil nutrients and other major properties in grassland fertilized with nitrogen and phosphorus. Soil Sci. Soc. Am. J. 2013, 77, 643–652. [Google Scholar] [CrossRef]
- Hodgkiss, I.J.; Ho, K.C. Are changes in N:P ratios in coastal waters the key to increased red tide blooms? Hydrobiologia 1997, 352, 141–147. [Google Scholar] [CrossRef]
- Leong, D.N.S.; Donner, S.D.; Hassan, M.A.; Gabor, R.; Drummond, J.D. Sensitivity of stoichiometric ratios in the Mississippi River to hydrologic variability. J. Geophys. Res. Biogeosci. 2014, 119, 1049–1062. [Google Scholar] [CrossRef] [Green Version]
- Froelich, P.N. Kinetic control of dissolved phosphate in natural rivers and estuaries: A primer on the phosphate buffer mechanism. Limnol. Oceanogr. 1988, 33, 649–668. [Google Scholar] [CrossRef]
- Meng, J.; Yu, Z.; Yao, Q.; Bianchi, T.S.; Paytan, A.; Zhao, B.; Pan, H.; Yao, P. Distribution, mixing behavior, and transformation of dissolved inorganic phosphorus and suspended particulate phosphorus along a salinity gradient in the Changjiang Estuary. Mar. Chem. 2015, 168, 124–134. [Google Scholar] [CrossRef]
- Van Raaphorst, W.; Kloosterhuis, H.T. Phosphate sorption in superficial intertidal sediments. Mar. Chem. 1994, 48, 1–16. [Google Scholar] [CrossRef]
- Hobbie, J.E.; Copeland, B.J.; Harrison, W.G. Sources and Fate of Nutrients of the Pamlico River Estuary, North Carolina; Academic Press: New York, NY, USA, 1975. [Google Scholar]
- Evans, D.J.; Johnes, P.J.; Lawrence, D.S. Physico-chemical controls on phosphorus cycling in two lowland streams. Part 2—The sediment phase. Sci. Total Environ. 2004, 329, 165–182. [Google Scholar] [CrossRef] [PubMed]
- Pomeroy, L.R.; Smith, E.E.; Grant, C.M. The exchange of phosphate between estuarine water and sediments. Limnol. Oceanogr. 1965, 10, 167–172. [Google Scholar] [CrossRef]
- Fox, L.E. A model for inorganic control of phosphate concentrations in river waters. Geochim. Cosmochim. Acta 1989, 53, 417–428. [Google Scholar] [CrossRef]
- Conley, D.J.; Smith, W.M.; Cornwell, J.C.; Fisher, T.R. Transformation of particle-bound phosphorus at the land-sea interface. Estuar. Coast. Shelf Sci. 1995, 40, 161–176. [Google Scholar] [CrossRef]
- Evans, D.J.; Johnes, P.J. Physico-chemical controls on phosphorus cycling in two lowland streams. Part 1—The water column. Sci. Total Environ. 2004, 329, 145–163. [Google Scholar] [CrossRef] [PubMed]
- Conley, D.J.; Humborg, C.; Rahm, L.; Savchuk, O.P.; Wulff, F. Hypoxia in the Baltic Sea and basin-scale changes in phosphorus biogeochemistry. Environ. Sci. Technol. 2002, 36, 5315–5320. [Google Scholar] [CrossRef] [PubMed]
- Young, K.; Morse, G.K.; Scrimshaw, M.D.; Kinniburgh, J.H.; MacLeod, C.L.; Lester, J.N. The relation between phosphorus and eutrophication in the Thames catchment, UK. Sci. Total Environ. 1999, 228, 157–183. [Google Scholar] [CrossRef]
Figure 1.
Geographic location of the Calcasieu, Mermentau, and Vermilion Rivers entering the Northern Gulf of Mexico, and the locations of eight sampling sites and United States Geological Survey (USGS) discharge gauging sites. The Vermilion and Mermentau River Basins are agriculture-intensive (i.e., 67% and 61% agricultural land use), while the Calcasieu River Basin is much less agriculture-intensive (i.e., 26%).

Figure 2.
Daily (a–c) and monthly (d–f) discharge and mass fluxes of TP and DIP in the Calcasieu (Site 1), Mermentau, and Vermilion Rivers from April 2014 to February 2016; discharge data at sites 1, 7, and 8 were used to represent the three rivers; Discharge at site 1 was calculated using discharge data at Kinder (USGS 08015500). Discharges at sites 7 and 8 were downloaded from USGS gage stations (USGS 08012150 and USGS 07386980); dashed lines in (a) mark the sampling dates; phosphorus concentrations and discharges at sites 1, 7, and 8 were used to calculate mass fluxes for the Calcasieu, Mermentau, and Vermilion Rivers, respectively; missing data for the Mermentau and Vermilion Rivers are due to availability of phosphorus concentration and discharge data.

Figure 3.
Temporal trends of salinity (a), water temperature (b), dissolved oxygen (DO) concentration (b), pH (c), total suspended solids (TSS) (d), fluorescence (e), and turbidity (f) at six sampling sites along the Calcasieu River from April 2014 to February 2016.
Figure 3.
Temporal trends of salinity (a), water temperature (b), dissolved oxygen (DO) concentration (b), pH (c), total suspended solids (TSS) (d), fluorescence (e), and turbidity (f) at six sampling sites along the Calcasieu River from April 2014 to February 2016.

Figure 4.
Concentrations of TP and DIP in the Calcasieu, Mermentau, and Vermilion Rivers from April 2014 to February 2016; The Mermentau and Vermilion Rivers were only sampled from April 2014 to July 2015; Data for the Calcasieu, Mermentau, and Vermilion Rivers in (a) are data for sites 1, 7, and 8; (b) TP concentration in the Calcasieu River; (c) DIP concentration in the Calcasieu River.

Figure 5.
Relationships between TP and salinity in the Calcasieu River entering the Northern Gulf of Mexico in the southern United States. Hollow circles represent actual measurements. Corresponding conservative mixing values are denoted by stars. Lines represent conservative-mixing models (see Equations (2) and (3)). Site 1 was used as the river endmember, and site 6 was used as the marine endmember.

Figure 6.
Relationships between DIP and salinity in the Calcasieu River entering the Northern Gulf of Mexico in the southern United States. Hollow circles represent actual measurements. Corresponding conservative mixing values are denoted by stars. Lines represent conservative-mixing models (see Equations (2) and (3)). Site 1 was used as the river endmember, and site 6 was used as the marine endmember.

Table 1.
Parameter estimates (b0 and b1) used in Equation (1) for estimating total phosphorus (TP) and dissolved inorganic phosphorus (DIP) fluxes and their regression coefficients (R2) for the Calcasieu, Mermentau, and Vermilion Rivers using data from this study and Louisiana Department of Environmental Quality (LDEQ). SE = standard error, RMSE = root of mean square error, n = sample size.
| Data Source | River | Phosphorus | b0 ± SE | b1 ± SE | R2 | RMSE | p Value | n |
|---|---|---|---|---|---|---|---|---|
| This Study (April 2014–February 2016) | Calcasieu (Site 1) | TP | −3.12 ± 0.61 | 1.20 ± 0.15 | 0.80 | 0.62 | <0.0001 | 17 |
| DIP | −3.61 ± 0.40 | 0.89 ± 0.10 | 0.83 | 0.41 | <0.0001 | 17 | ||
| Mermentau | TP | −1.64 ± 0.39 | 1.04 ± 0.11 | 0.91 | 0.43 | <0.0001 | 11 | |
| DIP | −2.16 ± 0.35 | 0.94 ± 0.10 | 0.91 | 0.38 | <0.0001 | 11 | ||
| Vermilion | TP | −2.06 ± 0.53 | 1.35 ± 0.16 | 0.90 | 0.19 | <0.0001 | 10 | |
| DIP | −3.00 ± 1.00 | 1.46 ± 0.31 | 0.74 | 0.36 | 0.0014 | 10 | ||
| LDEQ (2010–2017) | Calcasieu (Kinder) | TP | −1.71 ± 0.56 | 0.93 ± 0.15 | 0.76 | 0.55 | <0.0001 | 14 |
| Mermentau | TP | −1.51 ± 0.12 | 1.00 ± 0.03 | 0.95 | 0.39 | <0.0001 | 53 | |
| Vermilion | TP | −1.77 ± 0.21 | 1.20 ± 0.06 | 0.84 | 0.31 | <0.0001 | 78 |
Table 2.
Environmental conditions during the study period at six sampling sites along the Calcasieu River entering the Northern Gulf of Mexico in the southern United States. Tukey-Kramer’s adjustment was used to group sampling sites when analysis of variance (ANOVA) shows significant differences among sites. Means with the same superscript letter (a, b, c, d, or e) are not significantly different at the 0.05 level (Tukey groupings). Temp = Temperature, Fluo = Fluorescence, Turb = Turbidity.
| River | Site | Temp (°C) | Salinity | pH | DO (mg L−1) | TSS (mg L−1) | Fluo (RFU) | Turb (NTU) |
|---|---|---|---|---|---|---|---|---|
| Calcasieu | Site 1 | 22 ± 7 | 0.03 ± 0.01 a | 6.2 ± 0.5 a | 6 ± 2 a,c | 18 ± 7 a | 40 ± 20 a,b | 40 ± 20 a |
| Site 2 | 22 ± 7 | 0.1 ± 0.1 a | 6.1 ± 0.6 a | 5 ± 3 a,c | 20 ± 10 a | 40 ± 10 a,b | 30 ± 20 a | |
| Site 3 | 21 ± 7 | 2 ± 2 a | 6.4 ± 0.5 a,b | 5 ± 3 a,c | 20 ± 20 a | 30 ± 8 a | 20 ± 10 a | |
| Site 4 | 23 ± 7 | 4 ± 3 a | 6.7 ± 0.5 b,e | 5 ± 2 a,c | 14 ± 7 a | 30 ± 10 a | 20 ± 10 a | |
| Site 5 | 23 ± 6 | 12 ± 6 b | 7.5 ± 0.5 c | 7 ± 3 a,c | 40 ± 30 a,b | 30 ± 20 a | 30 ± 30 a | |
| Site 6 | 23 ± 6 | 19 ± 6 c | 8.1 ± 0.4 d | 7 ± 2 a,b | 70 ± 40 c | 40 ± 20 a,b | 40 ± 30 a | |
| Mermentau | Site 7 | 23 ± 7 | 0.09 ± 0.04 a | 7.6 ± 0.6 c | 4 ± 3 c | 21 ± 8 a | 80 ± 40 c | 70 ± 50 b |
| Vermilion | Site 8 | 24 ± 7 | 0.09 ± 0.03 a | 7.0 ± 0.4 e | 4 ± 2 c | 60 ± 50 b,c | 60 ± 20 b | 70 ± 40 b |
Table 3.
Pearson Correlation Coefficients between phosphorus and environmental factors in the Calcasieu River entering the Northern Gulf of Mexico in the southern United States. Only significant (p < 0.01) correlations are shown. Temp = Temperature, Q = Discharge, GH = Gage Height, Fluo = Fluorescence.
| Parameters | TP | DIP | Salinity | pH | Temp | DO | TSS | Q | GH | Fluo | Turbidity |
|---|---|---|---|---|---|---|---|---|---|---|---|
| TP | 1.00 | ||||||||||
| DIP | 1.00 | ||||||||||
| Salinity | 0.35 | 1.00 | |||||||||
| pH | 0.41 | 0.86 | 1.00 | ||||||||
| Temp | 0.33 | 0.48 | 1.00 | ||||||||
| DO | −0.34 | −0.30 | 0.30 | −0.76 | 1.00 | ||||||
| TSS | 0.27 | 0.50 | 0.42 | 1.00 | |||||||
| Q | 0.30 | −0.35 | 1.00 | ||||||||
| GH | 0.36 | 1.00 | |||||||||
| Fluo | 0.64 | 0.46 | 0.47 | 1.00 | |||||||
| Turbidity | 0.57 | 0.57 | 0.54 | 0.88 | 1.00 |
Table 4.
TP and DIP concentrations and ratios as well as dissolved organic carbon (DOC) and silicon to phosphorus ratios at six sampling sites along the Calcasieu, Mermentau, and Vermilion Rivers entering the Northern Gulf of Mexico in the southern United States. Tukey-Kramer’s adjustment was used to group sampling sites when ANOVA shows significant differences among sites. Means with the same superscript letter (a, b, or c) are not significantly different at the 0.05 level (Tukey groupings).
| River | Site | TP (mg L−1) | DIP (mg L−1) | DIP:TP | DOC:TP | DOC:DIP | Si:TP | Si:DIP |
|---|---|---|---|---|---|---|---|---|
| Calcasieu | Site 1 | 0.11 ± 0.06 a | 0.02 ± 0.01 a | 0.2 ± 0.2 a | 400 ± 300 | 2000 ± 1000 a | 100 ± 80 | 500 ± 200 a |
| Site 2 | 0.10 ± 0.05 a | 0.02 ± 0.01 a | 0.3 ± 0.2 a | 400 ± 300 | 2000 ± 1000 a | 100 ± 60 | 400 ± 200 a | |
| Site 3 | 0.10 ± 0.05 a | 0.03 ± 0.02 a | 0.3 ± 0.3 a,b | 400 ± 300 | 1300 ± 900 a,b | 80 ± 50 | 300 ± 300 a,b | |
| Site 4 | 0.11 ± 0.05 a | 0.04 ± 0.02 a | 0.3 ± 0.3 a,b | 400 ± 300 | 1200 ± 800 a,b | 70 ± 50 | 200 ± 200 b,c | |
| Site 5 | 0.10 ± 0.06 a | 0.05 ± 0.02 a | 0.3 ± 0.2 a,b | 400 ± 700 | 500 ± 300 b,c | 70 ± 60 | 100 ± 100 b,c | |
| Site 6 | 0.11 ± 0.07 a | 0.04 ± 0.01 a | 0.3 ± 0.3 a,b | 300 ± 500 | 400 ± 200 b,c | 80 ± 70 | 200 ± 100 b,c | |
| Mermentau | Site 7 | 0.3 ± 0.1 b | 0.11 ± 0.05 b | 0.4 ± 0.2 a,b | 200 ± 200 | 300 ± 100 b,c | 60 ± 50 | 130 ± 90 b,c |
| Vermilion | Site 8 | 0.40 ± 0.08 c | 0.22 ± 0.09 c | 0.5 ± 0.2 b | 60 ± 20 | 110 ± 40 c | 30 ± 20 | 70 ± 50 c |
Table 5.
Comparison between total phosphorus loading from 1990 to 2009 and from 2010 to 2017. Means followed by the same superscript letter (a or b) within a column for the same river are not significantly different at the 0.05 level, and vice versa. Only non-negative discharge data were used to calculate phosphorus flux and perform statistical analysis here. Data for 1990–2009 are from He and Xu [7]. TP concentration data used are all from LDEQ to keep the data source consistency. The sampling size used to calculate mean TP concentration for the Calcasieu, Mermentau, and Vermilion Rivers during 2010–2017 are 14, 53, and 78, respectively.
| River | Year | Discharge (m3 s−1) | TP Concentration (mg L−1) | TP Flux (t day−1) |
|---|---|---|---|---|
| Calcasieu (Kinder) | 1990–2009 | 72 ± 126 a | 0.079 ± 0.050 a | 0.51 ± 1.05 a |
| 2010–2017 | 43 ± 90 b | 0.16 ± 0.11 b | 0.48 ± 0.88 a | |
| Mermentau | 1990–2009 | 86 ± 105 a | 0.25 ± 0.13 a | 1.87 ± 2.41 a |
| 2010–2017 | 91 ± 134 a | 0.24 ± 0.090 a | 1.78 ± 2.62 a | |
| Vermilion | 1990–2009 | 32 ± 32 a | 0.35 ± 0.12 a | 1.02 ± 1.18 a |
| 2010–2017 | 41 ± 37 b | 0.36 ± 0.13 a | 1.34 ± 1.58 b |
Table 6.
Relationships between phosphorus concentrations and environment parameters from all six sampling sites in the Calcasieu River using backward stepwise linear regression. Slope and intercept estimates are presented with standard errors (±SE). Only statistically significant relationships are reported (p < 0.05). Variables left in the model are significant at the 0.05 level. T = temperature; Turb = turbility; DO = dissolved oxygen concentration; GH = gage height.
| Nutrient | Environmental Parameters | Final Equation | R2 | F Value | p |
|---|---|---|---|---|---|
| TP | Temperature | 33.63 | <0.0001 | ||
| Turbidity | 68.71 | <0.0001 | |||
| T + Turb | 0.50 | 46.41 | <0.0001 | ||
| DIP | pH | 40.17 | <0.0001 | ||
| DO | 24.87 | <0.0001 | |||
| Gage Height | 24.80 | <0.0001 | |||
| pH + DO + GH | 0.47 | 22.06 | <0.0001 |
© 2018 by the authors. Licensee MDPI, Basel, Switzerland. This article is an open access article distributed under the terms and conditions of the Creative Commons Attribution (CC BY) license (http://creativecommons.org/licenses/by/4.0/).
Share and Cite
MDPI and ACS Style
He, S.; Xu, Y.J. Phosphorus Fluxes from Three Coastal Watersheds under Varied Agriculture Intensities to the Northern Gulf of Mexico. Water 2018, 10, 816. https://doi.org/10.3390/w10060816
AMA Style
He S, Xu YJ. Phosphorus Fluxes from Three Coastal Watersheds under Varied Agriculture Intensities to the Northern Gulf of Mexico. Water. 2018; 10(6):816. https://doi.org/10.3390/w10060816
Chicago/Turabian StyleHe, Songjie, and Y. Jun Xu. 2018. "Phosphorus Fluxes from Three Coastal Watersheds under Varied Agriculture Intensities to the Northern Gulf of Mexico" Water 10, no. 6: 816. https://doi.org/10.3390/w10060816
Note that from the first issue of 2016, this journal uses article numbers instead of page numbers. See further details here.