Variability of Short-Term Diel Water Temperature Amplitudes in a Mountain Lake

1
Department of Hydrology and Water Management, Adam Mickiewicz University, Krygowskiego 10, 61-680 Poznań, Poland
2
Faculty of Food Sciences and Fisheries, West Pomeranian University of Technology in Szczecin, Pawła VI 3, 71-459 Szczecin, Poland
*
Author to whom correspondence should be addressed.
Water 2018, 10(6), 795; https://doi.org/10.3390/w10060795
Submission received: 10 May 2018
/
Revised: 7 June 2018
/
Accepted: 12 June 2018
/
Published: 15 June 2018
(This article belongs to the Section Hydrology)
Abstract
:This paper presents an analysis of the variability of short-term water temperature amplitudes in Lake Morskie Oko, situated in the Tatra Mountains National Park, which makes the human impact on the lake very limited. The objective of the study was to determine to what extent an increase in depth contributes to suppressing daily water temperature amplitudes. It was shown, among other things, that water temperature amplitudes were the lowest in the period of occurrence of the ice cover, higher in the period of occurrence of other (than ice cover) ice phenomena, and the highest in the case of their lack. The analysis of profiles of water temperature amplitudes (in the case of lack of ice phenomena) resulted in determination of their six types. A strong correlation was observed in which the effect of mean daily air temperature and the effect of wind on water level amplitudes are considerably lower during the occurrence of ice phenomena in comparison to the period when the water surface is free from such phenomena. It was demonstrated that the near-bottom waters in Lake Morskie Oko are very stable in terms of temperature. The short transition period from ice cover to free water surface was determined to be very important, because it constitutes a threshold in the effect of air temperature and wind on changes in thermal dynamics of water (in this case expressed in amplitude values). Finally, proposals are presented for future expansion of the scope of research on water temperature amplitudes. This work is important, because the amplitudes were investigated not only at the surface of the lake, but also at its bottom, and also during the ice cover period, when the lake was isolated from the atmospheric influences. This study may contribute to better understanding of the lake water temperature responses to climate change and thus to more accurate prediction these patterns in lake globally. Moreover, understanding of changes in water temperature is closely related to the variability of its heat resources, and these in the future may be used on a large scale. In the case of a mountain lake such as Morskie Oko, the heat of water may be used, for example, for heating tourist shelters.
1. Introduction
Research on water temperature in lakes is usually performed in lake surface water [1,2,3] or in a given vertical profile [4,5,6,7,8], once or several times, e.g., in various seasons of the year or in subsequent years. Such a procedure does not allow the determination of the range of amplitudes in short time intervals. Therefore, research of the type represents a statistical approach to thermal dynamics. Recording amplitudes provides the dynamic approach. The application of thermal probes in recent years has permitted the collection of very abundant data sets, from any depth as well as from any short time interval. The determination of temperature instability is an expression of the circulation movement of waters, and indicates their scale and frequency of occurrence. This concerns both under-ice circulation and that occurring in waters free from ice phenomena. Hundreds of examples of papers on classic temperature measurements, i.e., in vertical profile (single or repeated) exist. Such measurements have been performed in all climatic zones, as was already pointed out in 1957 by Hutchinson [9]. The recorded amplitudes usually concern those possible to determine based on several measurements—at long time intervals (e.g., several times in a year, or from single measurements in a day). There are many key papers on short-term (diurnal/diel) fluctuations in surface and epilimnetic temperature of lakes, such as those, for example, by Frempong [10], Houser [11], Wilhelm et al. [12], Woolway et al. [13,14,15]. Other studies include the paper concerning amplitudes of a short time interval in Lake Baikal [16], the paper by Choiński and Kanikowski [17] presenting suppression of water temperature amplitudes with depth (Lake Zamkowe in North Poland with a max. depth of 36.5 m), or the paper by Łyczkowska [18]. In the latter, the analysis of short-term water temperature amplitudes permitted the detection of anomalies probably resulting from the descent of avalanches to the surface of the ice cover. This probably results from the fact that probes automatically recording data have only been applied for a relatively short time. In recent years, there have been numerous studies focusing on thermal conditions [19,20], ice phenomena [21,22,23,24,25,26], water chemistry and sediments [27,28] of lakes in different parts of the world. This direction of research has also been carried out in relation to Lake Morskie Oko in Poland [29,30,31,32,33,34]. The paper by Skowron [35] is also interesting. It analyzes changes in water temperature amplitudes between the surface and bottom for several lakes in North Poland for terms of several days each. The author detected a number of pulsations at various depths. Studies of the diel/diurnal cycle is important because knowledge of the diel temperature cycle is important to determine whether the predominance of day-time measurements (surface or depth resolved) in the past has biased limnological understanding. Also, this research is important, because it takes into account fluctuations of the temperature within the water column, particularly during the ice-covered period, when the impact of the atmosphere is completely eliminated. In addition to the determination of the dynamics of waters, temperature amplitudes indirectly show changes in heat resources. This can be of practical importance, e.g., in balancing heat energy obtained from waters of mountain lakes for mountain shelters. Examples of the latest studies on these problems include papers of Haberman et al. [36], Choiński et al. [37] and Choiński et al. [38]. Studies on ice may also be useful in hydrobiological research. An example of this is the work by Öterler [39], in which the correlation between dominant organisms and ice thickness was analyzed. The selection of Lake Morskie Oko for the following analysis was based on the following factors:
- -
- exceptionally high depth (max. 51.8 m, mean 28.4 m), for such a small lake area;
- -
- the only Polish mountain lake easily accessible in winter;
- -
- exceptionally long persistence of the ice cover at this latitude;
- -
- no surface alimentation in winter; this determined certain stabilization of the water masses under the ice; lack of this component of alimentation permits potential detection of other factors affecting under-ice circulation.
The objective of the paper was to determine the degree to which an increase in depth contributes to the suppression of daily temperature amplitudes, and therefore the effect of external conditions determining them. The presented study, although it refers to a relatively small mountain lake, may also serve as an example for research on the water temperature changes of large lakes in different parts of the world. Consequently, we think that it would contribute to a better understanding of global lake surface water temperature trends, as presented for example by Schneider and Hook [40], O’Reilly et al. [41] and Woolway and Merchant [42]. It has to be noted that such studies may provide valuable information on changes of ice cover and ice phenomena on lakes, and therefore on the predicted climate fluctuations. The knowledge gained in this study on the diel temperature range may also provide supplementary data to the satellite measurements.
2. Material and Methods
Lake Morskie Oko is located in the Tatra Mountains on their northern side in the territory of Poland. The water surface is located at an altitude of 1395 m a.s.l. The lake’s surface area slightly exceeds 30 ha, and its maximum depth is 50 m. Morskie Oko is a tarn confined to a moraine rampart to the north, where a tourist shelter is located. It is the only Polish mountain lake that has been subject to measurements of water temperature, ice phenomena, and water stages by the Institute of Meteorology and Water Management for several decades. It should be explained that the term “ice phenomena” refers to any presence of ice in water, for example frazil ice, floating ice, etc., while the ice cover is only one of the types of ice phenomenon. No mountain lakes occur in Poland outside national parks. Therefore, in contrast to lakes exposed to human activity, as for example those with riparian deforestation [43] or urban lakes influenced by forest regrowth [44], isolated from the human impact, Lake Morskie Oko provides unique conditions for studies on the thermal regime of lake water. It has to be noted, studies on Lake Morskie Oko is connected with the threat of avalanches originating from the surrounding mountain slopes. Water temperatures were measured by a probe installed in Lake Morskie Oko produced in 2006 by A-STER (Cracow, Poland). It was located at λ = 20°04′ E and φ = 49°12′ N, above the place where the depth reaches 50 m. Wires with temperature sensors were mounted to a device maintained on the water surface by means of a float. They were located at depths of: 1 m, 5 m, 10 m, 20 m, and 50 m. The accuracy of the temperature records amounted to 0.1 °C. The measurements were performed every 10 min. Recording water temperature with the application of a gradient thermal probe, especially with such a high temporal measurement frequency, permitted the exclusion of the randomness resulting from one temperature measurement per day. Over several years of the functioning of the probe (2006–2010), it was subject to a high number of failures (e.g., avalanches, ice phenomena, intensive wave action, power cuts, etc.). The following analyses covered the year 2007, because in that year only one break in recording data occurred, from 1 to 13 January. In the above case, more than 250 thousand records of the probe were collected. The obtained data permitted tracing changes of mean daily water temperatures at particular depths in the annual cycle. They were calculated as arithmetic means from 144 measurements at a given point during a day. Moreover, daily amplitudes of temperatures were determined at particular depths. They constituted output data for investigation of the range of suppression of temperature amplitudes with depth. Due to the applied measurement methodology, it was also possible to trace changes in water temperatures under the ice cover. Air temperature and mean daily wind velocity were adopted as external factors potentially contributing to the variability of water temperatures in Lake Morskie Oko in the vertical profile. Both of the parameters are measurement data obtained from the meteorological station of the Institute of Meteorology and Water Management. It is located only several tens of meters from the shore of Morskie Oko, and approximately 20 m above its surface.
The statistical analysis of water temperature amplitudes at particular depths showed deviations from normal distribution of variables (p < 0.5 in Kołmogorow-Smirnow, Lilliefors, and chi-square tests). Therefore, the significance of difference between particular levels was analyzed by means of a non-parametric Kruskal-Wallis ANOVA test and Dunn test, and correlations between them were analyzed by means of the Spearman’s coefficient of rank correlation. In both of the cases, the adopted probability level amounted to p = 0.05.
The assessment of a decrease in the oscillation value, and therefore the suppression of water temperature amplitudes with depth involved the distribution fitting analysis, and determination of parameters of distribution best corresponding with the analyzed variable at particular depths. The determination of the correlation between air temperature, wind velocity, and water temperature amplitude in Lake Morskie Oko at a level of 1 m involved the application of the Spearman’ rank correlation analysis.
3. Results
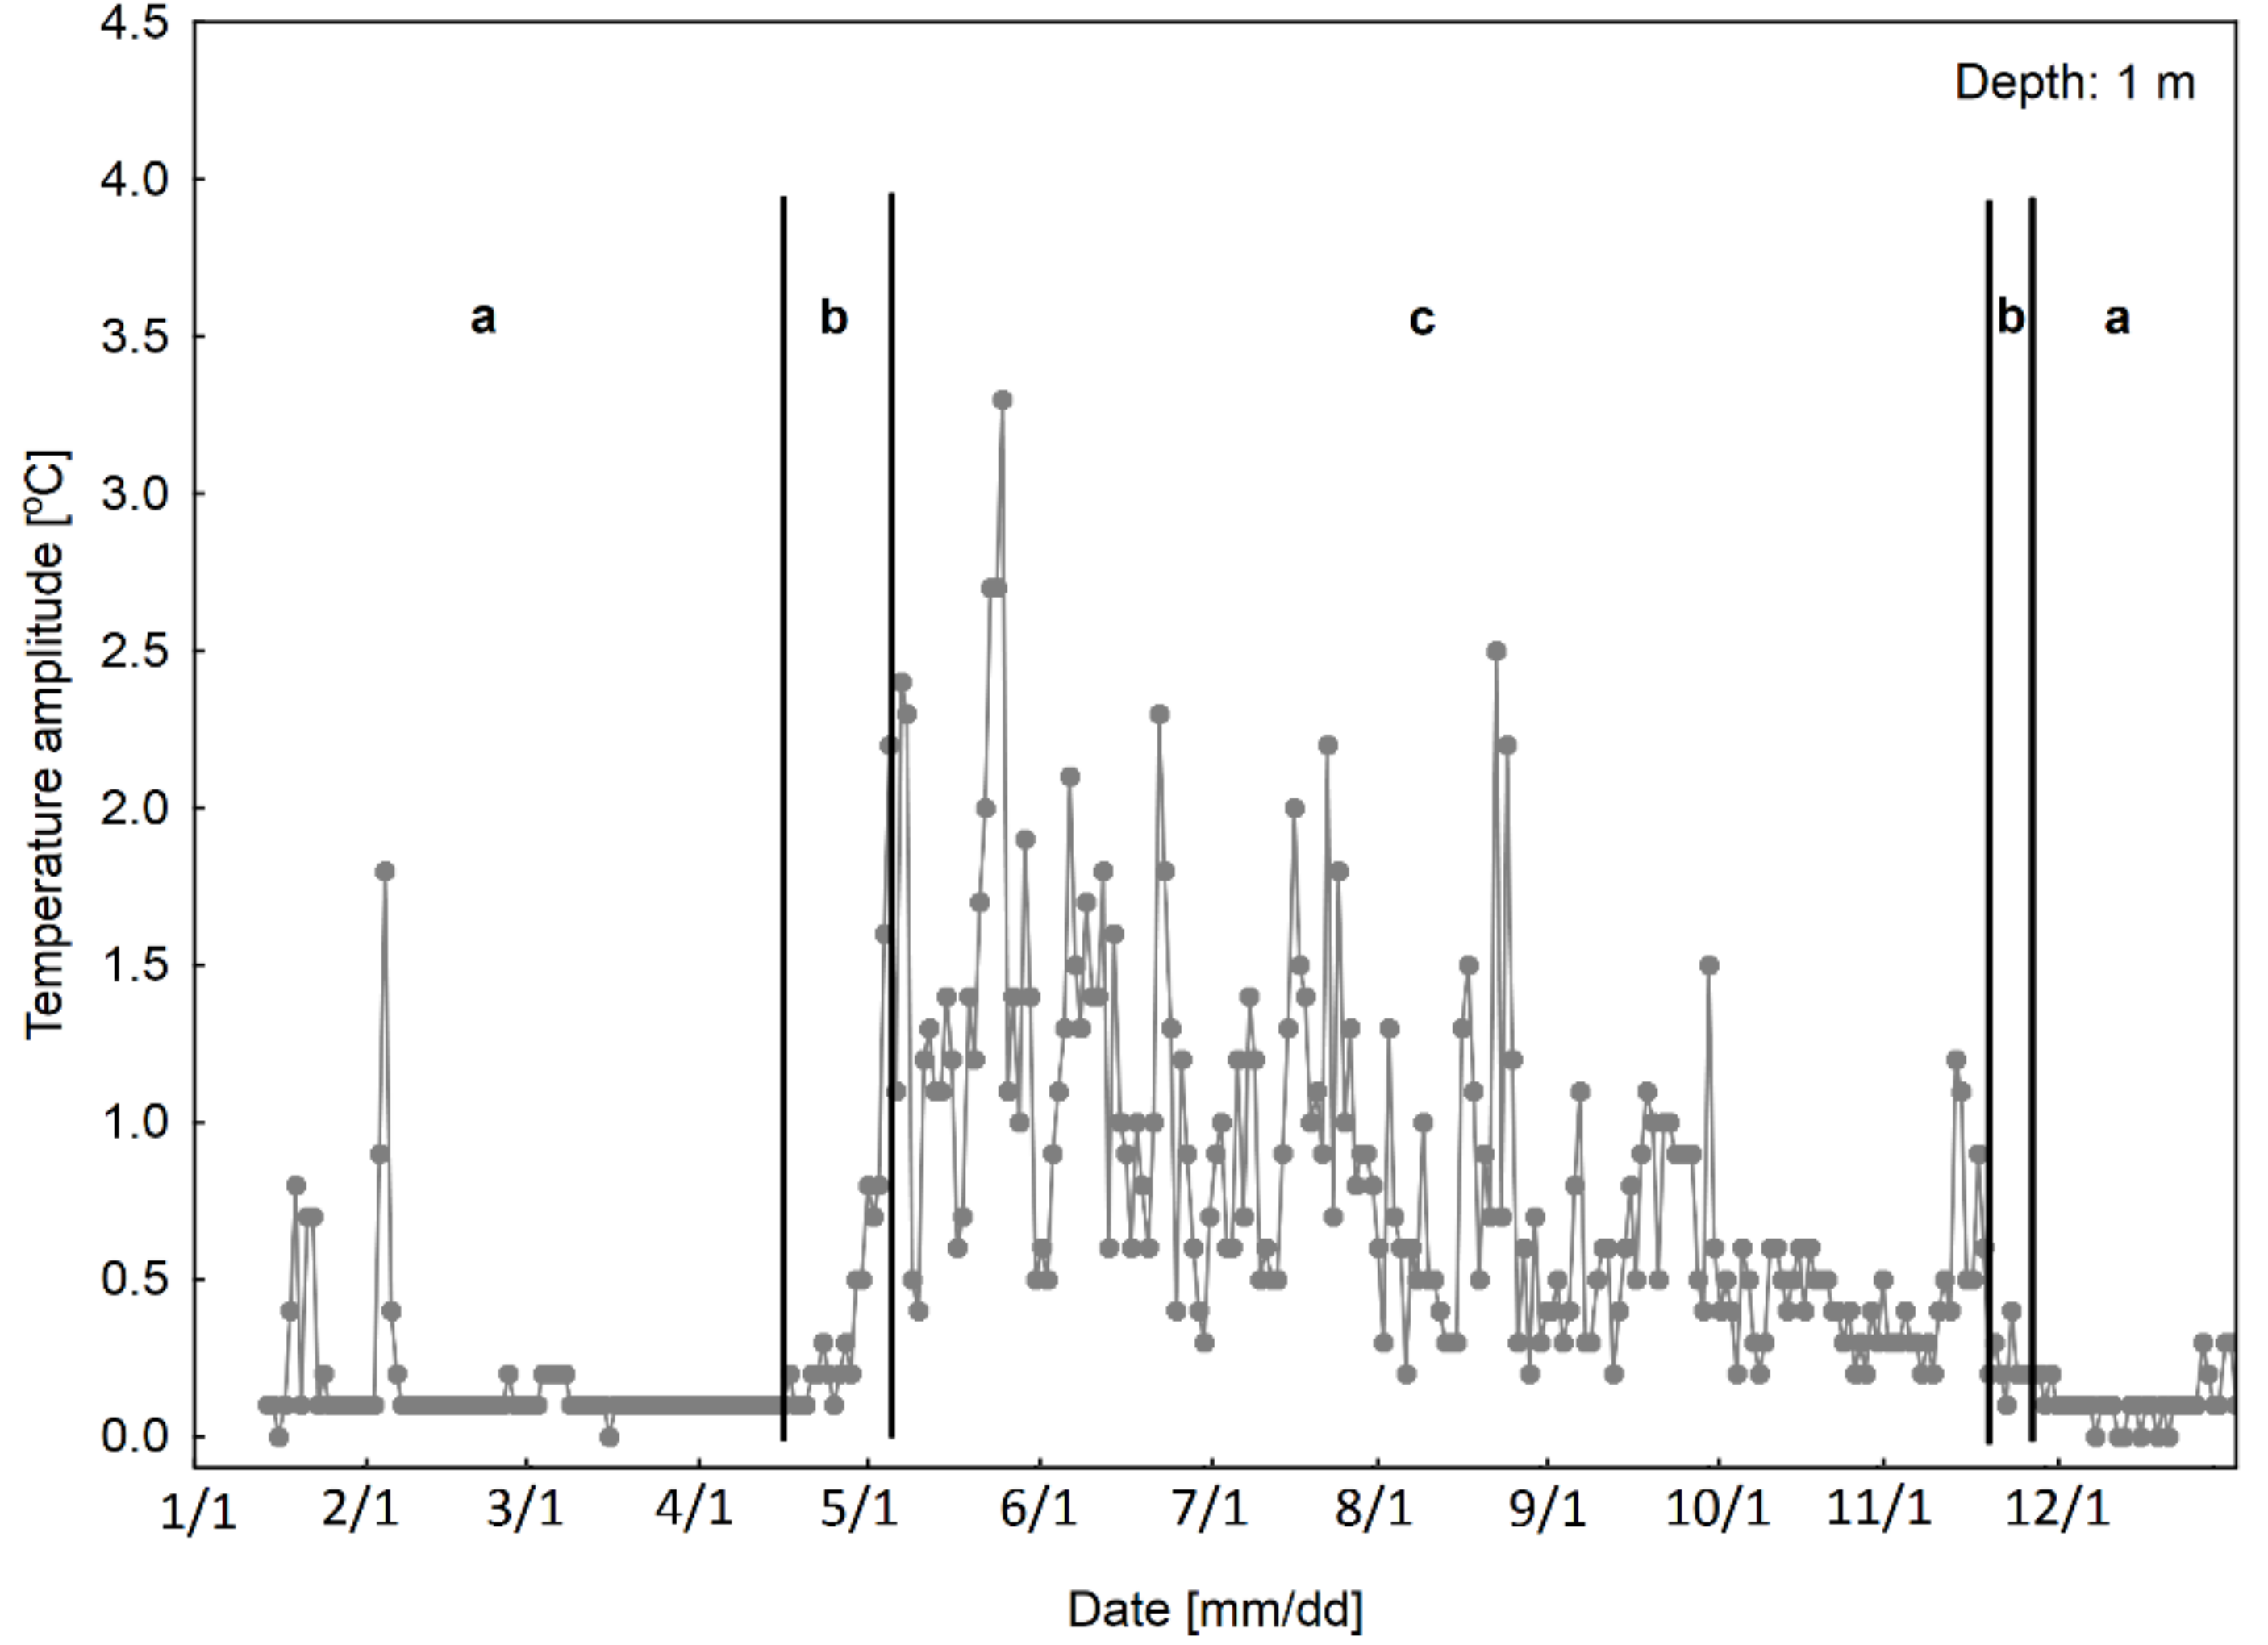
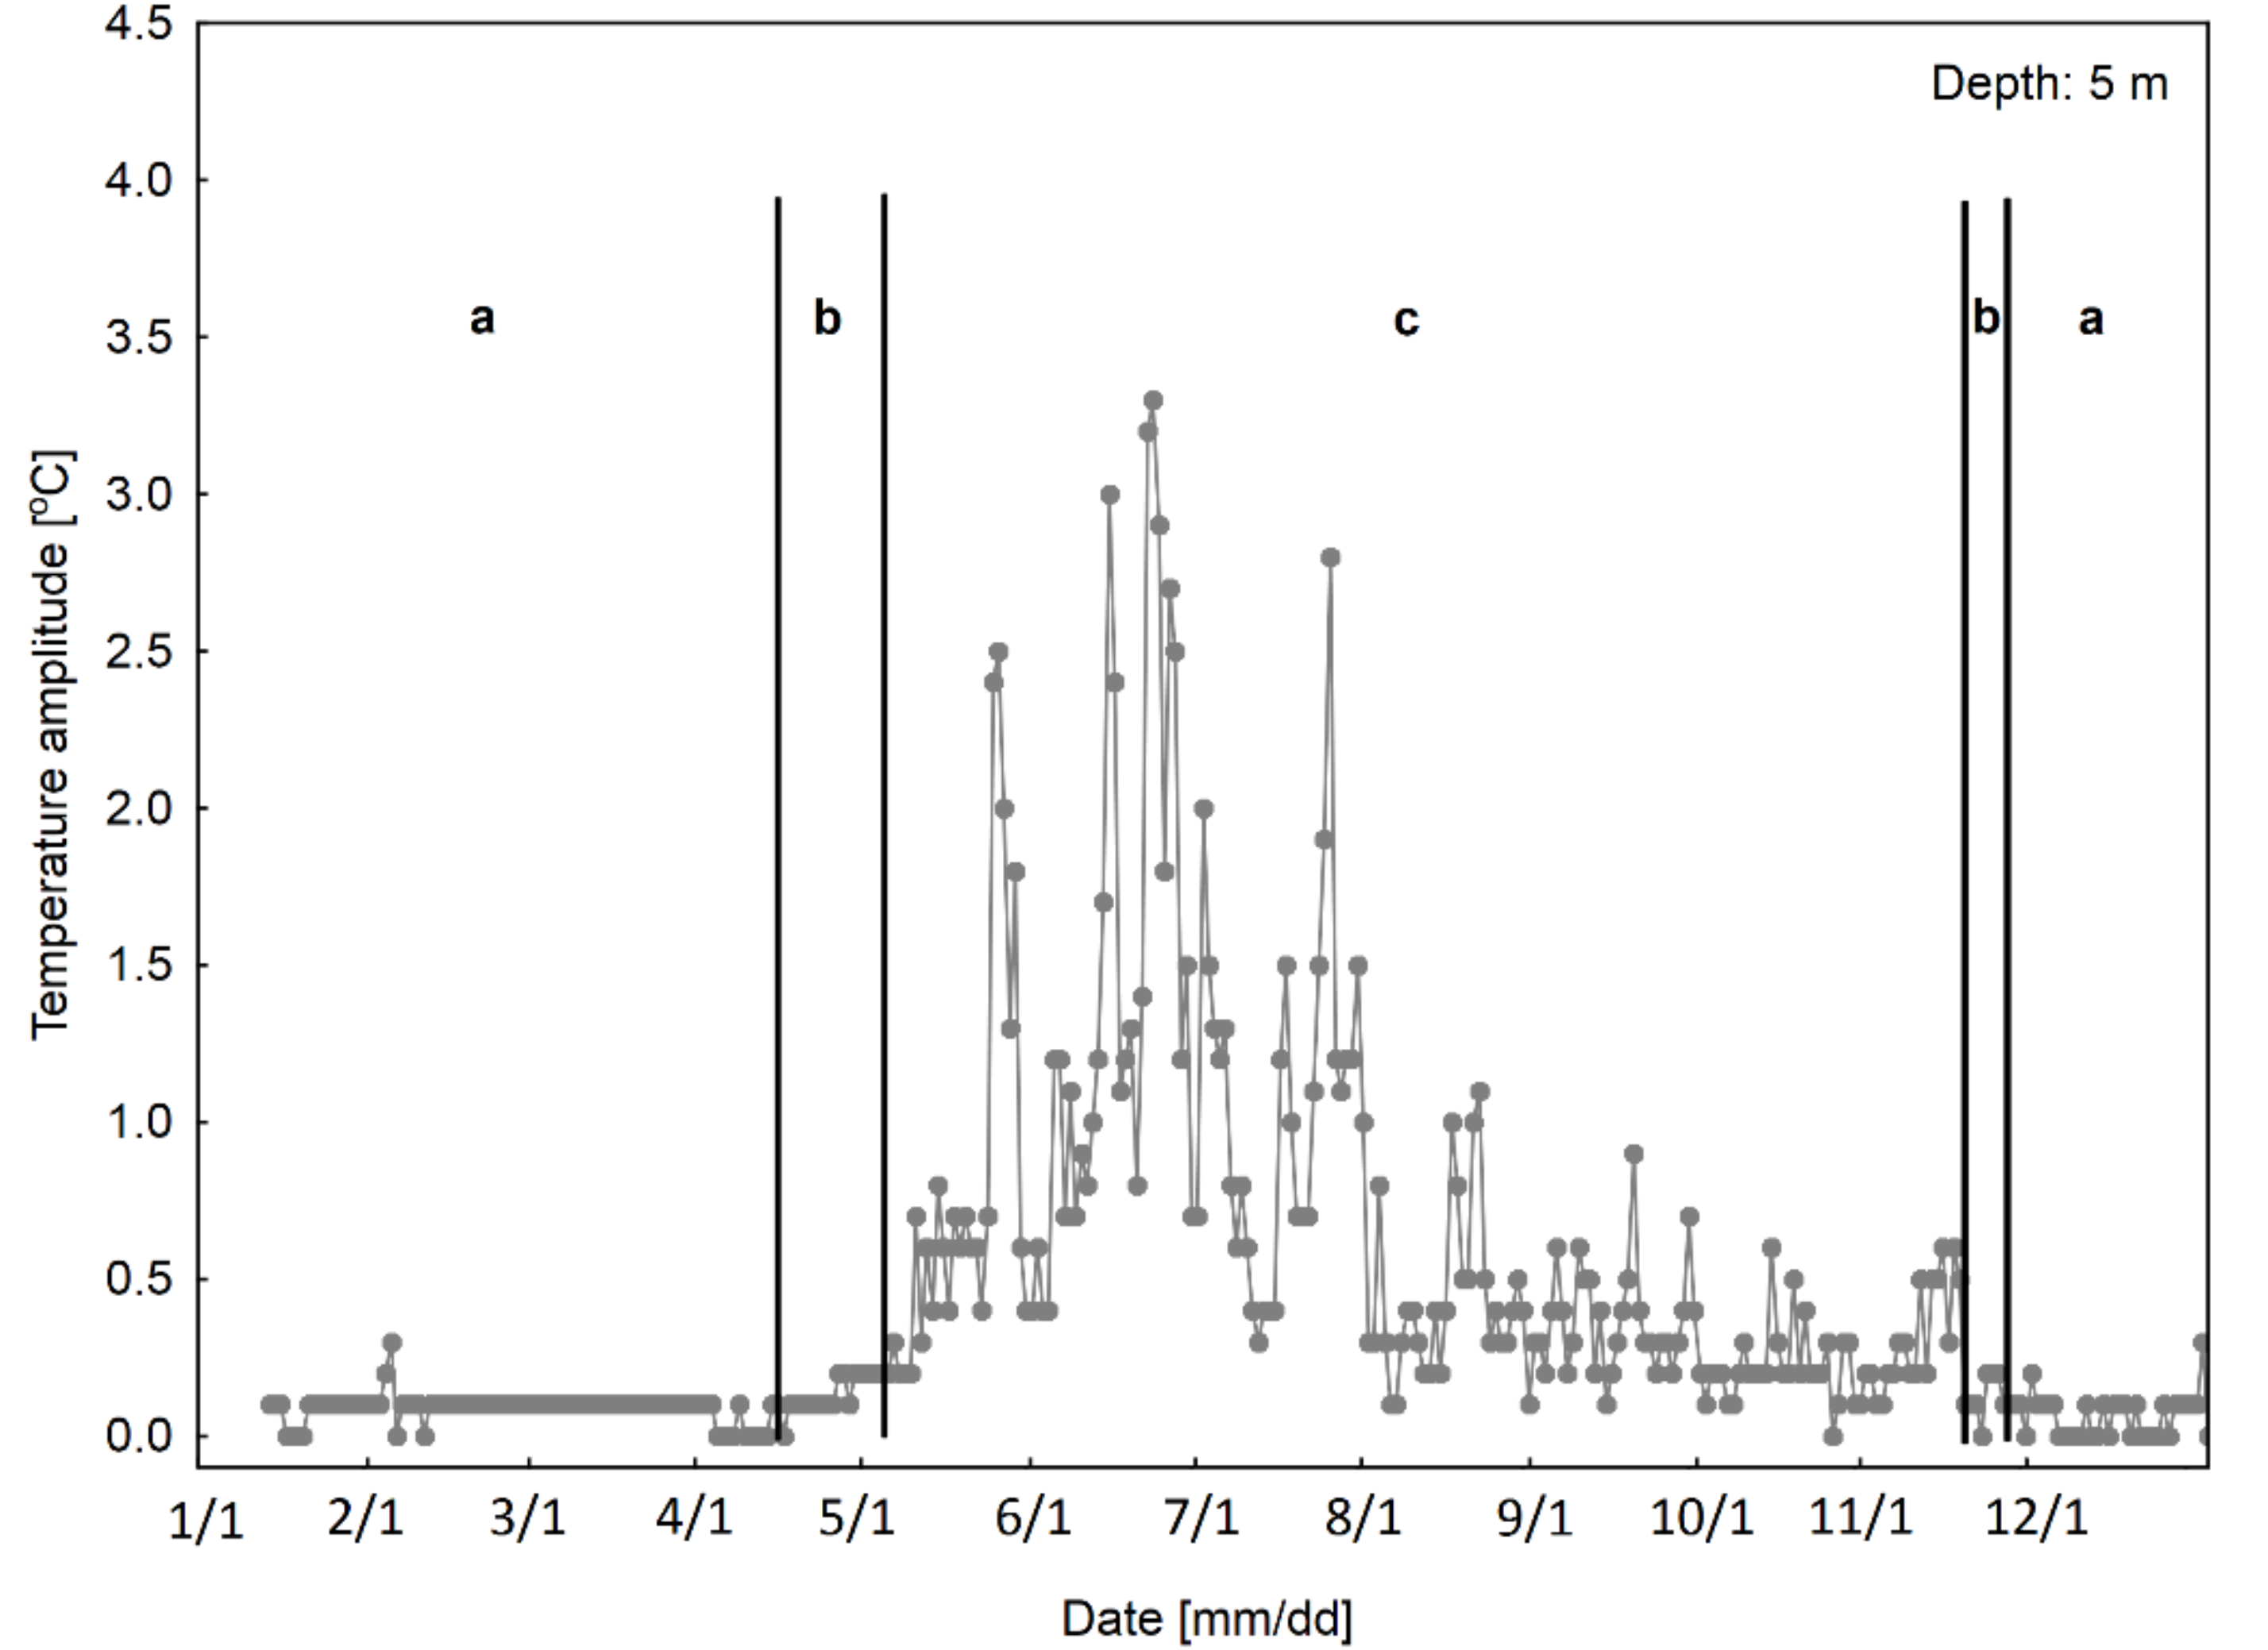
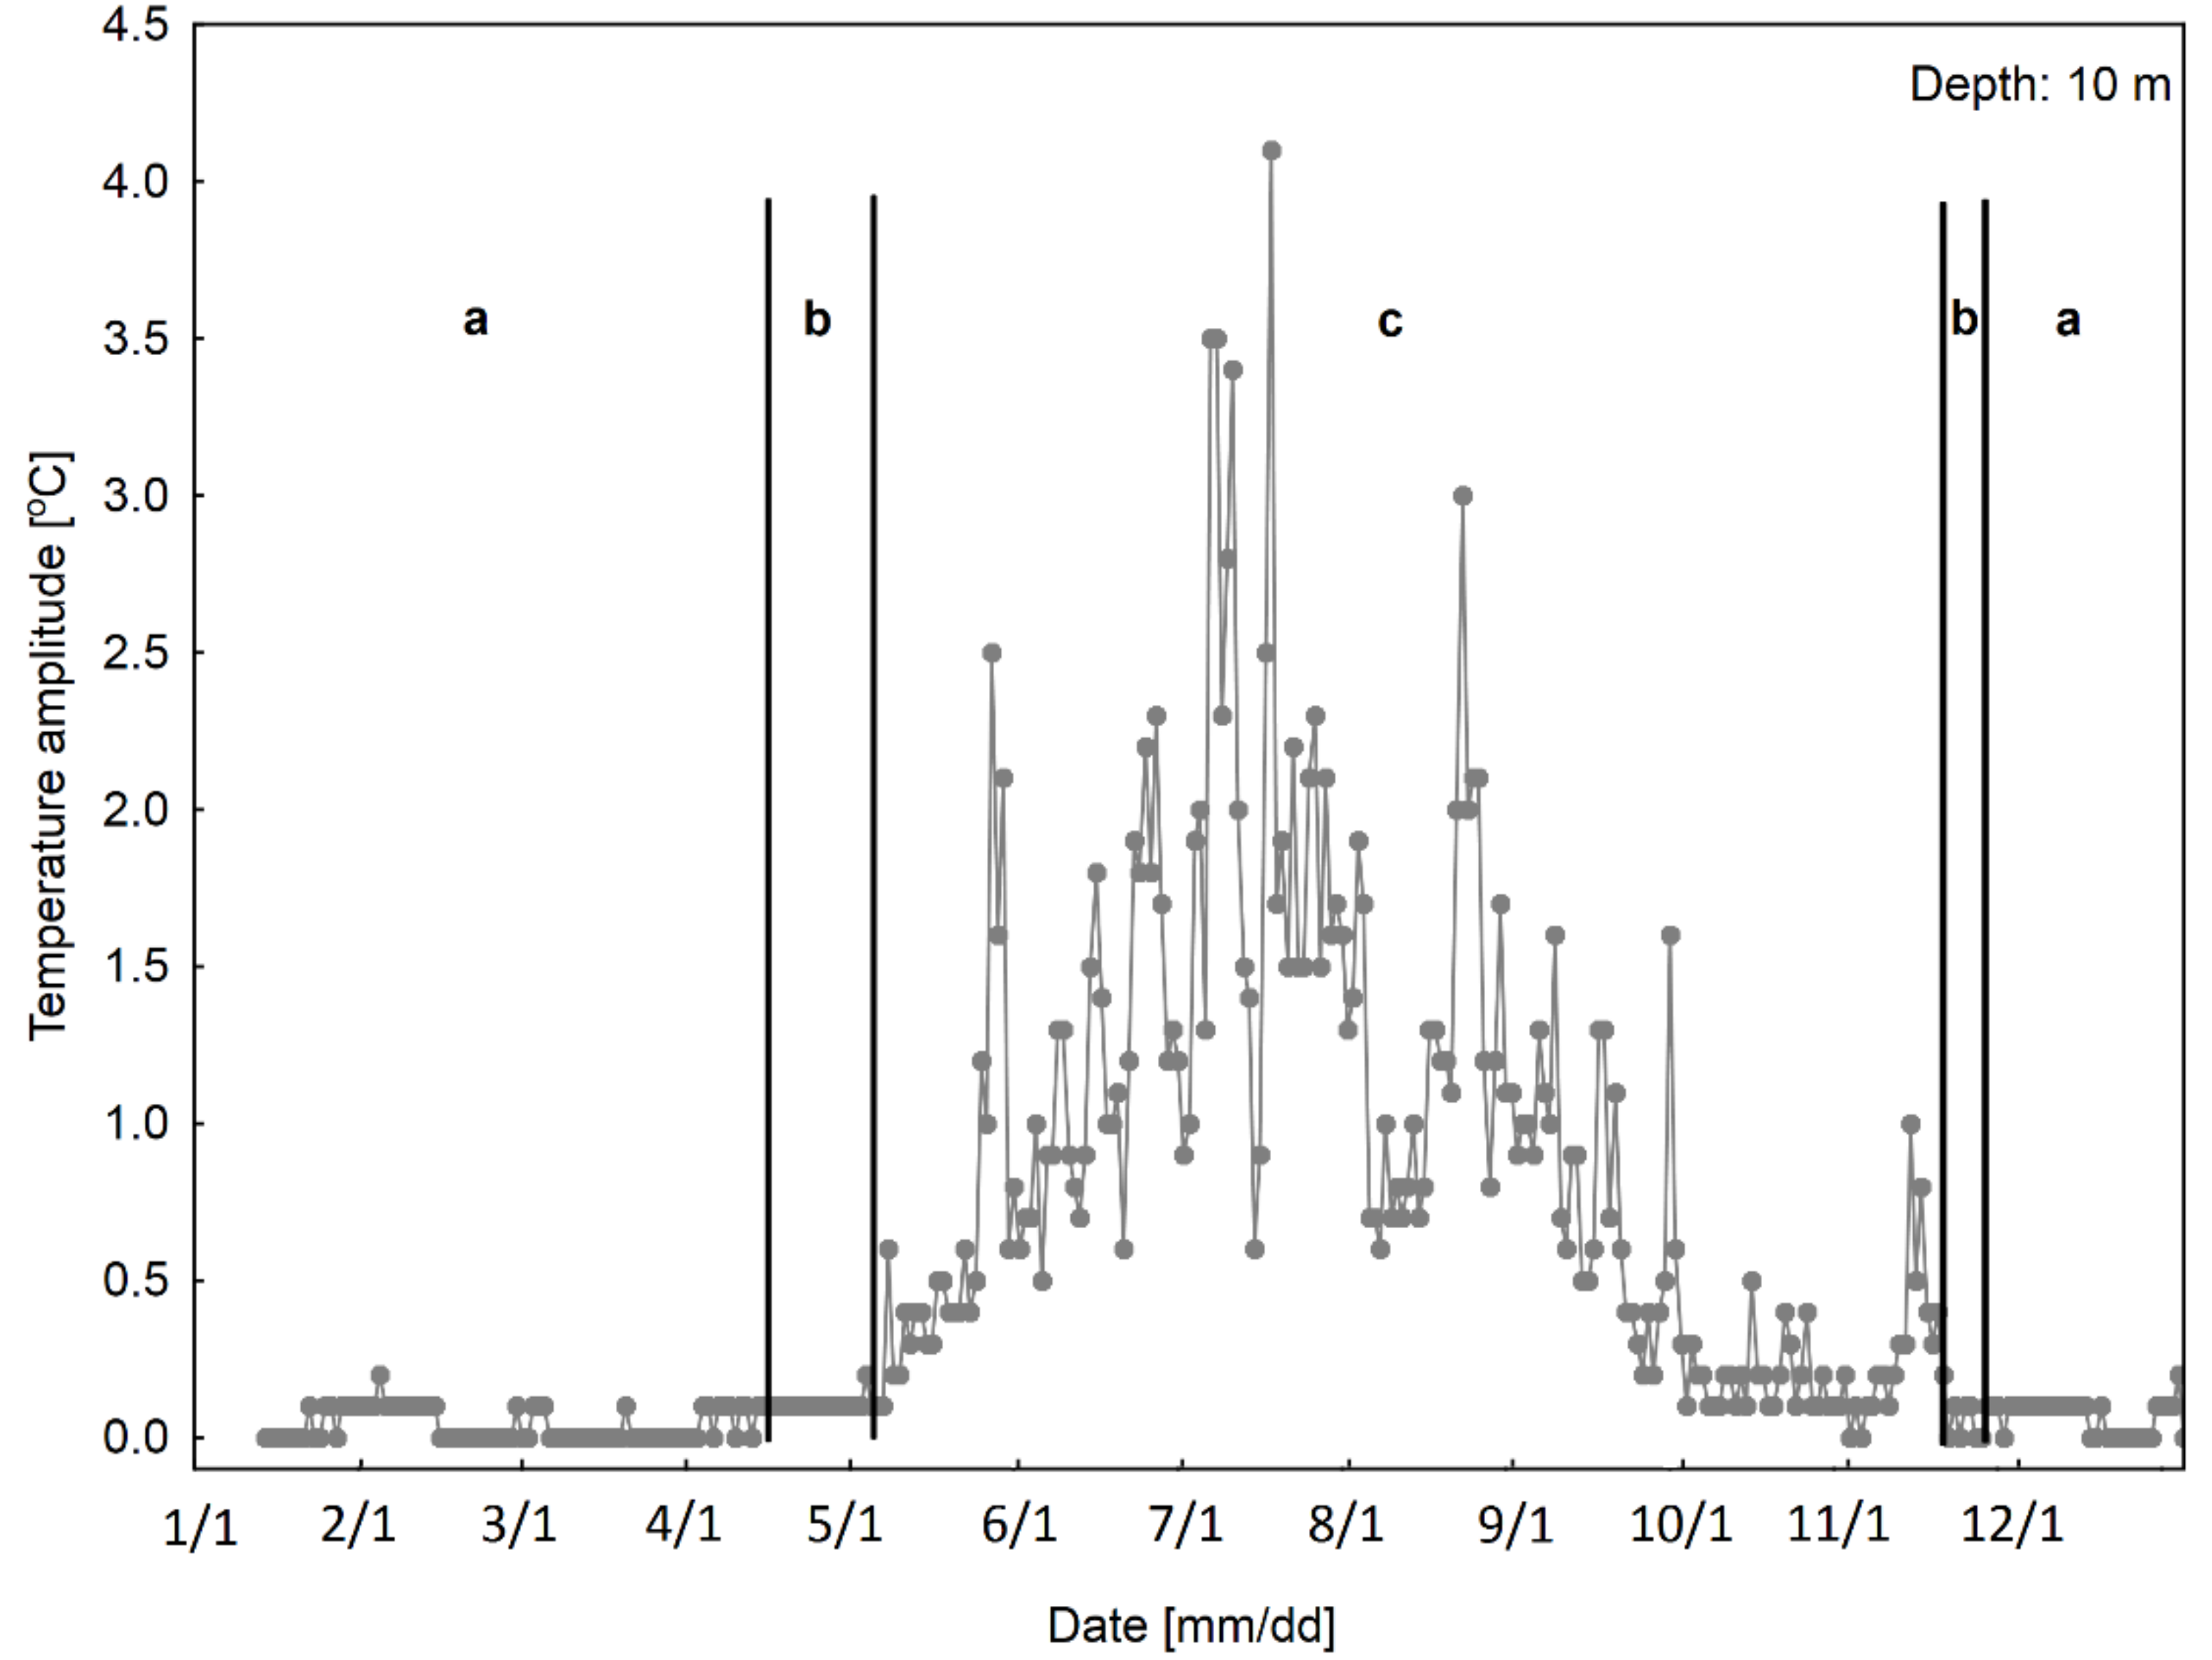
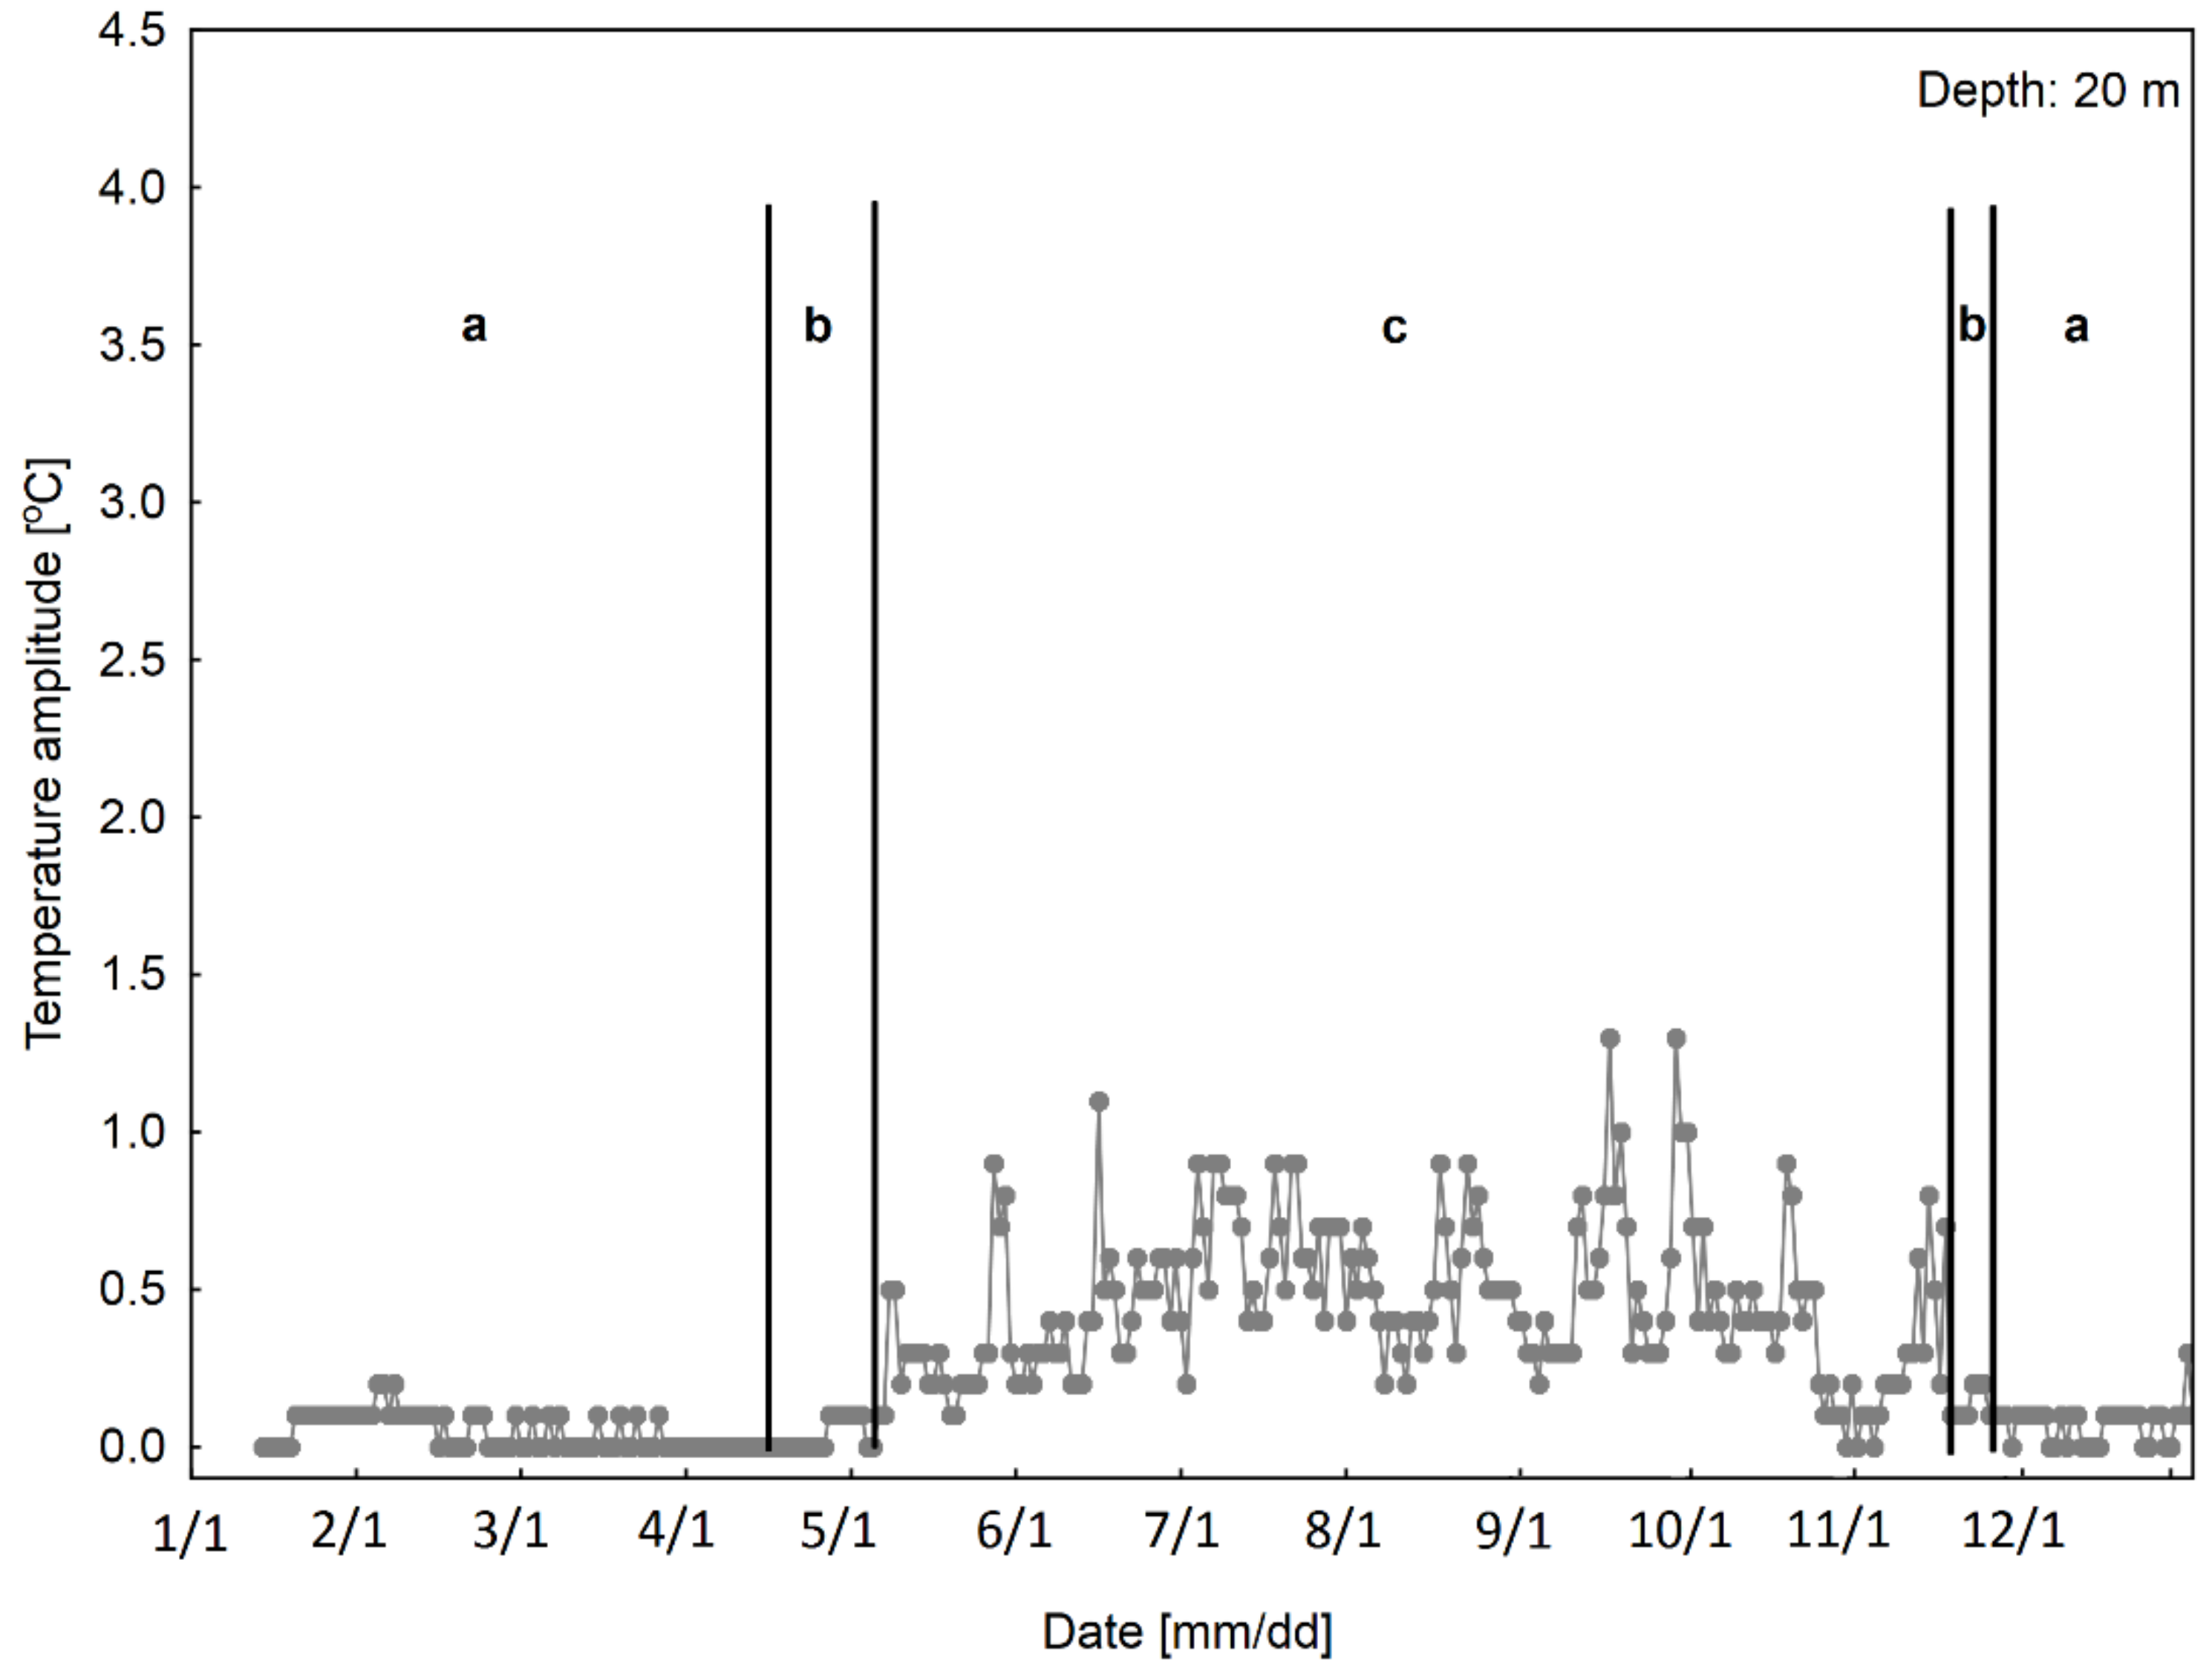
The course of daily temperature amplitudes in the study period is presented in Figure 1, Figure 2, Figure 3, Figure 4 and Figure 5.
The obtained data on water temperature were divided into three subsets due to differences in the dynamics of changes (Figure 6, Figure 7, Figure 8, Figure 9, Figure 10 and Figure 11), i.e.,
- a
- measurements in the presence of compact ice cover (14 January–15 April and 19 November–31 December 2007),
- b
- measurements during the occurrence of ice phenomena other than ice cover (16 April–5 May and 15 November–18 November 2007),
- c
- measurements when the water surface was free from any ice phenomena (6 May–14 November 2007).
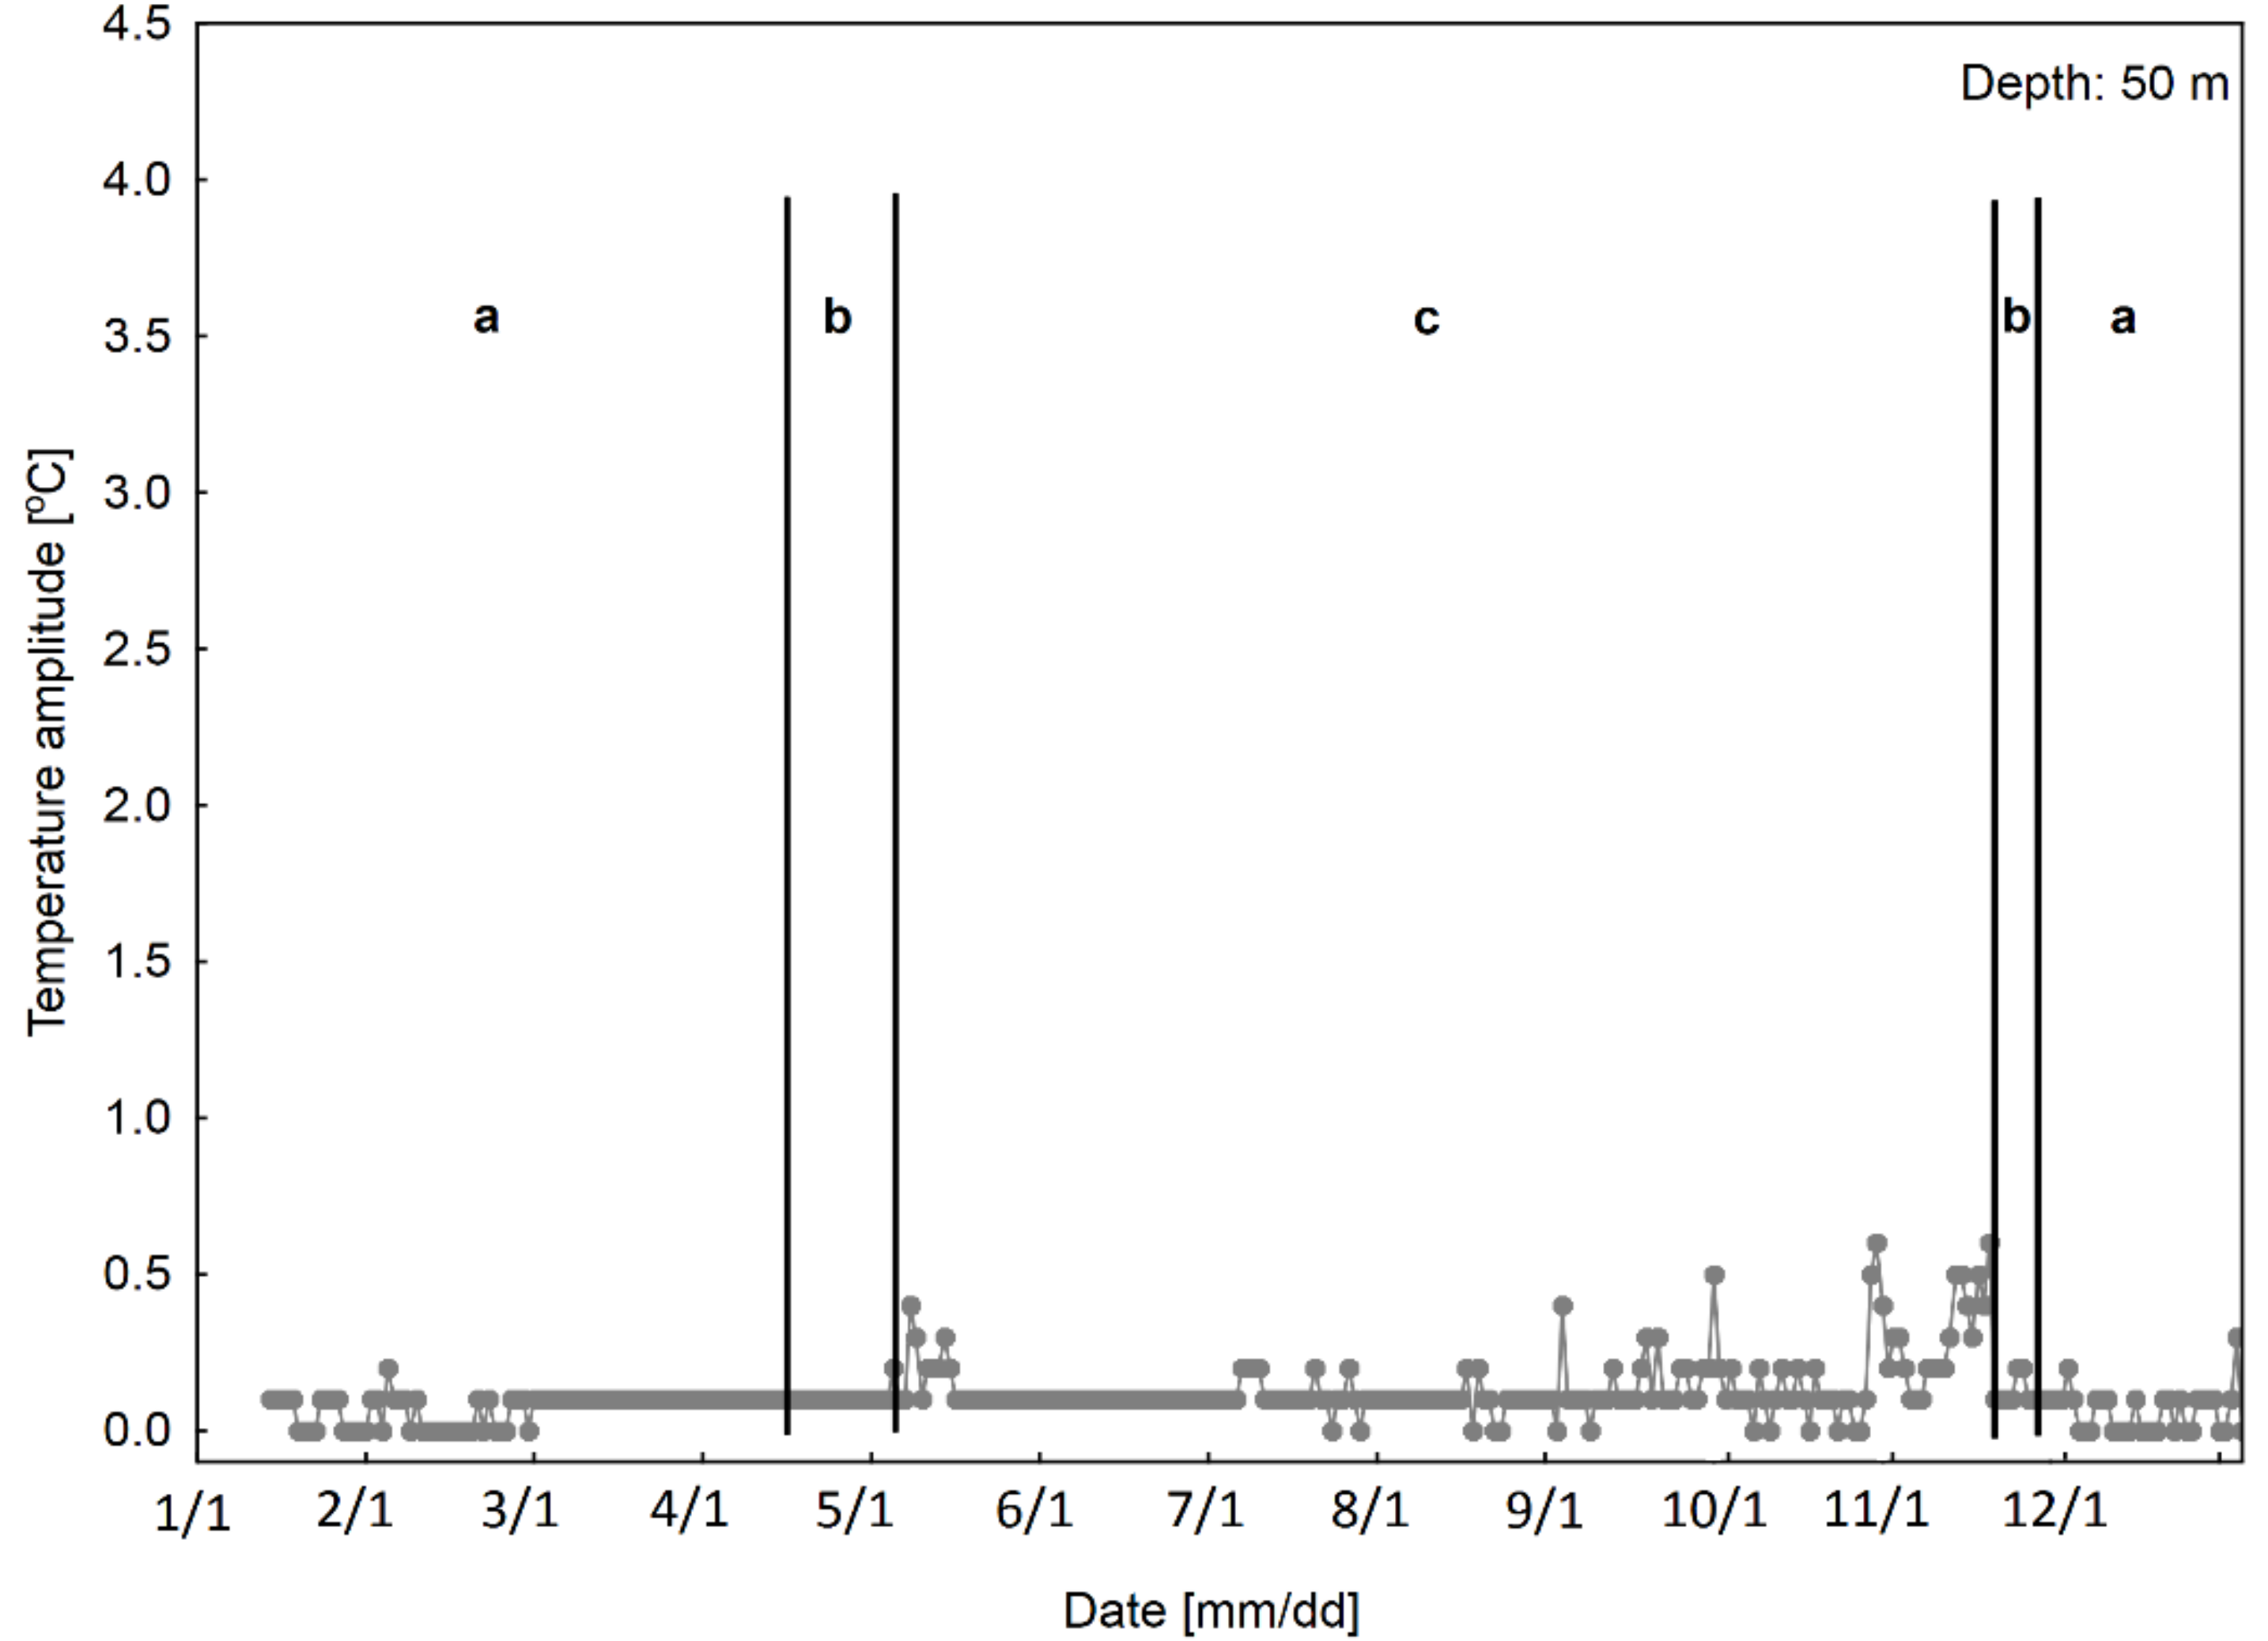
The Kruskal-Wallis test and the Dunn test (Table 1) showed the occurrence of statistically significant differences between all of the three analyzed terms at depths of 1 m and 10 m, whereas the temperature amplitudes were the lowest in the presence of the ice cover, higher for ice phenomena, and the lowest in the case of free water surface. An analogous tendency was observed at the remaining levels, whereas at depths of 5 m and 20 m, significant differences were only obtained between the period of lack of ice cover/ice phenomena and the period with ice phenomena or ice cover. At the deepest level of 50 m, temperature amplitudes in the presence of ice cover were statistically lower than in the case of ice phenomena or their lack.
The Spearman’s analysis of rank correlations between water temperature amplitudes at particular depths (Table 2) showed that they were the lowest in the presence of ice cover (Spearman’s R of approximately 0.2–0.3). A statistically significant correlation was obtained between the neighboring levels of 1 m and 5 m, and between more distant levels: 1 m–20 m, 5 m–20 m, 1 m–50 m, and 5 m–50 m. Water temperatures at a depth of 10 m showed statistically significant correlations only with the measurements from a depth of 20 m. The deepest level of 50 m showed a statistically significant, although weak correlation with shallower levels: 1 m and 5 m.
Higher Spearman’s rank correlation coefficients were obtained for the period with no ice cover or ice phenomena. The strongest correlations were observed between the neighboring levels (1 m–5 m, 5 m–10 m, 10 m–20 m, Spearman’s R of approximately 0.6–0.7). Only temperature amplitudes at the greatest depth (level 50 m) did not significantly correlate with the remaining levels with the exception of measurements from a depth of 10 m (Spearman’s R = −0.20). An inverse correlation was observed between them.
The highest values of Spearman’s rank correlation coefficients were obtained in the case of occurrence of ice phenomena, and particularly between the shallowest levels 1 m and 5 m (R = 0.74). The distinctness of levels 20 m and 50 m is characteristic here. They show no mutual correlation, but a statistically significant correlation was determined between them and the shallower neighboring levels (R = 0.48 ÷ 0.67).
The analysis of distribution fitting to temperature amplitudes at particular depths showed that empirical distributions are the best described with a theoretical (Gumbel’s) distribution of extreme values. Its probability density function is as follows:
where:
- a—threshold (location) parameter;
- b—scale parameter;
- e—basis of natural logarithm.
The obtained results (Table 3) showed that temperature amplitudes at particular depths were distinguished by the lowest values (threshold parameter) and the lowest variability (scale parameter) in the period of occurrence of ice cover. During the occurrence of ice phenomena, both of the parameters were somewhat higher, and showed a decreasing tendency with depth. In the case of lack of ice cover/ice phenomena, the values of parameters a and b were considerably higher than for the remaining periods for levels 1–20 m, and low in the case of the highest depth (50 m). The decreasing tendency of values and variability of temperature amplitudes was disturbed at a depth of 10 m, where high values of parameters of extreme values distribution were recorded.
The analysis of profiles of temperature amplitudes during no occurrence of ice phenomena permitted distinguishing its six types:
- -
- type 1 (Figure 6): fast decrease in temperature amplitudes with depth (06–08 V; 10–16 V; 20–24 V; 30 V; 12 VI; 20–25 IX; 16 X, 25 X; 29 X; 02–04 XI; 08XI; 12 XI);
- -
- type 2 (Figure 7): high value of water temperature amplitudes at a depth of 20 m (09 V; 12–14 IX; 06–17 IX; 19 IX; 27 IX; 29–30 IX; 01–08 X; 05–12 X; 17–24 X);
- -
- type 3 (Figure 8): high value of temperature amplitudes at a depth of 5 m (26 V; 13 VI; 15–29 VI; 02 VII; 25 VII; 13 X; 05 XI);
- -
- type 4 (Figure 9): high value of temperature amplitudes at a depth of 10 m (27–29 V; 02–04 VI; 07–09 VI; 30 VI – 21VII; 23–24 VII; 26 VII–01 VIII; 05 VIII–11 IX; 15 IX; 18 IX; 26 IX; 28 IX; 14–15 X; 11 XI; 13 XI);
- -
- type 5 (Figure 10): even temperature amplitude at levels 1 m and 5 m, followed by a decrease in amplitudes (18 V; 25 V; 05–06 V; 10–11 VI; 14 VI; 22 VII; 06 XI, 9 XI);
- -
- type 6 (Figure 11): high value of temperature amplitudes at a depth of 50 m (26–28 X; 30–31 X; 01 XI; 07 XI; 10 XI).
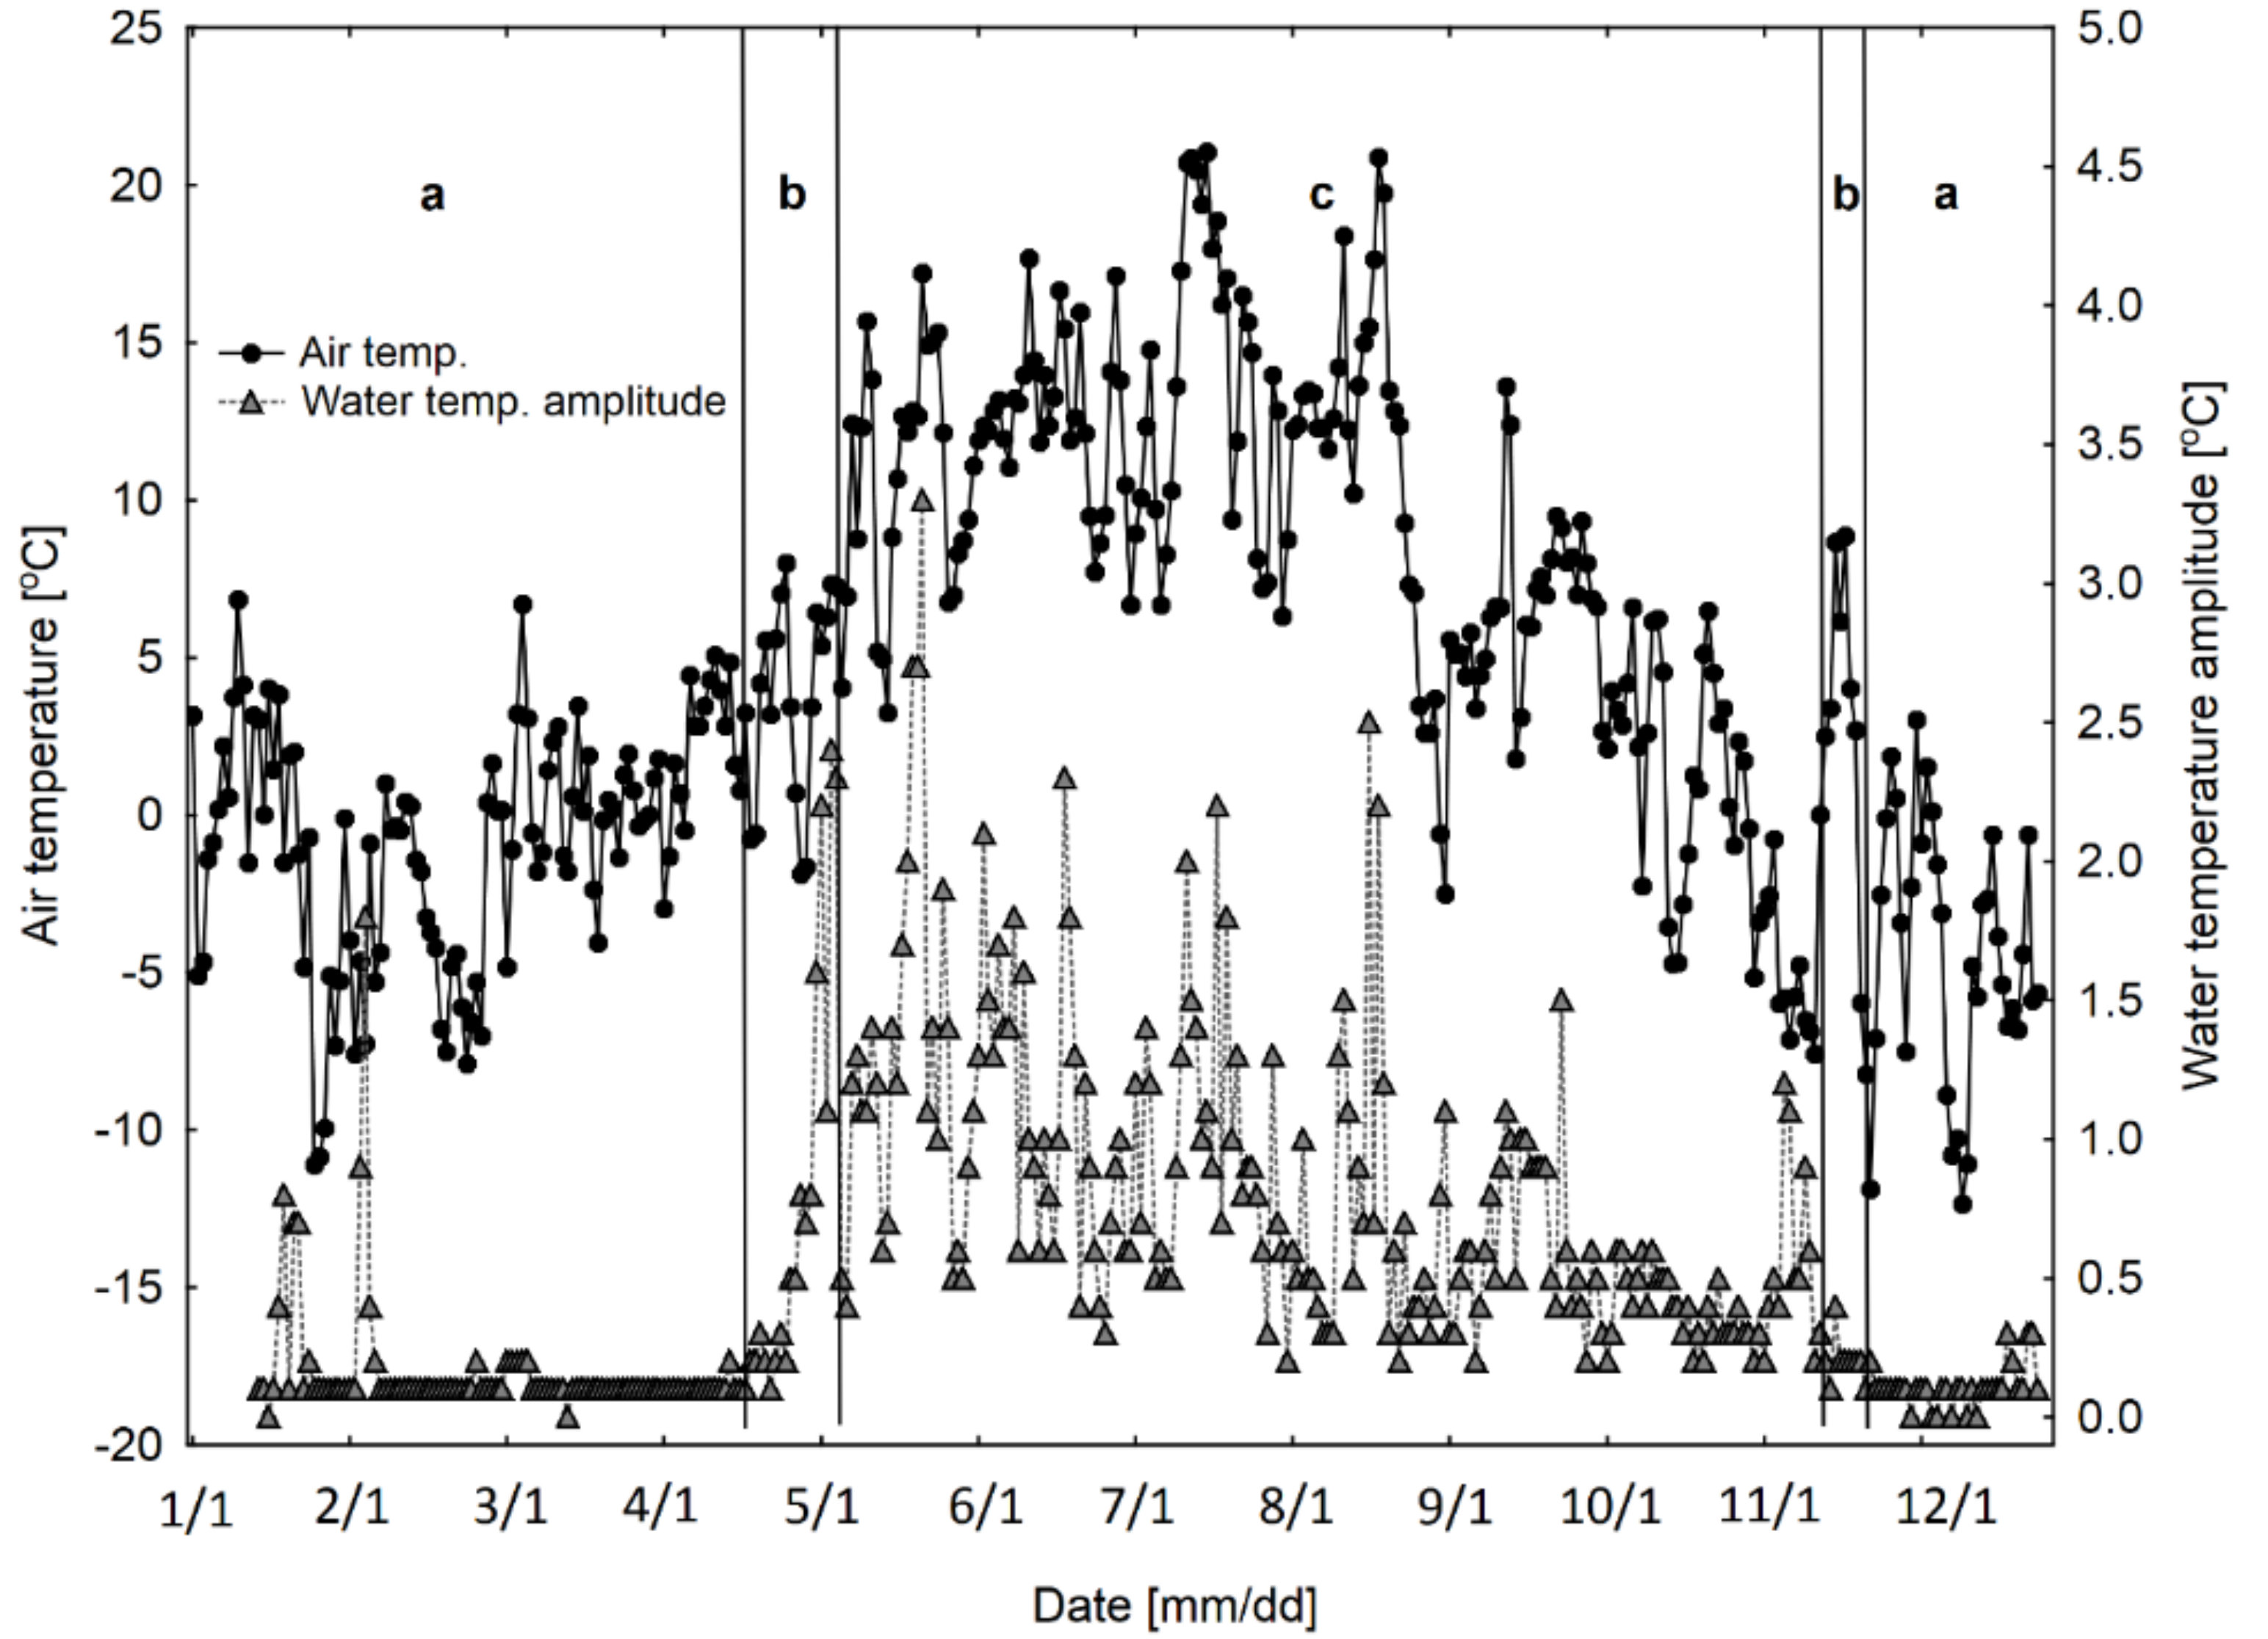
Changes in mean daily water temperature amplitudes at a depth of 1 m, as well as mean daily air temperature and wind velocity are presented in Figure 12 and Figure 13.
The analysis of correlations between air temperature, wind velocity, and water temperature amplitudes at a depth of 1 m is presented in Table 4 and in Figure 12 and Figure 13. A strong correlation occurred between air temperature and water temperature amplitude for profiles of type 1 (R = 0.71), type 2 (R = 0.39), type 4 (R = 0.59), and type 5 (R = 0.94). Wind velocity had a statistically significant effect on water temperature amplitude at a depth of 1 m in profiles of type 3 (R = 0.50), type 4 (R = 0.39), and type 6 (R = 0.69).
4. Discussion
The literature includes many papers concerning the effect of wind on the thermal dynamics of waters. One of the first of those was a paper by Yoshimura [45]. Few recent studies have examined impacts of systematic wind speed changes on lake stratification, including the influence of local changes such as deforestation and forest regrowth [43,44] and the influence of atmospheric stilling [46]. The case analyzed in this paper concerns a high mountain lake where foehn winds occur frequently. Therefore, their effect on the water surface and changes of temperature with water depth can be clearly visible. The paper is not only limited to the situation with no ice phenomena where the effect of wind is evident. Therefore, a division of the research term into three parts (sub-terms) (a—presence of ice cover, b—occurrence of ice phenomena (with no ice cover), and c—lack of ice cover or ice phenomena) seems to be justified. The duration of the designated parts (sub-terms) is largely varied: a—135 days (38.4%), b—24 days (6.8%), c—193 days (54.8%). The designation of the aforementioned sub-terms has the following justification. The period of occurrence of ice cover completely isolates water masses particularly from the impact of wind. Therefore, no wind mixing occurs. Two periods (spring and autumn) with recorded ice phenomena (no ice cover) constitute a “transitional period” between complete isolation of the water masses from external factors, and lack of such isolation. In the above case, the spring period, i.e., accompanying the decline of ice phenomena, is considerably longer (20 days) than the autumn period (4 days). Such a transitional character of isolation of the waters depends on the degree of cover of the waters with different forms of ice, e.g., accumulated or dispersed floating ice. The period with no occurrence of ice in water was the longest, lasting for 193 days. The proportions between the period with no ice (193 days) and with ice phenomena (172 days), i.e., 159 days plus 13 days in January with no observations, are typical of high mountain lakes in this part of Europe. Changes in water temperature amplitudes at particular depths (1, 5, 10, 20, and 50 m) presented in Figure 1, Figure 2, Figure 3, Figure 4 and Figure 5 evidently correspond with the three designated periods. In the case of the period with ice cover, evident suppression of temperature amplitudes is observed, approximate to zero, or usually oscillating from 0.1 to 0.2 °C, where 0.1 °C is within the aforementioned error of the temperature observations. This concerns all of the analyzed depths. The only deviation from the rule is the situation in January at a depth of 1 m, when the daily amplitude exceeded 1.5 °C. Perhaps in this case this was a result in a break in the ice cover. In two short periods, earlier described as “transitional”, an increase in daily water temperature amplitudes is observed. This concerns both the spring and autumn periods at depths of 1 and 5 m, and the autumn period at the remaining depths. From the moment when water is free from ice, daily water temperature amplitudes drastically increase. The increase is observed at depths from 1 to 20 m. Varied course of amplitudes is recorded at particular depths, however. Directly under the surface, i.e., at a depth of 1 m, the highest amplitudes occur at the turn of May and June, and consequently decrease until November. The highest amplitudes oscillate from 2 to more than 3 °C, which is larger than may be expected for a lake of this size, according to the results of Wollway et al. [15]. However, Choiński et al. [31], using an infrared camera, proved that the differences between the maximum and minimum temperatures in different parts of the surface waters of Lake Morskie Oko can reach nearly 6 °C. A decrease in the amplitudes from summer to autumn is a result of cooling of the waters of the near-surface zone, i.e., epilimnion, until its disappearance. At a depth of 5 m, the highest amplitudes occur between the end of May and the end of July, followed by their decrease until November. Similarly, as in the previous case, the highest amplitudes oscillate from 2 to more than 3 °C. The distribution of amplitudes at a depth of 10 m is somewhat different. Consequently, their values increase until mid-July, and decrease from that moment to November. In this case, the amplitudes reach considerable values, i.e., high contribution in the range from 2 to 4 °C. At a depth of 20 m, the amplitudes are rapidly suppressed, rarely exceeding 1 °C. Moreover, their course is evidently flattened, and devoid of an evident maximum as at lower depths. At a depth of 50 m, the amplitudes reach trace values, i.e., almost complete suppression of the effect of external factors on the deepest near-bottom water zones occurs. The amplitudes occurring there reach up to 0.5 °C, and are recorded particularly from the beginning of September to the moment of appearance of ice phenomena.
At almost all of the depths in the free water surface period, water temperature amplitudes were significantly higher than during the occurrence of ice cover/ice phenomena. The exception was a depth of 50 m, where the effect of external factors was considerably suppressed. It is difficult to explain why temperature amplitudes at a depth of 10 m were significantly higher in the presence of ice phenomena than during the occurrence of ice cover, and no such differences were observed at a depth of 5 m.
The analysis of correlations between temperature amplitudes at particular depths showed that in all of the analyzed periods, a correlation occurred between the amplitudes at depths of 1 and 5 m. In the case of ice cover, this was caused by direct under-ice water circulation (outflow from the lake), and in both of the remaining cases, by intensive effect of wind on the surface and sub-surface zone of the waters (several meters). Moreover, it can be determined that wind is a cause of stronger correlations between amplitudes at particular depths for the period of occurrence of ice phenomena and free water surface than for the period of occurrence of ice cover.
The analysis of distribution fitting confirmed the earlier conclusions on the scale of variability of temperature amplitudes in the three designated periods, and on a decrease of the effect of external factors with increasing depth (this was particularly evident in the near-bottom zone). It is difficult to explain the deviation of the above rules, namely an increase in the value and variability of temperature amplitudes at a depth of 10 m in the period of free water surface.
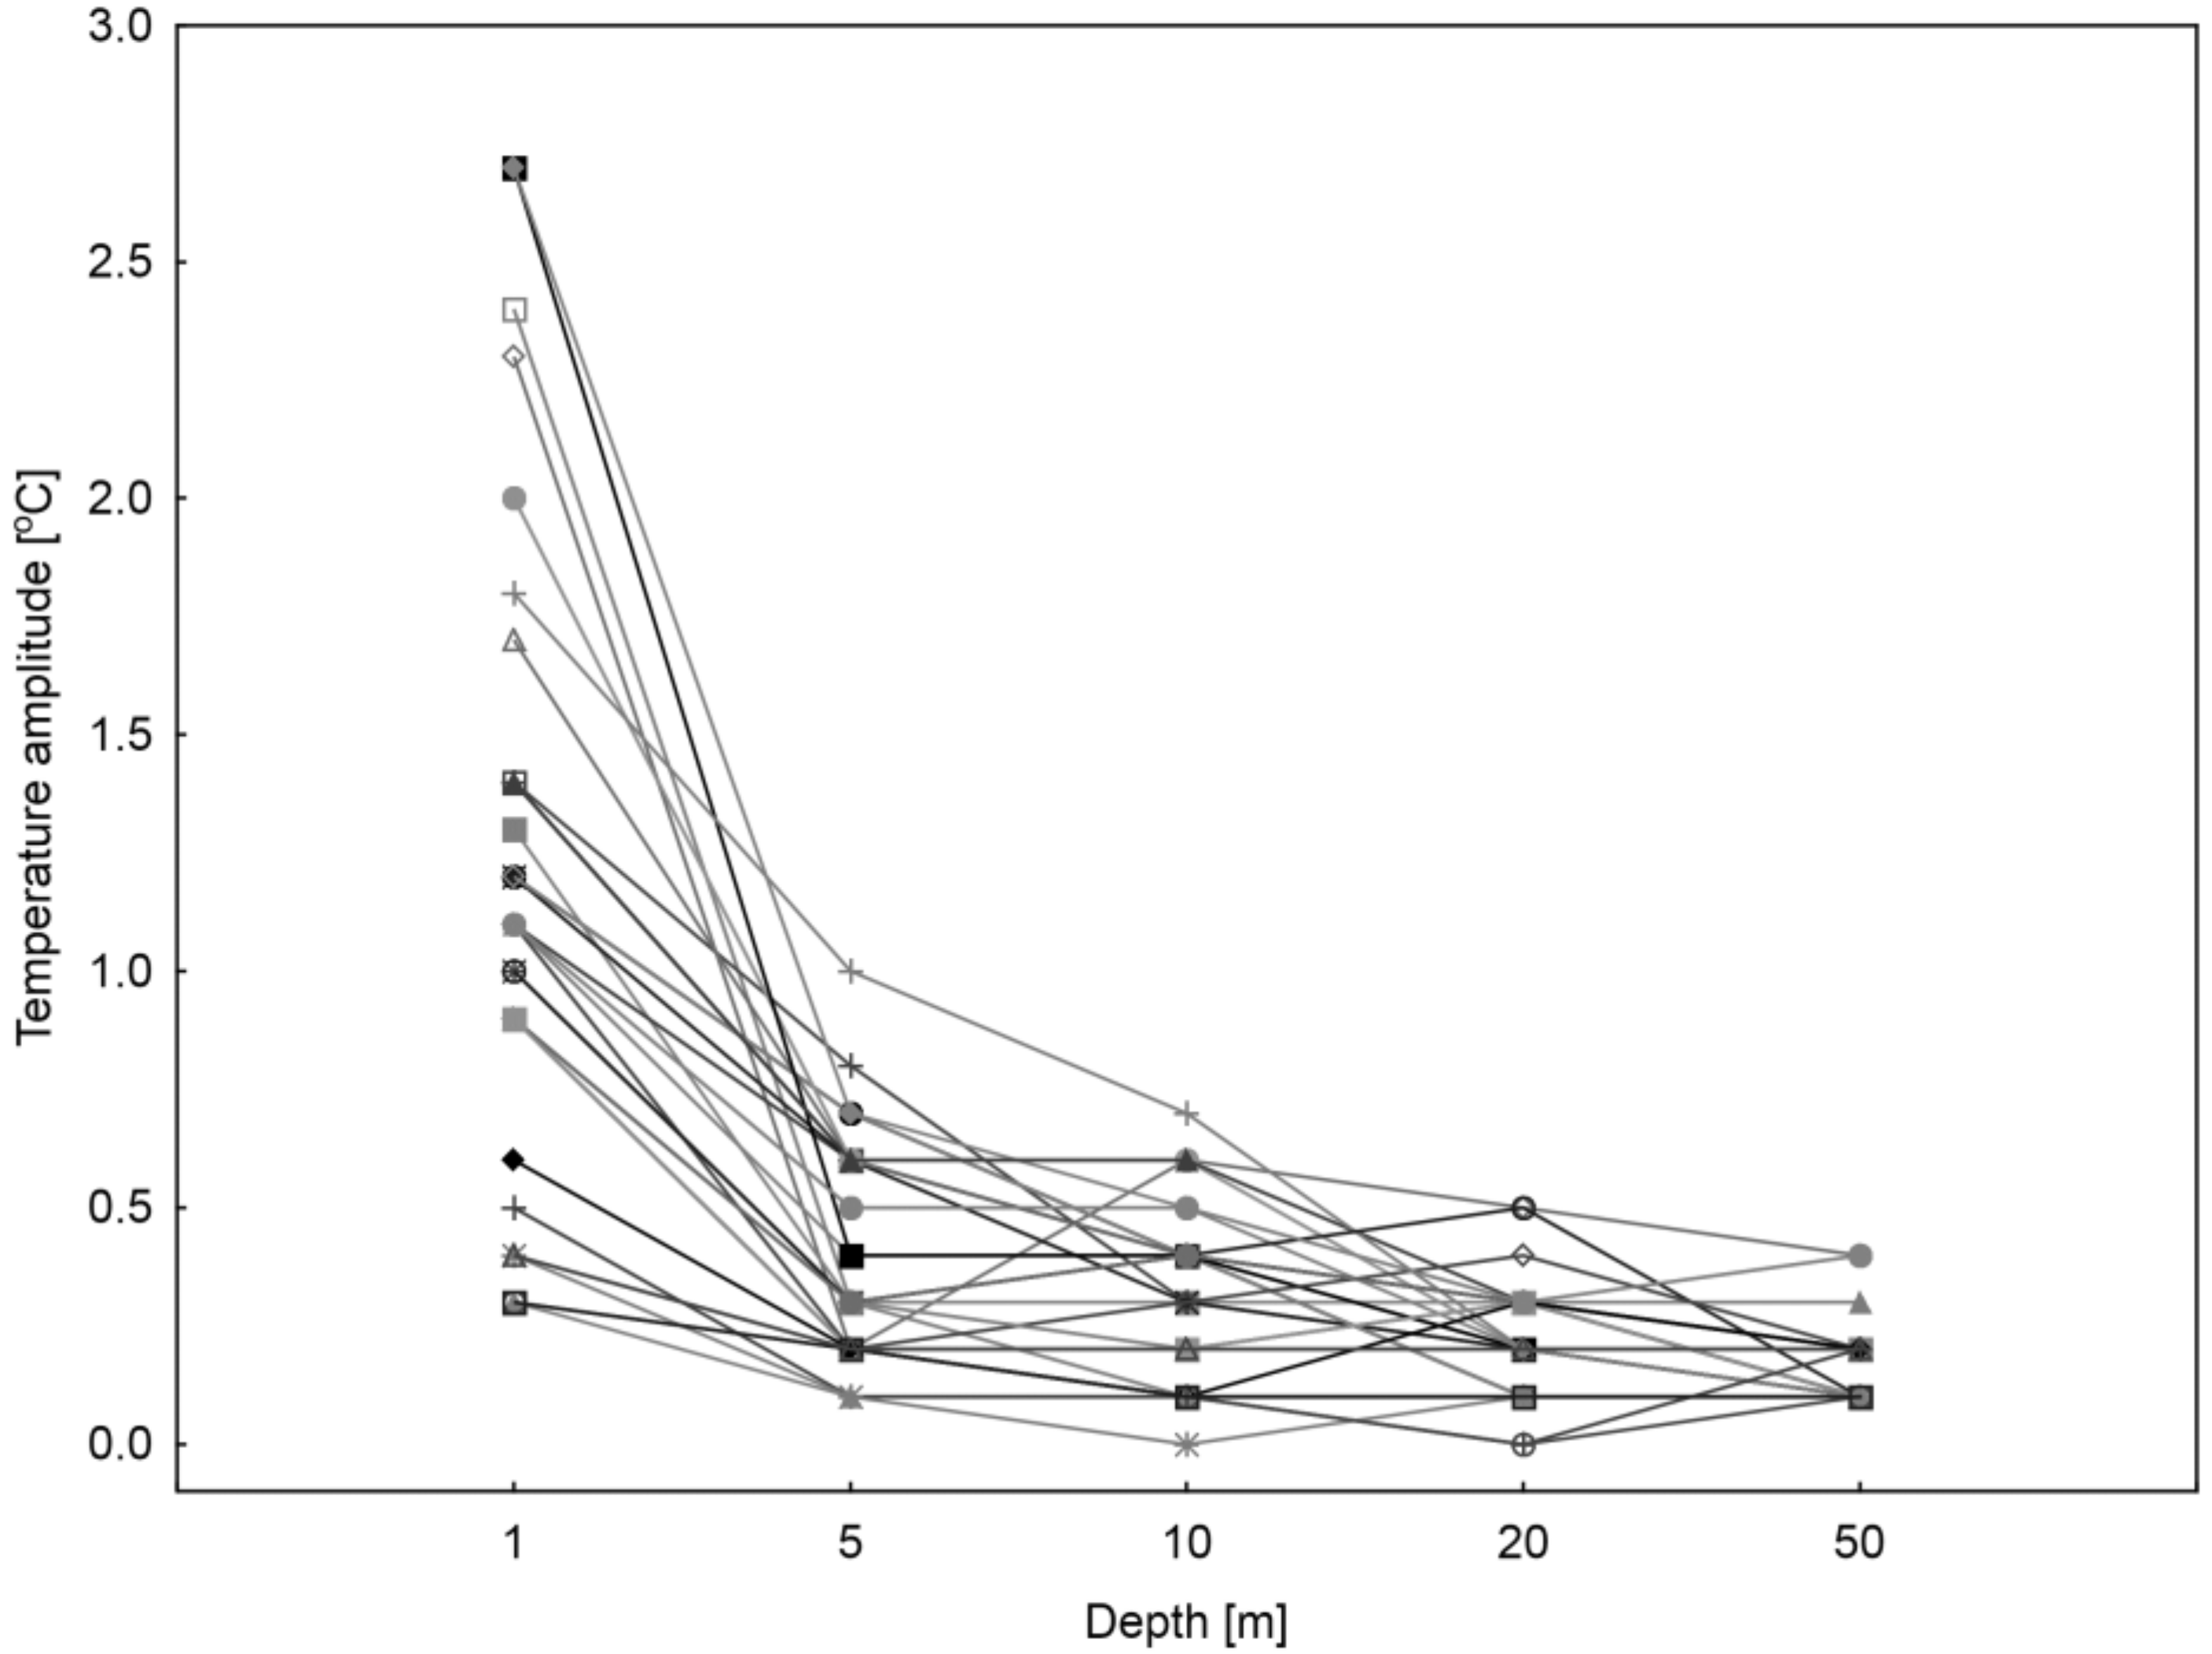
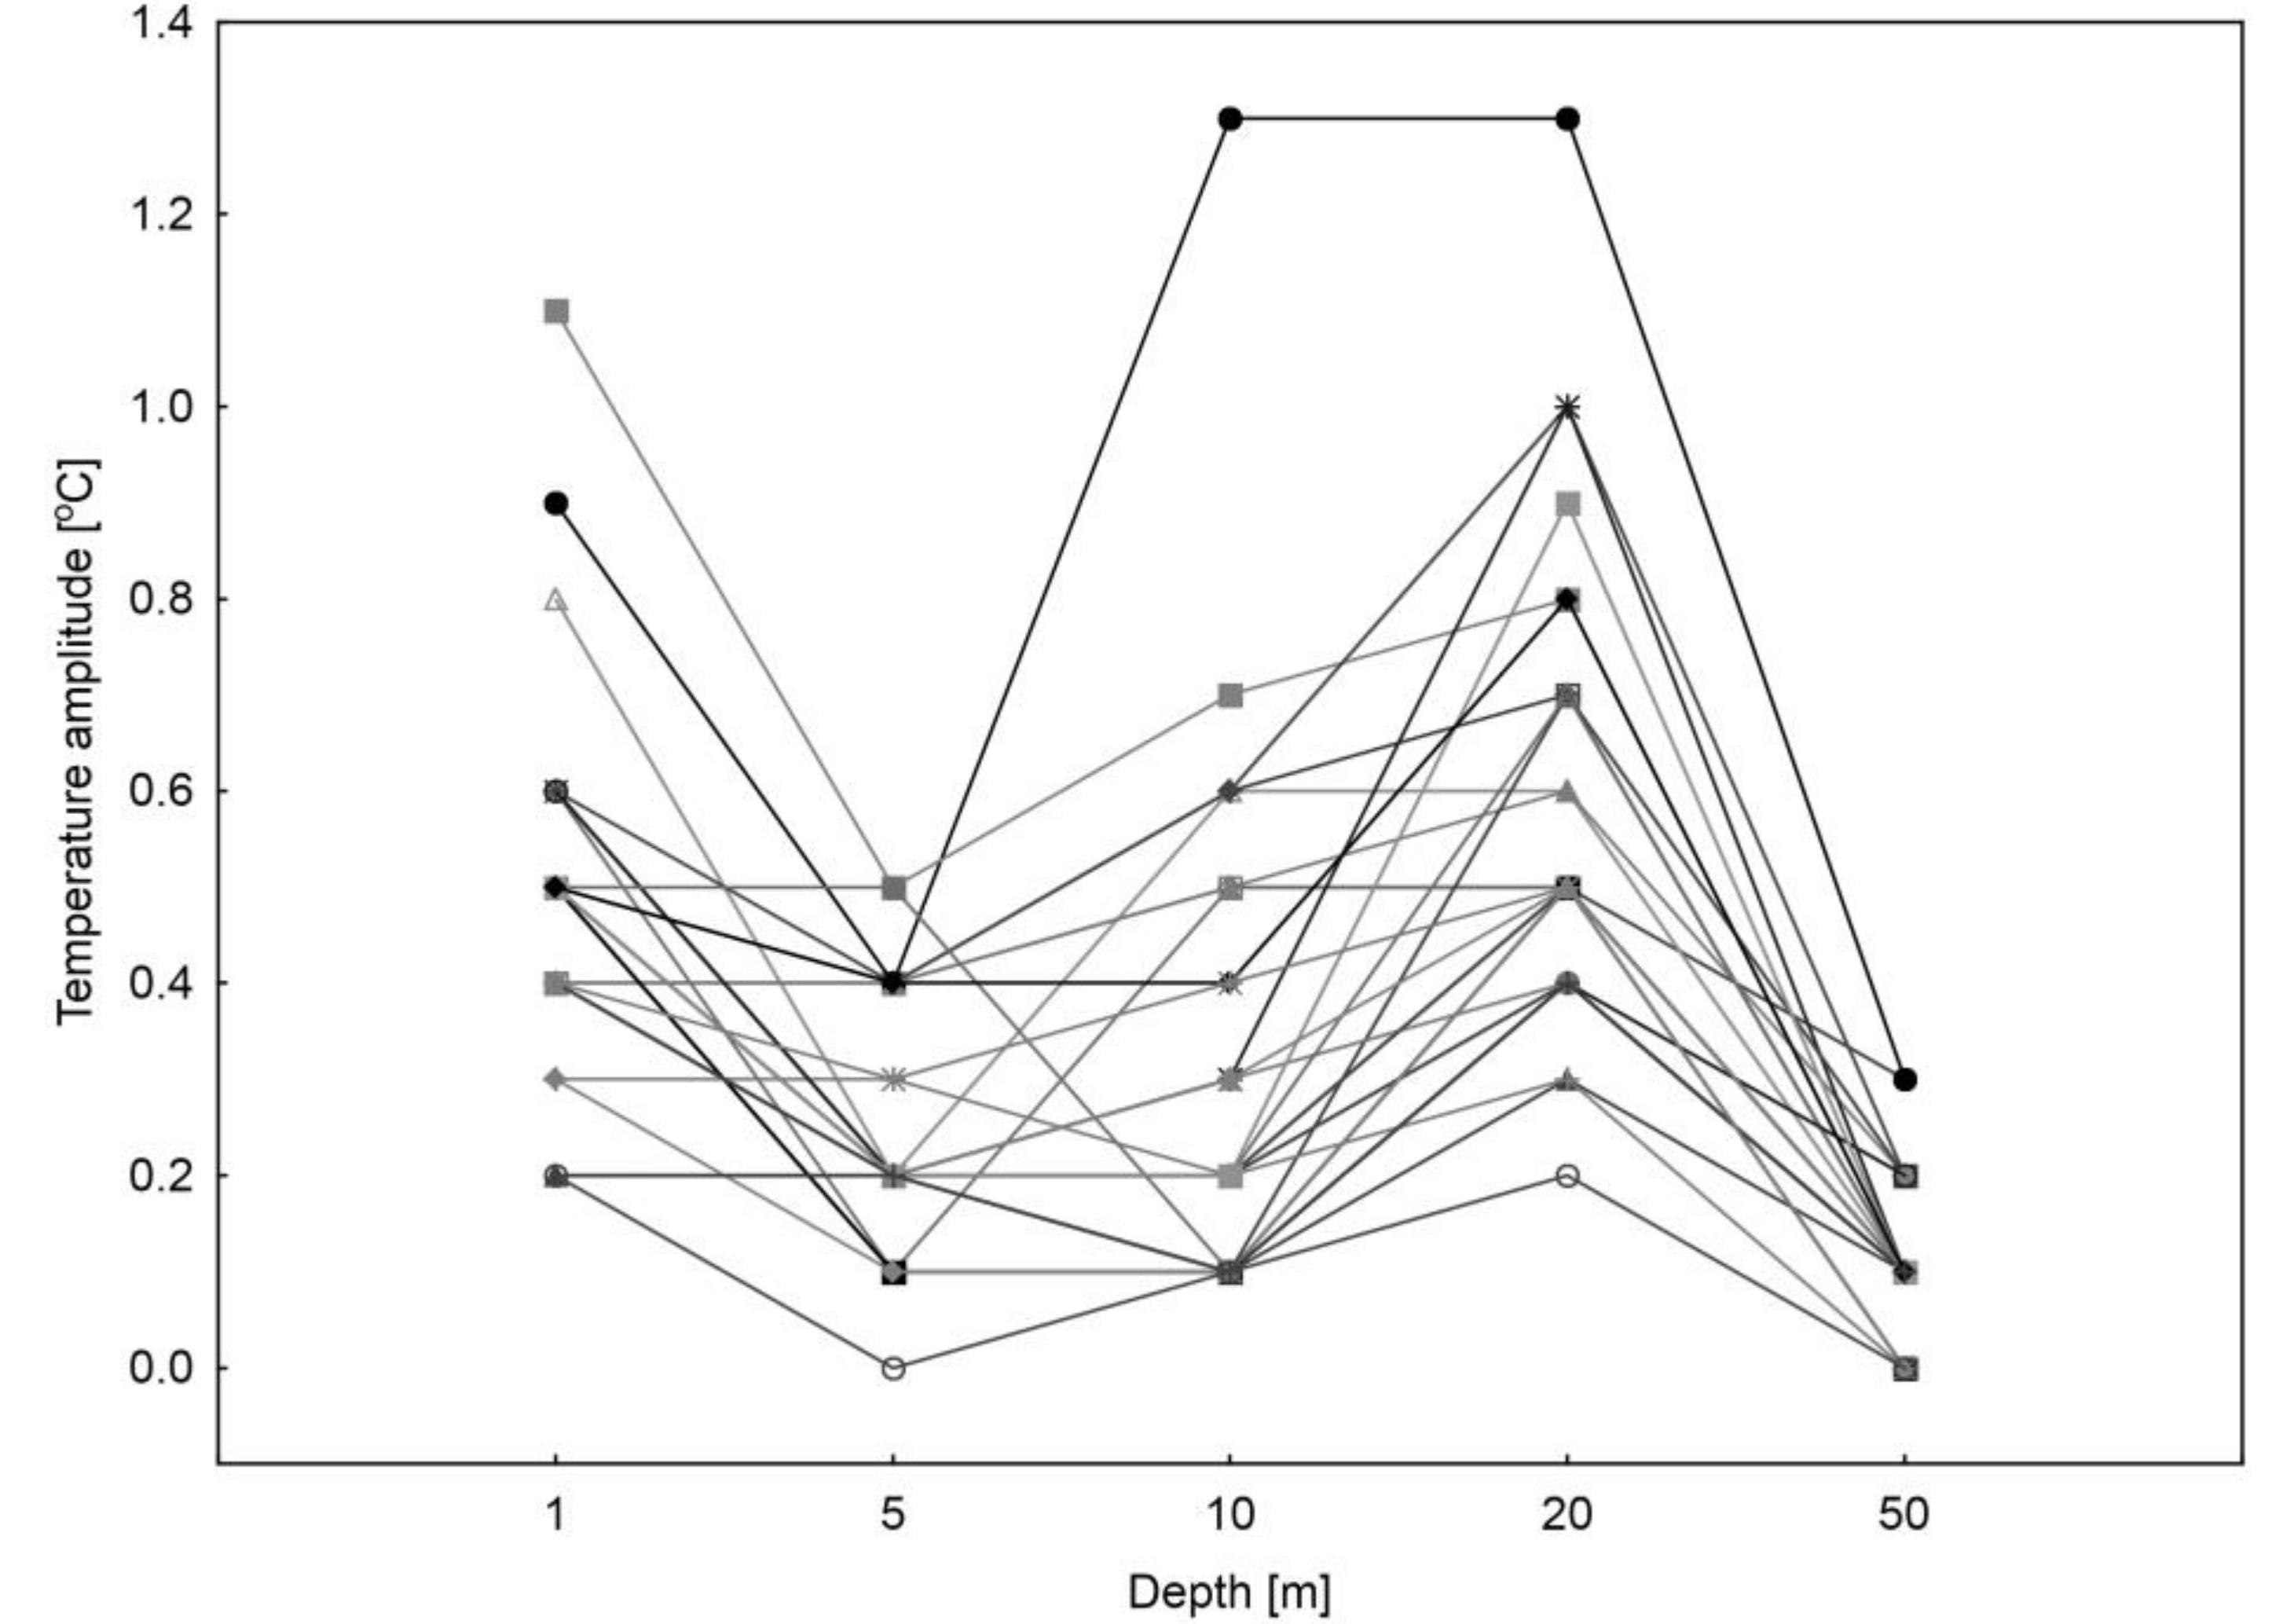
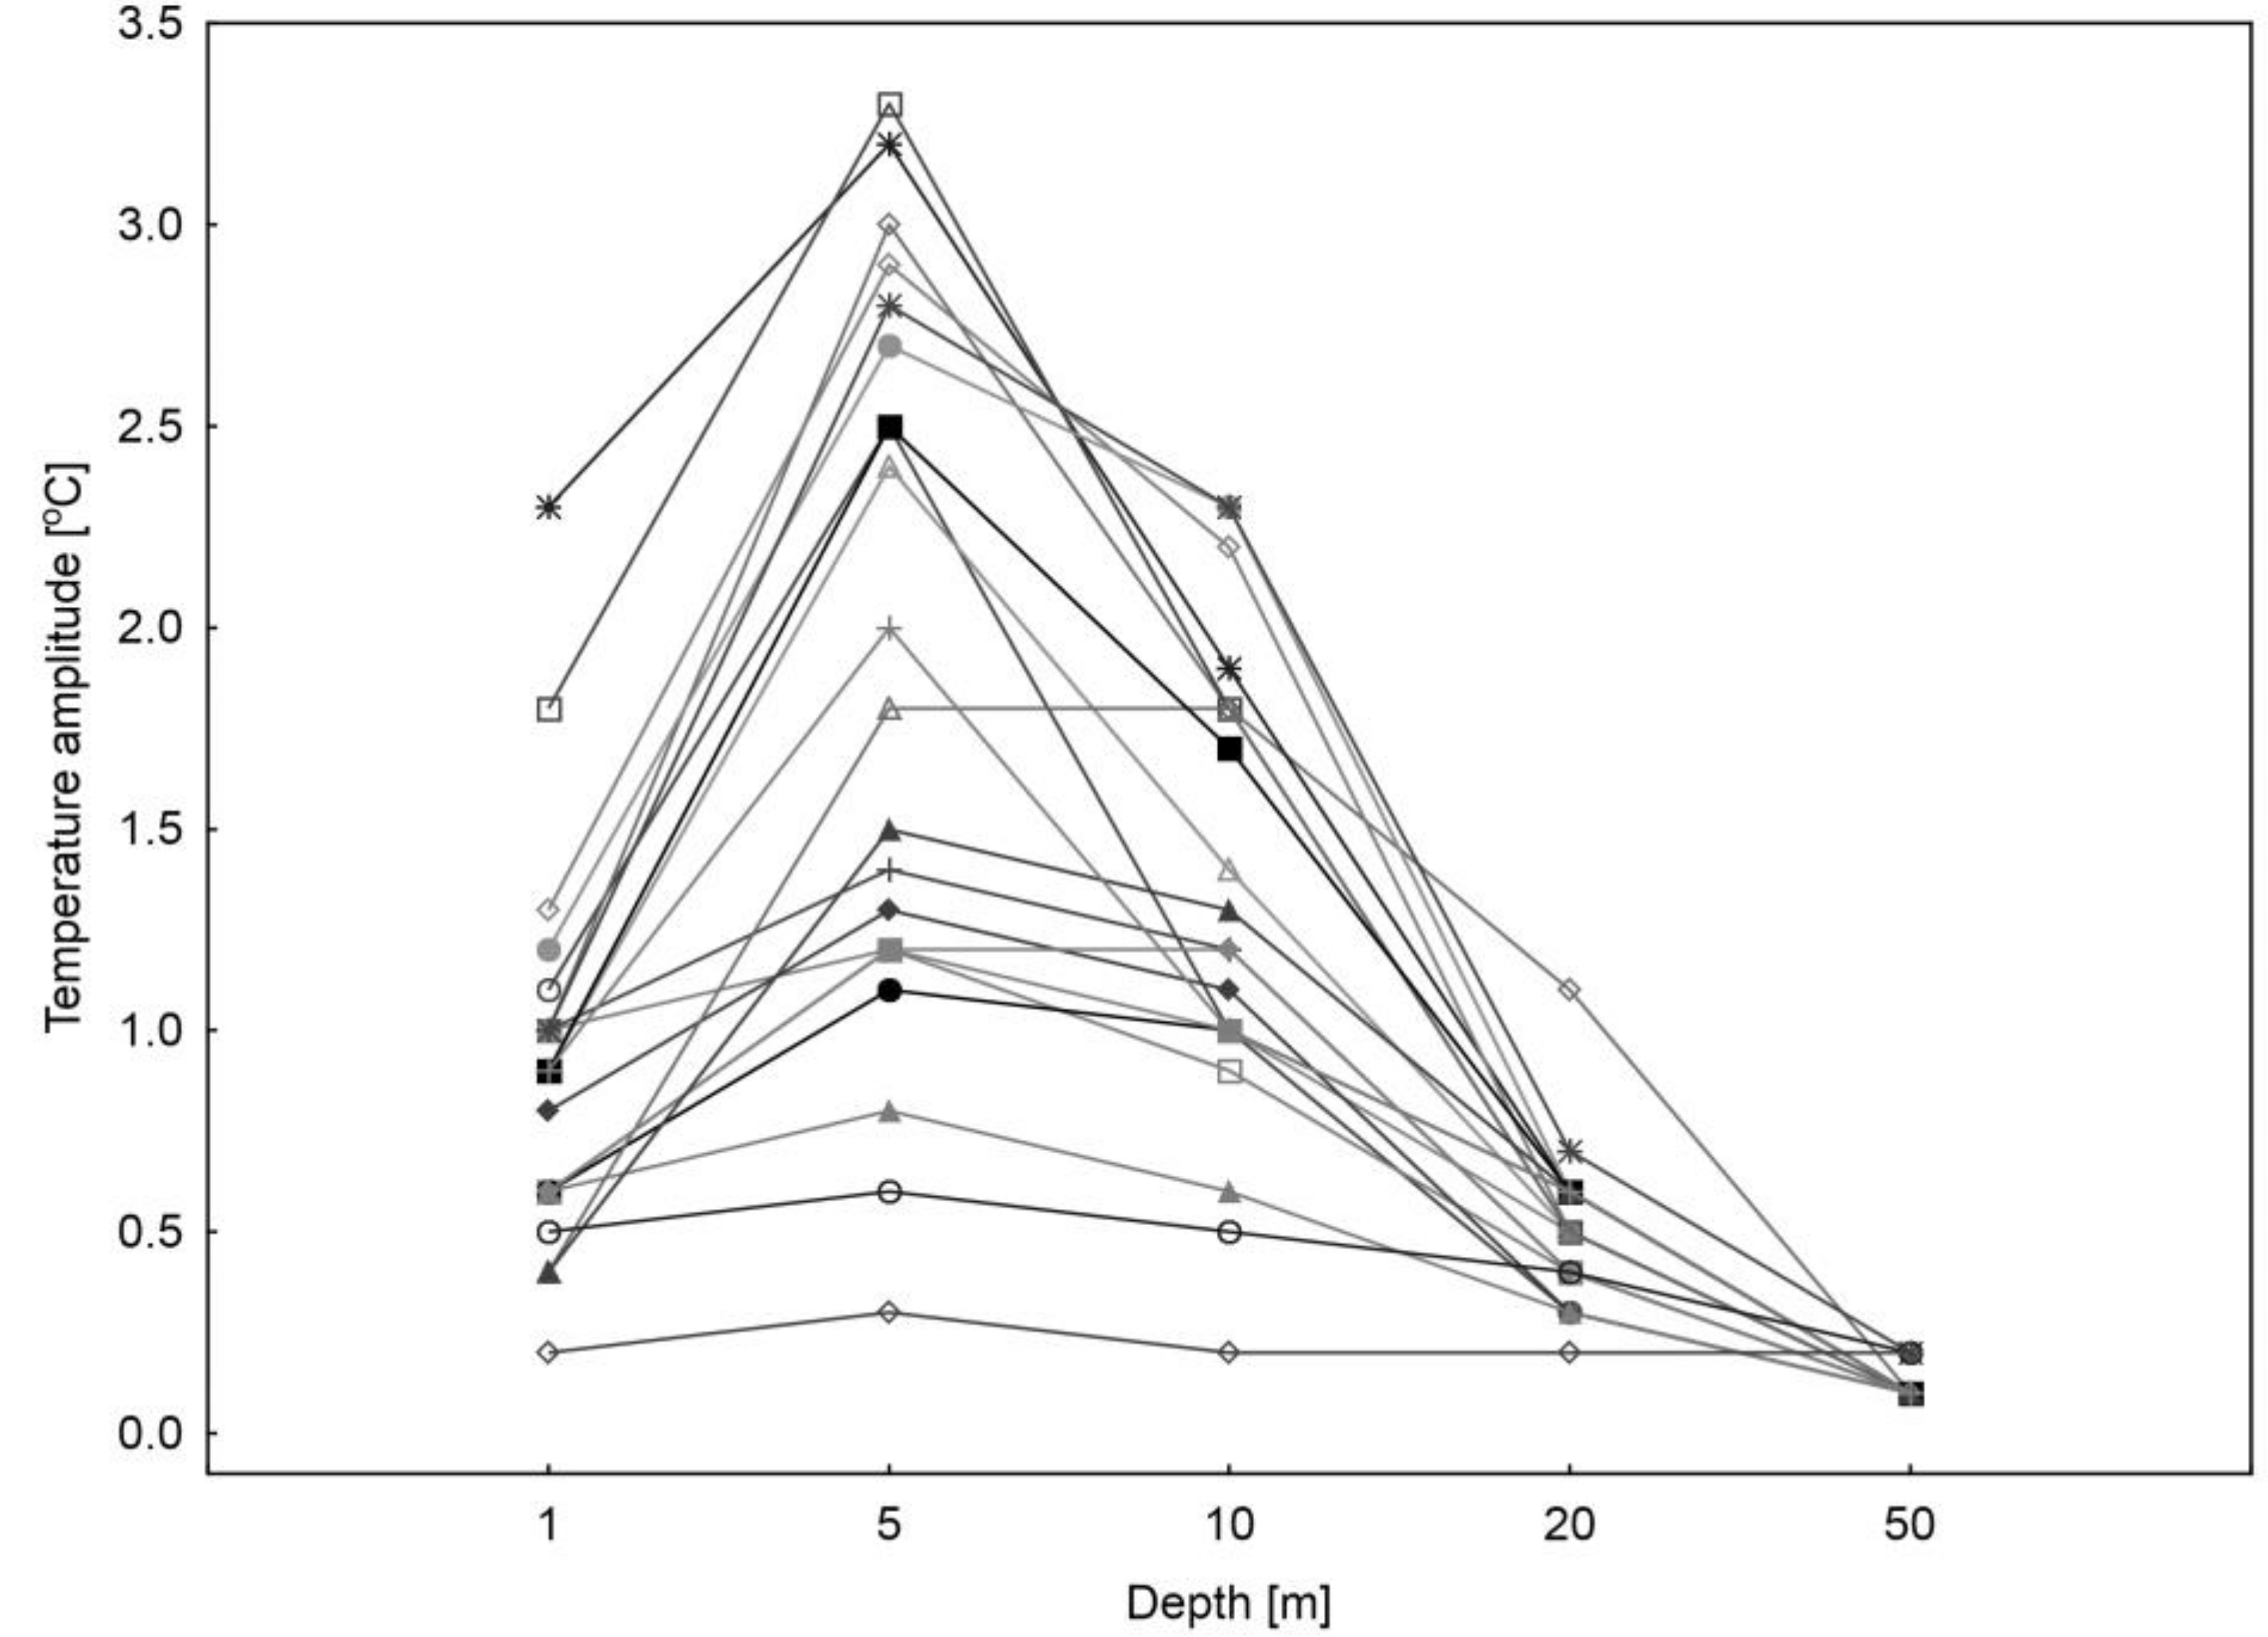
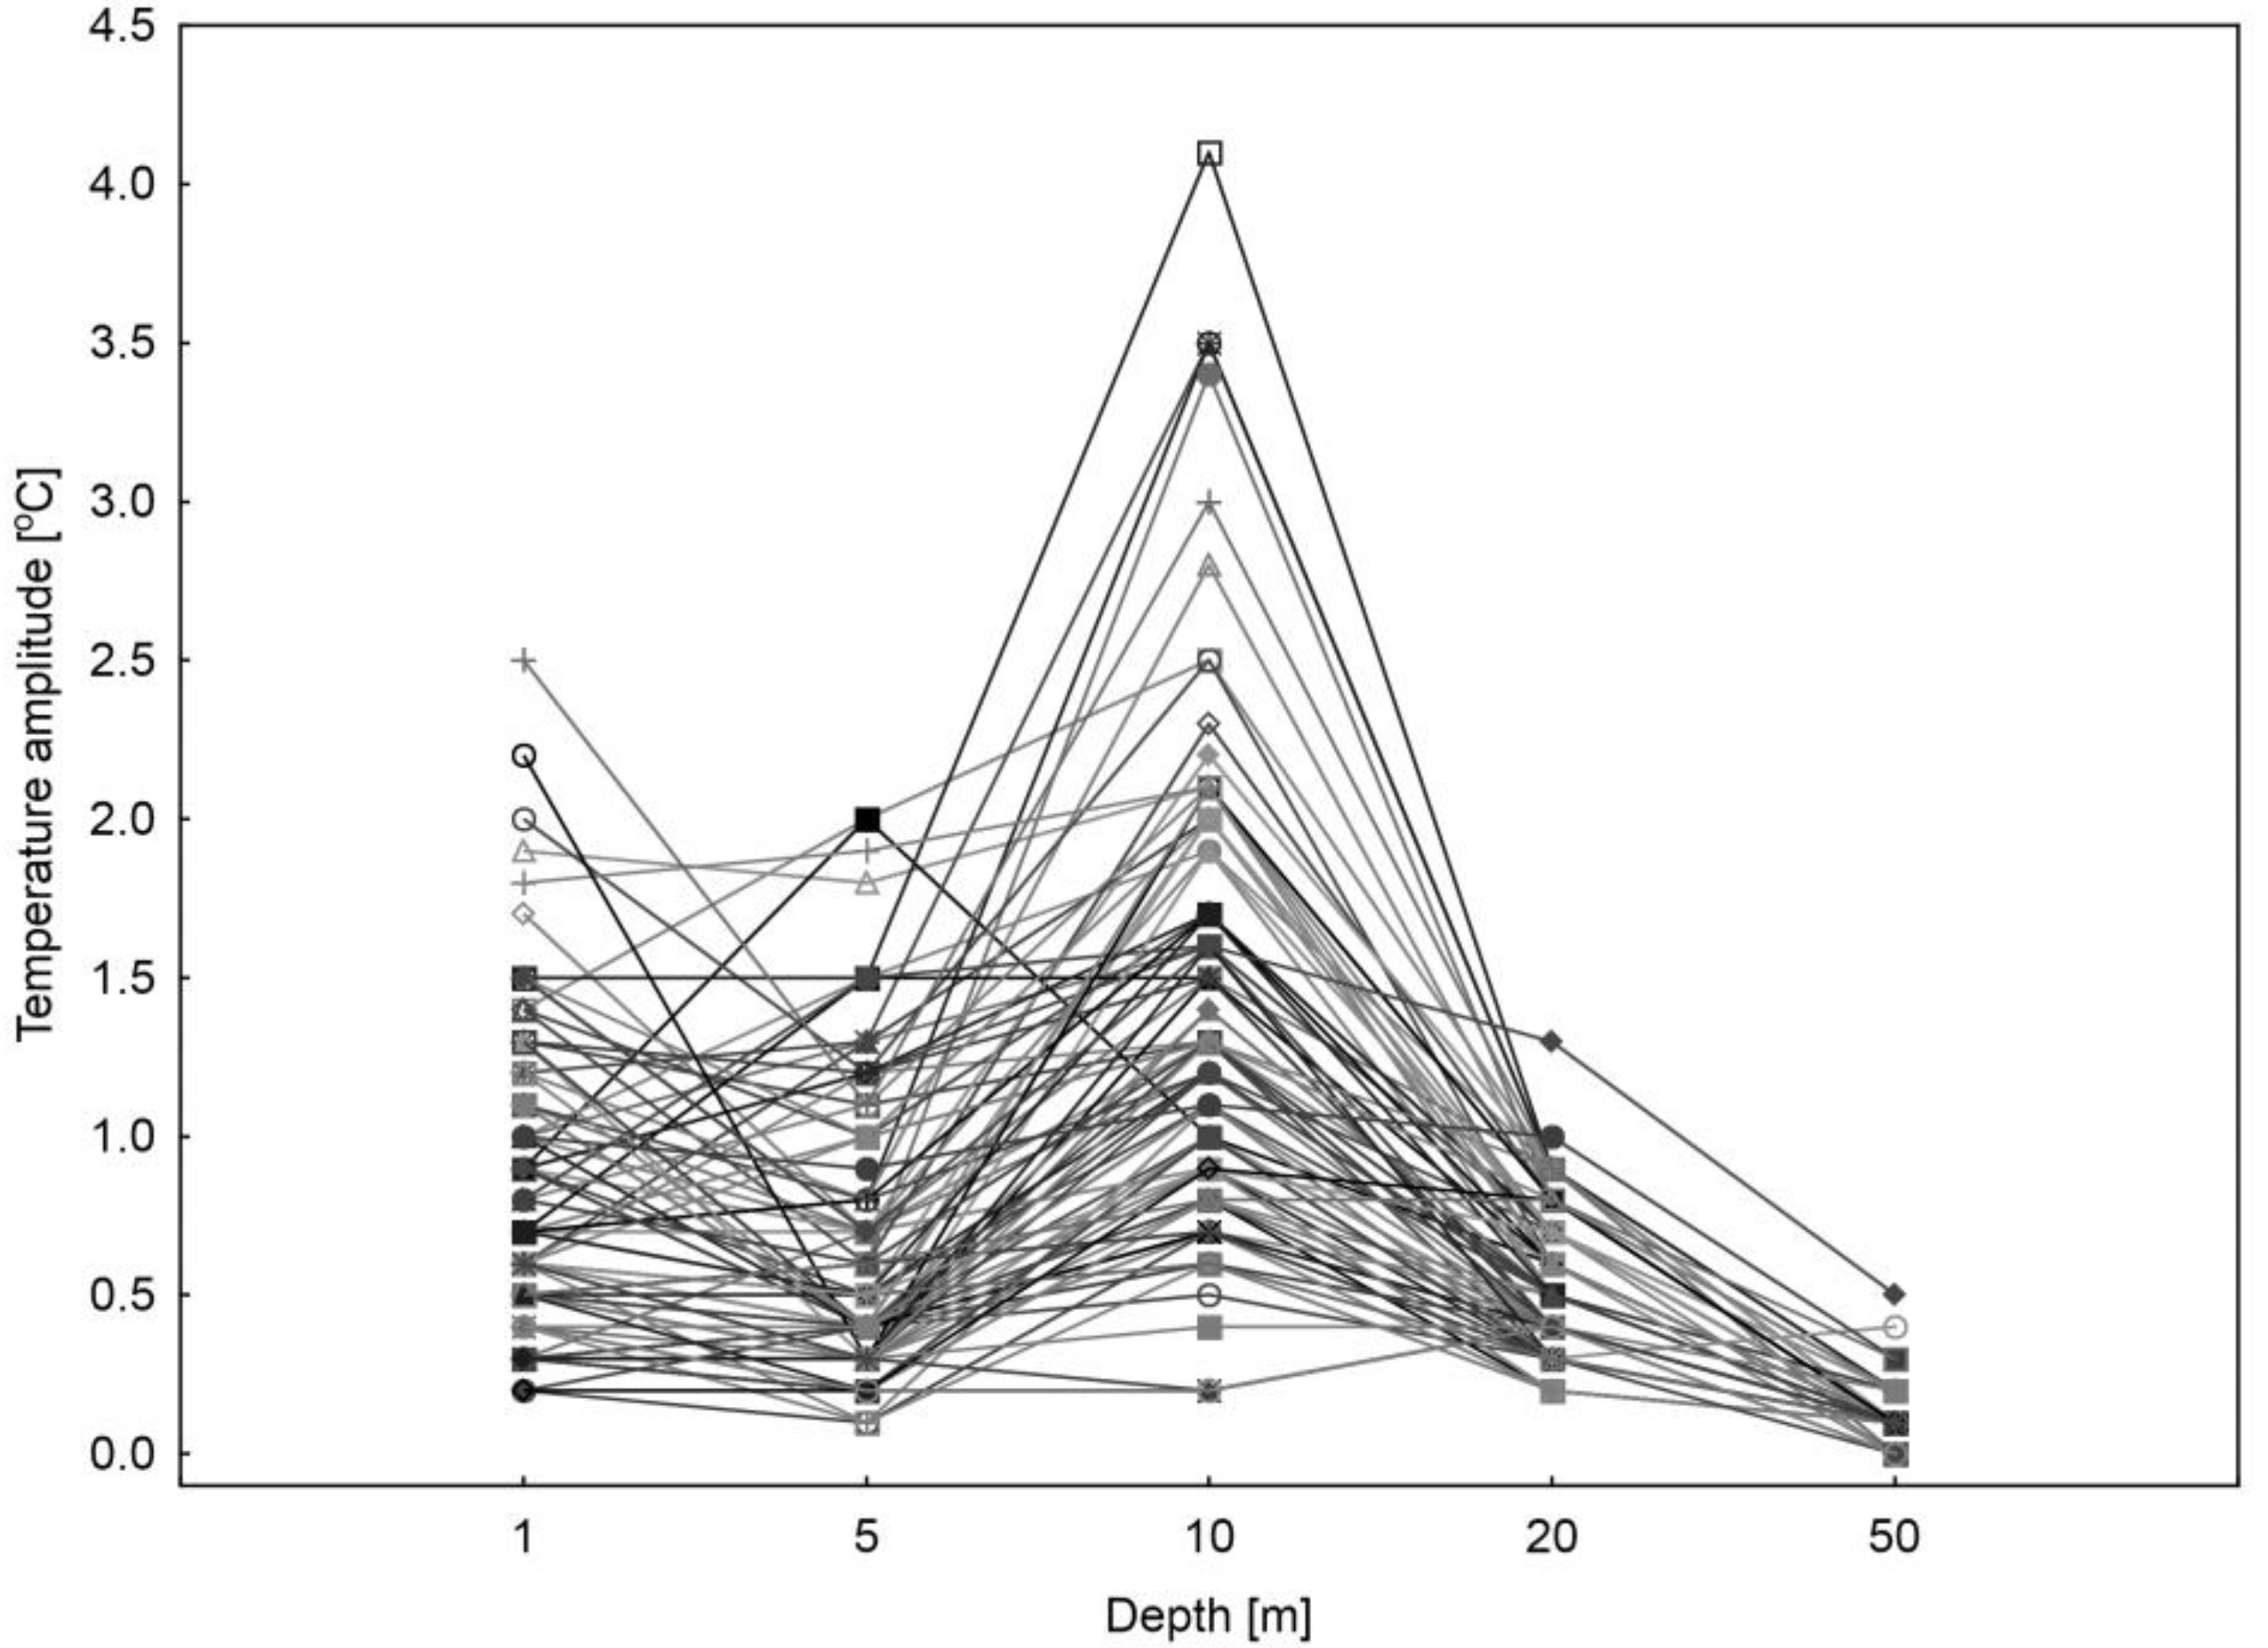
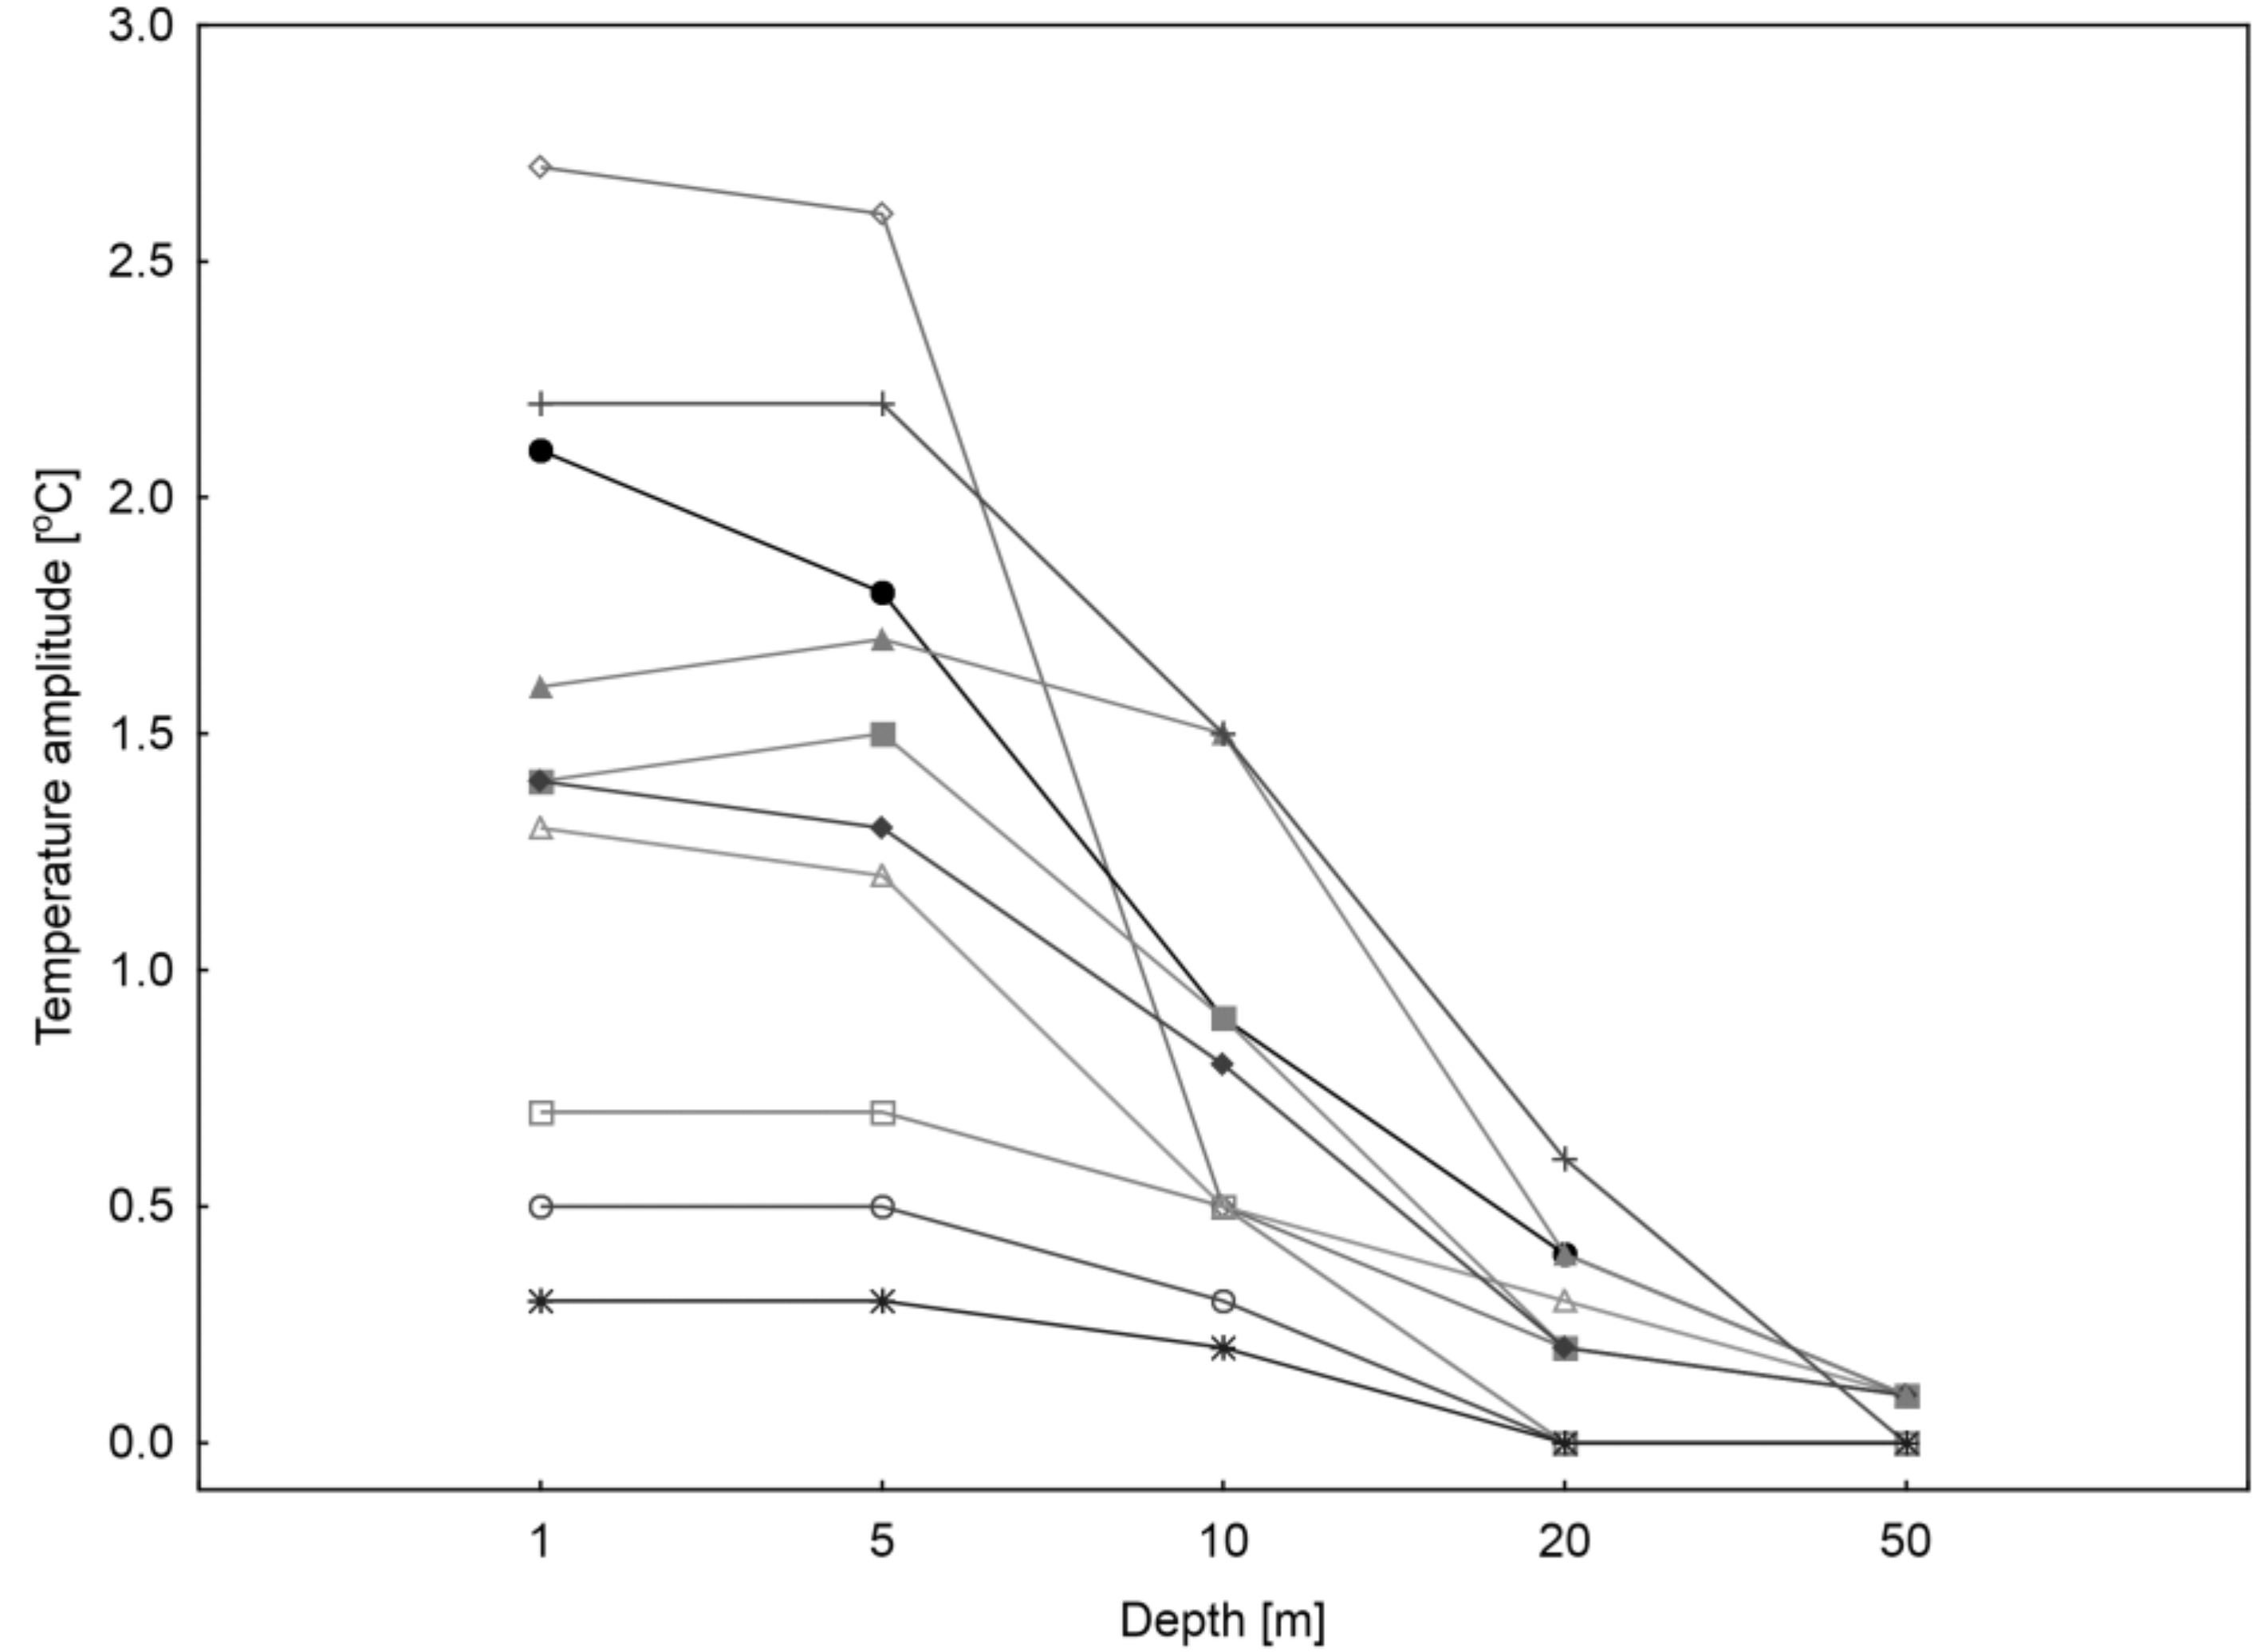
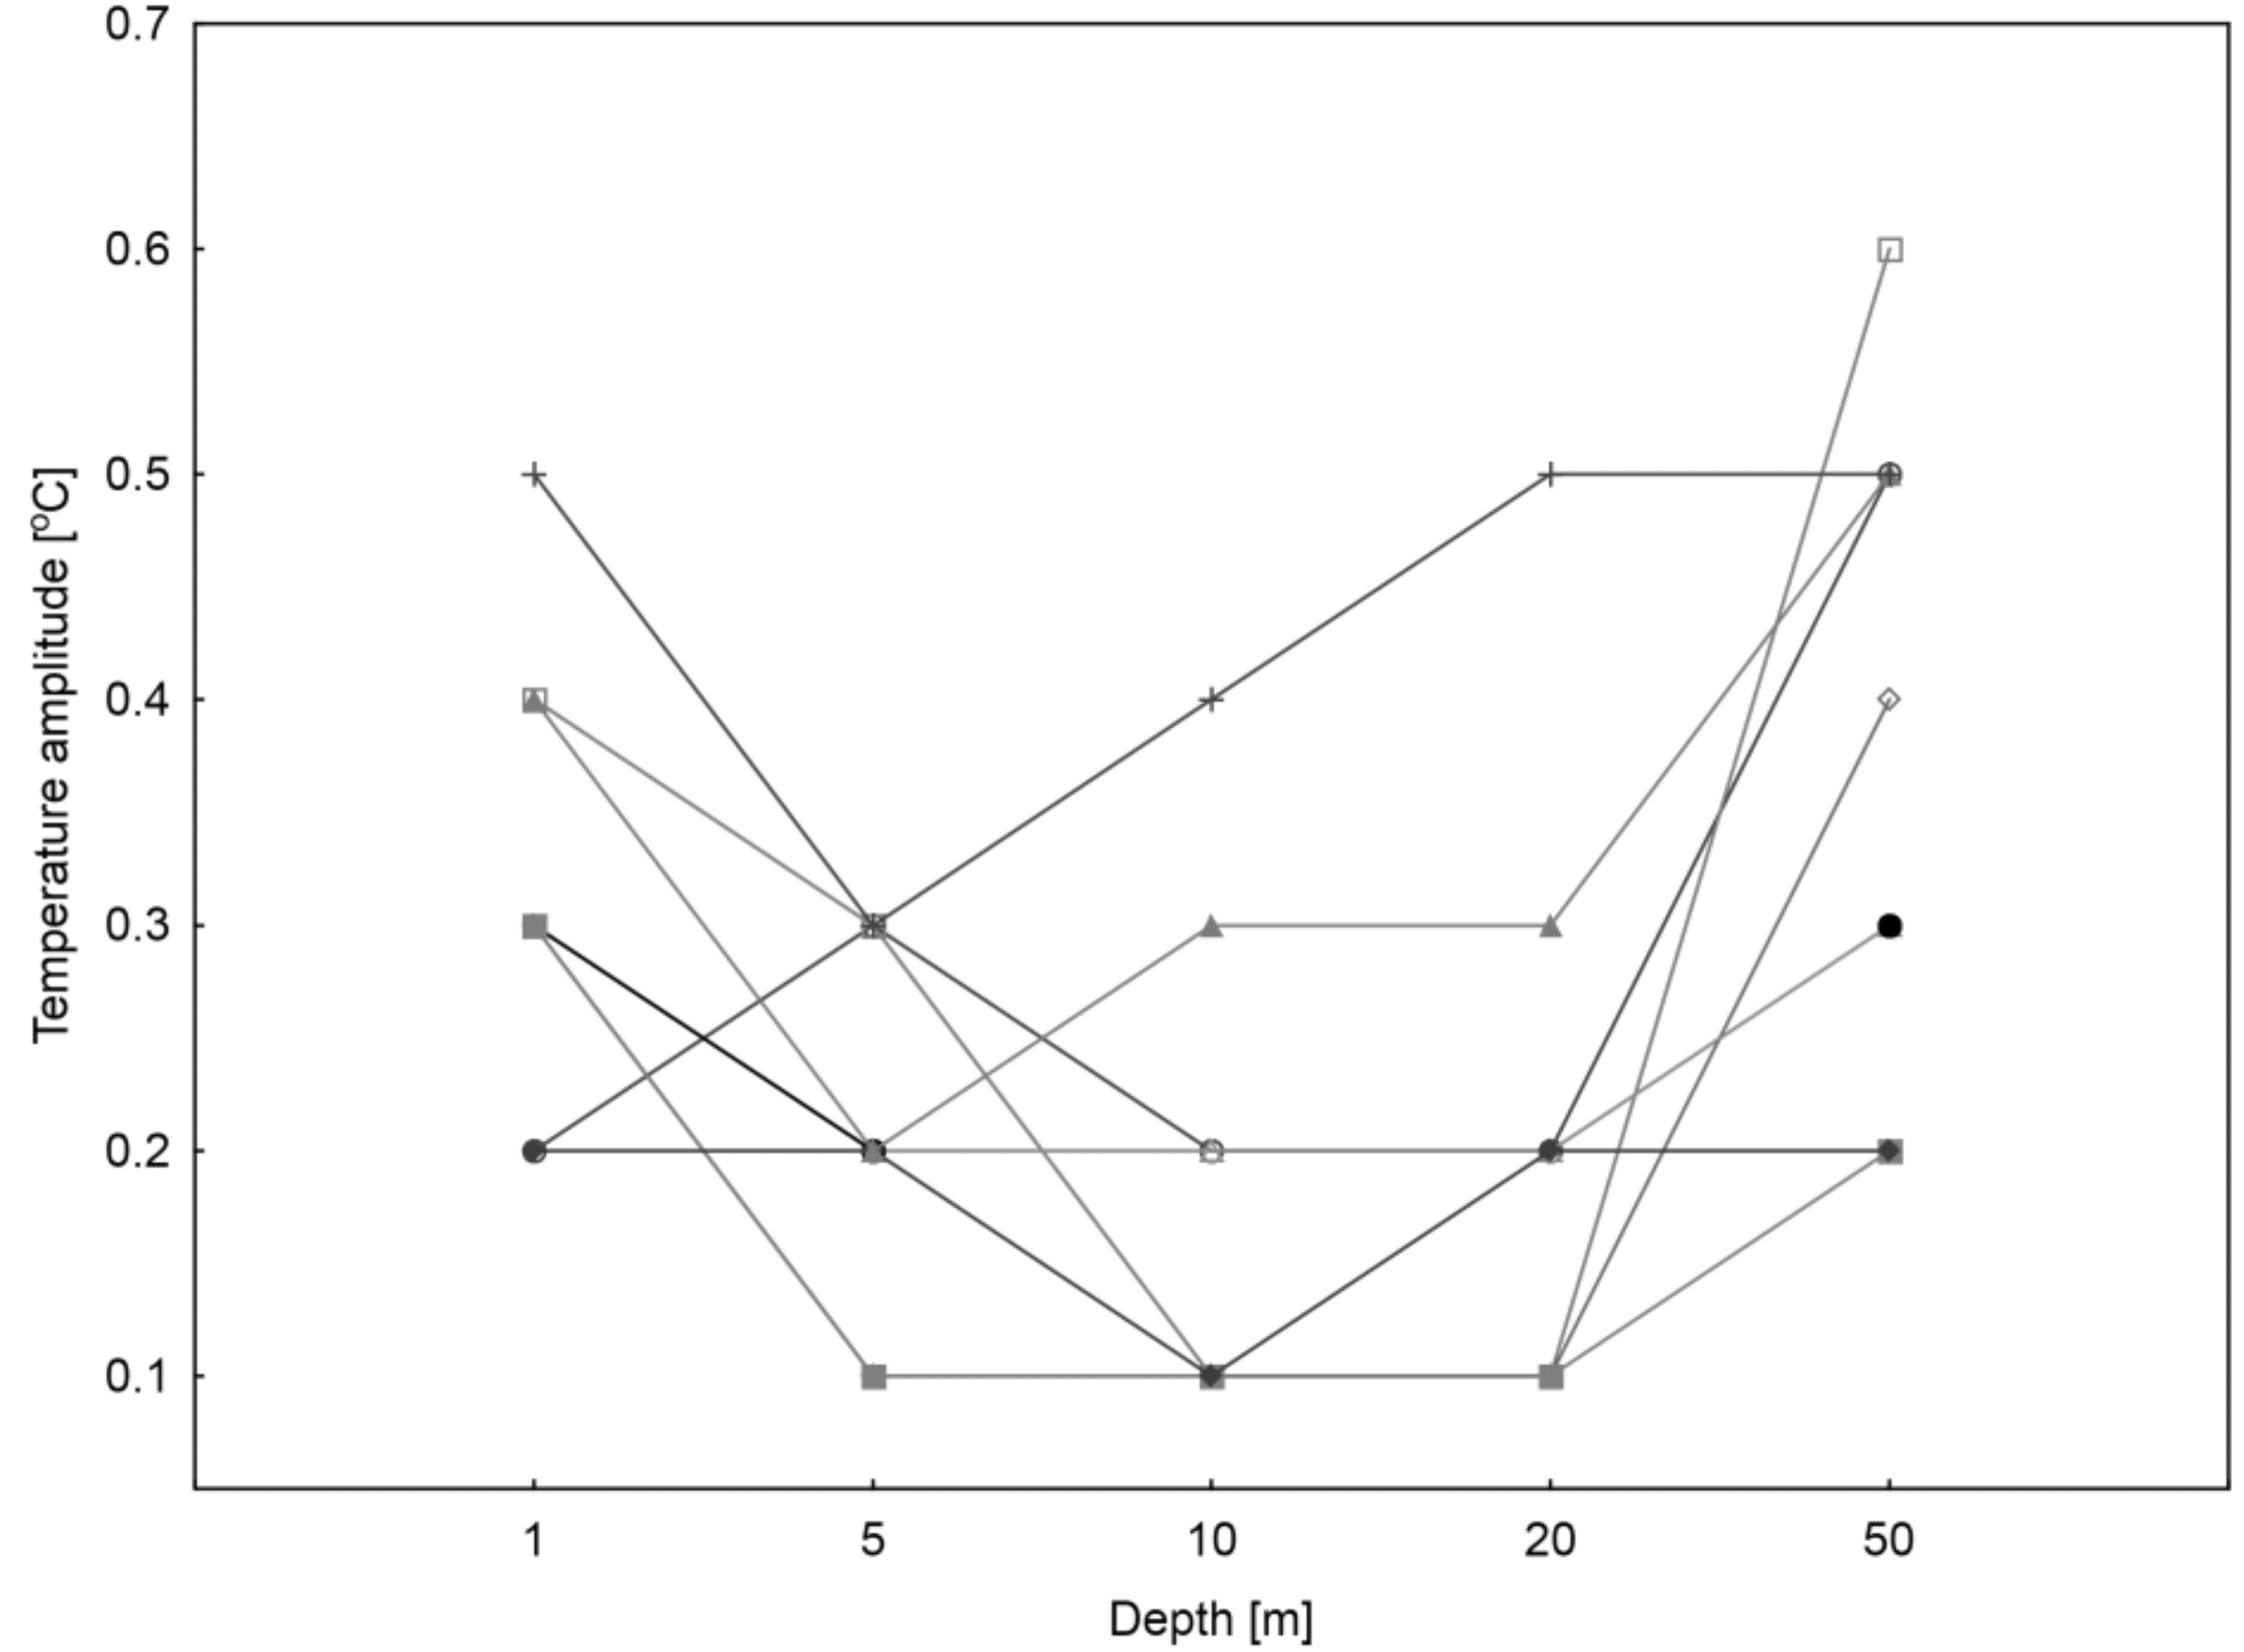
Over 193 days with no ice phenomena, i.e., with free water surface, the occurrence of maximum daily water temperature amplitudes was recorded at various depths. This permitted the designation of six types (patterns) of distribution of amplitudes corresponding with depth. In type 1, occurring relatively frequently, maximum amplitudes are recorded at a depth of 1 m, whereas they rapidly decrease with depth. Such situations are, on the one hand, related to strong insolation (or its lack—cloudiness), and on the other hand to effective movement (mixing) of near-surface water masses due to the effect of wind. As a result, warm waters moved by wind can be replaced with cooler waters from deeper parts of the lake. In the above case, amplitudes at a depth of 1 m are frequently higher than 1 °C per day. Type 2 is represented by thermal patterns of amplitudes in which the maximum value is recorded at a depth of 20 m. In this case, the frequency of their occurrence is considerably lower than at a depth of 1 m. Their value is also lower, i.e., it amounts to approximately 0.5 °C per day on the average. At a depth of 20 m, the effect of direct heating of water practically does not occur, and the impact of wind is scarce. Therefore, such a pattern of amplitudes can be determined by deep circulation, not as an effect of direct wind mixing under the surface, but as an effect of water-induced water stage increases forcing deep circulation. Type 3 includes situations where maximum daily amplitudes are recorded at a depth of 5 m. They occur slightly more frequently than those in type 2, but considerably more seldom than in type 1. The amplitudes usually exceed 1 °C per day. This type of amplitudes has a similar genesis as those occurring directly under the surface, i.e., at a depth of 1 m. A depth of 5 m is often reached by the wave base, resulting in intensive mixing of waters. Type 4 is distinguished by the occurrence of maximum daily water temperature amplitudes at a depth of 20 m. Among the six types, this one is represented the most frequently. Values of the amplitudes in this type are also the highest, i.e., their high contribution reaches values exceeding 2 °C per day. Daily water temperature amplitudes at a depth of 10 m are not closely correlated with those at depths of 5 and 20 m, and probably have the character of stochastic phenomena, determined by hydrodynamics. In type 5, even the amplitude of temperatures occurs at depths of 1 and 5 m, followed by a decrease in amplitude values. Only several such cases were recorded. In the last type 6, the maximum value of amplitudes was recorded at the bottom, i.e., at a depth of 50 m. Only several such cases were recorded, whereas the amplitude values in the case of the type are the lowest, and vary from 0.2 to 0.6 °C per day. Near-bottom water movement pulsations resulting in changes in water temperature can be caused by wind-induced water stage increases at the shores, resulting in water circulations similar to upwelling. The facts presented above show the complexity of the problem of short-term (in this case, daily) water temperature fluctuations the highest amplitudes of which can occur practically at any depth.
The correlation between mean daily air temperature and water temperature amplitude (at a depth of 1 m) is evident (Figure 12). In the period of occurrence of ice cover, water temperature amplitudes are stable (i.e., approximate to 0 °C). This suggests the isolation of water from the effect of air temperatures (oscillating between −12 °C and +7 °C). Only in the preliminary phase of development of ice cover, cases of just several deviations from the above rule were recorded. Perhaps this is a consequence of a short-term break in a part of the ice cover. Over the short period of occurrence of ice phenomena (with no compact cover), a rapid increase in water temperature amplitudes is observed. In the longest of the designated periods, i.e., with no occurrence of ice phenomena, the courses of air temperatures and water temperature amplitudes are relatively similar. They reached the highest values in mid-August. From that moment until the first days of November, they evidently decreased. In the autumn phase of appearance of ice phenomena (with no ice cover), water temperature amplitudes surprisingly increased in comparison to the final period with no occurrence of ice phenomena. In the last of the designated periods, i.e., with ice cover, changes in air temperature (oscillating from −13 °C to +8 °C) had no effect on water temperature amplitudes, and were approximate to 0 °C. Therefore, the ice cover effectively isolated water under the ice from the effect of changes in air temperature.
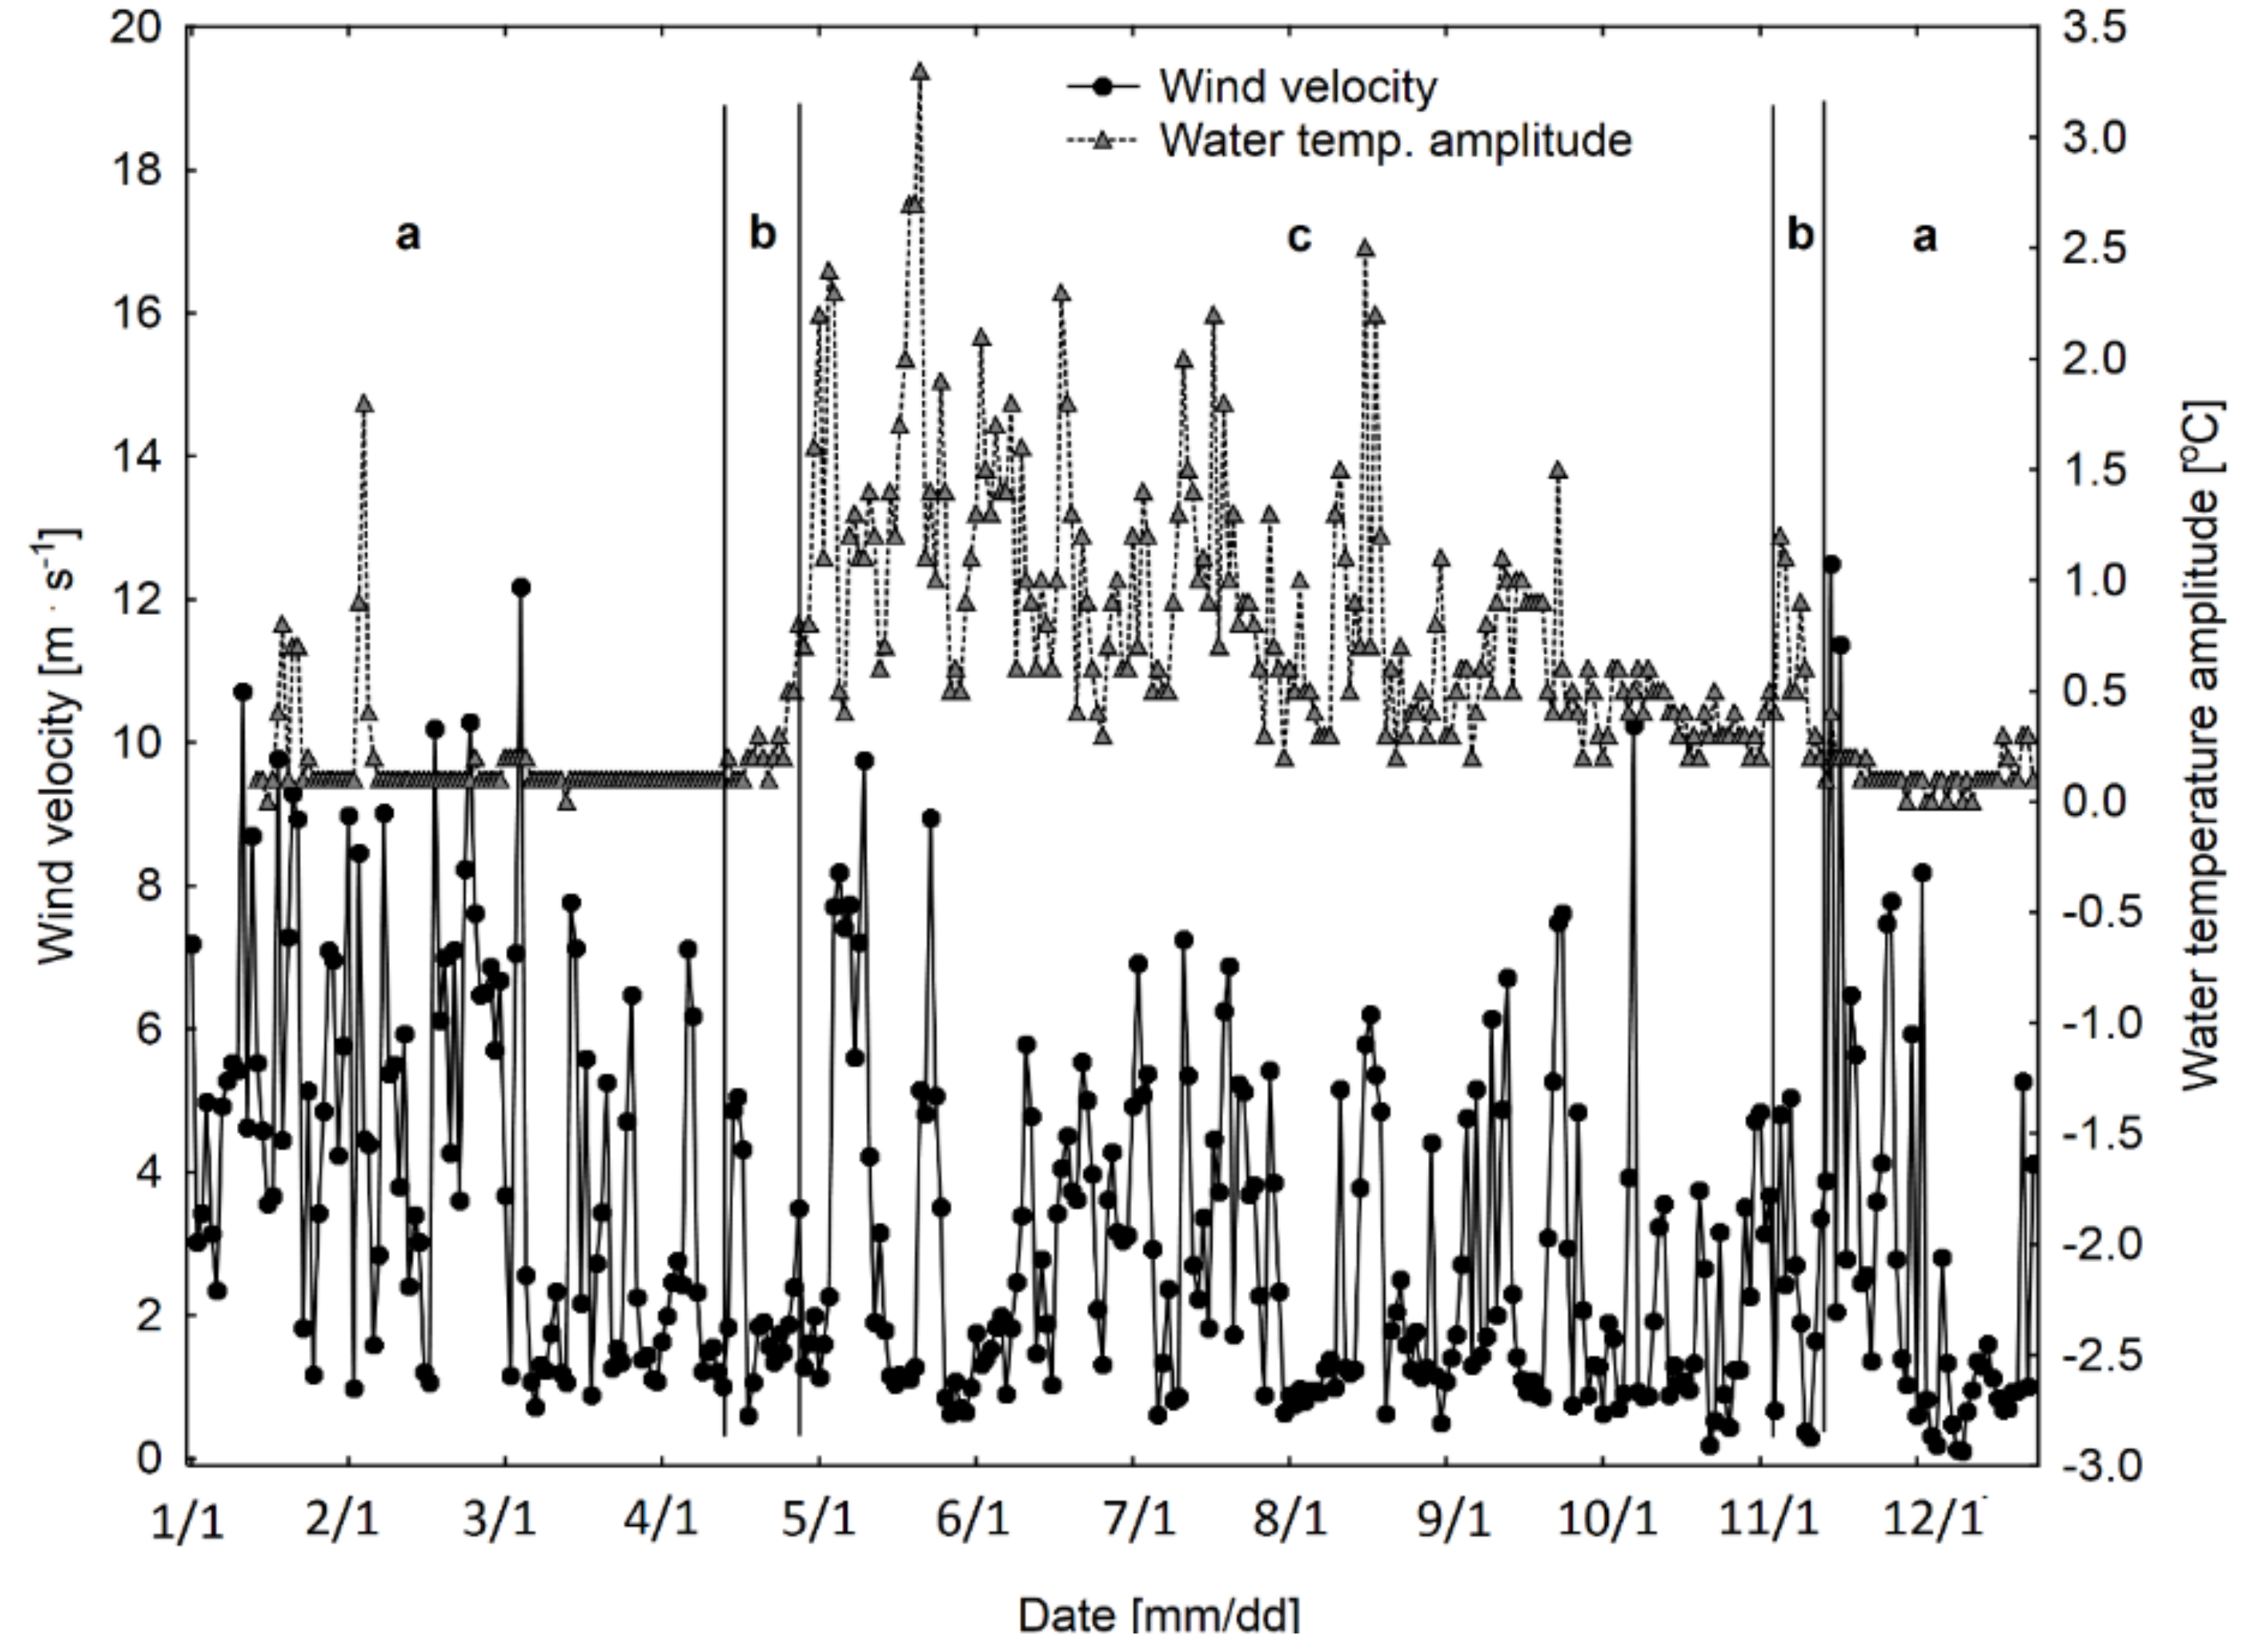
In terms of the effect of wind on water temperature amplitudes (Figure 13), the situation is generally similar to the previously analyzed pattern. In the period of occurrence of ice cover, in spite of considerable wind velocities, wind has no effect on water temperature amplitudes. Over only several days, an increase in water temperature amplitudes was recorded from 0 °C. This is associated with a temporary discontinuity of the ice cover. After the disappearance of ice cover (but still during the occurrence of ice phenomena), a slight effect of wind is observed, and water temperature amplitudes begin to increase, although only by a fraction of °C. After the decline of ice phenomena, an evident effect of wind activity is observed, i.e., water temperature amplitudes drastically increase, exceeding even 1.5 °C. An increase in wind velocity, however, is ambiguous, i.e., it does not always cause an increase in water temperature amplitude. Opposite situations are even recorded, when low wind velocities correspond with considerable amplitudes. From mid-August to the end of the period with no occurrence of ice, water temperature amplitudes reach inconsiderable values, although wind velocities throughout the period with no occurrence of ice are approximate. At the time of appearance of ice phenomena, water temperature amplitudes were low, and in the first phase of development of the ice cover, they still occurred. This could be caused by winds with high velocities of more than 10 m·s−1. After that period, water temperature amplitudes were stable and approximate to 0 °C. Only in the last days of December did they reach approximately 0.3, perhaps as a consequence of discontinued ice cover resulting from strong winds. Therefore, in the period with no ice, considerable wind velocities can force deeper water mixing, and consequently considerable changes in water temperature amplitudes. In the period with the occurrence of ice cover, changes in water temperatures, particularly directly under the ice, can be determined by under-ice circulation forced by water outflow from the lake.
Research on water temperature amplitudes seems to be strongly justified. Lack of amplitudes suggests water stagnation, while their occurrence and scale of variability provides information on the dynamics of movement of water masses.
5. Conclusions
The objective of the paper was to determine the degree to which an increase in depth contributed to the suppression of water temperature amplitudes, and therefore the degree to which the effect of external conditions diminishes. The discussed case is based on measurements performed over a period of one year in mountain Lake Morskie Oko (Tatra Mountains) at five depths every 10 min (more than 250 thousand data). The obtained data were divided into three subsets based on differences in the dynamics of changes, i.e., period with the occurrence of compact ice cover, with the occurrence of ice phenomena other than ice cover, and period when the water surface was free from any ice phenomena. The conducted research suggests that the short transitional period from ice cover to water surface free from ice constitutes a thresholds of significant effect of air temperature and wind on the water surface and its near-surface layers and also that near-bottom waters in Lake Morskie Oko are stable in terms of temperature, i.e., the amplitudes are low. This can have a practical aspect (year-round possibility of water intake for cooling for the purpose of obtaining heat energy). Moreover, it can be concluded that water temperature amplitudes (at different depths) can be generated (forced) by different factors, such as the effect of wind, changes in air temperature, intensive rainfall, inflow of groundwaters, circulation forced by outflow, insolation through the ice cover, heat released from sediments, surface runoff, etc. A task for the future is to determine the contribution of the effect of the aforementioned components. In the future, for the purpose of accurate determination of the depth affected by wind and air temperatures, increasing the density of the vertical distribution of sensors is advisable. At the same time, it has to be noted that the above paper discusses only one measurement profile. The next stage should involve spatial determination of water temperature amplitudes throughout the lake basin. This would provide the basis for the development of a model of water dynamics throughout the water depths. Last, but not least, the research has both cognitive and practical significance, because understanding of changes in water temperature and the variability of its heat resources are closely related, and these in the future will certainly be used on a large scale. The heat of the Morskie Oko waters can be used, for example, for heating the nearby tourist shelter.
Author Contributions
Conceptualization, A.C.; Data curation, A.C.; Formal analysis, A.S.; Investigation, A.C. and A.S.; Methodology, A.S.; Supervision, A.C.; Visualization, A.S.; Writing—original draft, A.C.; Writing—review & editing, A.C.
Funding
This research received no external funding.
Conflicts of Interest
The authors declare no conflict of interest.
References
- Skowron, R.; Piasecki, A. Water Temeprature and its Diversity in the Deepest Lakes of the Tuchola Forest and the Kashubian and Brodnickie Lakelands. Bull. Geogr. Phys. Geogr. Ser. 2014, 7, 105–119. [Google Scholar]
- Ptak, M.; Nowak, B. Thermal-oxygen conditions in Lake Białe Włodawskie in the summer half-year (2012–2015). Ann. Univ. Mariae Curive-Sklodowska Sect. B 2016, 71, 61–71. [Google Scholar]
- Ptak, M.; Nowak, B. Thermal-oxygen conditions in Lake Roś and Rospuda Filipowska (north-eastern Poland) in the summer half-year 2005–2014. Pol. J. Nat. Sci. 2017, 32, 343–355. [Google Scholar]
- Dąbrowski, M.; Marszalewski, W.; Skowron, R. The trends and dependancies between air and water temperatures in the lakes located in Northern Poland in the years 1961–2000. Hydrol. Earth Syst. Sci. 2004, 79–87. [Google Scholar] [CrossRef]
- Girjatowicz, J.P. Effects of the North Atlantic Oscillation on water temperature in southern Baltic coastal lakes. Ann. Limnol. 2011, 47, 73–84. [Google Scholar] [CrossRef]
- Ptak, M.; Choiński, A.; Piekarczyk, J.; Pryłowski, T. Application of Landsat satellite thermal images in the analysis of the temperature of Polish lakes. Pol. J. Environ. Stud. 2017, 26, 2159–2165. [Google Scholar] [CrossRef]
- Czernecki, B.; Ptak, M. The impact of global warming on lake surface water temperature in Poland—The application of empirical-statistical downscaling, 1971–2010. J. Limnol. 2018. [CrossRef]
- Ptak, M.; Tomczyk, A.M.; Wrzesiński, D. Effect of teleconnection patterns on changes in water temperature in Polish lakes. Atmosphere 2018, 9, 66. [Google Scholar] [CrossRef]
- Hutchinson, G.E. A Treatise on Limnology, Geography, Physics and Chemistry; Department of Zoology Yale University: New York, NY, USA, 1957; Volume 1, p. 1013. [Google Scholar]
- Frempong, E. Diel aspects of the thermal structure and energy budget of a small English lake. Freshw. Boil. 1983, 13, 89–102. [Google Scholar] [CrossRef]
- Houser, J. Water color affects the stratification, surface temperature, heat content, and mean epilimnetic irradiance of small lakes. Can. J. Fish. Aquat. Sci. 2006, 63, 2447–2455. [Google Scholar] [CrossRef]
- Wilhelm, S.; Hintze, T.; Livingstone, D.M.; Adrian, R. Long-term response of daily epilimnetic temperature extrema to climate forcing. Can. J. Fish. Aquat. Sci. 2006, 63, 2467–2477. [Google Scholar] [CrossRef]
- Woolway, R.I.; Jones, I.D.; Feuchtmayr, H. A comparison of the diel variability in epilimnetic temperature for five lakes in the English Lake District. Inland Waters 2015, 5, 139–154. [Google Scholar] [CrossRef]
- Woolway, R.I.; Livingstone, D.M.; Kernan, M. Altitudinal dependence of a statistically significant diel temperature cycle in Scottish lochs. Inland Waters 2015, 5, 311–316. [Google Scholar] [CrossRef]
- Woolway, R.I.; Jones, I.D.; Maberly, S.C.; French, J.R.; Livingstone, D.M.; Monteith, D.T.; Simpson, G.L.; Thackeray, S.J.; Andersen, M.R.; Battarbee, R.W.; et al. Diel surface temperature range scales with lake size. PLoS ONE 2016, 11, e0152466. [Google Scholar] [CrossRef] [PubMed] [Green Version]
- Baikal, A. Federal Service of Geodesy and Cartography of Russia; Russian Academy of Sciences, Siberian Division: Moscow, Russia, 1993; p. 160. (In Russian) [Google Scholar]
- Choiński, A.; Kanikowski, J. Fluctuations in water temperature of Lake Zamkowe. Limnol. Rev. 2004, 4, 33–44. [Google Scholar]
- Łyczkowska, G. Termika wód Wielkiego Stawu w Karkonoszach; [Thermal dynamics of the waters of Lake Wielki Staw in the Karkonosze Mountains]; Wydawnictwo Naukowe UAM: Poznań, Poland, 2009; p. 135. (In Polish) [Google Scholar]
- Kainz, M.J.; Ptacnik, R.; Rasconi, S.; Hager, H.H. Irregular changes in lake surface water temperature and ice cover in subalpine Lake Lunz, Austria. Inland Waters 2017, 7, 27–33. [Google Scholar] [CrossRef] [Green Version]
- Ptak, M.; Nowak, B. Variability of oxygen-thermal conditions in selected lakes in Poland. Ecol. Chem. Eng. S. 2016, 23, 639–650. [Google Scholar] [CrossRef]
- Murfitt, J.; Brown, L.C. Lake ice and temperature trends for Ontario and Manitoba: 2001 to 2014. Hydrol. Process. 2017, 31, 3596–3609. [Google Scholar] [CrossRef]
- Ptak, M.; Sojka, M.; Choiński, A.; Nowak, B. Effect of environmental conditions and morphometric parameters on surface water temperature in Polish lakes. Water 2018, 10, 580. [Google Scholar] [CrossRef]
- Magee, M.R.; Wu, C.H.; Robertson, D.M.; Lathrop, R.C.; Hamilton, D.P. Trends and abrupt changes in 104 years of ice cover and water temperature in a dimictic lake in response to air temperature, wind speed, and water clarity drivers. Hydrol. Earth Syst. Sci. 2016, 20, 1681–1702. [Google Scholar] [CrossRef] [Green Version]
- Magee, M.R.; Wu, C.H. Effects of changing climate on ice cover in three morphometrically different lakes. Hydrol. Process. 2017, 31, 308–323. [Google Scholar] [CrossRef]
- Hewitt, B.A.; Lopez, L.S.; Gaibisels, K.M.; Murdoch, A.; Higgins, S.N.; Magnuson, J.J.; Paterson, A.M.; Rusak, J.A.; Yao, H.; Sharma, S. Historical trends, drivers, and future projections of ice phenology in small north temperate lakes in the Laurentian Great Lakes Region. Water 2018, 10, 70. [Google Scholar] [CrossRef]
- Choiński, A.; Ptak, M.; Skowron, R.; Strzelczak, A. Changes in ice phenology on polish lakes from 1961–2010 related to location and morphometry. Limnologica 2015, 53, 42–49. [Google Scholar] [CrossRef]
- Pu, X.; Yang, S.; Pu, X.; Cheng, H.; Tysklind, M.; Xie, J.; Lu, L. Occurrence of water phosphorus at the water-sediment interface of a freshwater shallow lake: Indications of lake chemistry. Ecol. Indic. 2017, 81, 443–452. [Google Scholar] [CrossRef]
- Abdel-Satar, A.M.; Ali, M.H.; Goher, M.E. Distribution and speciation of Fe, Mn, Zn, Cu, Pb and P in surface sediments of Lake Mariut, Egypt. Oceanol. Hydrobiol. Stud. 2017, 46, 154–167. [Google Scholar] [CrossRef]
- Choiński, A.; Kolendowicz, L.; Pociask-Karteczka, J.; Sobkowiak, L. Changes in lake ice cover on the Morskie Oko Lake in Poland (1971–2007). Adv. Clim. Chang. Res. 2010, 1, 71–75. [Google Scholar] [CrossRef]
- Pociask-Karteczka, J.; Choiński, A. Recent trends in ice cover duration for Lake Morskie Oko (Tatra Mountains, East-Central Europe). Hydrol. Res. 2012, 43, 500–506. [Google Scholar] [CrossRef] [Green Version]
- Choiński, A.; Heese, T.; Oberski, T. The infrared camera: A tool for mountain lakes research. Limnol. Rev. 2013, 13, 129–138. [Google Scholar] [CrossRef]
- Sienkiewicz, E.; Gąsiorowski, M. Changes in the Trophic Status of Three Mountain Lakes—Natural or Anthropogenic Process? Pol. J. Environ. Stud. 2014, 23, 875–892. [Google Scholar]
- Kurzyca, I.; Choiński, A.; Pociask-Karteczka, J.; Lawniczak, A.; Frankowski, M. Terms and conditions of high-mountain lake ice-cover chemistry (Carpathians, Poland). J. Glaciol. 2015, 61, 1207–1212. [Google Scholar] [CrossRef]
- Ptak, M.; Wrzesiński, D.; Choiński, A. Long-term changes in the hydrological regime of high mountain lake Morskie Oko (Tatra Mountains, Central Europe). J. Hydrol. Hydromech. 2017, 65, 146–153. [Google Scholar] [CrossRef]
- Skowron, R. The Differentiation and the Changeability of Chosen Elements of the Thermal Regime of Water in Lakes on Polish Lowland; Wyd. Nauk. UMK: Toruń, Poland, 2011; p. 345. (In Polish) [Google Scholar]
- Haberman, J.; Nõges, P.; Nõges, T.; Pihu, E.; Kangur, K.; Kangur, A.; Kisand, V. Characterization of Lake Võrtsjärv. Limnologica 1998, 28, 3–11. [Google Scholar]
- Choiński, A.; Ptak, M.; Strzelczak, A. Areal variation in ice cover thickness on lake Morskie Oko (Tatra Mountains). Carpath. J. Earth Environ. Sci. 2013, 8, 97–102. [Google Scholar]
- Choiński, A.; Ptak, M.; Strzelczak, A. Changeability of accumulated heat content in alpine-type lakes. Pol. J. Environ. Stud. 2015, 24, 2363–2369. [Google Scholar] [CrossRef]
- Öterler, B. Winter Phytoplankton Composition Occurring in a Temporarily Ice-Covered Lake: A Case Study. Pol. J. Environ. Stud. 2017, 26, 2677–2688. [Google Scholar] [CrossRef]
- Schneider, P.; Hook, S.J. Space observations of inland water bodies show rapid surface warming since 1985. Geophys. Res. Lett. 2010, 37, L22405. [Google Scholar] [CrossRef]
- O’Reilly, C.M.; Sharma, S.; Gray, D.K.; Hampton, S.E.; Read, J.S.; Rowley, R.J.; Schneider, P.; Lenters, J.D.; McIntyre, P.B.; Kraemer, B.M.; et al. Rapid and highly variable warming of lake surface waters around the globe. Geophys. Res. Lett. 2015. [CrossRef]
- Woolway, R.I.; Merchant, C.J. Amplified surface temperature response of cold, deep lakes to inter-annual air temperature variability. Sci. Rep. 2017, 7, 4130. [Google Scholar] [CrossRef] [PubMed]
- France, R. Land-water linkages: Influences of riparian deforestation on lake thermocline depth and possible consequences for cold stenotherms. Can. J. Fish. Aquat. Sci. 1997, 54, 1299–1305. [Google Scholar] [CrossRef]
- Tanentzap, A.J.; Norman, D.Y.; Keller, B.; Girard, R.; Heneberry, J.; Gunn, J.M.; Hamilton, D.P.; Taylor, P.A. Cooling lakes while the world warms: Effects of forest regrowth and increased dissolved organic matter on the thermal regime of a temperate, urban lake. Limnol. Oceanogr. 2008, 53, 404–410. [Google Scholar] [Green Version]
- Yoshimura, S. A contribution to the knowledge of deep water temperatures of Japanese Lakes. Jpn. J. Astron. Geophys. 1936, 13, 57–82. [Google Scholar]
- Woolway, R.I.; Meinson, P.; Nõges, P.; Jones, I.D.; Laas, A. Atmospheric stilling leads to prolonged thermal stratification in a large shallow polymictic lake. Clim. Chang. 2017, 141, 759–773. [Google Scholar] [CrossRef] [Green Version]
Figure 1.
Changes in water temperature amplitudes in time at a depth of 1 m. a—presence of ice cover; b—occurrence of ice phenomena; c—lack of ice cover/ice phenomena.
Figure 1.
Changes in water temperature amplitudes in time at a depth of 1 m. a—presence of ice cover; b—occurrence of ice phenomena; c—lack of ice cover/ice phenomena.

Figure 2.
Changes in water temperature amplitudes in time at a depth of 5 m. a—presence of ice cover; b—occurrence of ice phenomena; c—lack of ice cover/ice phenomena.
Figure 2.
Changes in water temperature amplitudes in time at a depth of 5 m. a—presence of ice cover; b—occurrence of ice phenomena; c—lack of ice cover/ice phenomena.

Figure 3.
Changes in water temperature amplitudes in time at a depth of 10 m. a—presence of ice cover; b—occurrence of ice phenomena; c—lack of ice cover/ice phenomena.
Figure 3.
Changes in water temperature amplitudes in time at a depth of 10 m. a—presence of ice cover; b—occurrence of ice phenomena; c—lack of ice cover/ice phenomena.

Figure 4.
Changes in water temperature amplitudes in time at a depth of 20 m. a—presence of ice cover; b—occurrence of ice phenomena; c—lack of ice cover/ice phenomena.
Figure 4.
Changes in water temperature amplitudes in time at a depth of 20 m. a—presence of ice cover; b—occurrence of ice phenomena; c—lack of ice cover/ice phenomena.

Figure 5.
Changes in water temperature amplitudes in time at a depth of 50 m. a—presence of ice cover; b—occurrence of ice phenomena; c—lack of ice cover/ice phenomena.
Figure 5.
Changes in water temperature amplitudes in time at a depth of 50 m. a—presence of ice cover; b—occurrence of ice phenomena; c—lack of ice cover/ice phenomena.

Figure 6.
Correlation between water temperature amplitude and depth in Lake Morskie Oko. Temperature profile Type 1. The dates for each line are described in detail in the text above.
Figure 6.
Correlation between water temperature amplitude and depth in Lake Morskie Oko. Temperature profile Type 1. The dates for each line are described in detail in the text above.

Figure 7.
Correlation between water temperature amplitude and depth in Lake Morskie Oko. Temperature profile Type 2. The dates for each line are described in detail in the text above.
Figure 7.
Correlation between water temperature amplitude and depth in Lake Morskie Oko. Temperature profile Type 2. The dates for each line are described in detail in the text above.

Figure 8.
Correlation between water temperature amplitude and depth in Lake Morskie Oko. Temperature profile Type 3. The dates for each line are described in detail in the text above.
Figure 8.
Correlation between water temperature amplitude and depth in Lake Morskie Oko. Temperature profile Type 3. The dates for each line are described in detail in the text above.

Figure 9.
Correlation between water temperature amplitude and depth in Lake Morskie Oko. Temperature profile Type 4. The dates for each line are described in detail in the text above.
Figure 9.
Correlation between water temperature amplitude and depth in Lake Morskie Oko. Temperature profile Type 4. The dates for each line are described in detail in the text above.

Figure 10.
Correlation between water temperature amplitude and depth in Lake Morskie Oko. Temperature profile Type 5. The dates for each line are described in detail in the text above.
Figure 10.
Correlation between water temperature amplitude and depth in Lake Morskie Oko. Temperature profile Type 5. The dates for each line are described in detail in the text above.

Figure 11.
Correlation between water temperature amplitude and depth in Lake Morskie Oko. Temperature profile Type 6. The dates for each line are described in detail in the text above.
Figure 11.
Correlation between water temperature amplitude and depth in Lake Morskie Oko. Temperature profile Type 6. The dates for each line are described in detail in the text above.

Figure 12.
Changes in mean daily air temperatures and water temperature amplitudes in time at a depth of 1 m. a—presence of ice cover; b—occurrence of ice phenomena; c—lack of ice cover/ice phenomena.
Figure 12.
Changes in mean daily air temperatures and water temperature amplitudes in time at a depth of 1 m. a—presence of ice cover; b—occurrence of ice phenomena; c—lack of ice cover/ice phenomena.

Figure 13.
Changes in mean daily wind velocity and water temperature amplitudes in time at a depth of 1 m. a—presence of ice cover; b—occurrence of ice phenomena; c—lack of ice cover/ice phenomena.
Figure 13.
Changes in mean daily wind velocity and water temperature amplitudes in time at a depth of 1 m. a—presence of ice cover; b—occurrence of ice phenomena; c—lack of ice cover/ice phenomena.


Table 1.
Temperature amplitudes in the study terms of 2007 at particular depths in Lake Morskie Oko.
Table 1.
Temperature amplitudes in the study terms of 2007 at particular depths in Lake Morskie Oko.
| Depth [m] | Ice Cover A | Ice Phenomena B | Free Water Surface C |
|---|---|---|---|
| 1 * | 0.1 (0.0; 1.8) B,C | 0.25 (0.1; 2.2) A,C | 0.6 (0.2; 3.3) A,B |
| 5 * | 0.1 (0.0; 0.3) C | 0.1 (0.0; 0.6) C | 0.4 (0.0; 3.3) A,B |
| 10 * | 0.0 (0.0; 0.2) B,C | 0.1 (0.0; 0.4) A,C | 0.8 (0.0; 4.1) A,B |
| 20 * | 0.01 (0.0; 0.3) C | 0.0 (0.0; 0.7) C | 0.4 (0.0; 1.3) A,B |
| 50 * | 0.1 (0.0; 0.3) B,C | 0.1 (0.1;0.6) A | 0.1 (0.0; 0.6) A |
* Statistically significant differences at a given depth (Kruskal-Wallis test, p < 0.05); A,B,C Statistically significant differences at a given depth between consecutive periods (Dunn’s test, p < 0.05)
Table 2.
Results of Spearman’s rank correlation analysis between temperature amplitudes at particular depths in Lake Morskie Oko during the occurrence of ice cover (a), during the occurrence of ice phenomena (b), and in the period with no ice cover or ice phenomena (c).
Table 2.
Results of Spearman’s rank correlation analysis between temperature amplitudes at particular depths in Lake Morskie Oko during the occurrence of ice cover (a), during the occurrence of ice phenomena (b), and in the period with no ice cover or ice phenomena (c).
| Depth [m] | Depth [m] | |||||
|---|---|---|---|---|---|---|
| Period | 1 | 5 | 10 | 20 | 50 | |
| 1 | a | 1.00 | 0.30 * | 0.16 | 0.24 * | 0.24 * |
| b | 1.00 | 0.74 * | 0.30 | 0.54 * | 0.48 * | |
| c | 1.00 | 0.62 * | 0.43 * | 0.18 * | −0.03 | |
| 5 | a | 0.30 * | 1.00 | 0.06 | 0.27 * | 0.20 * |
| b | 0.74 * | 1.00 | 0.46 * | 0.67 * | 0.57 * | |
| c | 0.62 * | 1.00 | 0.71 * | 0.33 * | −0.13 | |
| 10 | a | 0.16 | 0.06 | 1.00 | 0.34 * | −0.04 |
| b | 0.30 | 0.46 * | 1.00 | 0.30 | 0.55 * | |
| c | 0.43 * | 0.71 * | 1.00 | 0.61 * | −0.20 * | |
| 20 | a | 0.24 * | 0.27 * | 0.34 * | 1.00 | −0.10 |
| b | 0.54 * | 0.67 * | 0.30 | 1.00 | 0.37 | |
| c | 0.18 * | 0.33 * | 0.61 * | 1.00 | −0.06 | |
| 50 | a | 0.24 * | 0.20 * | −0.04 | −0.10 | 1.00 |
| b | 0.48 * | 0.57 * | 0.55 * | 0.37 | 1.00 | |
| c | −0.03 | −0.13 | −0.20 * | −0.06 | 1.00 | |
* statistically significant correlation coefficients (p < 0.05).
Table 3.
Parameters of Gumbel’s distribution for temperature amplitudes in Lake Morskie Oko at particular depths (1–50 m) during the occurrence of ice cover, during the occurrence of ice phenomena, and in the period with no ice cover or ice phenomena.
Table 3.
Parameters of Gumbel’s distribution for temperature amplitudes in Lake Morskie Oko at particular depths (1–50 m) during the occurrence of ice cover, during the occurrence of ice phenomena, and in the period with no ice cover or ice phenomena.
| Period | Depth [m] | Parameters of Gumbel Distribution | |
|---|---|---|---|
| Location Parameter a | Scale Parameter b | ||
| Ice cover | 1 | 0.099 | 0.070 |
| 5 | 0.056 | 0.052 | |
| 10 | 0.022 | 0.041 | |
| 20 | 0.028 | 0.047 | |
| 50 | 0.045 | 0.050 | |
| Ice phenomena | 1 | 0.284 | 0.272 |
| 5 | 0.118 | 0.075 | |
| 10 | 0.095 | 0.051 | |
| 20 | 0.030 | 0.062 | |
| 50 | 0.105 | 0.037 | |
| Free water surface | 1 | 0.610 | 0.383 |
| 5 | 0.426 | 0.374 | |
| 10 | 0.616 | 0.552 | |
| 20 | 0.344 | 0.201 | |
| 50 | 0.097 | 0.064 | |
Table 4.
Results of Spearman’s rank correlation analysis between air temperature, wind velocity, and temperature amplitude at level A (1 m depth) of Morskie Oko in the presence of ice cover, during the occurrence of ice phenomena, and in the period with no ice cover/ice phenomena for various types of profiles of temperature amplitudes.
| Air Temperature | Wind Velocity | ||
|---|---|---|---|
| Water temperature amplitudes at 1 m depth | Ice cover | 0.11 | 0.32 * |
| Ice phenomena | −0.05 | −0.04 | |
| Free water surface | 0.58 * | 0.30 * | |
| Type 1 | 0.71 * | −0.09 | |
| Type 2 | 0.39 * | 0.28 | |
| Type 3 | 0.44 | 0.50 * | |
| Type 4 | 0.59 * | 0.39 * | |
| Type 5 | 0.94 * | 0.23 | |
| Type 6 | −0.42 | 0.69 * | |
* statistically significant correlation coefficients (p < 0.05).
© 2018 by the authors. Licensee MDPI, Basel, Switzerland. This article is an open access article distributed under the terms and conditions of the Creative Commons Attribution (CC BY) license (http://creativecommons.org/licenses/by/4.0/).
Share and Cite
MDPI and ACS Style
Choiński, A.; Strzelczak, A. Variability of Short-Term Diel Water Temperature Amplitudes in a Mountain Lake. Water 2018, 10, 795. https://doi.org/10.3390/w10060795
AMA Style
Choiński A, Strzelczak A. Variability of Short-Term Diel Water Temperature Amplitudes in a Mountain Lake. Water. 2018; 10(6):795. https://doi.org/10.3390/w10060795
Chicago/Turabian StyleChoiński, Adam, and Agnieszka Strzelczak. 2018. "Variability of Short-Term Diel Water Temperature Amplitudes in a Mountain Lake" Water 10, no. 6: 795. https://doi.org/10.3390/w10060795
Note that from the first issue of 2016, this journal uses article numbers instead of page numbers. See further details here.