COD Discharge Limits for Urban Wastewater Treatment Plants in China Based on Statistical Methods

1
College of Water Sciences, Beijing Normal University, Beijing 100875, China
2
Environmental Standards Institution, Chinese Research Academy of Environmental Sciences, Beijing 100012, China
3
Beijing Municipal Research Institute of Environmental Protection, State Environmental Protection and Industrial Wastewater Pollution Control Engineering and Technology (Beijing) Center, Beijing 100037, China
*
Author to whom correspondence should be addressed.
Water 2018, 10(6), 777; https://doi.org/10.3390/w10060777
Submission received: 18 May 2018
/
Revised: 5 June 2018
/
Accepted: 11 June 2018
/
Published: 13 June 2018
(This article belongs to the Section Wastewater Treatment and Reuse)
Abstract
:Discharge standards are among the most important regulations to control pollutants discharged from industries and domestic uses. China has made great efforts to build up its discharge standard system and develop methods to derive limits. However, there is still a lack of systematic analysis of measured data and derivation of discharge limits based on statistical methods. The present study, taking chemical oxygen demand (COD) discharge limits of urban wastewater treatment plants (WWTPs) as an example, reviews the history of discharge standards of WWTPs in China and analyzes the statistical distributions of COD concentrations from 1753 WWTPs. Based on the lognormal distribution, three factors—geographic location, treatment process, and ratio of treated wastewater from industries—were found to be significantly correlated with logarithmic COD concentrations via a regression model and long-term averages of WWTPs were derived. Daily maximum variability factors for WWTPs based on the 99th percentile of the distribution of daily measurements and the discharge limits for WWTPs were also derived by multiplying long-term averages by variability factors. This study develops, for the first time in China, discharge limits based on statistical methods. The results may inform special discharge limit settings for different types of WWTPs.
1. Introduction
As a form of legal enforcement, discharge standards have been designed to regulate end-of-pipe wastewater dischargers in China, as in most other countries. The national standard, “Integrated Wastewater Discharge Standard (GB 8978-1996)” [1], first established separate discharge limits for urban wastewater treatment plants (WWTPs). With development of environmental standard systems in the country, the national discharge standard of WWTPs (GB 18918-2002) [2] was established in 2002, which has played an important role in controlling water pollutants discharged from WWTPs. In 2006, the Ministry of Environmental Protection (MEP) of China released a modified announcement for GB 18918-2002 to strengthen protection of the water quality of lakes and reservoirs.
Standard GB 18918-2002, however, had some limitations. The setting of this standard was mainly based on treatment technology and without considering the impact of geographic location, WWTP size, or the ratio of treated wastewater from industries [3]. Moreover, because of the limited data available at the time, there was also a shortage of measured data to evaluate the rationality of discharge limits. The application of statistical concepts to the establishment of wastewater discharge standards has been the subject of several articles [4,5,6,7,8,9,10,11,12,13]. From the 1980s, the U.S. Environmental Protection Agency (EPA) developed a systematic method to derive technically based discharge limits using statistical analysis of discharge data and comprehensive evaluations of factors such as location and wastewater characteristics that might influence discharge concentration levels [14,15]. Both European Union (EU) directives concerning urban wastewater treatment [16] and limits on domestic and municipal wastewater in Germany [17] set different discharge limits for WWTPs on different scales, demonstrating that EU countries pay substantial attention to the influence to discharge concentrations caused by WWTP size. Furthermore, studies conducted by the EU have focused on the variations and statistical distributions of discharge concentrations, and the results have been considered in the development of discharge regulations [18,19]. Researchers in Korea have used statistical methods to improve the effluent standard in that country [20].
In recent years, China has made great efforts to collect discharge data and these data, especially from WWTPs, have been used to reveal statistical distributions for conventional pollutant discharge concentrations and evaluate the rationality of discharge standards [21,22]. Some researchers have assessed the effluent quality of WWTPs based on percentiles of the standard compliance method [23]. However, these studies mainly concerned a single city or river basin in China and therefore did not give an overall perspective of WWTPs discharge situations. Some studies have mentioned that industrial streams can influence wastewater influent quality [24], but these studies did not discuss the exact correlation between factors and discharge concentrations using statistical measures. Furthermore, there has been a lack of systematic method for deriving discharge limits based on statistical approaches in China. In the present study, chemical oxygen demand (COD) was selected as the target pollutant, and the primary objective was to derive COD discharge limits of WWTPs using a statistical method. We also address factors that may affect COD discharge concentrations from different WWTPs. The result of this study may provide suggestions for COD discharge standard revisions in China.
2. Basic Information of WWTPs in China
According to the “Announcement of the Urban Wastewater Treatment Plants list in 2014” (the 35th announcement of the MEP, China, 2015), there were 4436 WWTPs in service, with a treatment capacity of 171 million m3/d and 135 million m3/d of treated wastewater. According to data in the announcement, the proportion of large-scale WWTPs (treatment capacity ≥ 0.1 million m3/d) in China was ~9.7%, while mid-scale (10 thousand m3/d ≤ treatment capacity < 0.1 million m3/d) and small-scale WWTPs (treatment capacity < 10 thousand m3/d) made up about 67.3% and 23.0%, respectively.
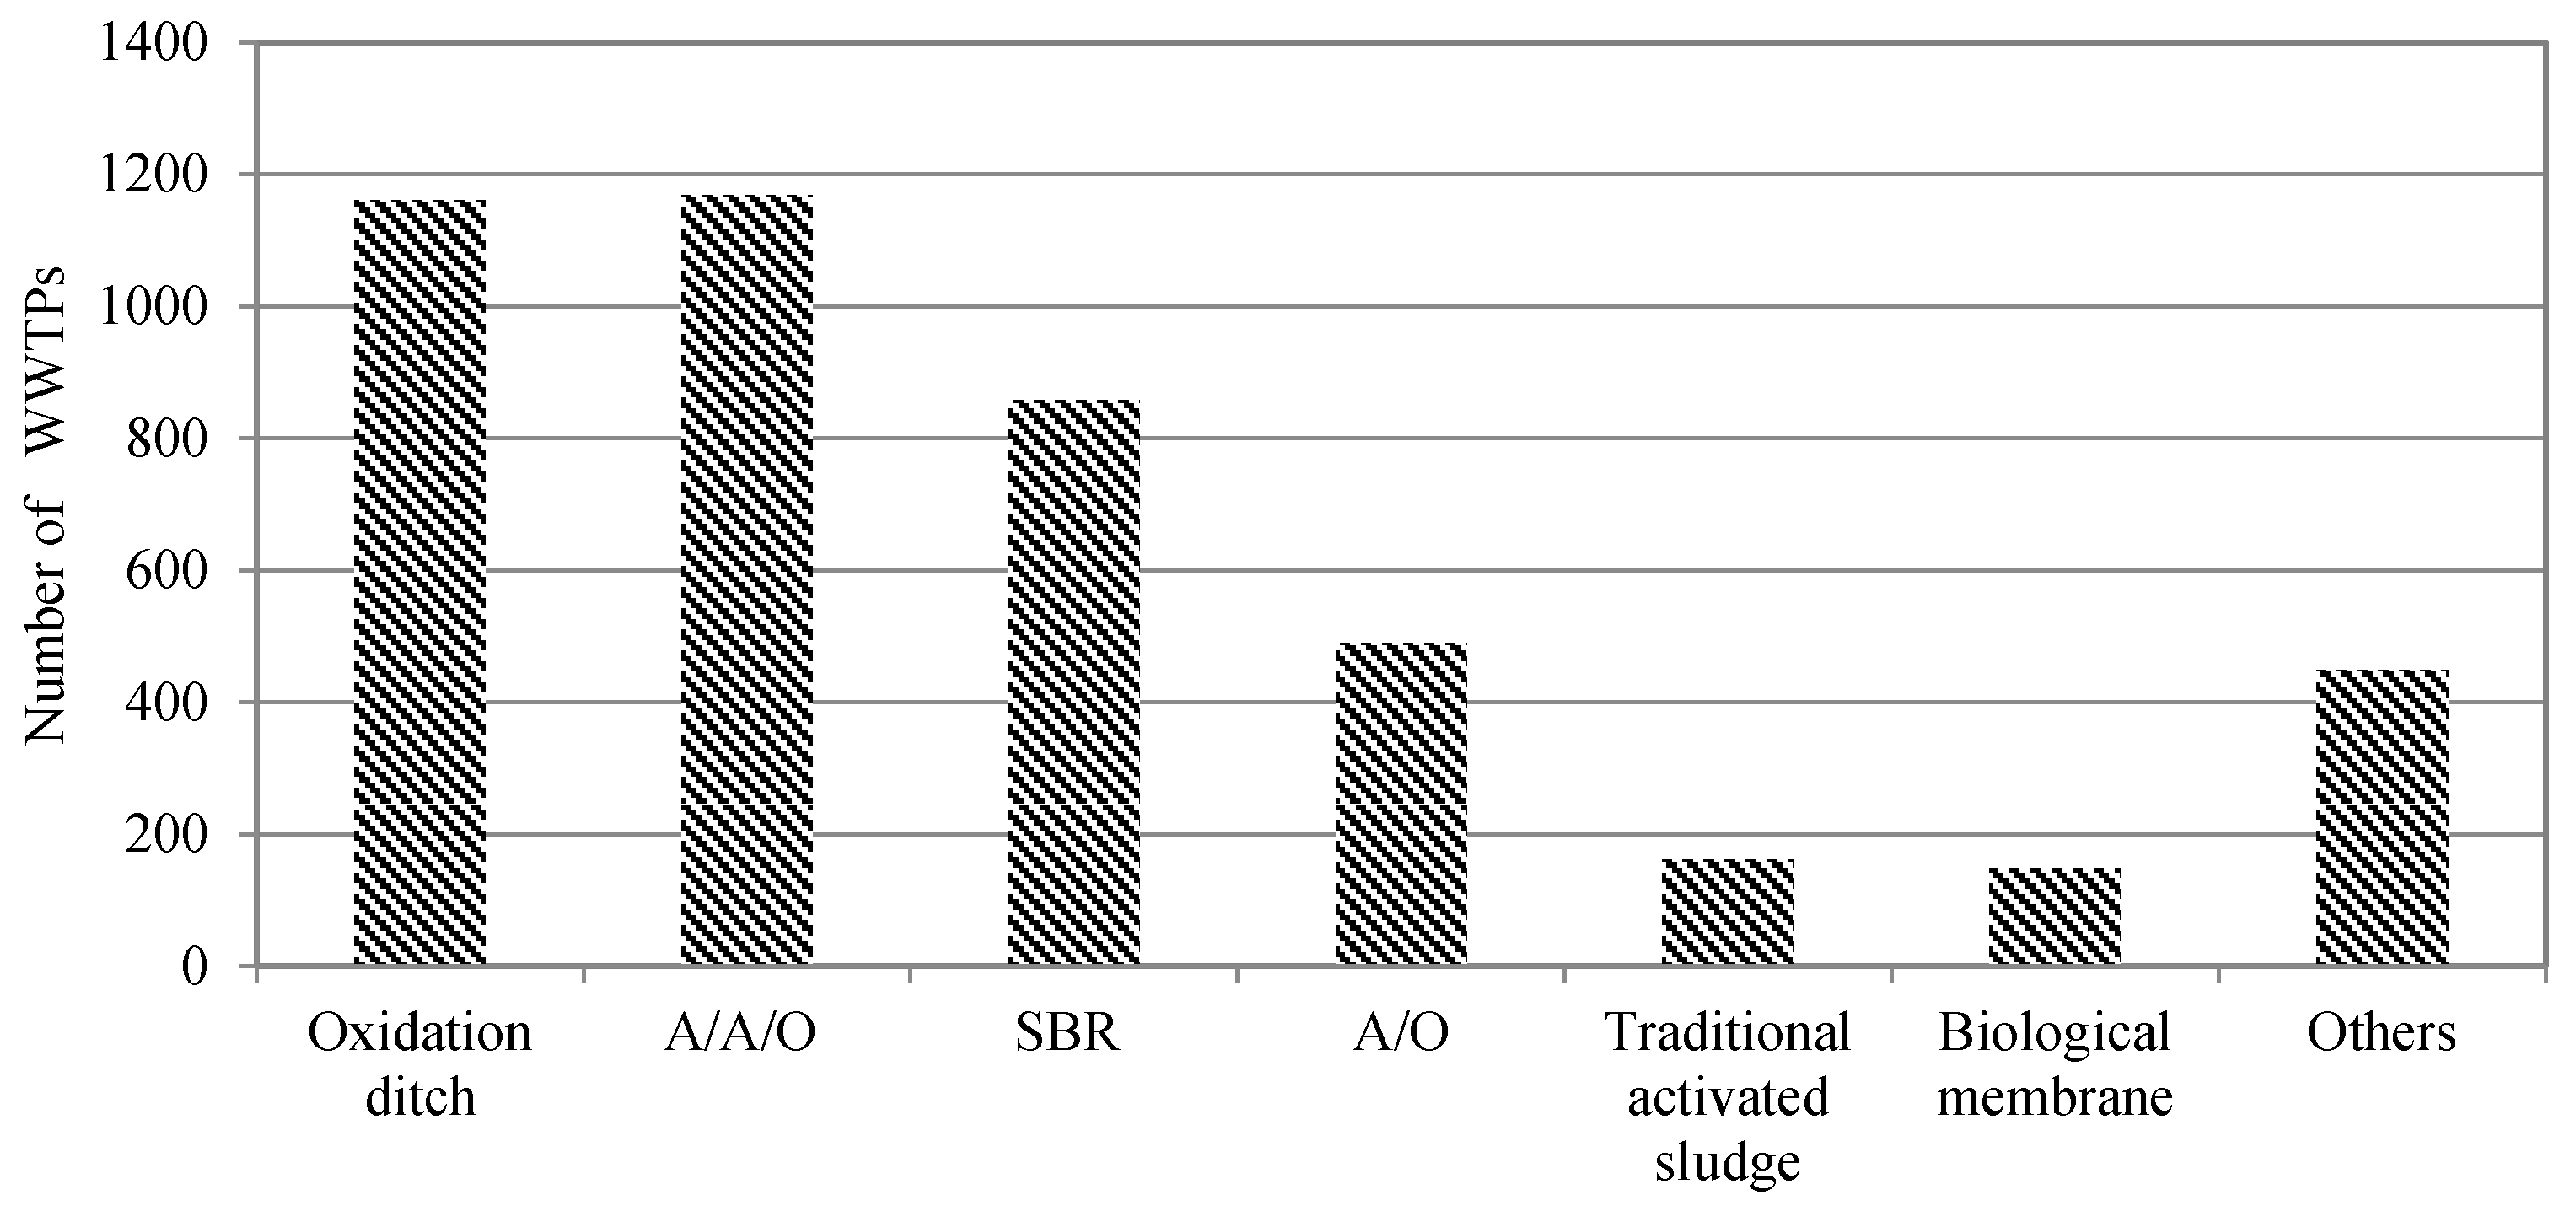
The data showed WWTPs in China mainly use six treatment techniques: oxidation ditch, anaerobic-anoxic-oxic (A/A/O), sequencing batch reactor (SBR), anoxic-oxic (A/O), activated sludge, and biological membrane (Figure 1). These six techniques were used in almost 89.9% of WWTPs, and the ratio of treated wastewater was ~91%.
WWTPs were allowed to receive wastewater from industries, and ~40% were receiving and treating industrial wastewater to varying extents. Some WWTPs in industrial zones even treated wastewater entirely from industries, which led to difficulties in meeting discharge standards.
3. History of Discharge Standards of WWTPs in China
“Integrated Wastewater Discharge Standard (GB 8978-1988)” [25] was the first standard to set discharge limits for WWTPs independently. It was amended in 1996 to “Integrated Wastewater Discharge Standard (GB 8978-1996)” [1]. After that, China has made requests for stricter control of wastewater discharge from WWTPs three times. In 2002, the “Discharge Standard of Pollutants for Municipal Wastewater Treatment Plant” (GB 18918-2002) [2] was issued, which focused on controlling wastewater from WWTPs and was much stricter than GB 8978-1996. Then, the amended GB 18918-2002 stipulated that WWTPs discharging wastewater to key rivers, lakes, and reservoirs must satisfy Grade 1-A standards of GB 18918-2002. The third issuance of “Water Pollution Prevention and Control Plan for Key River Basins in China (2011–2015)” requested that all WWTPs in key river basin areas implement Grade 1-B standards of GB 18918-2002 (other than the Grade 2 standards). Limits for certain parameters in the discharge standards of WWTPs in China are presented in Table 1.
4. Data and Methods
4.1. Data Source
In our study, automated monitoring data of COD concentrations discharged from 1753 WWTPs in 2015 were used as the data source. Among them, 139 were from Northeast China, 324 from the north, 615 from the east, 416 from the south, 81 from the northwest, and 178 from the southwest. Among the WWTPs, 185 were large-scale, 1385 were mid-scale, and 183 were small-scale. For treatment techniques, 106 WWTPs used the A/O process, 468 the A/A/O process, 347 the SBR process, 544 the oxidation ditch process, 185 the traditional activated sludge process, 45 the biological membrane process, and 58 used other techniques referring to some depth treatment processes (ozonation, etc.) used after second treatment. Regarding the ratio of industrial wastewater treated, 126 WWTPs were >70%, 63 WWTPs were between 50% and 70% (including 50%), and 1564 WWTPs were <50%. The selected WWTPs were representative of Chinese WWTPs for locations, sizes, treatment techniques, and ratios of received industrial wastewater.
4.2. Data Analysis
The data collected were COD concentrations sampled once per hour and analyzed mainly using dichromate method by the automated monitoring system. There were >7200 h of data for each WWTP. We eliminated negative and zero concentrations, which are invalid according to the “Technical Specifications for Validity of Wastewater Online Monitoring Data (HJ/T 356-2007)”. We also eliminated data for which COD concentrations were <10 mg/L because these data are below the method detection limit according to the “Water quality-Determination of the Chemical Oxygen Demand-Dichromate method (GB 11914-89)”. After that, daily arithmetic average concentrations of COD were calculated for days on which there were >18 h of data. We then obtained annual arithmetic average concentrations for each WWTP.
4.3. Methods
Discharge limits were derived by Equation (1) using the long-term average (LTA) multiplied by the variability factor (VF). This equation has been used by the U.S. EPA in developing limits for many industries, such as the Organic Chemicals, Plastics and Synthetic Fibers (OCPSF) industry [14]. In this equation, the average concentrations and fluctuations in the treatment systems are both considered. This reflects conditions that most treatment systems are capable of achieving and is therefore more suitable for setting the limits.
LTA is the target value that a plant’s treatment system should achieve on an average basis. In developing limits for the OCPSF industry, the EPA used a regression equation that accounts for multiple subcategory plants. After a full evaluation of many factors—such as manufacturing products or processes, raw materials, wastewater characteristics, facility size, geographic location, facility and equipment age, treatability, non-water quality environmental impacts, and energy requirements—the coefficients of the regression equation ultimately included the subcategory to which the facility belonged, the treatment process used, and the performance of wastewater treatment. The EPA then used the regression parameters to calculate conventional pollutant LTAs for each subcategory [14]. In the present study, we first determined the fitted statistical distribution of COD concentrations. Based on this distribution, we also made a regression model using SPSS 18.0 to address factors that might affect the WWTP COD concentration and used the regression parameters to derive the COD LTAs for WWTPs.
VF is the ratio of strong effluent to the average level, which expresses the relationship between large values and average treatment performance levels that a well-designed and well-operated treatment system should be capable of achieving all the time [15]. The U.S. EPA used the 99th and 95th percentiles to express the daily maximum and monthly average VFs, respectively [14,15]. Because the concept of monthly average was not used in China, we adopted the daily maximum 99th percentile VF in our study.
5. Results and Discussion
5.1. Statistical Distribution of COD Concentrations
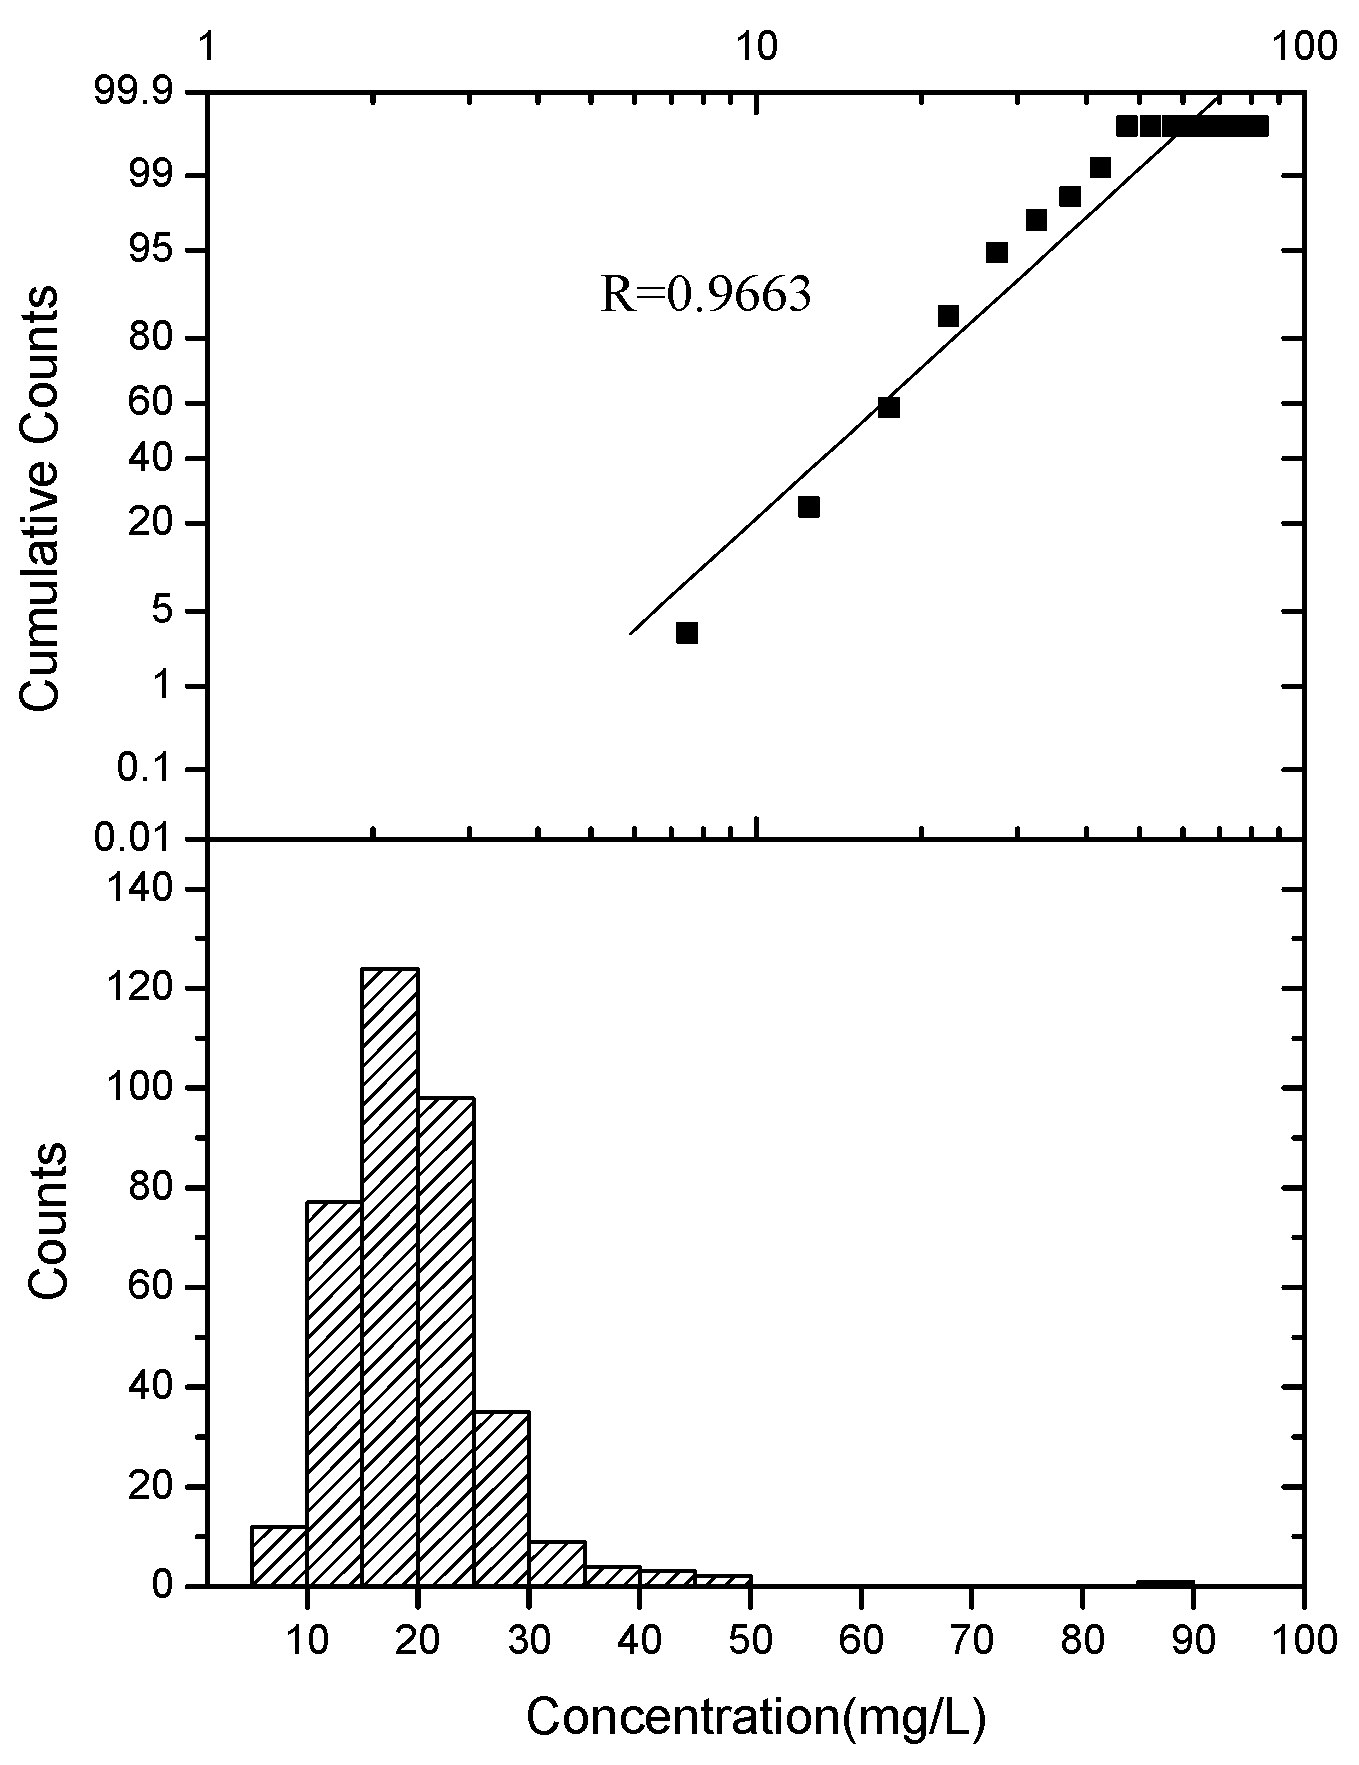
OriginPro 7.0 was used to analyze the COD data to determine the fitted statistical distribution. As shown in Figure 2 and Figure 3, with the logarithm of COD concentrations on the horizontal x-axis against the normal probabilities on the vertical y-axis, the lognormal distribution was seen for both the daily average COD concentrations of one of the WWTPs and the annual average concentrations of 1753 WWTPs. These results confirm that the lognormal distribution provides a reasonable and practical basis for further analyzing the COD data and determining the discharge limits, in accord with the EPA [14,15,27] and other research results [6,7,28,29]. The lognormal distribution of effluent concentrations is also consistent with other research [30,31,32,33].
5.2. Factors Influencing COD Concentrations and LTAs
Based on the lognormal distribution of the COD concentration, we constructed a regression model (Equation (2)) to estimate four factors that may influence the WWTP COD concentration, including WWTP size and geographic location, the treatment process, and the ratio of treated wastewater from industries.
where
is the size of WWTPs; 1 for large-scale (treatment capacity ≥ 0.1 million m3/d), 2 for mid-scale (10 thousand tons m3/d ≤ treatment capacity < 0.1 million m3/d), 3 for small-scale (treatment capacity < 10 thousand m3/d).
is the geographic location; 1 for Northeast China, 2 was for the north, 3 for the east, 4 for the south, 5 for the southwest, 6 for the northwest.
is the treatment process; 1 for a second treatment only, 2 for a second treatment with nitrogen and phosphorus controlled.
is the ratio of treated wastewater from industries; 1 for the ratio ≥70%, 2 for the ratio between 50% and 70% (including 50%), 3 for the ratio <50%.
Estimates of the five model parameters () were derived via:
The estimated results showed a significant linear relationship of the regression model, with the F-test p < 0.05. The three factors—the geographic location, treatment process, and ratio of treated wastewater from industries—showed significant correlations with the logarithm of COD concentration, with p2, p3, and p4 of the t-test all <0.05. There was a non-significant correlation between the size of WWTPs and the logarithm of COD concentration, with p1 = 0.085 > 0.05.
There was multicollinearity in the above regression model. Thus, we used stepwise regression to modify the model. The results showed that the three factors—the geographic location, treatment process, and ratio of treated wastewater from industries—were ultimately retained (Equation (4)). The F-test showed a significant linear relationship in the new model, with p2, p3, and p4 of the t-test all <0.05, proving that the three factors were significantly correlated with the logarithm of COD concentration. Furthermore, the largest regression parameter of revealed that the ratio of treated wastewater from industries strongly affected the COD concentration, which may be the most notable factor.
Considering eutrophication is a major problem in China and the treatment process for nitrogen and phosphorus control would be a basic requirement for WWTPs in the country, we let = 2, and the COD LTAs of WWTPs were derived using Equation (5). Results are shown in Table 2.
5.3. Daily Maximum Variability Factors
As mentioned above, the daily maximum VF was based on the 99th percentile of the distribution of daily measurements and the equations are as follows:
where
- is the daily maximum VF.
- is the estimated 99th percentile of COD concentration at a given plant.
- is the estimated expected value of COD concentration at a given plant.
- is the natural logarithm of COD effluent concentration; i = 1, …, n, where n represents the daily pollutant values measured at a given plant.
- is the estimated average of .
- is the estimated standard deviation of .
Following the above equations, we obtained the daily maximum VFs of 1753 WWTPs. According to the one-way analysis of variance, the three factors—the geographic location, treatment process, and ratio of treated wastewater from industries—were all non-significantly correlated with the VF(1), with p-values of the F-test all >0.05. We concluded that VF might be more related to operation management than the factors mentioned above.
5.4. Discharge Limits
We obtained the COD discharge limits for each classification (Table 2).
Considering the national discharge limits would be suitable for the entire country, we used the maximum values for each geographic location as the suggested COD discharge limits (Table 3).
We concluded that the Grade 1-B standard for COD (60 mg/L) in GB 18918-2002 was suitable for WWTPs that used a second treatment with nitrogen and phosphorus control and where the ratio of treated wastewater from industries <70%. However, that standard was strict for WWTPs with the ratio of treated wastewater from industries >70%.
Setting less strict discharge limits for WWTPs with a large ratio of received industry wastewater may be more aligned with practical situations in China. Even so, the complexity of industry wastewater discharged into WWTPs cause difficulties for wastewater treatment and may require other measures such as strengthened pretreatment by industries or the construction of special centralized wastewater treatment plants for factories belonging to the same type of industry.
Furthermore, the proposed limits are stricter than EU directives concerning urban wastewater treatment [16] in which the COD discharge limit is 125 mg/L for all kinds of WWTPs. In Germany, the COD discharge limits range from 75 mg/L to 150 mg/L for different scales WWTPs [17] based on random sample or 2 h composite sample. This means it is not possible to compare directly between the proposed limits based on daily average and the German limits. In the U.S., there are no discharge limits for COD in the secondary treatment regulations (40 CFR 133) in the EPA, so we cannot compare the limits between the proposed limits and U.S. limits either. Nonetheless, regardless of the EU directives or the regulations in Germany and the U.S., there have not been different limits for WWTPs with different ratios of received industry wastewater, and the proposed limits show the difference between China and other countries.
6. Conclusions
The present study fully demonstrates the procedure of COD discharge limits derived for WWTPs in China based on statistical methods. In this procedure, the statistical analysis demonstrated that the lognormal distribution was suitable for the COD discharge concentrations of WWTPs. Based on this finding, the study found that three factors—the geographic location, treatment process, and ratio of treated wastewater from industries—were significantly correlated with COD discharge concentrations. The last factor may be the most worthy of greater attention. The derived VF(1)s of WWTPs revealed that the COD fluctuations were not large and not significantly influenced by the three factors. This implies a relatively favorable situation of operation management of WWTPs in the country. Finally, the derived COD discharge limits suggest that it is necessary to establish less strict discharge limits for WWTPs that have a large ratio of received industry wastewater and that there should be other measures to control industrial wastewater discharged into the WWTPs.
Author Contributions
Methodology by Y.Z.; Writing—original draft by Y.Z. and H.F.; Writing—review and editing by N.D. and X.W.
Funding
This research received no external funding.
Conflicts of Interest
The authors declare no conflict of interest.
References
- Integrated Wastewater Discharge Standard (GB 8978-1996); Ministry of Environment Protection of China: Beijing, China, 1996. Available online: http://www.mep.gov.cn (accessed on 15 May 2018).
- Discharge Standard of Pollutants for Municipal Wastewater Treatment Plant (GB 18918-2002); Ministry of Environment Protection of China: Beijing, China, 2002. Available online: http://www.mep.gov.cn (accessed on 15 May 2018).
- Ma, S.H.; He, X.H. The brief introduction of discharge standard of urban wastewater treatment plant (GB 18918-2002). Water Wastewater Eng. 2003, 29, 89–94. [Google Scholar]
- Wheatland, A.B. Discussion statistical expression of effluent quality standards. Water Res. 1972, 6, 339–340. [Google Scholar] [CrossRef]
- Porter, K.S. Percentiles mean relation for effluent assessment. J. Environ. Eng. Div. 1975, 101, 473–478. [Google Scholar]
- Dean, R.B.; Forsythe, S.L. Estimating the reliability of advanced waste treatment. Part 1 and Part 2. Water Sew. Works 1976, 123, 87. [Google Scholar]
- Niku, S.; Schroeder, E.D. Stability of activated sludge processes based on statistical measures. J. Water Pollut. Control Fed. 1981, 53, 129–143. [Google Scholar]
- Niku, S.; Schroeder, E.D.; Samaniego, F.J. Performance of activated sludge processes and reliability-based design. J. Water Pollut. Control Fed. 1979, 51, 2841–2857. [Google Scholar]
- Niku, S.; Schroeder, E.D.; Tchobanoglous, G.; Samaniego, F.J. Performance of Activated Sludge Process: Reliability, Stability and Variability; EPA Grant No. R805097-01; United Sates Environmental Protection Agency: Washington, WA, USA, 1981.
- Niku, S.; Schroeder, E.D.; Haugh, R.S. Reliability and stability of trickling filter processes. J. Water Pollut. Control Fed. 1982, 54, 457–470. [Google Scholar]
- McBride, G.B.; Ellis, J.C. Confidence of compliance: A Bayesian approach for percentile standards. Water Res. 2001, 35, 1117–1124. [Google Scholar] [CrossRef]
- McBride, G.B. Confidence of compliance: Parametric versus nonparametric approaches. Water Res. 2003, 37, 3666–3671. [Google Scholar] [CrossRef]
- Metcalf Eddy. Wastewater Engineering: Treatment and Reuse, 4th ed.; Metcalf Eddy, Ed.; McGraw Hill Higher Education: New York, NY, USA, 2003; p. 1819. [Google Scholar]
- US EPA. Development Document for Effluent Guidelines and Standards for the Organic Chemicals, Plastics and Synthetic Fibers Point Source Category; United States Environmental Protection Agency: Washington, DC, USA, 1987.
- Henry, D.K.; Marvin, B.R. Use of statistical methods in industrial water pollution control regulations in the United States. Environ. Monit. Assess. 1989, 12, 129–148. [Google Scholar]
- EU. Council Directive of 21 May 1991 concerning urban waste water treatment (91/271/EEC). Off. J. Eur. Union 1991, 135, 40–52. [Google Scholar]
- Federal Ministry for the Environment, Nature Conservation and Nuclear Safety. Promulgation of the New Version of the Ordinance on Requirements for the Discharge of Waste Water into Waters (Waste Water Ordinance—ABWV); Federal Ministry for the Environment, Nature Conservation and Nuclear Safety: Berlin, Germany, 2004. [Google Scholar]
- EU. Reference Document on Best Available Techniques in the Pulp and Paper Industry; European IPPC Bureau: Seville, Spain, 2001. [Google Scholar]
- EU. Reference Document on the General Principles of Monitoring; European IPPC Bureau: Seville, Spain, 2003. [Google Scholar]
- Ijung, K.; Sung-Hoon, H.; Jin-Young, J. Establishment of effluent standards for industrial wastewaters in Korea: Current issues and suggestions for future plan. J. Water Environ. Technol. 2010, 8, 151–165. [Google Scholar]
- Zhou, Y.H.; Lu, Y.N.; Zhang, Y.; Zhu, J.; Lei, J.; Shen, C.; Wu, X.F. Assessment on the COD Discharge Status of Municipal Wastewater Treatment Plant in a City of China. Environ. Sci. 2014, 35, 3998–4002. [Google Scholar]
- Zhou, Y.H.; Lu, Y.N.; Zhang, Y.; Reng, N.; Lei, J. Assessment on daily discharge status of regular water pollutants in urban sewage treatment plant. Ind. Water Treat. 2016, 36, 12–15. [Google Scholar]
- Sun, Y.X.; Wu, G.X.; Hu, H.Y.; Guo, F.; Wu, Y.H.; Guo, Y.M. Assessment of effluent quality of wastewater treatment plant in Kunming based on the percentile of standard compliance method. China Environ. Sci. 2013, 33, 1113–1119. [Google Scholar]
- Sun, Y.; Chen, Z.; Wu, G.; Wu, Q.; Zhang, F.; Niu, Z.; Hu, H.Y. Characteristics of water quality of municipal wastewater treatment plants in China: Implications for resources utilization and management. J. Clean Prod. 2016, 131, 1–9. [Google Scholar] [CrossRef]
- Integrated Wastewater Discharge Standard (GB 8978-1988); Ministry of Environment Protection of China: Beijing, China, 1988. Available online: http://www.mep.gov.cn (accessed on 15 May 2018).
- Environmental Quality Standards for Surface Water (GB 3838-2002); Ministry of Environment Protection of China: Beijing, China, 2002. Available online: http://www.mep.gov.cn (accessed on 15 May 2018).
- US EPA. Development Document for Final Effluent Limitations Guidelines and Standards for the Pharmaceutical Manufacturing Point Source Category; Office of water: Washington, DC, USA, 1998.
- Olivera, S.C.; Von Sperling, M. Reliability analysis of wastewater treatment plants. Water Res. 2008, 42, 1182–1194. [Google Scholar] [CrossRef] [PubMed]
- Djeddou, M.; Achour, B.; Martaud, M. Determination and analysis of daily reliability level of municipal wastewater treatment plant. Courr. du Savoir. 2013, 17, 39–46. [Google Scholar]
- Cohen, A.I.; Bar-Shalom, Y.W. A Quantitative Method for Effluent Compliance Monitoring Recourses Allocation EPA-600/5-75-015; USA Environmental Protection Agency: Washington, DC, USA, 1975.
- Culp, G.; Wesner, G.; Williams, R.; Hughes, M.V. Wastewater Reuse and Recycling Technology; Noyes Data Corporation: Trident, NJ, USA, 1980. [Google Scholar]
- Ossenbruggen, P.J.; Constantine, K.; Collins, M.R.; Bishop, P.L. Toward Optimum Control of the Activated Sludge Process with Reliability Analysis. Civ. Eng. Syst. 1987, 4, 77–86. [Google Scholar] [CrossRef]
- US EPA. Technical Support Document for Water Quality-Based Toxics Control EPA 505/2690-001; US Environmental Protection Agency: Washington, DC, USA, 1991; p. 335.
Figure 1.
Treatment techniques used by urban wastewater treatment plants (WWTPs) in China.

Figure 2.
Statistical distribution of daily average chemical oxygen demand (COD) concentrations of one of the WWTPs..
Figure 2.
Statistical distribution of daily average chemical oxygen demand (COD) concentrations of one of the WWTPs..

Figure 3.
Statistical distribution of annual average COD concentrations of 1753 WWTPs.


Table 1.
Limits for certain parameters in WWTP discharge standards in China.
| Standards | Grade | BOD5 (mg·L−1) | CODCr (mg·L−1) | SS (mg·L−1) | NH3-N (mg·L−1) | TN (mg·L−1) | TP (mg·L−1) |
|---|---|---|---|---|---|---|---|
| Integrated wastewater discharge standard (GB 8978-1988) | — | 30 | 120 | 30 | — | — | — |
| Integrated wastewater discharge standard (GB 8978-1996) | Grade 1 1 | 20 | 60 | 20 | 15 | — | — |
| Grade 2 1 | 30 | 120 | 30 | 25 | — | — | |
| Discharge standard of pollutants for municipal wastewater treatment plant (GB 18918-2002) | Grade 1-A 2 | 10 | 50 | 10 | 5(8) 3 | 15 | 0.5 |
| Grade 1-B 2 | 20 | 60 | 20 | 8(15) 3 | 20 | 1 | |
| Grade 2 2 | 30 | 100 | 30 | 25(30) 3 | — | 3 |
1 According to GB 8978-1996, Grade 1 standards were for WWTPs discharging wastewater into surface water classified as Grade III according to “Environmental Quality Standards for Surface Water” (GB 3838-2002) [26]. Grade 2 standards were for WWTPs discharging wastewater into surface water classified as Grade IV–V according to GB 3838-2002; 2 According to GB 18918-2002, Grade 1-A standards were for water discharged by WWTPs for reuse. Grade 1-B standards were for WWTPs discharging wastewater into surface water classified as Grade III according to GB 3838-2002. Grade 2 standards were for WWTPs discharging wastewater into surface water classified as Grade IV–V according to GB 3838-2002; 3 Limits in parentheses are for wastewater temperature ≤12 °C, and those outside parentheses are for >12 °C.
Table 2.
Derived COD discharge limits of WWTPs in China.
| NO. | Geographic Location | Ratio of Treated Wastewater from Industries | LTAs (mg·L−1) | Average of VF(1)s | COD Discharge Limits (mg·L−1) |
|---|---|---|---|---|---|
| 1 | Northeast | ≥70% | 42.1 | 1.65 | 69.5 |
| 2 | 50–70% (including 50%) | 34.0 | 1.37 | 46.4 | |
| 3 | <50% | 27.5 | 1.78 | 48.8 | |
| 4 | North | ≥70% | 40.1 | 1.51 | 60.7 |
| 5 | 50–70% (including 50%) | 32.4 | 1.64 | 53.2 | |
| 6 | <50% | 26.2 | 1.78 | 46.7 | |
| 7 | East | ≥70% | 38.2 | 1.70 | 65.0 |
| 8 | 50–70% (including 50%) | 30.9 | 1.76 | 54.3 | |
| 9 | <50% | 25.0 | 1.72 | 43.0 | |
| 10 | South | ≥70% | 36.4 | 1.81 | 66.0 |
| 11 | 50–70% (including 50%) | 29.4 | 1.71 | 50.3 | |
| 12 | <50% | 23.8 | 1.74 | 41.4 | |
| 13 | Southwest | ≥70% | 34.7 | 1.73 | 60.0 |
| 14 | 50–70% (including 50%) | 28.1 | − | − | |
| 15 | <50% | 22.7 | 1.74 | 39.5 | |
| 16 | Northwest | ≥70% | 33.1 | 1.54 | 51.0 |
| 17 | 50–70% (including 50%) | 26.7 | − | − | |
| 18 | <50% | 21.6 | 1.66 | 35.9 |
“−” indicates no data in that classification.
Table 3.
Suggested COD discharge limits of WWTPs in China.
| NO. | Ratio of Treated Wastewater from Industries | Suggested COD Discharge Limits (mg·L−1) |
|---|---|---|
| 1 | ≥70% | 69.5 |
| 2 | 50–70% (including 50%) | 54.3 |
| 3 | <50% | 48.8 |
© 2018 by the authors. Licensee MDPI, Basel, Switzerland. This article is an open access article distributed under the terms and conditions of the Creative Commons Attribution (CC BY) license (http://creativecommons.org/licenses/by/4.0/).
Share and Cite
MDPI and ACS Style
Zhou, Y.; Duan, N.; Wu, X.; Fang, H. COD Discharge Limits for Urban Wastewater Treatment Plants in China Based on Statistical Methods. Water 2018, 10, 777. https://doi.org/10.3390/w10060777
AMA Style
Zhou Y, Duan N, Wu X, Fang H. COD Discharge Limits for Urban Wastewater Treatment Plants in China Based on Statistical Methods. Water. 2018; 10(6):777. https://doi.org/10.3390/w10060777
Chicago/Turabian StyleZhou, Yuhua, Ning Duan, Xuefang Wu, and Hao Fang. 2018. "COD Discharge Limits for Urban Wastewater Treatment Plants in China Based on Statistical Methods" Water 10, no. 6: 777. https://doi.org/10.3390/w10060777
Note that from the first issue of 2016, this journal uses article numbers instead of page numbers. See further details here.