The Atmospheric Branch of the Hydrological Cycle over the Negro and Madeira River Basins in the Amazon Region


1
Environmental Physics Laboratory (EPhysLab), Facultad de Ciencias, Universidade de Vigo, 32004 Ourense, Spain
2
National Center for Monitoring and Early Warning of Natural Disasters (CEMADEN), São José dos Campos, São Paulo 12247-016, Brazil
*
Author to whom correspondence should be addressed.
Water 2018, 10(6), 738; https://doi.org/10.3390/w10060738
Submission received: 6 May 2018
/
Revised: 1 June 2018
/
Accepted: 2 June 2018
/
Published: 5 June 2018
(This article belongs to the Special Issue Selected Papers from the 1st International Electronic Conference on the Hydrological Cycle (ChyCle-2017))
Abstract
:The Amazon region, in South America, contains the largest rainforest and biodiversity in the world, and plays an important role in the regional and global hydrological cycle. In the present study, we identified the main sources of moisture of two subbasins of the Amazon River Basin, the Negro and Madeira River Basins respectively. The source-sink relationships of atmospheric moisture are investigated. The analysis is performed for the period from 1980–2016. The results confirm two main oceanic moisture sources for both basins, i.e., oceanic regions in the Tropical North and South Atlantic oceans. On the continents are, the Negro River Basin itself, and nearby regions to the northeast. For the Madeira River Basin, the most important continental sources are itself, and surrounding regions of the South American continent. Forward-trajectory analysis of air masses over the source regions is used to compute the moisture contribution to precipitation over basins. Oceanic (continental) sources play the most important role in the Negro River Basin (Madeira River Basin). The moisture contribution from the Tropical North Atlantic region modulates the onset and demise of the rainy season in the Negro River Basin; while the moisture contribution from the rest of the Amazon River Basin, the Madeira Basin itself, and Tropical South America leads to the onset of the rainy season in the Madeira River Basin. These regions also played the most important role in decreasing the moisture supply during most severe dry episodes in both basins. During ‘’El Niño’’, generally occurs a reduction (increase) of the moisture contribution to the Negro River Basin (Madeira River Basin; mainly from April to August) from almost all the sources, causing a decrease in the precipitation. Generally, the contrary occurs during ‘’La Niña’’.
1. Introduction
The Amazon River Basin (ARB) (Figure 1) hosts the world’s largest tropical rainforest and drainage basin on the planet. It is an important source of natural resources for human economic development and is characterised by large biodiversity. Its drainage area includes more than one-third of the South American continent and the discharge of the Amazon River (AR) accounts for almost one-fifth of the total discharge of all rivers of the world [1]. The ARB contains several subbasins. The most important subbasins are the Negro and Madeira River basins (NRB, MRB; Figure 1) in the north and southwest, respectively. The Negro and Madeira Rivers (NR and MR respectively) are the most important Amazonas tributaries, contributing more than one-third of the total water discharge [1]. Consequently, the ARB plays an important role in the local and regional hydrological cycle [2,3,4].
The basic principle of the hydrological cycle is that evaporation in one region contributes to precipitation in that region or in another region through atmospheric moisture transport. Several authors have investigated the origin of the Amazon’s rainfall using different methods to finally highlight the important role of the Tropical North and South Atlantic regions (TNA and TSA, respectively), as sources of moisture [3,5,6,7,8,9,10]. The role of the ARB providing humidity for itself and surrounded regions has been also documented. The continental moisture recycling, the process by which evapotranspiration from the continent returns as precipitation to the continent [11,12,13,14], is particularly important for the South American hydrological cycle. Between 25% and 35% of the moisture is regionally recycled in the ARB [15]. However, in northern Amazon regions, the continental evaporation recycling efficiencies are higher than in the south [16,17]. The moisture from the ARB is transported out of the basin via the South American low-level jet (SALLJ) along the Andes during the austral wet season, and contributes to precipitation over the La Plata Basin [3,4,14,18,19,20,21,22,23]. In fact, the moisture transport in and out of the ARB has been studied since the 1990s using different methods, that is, a variety of upper-air and global reanalysis datasets, observations, and climate model simulations [2]. In the present climate, the ARB behaves as a moisture sink, which receives moisture from sources, such as the tropical rainforest, by intense recycling from vegetation [2,15,24] and by moisture advection over the tropical North and South Atlantic oceans [2,3,25,26,27,28,29]. Based on van der Ent et al. [13], 70% of the water resources of the Río de la Plata Basin depend on evaporation over the Amazon forest. They also indicated that the decrease of evaporation in areas in which continental evaporation recycling is high (e.g., by land use change for agriculture and urbanization) would enhance droughts in downwind areas with overall low precipitation amounts. This might result in the reduction of the regional moisture supply and have important consequences for the stability of the Amazon rainforest [30,31,32,33]. Therefore, the acceleration of human-driven climate change raises serious questions and poses challenges for conservation strategies in the Amazonian forest of the ARB [34]. Deforestation and land use change within the ARB are major challenges [35]. Business-as-usual deforestation (based on deforestation rates prior to 2004) would lead to an 8.1% ± 1.4% reduction in the annual mean ARB rainfall by 2050, which is greater than the natural variability [36]. Future scenarios of complete deforestation in the region indicate a restrained water cycle [37,38]; the total deforestation of the Amazon would result in a 10%–20% decrease of the annual rainfall in the entire ARB [37].
The annual cycle of the water balance within the ARB is characterised by differences between the northern and southern sections [6,18,39]. The evaporation–precipitation budget (E − P) of the entire region shows that the precipitation generally exceeds evaporation and the basin acts as a moisture sink (P > E) [18,40]. However, the basin can act as a moisture source (P < E) under extreme conditions, such as those related to deficient rainfall during the strong El Niño of 1983 in northern Amazonia [18]. Usually, negative precipitation anomalies over Amazonia occur during intense El Niño events and anomalously cold (warm) sea surface temperatures (SST) in the tropical South Atlantic, coupled with anomalously warm (cold) SST in the tropical North Atlantic [5,6,8,41,42,43]. The identification of moisture sources has become a major research tool for the analysis of extreme events (e.g., floods and droughts) and a basic tool used for regional and global climate assessment [44]. Recent studies confirmed the occurrence of several extreme hydrological events in the ARB, such as droughts (e.g., 2005, 2010, 2016), floods (2009, 2012, 2014), and notable terrestrial water storage variability [45,46,47,48,49].
The climate of Amazonia is principally affected by seasonal changes of the position of the Intertropical Convergence Zone (ITCZ), which is the main rainfall-producing system in the eastern ARB during the rainy season [50,51,52]. The South Atlantic Convergence Zone (SACZ), which enhances the convection during the austral summer, is important for rainfall in the southern ARB [53,54]. The life cycle of the South American Monsoon System (SAMS) also plays an important role, featuring strong seasonal variability in the distribution and duration of the rainy season, mainly over southwestern Amazonia and the La Plata Basin [28,55]. The cross-equatorial flux plays an important role for moisture flux changes that ultimately enhance the convection over central–eastern Brazil on intraseasonal timescales, representing an increase in the contribution to the monsoon precipitation from moisture transported from the northern Amazon toward eastern South America [56,57]. An important climatological structure in the upper-tropospheric summertime circulation over South America is the Bolivian High and the accompanying Nordeste trough over the east. The results of a study by Lenters and Cook [58] indicate that these systems are generated in response to precipitation over the ARB, central Andes, and the South Atlantic convergence zone.
A great number of studies have related the rainfall variability over the ARB with the SST changes in the Tropical North and South Atlantic regions (e.g., Marengo [5,6], Marengo et al. [7], Yoon and Zeng [8], Andreoli et al. [59], Espinoza et al. [60], Yoon [61]). Nevertheless, few studies have quantified the moisture contribution from these regions (e.g., Drumond et al. [3], COLA [62]). Usually, the ARB is studied as a whole. However, considering the reported differences of the hydrological cycle between the northern and southern ARB, our aim is to identify the main continental and oceanic moisture sources of the NRB and MRB. Furthermore, we attempt to obtain and assess the impact of their moisture contribution on the onset and demise of the rainy season, during dry episodes, and under warm (El Niño) and cold events (La Niña) of El Niño-Southern Oscillation (ENSO). ENSO is the main driver of interannual climate extremes in Amazonia and other tropical regions [63]. Respect previous studies, our point is to establish a source-sink of atmospheric moisture relationship to further understand some steps of the hydrological cycle in both the NRB and MRB.
2. Materials and Methods
2.1. The Lagrangian Approach
The global atmosphere was homogeneously divided into finite elements of volume, that is, approximately 2.0 million parcels. The Lagrangian particle dispersion model, FLEXPART (FLEXible PARTicle dispersion model) v9.0 [25,64], was applied to track backward-in-time the air masses over the NRB and MRB, and to calculate the rate of moisture increase (through evaporation from the environment, e) or decrease (through condensation or precipitation, p) along the trajectories of the parcels. Based on Equation (1), this budget equals the specific humidity (q) changes over time (t), assuming a constant parcel mass (m). Based on Stohl and James [64], the equation contains a small error because the mass of a particle (thus, the mass of the whole atmosphere) is assumed to be constant. Nevertheless, the atmosphere mass slightly changes through the addition and removal of water. The residence time of water vapour in the atmosphere varies in different regions of the planet. In this work, we considered it to be ten days, as stated by Numaguti [65].
(e − p) = m(dq/dt)
The total surface freshwater flux during ten days, hereafter represented by (E − P)i10, was obtained from Equation (2) by integrating the (e − p) values of all parcels in a vertical column from 0.1 to 1000 hPa over an area A. The area depends on the resolution of the input data and K is the number of particles over A. The values of (E − P), summed over the period in which clouds formed and evaporated, were not affected, but separating E and P led to the identification of extra precipitation and surface evaporation upon cloud formation and evaporation of cloud droplets, respectively. These errors were reasonably accurate only when one of the two terms was known to be much larger than the other, for instance, when P > E during rain events [25]. Thus, for our purposes, the determination of the freshwater budget was quite enough. The analysis was performed for the period from 1980–2016.
The historical backward-in-time analysis allowed the determination of the main moisture sources for the given receptors. Those regions in which (E − P)i10 > 0, which indicates that air parcels gain humidity rather than lose it during their movement to the target region, were considered moisture sources. On the contrary, regions in which the (E − P)i10 budget was negative and moisture loss prevailed were considered as moisture sinks. To determine the most important regions in which air masses in transient to the basins uptake humidity, a threshold was defined. This threshold represented the 90th percentile and was calculated from the annual budget, (E − P)i10 > 0. This criterion has previously been utilised with a similar aim by Drumond et al. [66], Ciric et al. [67], and Sorí et al. [68]. The NRB and MRB were considered moisture sources for themselves to evaluate their role. To assess the moisture contribution of sources to the precipitation over the basins, air masses over each source region were tracked forward-in-time to compute the moisture loss, (E − P)i10 < 0, over the respective basin.
The model FLEXPART has been widely used to investigate the atmospheric branch of the hydrological cycle in several regions worldwide, for example, to investigate the origin of continental precipitation [69], to identify the major moisture sources for East China [70] and the Sudan-Sahel [71], or to understand the causes of extreme sea ice loss over the Arctic [72]. The main advantage of using this model is the possibility of computing the atmospheric water budget along backward and forward trajectories. To run FLEXPART, we utilised datasets from ERA-Interim reanalysis [73] at 6-h intervals (00:00, 06:00, 12:00, and 18:00 UTC) and a resolution of 1° in longitude and latitude along 61 vertical levels from 0.1 to 1000 hPa. We also used the vertical monthly integral of northward and eastward water vapour flux data from ERA-Interim reanalysis [73] at a resolution of 1° × 1° to calculate vertically integrated moisture flux (VIMF) divergence anomalies. Several factors were considered for the use of ERA-Interim reanalysis datasets. Significant improvements have been made between ERA-Interim and ERA-40 [74] with respect to the global hydrological cycle, that is, in terms of water vapour, clouds, and precipitation, especially over the oceans. The unrealistic interannual drift of precipitation observed in ERA-40 over the ARB has been reduced in ERA-Interim and the annual precipitation was largely unbiased, although the seasonal amplitude of precipitation remained too small [75]. De-Almeida et al. [76] assessed the ability of three global reanalysis products (NCEP-2, ERA-Interim, and CFSR-1) to reproduce South American Monsoon (SAMS) precipitation. They found that ERA-Interim provided more consistent results regarding the climatology of precipitation and 850 hPa moisture flux divergence monthly means, both averaged over the SAMS region.
2.2. Identification of the Onset and Demise of the Rainy Season
The onset and end of the rainy season in the NRB and MRB can be considered as the beginning and end of the longest period during which the rainfall exceeds its annual climatology [77]. To determine the dates associated with the onset/demise, we applied an objective previously implemented for the ARB by Liebmann et al. [78], for South America by Liebmann et al. [77], and for the Indian Summer Monsoon by Noska and Misra [79]. This method was based on daily cumulative precipitation anomalies (C’m) of each basin throughout the year:
where Dp(m,n) is the daily average precipitation over each basin for day n of year m and C is the climatology of the annual mean precipitation over N (365/366) days for M years. Therefore, starting in January, the onset date was defined as the day after C’m reached its absolute minimum value. After this date, a positive slope indicated the rainy season until C’m reached its absolute maximum value, which was considered to be the demise because it was the point at which the precipitation started to decrease. In this analysis, we used the daily precipitation from the Climate Hazards Group InfraRed Precipitation with Station data (CHIRPS) [80], which has the advantage of incorporating 0.05° resolution satellite imagery with in situ station data. The determination of the onset/demise dates and the length of the rainy season in the Amazon region and South America have already been investigated by different methods [7,77,78,81,82,83,84,85]. However, the method used in our study was sufficient for our purpose. Daily data of the Interpolated Outgoing Longwave Radiation (OLR) [86] freely provided by the NOAA/OAR/ESRL PSD, Boulder, Colorado, USA, from their Web site at https://www.esrl.noaa.gov/psd/ was used to investigate the response of the convection associated with the |(E − P)i10 < 0| anomalies over the basins.
2.3. Identification of Dry and Wet Conditions
In this study, we used the Standardised Precipitation–Evapotranspiration Index (SPEI) [87] to identify dry and wet conditions in the NRB and MRB. The SPEI is based on the same methodology as the Standardised Precipitation Index (SPI) [88], but computed the probability distribution of the difference between precipitation (P) and Atmospheric Evaporative Demand (AED), which were computed on different time scales. Here, we considered the potential evapotranspiration (PET) to be a reliable approximation of the AED. The P and PET data with a resolution of 0.5° × 0.5° belonged to the Climatic Research Unit CRU3.25 [89]. The use of the SPEI is of advantage if we considered the dense forest of the region and its effect on evapotranspiration. Positive SPEI values indicate above-average moisture conditions (wet), while negative values reveal below-normal (dry) conditions. To identify dry episodes, the criterion of Mckee et al. [88] was applied to each basin. Dry episodes started when the SPEI fell below zero, reaching a value of −1 or less, and ended when the SPEI returned to positive values. Several indicators were calculated for such episodes, such as the duration [number of months between the beginning (included) and end (last month, not included)] and severity (absolute value of the sum of all SPEI values during the episode) [90,91,92]. We considered the parameter ‘severity’ to be an indicator of the possible impact. The most severe five dry episodes were selected to investigate the role of the climatological moisture sources of each basin on the moisture contribution to precipitation over the basins. Stojanovic et al. [93,94] have performed similar assessments for the Euro Mediterranean region. For each dry episode was also calculated the average pattern of the Vertically Integrated Moisture Flux (VIMF) anomalies from the ERA-Interim [73] to assess dynamical atmospheric conditions. The classification of the SPEI values into categories (Table 1; according to Mckee et al. [88] for the SPI) permitted the association of the magnitude of this index with water deficit conditions in the basins. A correlation analysis was performed between the SPEI at 1 to 24 temporal scales and the water level (WL) of the NR and MR recorded in Manaus and Borba, respectively, to investigate possible relationships. The WL data were provided by the Observatory of Research for the Environment [95].
2.4. Moisture Transport during El Niño and La Niña Events
Considering that one of the most significant causes of the climate variability in the tropics is the ENSO, we obtained composites of months affected by the warm (El Niño) and cold (La Niña) events. The P anomalies over each basin and |(E − P)i10 < 0| anomalies of air masses arriving from each source of moisture were calculated for each composite of months. The El Niño/La Niña conditions were obtained from the Bivariate EnSo Timeseries (BEST ENSO index) [96]. The alternative, less stringent definition that uses the top/bottom 33% events or standard deviation (std) = ±0.96 of the BEST values was utilised. This index was chosen because it was obtained by combining an atmospheric component of the ENSO phenomenon (the Southern Oscillation Index ‘SOI’) with an oceanic component (Nino 3.4 Sea Surface Temperature ‘SST‘ that was defined as the SST averaged over the region 5° N–5° S and 170° W–120° W).
3. Results and Discussion
3.1. Precipitation, Potential Evapotranspiration, and Annual Water Level Cycles
The monthly average P patterns within the ARB are shown in Figure 2. It shows the spatial variability of the P between the north and south of the basin, specifically between the NRB and MRB. During the austral summer from December to March, the maximum P was observed in the central southeast of the ARB. The P rate over the MRB was greater than over the NRB during these months. April was a transitional month; the maximum precipitation occurred over the northern half of the ARB, but major rainfall was favoured over the NRB in May and June. Espinoza et al. [97] reported that the maximum P was concentrated in the northwest of the ARB during four months (July–October), which was consistent with our results. In October, the P increased over the southeast of the ARB; this phenomenon was best observed in November and December. Marengo [18] investigated the December–January and March–May seasonal rainfall in the ARB derived from different gridded data sources. He considered that these two seasons represented the peak of the rainy season in southern and northern Amazonia, respectively. However, Figure 2 shows that the strongest rainfall was concentrated in northern Amazonia from May to September. The March–May (MAM) maximum and September-November (SON) minimum rainfall close to the Amazon Delta were associated with the seasonal migration of the Intertropical Convergence Zone (ITCZ). Overall, the rainfall regimes over the ARB indicated a strong contrast between the northern and southern tropics, which was due to the alternating warming of each hemisphere [97]. The spatial distribution of various precipitation datasets (GPCP, GPCC, and HYBAM) averaged for the 1989–2008 period showed similar patterns within the ARB with slight differences in the northwestern ARB, where SO HYBAM datasets presented a larger area with higher precipitation rates [82]. The study results of Geritana et al. [98] also showed that evapotranspiration (ET) was greater in the south and west of the ARB in the period from 2000–2008, indicating the principal differences of this variable between the NRB and MRB. Based on Gloor et al. [99], the intensification of the hydrological cycle in the ARB has been concentrated in the wet season since approximately 1990, driving the progressively increasing differences between the peak and minimum flows in the ARB.
The monthly average P for each subbasin was calculated. The annual cycle of the subbasins differed, as expected from previous analysis (Figure 3). Figure 3 also shows the annual PET cycle of each basin and the annual WL cycle of the Negro and Madeira rivers recorded at hydrological stations located in Manaus and Borba, respectively. The monthly average P (light grey bars) in the NRB increased from October to May when it reached the average annual maximum rainfall (~11.0 mm/day). The average P decreased after May, reaching a minimum in October (~4.9 mm/day). Less rainfall occurred in July (~0.9 mm/day) in the MRB (dark grey bars) in the Southern Hemisphere southwest of the ARB. From July onwards, it increased during the austral summer months until it reached a peak in January (~8.7 mm/day) and then decreased. The monthly average P in the NRB was greater than that in the MRB. Thus, the annual average rainfall in the NRB (~7.0 mm/day) was greater than that in the MRB (~4.6 mm/day). Both annual PET cycles (NRB and MRB) were very similar, although they differed from June to December when the PET in the NRB (red line) was higher than that in the MRB (green line). On the contrary, the PET in the MRB was higher in February and March. The PET in the NRB increased with decreasing P. However, this was not the case in the MRB, reflecting a lag time. Utilizing several datasets, Marengo [18] described similar annual P and evaporation (E) cycles for northern and southern Amazonia. Nevertheless, the annual ET cycle obtained by Maeda et al. [100] for the NRB slightly differed from the PET in Figure 3. These authors described two maximum ET peaks in April and October. This indicates that the methods adopted to calculate the ET, land cover, soil types, and meteorological forcing used in the models and the study period have a significant impact on ET rates [101].
The WL of both annual cycles lagged in time with respect to the P. The maximum WL (~28 m) in Manaus occurred in June, one month after the maximum P in the NRB, while the maximum WL (~20.4 m) in Borba occurred in April, three months after the maximum P in the MRB. A strong seasonal signal of the Negro River water storage was described by Frappart et al. [101], with minima in October and maxima in June, in accordance with the minimum and maximum climatological WL. Marengo [5] revealed that the WL in Manaus and rainfall in northern Amazonia vary in unison and had less in common with the rainfall anomalies in southern Amazonia. In this analysis, we must consider that WL fluctuations were generally influenced by hydrological, hydrometeorological, and hydrogeological phenomena, such as groundwater recharge, evapotranspiration, phreatophytic consumption, artificial recharge, groundwater pumping, and return flows from irrigation [102]. Therefore, these phenomena are not analysed in this work because our purpose was to provide a general overview of the hydrological cycles of both basins.
3.2. Moisture Source Identification
The monthly budget (E − P)i10 obtained with FLEXPART for the NRB and MRB in the air-mass back-trajectory analysis is shown in Figure 4. Positive values represented by reddish colours indicate areas in which the net moisture budget in the vertical column was positive, which means that evaporation exceeded precipitation (E > P) and the air masses transient to the basins in these regions gained humidity rather than lost it. These regions act as moisture sources for the basins. In contrast, the bluish colours represent regions in which air parcels moving toward the basins lost humidity (E < P), which were considered to be moisture sinks. The spatial pattern of (E − P)i10 from January to May shows that for the NRB, where was an uptake in humidity from an extended area in the Tropical North Atlantic region (TNA); (E − P)i10 > 0 was also observed in a visibly smaller area in the Tropical South Atlantic region (TSA) and in the northeast of the NRB. The NRB mainly acted as a water vapour sink from April to July, which was consistent with major precipitation over itself (Figure 2). We must highlight that during the rainiest month in the NRB, that is, May, the moisture uptake was less intense in the TNA than in previous months; however, the extension and intensity of areas with (E − P)i10 > 0 in the TSA increased. The main oceanic moisture source for the NRB from June to October seemed to be the TSA; the main continental moisture sources were the eastern ARB and NRB itself. The humidity gain was reintensified in the TNA region and this source became more important than the TSA in December (visual analysis of Figure 4). The TNA and TSA regions were commonly associated with restricted areas, delimited by boxes in the North and South Atlantic Ocean. However, we named the sources according to the geographical location in this study. Drumond et al. [3] confirmed the tropical Atlantic regions to be the most important remote moisture sources for the ARB. Other studies have attempted to establish a relationship between the Atlantic and Pacific SST with rainfall over Amazonia. For example, Ronchail et al. [43] argued that the northeastern part of the basin, north of 5° S and east of 60° W, was significantly related to the tropical SST and a rainier wet season was observed when the equatorial Pacific and northern (southern) tropical Atlantic are anomalously cold (warm).
The historical (E − P) budget of air parcels tracked backward-in-time from MRB and integrated into the vertical column over ten days (Figure 4) showed positive values in the TNA, mainly from January to March, while at TSA the (E − P)i10 > 0 was less intense during this months. From October to April, the MRB mainly acted as a moisture sink in concordance with the major annual rainfall (Figure 3). The most important continental regions acted as moisture sources during these months based on areas in which (E − P)i10 > 0, such as the northern half of the ARB, northern South America, northeast of Brazil, and a region to the southeast of this basin. The positive values of the (E − P)i10 budget over the ocean were most intense (> 0.2 mm/day) in the TNA and TSA, except for October and November when the TNA seemed to be not effective in providing moisture to the MRB. In May, the (E − P)i10 budget was positive in most parts of the MRB, mainly in the centre and south; negative values were observed in the north. When the Austral winter commences in June, the (E − P)i10 pattern revealed a dipole. Negative values were observed in the north of the MRB, in the northern half of the ARB, and north of the continent, while positive values (indicating moisture uptake) were detected in the southern half of the ARB, northeast of Brazil, and in the southeast of the MRB. These patterns could be detected until September. As previously commented, areas with (E − P)i10 < 0 values (moisture loss) were observed over parts of the MRB and in the eastern and northern ARB in October. Based on Yoon and Zheng [8], the Atlantic influence on the Amazon rainfall was due to changes in the north–south divergent circulation and the movement of the ITCZ following warm SST. Therefore, it was strongest in the southern part of the ARB during the dry season (July–October). Differences between the (E − P)i10 budget over the NRB and MRB were partly due to the seasonality of the water balance in the ARB and played an important role in the interannual variability of the water balance within the ARB [20]. As well as Durán et al. [9] we found an apparent absence of contributions of moisture from the Pacific Ocean; possibly because the presence of the Andes did not permit moist winds to reach the basins.
The (E − P)i10 budget was also computed in the backward in time experiment for each basin, at the annual scale (Figure 5a). The positive values within the 90th percentile (p90 = 0.26 mm/day) represent regions in which the most intense moisture uptake occurred. The (E − P)i10 budget was positive in the historical experiment for the NRB, mainly over two regions in the Atlantic Ocean, that is, the TNA and TSA regions (Figure 5a). On land, it received humidity from the northeast of the basin and parts of the basin itself. The rest of the ARB did not play an important role in providing humidity to the NRB. Annual climatological (E − P)i10 > 0 values for the MRB delimited by p90 = 0.14 mm/day were observed in a large area of the continent (Figure 5b). This basin uptakes humidity from the northern half of the ARB, north and northeast of the continent, southeast (from the Plata River Basin), and southwest (from the Andes region). At the annual scale, the NRB and MRB mainly acted as a moisture sink. The ARBp, TNA, and TSA were the most important continental and oceanic moisture sources for the MRB, based on the extension and intensity of the positive values in the (E − P)i10 pattern. Nevertheless, a part or the whole MRB acted as a source of humidity for itself from May to September (Figure 4). Therefore, we considered the whole MRB and NRB as moisture sources for themselves, which allowed the investigation of their roles in the hydrological cycles. A schematic representation of the sources considered in this study is shown in Figure 6. In this figure, we divided the sources into oceanic and continental sources considering the origin of the air masses. To the north of the NRB was a small source we called N, to the northeast of Brazil, NEB; and the TNA and TSA on the Tropical Atlantic. A source region in the north of the ARB called N also appeared for the MRB; also, NEB, and the TNA and TSA sources. The southeastern ARB was not an important moisture source for the MRB at the annual scale; however, it was an important moisture source if we consider the monthly variability of the (E − P)i10 pattern (Figure 4) from May to September. Thus, we consider the rest of the ARB (ARBp) in addition to the MRB, as previously defined. Two important sources named ‘Southeast’ (SE) and Andes region (AND) were in the south of the MRB.
The cross-equatorial flux played an important role in changing the moisture fluxes that ultimately enhance the convection over central–eastern Brazil on intraseasonal timescales. The contribution of moisture transported from northern Amazon towards eastern South America generated the monsoon precipitation [56,57]. Despite this mechanism, our results also showed that the MRB and therefore the southwestern ARB received moisture from the south. Based on a quasi-isentropic calculation of the trajectories of water vapor back-in-time (QIBT) utilised by Dirmeyer and Brubaker [103], a ‘catalogue’ of moisture sources based on river basins was developed, which is available at http://cola.gmu.edu/wcr/river/basins.html. Based on this catalogue, the most evaporative moisture sources for the ARB were very similar to those shown in Figure 5 for the NRB and MRB. However, our results indicated that the TSA extended more to the east and SE and AND were more important evaporative regions.
3.3. Moisture Contribution from the Sources
The average moisture contribution to the P of the basins (Figure 7) was computed by tracking forward-in-time, the air masses based on all climatological sources. As the P increased in the NRB from January onwards, the moisture contribution from all sources increased; the TNA and NRB itself contributed the most (Figure 7a). The maximum moisture loss of air masses from the TNA over the NRB occurred in April, one month before the annual maximum P was reached. In fact, the correlation between |(E − P)i10 < 0| and P increased to 0.52 at a lag time of one month (Table 2). The maximum moisture loss over the NRB from itself also occurred in April but the correlation with P was highest without lag time. From May to October (austral winter), the maximum moisture supply from the TNA decreased and principal moisture input from the TSA and NRB occurred. It is very interesting that the TNA and TSA seemed to provide almost the same amount of moisture to P over the NRB in May, with the maximum rainfall peak over the NRB. In this month, 61% of the total moisture income to the NRB was due to oceanic sources. Lower atmospheric moisture contribution from the basin itself occurred in the following months; associated with a P decrease. Both sources, the TNA and TSA, seemed to play opposite roles in providing moisture to the NRB throughout the year. In September and October, with less rainfall over the NRB, continental sources became the most important, possibly because of the increase of recycling. The moisture contribution from N and NEB despite following the P annual cycle approximately, was less than that from the rest of the sources. Considering |(E − P)i10 < 0| when performing a multiple regression led to 54% of the P variance explained (Table 2).
We must clarify that the transport of moisture into a region in which it can become entrained into a precipitation weather system depends on the atmospheric dynamics and moisture sources from other parts of the globe (e.g., the rest of the sources) [104]. The moisture contribution from climatological moisture sources in the MRB, especially from ARBp, MRB, N, and TNA, followed the annual P cycle (Figure 7b). The correlations were positive and higher than 0.5, but decreased at a lag in time of one or two months (Table 3). Every month, the moisture loss over the MRB due to continental sources was greater than that from oceanic sources; particularly from the ARBp and the MRB itself. The |(E − P)i10 < 0| over the MRB from December to March (the rainiest months) from the TNA was greater than that from the TSA, while the moisture supply from the TSA was more important than that from the TNA during the remaining months. However, the moisture income from the TNA correlated best with P over the MRB. With respect to continental sources, the moisture contribution from AND to P in the MRB was the lowest. The comparison between the moisture provided by continental and oceanic sources to the MRB revealed the major contribution of moisture of continental regions during all of the year.
3.4. Role of the Sources during the Onset and Demise of the Rainy Season
Liebman et al. [77] defined the onset and end of the rainy season in the ARB as the beginning and end of the longest period during which the rainfall exceeds its annual climatology, which was consistent with our approach. As previously commented, several studies investigated the onset/demise and length of the rainy season in the Amazon region and South America. Here we aim to determine the role of the moisture contribution from the sources in the climatological onset/demise of the rainy season over the basins. Figure 8 shows the daily climatological P and cumulative anomalies of P, |(E − P)i10 < 0|, and OLR over the NRB and MRB obtained by applying Equations (3) and (4). The day after the minimum value of the daily P cumulative anomalies indicated the rainy season onset, while the day when the anomalies reached the maximum, pointed out the rainy season demise. The cumulative anomalies of the moisture loss (|(E − P)i10 < 0|) over the basins allowed us to identify from which source(s) there was an increase (decrease) on the moisture contribution before the rainy season onset (demise). A similar approach was utilised by Sorí et al. [105] to determine the day on which the increase in rainfall indicated the beginning of the monsoon involvement for the Indus, Ganges, and Brahmaputra River Basins.
The minimum cumulative daily anomalies of P over the NRB occurred on May 23 (Figure 8a). Before this date, the minimum cumulative daily anomalies of |(E − P)i10 < 0| were due to the moisture supply from the N and NRB itself. Considering the annual climatological cycle of P and not the calendar year, the minimum value occurred from the TNA in the beginning of December. After these peaks, the cumulative daily anomalies of |(E − P)i10 < 0|, from the TNA, N, and NRB started to increase and were responsible for the subsequent P increase over the NRB. In the beginning of June, the cumulative daily anomalies of |(E − P)i10 < 0| over the NRB from the TNA, N, and NRB reached a maximum and later started to decrease, but the P decreased abruptly on 1 August. The cumulative daily anomalies of the moisture contribution from the NEB and TSA seemed not to be associated with the rainy season onset/demise at the NRB. To support these results, we also calculated the cumulative daily anomalies of the OLR. Several days after the rainfall increase causes the onset of the rainy season over the NRB, the cumulative daily anomalies of the OLR decreased (due to major cloud cover); reached the minimum value when the accumulated anomalies from TNA was at its maximum, and progressively increased when the rainfall decreased over the NRB. Results of Marengo shows that the onset of the rainy season has been strongly associated with changes in large-scale weather conditions in the region due to the effect of the Madden–Julian Oscillation (MJO).
The cumulative daily anomalies of P over the MRB reached the annual minimum value on 25 October (Figure 8b) and one day after (26) the onset of the rainy season occurred and subsequently positive anomalies of daily P occurred. Before the onset of rainy season, the moisture loss of the air masses over the MRB reached the minimum |(E − P)i10 < 0| anomaly and afterwards started to increase due to the MRB itself, ARBp, and TSA contributions. The contributions from the rest of the sources seemed not to be associated with the onset of the rainy season. Before the rainy season demise on 26 April, a reduction of the moisture loss over the MRB occurred based on the decrease in the daily accumulated anomalies of |(E − P)i10 < 0| of almost all sources, except from the NEB. The annual cycle of the cumulative daily anomalies of the OLR was opposite to |(E − P)i10 < 0|, as expected.
According to the observation of the annual cycle and cumulative daily anomalies of P over both basins, we confirmed that the rainy season started first over the MRB and later over the NRB, which agreed with the results of Liebman et al. [77]. These authors reported that the rainy season progresses northward from the southern ARB rather than from northwest to southeast, as suggested in previous studies. The atmospheric circulation and atmospheric dynamical condition were clearly key factors that modulates the transport of moisture and the P over the Amazon region. Thus, based on the rapid increase/decrease of the moisture contribution from the sources to the precipitation over NRB and MRB, we tried to explain the climatological onset/demise of the rainy season over the NRB and MRB. Nevertheless, other authors, such as Wright et al. [106], described another mechanism in which the Amazon rainforest transpiration enables the increase of shallow convection that moistens and destabilises the atmosphere during the initial stages of the dry-to-wet season transition and finally leads to the onset of the rainforest-initiated wet season in the southern ARB.
3.5. Dry and Wet Conditions in the NRB and MRB
The evolution of the SPEI at temporal scales of 1, 6, and 12 months (SPEI1; 6, 12) from 1980–2016 for the NRB and MRB is shown in Figure 9. Figure 9 also shows the monthly standardised anomalies of the WL of the Niger and Madeira rivers at the hydrological stations of Manaus and Borba, respectively. Dry conditions prevailed in the NRB from 1980–1993 and from 2013–2016. The SPEI reached values below −2 on few occasions, revealing extremely dry conditions. In the MRB, we must highlight the period of 1980–1986 because it was the longest period of wet conditions, which was followed by more frequent dry conditions among which the periods 1995–1996, 1998, 2003–2005, and 2015–2016 stood out because of their magnitude and/or duration. Indeed, dry conditions simultaneously affected both basins from 2015–2016. The 2005 drought in southwestern Amazonia has been documented to be one of the most intense droughts of recent years. However, the index value was not as large when compared with other years mentioned earlier, but the duration of dry conditions was considerable higher in the MRB. Dos Santos et al. [107] found that the drought of 1998 was the most intense drought (average SPI equal to −1.69) that occurred in Amazonia in the period from 1979 to 2014. The MRB experienced an important wet period starting in the end of 2013 and continuing throughout 2014. Espinoza et al. [60] confirmed that the rainfall in the southwestern ARB was ~100% above normal during the 2014 summer (December–March).
The temporal evolution of WL-standardised anomalies in Manaus and Borba is shown in Figure 9b,e. It mostly matched the temporal evolution of SPEI6 in the NRB and MRB (Figure 9b,e). The widely investigated intense droughts of 2005 and 2010 that affected southwestern Amazonia were represented by negative SPEI values for the MRB and negative WL anomalies in Borba (Figure 9b). According to Marengo et al. [26], the 2005 drought was manifested as weak peak river season from autumn to winter because of a weak summertime season. This drought was not related to El Niño; it experimented a pattern different from the El Niño–related droughts in 1926, 1983, and 1998, but the anomalously warm tropical North Atlantic, the reduced intensity in northeast trade wind moisture transport into southern Amazonia during the peak summertime season, and the weakened upward motion over this section of Amazonia, resulting in reduced convective development and rainfall [45].
As each source of moisture contributed to the total precipitation, each one had a role on the water balance conditions. Correlations were calculated between |(E − P)i10 < 0| values in the NRB and MRB from all sources with 1- to 24-month SPEI values, respectively (Figure 10). Significant r-values were observed for the first temporal scales of the SPEI, especially in the NRB (Figure 10a). All correlations were positive in the NRB, highlighting the correlation between the moisture contribution from N and the NRB itself with the SPEI at first temporal scales. In particular, the correlation between the moisture contribution from NEB and the SPEI, increased after the SPEI12. No significant correlations were obtained between |(E − P)i10 < 0| from TSA and the SPEI7–SPEI11. The same analysis was performed for the MRB. The strongest correlations occurred at the first temporal scales of the SPEI (Figure 10b). However, although all the r-values were positive at the first temporal scales, the highest occurred for correlations during the three first temporal scales of the SPEI. All correlations became insignificant after SPEI6 and even reached negative values (unless for N). The negative correlations indicated that the water balance conditions (even if accumulated from previous months) were not directly associated with the moisture loss over the basins.
To understand the possible impact of water balance conditions in the basins on the WL of the Negro and Madeira rivers, respectively, we calculated the monthly correlations between standardised WL anomalies and the SPEI1- to SPEI24-month timescales for each basin (Figure 11). The correlations in the NRB were positive at the first SPEI temporal scales from November to July, in accordance with the hydrological year. The r-values increased after December and become positive in February and March at all SPEI temporal scales. The maximum correlation occurred in March at SPEI4, suggesting that the WL was highly influenced by the water balance conditions of the previous four months. The correlations at the first SPEI temporal scales decreased with respect to previous months from April to July, which was the rainiest period, and they decreased month after month at longer SPEI temporal scales. This revealed a mechanism in which the WL does not instantaneously increase when the rainfall is the highest, but increases in following months when the water balance conditions of previous months are considered. Negative anomalies between the WL standardised anomalies and SPEI prevailed in September and October. The P was at a minimum over the NRB in October, while in the WL reached the minimum climatological level in November (Figure 2). As previously described, starting in November, when rainfall started to increased, the correlations increased from first to longer SPEI temporal scales as the months went by, highlighting the relationship between the two variables.
The same analysis was performed for the MRB. Positive correlations are observed for almost all months. During the driest months (June–October), the correlations were the lowest at the first SPEI temporal scales (negative at SPEI1 in August). Approximately from SPEI3 onwards, the r-values were statistically significant. This suggests that the impact of the rainfall deficit/surplus, over the WL (at Borba) may be effective when was calculated for the three previous months and longer temporal scales. However, the correlations were higher in November and December than in the previous months at the first SPEI temporal scales. To understand these correlations, it must be noted that the r-values increased at all SPEI temporal scales and become statistically significant from September onwards until January, when the rainfall was at its maximum over the MRB. In February, the rainfall started to decrease, the WL was increasing, and the correlations decreased at the longer SPEI temporal scales with respect to previous months. They generally become statistically insignificant and clearly divide the two transitional periods based on the highest (lowest) rainfall over the MRB. Based on the correlations, the WL of the driest months (June to July) were highly influenced by the water balance conditions of several previous months. This was expected for the NRB and MRB because of the lag between the peak rainfall in the early austral summer in the MRB and the peak WL during early austral fall, while the WL in the NRB peaked in late fall–early winter.
The dry episodes in the NRB and MRB were identified utilizing the SPEI1 for the period 1980–2016. Table S1 in Supplementary Materials shows the date, severity, duration, and peak of the dry episodes for each basin. The five most severe episodes in each basin (Table 4) from 1980–2016 were selected to investigate the role of the sources on the moisture contribution. The episodes of September 1991–July 1992 and May 2015–March 2016 in the NRB were the longest with a duration of 11 months, reaching a peak under −2.0 (extremely dry), and were characterised by major severity. The episodes January–October 1995 and August 2015–July 2016 were the most severe and longest in the MRB. Figure 9 shows that the dry conditions simultaneously affected both basins after 2014 and hence the time coincidence of the May 2015–March 2016 and August 2015–July 2016 episodes in the NRB and MRB.
Pampuch et al. [108] examined the distributions of anomalies of SST and of the moisture sources in the South Atlantic Ocean during extreme dry events in southeastern Brazil. However, these authors did not quantify the anomalies in the moisture contribution to the target regions. In our approach, we attempt to investigate the drought phenomenon from a close perspective, that is, by computing the moisture anomalies of |(E − P)i10 < 0| that caused a rainfall decrease over the NRB and MRB during severe dry conditions. Therefore, the monthly anomalies of the moisture contribution to precipitation from each climatological moisture source previously identified were calculated for each episode of Table 4 (Figure 12 and Figure 13). The negative anomalies of |(E − P)i10 < 0| from all sources prevailed during the most severe dry episode in the NRB (September 1991–July 1992). The |(E − P)i10 < 0| anomalies over the NRB, calculated in air masses from all the sources, generally followed the same temporal evolution as the SPEI1, as expected. Nevertheless, the major moisture loss anomalies usually occur in the moisture contribution from the TNA, which could be observed in May 1992 when the |(E − P)i10 < 0| anomaly over the NRB due to the TNA reaching a minimum value (−5.8 mm/day) and the SPEI1 consequently reached the minimum peak (−2.26) of the episode.
A decrease of the moisture loss over the basins may be also associated with dynamic factors. Then, we calculated the VIMF divergence anomalies for each dry episode (Figure 12 and Figure 13). The average VIMF divergence anomalies for the September 1991–July 1992 episode were positive over the NRB, indicating the prevalence of moisture flux divergence, favouring the rainfall decrease. During the second episode (May 2015–March 2016), the SPEI reached the threshold of −1 from September to February, when negative anomalies of |(E − P)i10 < 0| occurred over the NRB in air masses from almost all the sources. The moisture contribution to the precipitation over the NRB from all sources decreased in September 2015 and consequently, the SPEI1 sharply dropped, reaching the minimum of the episode (−2.32). The greatest decrease in the moisture supply occurred from the TSA (−3.16 mm/day) during this month. From September 2015 to January 2016, the moisture loss anomalies of the air masses arriving from all sources over the NRB were negative. They were positive in the last two months of the episode when the rainfall deficit decreases (according to SPEI1 values). The |(E − P)i10 < 0| anomalies of the TSA and NRB itself perfectly matched the SPEI1 evolution. Positive anomalies of the VIMF divergence prevailed in the northeast of the ARB and over almost all the NRB. Negative anomalies of the VIMF divergenced in the west and northwest of the ARB, which suggested a convergence of the moisture flux that enhanced the conditions necessary for rainfall occurrence. In the third dry episode (December 2000–August 2001), the |(E − P)i10 < 0| anomalies from all sources and the SPEI1 did not show the same temporal evolution. Nevertheless, we must consider the temporal lag that may exist between the contribution from the sources and the climatological role of the sources across the year. At the end of the episode, the moisture contribution from the TNA decreased, which was consistent with the SPEI1 decrease. The VIMF divergence anomaly patterns for this episode showed few areas with positive divergence anomalies. In the fourth episode (May 1982–November 1982) almost all |(E − P)i10 < 0| anomalies were negative, but did not match completely the SPEI1 evolution. During the fifth episode (January 1985–June 1985), the anomalies in the moisture contribution from TNA seemed to be the best associated with SPEI and predominant positive VIMF anomalies over the NRB indicated divergence of the vertically moisture flux.
Negative anomalies of the moisture contribution to the basin from all sources predominated during the most severe dry episode (January 1995 to October 1995) in the MRB (Figure 13). The negative anomalies of |(E − P)i10 < 0|from ARBp, MRB, and TSA seemed to be the most related with the dry conditions (according with the SPEI1). The average pattern of the VIMF divergence anomalies was positive over the MRB and almost all the ARB. In the second episode (August 2015 to July 2016), the anomalies of |(E − P)i10 < 0| from two continental sources, the MRB itself and ARBp, seemed to be the most important considering their magnitude and the SPEI values. With respect to the oceanic sources, the anomalies of the TNA and TSA showed an inverse behaviour. A lag of approximately one month was observed in some cases. The |(E − P)i10 < 0| anomalies from MRB was −3.8 mm/day, respectively, in November 2015. One month later, the SPEI abruptly decreased with respect to the previous months and reached the minimum value of the episode. This phenomenon could also be observed from February to March 2016 for |(E − P)i10 < 0| anomalies from the MRB, ARBp, SE, N, and TNA. However, the SPEI reached the greatest value (near zero) in February 2016, when the greatest amount of moisture contribution from the TSA and NEB could compensate the less supply from the rest of the sources. The dry conditions decreased toward the end of the episode along with the anomalies in the moisture supply, specifically that from the TNA and MRB. Positive and negative anomalies of the VIMF divergence anomalies over the MRB were observed; however, the positive anomalies prevailed.
During all months of the third dry episode (June–November 1988), almost all |(E − P)i10 < 0| anomalies were negative, while intense positive anomalies of the VIMF divergence were observed over the MRB. In the fourth episode (January–August 1998), under El Niño conditions, the moisture contribution from TNA experienced a major reduction than that from the TSA. In August 1998, the last month of the episode, the |(E − P)i10 < 0| anomalies from all sources were positive, which favoured the rainfall occurrences and consequently the SPEI1 become positive. The VIMF divergence anomalies of this period were mostly positive. In the fifth episode (August 2014 to March 2015) the negative anomalies of |(E − P)i10 < 0| occurred in a major number of months from the ARBp. After October 2014, the relationship between the SPEI and |(E − P)i10 < 0| anomalies remained unclear. The SPEI reached the minimum value (−2.3) of the episode during December 2014, indicating extremely dry conditions, but negative anomalies of |(E − P)i10 < 0| were only observed for the SE. Dry conditions diminish in January 2015. In this month, the anomalies on the moisture supply from TNA, N, ARBp, AND, and SE were negative but those from NEB, MRB and TSA were positive. The VIMF divergence anomalies of the episode were mostly positive.
3.6. Moisture Contribution during El Niño and La Niña Conditions
The rainfall variability and climate extremes in Amazonia and other tropical regions were strongly linked to the ENSO. El Niño events, such as in 1982/83, 1997/98, and 2015/16, or La Niña events in 1988/89 and 2010 were related to dry conditions [4,27,42,45,63,97,109,110]. However, the dry years of 1963–64 and 2004–05 were related to near normal conditions in the tropical Pacific and to anomalously warm SST in the tropical North Atlantic [45]. Table 5 and Table 6 summarises the average P and |(E − P)i10 < 0| anomalies over the NRB and MRB for composites of months under El Niño/La Niña conditions according to the BEST index. Negative rainfall anomalies prevailed in the NRB under El Niño conditions unless in April and July when were positive. Under La Niña conditions, positive P anomalies occurred mostly during boreal winter (Table 5). With respect to the composite under El Niño conditions, positive anomalies of P may be related to the positive |(E − P)i10 < 0| anomalies from TSA and N. With respect to the composite of months under La Niña conditions, the P anomalies were positive from September to March and in May. The moisture contribution to precipitation from all sources, except for the TSA in March, were favoured during these months. In April, June, July, and August (boreal summer), the P anomalies were negative. Based on the analysis of the moisture loss anomalies over the NRB, negative anomalies occurred in April were related the contribution from TSA and N, while in June were associated with the TNA source. Negative |(E − P)i10 < 0| anomalies rarely occurred in July; they did occur in August and were associated with the moisture supply from TSA. Here, we confirmed the opposite impact of warm and cold events of the ENSO on the hydroclimatology in the NRB.
The same analysis was performed for the MRB and the results are shown in Table 6. During El Niño, positive P anomalies occurred from April to August (austral winter) and in December. In these months positive |(E − P)i10 < 0| anomalies occurred from some sources alternatively; but all of them in July. Negative P anomalies occurred in the rest of months (austral summer). Based on the |(E − P)i10 < 0| anomalies, the reduction of the contribution was higher from continental sources. For the composite under La Niña conditions, the average P decreased over the MRB (according to negative P anomalies) from April to November and in January. A reduction of the moisture contribution from almost all the sources was observed from May to August (winter months). This behavior was very similar to what happened when, in 2010, drought started during an El Niño event in early austral summer and then became more intense during La Niña in the austral winter dry season and the following spring [27]. In December, February, and March, the anomalies indicated that P was favoured over the basin, which must have been related to the increased moisture contribution from sources. In those three months, there occurred positive anomalies of |(E − P)i10 < 0| from the ARBp, MRB, N, and SE. Drumond et al. [3] argued that, in comparison to La Niña episodes, it seemed that the contribution from the tropical and subtropical Atlantic to the ARB was weakened during an El Niño cycle. However, our results showed that mainly El Niño (La Niña) reduced the moisture contribution from the sources and the P over the NRB (MRB).
4. Conclusions
The precipitation regimes of the northern and southern ARB strongly vary. The main moisture sources of the NRB and MRB in the northern and southwestern ARB, respectively, were identified. The results confirmed the main roles of oceanic regions in the TNA, TSA, and surrounding continental areas in providing moisture to the NRB and MRB. In the NRB, the oceanic sources generally provided the major amount of humidity throughout the year, particularly the TNA (TSA) during boreal winter (summer). In contrast, the MRB received the greatest amount of humidity from land sources north and south of the basin. The high amount of moisture loss in air masses tracked forward-in-time from the basins themselves, confirmed that recycling played an important role in Amazonia, as previously reported. Particularly, part of the ARB (ARBp) played an important role in providing humidity to the MRB. We consider that the onset and demise of the rainy season in the NRB depended on moisture contribution from the TNA, while in the MRB mostly depended on the moisture contribution from the basin itself, rest of the ARBp, and TSA. These results may be highly useful to monitor and predict the onset and demise of the rainy season, which progresses northward from the southern ARB.
Dry and wet conditions within the ARB have not usually occurred simultaneously in the period under study. However, the NRB and MRB were simultaneously affected by intense dry conditions in 2015–2016. Through the five most severe episodes in the NRB the anomalies on the contribution from TNA principally, and TSA, seemed to be associated with the SPEI temporal evolution. It also happened in the MRB, where both oceanic and terrestrial sources played an important role. On average, the episodes were associated with a reduction of atmospheric moisture contribution from the sources, and subsidence based on predominantly positive VIMF divergence anomalies over the basins. Concerning the role of ENSO, it affected the moisture supply from the sources and thus the P over them. The impact varied between the NRB and MRB. In this study, we investigated the source-sink of atmospheric moisture relationship to identify and evaluate the role of the climatological moisture sources of the NRB and MRB on the precipitation and its variability over them. We consider this approach useful to understand better the hydrological cycle, but essentially to diagnose the causes of droughts and floods. However, further research must be done to investigate the influences of other modes of climate variability in the variations in the moisture contribution from the sources, and the role of the basins themselves as sources of moisture for surrounding continental regions.
Supplementary Materials
The following are available online at https://www.mdpi.com/2073-4441/10/6/738/s1, Table S1: Dry episodes occurring in the NRB and MRB according to SPEI1 and their duration, severity and peak. Sorted according to the date of occurrence. Period: 1980–2016.
Author Contributions
R.S., J.A.M., R.N., L.G. designed, proposed and conducted the research; R.S. performed the experiments and R.S., J.A.M., R.N., L.G. analysed the data; all the authors wrote the paper.
Acknowledgments
R.S. would like to acknowledge the grant from the Xunta of Galicia, Spain, in support of his doctoral research work and to Campus DoMar of the University of Vigo for the support to carry out a research stay at CEMADEN; R.N. acknowledges support from CNPq grant 314734/2014-7 provided by the Brazilian government, and A.D. acknowledges the support of the Spanish Government and FEDER via the SETH (CGL2014-60849-JIN) project. J.A.M. was supported by the National Institute of Science and Technology for Climate Change Phase Phase 2 under CNPq Grant 465501/2014-1, and FAPESP Grants 2014/50848-9 and 2015/50122-0; the National Coordination for High Level Education and Training (CAPES) Grant 16/2014, and the Deutsche Forschungsgemeinschaf Grant DFG-GRTK 1740/2. This research was partially supported by Xunta de Galicia under project ED413C 2017/64 “Programa de Consolidacion e Estructuracion de Unidades de Investigacion Competitivas (Grupos de Referencia Competitiva)” co-funded by European Regional Development Fund (FEDER). All the authors acknowledge the Water Journal by financing this publication.
Conflicts of Interest
The authors declare no conflicts of interest. The founding sponsors had no role in the design of the study; in the collection, analyses, or interpretation of data; in the writing of the manuscript, or in the decision to publish the results.
References
- Barthem, R.B.; Charvet-Almeida, P.; Montag, L.F.A.; Lanna, A.E. Amazon Basin, GIWA Regional Assessment 40b; Printed and bound in Sweden by Sunds Tryck Öland AB; UNEP, University of Kalmar: Kalmar, Sweden, 2004. [Google Scholar]
- Marengo, J.A. On the Hydrological Cycle of the Amazon Basin: A historical review and current state-of-the-art. Rev. Bras. Meteorol. 2006, 21, 1–19. [Google Scholar]
- Drumond, A.; Marengo, J.; Ambrizzi, T.; Nieto, R.; Moreira, L.; Gimeno, L. The role of the Amazon Basin moisture in the atmospheric branch of the hydrological cycle: A Lagrangian analysis. Hydrol. Earth Syst. Sci. 2014, 18, 2577–2598. [Google Scholar] [CrossRef] [Green Version]
- Marengo, J.A.; Ezpinoza, J.C. Extreme seasonal droughts and floods in Amazonia: Causes, trends and impacts. Int. J. Climatol. 2016, 36, 1033–1050. [Google Scholar] [CrossRef]
- Marengo, J.A. Interannual Variability of Surface Climate in the Amazon Basin. Int. J. Climatol. 1992, 12, 853–863. [Google Scholar] [CrossRef]
- Marengo, J.A. Interdecadal variability and trends of rainfall across the Amazon basin. Theor. Appl. Climatol. 2004, 78, 79–96. [Google Scholar] [CrossRef]
- Marengo, J.A.; Liebmann, B.; Kousky, V.E.; Filizola, N.P.; Wainer, I.C. Onset and end of the rainy season in the Brazilian Amazon Basin. J. Clim. 2001, 14, 833–852. [Google Scholar] [CrossRef]
- Yoon, J.-H.; Zeng, N. An Atlantic influence on Amazon rainfall. Clim. Dyn. 2010, 34, 249–264. [Google Scholar] [CrossRef]
- Durán-Quesada, A.M.; Reboita, M.; Gimeno, L. Precipitation in tropical America and the associated sources of moisture: A short review. Hydrol. Sci. J. 2012, 57, 612–624. [Google Scholar] [CrossRef]
- Satyamurty, P.; da Costa, C.P.W.; Manzi, A.O. Moisture source for the Amazon Basin: A study of contrasting years. Theor. Appl. Climatol. 2013, 111, 195–209. [Google Scholar] [CrossRef]
- Salati, E.; Dall’Olio, A.; Matsui, E.; Gat, J.R. Recycling of water in the Amazon basin: An isotopic study. Water Resour. Res. 1979, 15, 1250–1258. [Google Scholar] [CrossRef]
- Brubaker, K.L.; Entekhabi, D.; Eagleson, P.S. Estimation of continental precipitation recycling. J. Clim. 1993, 6, 1077–1089. [Google Scholar] [CrossRef]
- Van der Ent, R.J.; Savenije, H.H.G.; Schaefli, B.; Steele-Dunne, S.C. Origin and fate of atmospheric moisture over continents. Water Resour. Res. 2010, 46, W09525. [Google Scholar] [CrossRef]
- Zemp, D.C.; Schleussner, C.F.; Barbosa, H.M.J.; van der Ent, R.J.; Donges, J.F.; Heinke, J.; Sampaio, G.; Rammig, A. On the importance of cascading moisture recycling in South America. Atmos. Chem. Phys. 2014, 14, 13337–13359. [Google Scholar] [CrossRef] [Green Version]
- Eltahir, E.A.B.; Bras, R.L. Precipitation recycling in the Amazon basin. Q. J. Roy. Meteorol. Soc. 1994, 120, 861–880. [Google Scholar] [CrossRef]
- Van der Ent, R.J.; Savenije, H.H.G. Length and time scales of atmospheric moisture recycling. Atmos. Chem. Phys. 2011, 11, 1853–1863. [Google Scholar] [CrossRef] [Green Version]
- Van der Ent, R.J.; Wang-Erlandsson, L.; Keys, P.W.; Savenije, H.H.G. Contrasting roles of interception and transpiration in the hydrological cycle—Part 2: Moisture recycling. Earth Syst. Dyn. 2014, 5, 471–489. [Google Scholar] [CrossRef]
- Marengo, J.A. Characteristics and spatio-temporal variability of the Amazon River Basin Water Budget. Clim. Dyn. 2005, 24, 11–22. [Google Scholar] [CrossRef]
- Vera, C.; Baez, J.; Douglas, M.; Emmanuel, C.B.; Marengo, J.; Meitin, J.; Nicolini, M.; Nogues-Paegle, J.; Paegle, J.; Penalba, O.; et al. The South American low-level jet experiment. Bull. Am. Meteorol. Soc. 2006, 87, 63–77. [Google Scholar] [CrossRef]
- Drumond, A.; Nieto, R.; Gimeno, L.; Ambrizzi, T. A Lagrangian identification of major sources of moisture over Central Brazil and La Plata Basin. J. Geophys. Res. 2008, 113, D14128. [Google Scholar] [CrossRef]
- Arraut, J.M.; Satyamurty, P. Precipitation and water vapor transport in the Southern Hemisphere with emphasis on the South American region. J. Appl. Meteorol. Climatol. 2009, 48, 1902–1912. [Google Scholar] [CrossRef]
- Arraut, J.M.; Nobre, C.; Barbosa, H.M.; Obregon, G.; Marengo, J. Aerial rivers and lakes: Looking at large-scale moisture transport and its relation to Amazonia and to subtropical rainfall in South America. J. Clim. 2012, 25, 543–556. [Google Scholar] [CrossRef]
- Martinez, J.A.; Dominguez, F. Sources of Atmospheric Moisture for the La Plata River Basin. J. Clim. 2014, 27, 6737–6753. [Google Scholar] [CrossRef]
- Bosilovich, M.G.; Chern, J. Simulation of Water Sources and Precipitation Recycling for the MacKenzie, Mississippi, and Amazon River Basins. J. Hydrometeorol. 2006, 7, 312–329. [Google Scholar] [CrossRef] [Green Version]
- Stohl, A.; James, P. A Lagrangian analysis of the atmospheric branch of the global water cycle. Part II: Moisture transports between the Earth’s ocean basins and river catchments. J. Hydrometeorol. 2005, 6, 961–984. [Google Scholar] [CrossRef]
- Marengo, J.A.; Nobre, C.A.; Tomasella, J.; Cardoso, M.F.; Oyama, M.D. Hydro-climatic and ecological behaviour of the drought of Amazonia in 2005. Philos. Trans. R. Soc. B 2008, 363, 1773–1778. [Google Scholar] [CrossRef] [PubMed] [Green Version]
- Marengo, J.A.; Tomasella, J.; Alves, L.M.; Soares, W.; Rodriguez, D.A. The drought of 2010 in the context of historical droughts in the Amazon region. Geophys. Res. Lett. 2011, 38, 1–5. [Google Scholar] [CrossRef]
- Marengo, J.A.; Liebmann, B.; Grimm, A.M.; Misra, V.; Silva Dias, P.L.; Cavalcanti, I.F.A.; Carvalho, L.M.V.; Berbery, E.H.; Ambrizzi, T.; Vera, C.S.; et al. Review Recent developments on the South American monsoon system. Int. J. Climatol. 2012, 32, 1–21. [Google Scholar] [CrossRef]
- Enfield, D.B. Relationships of inter-American rainfall to tropical Atlantic and Pacific SST variability. Geophys Res Lett. 1996, 23, 3305–3308. [Google Scholar] [CrossRef]
- Cox, P.M.; Betts, R.A.; Collins, M.; Harris, P.P.; Huntingford, C.; Jones, C.D. Amazonian forest dieback under climate carbon cycle projections for the 21st century. Theor. Appl. Climatol. 2004, 78, 137–156. [Google Scholar] [CrossRef]
- Betts, R.; Cox, P.; Collins, M.; Harris, P.; Huntingford, C.; Jones, C. The role of ecosystem-atmosphere interactions in simulated Amazonian precipitation decrease and forest dieback under global climate warming. Theor. Appl. Climatol. 2004, 78, 157–175. [Google Scholar] [CrossRef]
- Spracklen, D.V.; Arnold, S.R.; Taylor, C.M. Observations of increased tropical rainfall preceded by air passage over forests. Nature 2012, 489, 282–285. [Google Scholar] [CrossRef] [PubMed]
- Zemp, D.C.; Schleussner, C.; Barbosa, H.M.J.; Hirota, M.; Montade, V.; Sampaio, G.; Staal, A.; Wang-Erlandsson, L.; Rammig, A. Self-amplified Amazon forest loss due to vegetation–atmosphere feedbacks. Nat. Commun. 2017, 8, 14681. [Google Scholar] [CrossRef] [PubMed]
- Ometto, J.P.; Sampaio, G.; Marengo, J.; Assis, T.; Tejada, G.; Aguiar, A.P. Climate Change and Land Use Change in Amazonia; Report for Global Canopy Programme and International Center for Tropical Agriculture as Part of the Amazonia Security Agenda Project; Global Canopy Programme: Oxford, UK, 2013. [Google Scholar]
- Aragao, L.E.O.C.; Anderson, L.O.; Fonseca, M.G.; Rosan, T.M.; Vedovato, L.B.; Wagner, F.H.; Silva, C.V.J.; Junior, C.H.L.S.; Arai, E.; Aguiar, A.P.; et al. 21st Century drought-related fires counteract the decline of Amazon deforestation carbon emissions. Nat. Commun. 2018, 9, 536. [Google Scholar] [CrossRef] [PubMed]
- Spracklen, D.V.; Garcia-Carreras, L. The impact of Amazonian deforestation on Amazon basin rainfall. Geophys. Res. Lett. 2015, 42, 9546–9552. [Google Scholar] [CrossRef] [Green Version]
- Moore, N.; Arima, E.; Walker, R.; Da Silva, R. Uncertainty and changing hydroclimatology of the Amazon. Geophys. Res. Lett. 2007, 34, L12707. [Google Scholar] [CrossRef]
- D’Almeida, C.; Vor smarty, C.J.; Hurtt, G.C.; Marengo, J.A.; Dingman, S.L.; Keim, B.D. The effects of deforestation on the hydrological cycle in Amazonia: A review on scale and resolution. Int. J. Climatol. 2007, 27, 633–647. [Google Scholar] [CrossRef]
- Costa, M.H.; Foley, J.A. Trends in the hydrologic cycle of the Amazon Basin. J. Geophys. Res. 1999, 104, 14189–14198. [Google Scholar] [CrossRef]
- Do Nascimento, M.G.; Herdies, D.L.; Oliveira de Souza, D. The South American Water Balance: The Influence of Low-Level Jets. J. Clim. 2016, 29, 1429–1449. [Google Scholar] [CrossRef]
- Uvo, C.B.; Repelli, C.A.; Zebiak, S.E.; Kushnir, Y. The Relationships between Tropical Pacific and Atlantic SST and Northeast Brazil Monthly Precipitation. J. Clim. 1998, 11, 551–562. [Google Scholar] [CrossRef]
- De Souza, E.B.; Kayano, M.T.; Tota, J.; Pezzi, L.; Fisch, G.; Nobre, C. On the influences of the El Niño, La Niña and Atlantic dipole pattern on the Amazonian rainfall during 1960–1998. Acta Amazon. 2000, 30, 305–318. [Google Scholar] [CrossRef]
- Ronchail, J.; Cochonneau, G.; Molinier, M.; Guyot, J.; De Miranda Chaves, A.G.; Guimarães, V.; de Oliveira, E. Interannual rainfall variability in the Amazon basin and sea-surface temperatures in the equatorial Pacific and the tropical Atlantic Oceans. Int. J. Climatol. 2002, 22, 1663–1686. [Google Scholar] [CrossRef] [Green Version]
- Gimeno, L. Grand challenges in atmospheric science. Front. Earth Sci. 2013, 1, 1–5. [Google Scholar] [CrossRef]
- Marengo, J.; Nobre, C.; Tomasella, J.; Oyama, M.; de Oliveira, G.; de Oliveira, R.; Camargo, H.; Alves, L. The drought in Amazonia in 2005. J. Clim. 2008, 21, 495–516. [Google Scholar] [CrossRef]
- Marengo, J.A.; Tomasella, J.; Soares, W.R.; Alves, L.M.; Nobre, C.A. Extreme climatic events in the Amazon basin. Theor. Appl. Climatol. 2012, 107, 73–85. [Google Scholar] [CrossRef]
- Marengo, J.A.; Borma, L.S.; Rodriguez, D.A.; Pinho, P.; Soares, W.R.; Alves, L.M. Recent Extremes of Drought and Flooding in Amazonia: Vulnerabilities and human adaptation. Am. J. Clim. Chang. 2013, 2, 87–96. [Google Scholar] [CrossRef]
- Espinoza, J.C.; Ronchail, J.; Guyot, J.L.; Junquas, C.; Drapeau, G.; Martinez, J.M.; Santini, W.; Vauchel, P.; Lavado, W.; Ordonez, J.; et al. From drought to flooding: Understanding the abrupt 2010–2011 hydrological annual cycle in the Amazonas River and tributaries. Environ. Res. Lett. 2012, 7, 024008. [Google Scholar] [CrossRef]
- Dias de Paiva, R.C.; Buarque, D.C.; Collischonn, W.; Bonnet, M.-P.; Frappart, F.; Calmant, S.; Mendes, C.A.B. Large-scale hydrologic and hydrodynamic modeling of the Amazon River basin. Water Resour. Res. 2013, 49, 1226–1243. [Google Scholar] [CrossRef] [Green Version]
- Furley, P.A. Tropical Forest of the Lowlands. In The Physical Geography of South America; Veblen, T.T., Young, K.R., Orme, A.R., Eds.; Oxford University Press: Oxford, UK, 2015; 448p, p. 136. [Google Scholar]
- Figueroa, S.N.; Nobre, C.A. Precipitation distribution over central and western tropical South America. Climanalise 1990, 5, 36–45. [Google Scholar]
- Da Silva Ferreira, D.B.; Barreiros de Souza, E.; Cavalcanti de Moraes, B.; Meira Filho, L.G. Spatial and Temporal Variability of Rainfall in Eastern Amazon during the Rainy Season. Sci. World J. 2015, 2015, 209783. [Google Scholar] [CrossRef] [PubMed]
- Carvalho, L.M.V.; Jones, C.; Liebmann, B. The South Atlantic Convergence Zone: Intensity, Form, Persistence, and Relationships with Intraseasonal to Interannual Activity and Extreme Rainfall. J. Clim. 2004, 17, 88–108. [Google Scholar] [CrossRef] [Green Version]
- Vieira, S.D.; Satyamurty, P.; Andreoli, R.V. On the South Atlantic Convergence Zone affecting southern Amazonia in austral summer. Atmos. Sci. Lett. 2013, 14, 1–6. [Google Scholar] [CrossRef] [Green Version]
- Raia, A.; Cavalcanti, I.F.D.A. The Life Cycle of the South American Monsoon System. J. Clim. 2008, 21, 6227–6246. [Google Scholar] [CrossRef]
- Wang, H.; Fu, R. Cross-equatorial flow and seasonal cycle of precipitation over South America. J. Clim. 2002, 15, 1591–1608. [Google Scholar] [CrossRef]
- Carvalho, L.M.V.; Silva, A.E.; Jones, C.; Liebmann, B.; Silva Dias, P.L.; Rocha, H.R. Moisture transport and intraseasonal variability in the South America monsoon system. Clim. Dyn. 2011, 36, 1865–1880. [Google Scholar] [CrossRef]
- Lenters, J.D.; Cook, K.H. On the Origin of the Bolivian High and Related Circulation Features of the South American Climate. J. Atmos. Sci. 1997, 54, 656–677. [Google Scholar] [CrossRef]
- Andreoli, R.V.; Ferreira de Souza, R.A.; Kayano, M.T.; Candido, L.A. Seasonal anomalous rainfall in the central and eastern Amazon and associated anomalous oceanic and atmospheric patterns. Int. J. Climatol. 2012, 32, 1193–1205. [Google Scholar] [CrossRef]
- Espinoza, J.C.; Marengo, J.A.; Ronchail, J.; Molina Carpio, J.; Noriega Flores, L.; Loup Guyot, J. The extreme 2014 flood in south-western Amazon basin: The role of tropical-subtropical South Atlantic SST gradient. Environ. Res. Lett. 2014, 9, 124007. [Google Scholar] [CrossRef] [Green Version]
- Yoon, J.-H. Multi-model analysis of the Atlantic influence on southern Amazon rainfall. Atmos. Sci. Lett. 2016, 17, 122–127. [Google Scholar] [CrossRef]
- COLA: The Center for Ocean-Land-Atmosphere Studies. Available online: http://cola.gmu.edu/wcr/river/Niger.png (accessed on 2 April 2018).
- Jiménez-Muñoz, J.C.; Mattar, C.; Barichivich, J.; Santamaría-Artigas, A.; Takahashi, K.; Malhi, Y.; Sobrino, J.A.; Schrier, G.V.D. Record-breaking warming and extreme drought in the Amazon rainforest during the course of El Niño 2015–2016. Sci. Rep. 2016, 6, 33130. [Google Scholar] [CrossRef] [PubMed] [Green Version]
- Stohl, A.; James, P. A Lagrangian analysis of the atmospheric branch of the global water cycle. Part I: Method description, validation, and demonstration for the August 2002 flooding in central Europe. J. Hydrometeorol. 2004, 5, 656–678. [Google Scholar] [CrossRef]
- Numaguti, A. Origin and recycling processes of precipitating water over the Eurasian continent: Experiments using an atmospheric general circulation model. J. Geophys. Res. 1999, 104, 1957–1972. [Google Scholar] [CrossRef] [Green Version]
- Drumond, A.; Nieto, R.; Gimeno, L. A Lagrangian approach for investigating anomalies in the moisture transport during drought episodes. Cuad. Investig. Geogr. 2016, 42, 113–125. [Google Scholar] [CrossRef]
- Ciric, D.; Stojanovic, M.; Drumond, A.; Nieto, R.; Gimeno, L. Tracking the Origin of Moisture over the Danube River Basin Using a Lagrangian Approach. Atmosphere 2016, 7, 162. [Google Scholar] [CrossRef]
- Sorí, R.; Nieto, R.; Vicente-Serrano, S.M.; Drumond, A.; Gimeno, L. A Lagrangian perspective of the hydrological cycle in the Congo River basin. Earth Syst. Dyn. 2017, 8, 653–675. [Google Scholar] [CrossRef] [Green Version]
- Gimeno, L.; Drumond, A.; Nieto, R.; Trigo, R.M.; Stohl, A. On the origin of continental precipitation. Geophys. Res. Lett. 2010, 37, L13804. [Google Scholar] [CrossRef]
- Sun, B.; Wang, H. Analysis of the major atmospheric moisture sources affecting three sub-regions of East China. Int. J. Climatol. 2015, 35, 2243–2257. [Google Scholar] [CrossRef]
- Salih, A.A.M.; Zhang, Q.; Tjernström, M. Lagrangian tracing of Sahelian Sudan moisture sources. J. Geophys. Res. Atmos. 2015, 120, 6793–6808. [Google Scholar] [CrossRef] [Green Version]
- Vázquez, M.; Nieto, R.; Drumond, A.; Gimeno, L. Extreme Sea Ice Loss over the Arctic: An Analysis Based on Anomalous Moisture Transport. Atmosphere 2017, 8, 32. [Google Scholar] [CrossRef]
- Dee, D.P.; Uppala, S.M.; Simmons, A.J.; Berrisford, P.; Poli, P.; Kobayashi, S.; Andrae, U.; Balmaseda, M.A.; Balsamo, G.; Bauer, P.; et al. The ERA-Interim reanalysis: Configuration and performance of the data assimilation system. Q. J. R. Meteorol. Soc. 2011, 137, 553–597. [Google Scholar] [CrossRef]
- Uppala, S.; Dee, D.; Kobayashi, S.; Berrisford, P.; Simmons, A. Towards a climate data assimilation system: Status update of ERA-Interim. ECMWF Newsletter. 2008, 115, 12–18. [Google Scholar]
- Betts, A.K.; Köhler, M.; Zhang, Y. Comparison of river basin hydrometeorology in ERA-Interim and ERA-40 reanalyses with observations. J. Geophys. Res. 2009, 114, D02101. [Google Scholar] [CrossRef]
- De Almeida, V.A.; Marton, E.; Nunes, A.M.B. Assessing the ability of three global reanalysis products to reproduce South American monsoon precipitation. Atmósfera 2018, 31, 1–10. [Google Scholar] [CrossRef] [Green Version]
- Liebmann, B.; Camargo, S.J.; Seth, A.; Marengo, J.A.; Carvalho, L.M.; Allured, D.; Fu, R.; Vera, C.S. Onset and End of the Rainy Season in South America in Observations and the ECHAM 4.5 Atmospheric General Circulation Model. J. Clim. 2007, 20, 2037–2050. [Google Scholar] [CrossRef] [Green Version]
- Liebmann, B.; Marengo, J. Interannual Variability of the Rainy Season and Rainfall in the Brazilian Amazon Basin. J. Clim. 2001, 14, 4308–4318. [Google Scholar] [CrossRef] [Green Version]
- Noska, R.; Misra, V. Characterizing the onset and demise of the Indian summer monsoon. Geophys. Res. Lett. 2016, 43, 4547–4554. [Google Scholar] [CrossRef]
- Chris, F.; Peterson, P.; Landsfeld, M.; Pedreros, D.; Verdin, J.; Shukla, S.; Husak, G.; Rowland, J.; Harrison, L.; Hoell, A.; et al. The climate hazards infrared precipitation with stations—A new environmental record for monitoring extremes. Sci. Data 2015, 2, 150066. [Google Scholar] [CrossRef]
- Kousky, V.E. Pentad outgoing longwave radiation climatology for the South American sector. Rev. Bras. Meteorol. 1988, 3, 217–231. [Google Scholar]
- González, M.; Vera, C.S.; Liebmann, B.; Marengo, J.A.; Kousky, V.; Allured, D. The nature of the rainfall onset over central South America. Atmósfera 2007, 20, 377–394. [Google Scholar]
- Garcia, S.R.; Kayano, M.T. Determination of the onset dates of the rainy season in central Amazon with equatorially antisymmetric outgoing longwave radiation. Theor. Appl. Climatol. 2009, 97, 361–372. [Google Scholar] [CrossRef]
- Garcia, S.R.; Kayano, M.T. Some considerations on onset dates of the rainy season in Western-Central Brazil with antisymmetric outgoing longwave radiation relative to the equator. Int. J. Climatol. 2013, 33, 188–198. [Google Scholar] [CrossRef]
- Dos Santos, L.F.; Garcia, S.R. Início e Fim da Estação Chuvosa no Estado de Minas Gerais: Comparação de Duas Metodologias Diferentes. Rev. Bras. Meteorol. 2016, 31, 92–104. [Google Scholar] [CrossRef] [Green Version]
- Liebmann, B.; Smith, C.A. Description of a Complete (Interpolated) Outgoing Longwave Radiation Dataset. Bull. Am. Meteorol. Soc. 1996, 77, 1275–1277. [Google Scholar]
- Vicente-Serrano, S.M.; Beguería, S.; López-Moreno, J.I. A Multiscalar Drought Index Sensitive to Global Warming: The Standardized Precipitation Evapotranspiration Index. J. Clim. 2010, 23, 1696–1718. [Google Scholar] [CrossRef] [Green Version]
- McKee, T.B.; Doesken, N.J.; Kleist, J. The relationship of drought frequency and duration to time scales. In Proceedings of the Eighth Conference on Applied Climatology, Anaheim, CA, USA, 17–22 January 1993; pp. 179–184. [Google Scholar]
- Harris, I.; Jones, P.D.; Osborn, T.J.; Lister, D.H. Updated high-resolution grids of monthly climatic observations—The CRU TS3.10 Dataset. Int. J. Climatol. 2014, 34, 623–642. [Google Scholar] [CrossRef] [Green Version]
- Spinoni, J.; Naumann, G.; Carrao, H.; Barbosa, P.; Vogt, J. World drought frequency, duration, and severity for 1951–2010. Int. J. Climatol. 2014, 34, 2792–2804. [Google Scholar] [CrossRef]
- Spinoni, J.; Vogt, J.V.; Naumann, G.; Barbosa, P.; Dosio, A. Will drought events become more frequent and severe in Europe? Int. J. Climatol. 2018, 38, 1718–1736. [Google Scholar] [CrossRef]
- Tan, C.; Yang, J.; Li, M. Temporal-Spatial Variation of Drought Indicated by SPI and SPEI in Ningxia Hui Autonomous Region, China. Atmosphere 2015, 6, 1399–1421. [Google Scholar] [CrossRef] [Green Version]
- Stojanovic, M.; Drumond, A.; Nieto, R.; Gimeno, L. Moisture Transport Anomalies over the Danube River Basin during Two Drought Events: A Lagrangian Analysis. Atmosphere 2017, 8, 193. [Google Scholar] [CrossRef]
- Stojanovic, M.; Drumond, A.; Nieto, R.; Gimeno, L. Anomalies in Moisture Supply during the 2003 Drought Event in Europe: A Lagrangian Analysis. Water 2018, 10, 467. [Google Scholar] [CrossRef]
- SO HYBAM. The Observation Service (formerly Environmental Research Observatory). Available online: http://www.ore-hybam.org/ (accessed on 10 December 2017).
- Smith, C.A.; Sardeshmukh, P. The Effect of ENSO on the Intraseasonal Variance of Surface Temperature in Winter. Int. J. Climatol. 2000, 20, 1543–1557. [Google Scholar] [CrossRef]
- Espinoza, J.C.; Ronchail, J.; Guyot, J.L.; Cochonneau, G.; Naziano, F.; Lavado, W.; de Oliveira, E.; Pombosa, R.; Vauchel, P. Spatio-temporal rainfall variability in the Amazon Basin countries (Brazil, Peru, Bolivia, Colombia and Ecuador). Int. J. Climatol. 2009, 29, 1574–1594. [Google Scholar] [CrossRef]
- Getirana, A.C.; Dutra, E.; Guimberteau, M.; Kam, J.; Li, H.; Decharme, B.; Zhang, Z.; Ducharne, A.; Boone, A.; Balsamo, G.; et al. Water Balance in the Amazon Basin from a Land Surface Model Ensemble. J. Hydrometeorol. 2014, 15, 2586–2614. [Google Scholar] [CrossRef] [Green Version]
- Gloor, M.; Brienen, R.J.W.; Galbraith, D.; Feldpausch, T.R.; Schöngart, J.; Guyot, J.-L.; Espinoza, J.C.; Lloyd, J.; Phillips, O.L. Intensification of the Amazon hydrological cycle over the last two decades. Geophys. Res. Lett. 2013, 40, 1729–1733. [Google Scholar] [CrossRef] [Green Version]
- Maeda, E.E.; Ma, X.; Wagner, F.H.; Kim, H.; Oki, T.; Eamus, D.; Huete, A. Evapotranspiration seasonality across the Amazon Basin. Earth Syst. Dyn. 2017, 8, 439–454. [Google Scholar] [CrossRef] [Green Version]
- Frappart, F.F.P.; Famiglietti, J.S.; Prigent, C.; Rossow, W.B.; Seyler, F. Interannual variations of river water storage from a multiple satellite approach: A case study for the Rio Negro River basin. J. Geophys. Res. 2008, 113, D21104. [Google Scholar] [CrossRef]
- Melesse, A.M.; Abtew, W. Landscape Dynamics, Soils and Hydrological Processes in Varied Climates; Springer International Publishing: Basel, Switzerland, 2015; 839p, ISBN1 3319187872. ISBN2 9783319187877. [Google Scholar]
- Dirmeyer, P.A.; Brubaker, K.L. Characterization of the Global Hydrologic Cycle from a Back-Trajectory Analysis of Atmospheric Water Vapor. J. Hydrometeorol. 2007, 8, 20–37. [Google Scholar] [CrossRef] [Green Version]
- Trenberth, K.E. Atmospheric Moisture Recycling: Role of Advection and Local Evaporation. J. Clim. 1999, 12, 1368–1380. [Google Scholar] [CrossRef]
- Sorí, R.; Nieto, R.; Drumond, A.; Vicente-Serrano, S.M.; Gimeno, L. The atmospheric branch of the hydrological cycle over the Indus, Ganges, and Brahmaputra river basins. Hydrol. Earth Syst. Sci. 2017, 21, 6379–6399. [Google Scholar] [CrossRef] [Green Version]
- Wright, J.S.; Fu, R.; Worden, J.R.; Chakraborty, S.; Clinton, N.E.; Risi, C.; Sun, Y.; Yin, L. Rainforest-initiated wet season onset over the southern Amazon. Proc. Natl. Acad. Sci. USA 2017, 114, 8481–8486. [Google Scholar] [CrossRef] [PubMed]
- Dos Santos, S.R.Q.; Braga, C.C.; Sansigolo, C.A.; de Araujo Ti-burtino Neves, T.T.; dos Santos, A.P.P. Droughts in the Amazon: Identification, Characterization and Dynamical Mechanisms Associated. Am. J. Clim. Chang. 2017, 6, 425–442. [Google Scholar] [CrossRef]
- Pampuch, L.A.; Drumond, A.; Gimeno, L.; Ambrizzi, T. Anomalous patterns of SST and moisture sources in the South Atlantic Ocean associated with dry events in southeastern Brazil. Int. J. Clim. 2016, 36, 4913–4928. [Google Scholar] [CrossRef]
- Grimm, A.M.; Tedeschi, R.G. ENSO and Extreme Rainfall Events in South America. J. Clim. 2009, 22, 1589–1609. [Google Scholar] [CrossRef]
- Foley, J.A.; Botta, A.; Coe, M.T.; Costa, M.H. El Niño–Southern oscillation and the climate, ecosystems and rivers of Amazonia. Glob. Biogeochem. Cycles 2002, 16, 79-1–79-20. [Google Scholar] [CrossRef]
Figure 1.
The black contour lines delimit the geographical locations of the Amazon River basin (ARB) and two subbasins, that is, the Negro River Basin (NRB) and Madeira River Basin (MRB) in the north and southwest of the ARB, respectively. Green and reddish colours indicate the ground elevation (m), while the blue lines represent the rivers. The pink (dark blue) circle indicates the location of the hydrological station of Manaus (Borba).

Figure 2.
Monthly average precipitation (from CRU 3.2401) in the Amazon River basin (ARB). The Negro and Madeira River basin (NRB and MRB, respectively) boundaries are marked by contours. Period: 1980–2016.
Figure 2.
Monthly average precipitation (from CRU 3.2401) in the Amazon River basin (ARB). The Negro and Madeira River basin (NRB and MRB, respectively) boundaries are marked by contours. Period: 1980–2016.

Figure 3.
Precipitation (P; bars), potential evapotranspiration (PET; dashed lines) annual climatological cycle of the Negro and Madeira river basins (NRB and MRB, respectively). Annual water level cycle in Manaus and Borba (WL; solid lines). Period: 1980–2016.
Figure 3.
Precipitation (P; bars), potential evapotranspiration (PET; dashed lines) annual climatological cycle of the Negro and Madeira river basins (NRB and MRB, respectively). Annual water level cycle in Manaus and Borba (WL; solid lines). Period: 1980–2016.

Figure 4.
Monthly (E − P)i10 patterns for the NRB and MRB based on the backward in time experiment. Period: 1980–2016.
Figure 4.
Monthly (E − P)i10 patterns for the NRB and MRB based on the backward in time experiment. Period: 1980–2016.

Figure 5.
Annual (E − P)i10 > 0 budget obtained in the backward in time experiment for the NRB (a) and MRB (b). Period: 1980–2016.
Figure 5.
Annual (E − P)i10 > 0 budget obtained in the backward in time experiment for the NRB (a) and MRB (b). Period: 1980–2016.

Figure 6.
Schematic representation of the continental and oceanic moisture sources of the NRB (a) and MRB (b) considered in this study based on the p90 values in Figure 5.
Figure 6.
Schematic representation of the continental and oceanic moisture sources of the NRB (a) and MRB (b) considered in this study based on the p90 values in Figure 5.

Figure 7.
Precipitation (grey bars) and moisture contribution to annual precipitation (|(E − P)i10 < 0|) cycles in the NRB (a) and MRB (b). Period: 1980–2016.
Figure 7.
Precipitation (grey bars) and moisture contribution to annual precipitation (|(E − P)i10 < 0|) cycles in the NRB (a) and MRB (b). Period: 1980–2016.

Figure 8.
Daily P (blue bars) and cumulative daily anomalies of P from the CHIRPS datasets, OLR from NOAA and |(E − P)i10 < 0| over the NRB (a) and MRB (b) obtained in a forward experiment from the climatological moisture sources using FLEXPART. Period: 1981–2016.
Figure 8.
Daily P (blue bars) and cumulative daily anomalies of P from the CHIRPS datasets, OLR from NOAA and |(E − P)i10 < 0| over the NRB (a) and MRB (b) obtained in a forward experiment from the climatological moisture sources using FLEXPART. Period: 1981–2016.

Figure 9.
SPEI time series at 1-, 6-, and 12-month temporal scales (a–c) for the Negro (top, NRB) and Madeira (d–f) (bottom, MRB) river basins. The blue (red) colour represents wet (dry) conditions. The black line represents the standardised anomalies of the water level (WL) recorded at the fluvial stations in Manaus (b) and Borba (e). Period: 1980–2016.

Figure 10.
Monthly correlation between |(E − P)i10 < 0| with SPEI1–24 temporal scales over the NRB (a) and MRB (b). Period: 1980–2016.
Figure 10.
Monthly correlation between |(E − P)i10 < 0| with SPEI1–24 temporal scales over the NRB (a) and MRB (b). Period: 1980–2016.

Figure 11.
Monthly correlations between standardised WL anomalies and SPEI1 to SPEI24 in the NRB (a) and MRB (b). The dotted lines represent significant correlations at p < 0.05. Period: 1980–2016.
Figure 11.
Monthly correlations between standardised WL anomalies and SPEI1 to SPEI24 in the NRB (a) and MRB (b). The dotted lines represent significant correlations at p < 0.05. Period: 1980–2016.

Figure 12.
The SPEI1 and monthly anomalies of |(E – P)i10 < 0| during the most severe dry episodes (left panel) in the NRB (ordered as in Table 4) and VIMF divergence anomalies for each episode (right panel).
Figure 12.
The SPEI1 and monthly anomalies of |(E – P)i10 < 0| during the most severe dry episodes (left panel) in the NRB (ordered as in Table 4) and VIMF divergence anomalies for each episode (right panel).

Figure 13.
The SPEI1 and monthly anomalies of |(E − P)i10 < 0| during the most severe dry episodes (left panel) in the MRB (ordered as in Table 4) and VIMF divergence anomalies for each episode (right panel).
Figure 13.
The SPEI1 and monthly anomalies of |(E − P)i10 < 0| during the most severe dry episodes (left panel) in the MRB (ordered as in Table 4) and VIMF divergence anomalies for each episode (right panel).


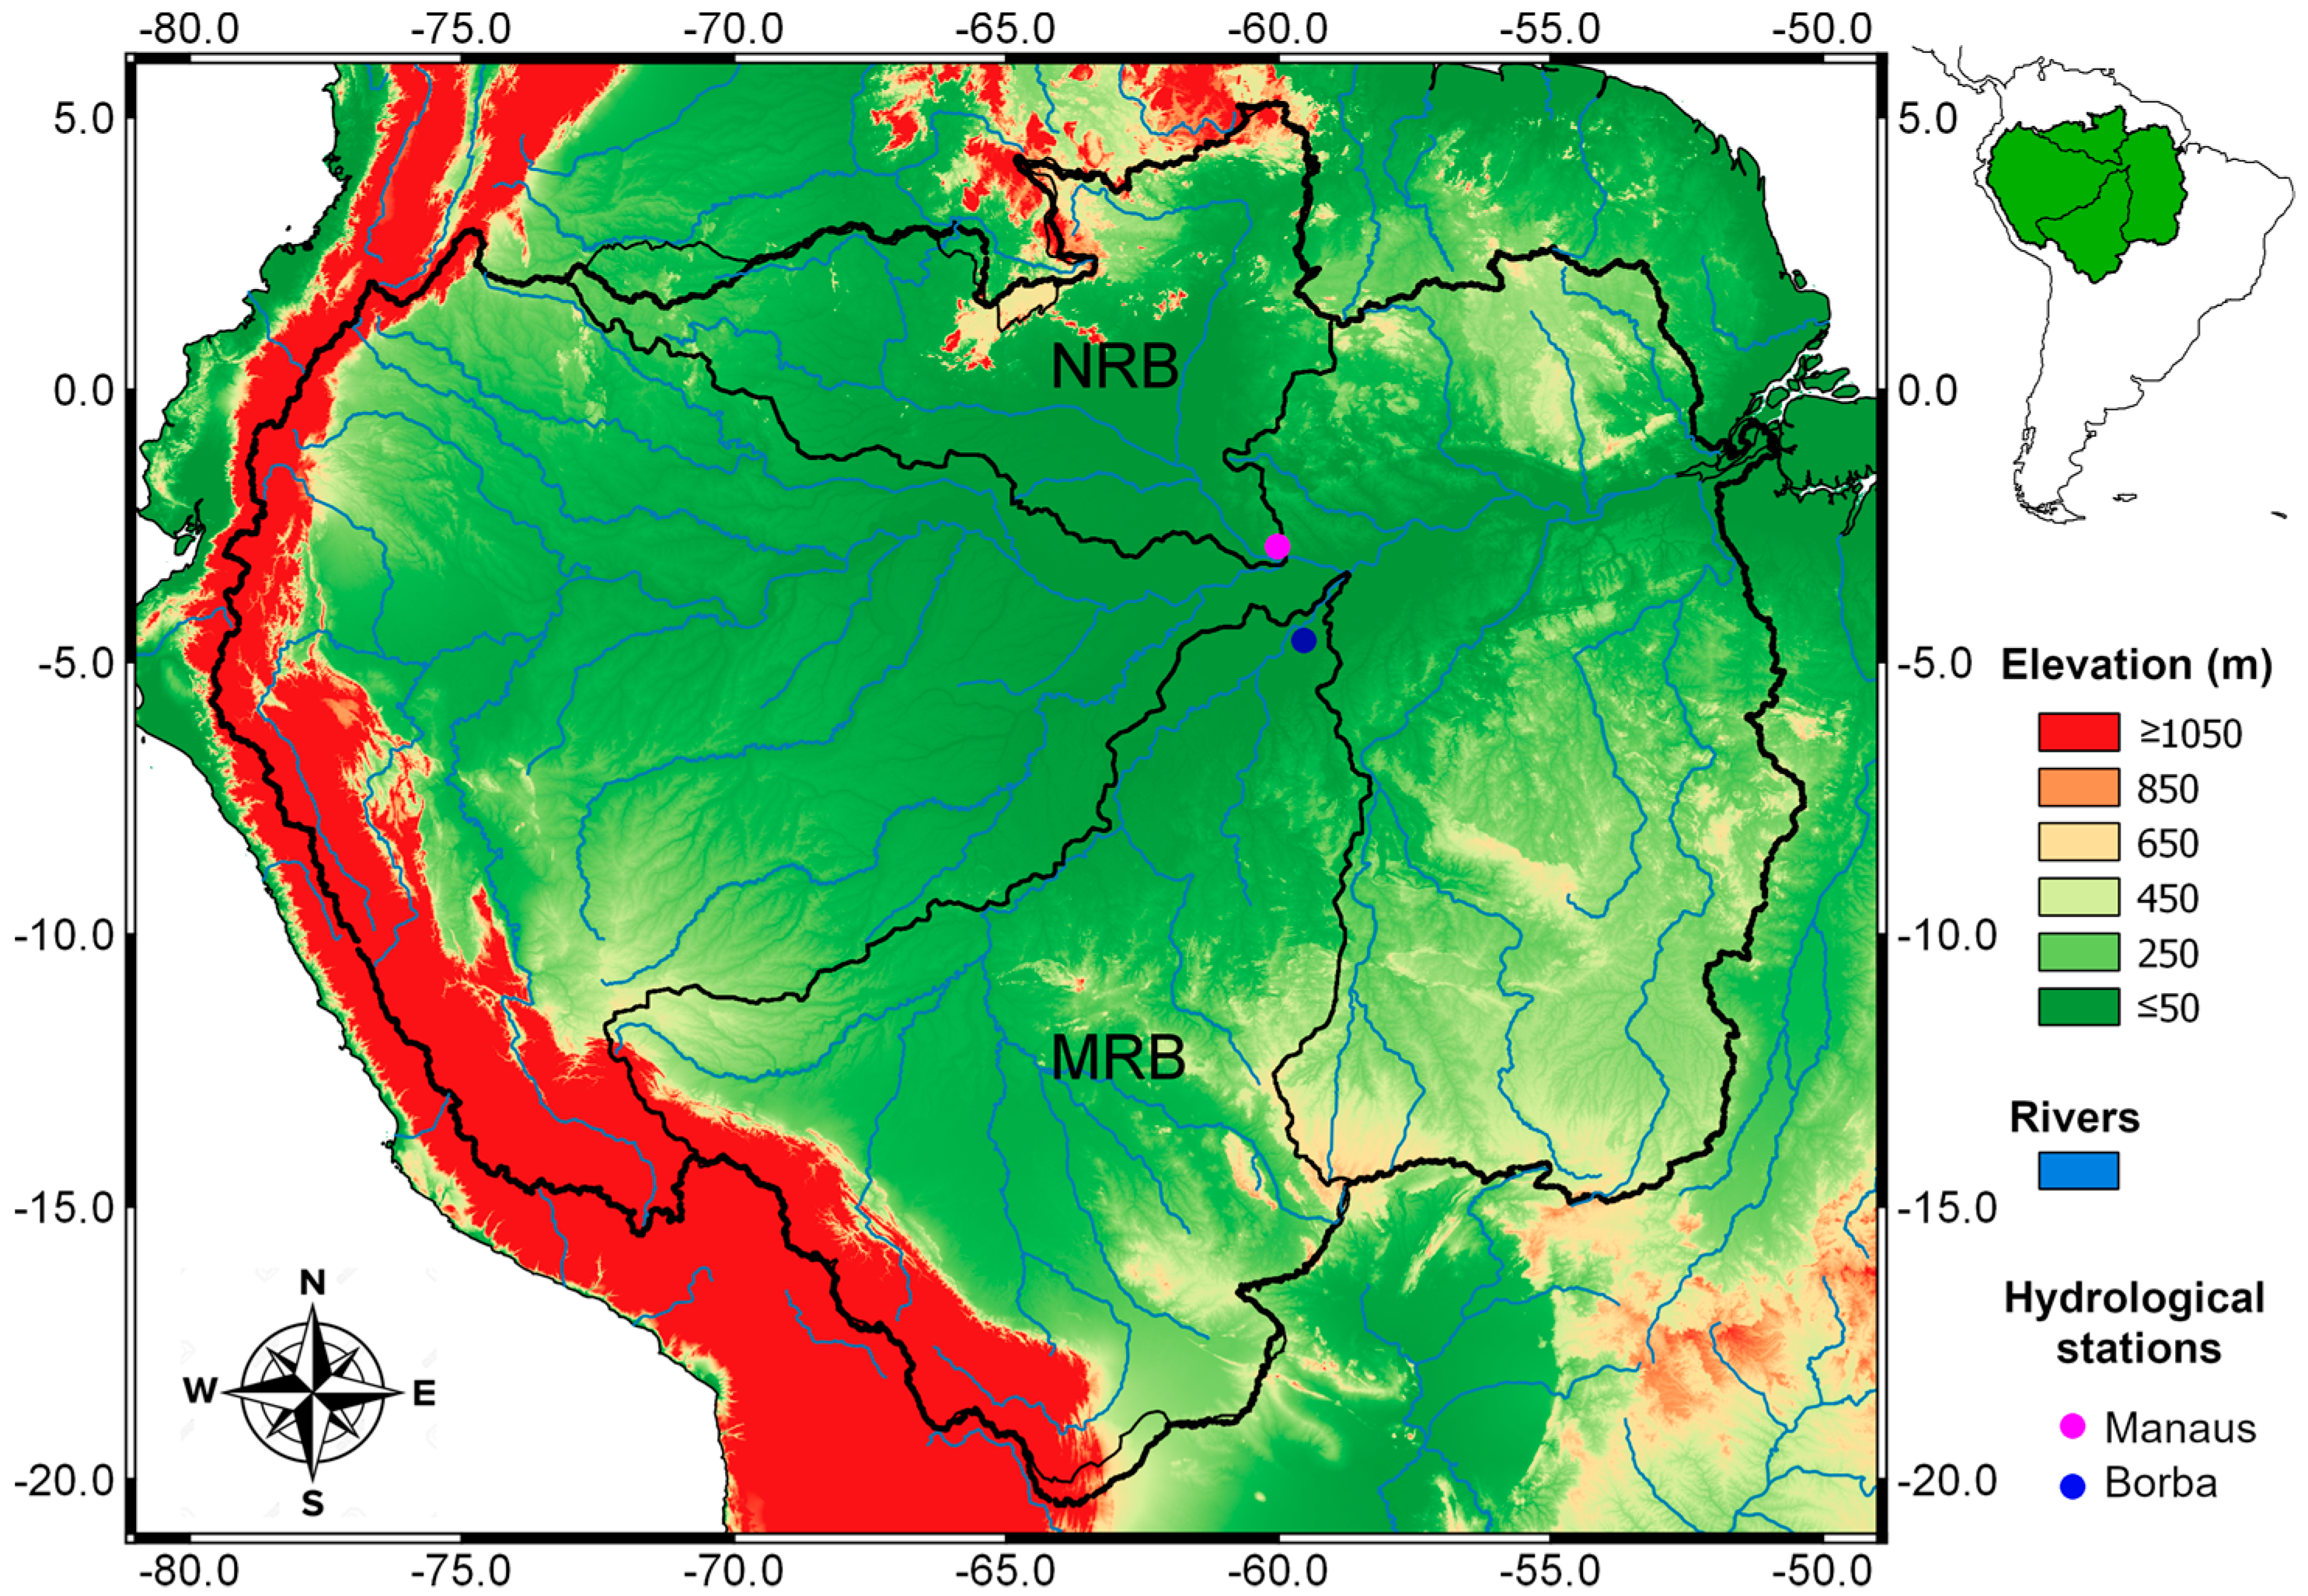
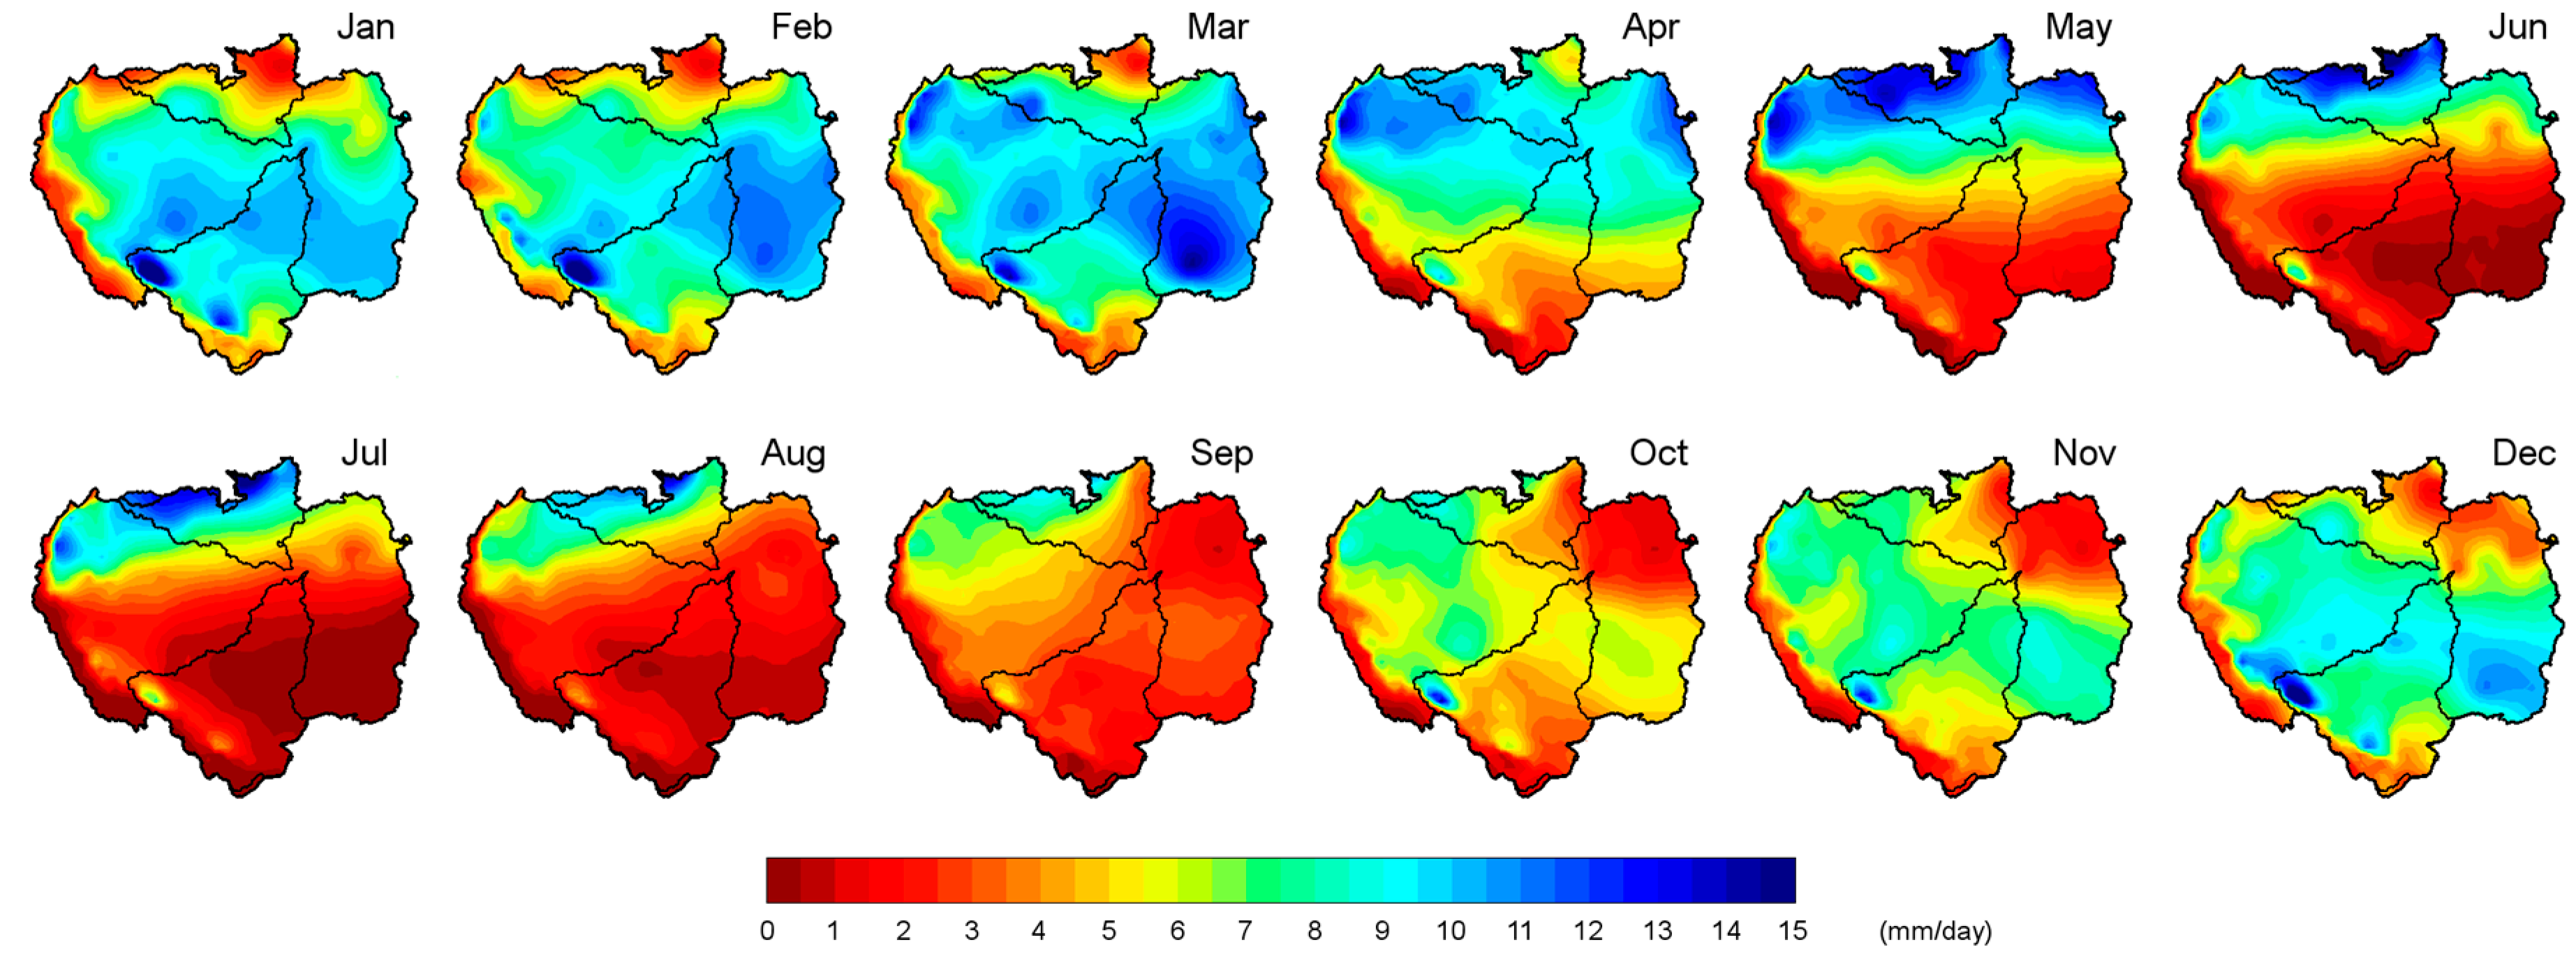
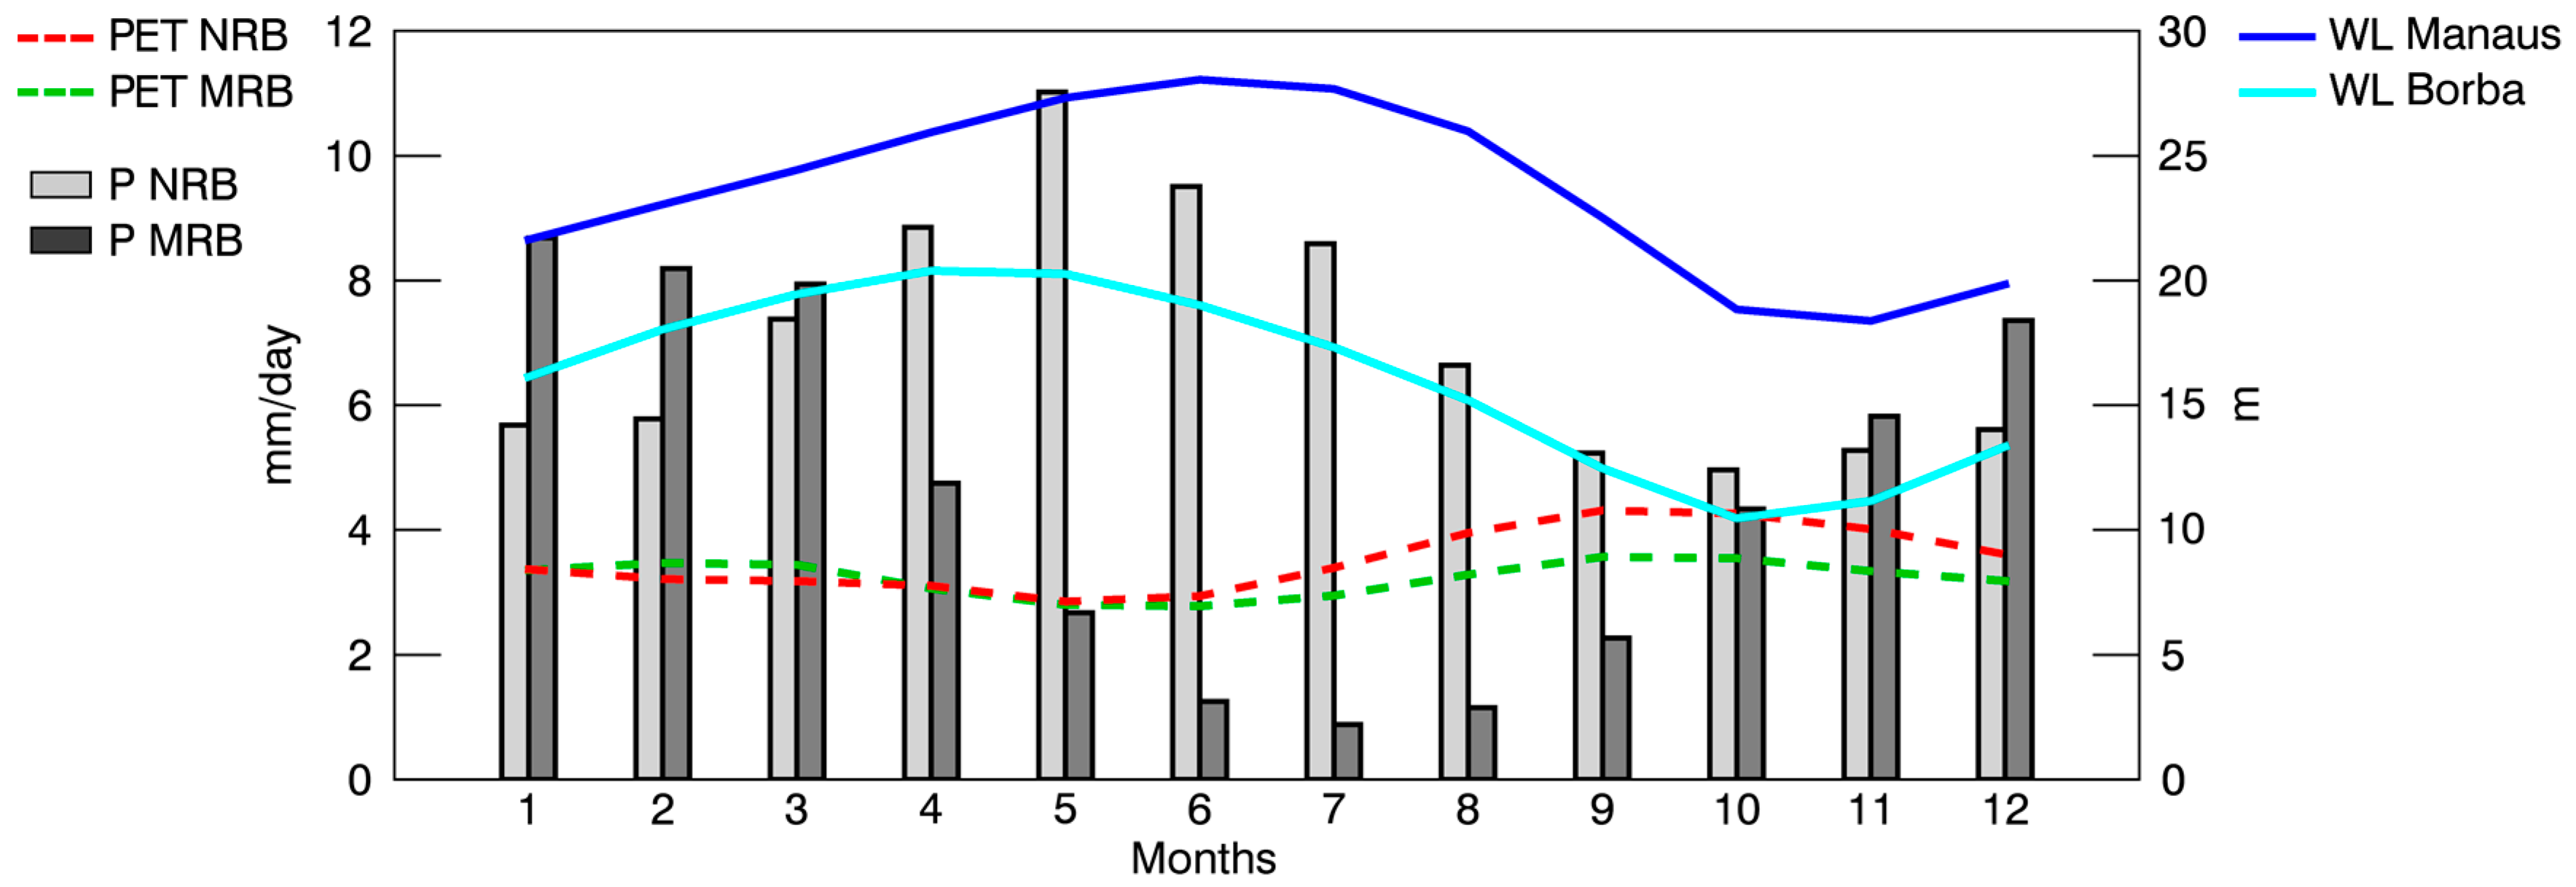
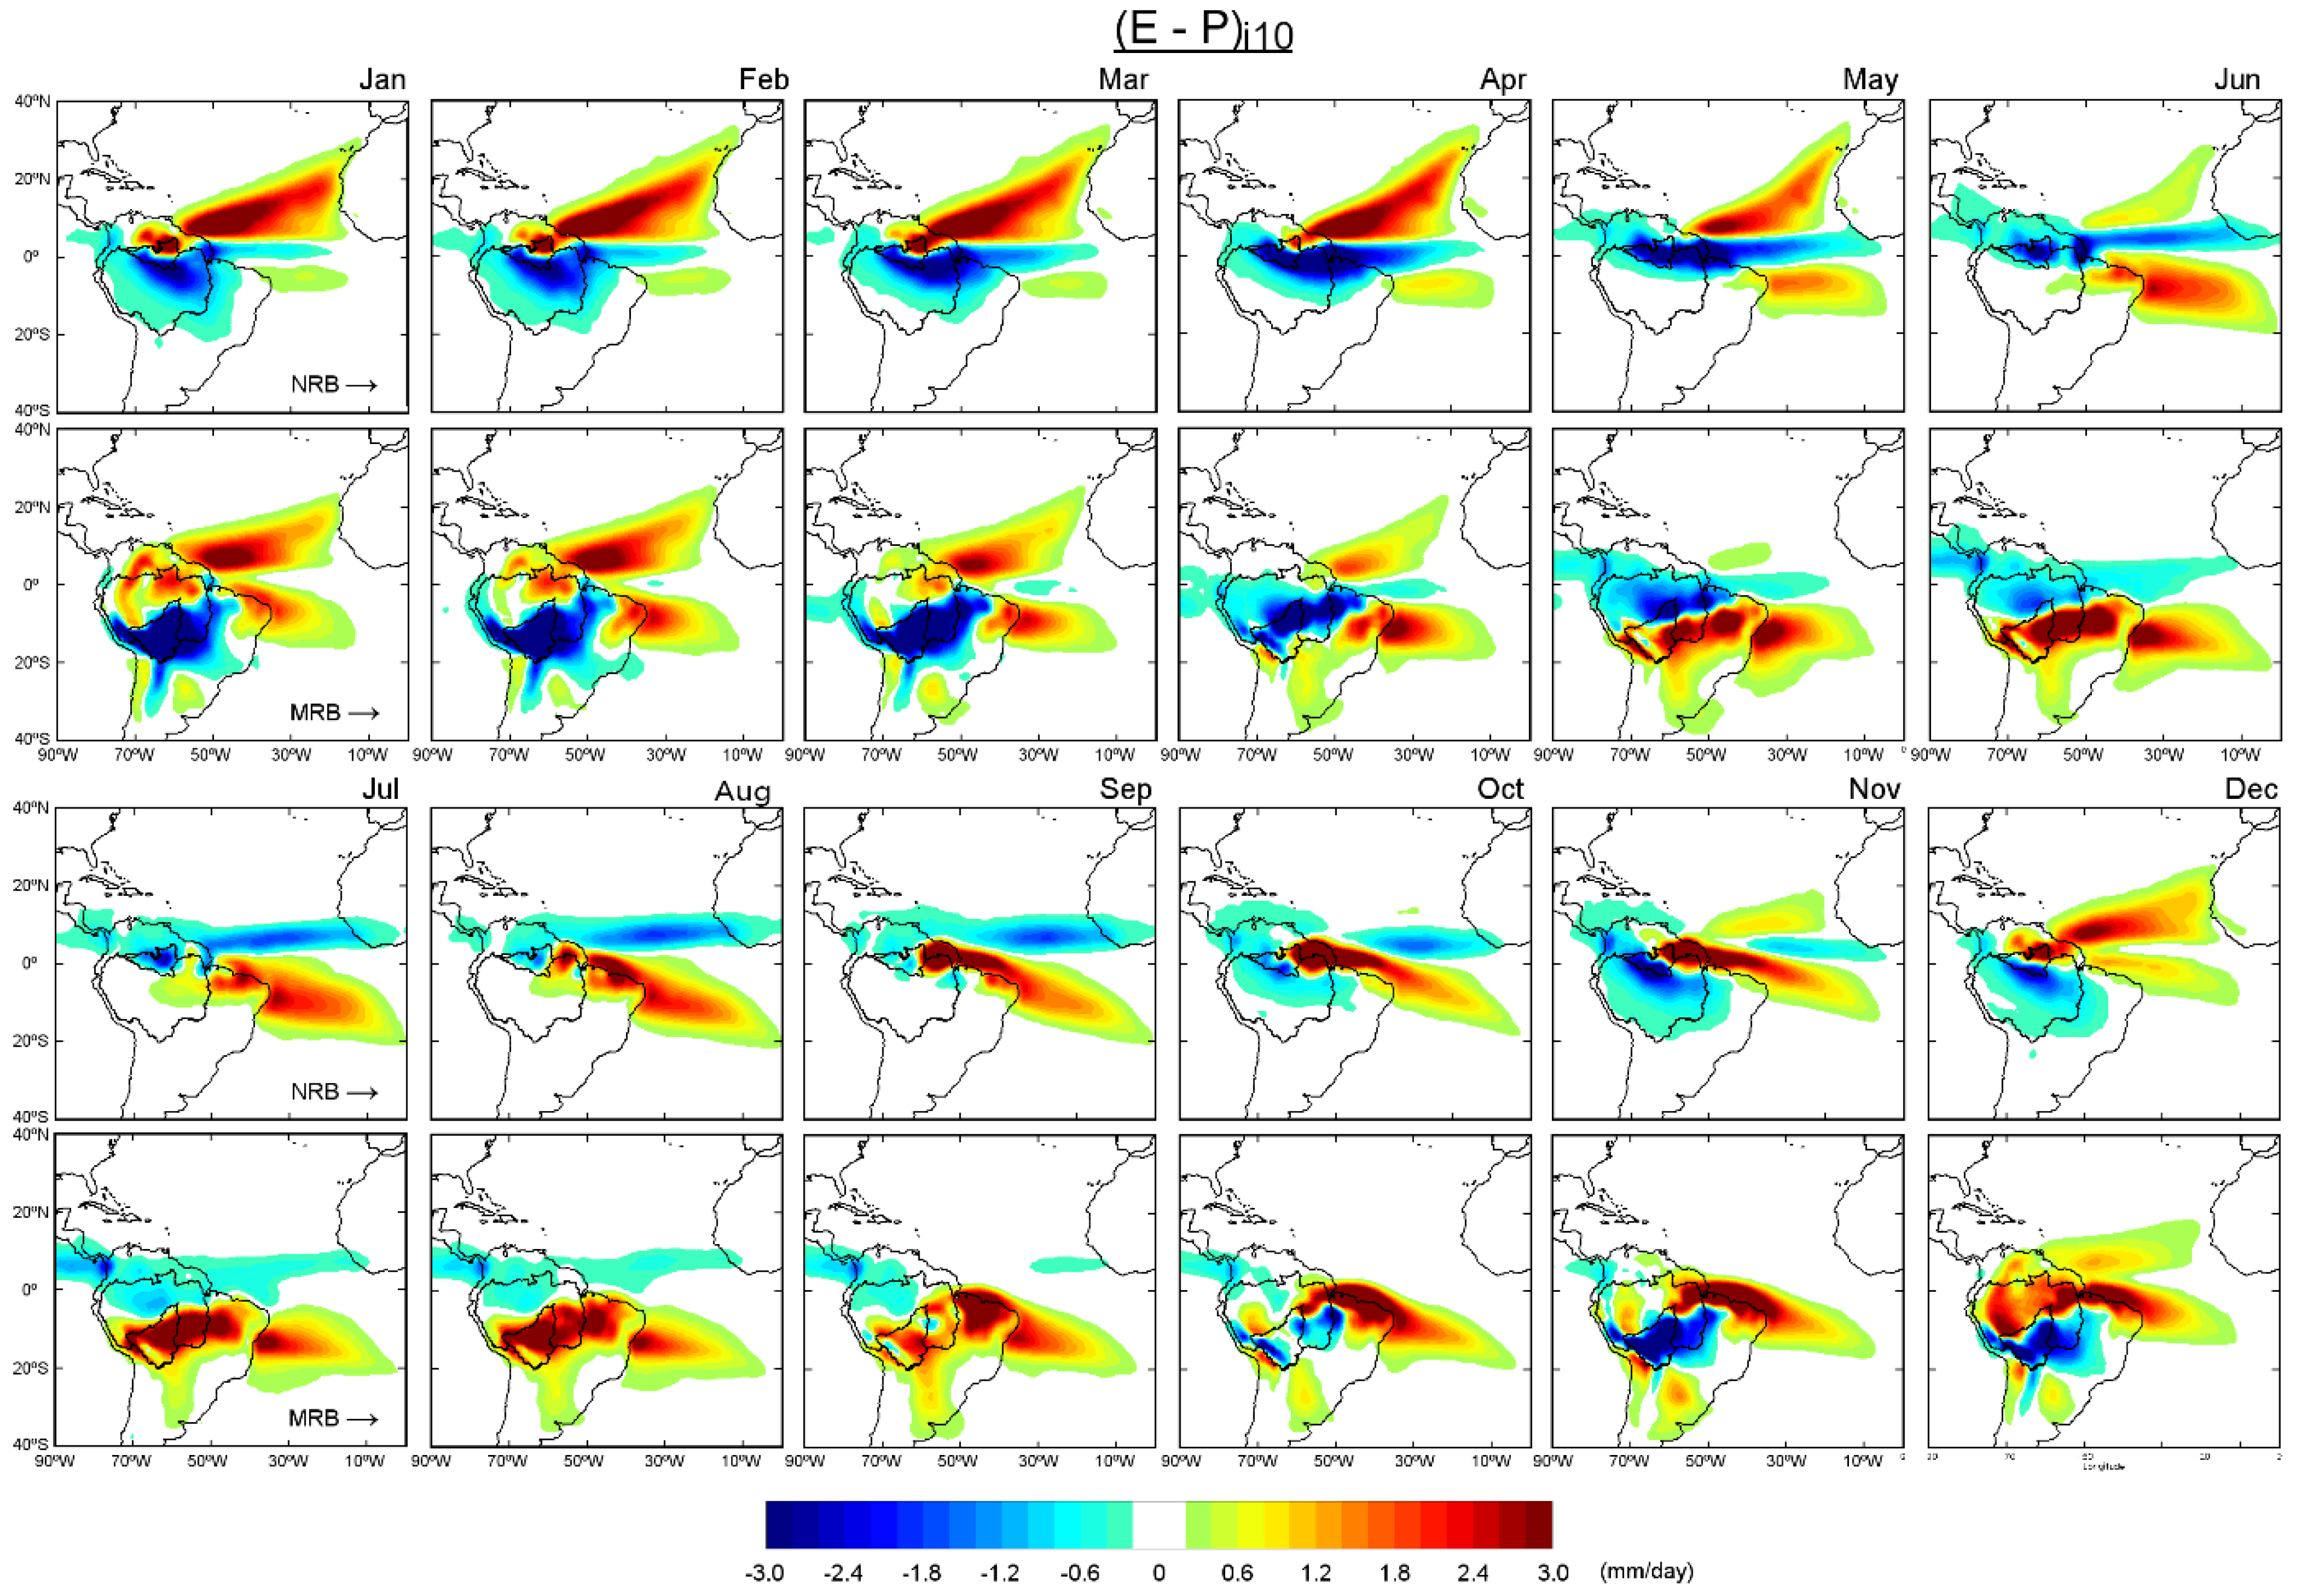
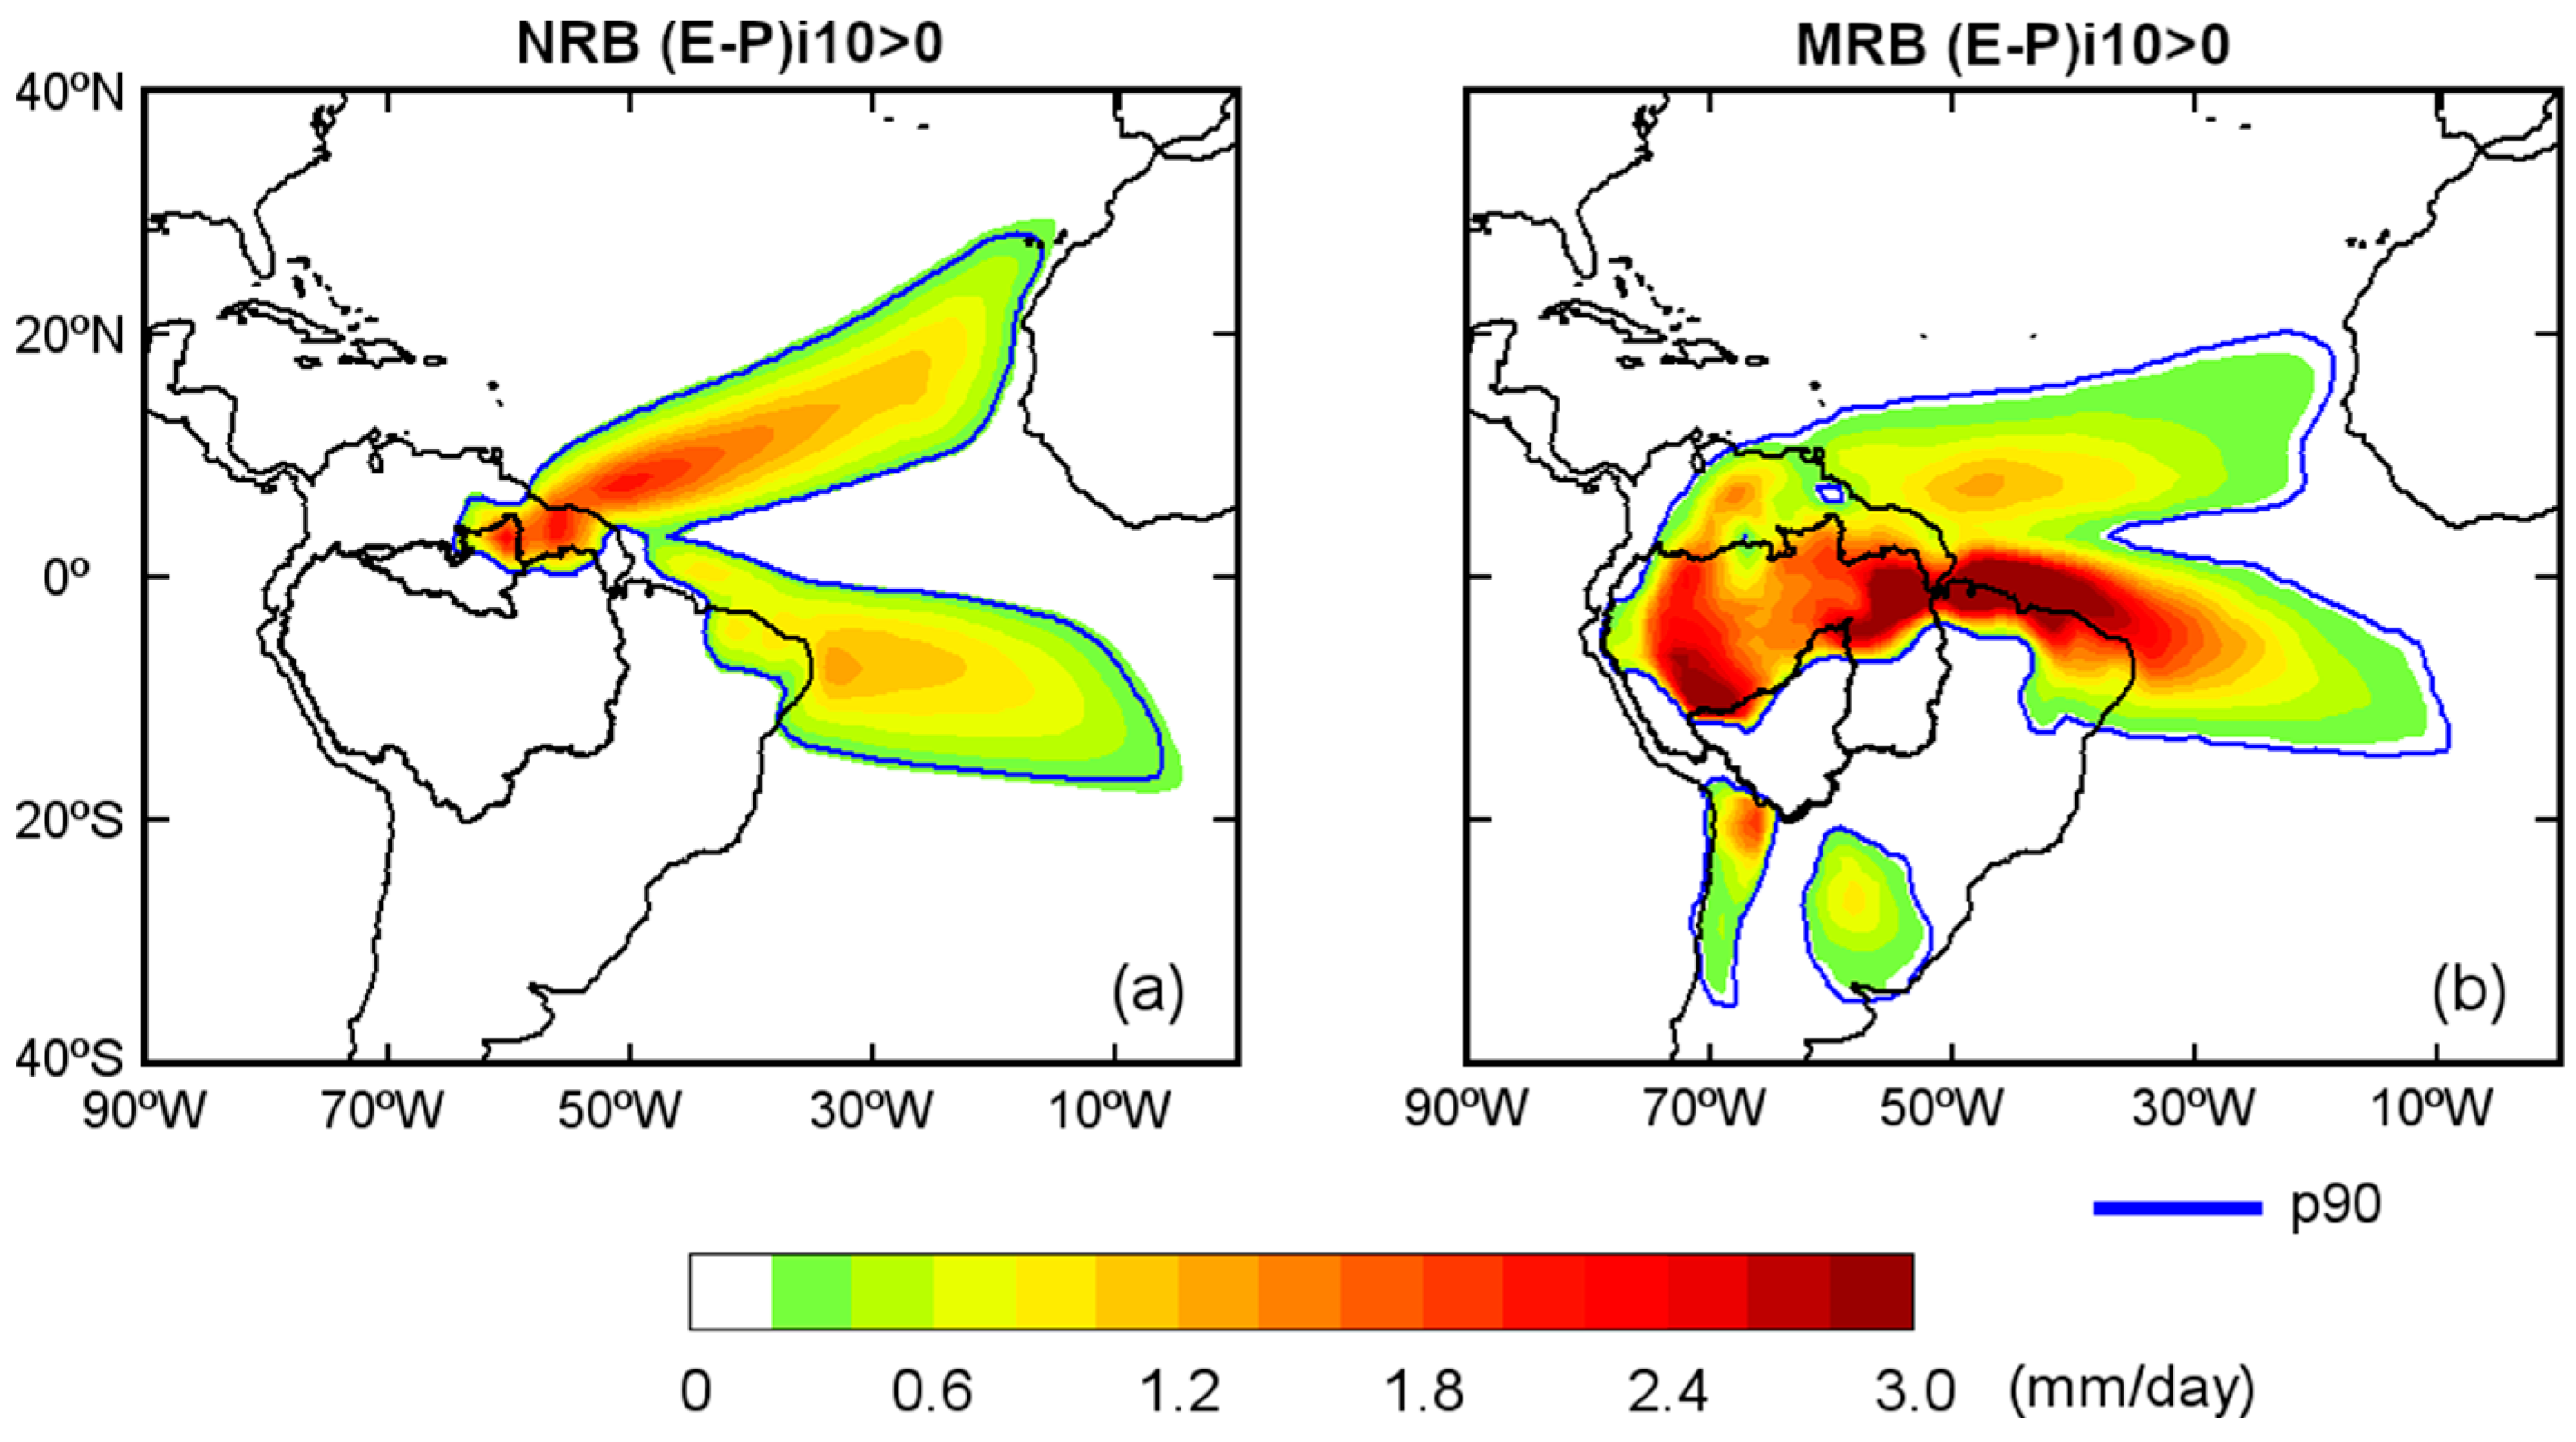
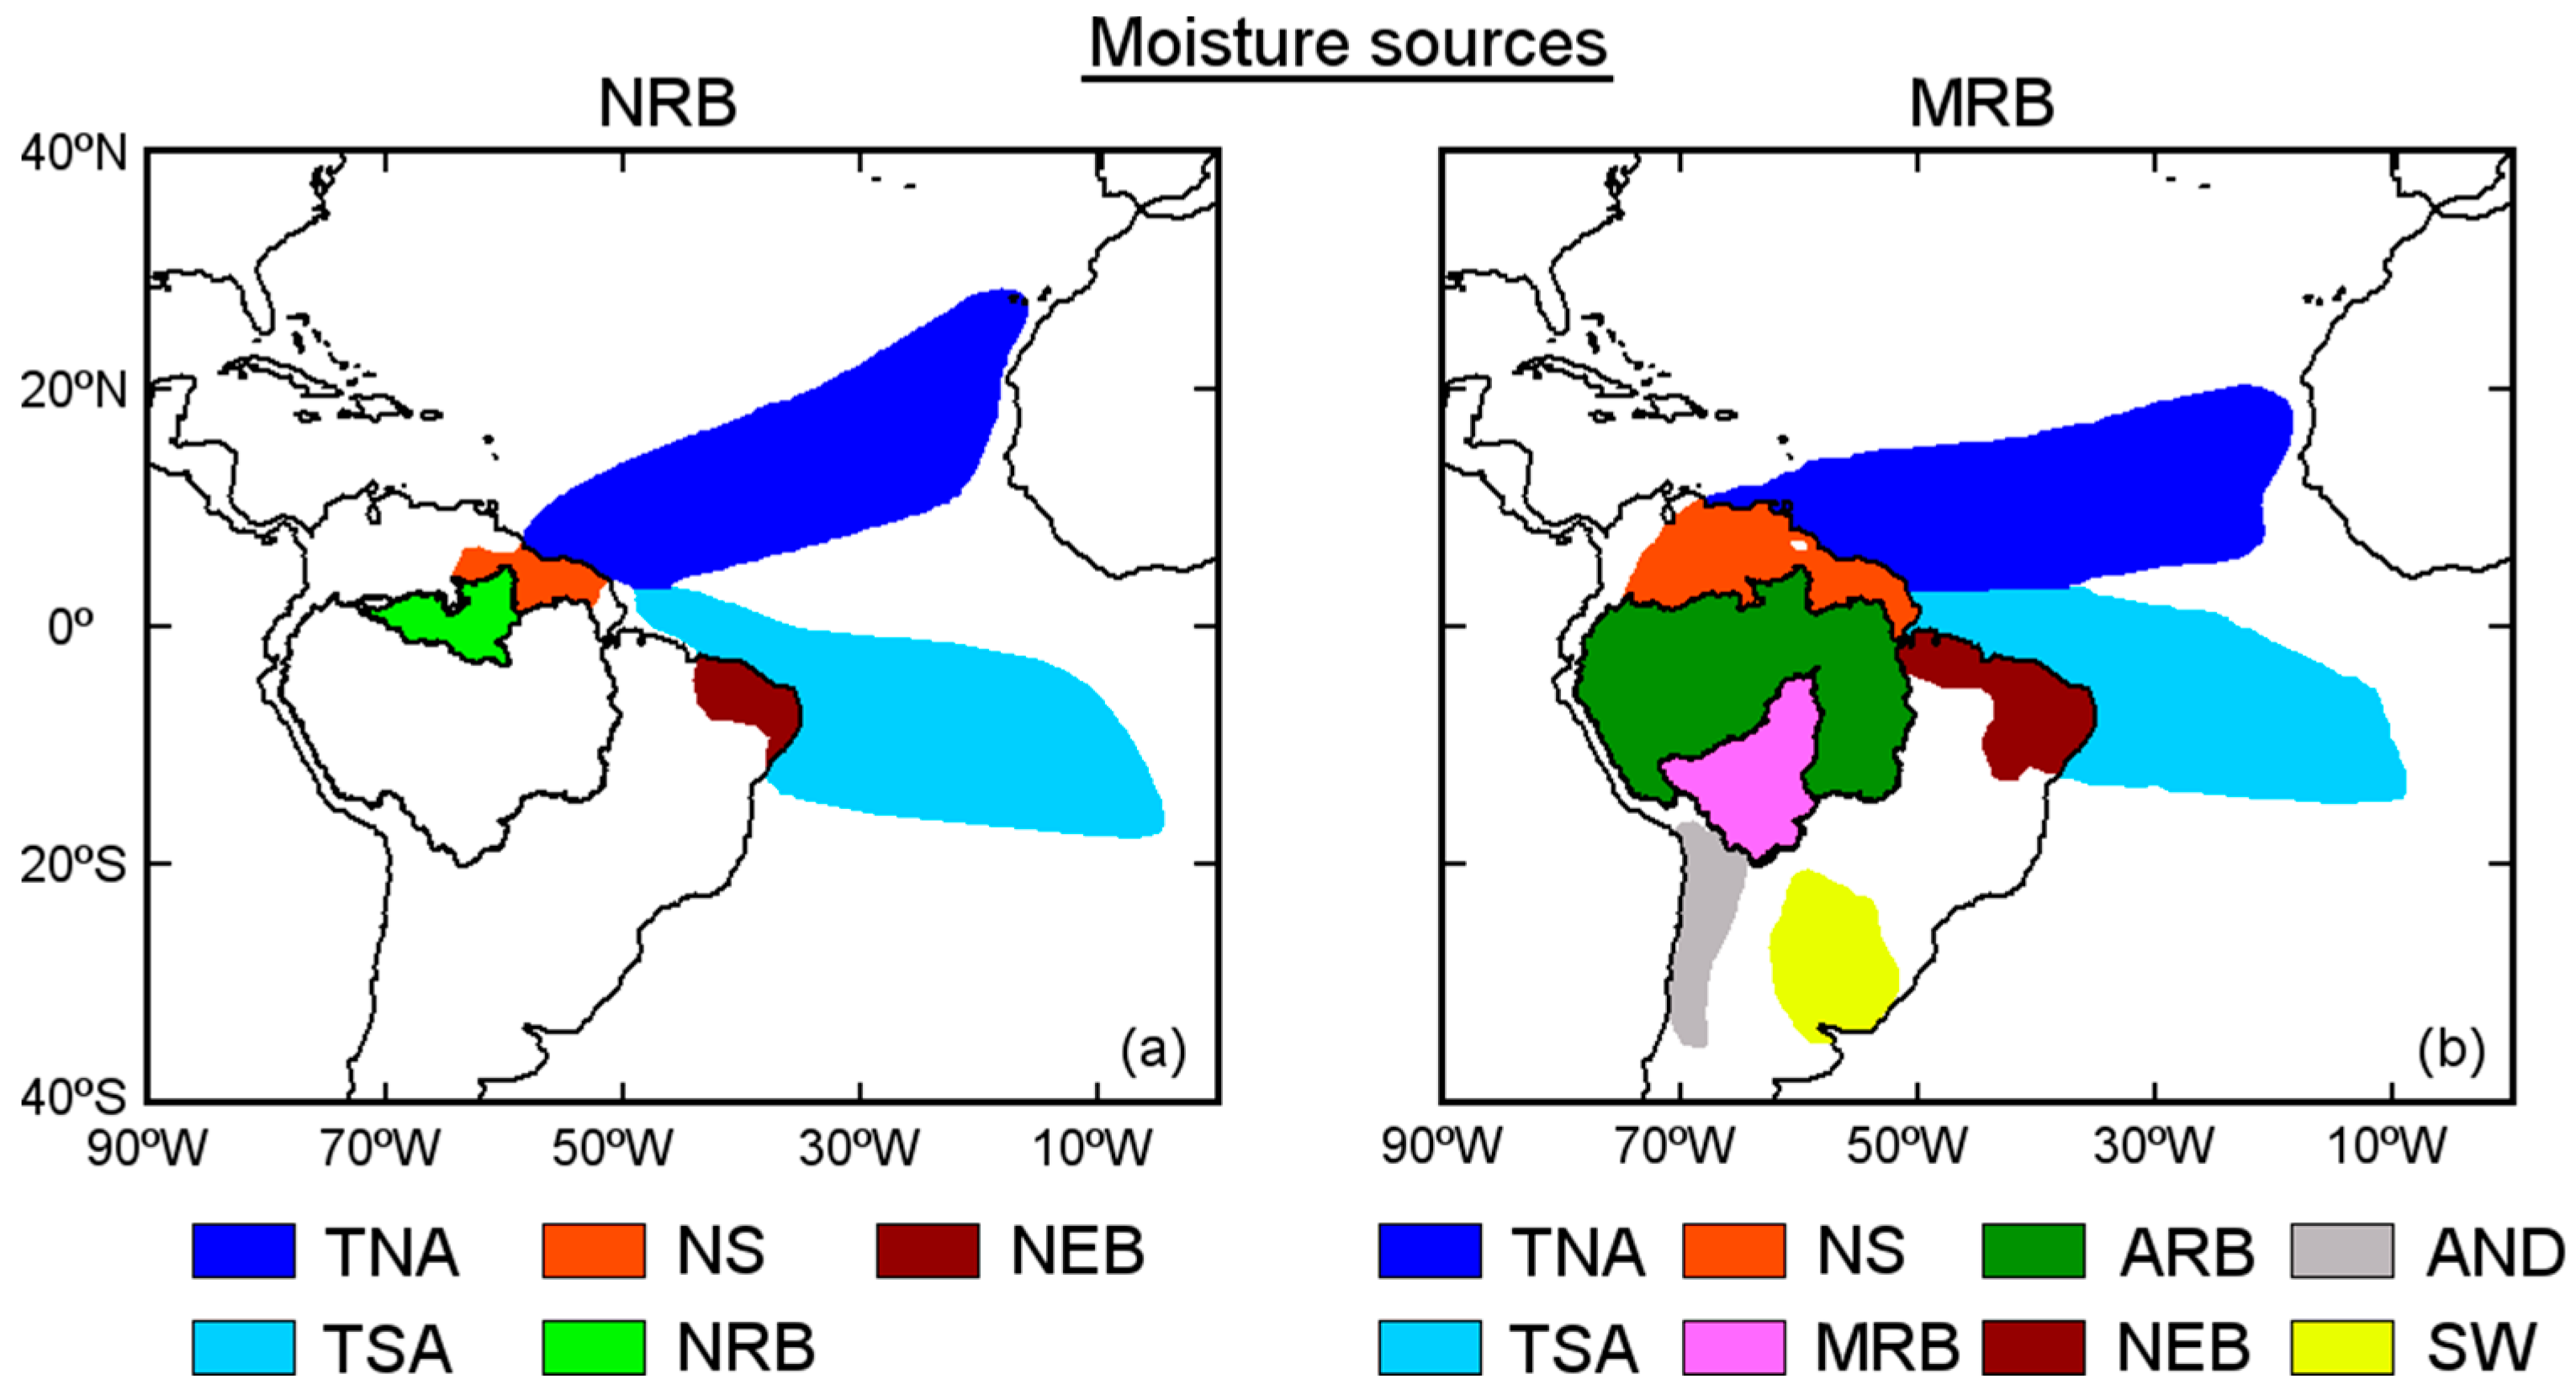
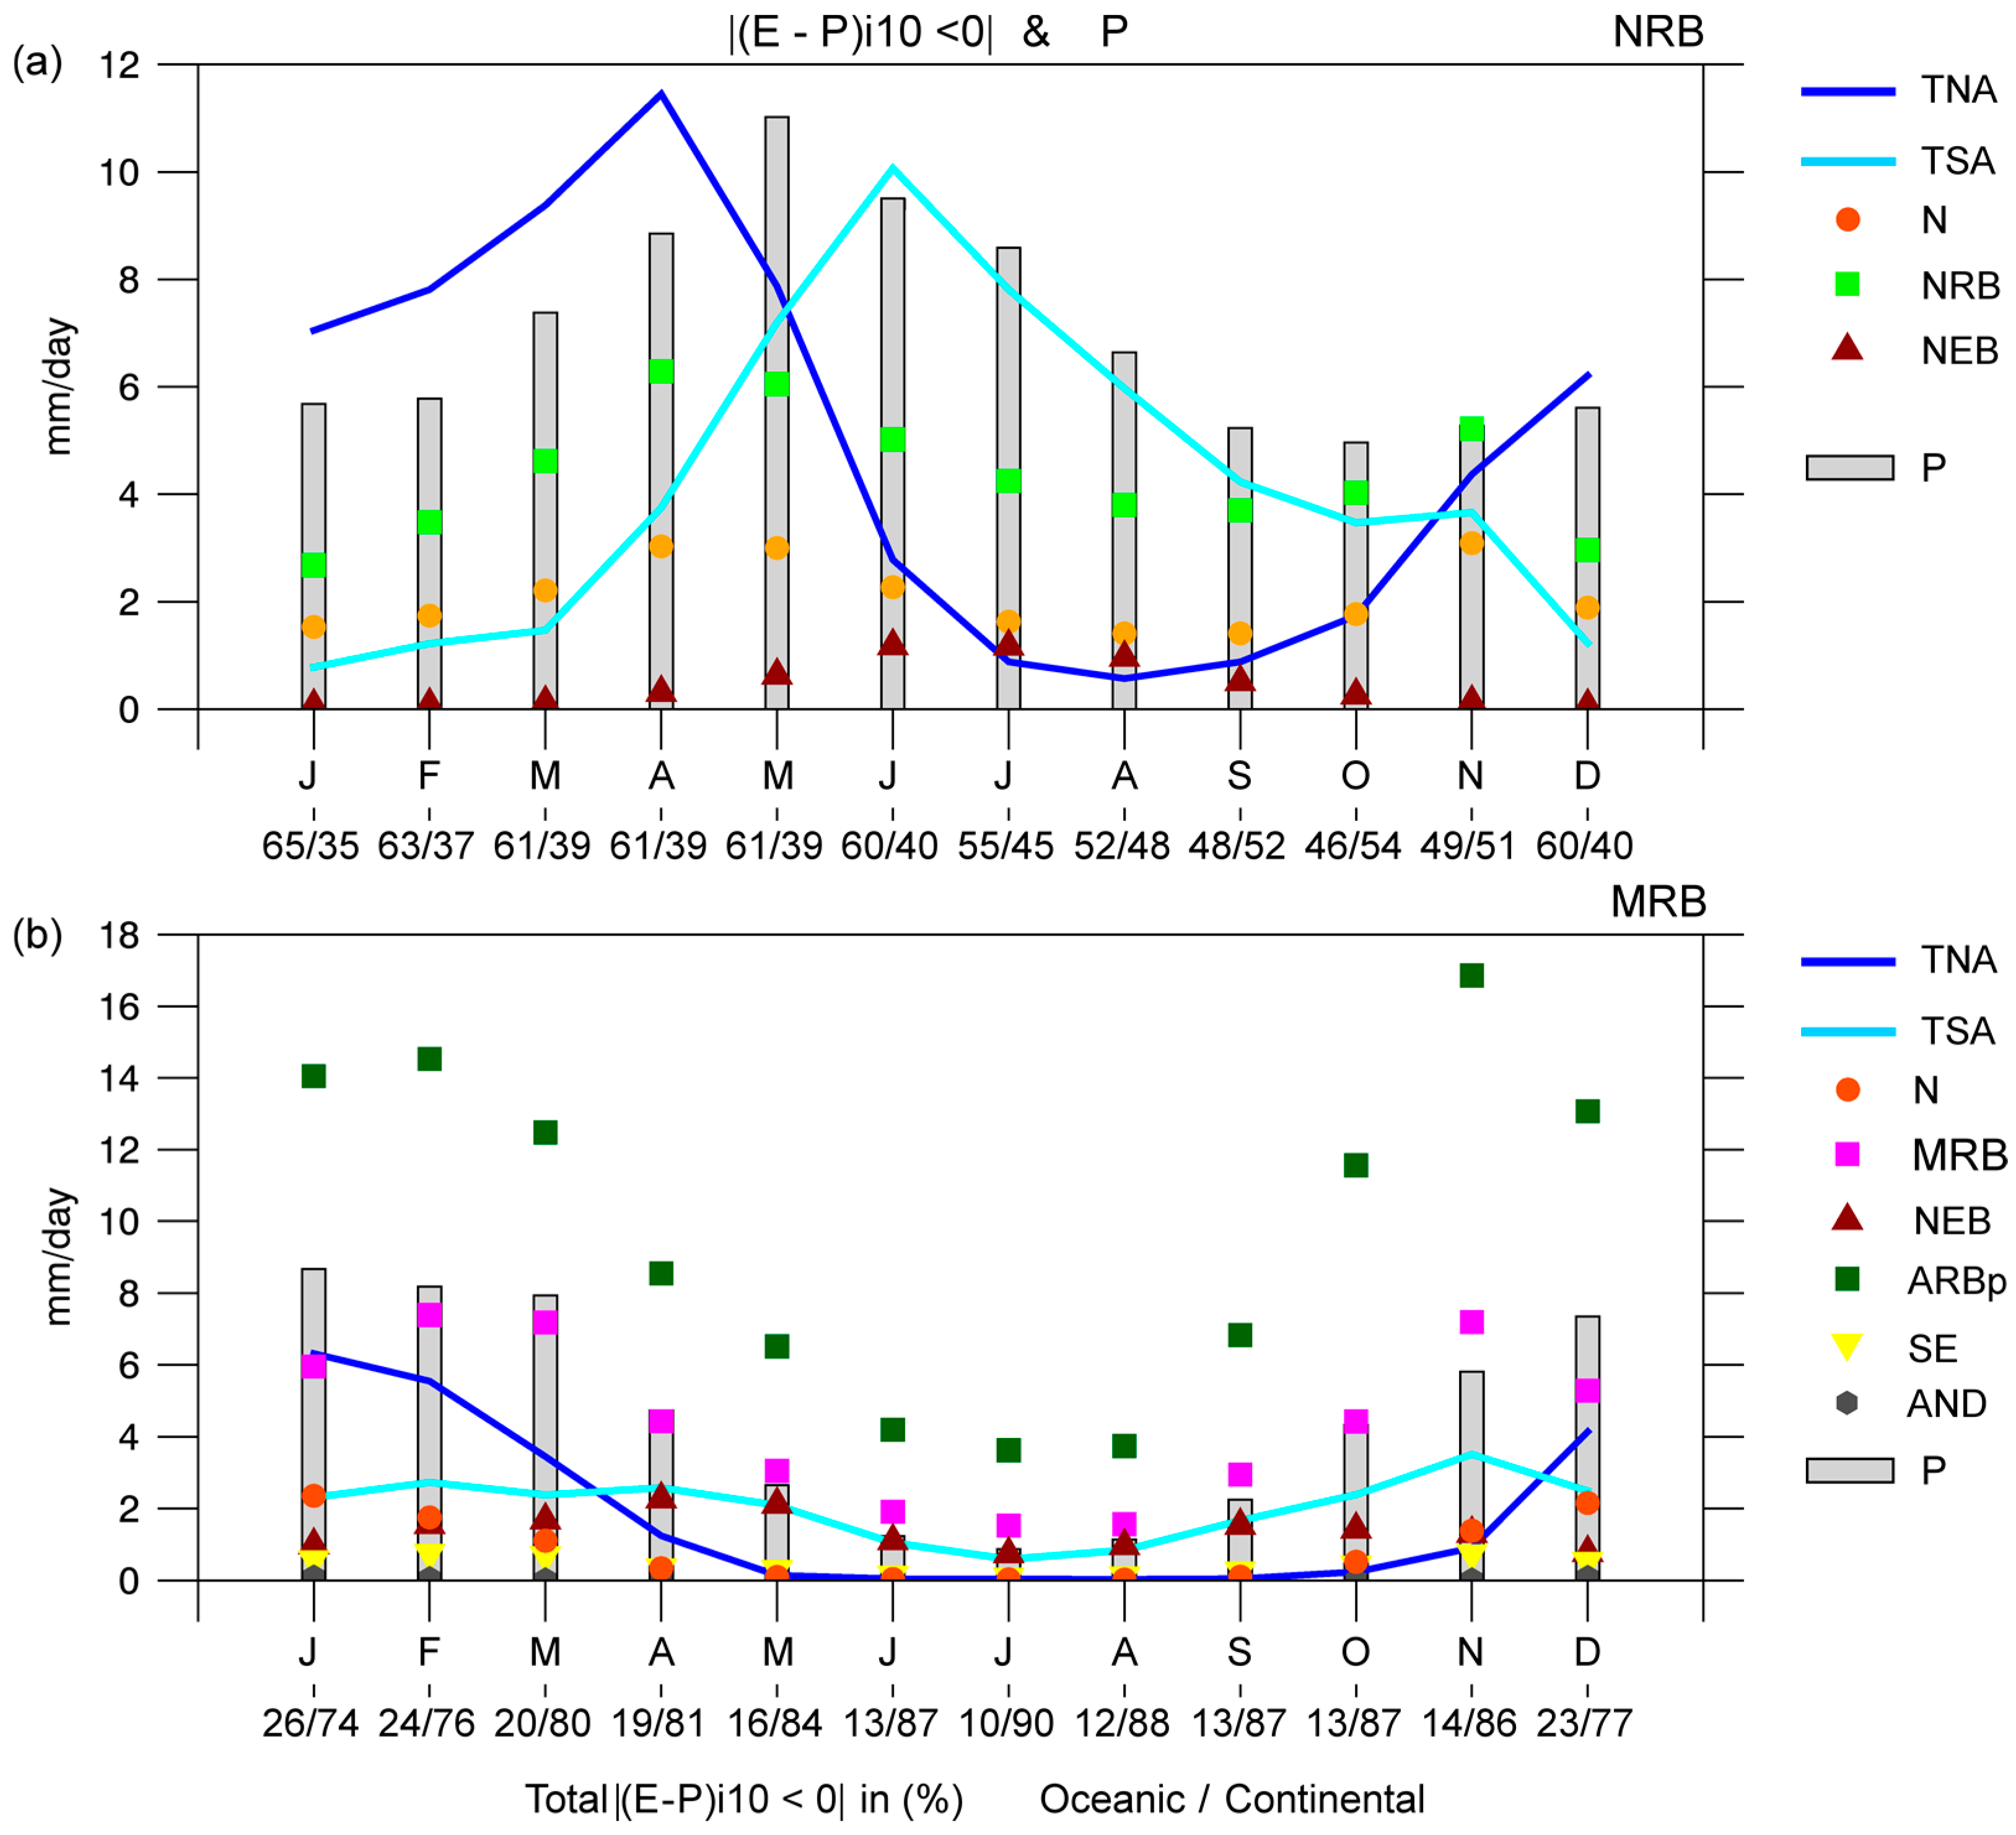
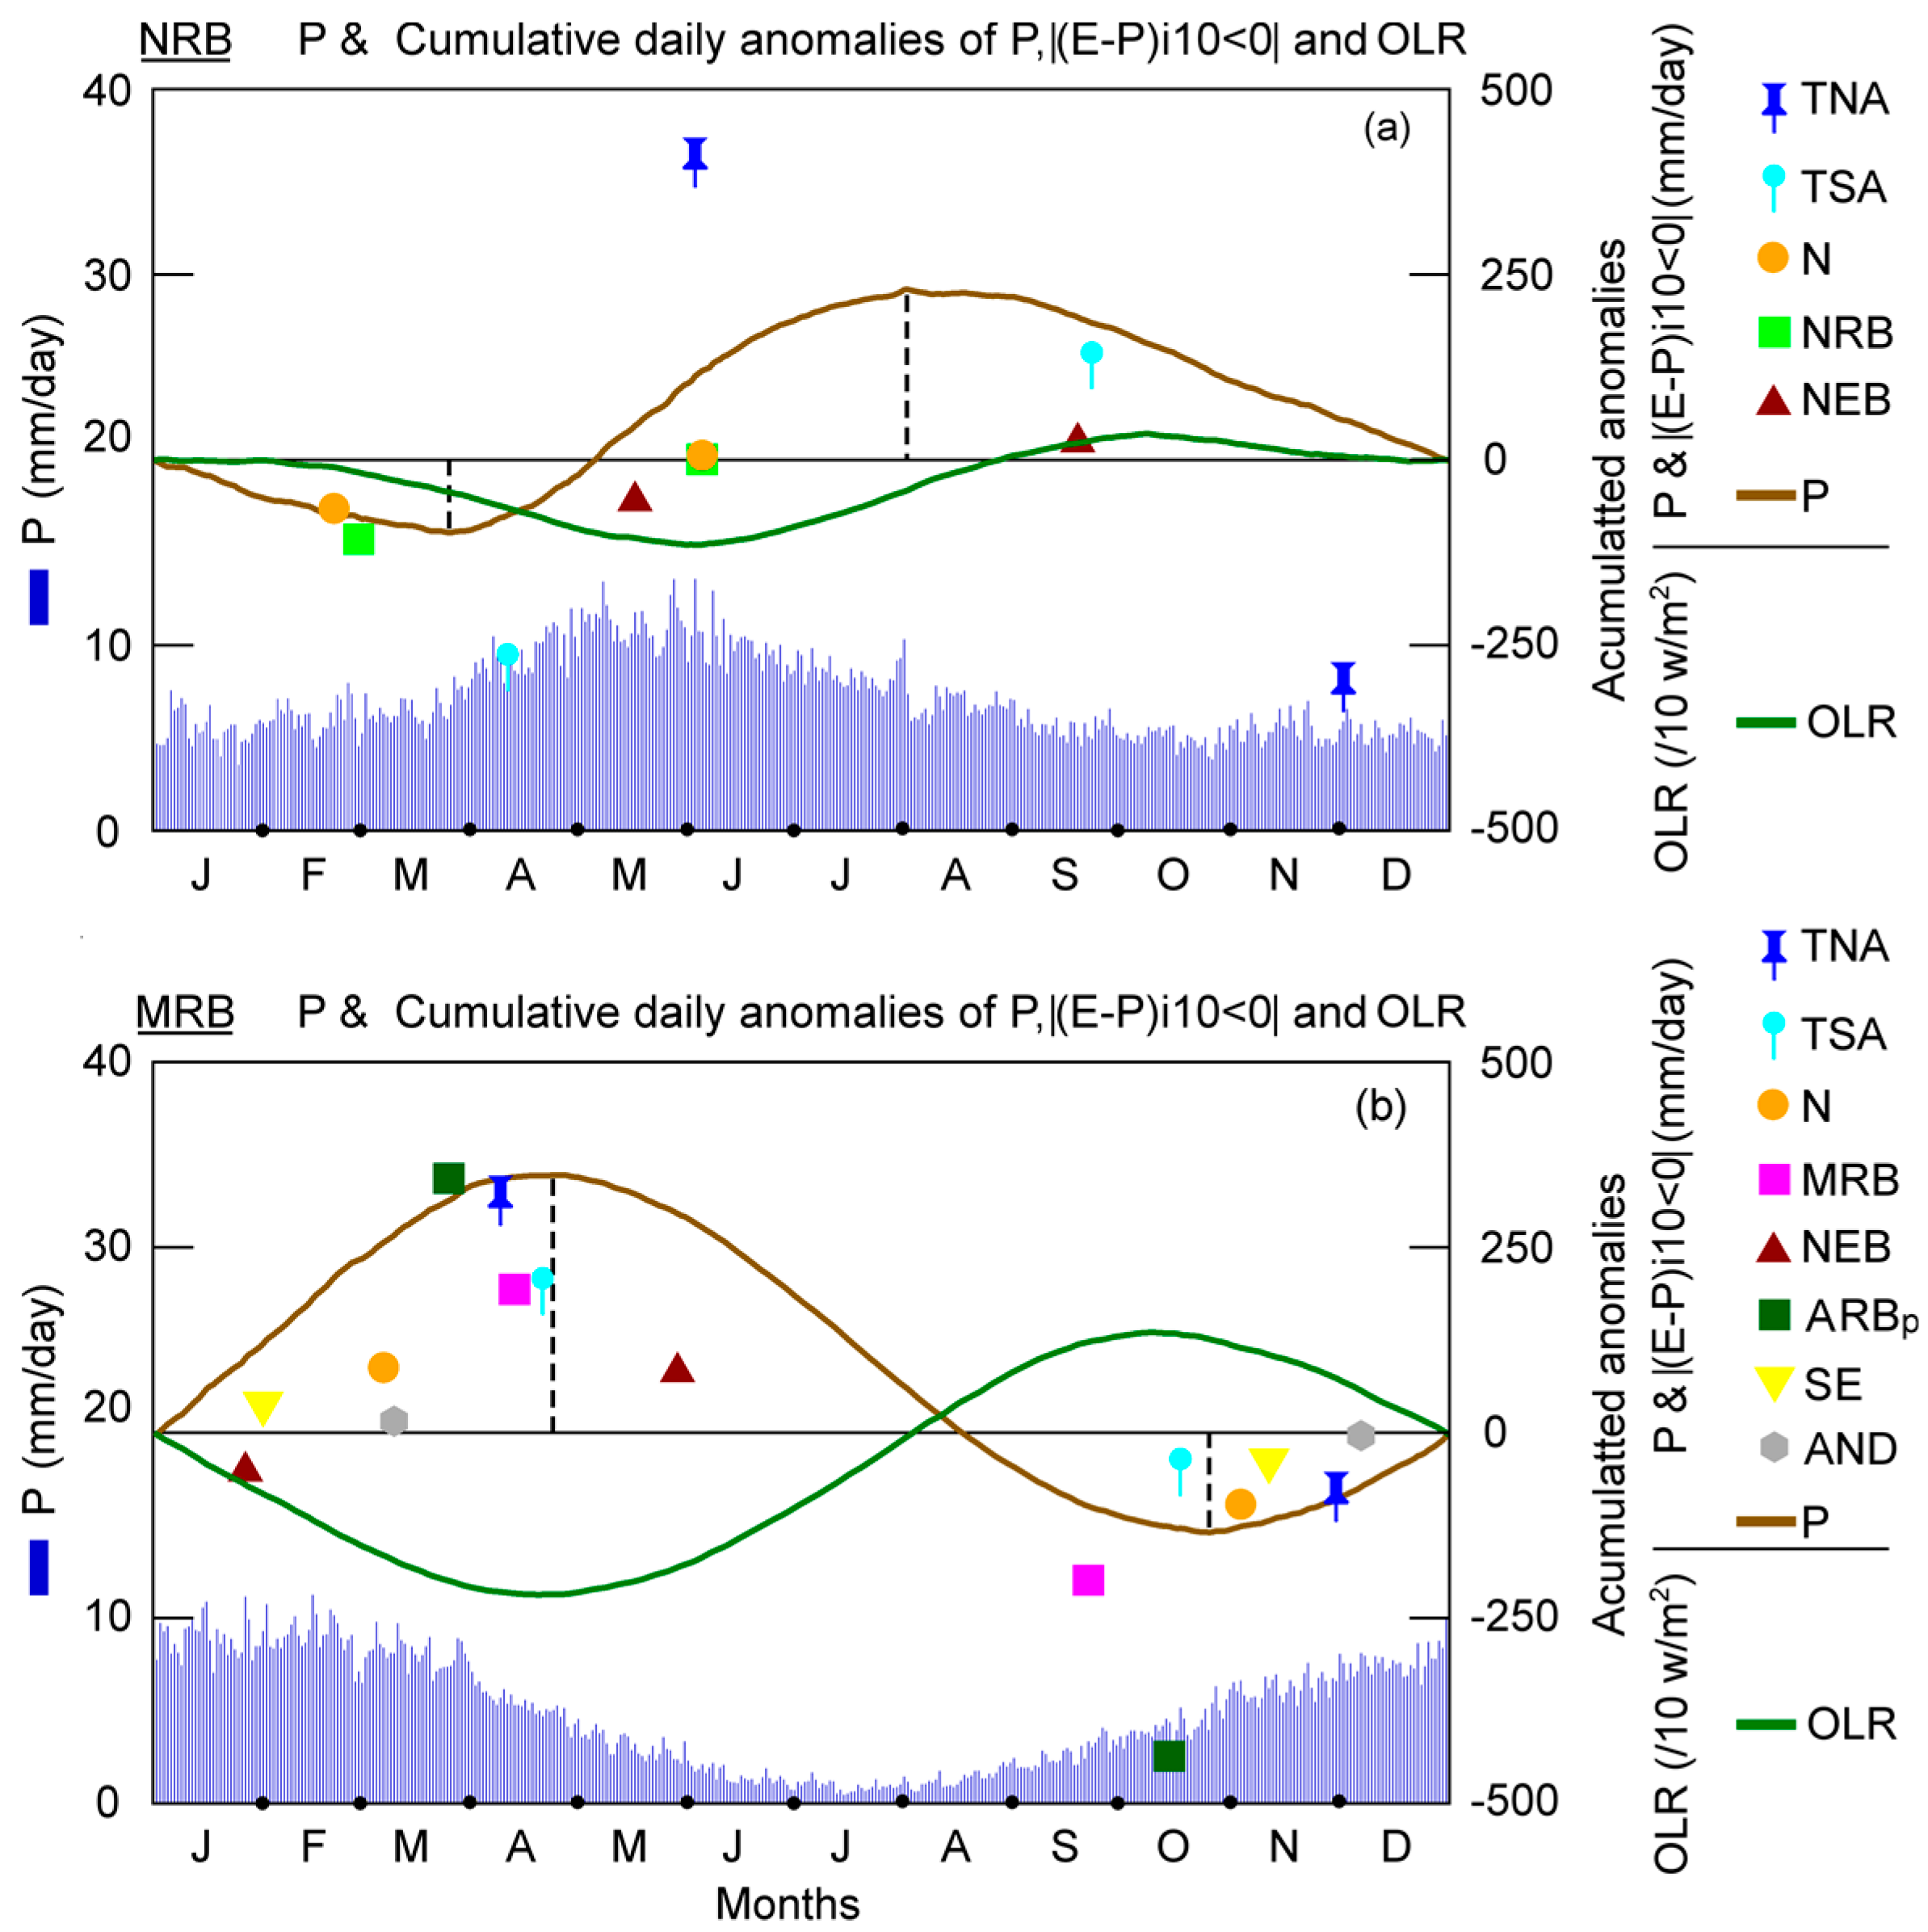
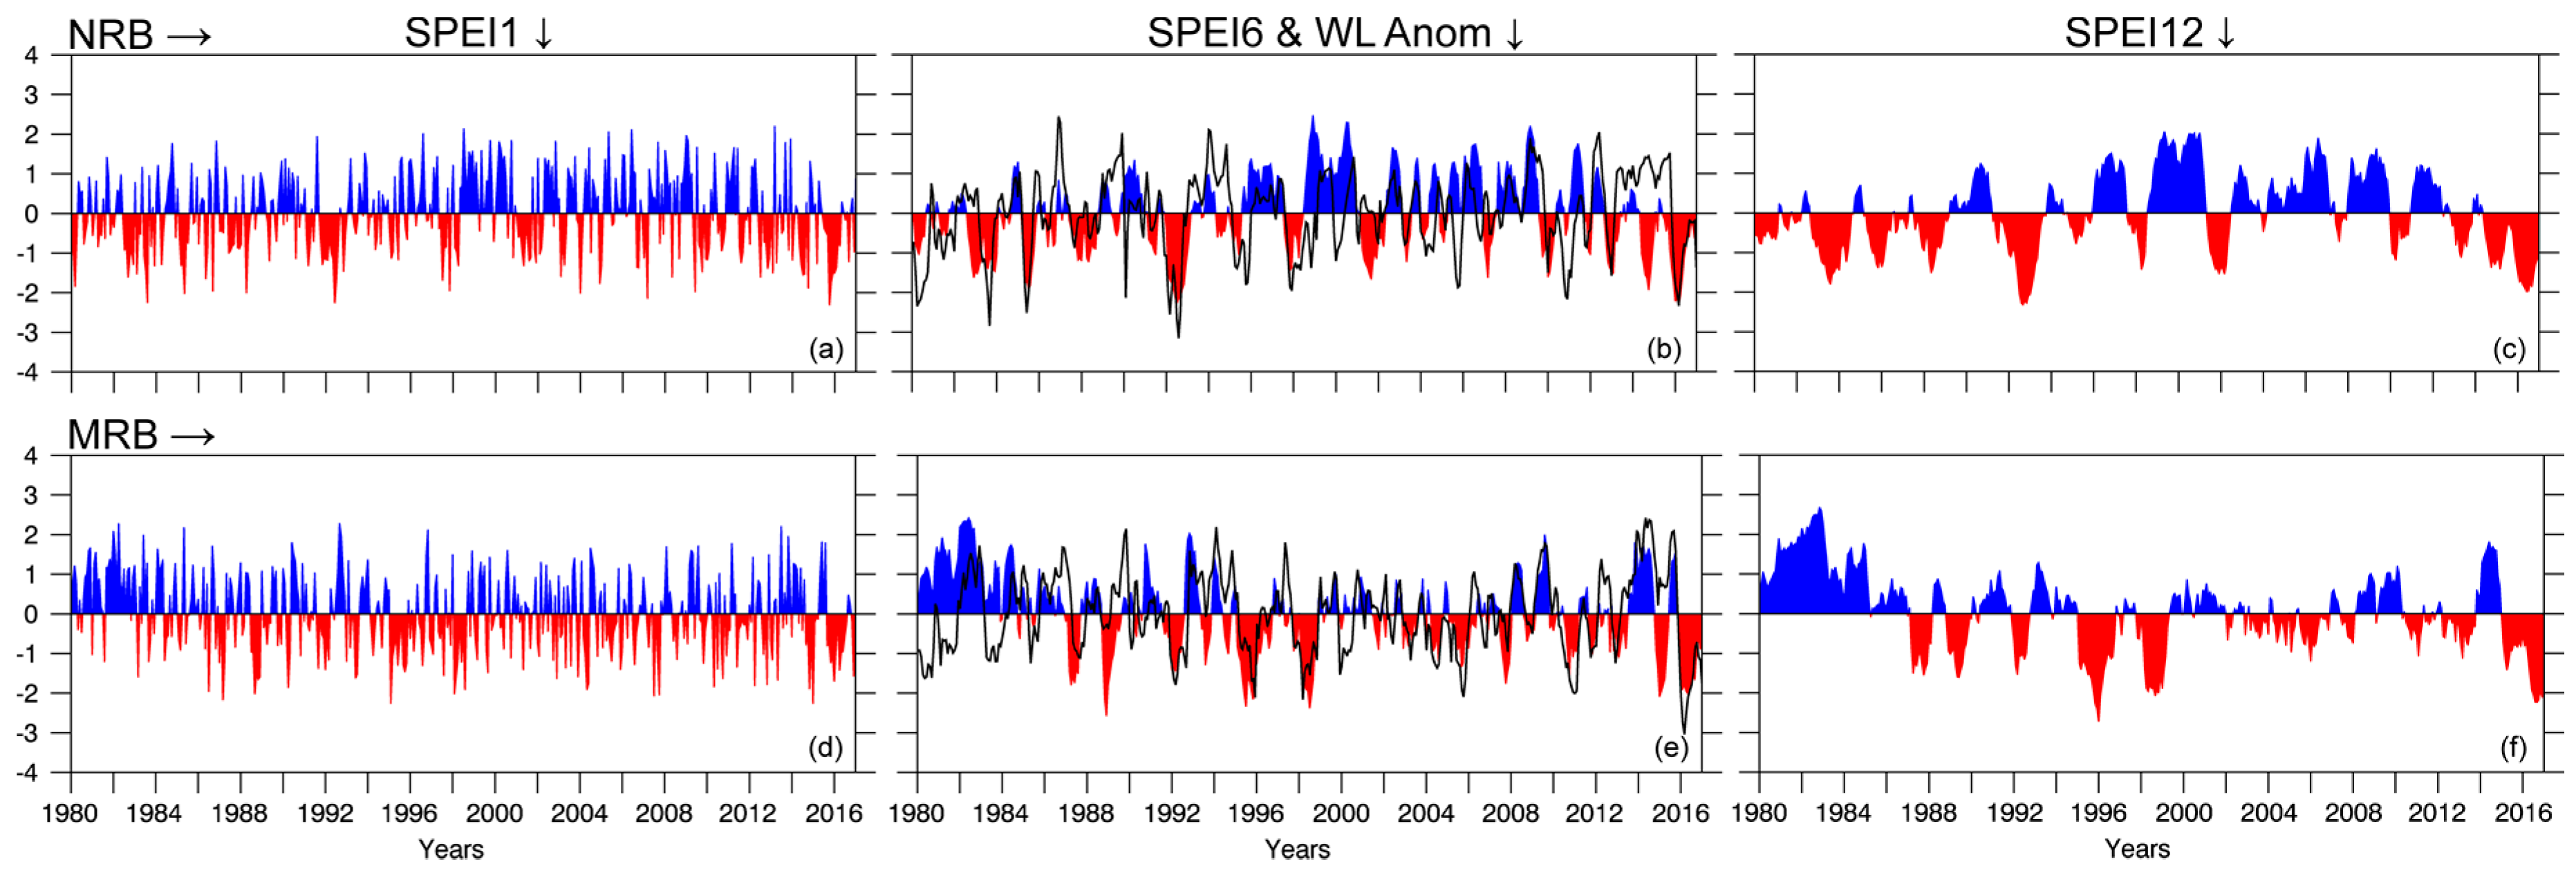
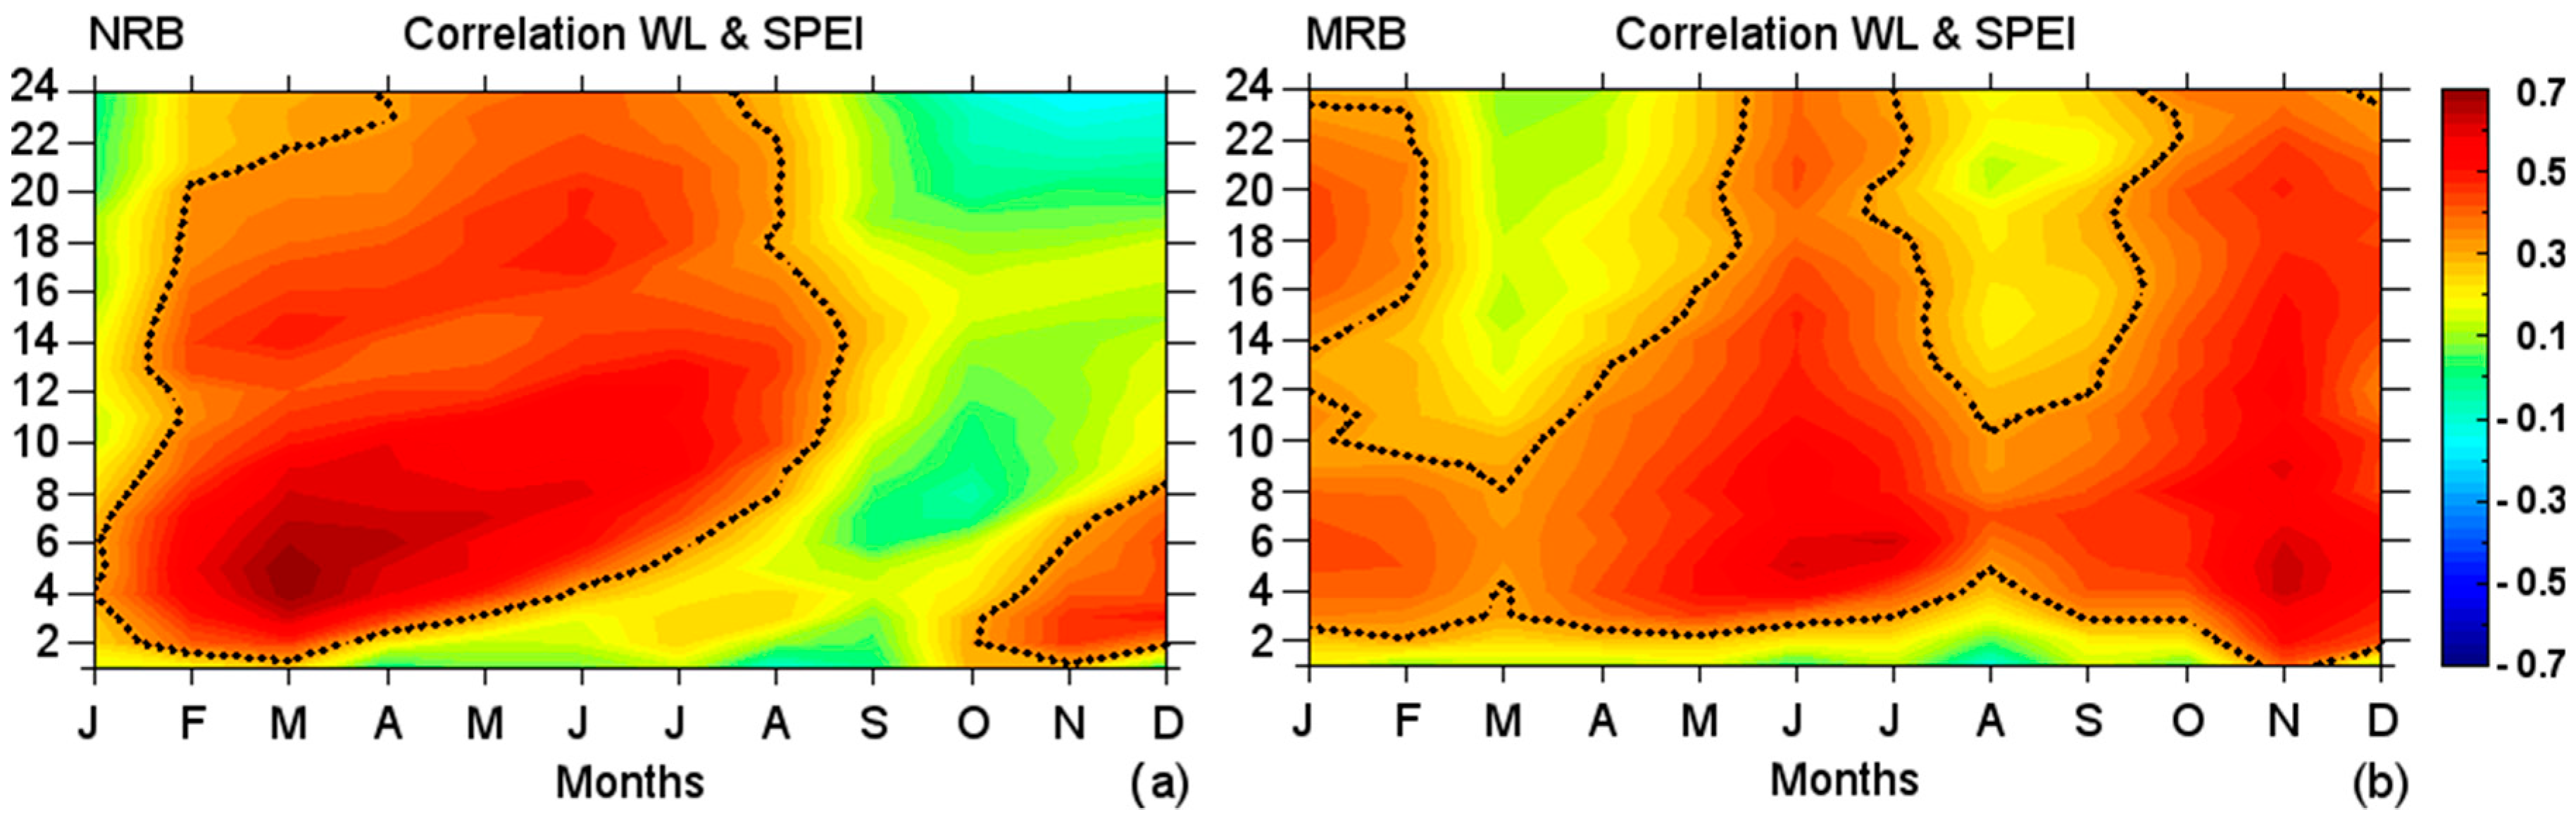
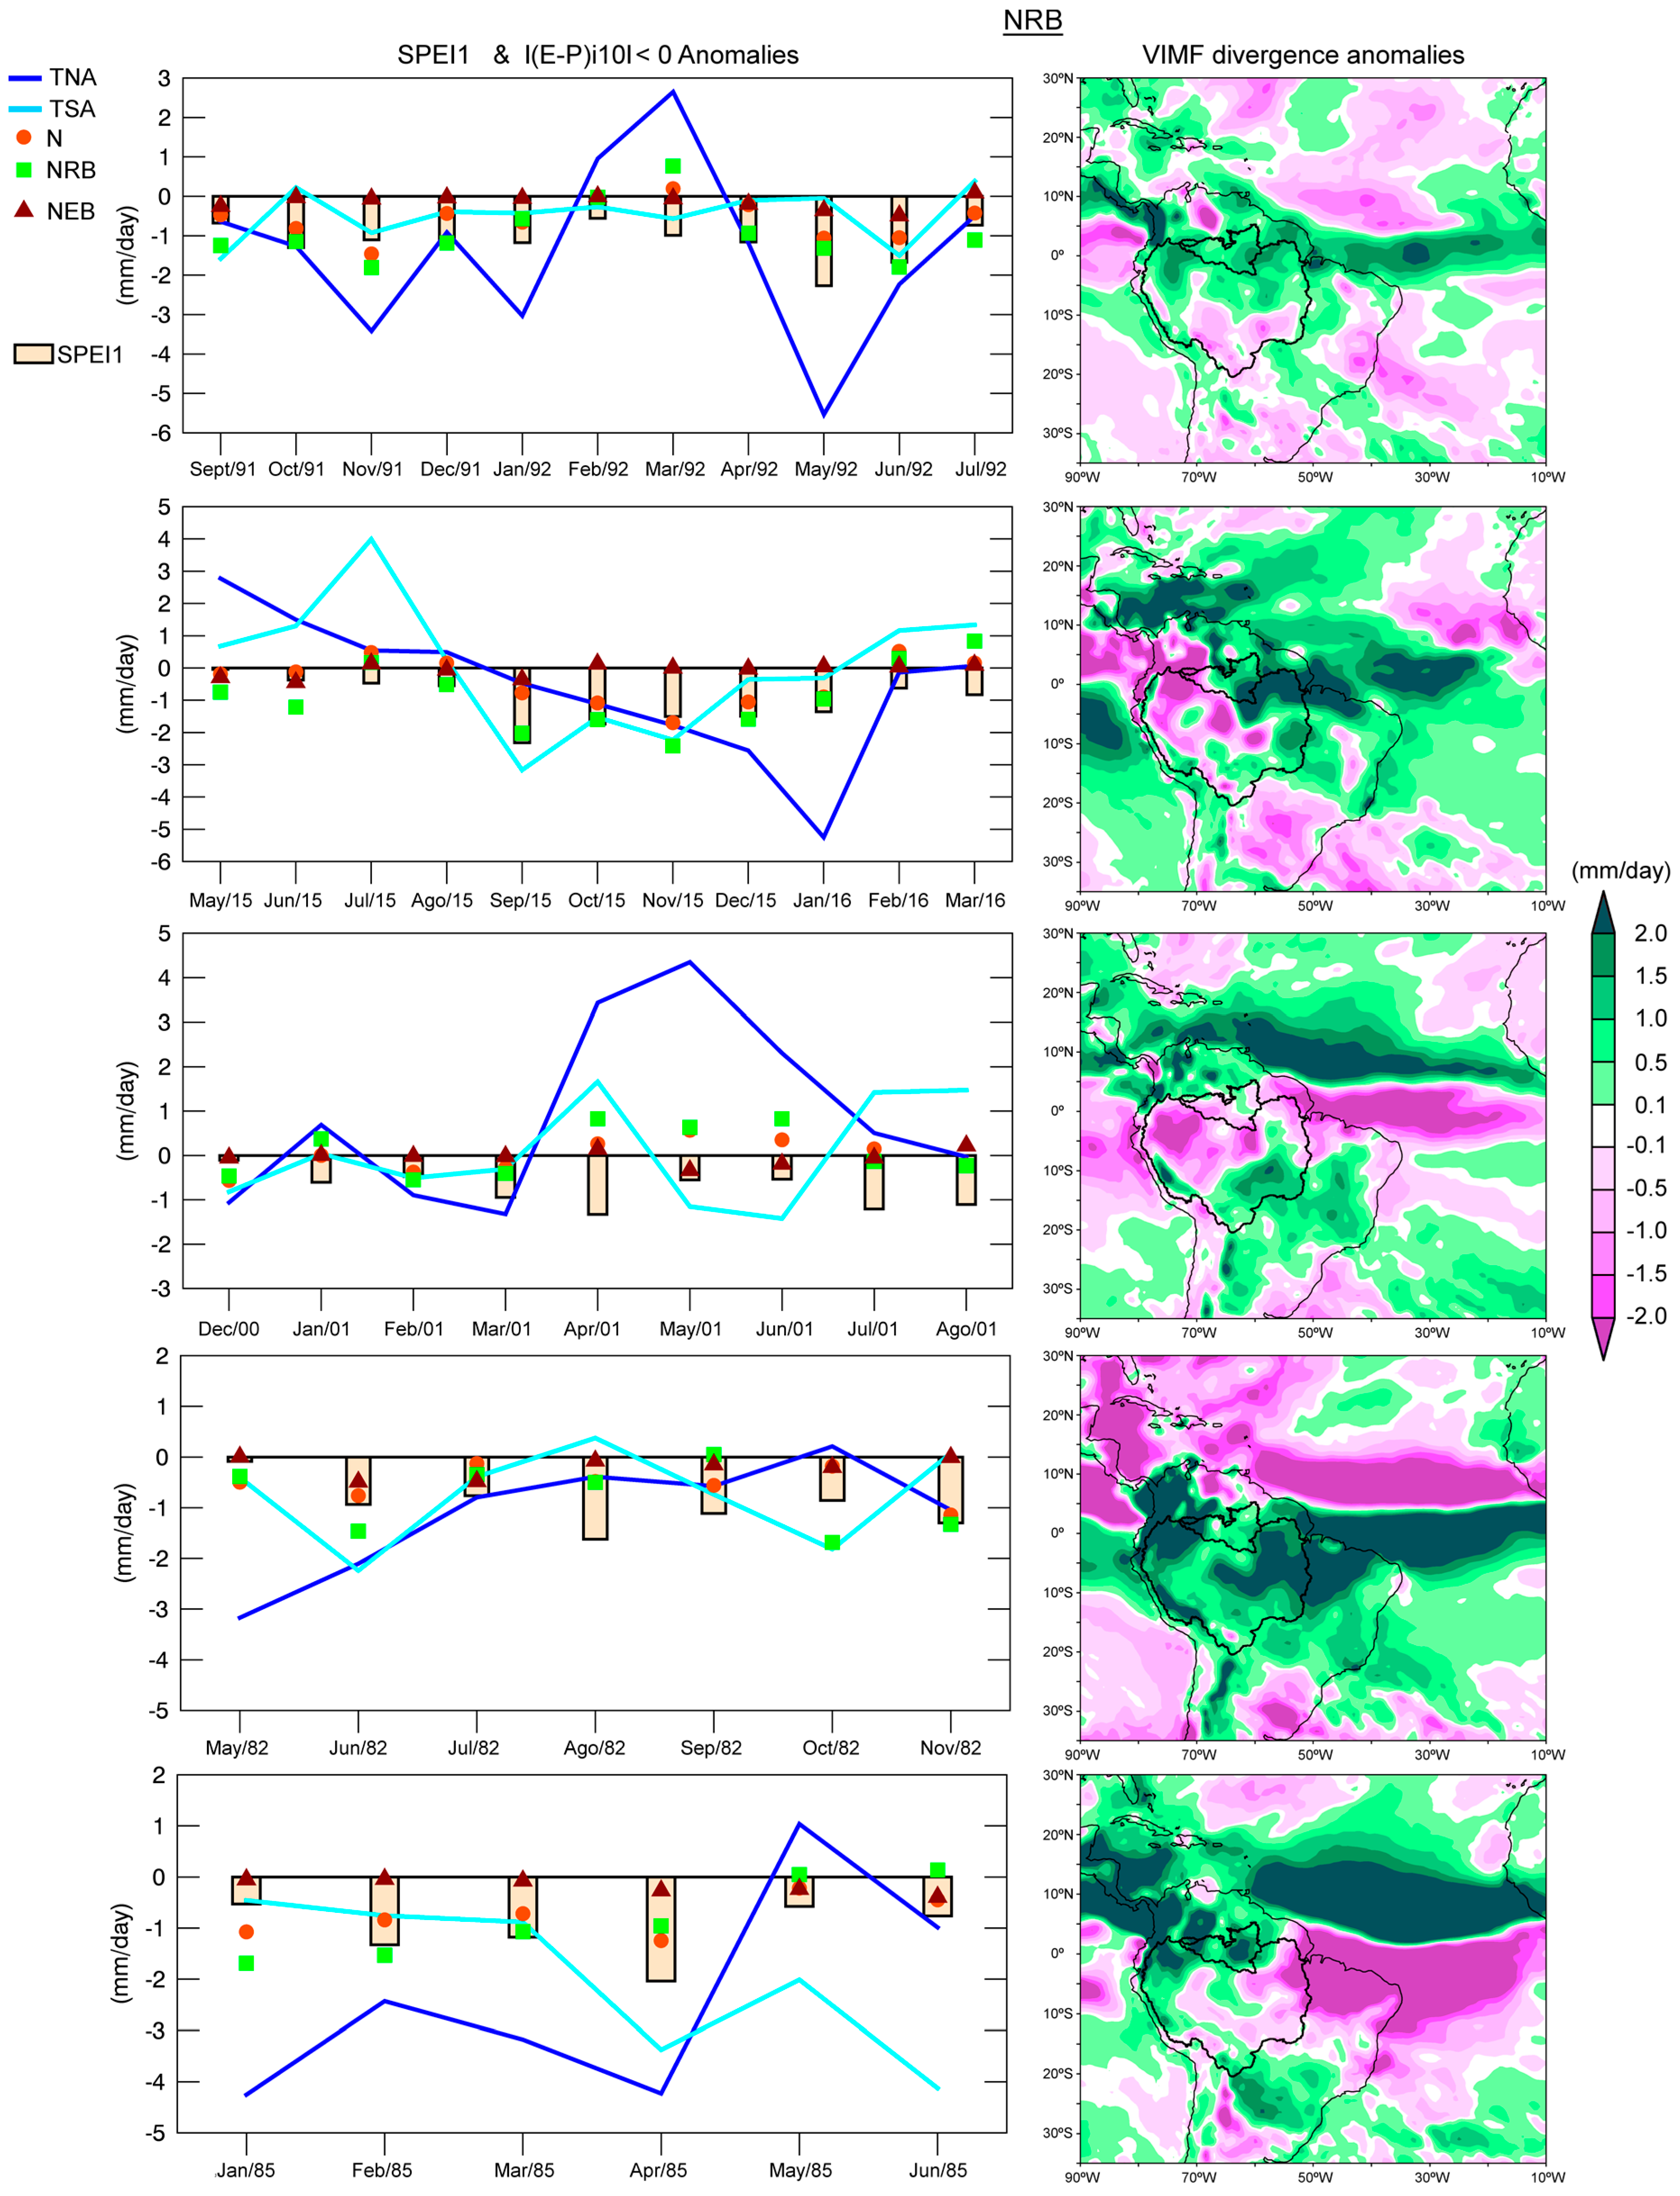
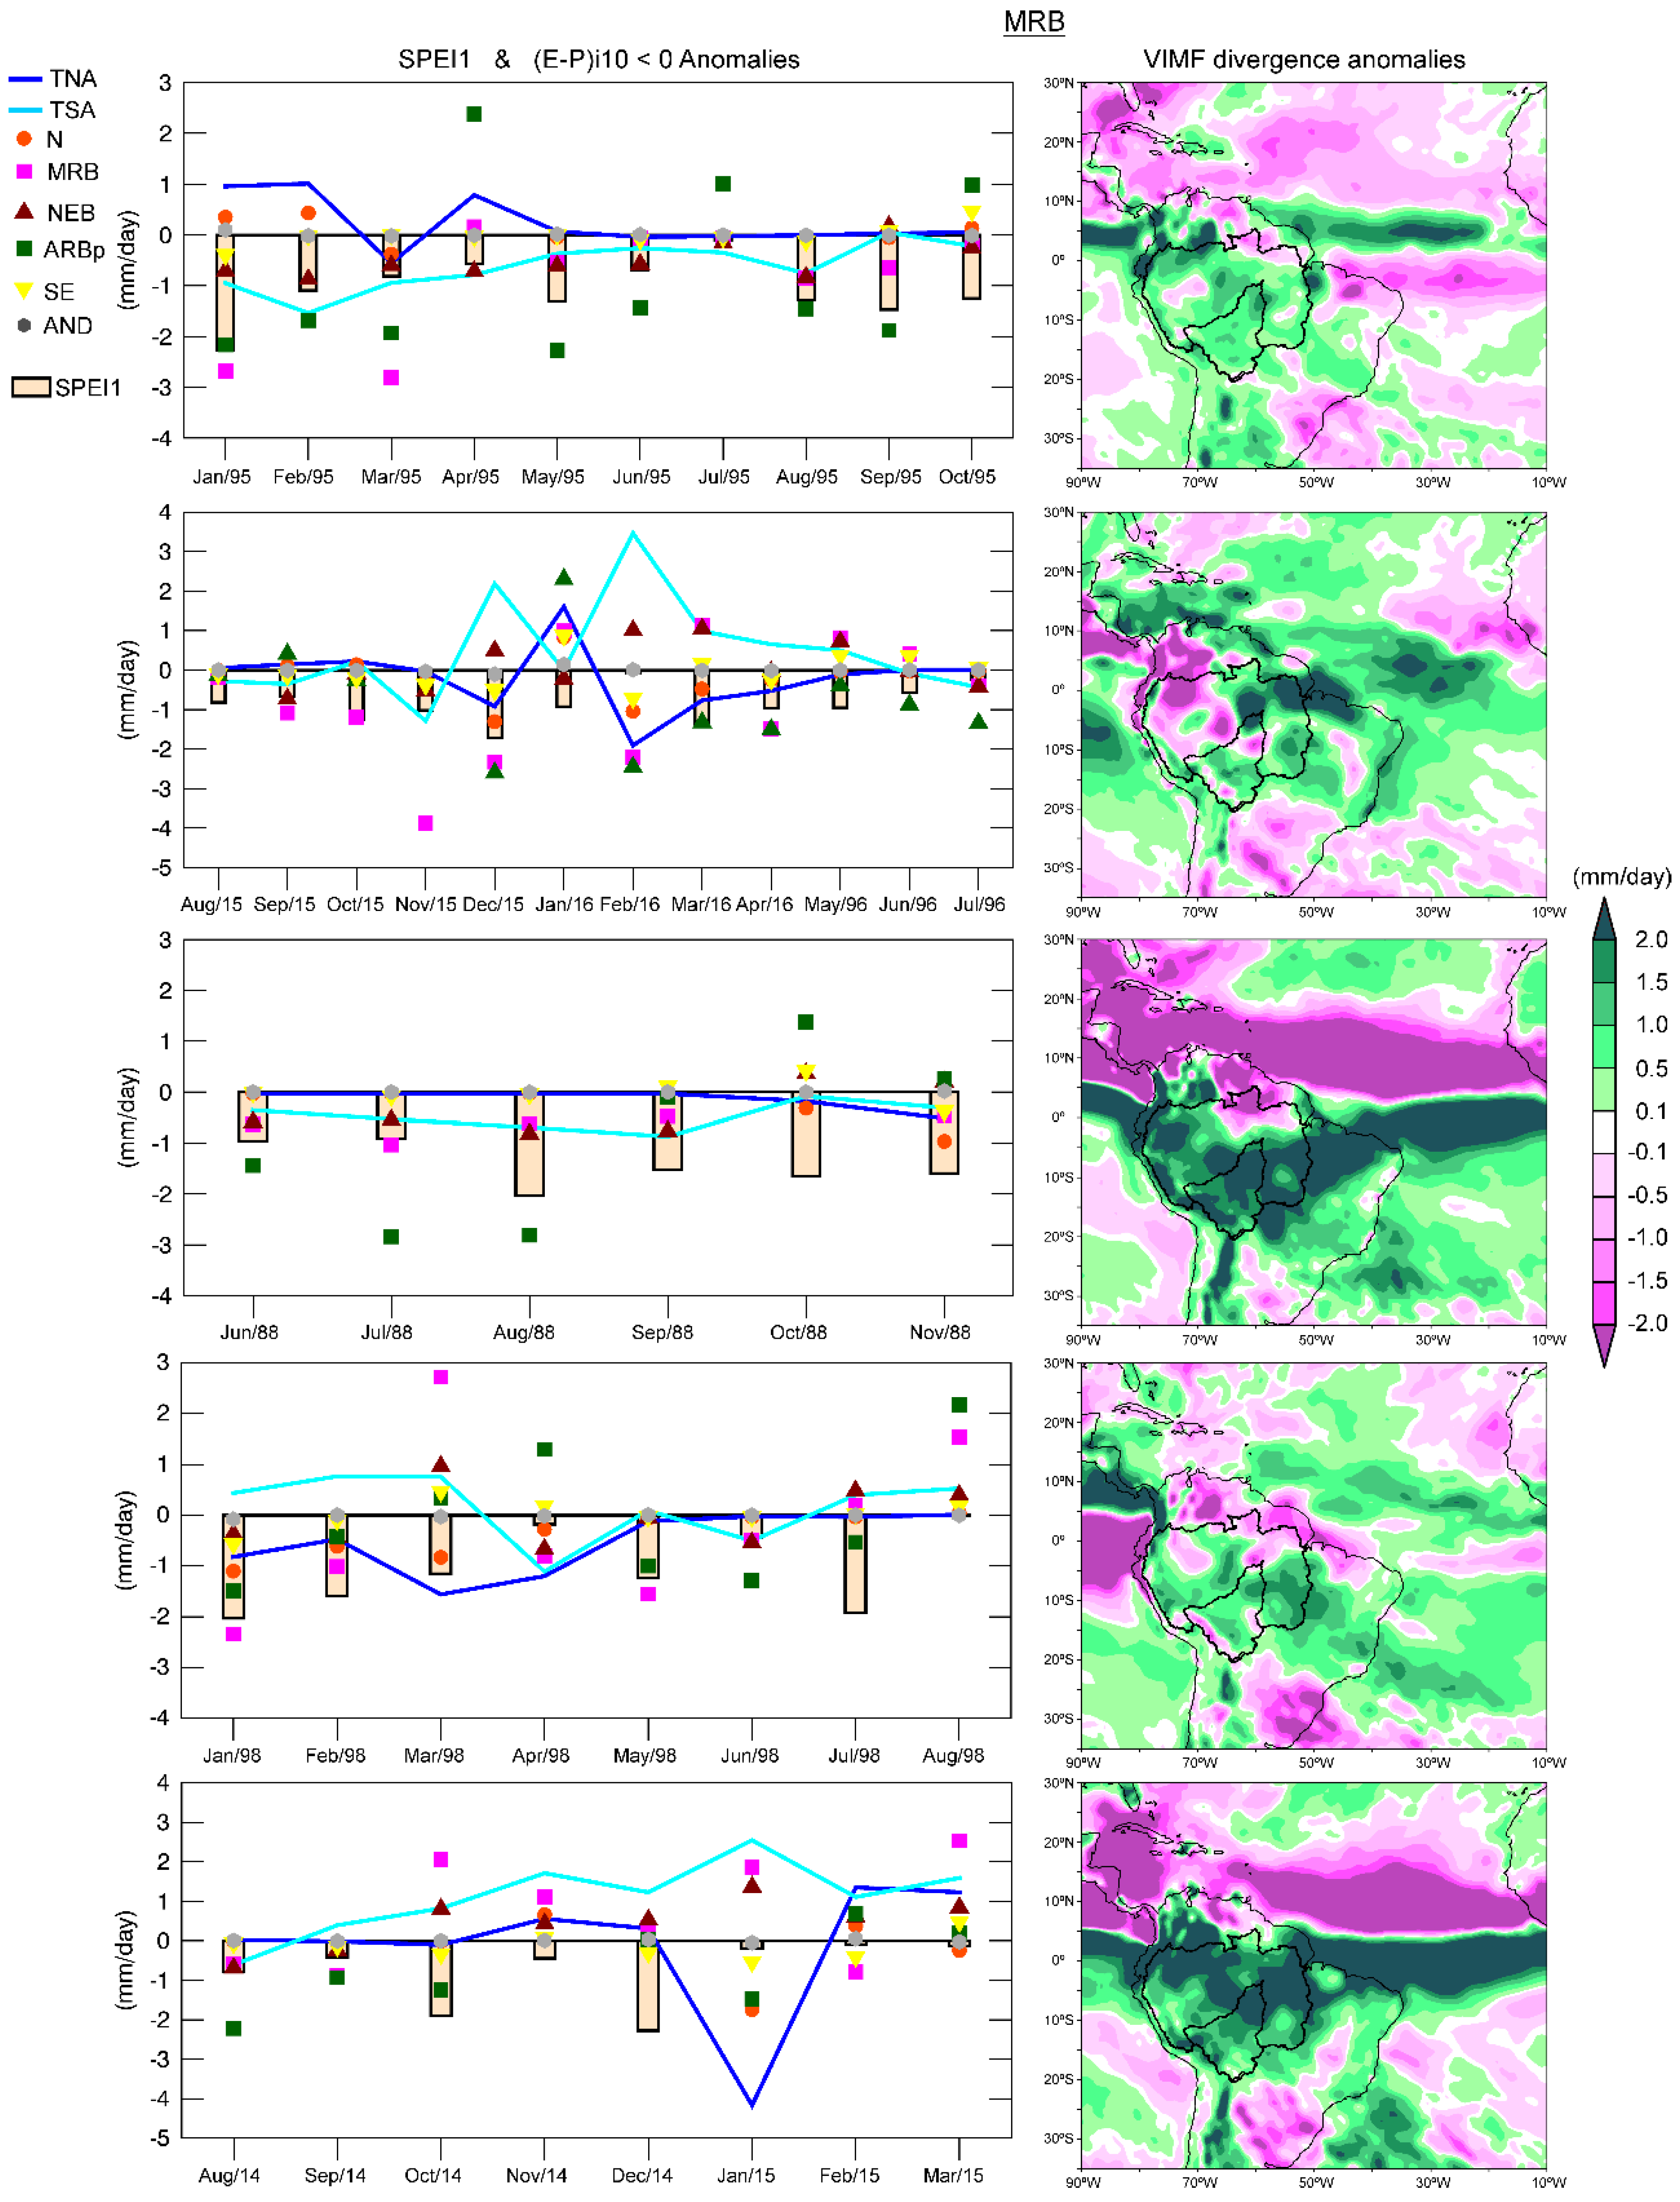
Table 1.
Drought classification based on the SPEI.
| Drought Category | Range |
|---|---|
| Non-drought | 0 ≤ SPEI |
| Mild drought | −1.0 < SPEI < 0 |
| Moderate drought | −1.5 < SPEI ≤ −1.0 |
| Severe drought | −2.0 < SPEI ≤ −1.5 |
| Extreme drought | SPEI ≤ −2.0 |
Table 2.
Significant monthly correlations (at p < 0.05) between |(E − P)i10 < 0| from the sources and P over the NRB.
Table 2.
Significant monthly correlations (at p < 0.05) between |(E − P)i10 < 0| from the sources and P over the NRB.
| Moisture Sources | ||||||
|---|---|---|---|---|---|---|
| TNA | TSA | N | NRB | NEB | r2 (%) | |
| r | 0.29 | 0.51 | 0.49 | 0.58 | 0.46 | 54 |
| r (lag 1 month) | 0.52 | 0.16 | 0.42 | 0.46 | 0.10 | 43 |
| r (lag 2 months) | 0.58 | −0.21 | 0.29 | 0.28 | −0.26 | 42 |
Table 3.
Significant monthly correlations (at p < 0.05) between |(E − P)i10 < 0| from the sources and P over the MRB.
Table 3.
Significant monthly correlations (at p < 0.05) between |(E − P)i10 < 0| from the sources and P over the MRB.
| Moisture Sources | |||||||||
|---|---|---|---|---|---|---|---|---|---|
| TNA | TSA | N | MRB | NEB | ARBr | AND | SE | r2 (%) | |
| r | 0.79 | 0.46 | 0.78 | 0.74 | 0.08 | 0.80 | 0.45 | 0.56 | 80 |
| r (lag 1 month) | 0.65 | 0.42 | 0.76 | 0.62 | −0.09 | 0.77 | 0.39 | 0.57 | 58 |
| r (lag 2 months) | 0.32 | 0.29 | 0.55 | 0.36 | −0.23 | 0.58 | 0.25 | 0.40 | 36 |
Table 4.
Top five most severe dry episodes occurring in the NRB and MRB according to SPEI1 and their duration and peak. Period: 1980–2016.
Table 4.
Top five most severe dry episodes occurring in the NRB and MRB according to SPEI1 and their duration and peak. Period: 1980–2016.
| NRB | MRB | ||||||
|---|---|---|---|---|---|---|---|
| Month/Year | Severity | Duration | Peak | Month/Year | Severity | Duration | Peak |
| September 1991–July 1992 | 12.8 | 11 | −2.26 | January 1995–October 1995 | 10.8 | 10 | −2.27 |
| May 2015–March 2016 | 11.3 | 11 | −2.32 | August 2015–July 2016 | 10.6 | 12 | −1.70 |
| December 2000–August 2001 | 6.9 | 9 | −1.33 | June 1988–November 1988 | 8.7 | 6 | −2.02 |
| May 1982–November 1982 | 6.7 | 7 | −1.62 | January 1998–August 1998 | 8.5 | 8 | −2.03 |
| January 1985–June 1985 | 6.4 | 6 | −2.03 | August 2014–March 2015 | 6.3 | 8 | −2.27 |
Table 5.
Anomalies of P and |(E − P)i10 < 0| in the NRB for the composite of months under El Niño and La Niña conditions. Simultaneous negative (positive) anomalies of P and |(E − P)i10 < 0| are shaded in blue (red). Period: 1980–2016.
Table 5.
Anomalies of P and |(E − P)i10 < 0| in the NRB for the composite of months under El Niño and La Niña conditions. Simultaneous negative (positive) anomalies of P and |(E − P)i10 < 0| are shaded in blue (red). Period: 1980–2016.
| El Niño | Months | |||||||||||
| P/Sources | January | February | March | April | May | June | July | August | September | October | November | December |
| P | −2.12 | −1.08 | −0.43 | 0.44 | −1.19 | −1.35 | 0.04 | −0.42 | −0.71 | −0.19 | −0.73 | −2.26 |
| TNA | −3.20 | −1.80 | 0.54 | −0.99 | −2.21 | −0.84 | −0.20 | −0.07 | −0.17 | −0.01 | −0.53 | −2.56 |
| TSA | −0.36 | −0.15 | 0.22 | 0.89 | 0.99 | −0.19 | 0.86 | −0.02 | −0.77 | −0.95 | −0.50 | −0.36 |
| N | −0.76 | −0.43 | 0.19 | −0.12 | −0.44 | −0.37 | 0.07 | −0.10 | −0.23 | −0.23 | −0.56 | −1.05 |
| NRB | −1.17 | −0.61 | 0.15 | −0.54 | −0.67 | −0.76 | −0.36 | −0.32 | −0.42 | −0.57 | −0.67 | −1.59 |
| NEB | −0.03 | −0.02 | −0.03 | −0.09 | −0.02 | −0.23 | −0.10 | −0.08 | −0.12 | −0.08 | −0.01 | −0.02 |
| La Niña | ||||||||||||
| P | 1.68 | 1.62 | 1.47 | −0.91 | 1.63 | −1.24 | −0.36 | −0.50 | 0.49 | 0.14 | 1.18 | 1.12 |
| TNA | 2.08 | 1.71 | 0.48 | 0.49 | 0.27 | −0.96 | 0.26 | 0.14 | 0.12 | 0.49 | 0.54 | 0.89 |
| TSA | 0.32 | 0.11 | −0.41 | −0.76 | 1.77 | 2.62 | 0.81 | −0.60 | 1.01 | 1.08 | 1.35 | 0.39 |
| N | 0.60 | 0.35 | 0.33 | −0.05 | 0.51 | 0.11 | 0.35 | 0.24 | 0.44 | 0.55 | 0.68 | 0.46 |
| NRB | 0.93 | 0.48 | 0.83 | 0.15 | 1.03 | 0.54 | 0.78 | 0.56 | 0.64 | 1.00 | 1.18 | 0.82 |
| NEB | 0.04 | 0.05 | 0.00 | 0.08 | 0.37 | 0.56 | 0.27 | 0.11 | 0.22 | 0.07 | 0.05 | 0.04 |
Table 6.
Anomalies of P and |(E − P)i10 < 0| over the MRB for composited of months under El Niño and La Niña conditions. Simultaneous negative (positive) anomalies of P and |(E − P)i10 < 0| are shaded in blue (red). Period 1980–2016.
Table 6.
Anomalies of P and |(E − P)i10 < 0| over the MRB for composited of months under El Niño and La Niña conditions. Simultaneous negative (positive) anomalies of P and |(E − P)i10 < 0| are shaded in blue (red). Period 1980–2016.
| El Niño | Months | |||||||||||
| P/Sources | January | February | March | April | May | June | July | August | September | October | November | December |
| P | −1.17 | −1.13 | −0.43 | 0.15 | 0.29 | 0.07 | 0.24 | 0.10 | −0.03 | −0.25 | −0.19 | 0.05 |
| TNA | 0.39 | −0.34 | −0.83 | −0.39 | −0.07 | 0.02 | 0.02 | 0.01 | 0.01 | 0.09 | −0.13 | 0.23 |
| TSA | −0.04 | 0.93 | 0.77 | 0.13 | −0.02 | −0.06 | 0.19 | −0.03 | −0.08 | −0.30 | 0.49 | 0.11 |
| N | −0.28 | −0.34 | −0.42 | −0.18 | −0.01 | 0.04 | 0.02 | 0.01 | 0.02 | 0.09 | −0.30 | −0.38 |
| MRB | −1.22 | −1.40 | 0.14 | −0.43 | −0.15 | −0.29 | 0.18 | −0.09 | −0.21 | −0.95 | −2.01 | −1.52 |
| NEB | −0.33 | 0.17 | 0.37 | −0.04 | −0.09 | −0.16 | 0.17 | 0.06 | −0.18 | −0.30 | −0.04 | −0.14 |
| ARBp | −1.03 | −1.55 | −1.09 | −0.27 | 0.91 | 0.57 | 0.81 | −0.10 | −0.31 | −0.52 | −2.43 | −1.52 |
| SE | −0.10 | −0.36 | −0.11 | 0.00 | 0.00 | −0.05 | 0.00 | −0.05 | −0.05 | −0.13 | −0.32 | −0.35 |
| AND | 0.01 | −0.01 | 0.01 | −0.01 | 0.00 | 0.00 | 0.00 | 0.00 | 0.00 | −0.01 | −0.01 | −0.04 |
| La Niña | ||||||||||||
| P | −0.08 | 0.79 | 0.03 | −0.43 | −0.36 | −0.41 | −0.15 | −0.47 | −0.31 | −0.09 | −0.70 | 0.29 |
| TNA | 0.24 | 0.85 | 0.21 | 0.92 | −0.06 | 0.05 | −0.01 | −0.02 | 0.00 | 0.00 | −0.77 | −0.40 |
| TSA | 0.23 | 0.11 | −0.48 | 0.02 | −0.15 | −0.75 | −0.25 | −0.34 | −0.13 | −0.24 | 0.61 | −0.17 |
| N | 0.16 | 0.44 | 0.46 | 0.11 | −0.01 | −0.01 | −0.02 | 0.00 | 0.05 | −0.01 | −0.74 | 0.16 |
| MRB | 1.73 | 1.10 | 2.61 | 1.30 | −0.29 | −0.27 | −0.12 | −0.07 | 0.39 | 1.11 | 3.68 | 1.28 |
| NEB | 0.29 | 0.31 | −0.01 | 0.06 | −0.12 | −0.58 | −0.16 | −0.37 | 0.04 | 0.26 | 0.46 | 0.12 |
| ARBp | 1.41 | 2.00 | 3.32 | 1.15 | −1.90 | −1.36 | −0.23 | −0.86 | 0.94 | −0.16 | 1.93 | 1.14 |
| SE | 0.24 | 0.15 | 0.40 | 0.14 | −0.02 | 0.00 | −0.03 | 0.01 | 0.13 | 0.41 | −0.33 | 0.45 |
| AND | 0.00 | 0.00 | −0.02 | 0.00 | 0.01 | 0.00 | 0.00 | 0.00 | 0.00 | −0.01 | 0.00 | −0.01 |
© 2018 by the authors. Licensee MDPI, Basel, Switzerland. This article is an open access article distributed under the terms and conditions of the Creative Commons Attribution (CC BY) license (http://creativecommons.org/licenses/by/4.0/).
Share and Cite
MDPI and ACS Style
Sorí, R.; Marengo, J.A.; Nieto, R.; Drumond, A.; Gimeno, L. The Atmospheric Branch of the Hydrological Cycle over the Negro and Madeira River Basins in the Amazon Region. Water 2018, 10, 738. https://doi.org/10.3390/w10060738
AMA Style
Sorí R, Marengo JA, Nieto R, Drumond A, Gimeno L. The Atmospheric Branch of the Hydrological Cycle over the Negro and Madeira River Basins in the Amazon Region. Water. 2018; 10(6):738. https://doi.org/10.3390/w10060738
Chicago/Turabian StyleSorí, Rogert, José A. Marengo, Raquel Nieto, Anita Drumond, and Luis Gimeno. 2018. "The Atmospheric Branch of the Hydrological Cycle over the Negro and Madeira River Basins in the Amazon Region" Water 10, no. 6: 738. https://doi.org/10.3390/w10060738
Note that from the first issue of 2016, this journal uses article numbers instead of page numbers. See further details here.