Simulation of Urban Water Resources in Xiamen Based on a WEAP Model


1
Key Lab of Urban Environment and Health, Institute of Urban Environment, Chinese Academy of Sciences, 1799 Jimei Road, Xiamen 361021, China
2
Pearl River Water Resource Commission of the Ministry of Water Resources, 80 Tianshou Road, Guangzhou 510611, China
*
Author to whom correspondence should be addressed.
Water 2018, 10(6), 732; https://doi.org/10.3390/w10060732
Submission received: 14 April 2018
/
Revised: 12 May 2018
/
Accepted: 29 May 2018
/
Published: 5 June 2018
(This article belongs to the Special Issue Water Networks Management: New Perspectives)
Abstract
:A water evaluation and planning model (WEAP) for Xiamen City was used to analyze trends in water use and demand between 2015 and 2050. This study was unique in that it considered the water resources of each of the city’s five districts’ separately, rather than the city as a whole. The water saving potential, water shortages, and water supply alternatives were analyzed under different simulated scenarios. The results show that future water consumption will greatly increase in Xiamen City, and that there will be a water shortage after 2030 without new water supplies. Water shortages will first occur in the Tongan and Xiangan districts, due to established water supply priorities and capacity. Industry restructuring (structural water-saving scenario, SWS) and advanced water-saving technology (technical water-saving scenario, TWS) can result in water saving potentials of 6.97% and 9.82% by 2050, respectively, while adopting both strategies (double water-saving scenario, DWS) can save 16.44%. The prevention of future water shortages requires the implementation of water-saving measures and the use of new water supplies.
1. Introduction
Four billion people face severe water shortages across the globe [1]. Increasing water demands coupled with water shortages have been identified as society’s greatest risk [2]. Cities are water shortage hotspots due to highly concentrated populations that consume large amounts of resources in a concentrated area. In 2014, 54% of the world’s population was located in urban areas, and this proportion is expected to increase to 66% by 2050 [3]. The rapid growth of urban populations will substantially increase worldwide water resource use [4,5]. Serious urban water shortages affect more than two thirds (approximately 400) of Chinese cities [6]. In 2015, China’s urbanization rate was 56.1% [7], and this rate is estimated to increase to about 80% by 2050 [8]. China’s rapid urbanization rate will result in additional water shortages. Hence, it is very important to effectively manage urban water resources to ensure that there is sustainable water use.
Water resource management models are effective tools for addressing water shortages. This is because water supply and demand simulations can support decision processes for regional water resource planning. There have been many studies and applications of water management models. Examples of water management models that have been used for previous research include the MODSIM, WEAP, AQUATOOL, RIBASIM, and WARGI-SIM models [9,10,11].
Many regions are facing formidable freshwater management challenges. The allocation of limited water resources, environmental quality and policies for sustainable water use are issues of increasing concern. Conventional supply-oriented simulation models are not always adequate. In response to this, the water evaluation and planning (WEAP) model has emerged as a strategy for framing water supply projects in the context of demand-side issues, while considering water quality and ecosystem preservation [12]. The WEAP model has been widely used globally for water resource management due to advantages that include flexible expression, multiple interfaces, good compatibility, and scalability [9]. There are multiple examples of the use of the WEAP model. Haddad et al. used WEAP to analyze the Tulkarem basin and found that water management and water trading were two strategies for the reduction of future water demands [13]. Yates et al. used WEAP to simulate water supply changes in California’s Sacramento River Basin and showed that this model is useful for several California water planning processes [14]. Bharati et al. used WEAP to show that a water storage and transfer project between India’s Godavari Basin and Krishna River Basin will reduce the area’s water deficit while significantly reducing dry slow river flow into the Lower Godavari Delta [15]. Al-Omari et al. established a water management support system in the Amman Zarqa watershed by using WEAP to compare different management plans and establish a theoretical basis for watershed water management [16]. Höllermann et al. used WEAP to analyze the impact of different socio-economic development and climate change scenarios on water resources in Benin [17]. Vicuña et al. used WEAP to investigate the effect of temperature and precipitation on surface hydrology, the performance of water infrastructure, and irrigation coverage in the Limari basin [18]. Rheinheimer et al. used a WEAP-based water resource management model for the upper west slope of the Sierra Nevadas to predict the effects of regional climate warming on the watershed’s hydropower production [19]. Similarly, Hamlat et al. used WEAP to analyze the impact of different operating policies and other factors on water resources in the western Algerian basin [20].
The analysis of the influence of different management scenarios on water consumption in the Tianjin Binhai New Area is an example of the use of WEAP on the city-level scale to justify the rational allocation of water resources, ensuring attention to ecological environmental concerns and the optimization of the city’s economic structure [21]. Likewise, Song et al. established an optimal allocation of water resources by using WEAP to establish a reliable scientific basis for Longkou City’s future water use and development [22]. Li et al. used WEAP to analyze the influence of urbanization, industrial restructuring, and water resource policy change on Tianjin Binhai New Area’s water resource utilization [23]. Overall, recent research using WEAP has been mostly focused on the watershed scale, with fewer studies of the urban water balance. In addition, most studies of urban water resource use and availability ignore the spatial allocation of water resources and only consider the whole city’s water balance relationships. Furthermore, few studies have analyzed the industrial sector’s water consumption in detail.
Using Xiamen City as a case study, a water resource simulation model from 2015 to 2050 was built using a WEAP model. This model included subsystems from each district and detailed descriptions of the industrial sectors. Water saving potentials and water shortage problems under different water saving scenarios were analyzed, as well as the spatial allocation relationship between districts. Furthermore, water supply alternatives were discussed according to the designed water supply scenarios. The results provide valuable information for Xiamen City’s future water planning and policy-making. This analysis may also provide some general insights into urban-level water saving and supplies for other cities.
2. Study Area
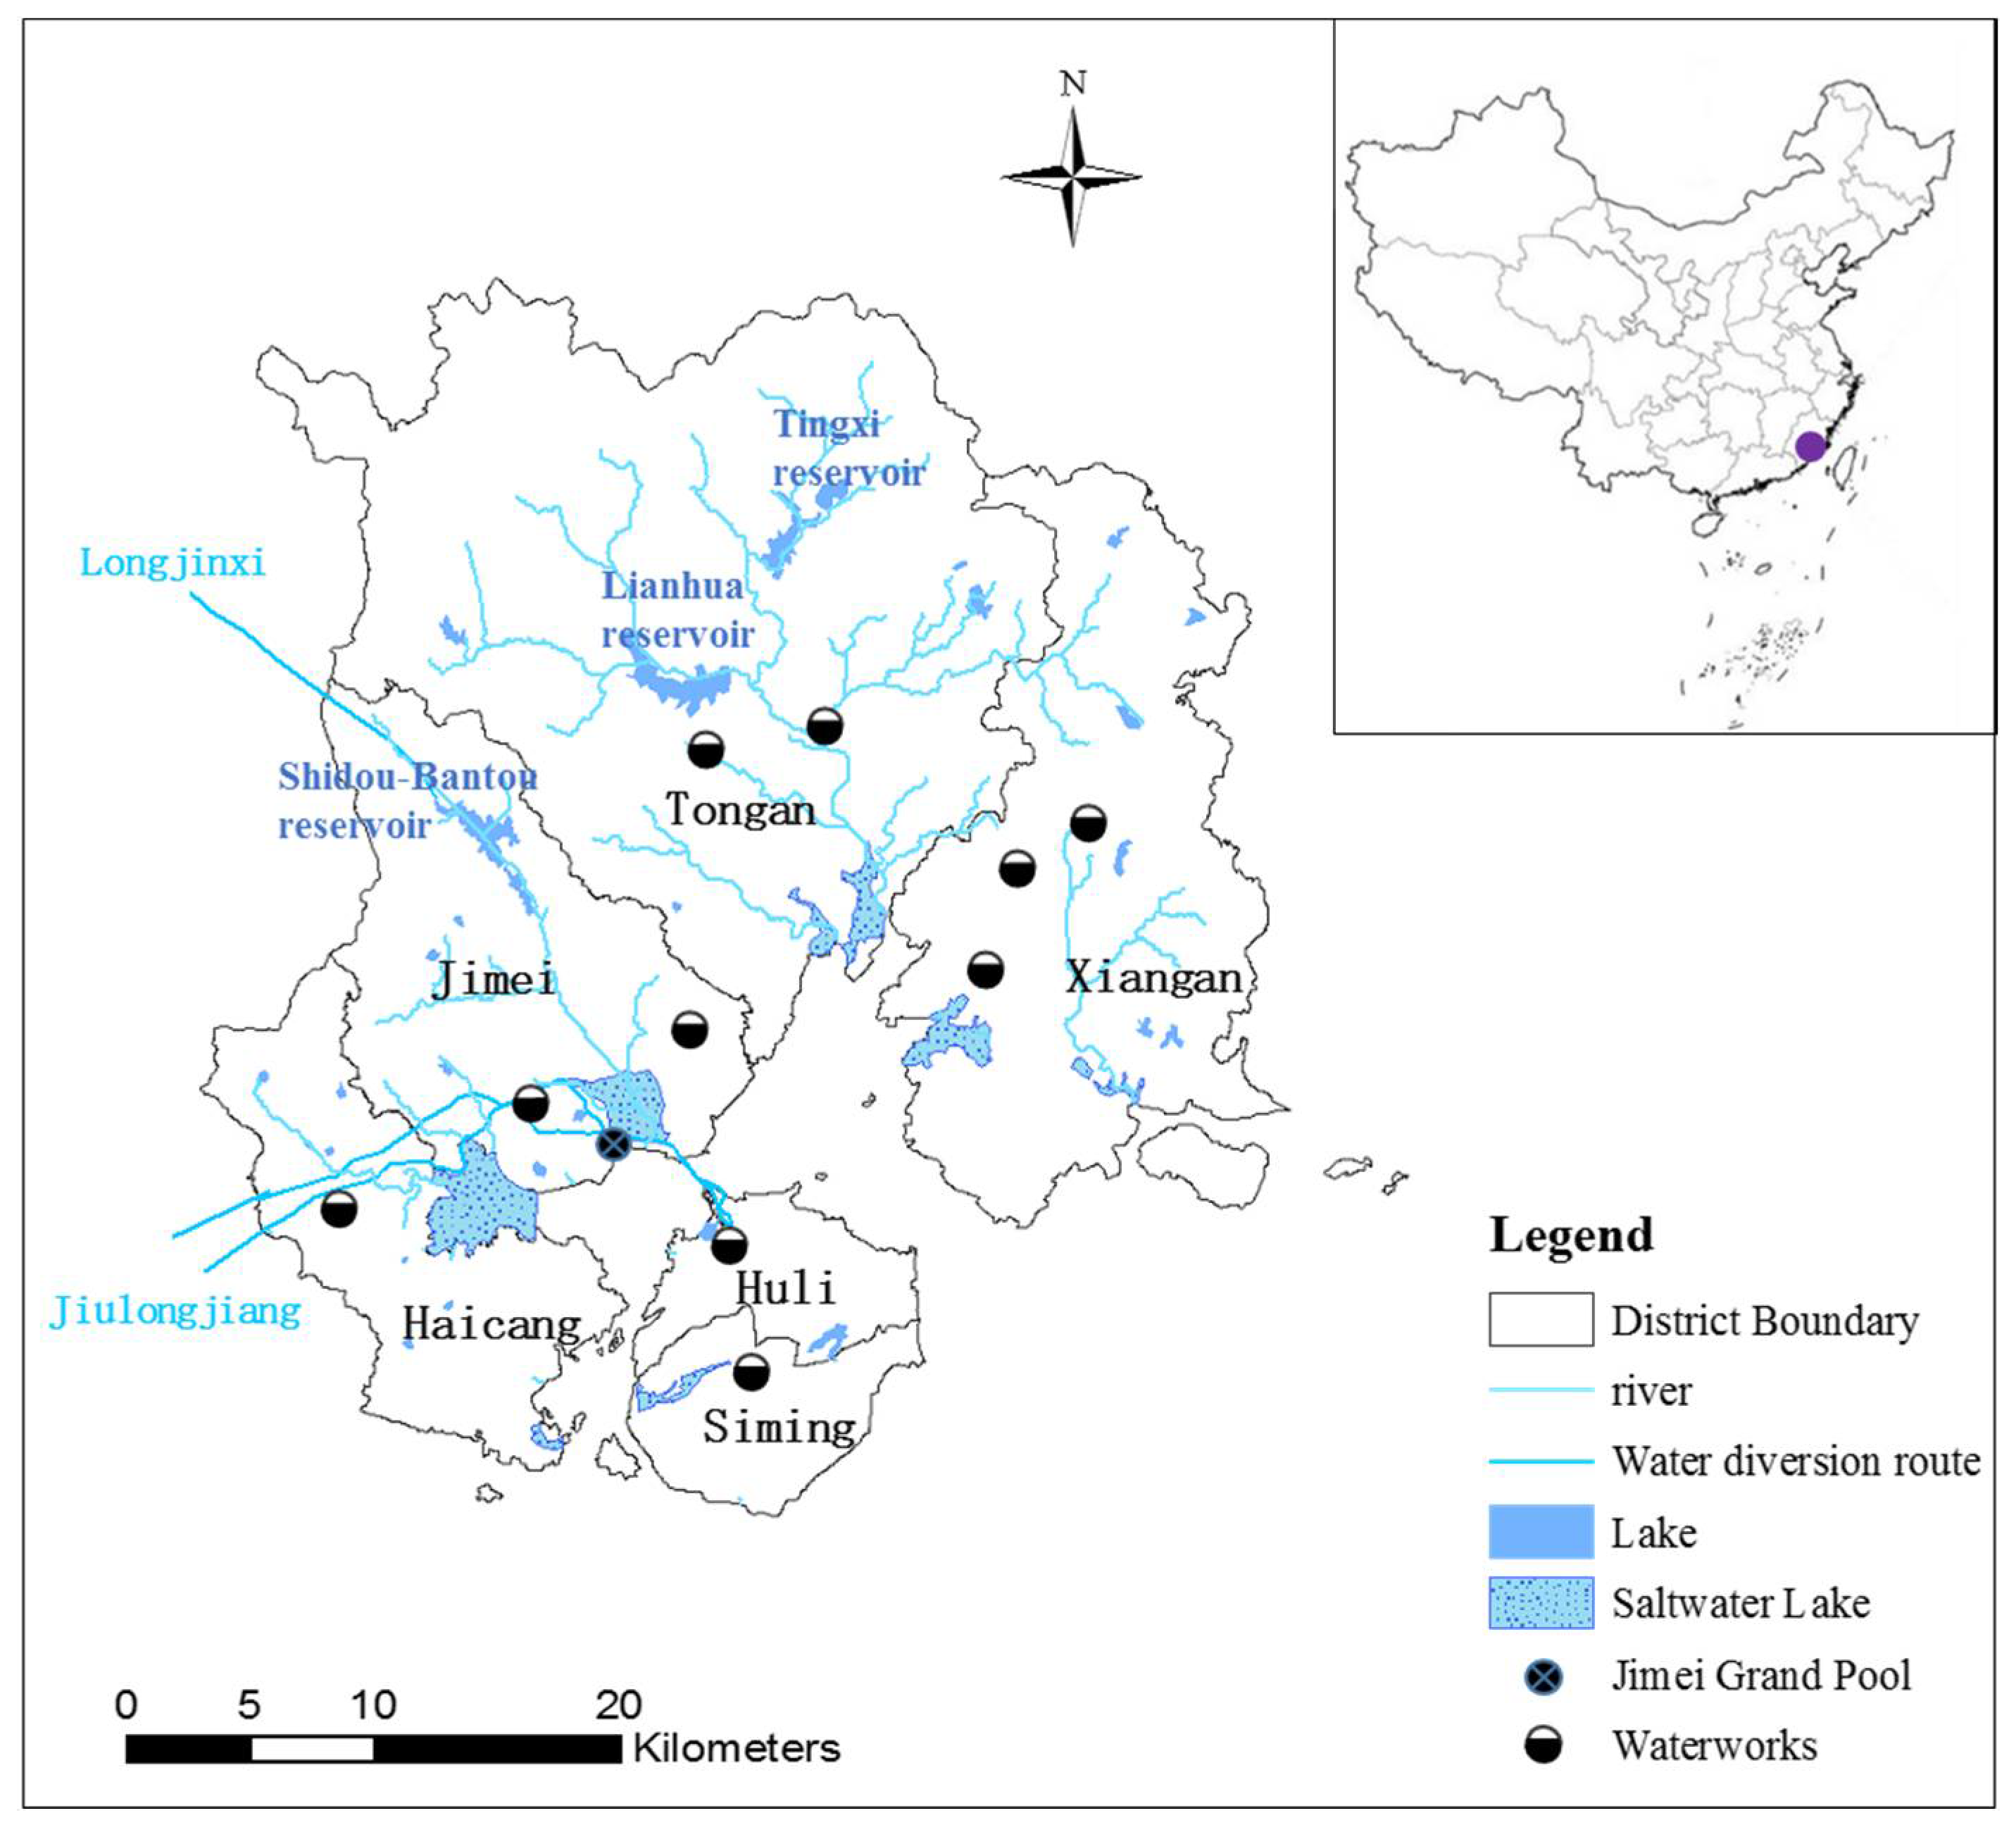
Xiamen City is located along the southeast coast of China, and comprises six districts: Siming, Huli, Jimei, Haicang, Tongan, and Xiangan (Figure 1). The Siming and Huli Districts are located on the same island, whereas the other four districts are on the mainland. The population of Xiamen was 3.84 million in 2015. However, the population’s distribution is skewed, with the Siming and Huli districts (the island) accounting for 52.2% of the total population while being located on less than 10% of the city’s area. Trends indicate that the population will continue to grow, and it is projected that the city will have eight million residents by 2050. The regional gross domestic product (GDP) of Xiamen was 346 million RMB in 2015, and grew by 12.38% over the previous ten years. Primary industry accounted for 0.7% of Xiamen City’s industrial economy, whereas secondary industries accounted for 43.6% and the tertiary industry accounted for 55.7% [24]. Local water resources are scarce in Xiamen City, with an average annual water resource of 319 m3 per person. This is only 15% of the average national level, and much lower than the internationally recognized warning line of 1700 m3 per person per year [25,26].
Xiamen City is located in an eastern subtropical monsoon region, with an abundant annual rainfall of 1350 mm [25]. Xiamen City’s rivers are short and scattered, and most of the runoff flows directly into the sea [26]. Furthermore, the absence of a large water storage project limits the storage and use of local water resources. Consequently, 70% of the city’s total water supply is imported, most of which is inter-basin diversion from Jiulongjiang [27]. Local water supplies include the Shidou-Bantou, Tingxi, and Lianhua reservoirs for urban water use, while other small reservoirs serve as irrigation water sources. Hence, the serious water shortage, imbalanced population distribution, and rapid economic and population growth are factors that indicate a pressing need to study Xiamen City’s water resources and water allocation
3. Urban Water Resource Simulation Method
3.1. Simulation Model Based on the WEAP Platform
The WEAP model developed by the Stockholm Environment Institute (SEI), and is distinguished by its integrated approach to simulating water systems and by its policy orientation [12]. The WEAP model is widely used to analyze water resource allocation by establishing the relationship between regional water supply and demand, using the basic principle of water supply and demand balance [28]. The model uses standard linear programming to solve water resource allocation problems at each time-step of analysis for integrated water resource planning. The WEAP model can also build and analyze different future scenarios using alternative assumptions about the impacts of water demand and supply policies [29].
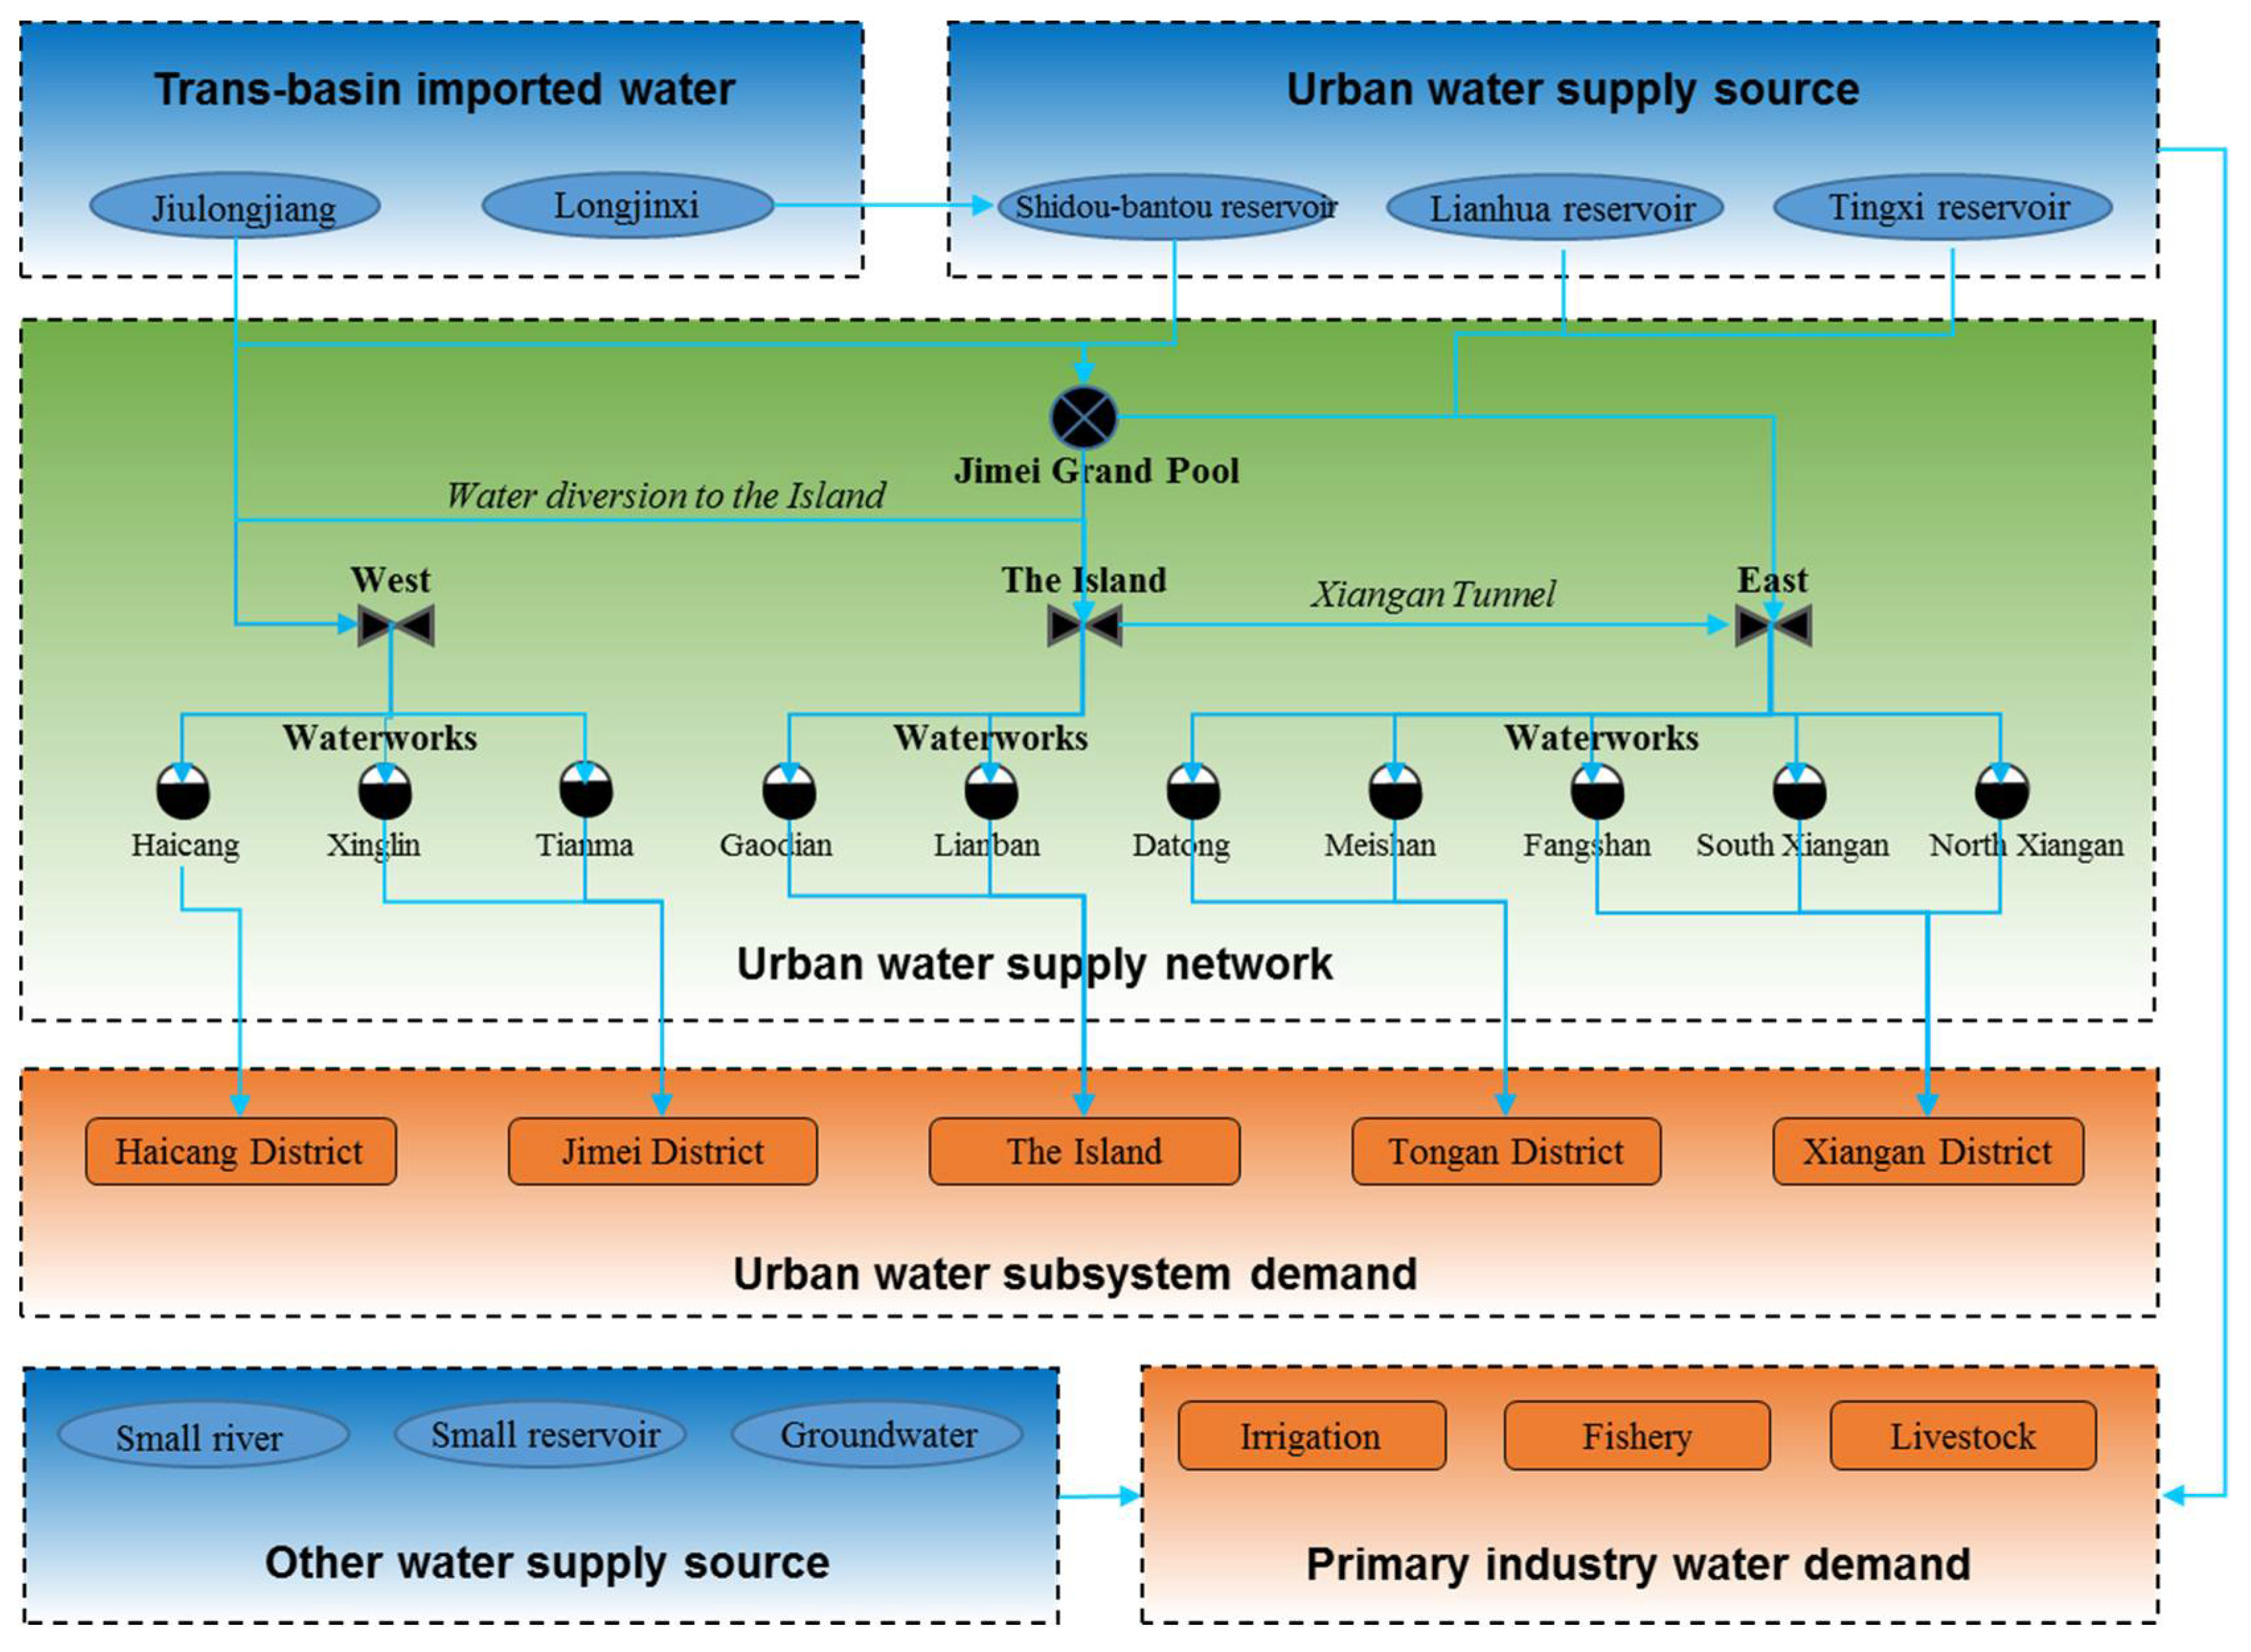
This study analyzes trends in water use and demand between 2015 and 2050 under different scenarios in Xiamen City. The scenarios are based on the government’s future policies and plans [27,30]. Xiamen City’s urban water demand is administrated by five districts that include the Haicang, Jimei, The Island, Tongan, and Xiangan districts (Figure 2). Each district considers domestic, secondary industrial, tertiary industrial, and ecological water demands. The main water supplies include imported water from the Jiulongjiang and Longjinxi rives, and local water from Shidou-Bantou, Tingxi, and Lianhua reservoirs. Primary industry also receives water supplies from local small rivers, small dams, small reservoirs, and groundwater, typically without treatment. Therefore, primary industry water analyses are considered separately from urban water supplies. The urban water supply network consists of 10 waterworks. There are three waterworks in the eastern part, five waterworks in the west and two waterworks on the island. It is worth noting that the water balance of each district was considered in the model.
3.2. Water Demand Calculations
3.2.1. Primary Industry Water Demand
Primary industry water includes irrigation, fisheries, and livestock water use. For irrigation water, the FAO (Food and Agriculture Organization of the United Nations) model was used to simulate the water consumption absorbed by various crops from the soil, followed by the calculation of the actual irrigation water requirement according to the irrigation coefficient [31]. Fisheries water use was calculated according to the amount of area containing aquaculture and the aquaculture water quota, and livestock water use was calculated according to the number of livestock and the livestock water quota [32,33]. The primary industry water demand was calculated according to the following equations (Equations (1)–(4)):
where Qprimary represents the total amount of primary industry water demand, Qirrigation represents the water demand of farm irrigation, Qfishery represents the water demand of fisheries, and Qlivestock represents the livestock water demand. qi-irrigation represents the irrigation water quota. Rcofficient represents the irrigation coefficient. qi-fishery represents the fishery water quota. Si represents the area of farm irrigation or aquaculture. qi-livestock represents the fishery water quota, numi represents the number of livestock, and n represents the number of crop varieties, fishery species or livestock species.
3.2.2. Secondary Industry Water Demand
Secondary industry includes manufacturing and construction. The water demand of manufacturing was determined by the industrial structure, industrial added value, and water quota. The water demand of the construction industry was determined by the area of newly built buildings and the construction water quota [34]. The secondary industry water demand was calculated according to the following equations (Equations (5)–(7)):
where Qsecondary represents the industrial water consumption. Qmanufacturing represents the manufacturing water consumption. Qconstruction represents the construction water consumption. qi represents the water consumption quota. Bi represents the industrial added value. S represents the construction area, and n represents the number of manufacturing species.
3.2.3. Tertiary Industry Water Demand
The tertiary industry’s water demand was mainly a function of the number of employees and the water quota [32,33]. The tertiary industry water demand was calculated according to the following equation (Equation (8)):
where Qtertiary represents the tertiary industry water demand. qi represents the water quota. popi represents the employed population, and n represents the number of tertiary species.
3.2.4. Domestic Water Demand
The domestic water demand was mainly a function of population size and water quota. The domestic water quota in each district was calculated from the Xiamen domestic water statistics and a questionnaire on domestic water use in each district. Each district’s water quota is expected to increase as the population’s living standards improve, and the gap in water demand between districts will gradually narrow [27]. The domestic water demand was calculated according to the following equation (Equation (9)):
where Qdomestic represents the total amount of domestic water. qdomestic represents the water quota, and pop represents the population.
3.2.5. Ecological Water Demand
Ecological environmental water demand refers to the amount of water that was artificially provided in order to maintain certain ecological functions. In Xiamen, the ecological water demand included urban greenbelt water demand and urban environmental sanitation water demand (sprinkling roads, etc.). According to Xiamen City’s urbanization process, the island’s infrastructure construction is complete, and green water and environmental sanitation water demands will grow little in the future. Infrastructure construction will be rapid outside the island, and green water and environmental sanitation water demand will increase rapidly. The ecological water demand was calculated according to the following equation (Equation (10)):
where Qecological represents the ecological water demand; Qgreenbelt represents the urban green belt water demand, and Qenvironment represents the urban environmental sanitation water demand.
3.3. Water Supply Priorities Used in the WEAP Model
Demand and supply priorities must be specified for WEAP simulations. The use of a static demand point for multiple supply points allows setting the supply priority order for a specified modeling scenario. When the water resource supplies are insufficient, and there are multiple demand points, the supply is prioritized to ensure that the demand point is met because it is of greater importance and higher priority. When the demand and supply points have equivalent priorities, they have the same WEAP satisfaction index [28]. For Xiamen City, the model’s supply priorities were: domestic water demand > secondary industry water demand > tertiary industry water demand > ecological water demand > primary industry water demand.
4. Model Scenario Design
4.1. Basic Assumptions
Key assumptions in the Xiamen WEAP model included population, regional gross domestic product (GDP), and industrial structure variables (Table 1). The population and GDP variables were assumed to grow continuously from 2015 to 2050. This plan assumes that the proportion of tertiary industries will continue to increase, while the proportion of primary and secondary industries will gradually decrease. The decrease of primary industry is due to decreasing agricultural acreage under rapid urbanization, while the decrease of secondary industry is due to moving these industries outside the city as a result of limited land area and environmental restrictions [30].
4.2. Scenario Design for Projecting Future Water Demand
Four scenarios were developed to evaluate Xiamen’s future water demand while accounting for the impact of industrial restructuring and water-saving measures. These demand side scenarios were: planning scenario (PLS), technical water-saving scenario (TWS), structural water-saving scenario (SWS), and double water-saving scenario (DWS). The PLS was designed to be consistent with local government planning. The TWS was designed by adopting advanced technology to reduce the water quota. The TWS was designed to save water by industrial restructuring. The DWS utilizes advanced technology and industrial restructuring to reduce water consumption. The scenarios and their main assumptions are summarized in Table 2.
4.3. Scenario Design for Water Supply
There are three kinds of new water supply patterns that Xiamen can use to meet future water demands (Table 3). These include trans-basin water diversion, reclaimed water, and seawater desalination. Trans-basin water diversion analyses considered three alternative rivers—Jiulongjiang, Tingjiang, and Mingjiang—which are located approximately 51 km, 135 km, and 200 km from Xiamen, respectively.
Imported water from the Jiulongjiang River is the most economical strategy, based on infrastructure expenditure and operating costs. Imported water from the Tingjiang and Mingjiang Rivers requires very high infrastructure expenditure, especially for the Mingjiang River. The infrastructure construction and operating costs for reclaimed water are slightly higher than imported water from the Jiulongjiang River, and much lower than seawater desalination and imported water from the Tingjiang and Mingjiang Rivers. Infrastructure expenditure and the operating costs for seawater desalination are much higher than external water diversion and reclaimed water, to the extent that this cost may be prohibitive.
5. Results and Discussions
5.1. Water Demand under Different Scenarios
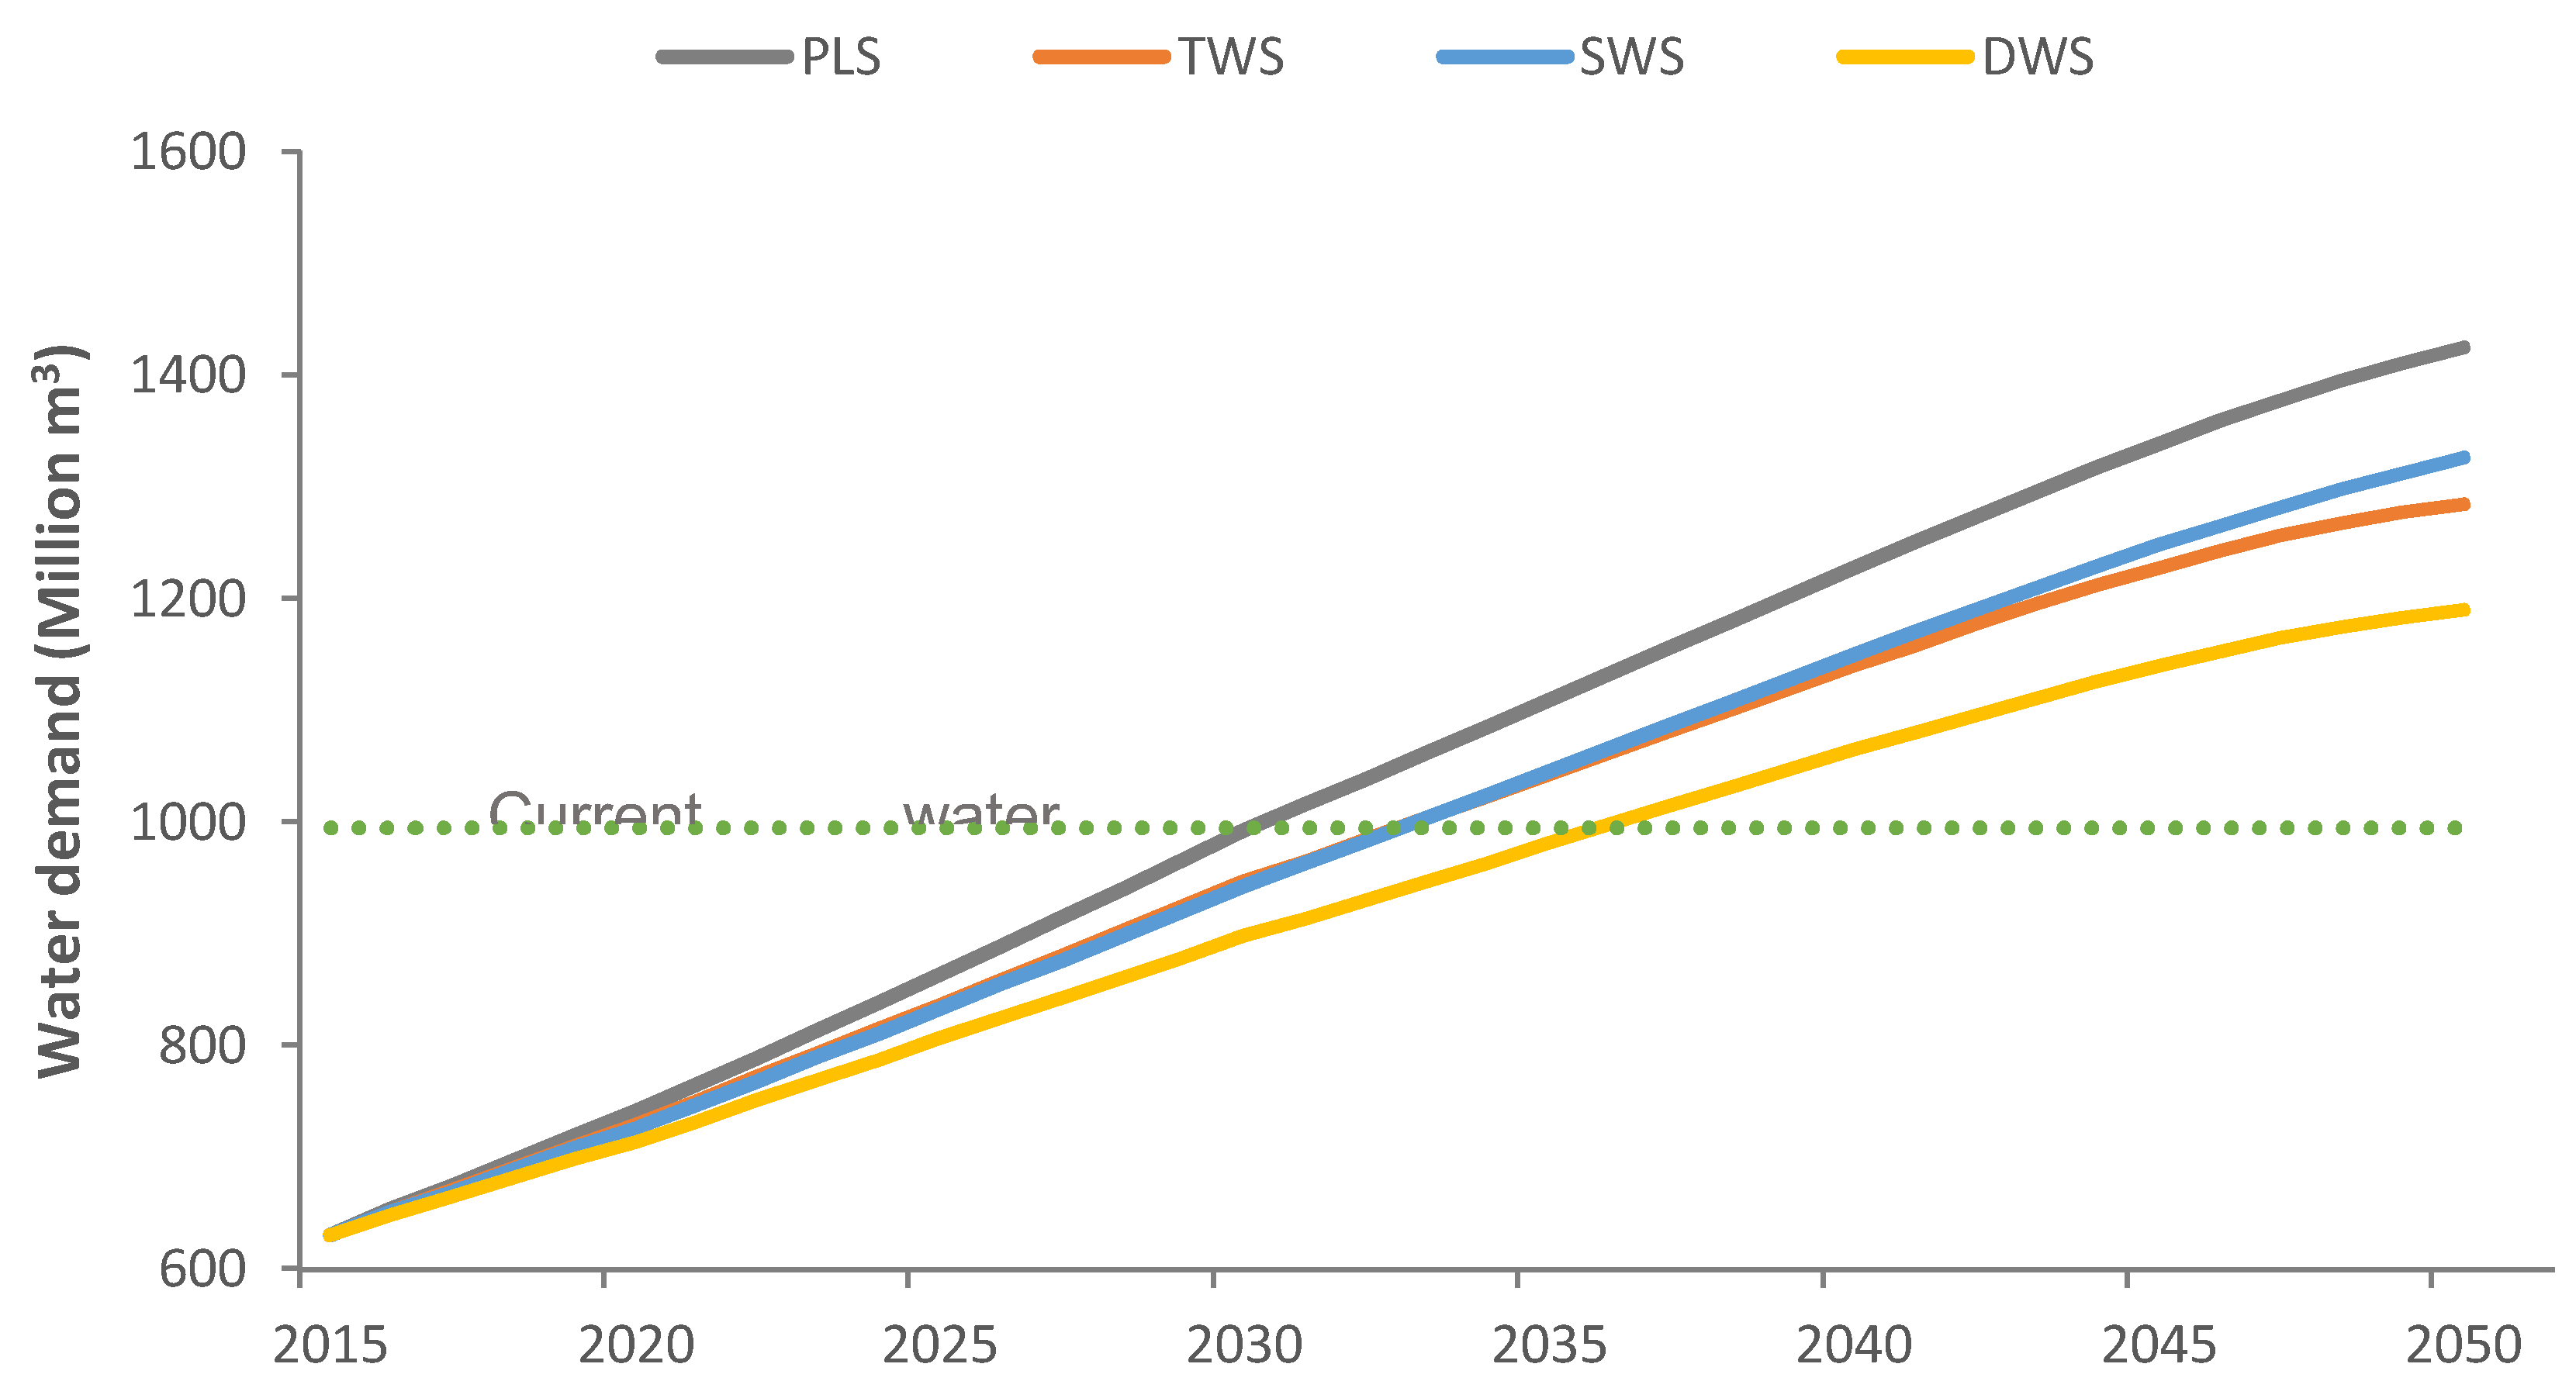
This study used WEAP to estimate the impact of various economic and social development scenarios on water demand in Xiamen between 2015–2050 (Figure 3). Xiamen’s water consumption will greatly increase in all future scenarios due to increasing population size and economic development. Water consumption in planning scenarios (PLS) is growing faster, while in the double water-saving scenario (DWS) it is slower. Without new water supplies there will be water shortages after 2030 for all scenarios.
The proportion of water used in each industry in 2015 and 2050 is shown in Table 4. In 2015, domestic demand, secondary industry and primary industry are the primary water consumers. In 2050, while domestic demand and secondary industry still consume the most water, it is projected that the water demand of tertiary industry will exceed that of primary industry and become the third major water user. The proportion of water demand from primary industry will decline dramatically from 20.33% to 4.35% in the future due to the reduction of agricultural land and the improvement of irrigation technology. However, the water demands of domestic demand and tertiary industry are expected to have the largest growth, because the population of Xiamen city will have increased by more than two times in 2050, and the tertiary industry will become the key development industry of Xiamen in the future. In 2050, by using the water-saving scenarios of the SWS and DWS, the proportion of water consumption from secondary industry will significantly reduce, compared with the PLS and TWS.
5.2. Water Saving Potential
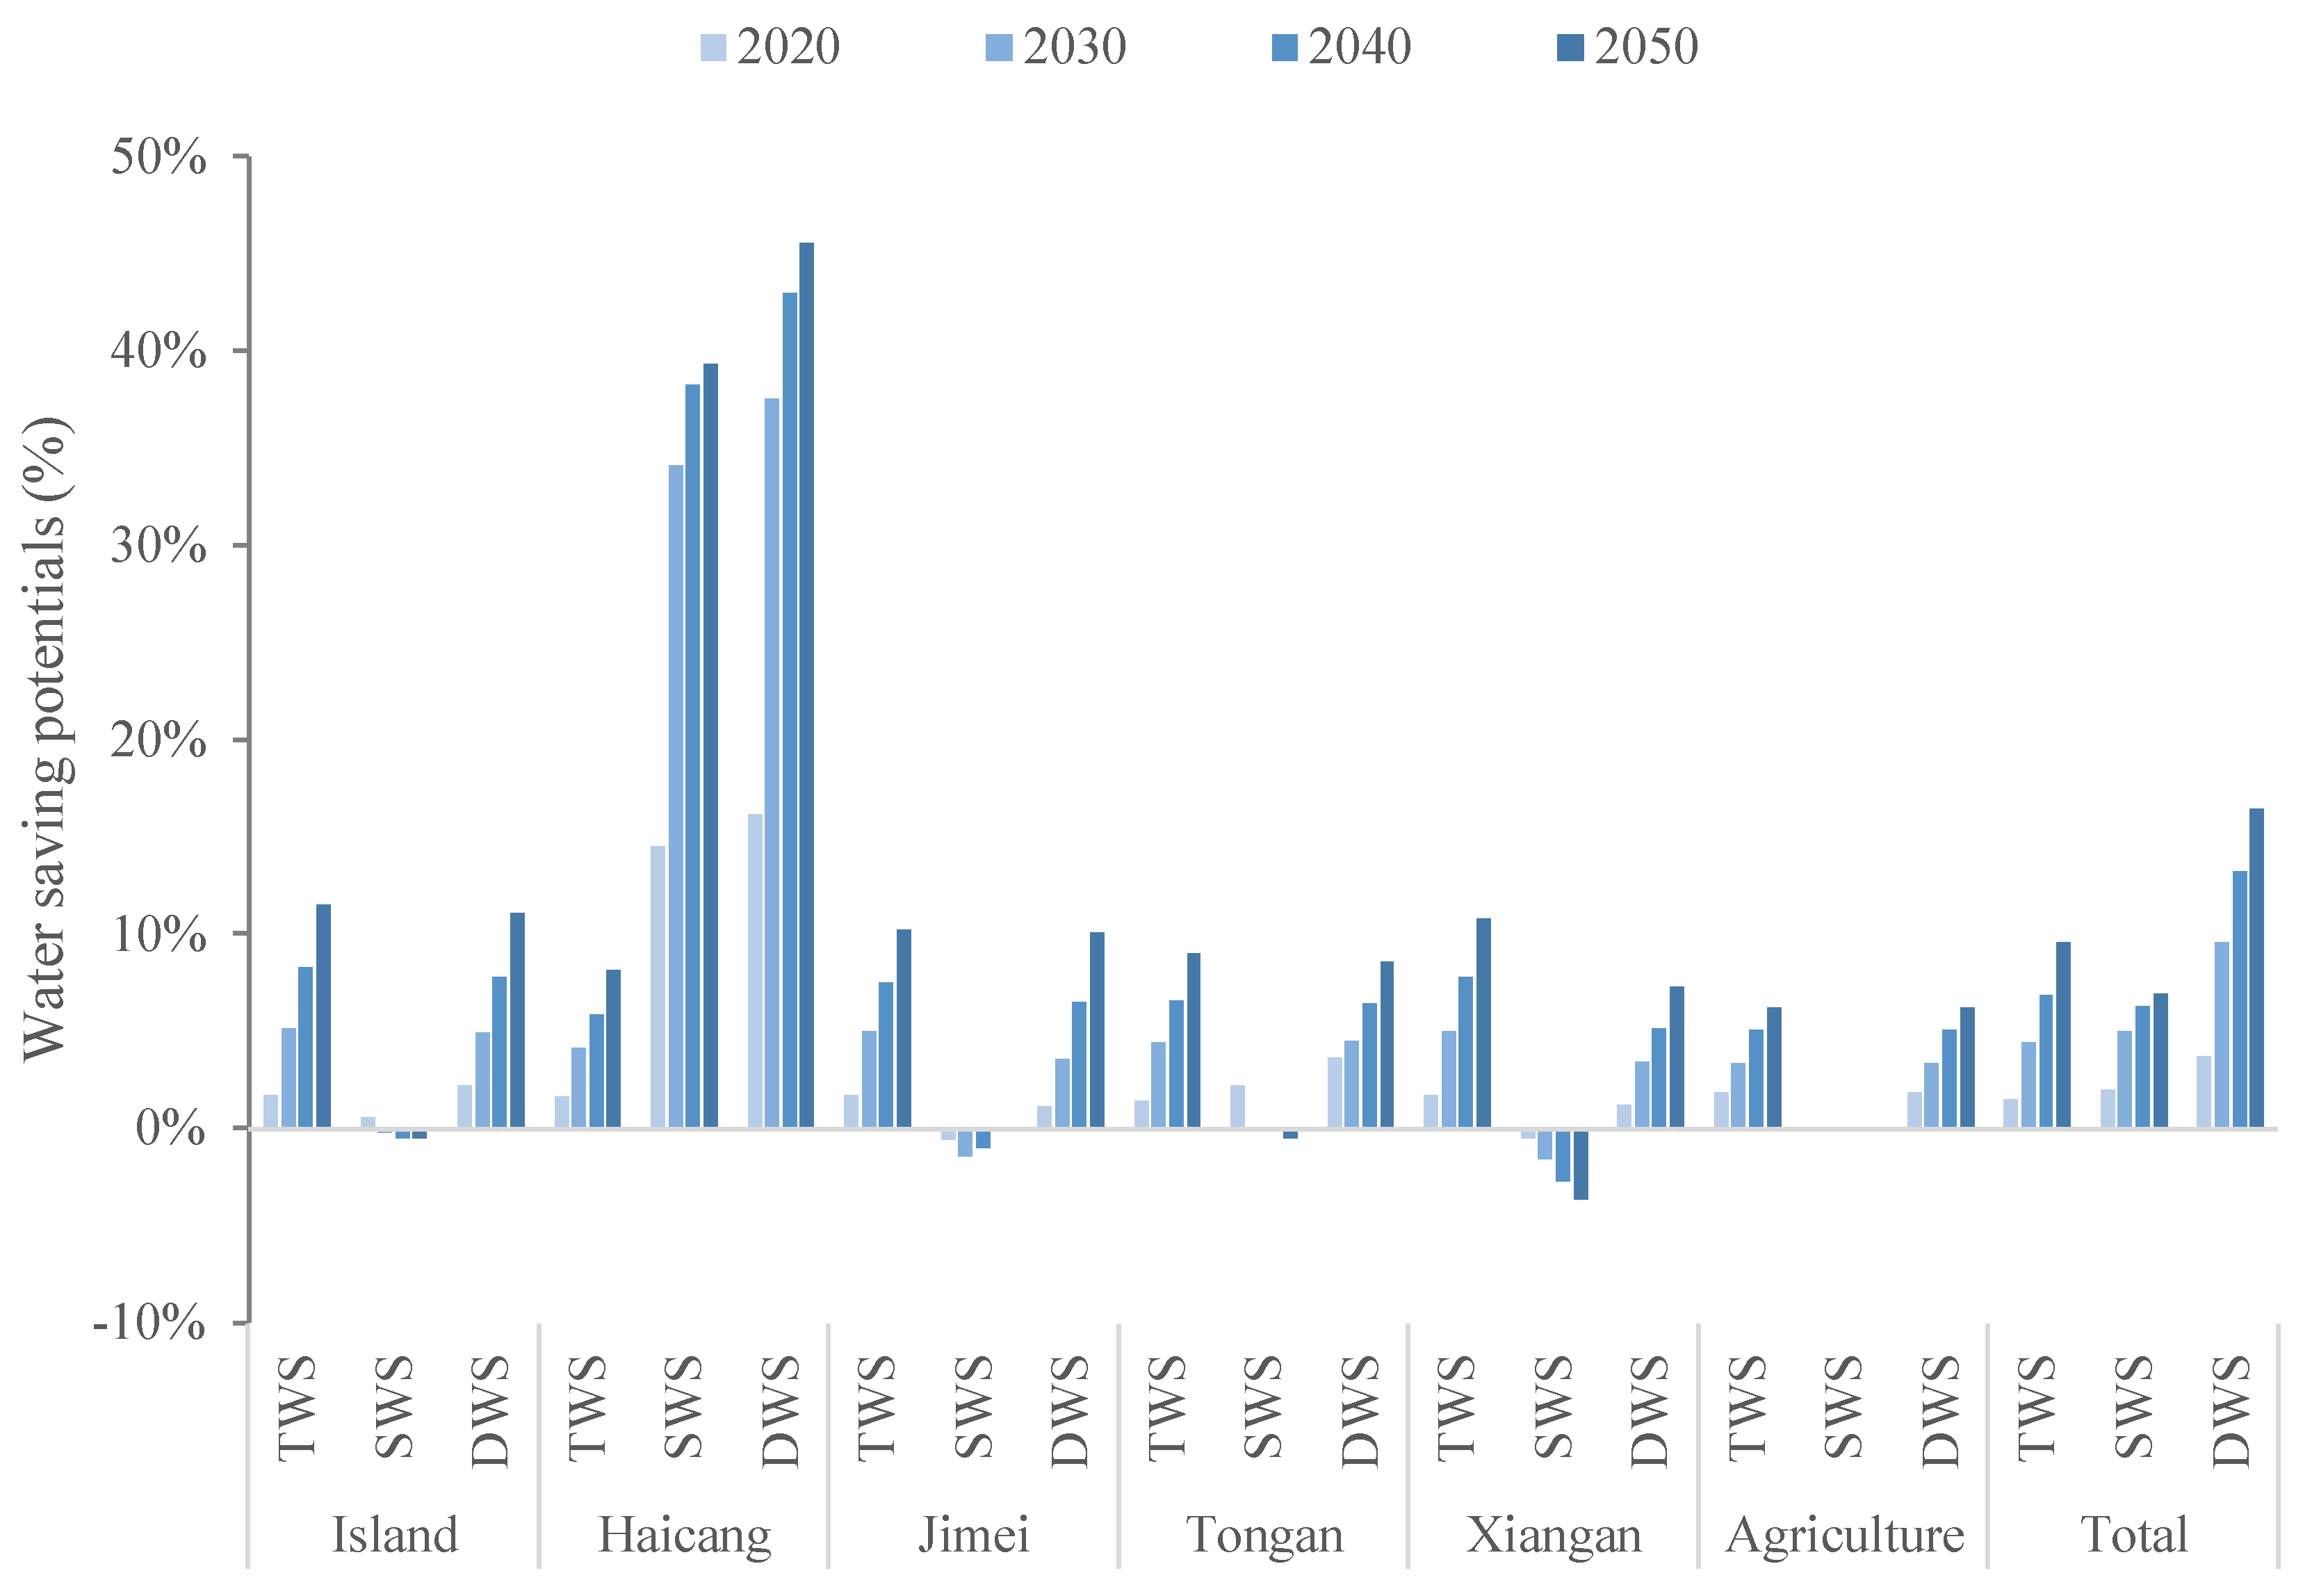
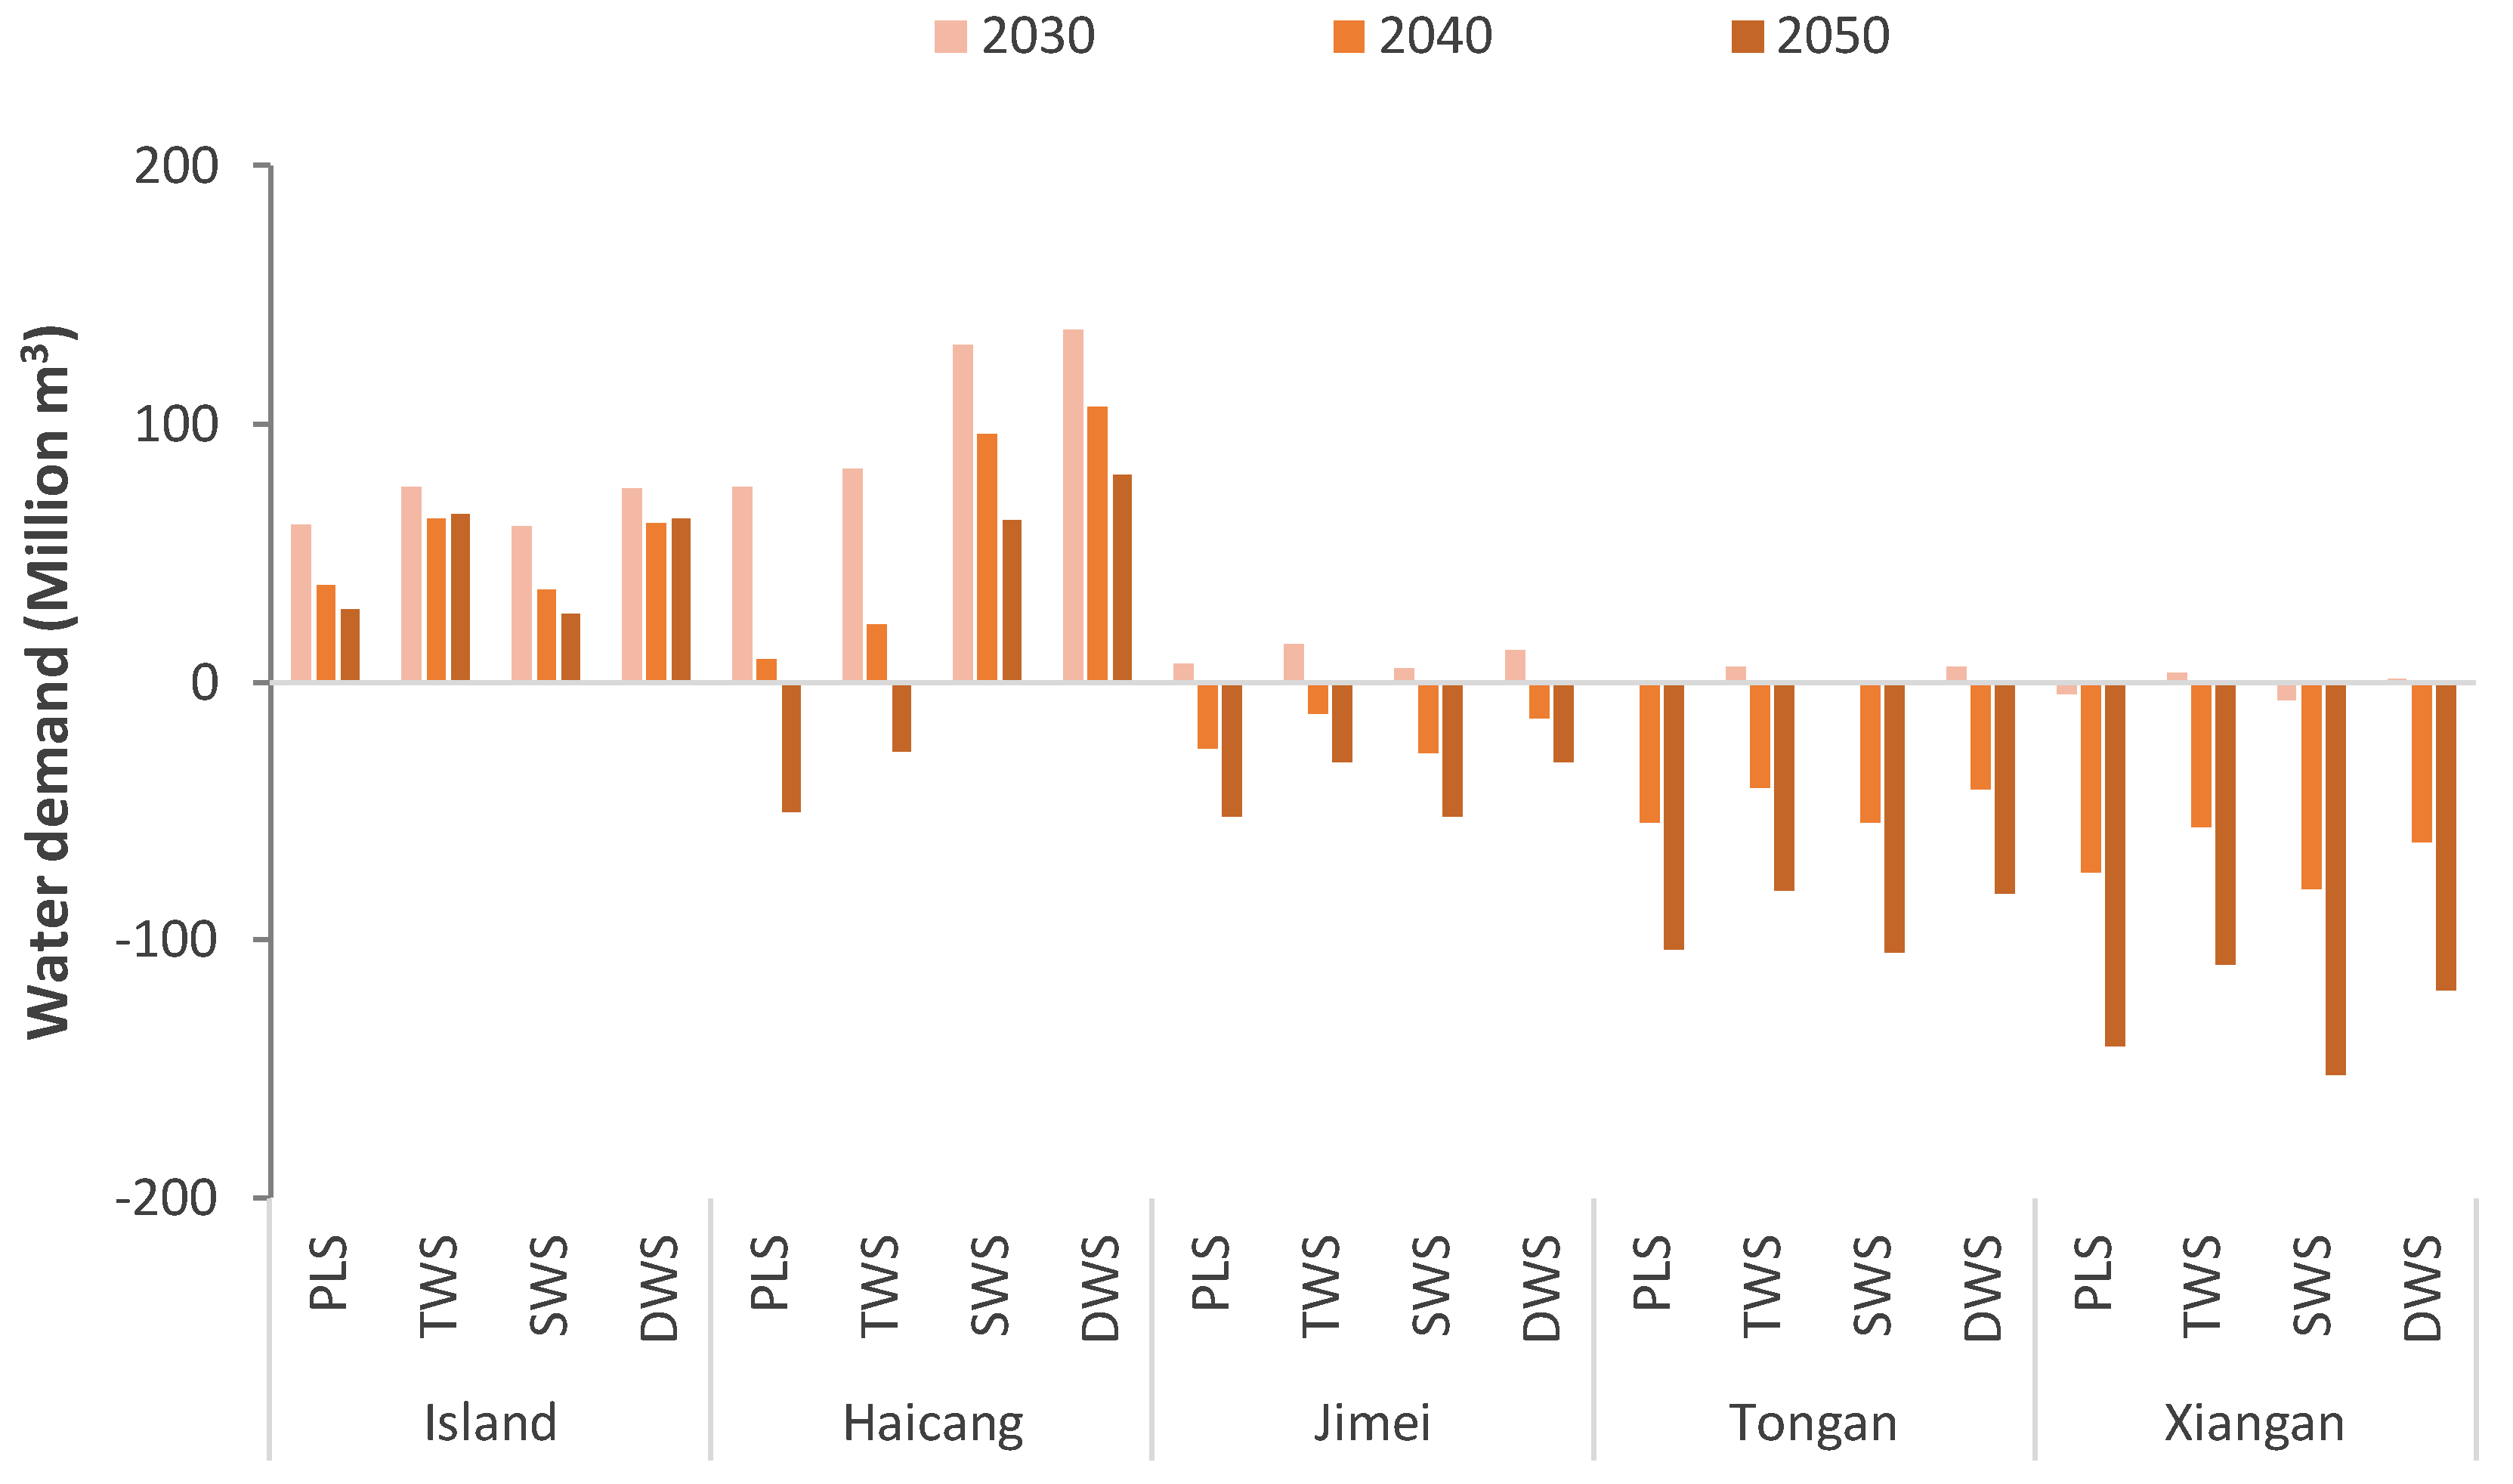
This study compared the water-saving potential in each district using the TWS, SWS, and DWS with PLS scenarios (Figure 4). The TWS measures will have a better water saving effect than the SWS in Xiamen City. In comparison with the PLS, the TWS will provide a city-wide water saving of 9.82% and the SWS will provide 6.97% savings by 2050. A combination of the TWS and SWS under the DWS scenario will result in 16.44% water savings compared with the PLS. The water consumption of every district will be reduced with the TWS, compared with the PLS, because the water efficiency of all industries will improve. The district water savings in 2050 with the TWS will vary from 8.16–11.54%, with the agricultural sector contributing an average saving of 6.27%. The SWS will substantially reduce water consumption in Haicang District by 39.39% in 2050, in comparison with the PLS. However, there will be slightly increased water consumption in other districts, especially the Xiangan and Jimei Districts under the SWS scenario. This will be due to changes in the industrial structure. The proportion of water-intensive industries will decline with the SWS. The water-intensive industries are mainly located in the Haicang District, and include the chemical, pharmaceutical manufacturing, and paper and printing industries. Concurrently, there will be an increase in the proportion of water-efficient industries such as electronics, electronics manufacturing and equipment manufacturing, especially in the Xiangan, Tongan and Jimei Districts. In the SWS, the water demand in Xiangan District will substantially decline, while in other districts it will slightly increase. In total, Xiamen City has the greatest future water savings potential with the use of DWS, especially in Haicang District.
5.3. Water Shortages under Different Scenarios
Xiamen City will have water shortages after 2030 for all the evaluated scenarios in the absence of new water supplies (Figure 3). Waterworks deficiencies will sequentially appear after 2030 in the Xiangan, Tongan, Jimei, and Haicang Districts under all scenarios due to increasing water demand and the limitations of the capacity of the existing waterworks (Figure 5). Most development will occur on the mainland due to the limited available space for development in the island districts. The Xiangan and Tongan Districts have the most space for future development, and will likely experience large population increases and industrial growth. This will cause increased water consumption and large waterworks capacity deficits for these districts. Consequently, there will be a need to prioritize building or expanding mainland waterworks to meet future water demands, especially in the Xiangan and Tongan Districts.
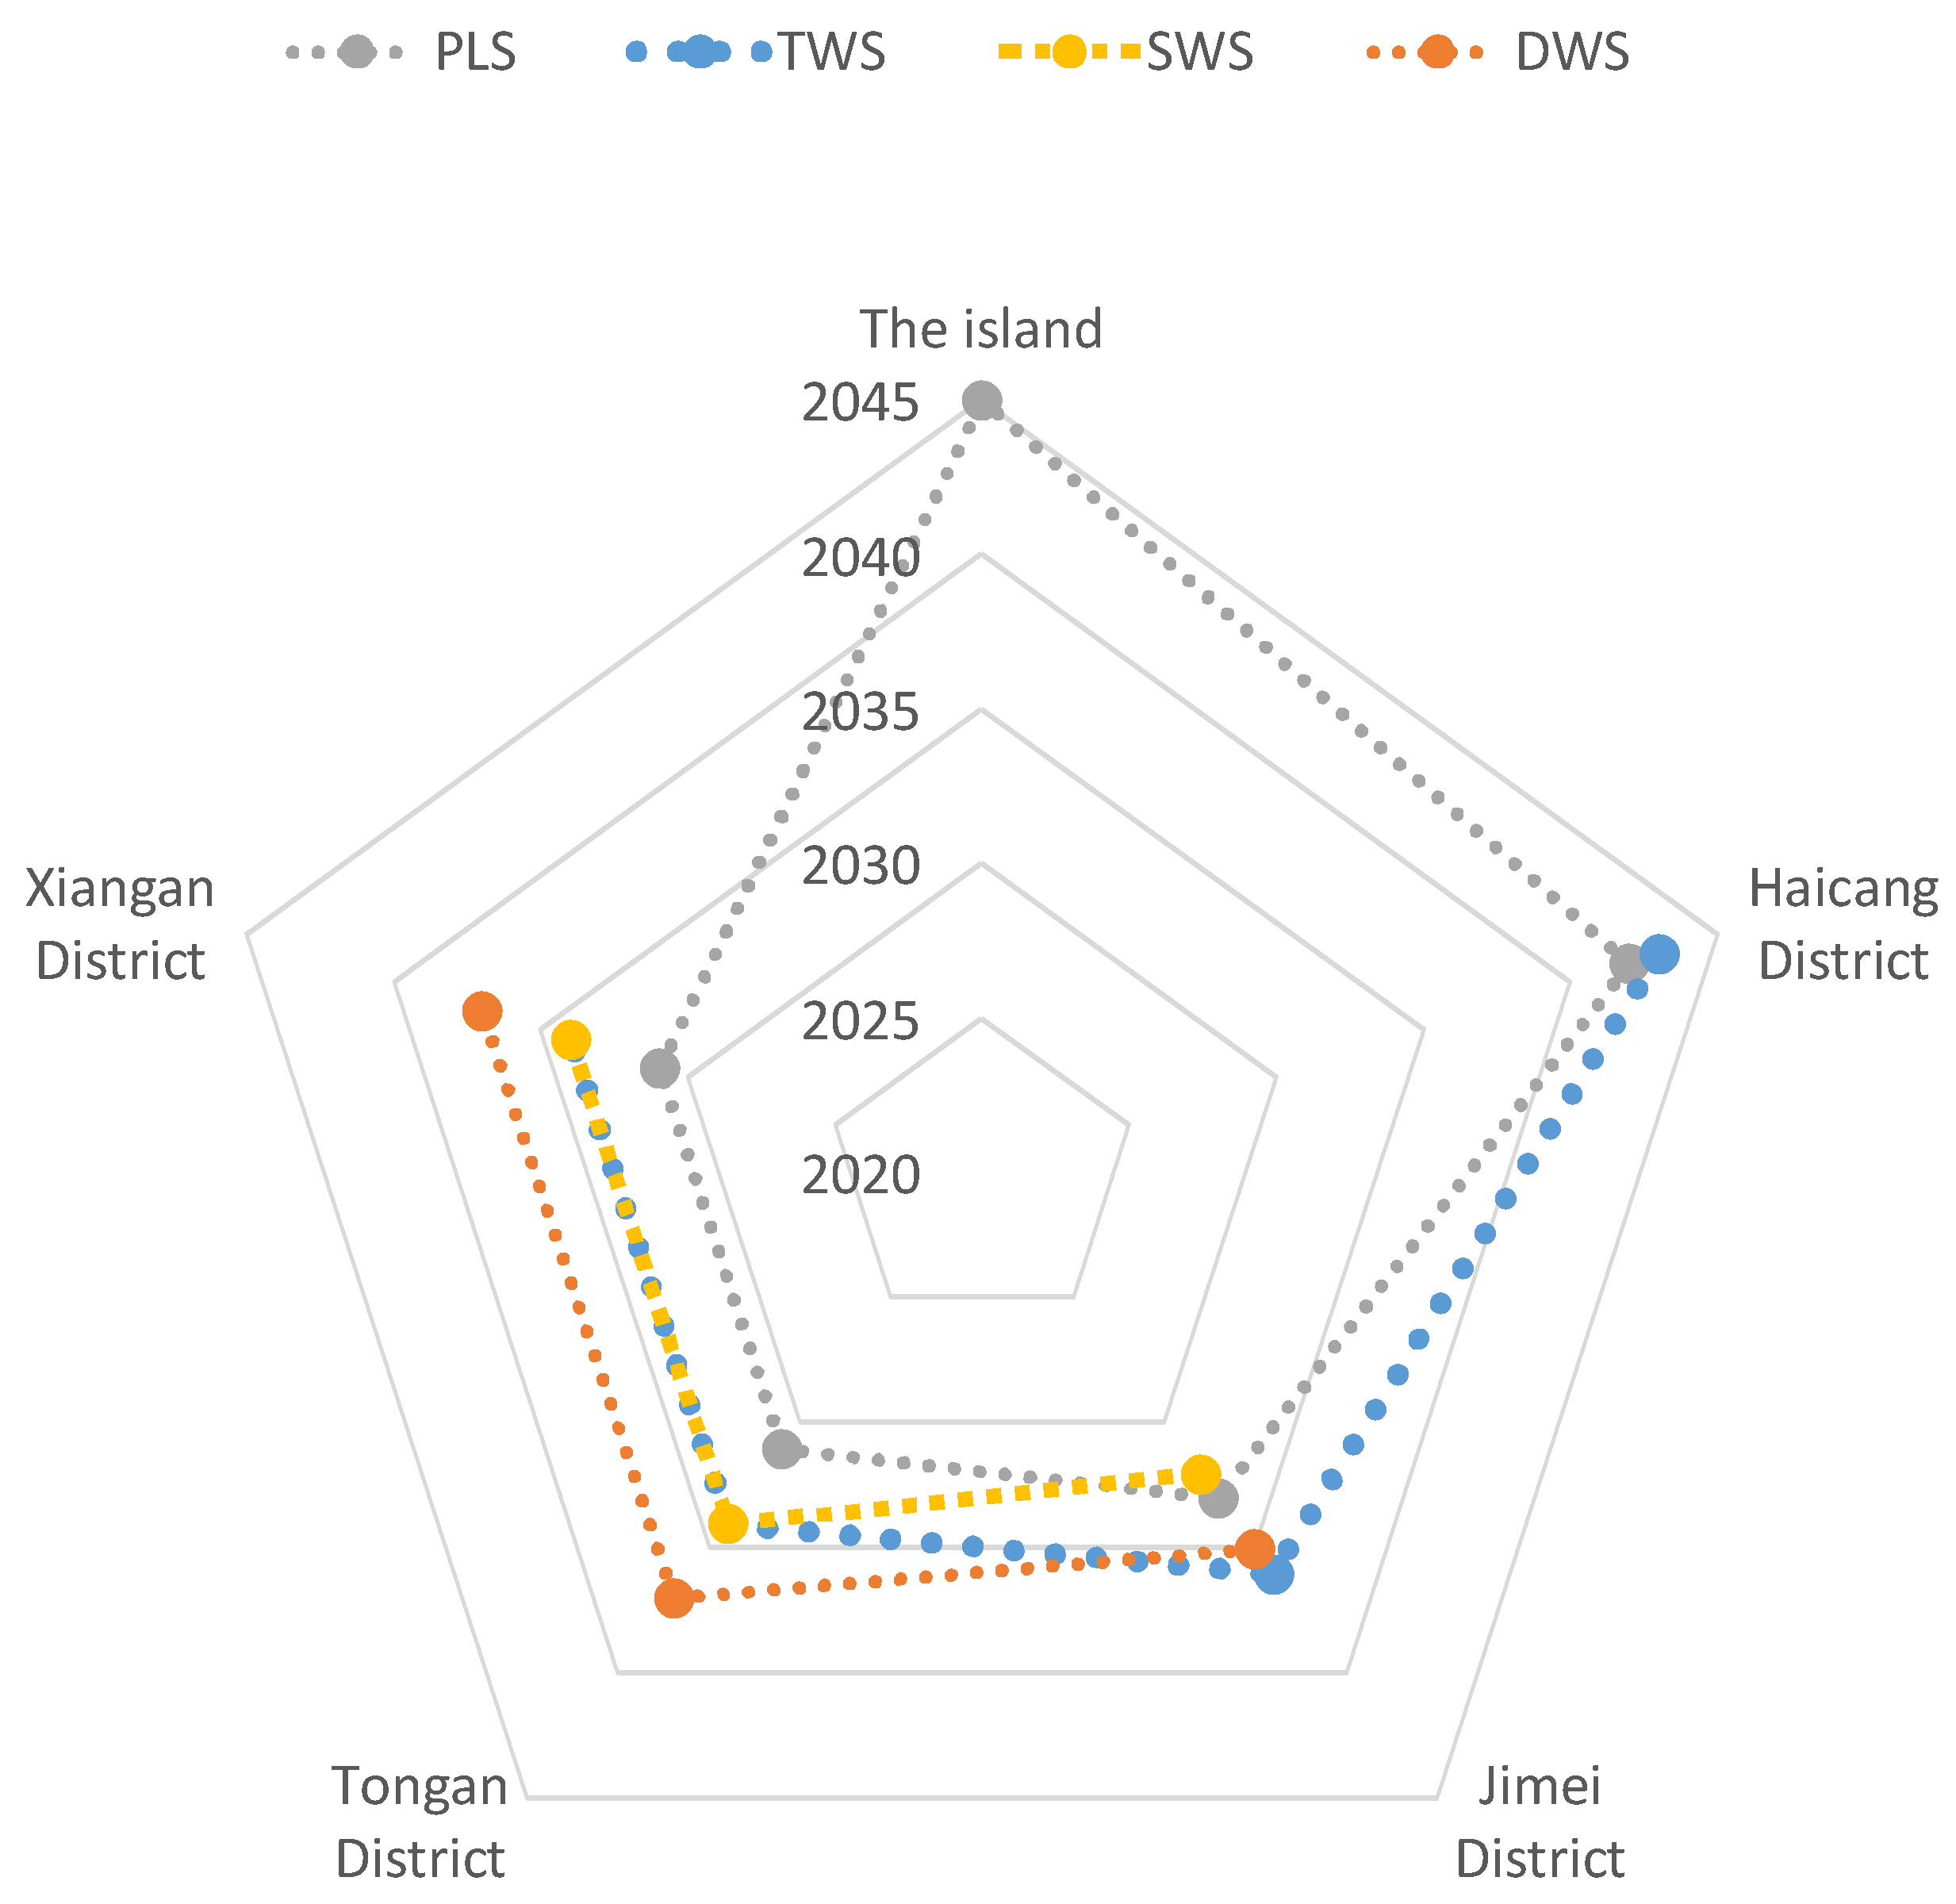
Water shortages will occur in Xiamen City due to insufficient waterworks capacity and the absence of new water supplies. Delays in water shortages can be achieved using the TWS (two years), SWS (three years), and DWS (five years), compared to the PLS. The water shortages will vary by district, but will occur with each scenario (Figure 6). If the water-saving scenarios (TWS, WSW, DWS) are adopted for the island, there will be no water shortages, although water shortages will occur in 2045 with the PLS scenario. If the WSW or DWS water-saving scenarios are adopted in Haicang District, there will be no water shortages, although water shortages will occur in 2042 and 2043 with the PLS and TWS scenarios, respectively. In the Tongan Districts and Xiangan Districts, water shortages will be delayed if the water-saving scenarios (TWS, SWS and DWS) are adopted In Jimei District, adopting the SWS cannot delay the water shortages compared to the PLS, whereas the TWS and DWS can. In general, water shortages will first occur in the Tongan and Xiangan Districts due to low water supply priorities and capacities in eastern Xiamen City. In contrast, the ongoing water diversion project from Jiulongjiang will prioritize meeting the water demands of the island and western districts. Jimei District water shortages will subsequently occur due to a waterworks shortage. This will be followed by water shortages on the island and in the Haicang District due to water supply limitations.
5.4. Water Supply Alternatives
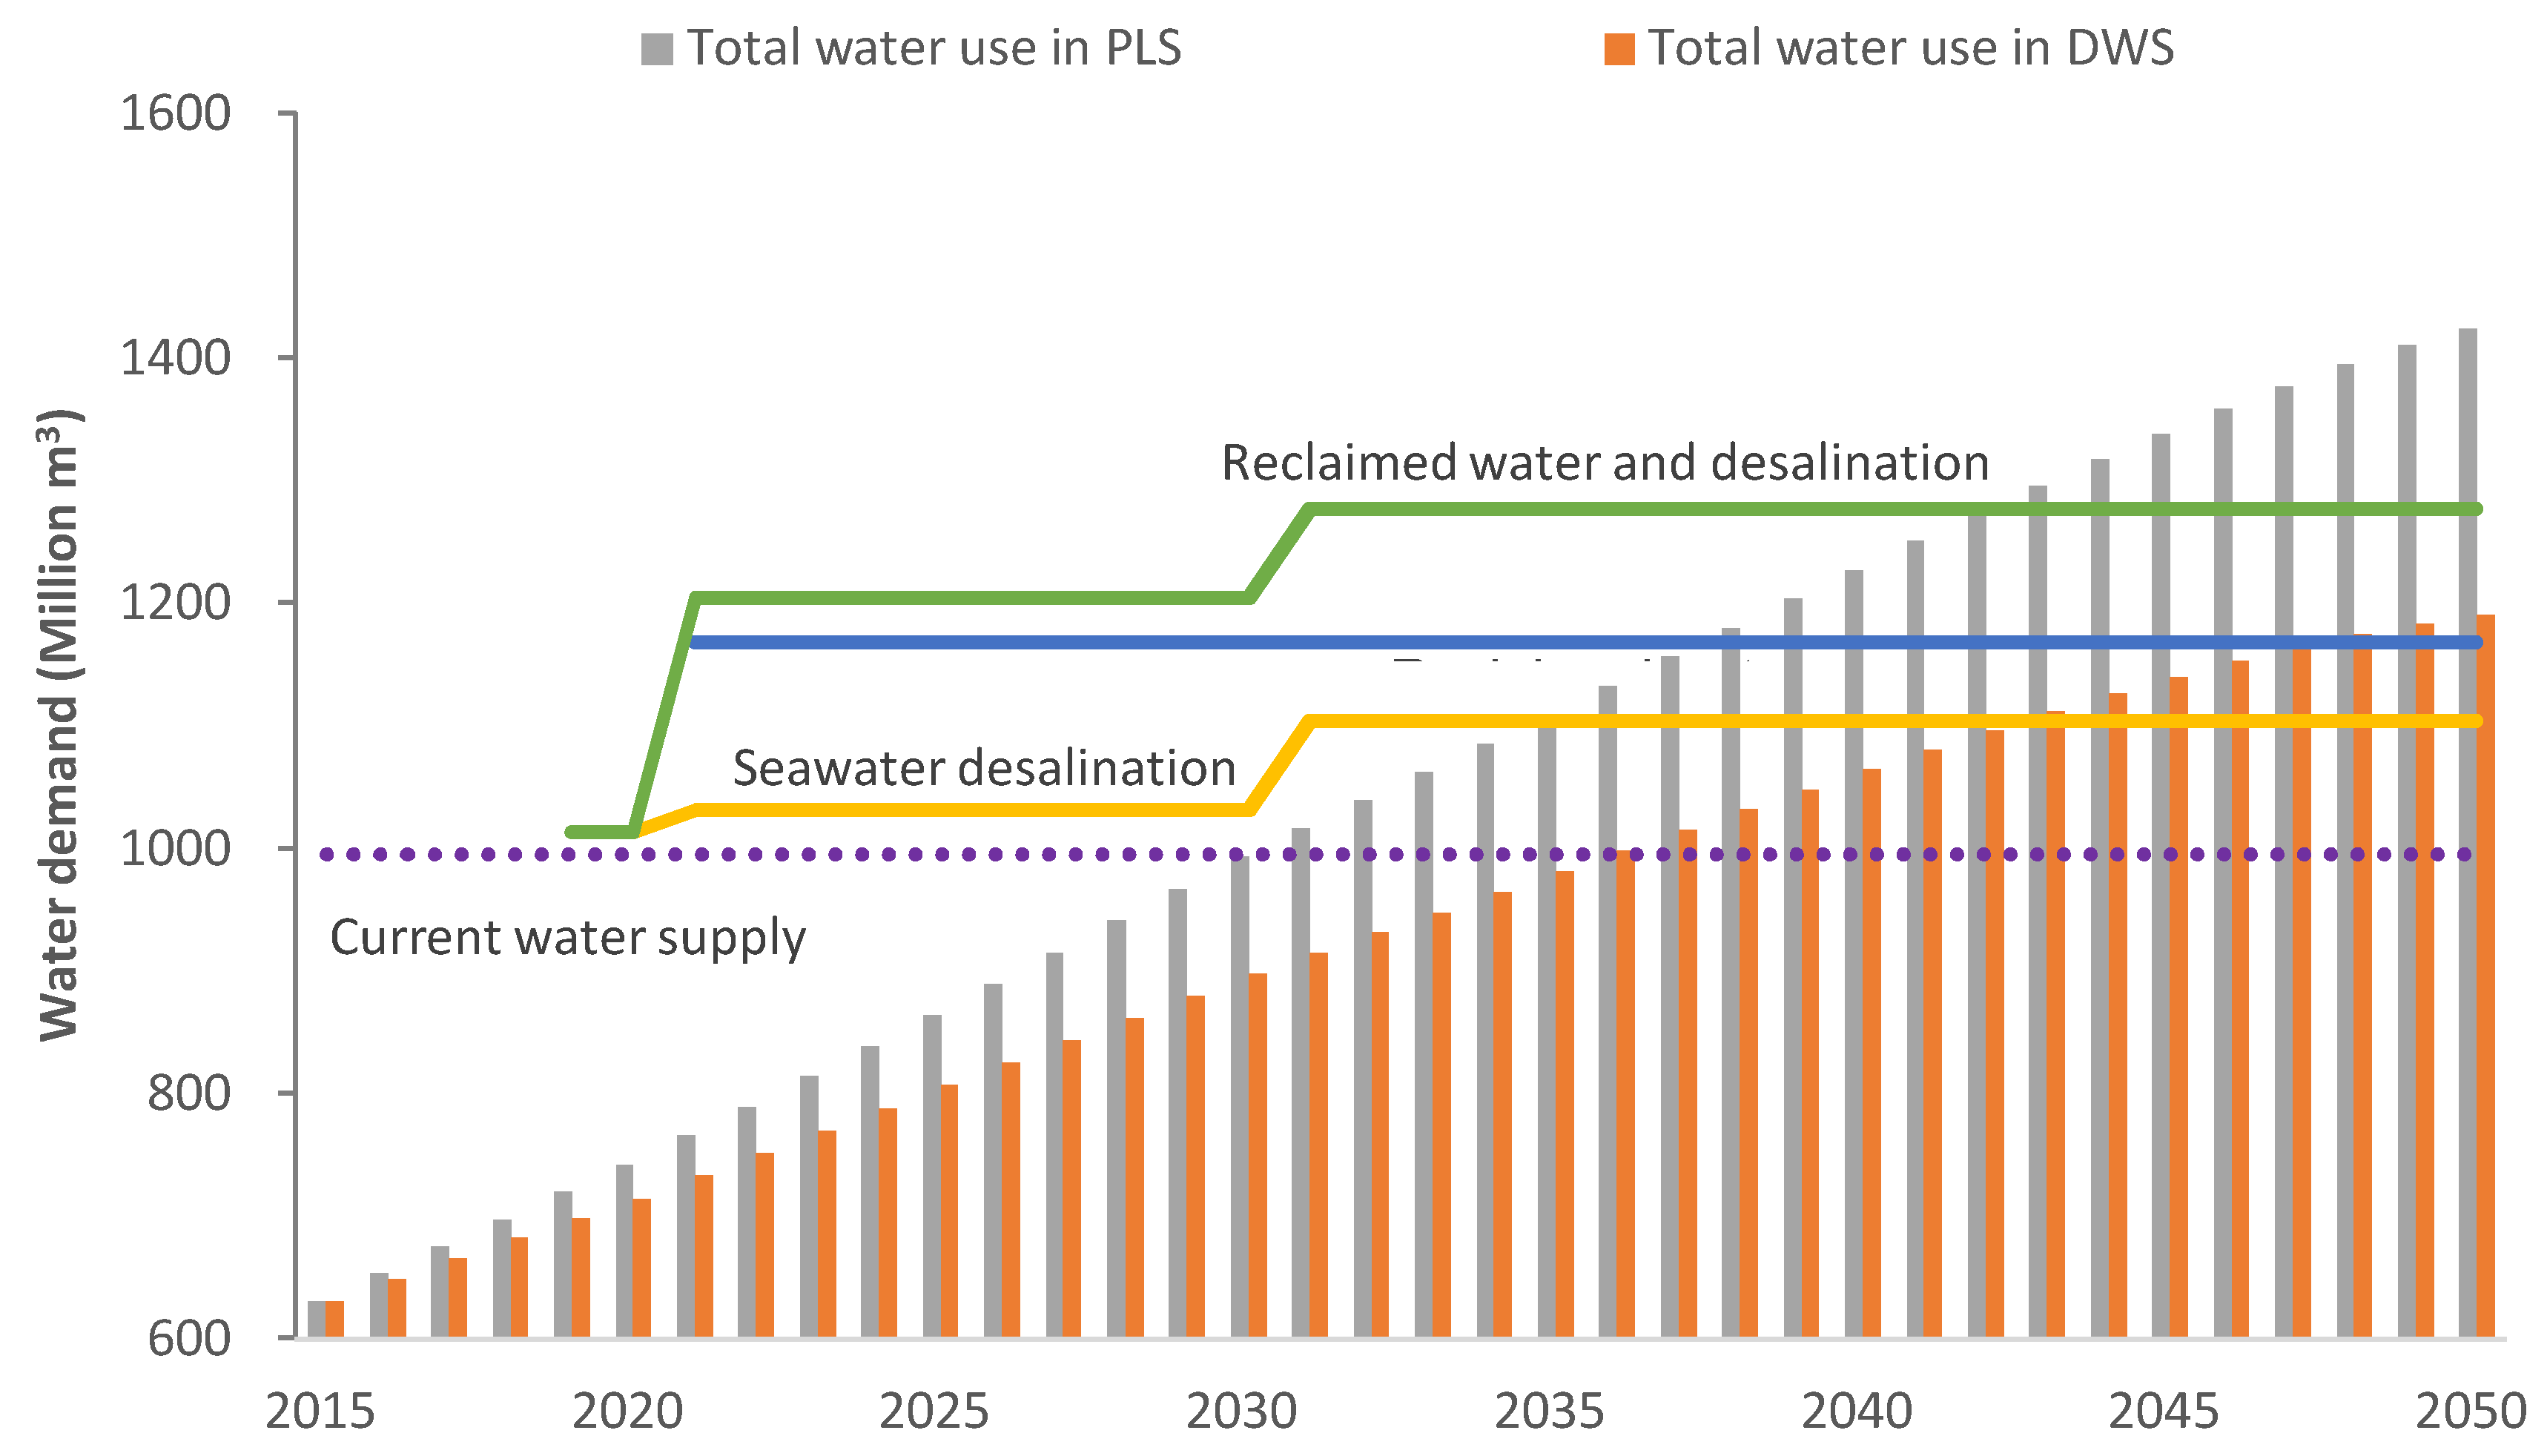
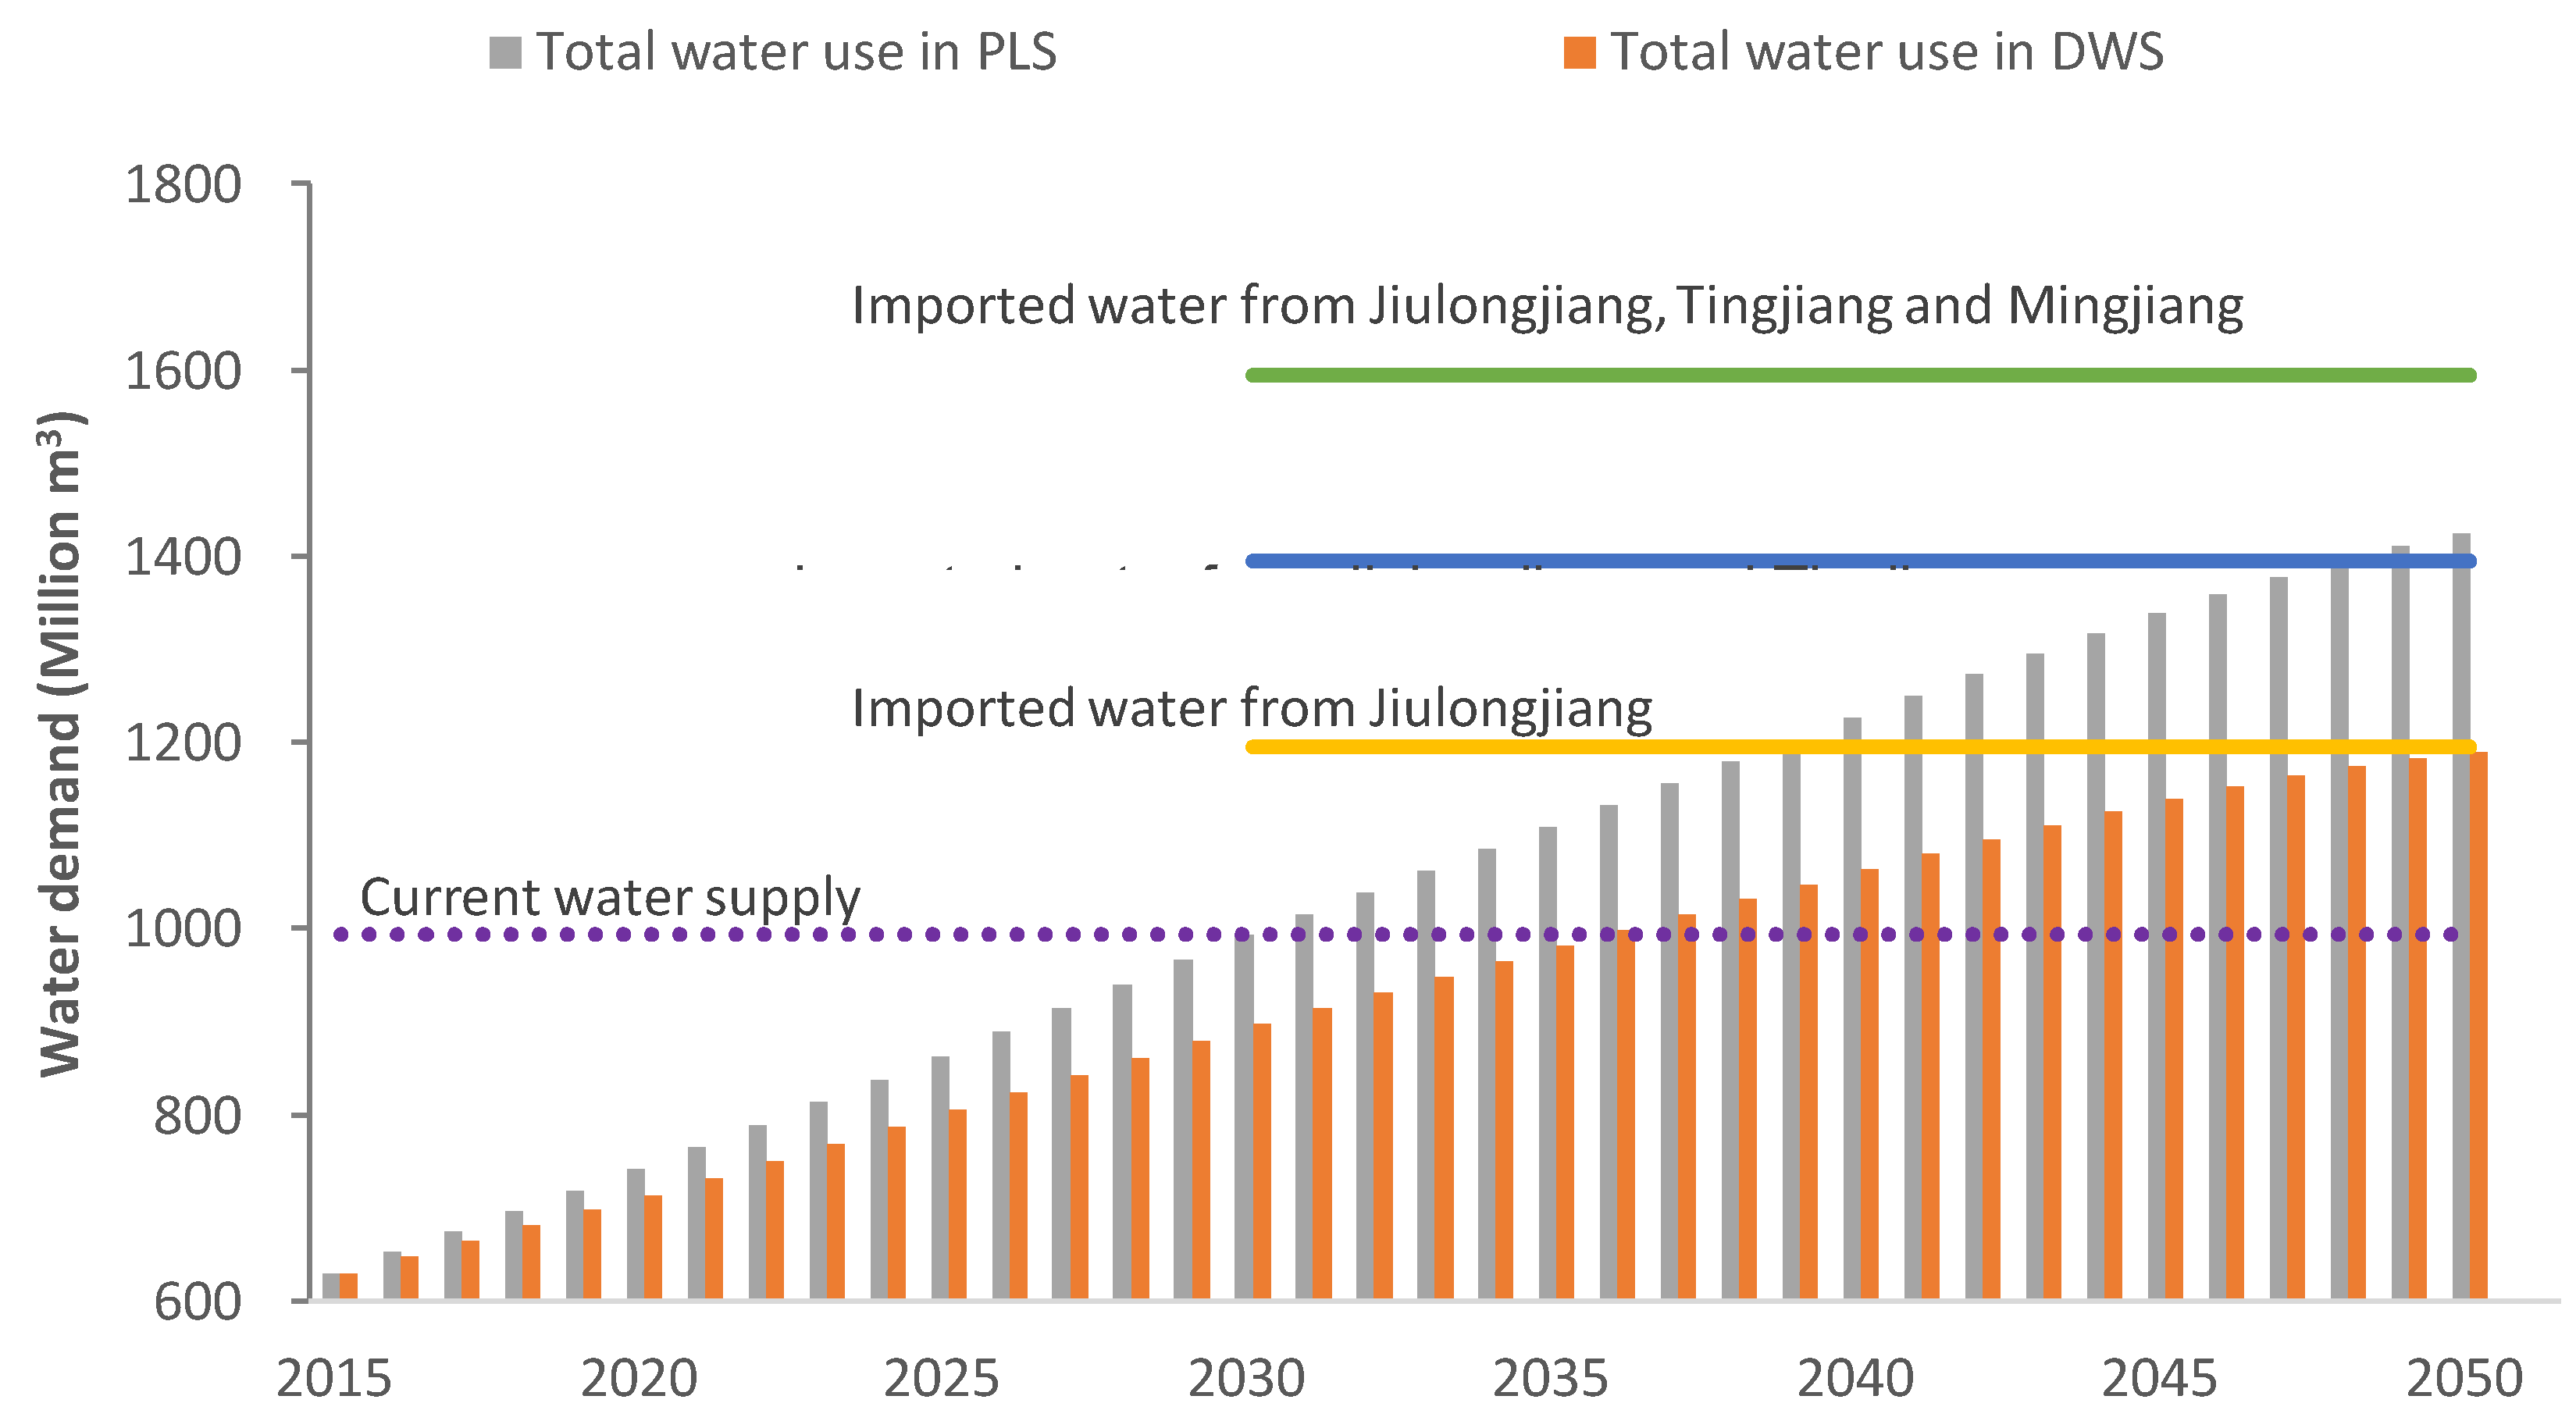
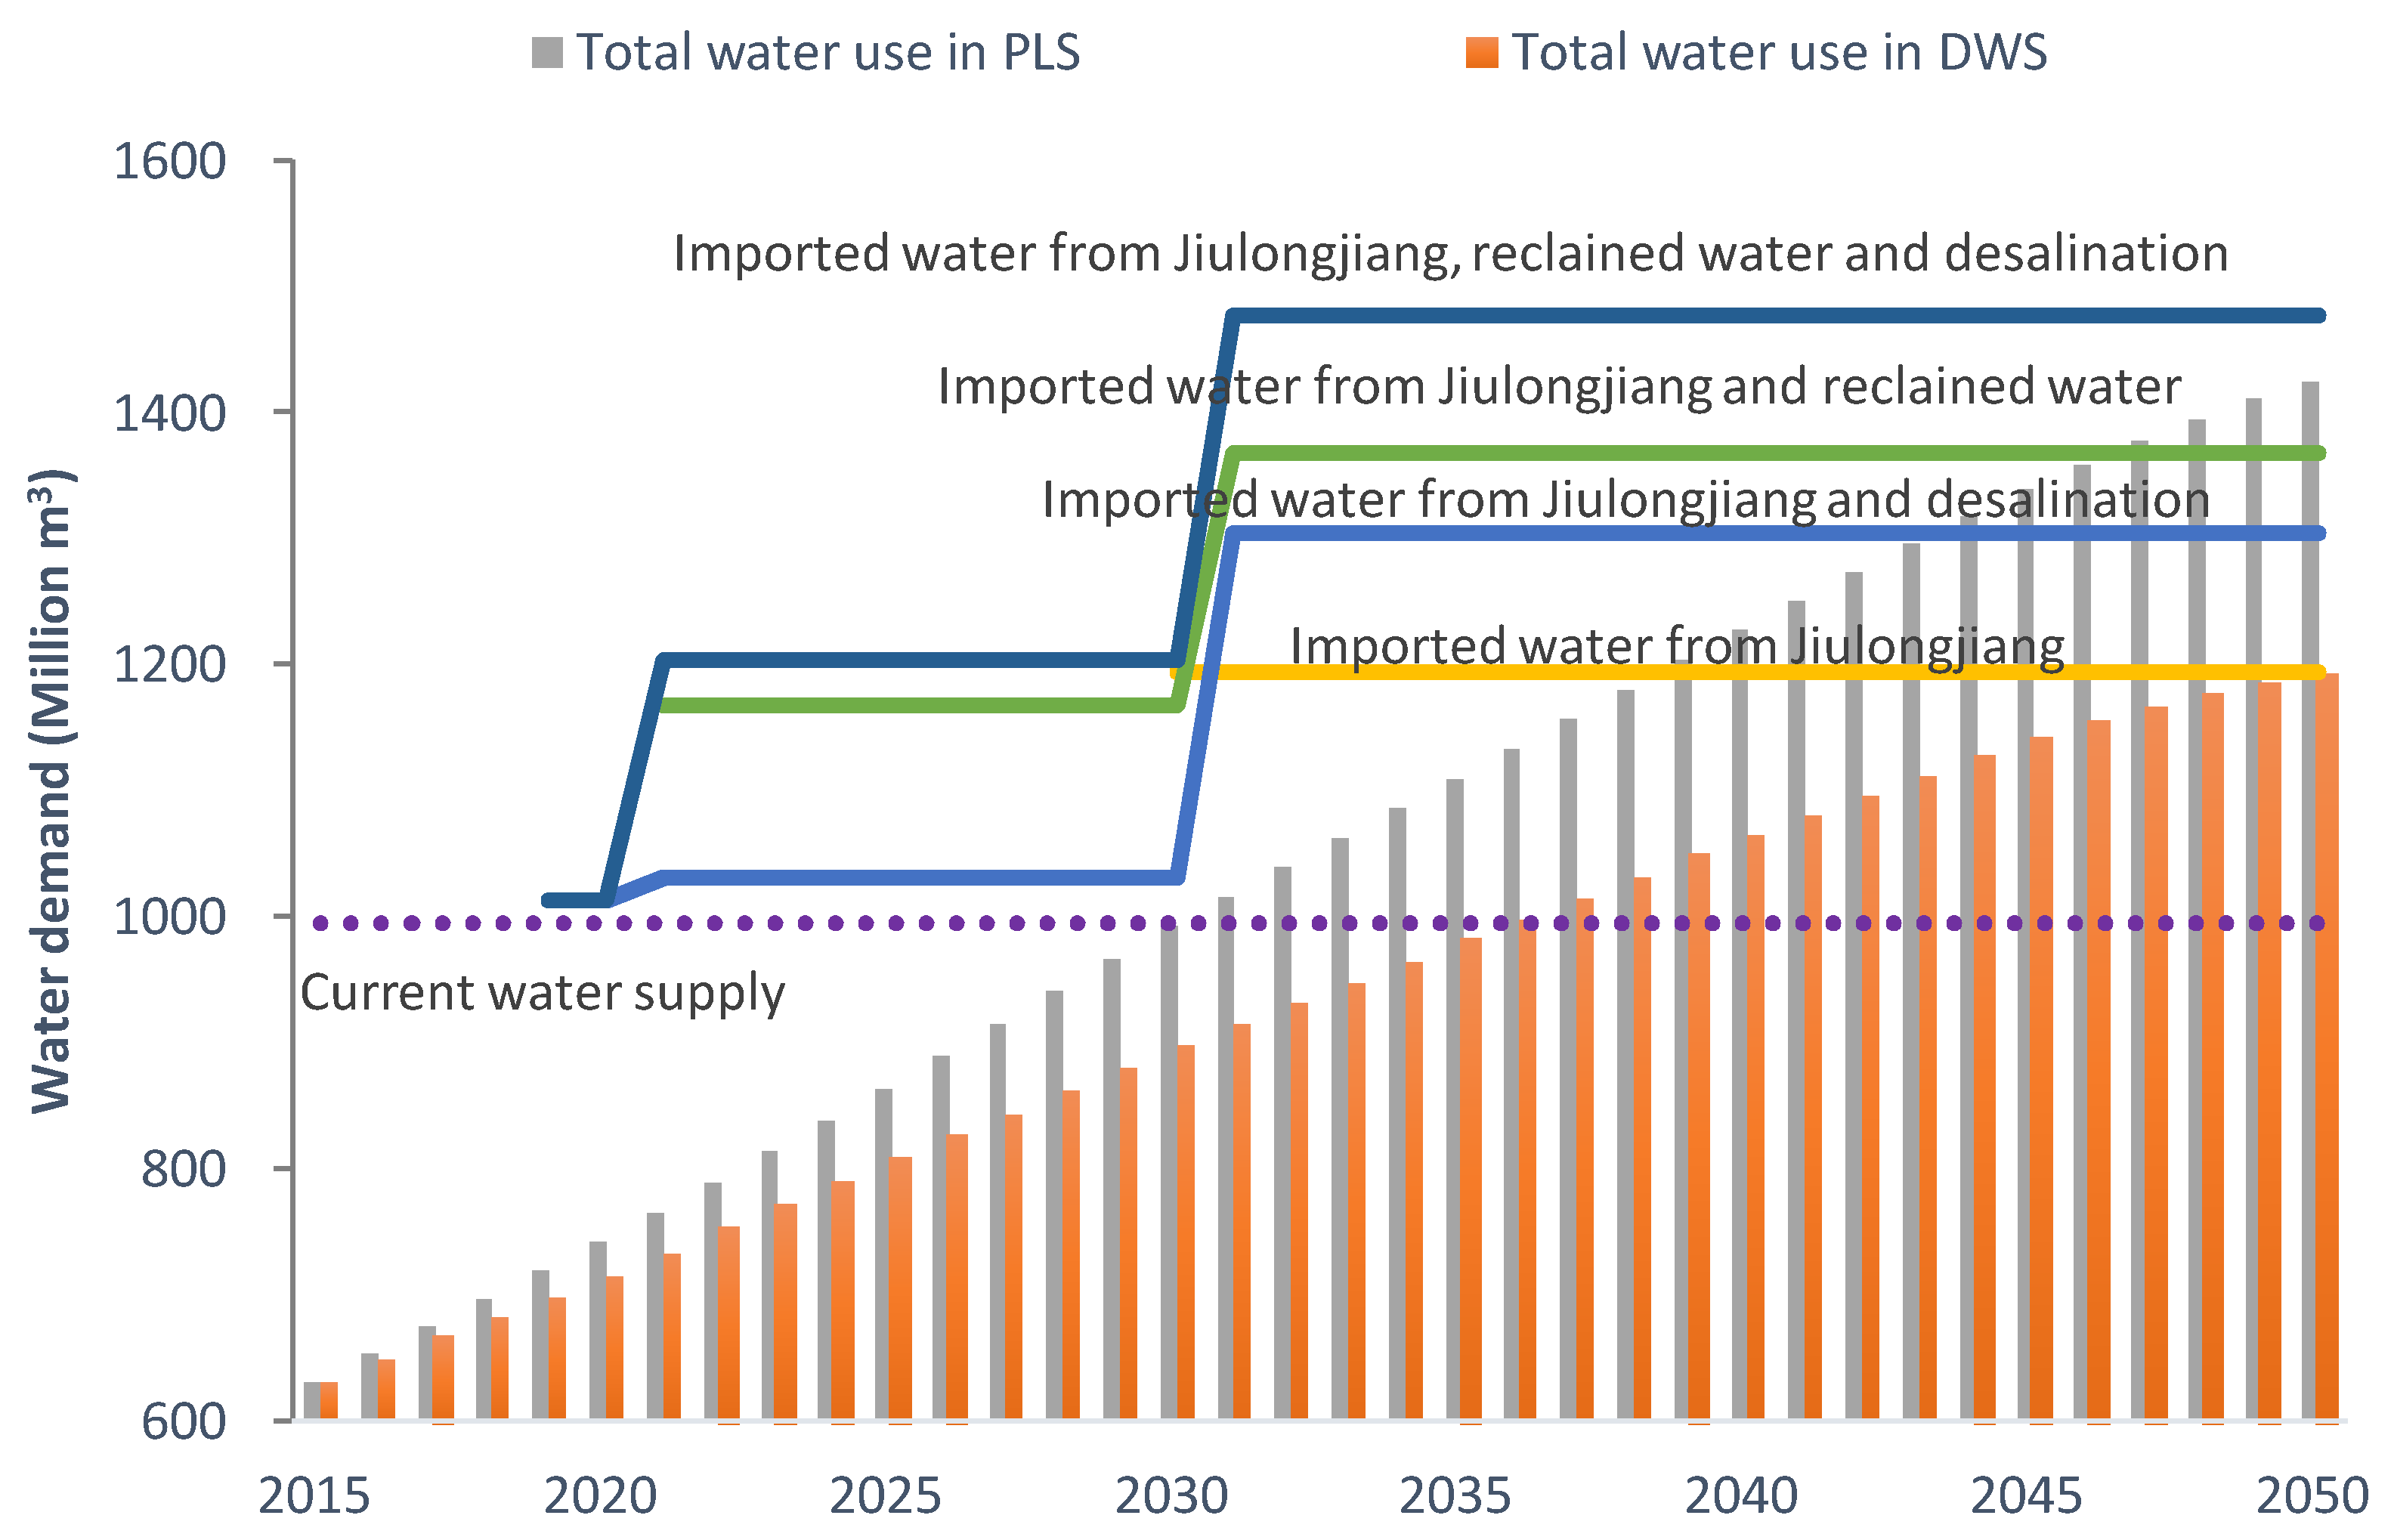
Water supply alternatives include the use of local water resources and trans-basin water diversion (Figure 7, Figure 8 and Figure 9). Considering only local water resources, including reclaimed water and seawater desalination, will result in water shortages in 2043 under the PLS scenario (Figure 7). The application of the scenario (DWS) with the greatest water savings will permit local water resources to meet Xiamen City’s future demands by combining technical and structural water savings. Reclaimed water use is currently limited to green areas and recycled water is limited to watering plants, and seawater desalination is currently prohibitive in cost. Thus, there will be substantial infrastructure and operation costs for the large-scale use of these two water sources. Projections that use only trans-basin water diversion (from the Jiulongjiang, Tingjiang, or Mingjiang basins) under the PLS will result in each channel providing 200 million m3 of water to Xiamen City (Figure 8); whereas only one water diversion channel would be required if the DWS is used. The most economical solution for reducing the construction and operational costs under the PLS scenario is a combination of reclaimed water and imported water from Jiulongjiang (Figure 9). Nevertheless, expensive water supplies (seawater desalination and trans-basin water diversion from longer distances) will need to be considered after 2047 if additional water saving measures at not enacted. In all alternative scenarios, the best way to avoid future water shortages is by combining new water supplies and water saving measures.
6. Conclusions
The authors used a WEAP-based water resource simulation model for Xiamen City that considered five water demand subsystems and their water supply–demand relationship with several sectors. The allocation of water resources among Xiamen City’s districts was also evaluated as a finer-scale assessment in comparison to whole city’s water balance, which has been considered in most previous studies. In addition, the water resource supply and demand, as well as water saving potentials, were projected from 2015 to 2010 under different development scenarios. Our main research findings were:
Xiamen City’s water consumption will greatly increase under all scenarios because of economic development and population increases. The SWS and TWS scenarios can provide water savings of 6.97% and 9.82% by 2050, respectively, relative to the PLS scenario. The most efficient water savings are achieved under the DWS scenario, which can potentially achieve 16.44% water savings compared with the PLS scenario by 2050. The TWS scenario can reduce water consumption in each of Xiamen’s districts, whereas the SWS scenario mainly reduces water consumption in the Haicang district. The DWS scenario can also reduce water consumption in every district, with a marked reduction occurring in the Haicang District.
Water shortages will occur after 2030 under all scenarios without new water supplies. Waterworks deficiencies will sequentially appear after 2030 in the Xiangan, Tongan, Jimei, and Haicang Districts under all scenarios, due to increasing water demand and the limitations of the capacity of the existing waterworks. Delays in these shortages can be respectively achieved under the TWS (two years), SWS (three years), and DWS scenario (five years), in comparison to the use of the PLS scenario. Water shortages will first occur in the Tongan and Xiangan Districts due to their low priority for receiving water supplies and poor water supply capacity. The most economical supply solution is a combination of imported water from Jiulongjiang and reclaimed water under the PLS scenario. However, high-cost water supplies (seawater desalination and longer trans-basin water diversion) are also needed to meet the projected water demand by 2047. If the largest water saving scenario (DWS) is enacted, only one new imported delivery channel will be needed. For all alternatives, the best way to avoid water shortages is by combining new water supply and water saving measures.
Author Contributions
This manuscript is the result of the research of L.K. under the supervision of J.L. and the advising of X.L. and J.K. All authors designed the study, developed the methodology, discussed the results and wrote the paper.
Funding
This research was funded by the National Natural Science Foundation of China (grant numbers 71573242 and 71273252).
Acknowledgments
The authors also appreciate the support from the Water Resources Department of Xiamen City, the Support the water bureau of Xiamen City.
Conflicts of Interest
The authors declare no conflict of interest.
References
- Mekonnen, M.M.; Hoekstra, A.Y. Four billion people facing severe water scarcity. Sci. Adv. 2016, 2, e1500323. [Google Scholar] [CrossRef] [PubMed] [Green Version]
- World Economic Forum (WEF). Global Risks 2015, 10th ed.; World Economic Forum: Geneva, Switzerland, 2015. [Google Scholar]
- Department of Economic and Social Affairs (DESA). The World Urbanization Prospects; Economic & Social Affairs; Department of Economic and Social Affairs: New York, NY, USA, 2014. [Google Scholar]
- Larsen, T.A.; Hoffmann, S.; Lüthi, C.; Truffer, B.; Maurer, M. Emerging solutions to the water challenges of an urbanizing world. Science 2016, 352, 928–933. [Google Scholar] [CrossRef] [PubMed]
- Paterson, W.; Rushforth, R.; Ruddell, B.L.; Konar, M.; Ahams, I.C.; Gironás, J.; Mijic, A.; Mejia, A. Water Footprint of Cities: A Review and Suggestions for Future Research. Sustainability 2015, 7, 8461–8490. [Google Scholar] [CrossRef] [Green Version]
- Liu, J.; Yang, W. Water sustainability for China and beyond. Science 2012, 337, 649–650. [Google Scholar] [CrossRef] [PubMed]
- National Bureau of Statistics (NBS). China’s Urbanization Rate Reached 56.10% in 2015; National Bureau of Statistics: Beijing, China, 2015.
- Li, X.; Shan, Q. Urbanization in the transition period: International experience and China’s prospects. Econ. Inf. 2013, 11, 151–154. [Google Scholar]
- Shi, C.; Jin, T.; Ren, H. Review on Studies about Typical Models of Water Resource Management. J. Anhui Agric. Sci. 2015, 10, 249–250. [Google Scholar]
- Labadie, J.; Larson, R. MODSIM8.1: River Basin Management Decision Support System, User Manual and Documentation; Colorado State University: Fort Collins, FL, USA, 2007; pp. 85–88. [Google Scholar]
- Andreu, J.; Capilla, J.; Sanchís, E. AQUATOOL, a generalized decision-support system for water-resources planning and operational management. J. Hydrol. 1996, 177, 269–291. [Google Scholar] [CrossRef]
- Sieber, J. WEAP Water Evaluation and Planning System. In Proceedings of the 3rd International Congress on Environmental Modelling and Software, Burlington, VT, USA, 9–13 July 2006. [Google Scholar]
- Haddad, M.; Jayousi, A.; Hantash, S.A. Applicability of WEAP as Water Management Decision Support System Tool on Localized Area of Watershed Scales: Tulkarem District in Palestine as Case Study. In Proceedings of the Eleventh International Water Technology Conference, Sharm El Sheikh, Egypt, 15–18 March 2007. [Google Scholar]
- Yates, D.; Purkey, D.; Sieber, J.; Huber-Lee, A.; Galbraith, H.; West, J.; Herrod-Julius, S.; Young, C.; Joyce, B.; Rayej, M. Climate driven water resources model of the Sacramento Basin, California. J. Water Resour. Plan. Manag. 2009, 135, 303–313. [Google Scholar] [CrossRef]
- Bharati, L.; Smakhtin, V.U.; Anand, B.K. Modeling water supply and demand scenarios: The Godavari-Krishna inter-basin transfer, India. Water Policy 2009, 11, 140–153. [Google Scholar] [CrossRef]
- Al-Omari, A.; Al-Quraan, S.; Al-Salihi, A.; Abdulla, F. A Water Management Support System for Amman Zarqa Basin in Jordan. Water Resour. Manag. 2009, 23, 3165–3189. [Google Scholar] [CrossRef]
- Höllermann, B.; Giertz, S.; Diekkrüger, B. Benin 2025—Balancing Future Water Availability and Demand Using the WEAP ‘Water Evaluation and Planning’ System. Water Resour. Manag. 2010, 24, 3591–3613. [Google Scholar] [CrossRef]
- Vicuña, S.; Mcphee, J.; Garreaud, R.D. Agriculture vulnerability to climate change in a snowmelt driven basin in semiarid Chile. J. Water Resour. Plan. Manag. 2012, 138, 431–441. [Google Scholar] [CrossRef]
- Rheinheimer, D.E.; Viers, J.H.; Sieber, J.; Kiparsky, M.; Mehta, V.K.; Ligare, S.T. Simulating High-Elevation Hydropower with Regional Climate Warming in the West Slope, Sierra Nevada. J. Water Resour. Plan. Manag. 2014, 140, 714–723. [Google Scholar] [CrossRef]
- Hamlat, A.; Errih, M.; Guidoum, A. Simulation of water resources management scenarios in western Algeria watersheds using WEAP model. Arab. J. Geosci. 2013, 6, 2225–2236. [Google Scholar] [CrossRef]
- Li, Q.; Sun, R.; Tian, L.; Wang, D.; Shi, C.; Li, Y.; Wang, Y. Application of WEAP Model to Water Resources and Water Environment Management in Binhai New Area of Tianjin City. J. Water Resour. Water Eng. 2010, 2, 56–59. [Google Scholar]
- Song, R.Y.; Liu, Q.Y.; Xu, Z.-H.; Meng, F.H. Optimization allocation of water resources in longkou city based on WEAP mode. China Rural Water Hydropower 2011, 4, 30–33. [Google Scholar]
- Li, X.; Zhao, Y.; Shi, C.; Sha, J.; Wang, Z.L.; Wang, Y. Application of Water Evaluation and Planning (WEAP) model for water resources management strategy estimation in coastal Binhai New Area, China. Ocean Coast. Manag. 2015, 106, 97–109. [Google Scholar] [CrossRef]
- Xiamen Statistical Bureau (XSB). Yearbook of Xiamen Special Economic Zone; Xiamen Statistical Bureau: Xiamen, China, 2015.
- Resources of Xiamen Municipality (XWR). Water Resources Bulletin in Xiamen; Bureau of Water Resources of Xiamen Municipality: Xiamen, China, 2015.
- Lin, J. Assessment of sustainable utilization of urban water resources in Xiamen City. Water Resour. Prot. 2010, 26, 51–56. [Google Scholar]
- Xiamen Municipal Government (XMG). The Strategic Planning of Water Resources in Xiamen (2015–2030); Xiamen Municipal Government: Xiamen, China, 2016.
- Stockholm Environment Institute (SEI). Water Evaluation and Planning System of User Guide; Stockholm Environment Institute: Stockholm, Sweden, 2006. [Google Scholar]
- Yates, D.; Sieber, J.; Purkey, D.; Huber-Lee, A. WEAP21—A demand-, priority-, and preference-driven water planning model Part 1: Model characteristics. Water Int. 2005, 30, 487–500. [Google Scholar] [CrossRef]
- Xiamen Municipal Government (XMG). Xiamen Master Plan; Xiamen Municipal Government: Xiamen, China, 2015.
- Allen, R.G.; Pereira, L.S.; Raes, D.; Smith, M. Crop Evapotranspiration: Guidelines for Computing Crop Water Requirements; Irrigation and Drainage Paper No 56; Food and Agriculture Organization of the United Nations (FAO): Logan, UT, USA, 1998. [Google Scholar]
- Fujian Bureau of Quality and Technology Supervision (FQTS). Norm of Water Intake of Industries; Fujian Bureau of Quality and Technology Supervision: Fujian, China, 2013.
- Xiamen Bureau of Quality and Technology Supervision (XQTS). Norm of Industrial Water Use and Living Water Use; Xiamen Bureau of Quality and Technology Supervision: Xiamen, China, 2016.
- Environmental Protection Agency (EPA). Environmental Statistics in Xiamen. 2005-1015; Environmental Protection Agency of Xiamen: Xiamen, China.
Figure 1.
Map of Xiamen City.

Figure 2.
Framework of Xiamen City’s urban water system.

Figure 3.
Water demand in Xiamen City under different scenarios. Note: PLS is the acronym for planning scenario; TWS is the acronym for technical water-saving scenario; SWS is the acronym for structural water-saving scenario; DWS is the acronym for double water-saving scenario.
Figure 3.
Water demand in Xiamen City under different scenarios. Note: PLS is the acronym for planning scenario; TWS is the acronym for technical water-saving scenario; SWS is the acronym for structural water-saving scenario; DWS is the acronym for double water-saving scenario.

Figure 4.
Water saving potential of each district and the agricultural sector under the three water saving scenarios. Note: PLS is the acronym for planning scenario; TWS is the acronym for technical water-saving scenario; SWS is the acronym for structural water-saving scenario; DWS is the acronym for double water-saving scenario.

Figure 5.
Waterworks capacity deficits in each Xiamen City district under different scenarios. Note: PLS is the acronym for planning scenario; TWS is the acronym for technical water-saving scenario; SWS is the acronym for structural water-saving scenario; DWS is the acronym for double water-saving scenario.

Figure 6.
The time of occurrence for water shortages for each district under different scenarios. Note: PLS is the acronym for planning scenario; TWS is the acronym for technical water-saving scenario; SWS is the acronym for structural water-saving scenario; DWS is the acronym for double water-saving scenario.

Figure 7.
Projected future Xiamen City water supplies and water demand considering only local water sources. Note: PLS is the acronym for planning scenario; DWS is the acronym for double water-saving scenario.
Figure 7.
Projected future Xiamen City water supplies and water demand considering only local water sources. Note: PLS is the acronym for planning scenario; DWS is the acronym for double water-saving scenario.

Figure 8.
Projected future Xiamen City water supplies and water demand considering only trans-basin water diversion. Note: PLS is the acronym for planning scenario; DWS is the acronym for double water-saving scenario.
Figure 8.
Projected future Xiamen City water supplies and water demand considering only trans-basin water diversion. Note: PLS is the acronym for planning scenario; DWS is the acronym for double water-saving scenario.

Figure 9.
Projected future Xiamen City water supplies and demand considering local resources and trans-basin water diversion. Note: PLS is the acronym for planning scenario; DWS is the acronym for double water-saving scenario.
Figure 9.
Projected future Xiamen City water supplies and demand considering local resources and trans-basin water diversion. Note: PLS is the acronym for planning scenario; DWS is the acronym for double water-saving scenario.


Table 1.
Assumptions of key variables for the Xiamen City WEAP model.
| Basic Parameters | 2015 1 | 2020 2 | 2030 2 | 2050 2 |
|---|---|---|---|---|
| Population (million) | 3.86 | 5.00 | 6.40 | 8.00 |
| GDP (million RMB) | 346 | 509 | 1002 | 2300 |
| Primary industry proportion (%) | 0.7 | 0.5 | 0.3 | 0.3 |
| Secondary industry proportion (%) | 43.6 | 39.5 | 34.7 | 29.7 |
| Tertiary industry proportion (%) | 55.7 | 60.0 | 65.0 | 70.0 |
Note: 1 Data are from the Yearbook of Xiamen Special Economic Zone (2016). 2 Data in 2020–2050 are based on the Xiamen Master Plan.
Table 2.
Scenarios and assumptions of the Xiamen City WEAP model.
| Scenarios | Abbreviation | Main Assumptions |
|---|---|---|
| Planning Scenario 1 | PLS | Future island population size remains unchanged, while the mainland population rapidly increases, especially in the Xiangan District. Agricultural land coverage will gradually decline. The chemical industry will completely disappear before 2030. High-tech industries, such as the pharmaceutical, equipment, and electronics industries, will greatly expand. The pharmaceutical industry’s added value will increase from 1.51% to 12% of the total by 2050. Emerging service industries, such as tourism, culture, health and education, will increase. |
| Technical Water-Saving Scenario | TWS | Compared with the PLS, the TWS scenario will adopt advanced technology to reduce water consumption. The irrigation coefficient for agriculture will be 0.72 in 2050 due to advanced technology such as dropper and sprinkler irrigation, compared to 0.55 in 2015. The water quotas for fishery and livestock enterprises will be reduced by 10% in 2050, relative to the PLS. For secondary industry, water recycling will be strengthened and water utilization efficiency improved. Tertiary industry and domestic users will use more water-saving appliances. Thus, water quotas for secondary and tertiary industries, as well as domestic water, will be reduced by 5%, 10% and 5% in 2050, respectively, compared with the PLS. Ecological water use for the TWS and PLS will be similar. |
| Structural Water-Saving Scenario | SWS | Compared with the PLS, the SWS scenario will reduce the proportion of water-intensive industries. Examples include the elimination of the papermaking, printing, and chemical industries by 2020, with the maintenance of the pharmaceutical industry’s ratio of 1.51% through 2050. In contrast, the proportion of water-saving industries will increase, such as the equipment and electronics industries. |
| Double Water-Saving Scenario | DWS | Compared with the PLS, the DWS utilizes advanced technology and industrial restructuring to reduce water consumption. The industrial structure proportions will be consistent with the SWS, and the water quotas will be consistent with the TWS. |
Note: 1 The geographic distribution of industry in the PLS is restructured according to a sub-regional spatial function scheme, and the water quota will be based on the Strategic Plan of Water Resources. The population size and the economy of each district will be based on the Xiamen Master Plan. The economic development of each industry in the future will be based on the national economy and social development plan of Xiamen.
Table 3.
Water supply sources for Xiamen City.
| Water Source | River | Amount of Water (million m3) | Infrastructure Expenditure (million RMB) | Annual Operating Cost (million RMB) |
|---|---|---|---|---|
| Trans-basin water diversion 1 | Jiulongjiang | 200 | 1000 | 179 |
| Tingjiang | 200 | 2500–2700 | 197 | |
| Mingjiang | 200 | 3500 | 244 | |
| Reclaimed water 2 | - | 170 | 1000 | 170 |
| Seawater desalination 3 | - | 110 | 3000 | 550–770 |
Note: 1 Data from the Strategic Planning of Water Resources in Xiamen (2015–2030); 2 Data from the Action Plan of Reclaimed Water Use in Xiamen; 3 Data from the Seawater Desalination Action Plan of Xiamen.
Table 4.
The proportion of water used in each industry.
| Scenario | Year | Primary Industry | Secondary Industry | Tertiary Industry | Domestic Demand | Ecological Demand |
|---|---|---|---|---|---|---|
| - | 2015 | 20.33% | 26.78% | 18.41% | 32.04% | 2.44% |
| PLS | 2050 | 4.88% | 31.24% | 24.07% | 35.45% | 4.35% |
| TWS | 2050 | 5.08% | 32.84% | 24.03% | 33.24% | 4.83% |
| SWS | 2050 | 5.25% | 26.09% | 25.88% | 38.11% | 4.68% |
| DWS | 2050 | 5.48% | 27.51% | 25.93% | 35.87% | 5.21% |
© 2018 by the authors. Licensee MDPI, Basel, Switzerland. This article is an open access article distributed under the terms and conditions of the Creative Commons Attribution (CC BY) license (http://creativecommons.org/licenses/by/4.0/).
Share and Cite
MDPI and ACS Style
Kou, L.; Li, X.; Lin, J.; Kang, J. Simulation of Urban Water Resources in Xiamen Based on a WEAP Model. Water 2018, 10, 732. https://doi.org/10.3390/w10060732
AMA Style
Kou L, Li X, Lin J, Kang J. Simulation of Urban Water Resources in Xiamen Based on a WEAP Model. Water. 2018; 10(6):732. https://doi.org/10.3390/w10060732
Chicago/Turabian StyleKou, Limin, Xiangyang Li, Jianyi Lin, and Jiefeng Kang. 2018. "Simulation of Urban Water Resources in Xiamen Based on a WEAP Model" Water 10, no. 6: 732. https://doi.org/10.3390/w10060732
Note that from the first issue of 2016, this journal uses article numbers instead of page numbers. See further details here.