1. Introduction
In force since 26 November 2007, flood protection directives within the European Union (EU) are outlined in the Flood Directive on the assessment and management of flood risks [
1], which sets goals, suggests activities and provides methods to reduce the adverse effects of floods. However, the implementation of the directive’s recommendations has proven to be a major challenge for a number of nations within the European Community. The concept of flood risk combines the probability of flooding (threat or hazard), and the related potential negative consequences with respect to human health and life, the environment, cultural heritage and economic activities. These consequences reflect the management of the affected area (exposure), the vulnerability of the elements managed within the flood event, and the ability of local communities to combat the threat and reality of floods (sensitivity or resilience). Flooding risk is a function of hazard, exposure and sensitivity to flooding, key factors in determining, respectively, the magnitude and areal extent of extreme events’ impacts, land-use within the geographic area of the event’s impact, and the resilience of people and objects to event occurrence. According to current EU (including Poland) regulations a three-pronged strategy is to be applied in limiting the effects of floods:
(i) Protecting individuals through hazard mitigation by way of technical protection activities such as dams and retention reservoirs, polders, relief canals, levees, riverbed regulation, activities for basin retention development, etc.,
(ii) isolating/limiting individuals’ exposure to flood waters by reducing high risk land uses, e.g., moving endangered properties and banning new construction in areas at risk of flooding, and
(iii) developing the ability of individuals and society as a whole to live with floods, e.g., hydrological forecasting and warning, preparation and evacuation of endangered populations, education of society, development of insurance and compensation systems, etc. These strategies are designed to mitigate the effects of flooding and reduce flood losses.
Though all countries follow the EU
Flood Directive, flood loss risk assessment is undertaken differently in different European countries. In Germany, for example, flood losses are determined through a loss function dependent on land-use classes and the value of the property and the loss of the population depending on the depth of inundation of residential buildings [
2,
3,
4]. In contrast, the French approach uses norms of sensitivity, developed for rural and urban areas, based on the depth and duration of flooding and flow velocity [
5,
6,
7]. Based on the type of statistical-derived probability of destruction of flood protection structures (objects)—e.g., levees that protect sites vulnerable to river or storm surge flooding—the approach taken by English and Welsh authorities [
8] differs significantly from those of the German and French authorities. Depending on the magnitude of the flood and objects’ structural parameters, various scenarios were analyzed with respect to the destruction of flood protection structures, and the attending economic and social losses in riverine and littoral areas. These losses were a reflection of the terrain’s configuration, of flow velocity, time and volume, inundation depth, land-use, as well as the characteristics of the resident human population. Polish legislation deviated slightly from the German approach in accounting for the specifics of the areas at risk of flooding. As of 2015, work in Poland had mainly focused on: (i) Determining floodplains in a preliminary flood risk assessment, (ii) drawing up flood hazard and flood risk maps using numerical terrain models, GIS tools and hydrodynamic models, and (iii) developing flood risk management plans [
9]. Currently, a second planning cycle is underway, in which heretofore compiled maps and plans will be verified.
Our proposed methodology sought to improve the safety and reliability of hydrological systems, by either increasing the reliability of the elements of the system that have a significant impact on its proper functioning, or by adding other elements to the existing structures in the system, thereby providing greater reliability. In the case of complex systems, such as hydrological systems, this is key to planning the construction of technical flood protection works, the modernization of existing hydraulic structures, as well as in land-use planning and the use of non-technical measures.
The proposal to use the tools of reliability theory in the field of flood protection creates opportunities for a better description of the reliable functioning of hydrological systems. Moreover, through hydraulic modeling of river flow and planning activities, it allows for a better use of current methods of assessing risk, particularly that posed by extreme hydrological events. The methods for managing the risk of extreme flows and providing protection against floods presented here are not intended to put into question the European Floods Directive [
1] currently employed in EU countries, but rather to complement them.
2. Theoretical Background
To date, the theory of reliability has mainly been applied to: (i) Describing technical objects in fields such as aviation, construction machinery and transportation [
10,
11,
12,
13], building structures [
14], and (ii) describing technical systems, e.g., water-supply and sewage systems [
15,
16,
17], safety-critical electrical and electronic systems [
18] and flood defense systems (building of levees, dikes and hydraulic structures [
19]. Attempts have been made to apply reliability engineering in the field of water management, notably for: Water reservoir operation [
20], assessment of water resources [
21,
22], water resources systems operation [
23], and hydrologic design of flood mitigation dams [
24].
Reliability theory can also serve as an aid in the analysis of extreme values of river flow and their impact on the safe operation of a hydrological system, i.e., a functional-spatial system existing within a river catchment area, including surface and groundwater, the natural environment, technical and non-technical activities or structures that develop the resources, as well as links between these elements. The hydrological system is therefore presented and discussed as a water engineering system, directly related to the issues of risk management of extreme flows.
In the present hydrological study, the primary study object was the river catchment (i.e., watershed or on a larger scale, river basin), viewed not only as a purely natural hydrological system, but as a water management system, subject to continuous changes under human influence. Accordingly, the river catchment was treated as a complex object consisting of elements that are on the one hand, resources of surface water and groundwater occurring in a natural environment and, on the other hand, hydraulic structures for using those resources, and the linkages between these elements.
In reliability and safety theory, the term
object implies a functional unit, a technical solution, an organizational solution with specific operating features, which both determines the properties of the object and provides its terms of use; the term operating features refers to those features relevant to the user in terms of employing the object [
25]. In hydrology, the
object is the hydrological system, a complex object, with an established organization and complement of relationships, composed of a set of interconnected indivisible elements or objects (e.g., hydraulic structures such as retention reservoirs, levees, polders, relief canals, etc., as well as a catchment, river valley or river bed retention) which implement the full system’s functionality and define its operating parameters.
An
undesirable event is defined as one causing failure in an object’s operation; such events in a hydrological context could be extremes of flooding or drought. The term
failure of object means any event that precludes, physically or conventionally, a given object from fulfilling its envisioned functions [
11]. In the case of a river catchment with existing flood protection infrastructure, the failure of such a complex object will result in the undesirable event of flooding. Depending on the severity of the hazard brought on by the occurrence of an undesirable event within the hydrological system, individual elements of its structure may suffer physical and/or conventional failures. The technical elements present in a hydrological system are considered as indivisible objects that constitute the technical flood protection infrastructure. In this context, the term
damage of object is understood as a synonym for failure of a technical object, with the damage being the physical failure of said object.
In view of the above terminology, a general definition of reliability can be adopted: An object’s ability to operate correctly, that is, perform its functions within a specified time and without failure. Such a definition can be elaborated for a specific object (e.g., a river catchment with existing flood protection infrastructure such as retention reservoirs, levees) based on information regarding the object’s features and the elements crucial for its reliability or failure.
Accordingly, a hydrological system’s or river catchment’s reliability resides in its ability, at any given time, to store potentially flood-causing extreme precipitation in existing, well maintained (i.e., in a good technical state), operating-as-designed, river bed retention reservoirs or levee-enclosed floodplains, following state-of-the-art land-use protocols to reduce surface runoff. In other words, the hydrological system’s reliability is tied to the capacity of the elements from which it is built, to perform in a specified time, without failure, the functions for which they are designed—without the occurrence of flooding.
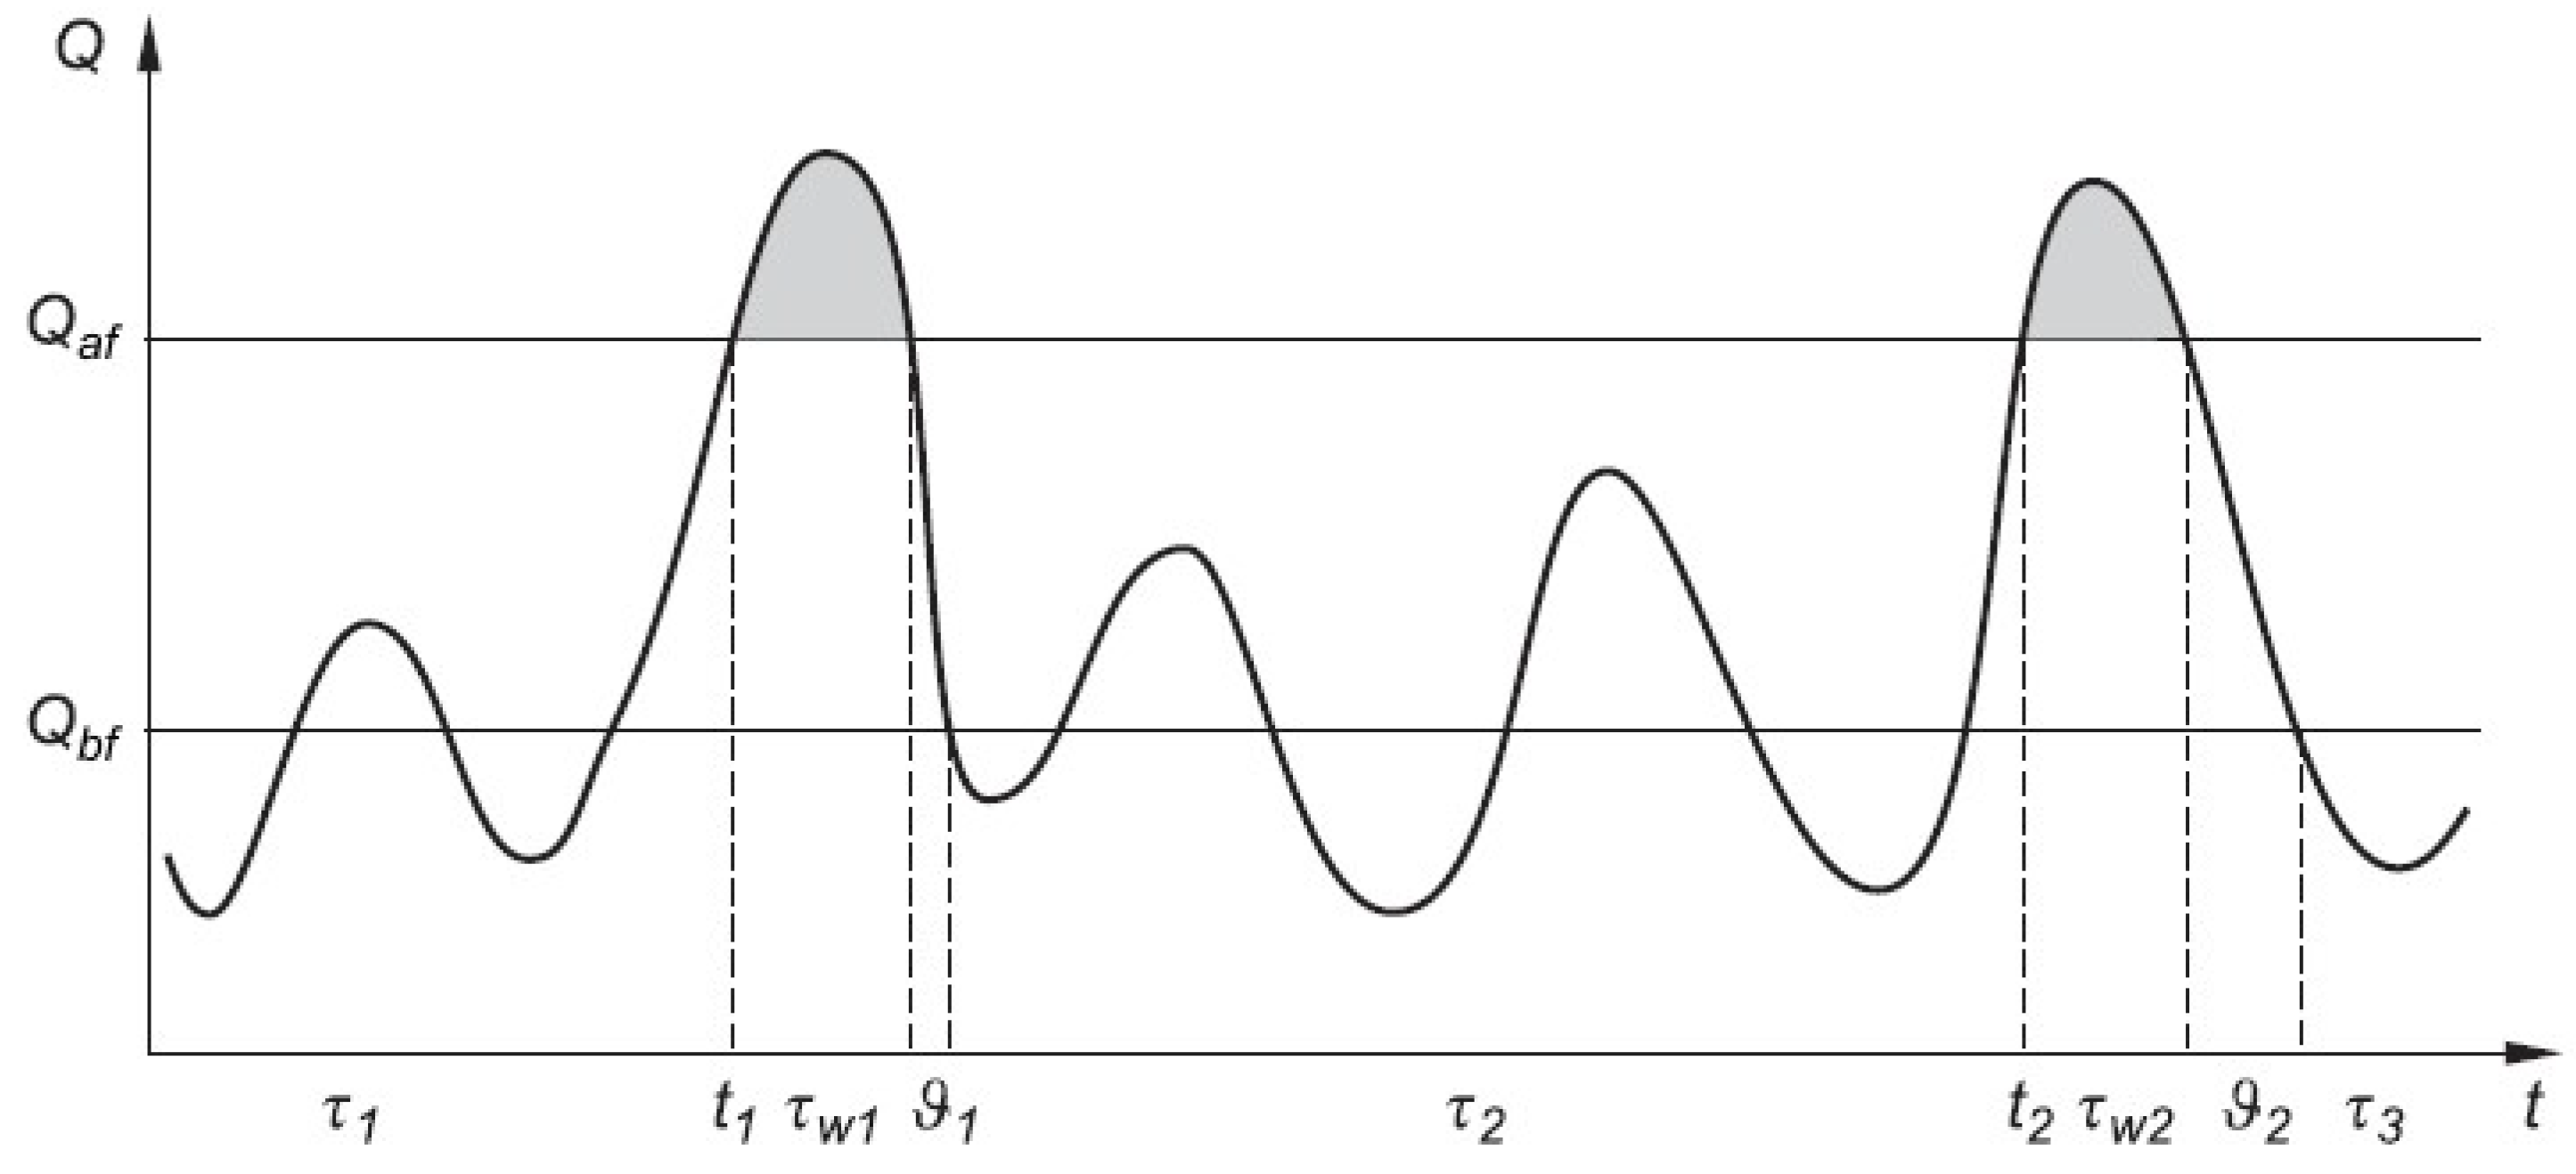
If we accept that the occurrence of flooding constitutes a failure of the hydrological system above a certain maximum threshold flow,
Qaf, given as the mean flow of the largest observed floods, then a time series analysis will show periods during which the hydrological system functions reliably (
τi), moments at which failure occurred (
ti), periods during which failure endures (
τwi), and periods of system renewal (
ϑi) during which the system returns to full fitness after the period of failure (end of flooding) (
Figure 1).
For hydrological systems, the object reliability function,
, is a well-characterized measure that represents the probability of meeting the requirement of proper operation.
where:
is time,
the moment failure occurs,
the probability of non-failure occurrence up to time ti, and
the duration of object function without failure i.
Expressing an exceedance probability with respect to the range [0, 1] through a non-increasing function,
takes on a value of
at time
, and indicates the object is functioning well (i.e., usable). Conversely, if
, the object is unfit for operation. Accordingly, the probability of object failure to time
ti is as follows:
where:
is a cumulative distribution function, otherwise known as the object failure function, and .
More about measures of reliability theory one can find practically in every book or article concerning this subject for example in [
18,
25,
26] and later on in
Section 4.
2.1. The Reliability Structure of a Hydrologic System (Reliability Block Diagram)
In the case of a complex object such as a hydrological system, it is important to determine the reliability of the object according to its structure and elements (reliability block diagram). In a model of a complex object, the reliability structure often takes on a mixed form composed of various structures.
2.2. Mixed Structure of a Hydrologic System
Typically, a mixed (composite) structure includes serial elements connected with elements operating in parallel (
Figure 2).
Assuming the time independence of the failure-free operation of a mixed structure’s individual elements, the mixed structure of a hydrological system including the river valley’s retention and one levee and one polder (
Figure 2) yields an
and
calculated as:
serial structure
and parallel structure
where,
i is the element number, where
i = 1, river valley retention;
i = 2, levee; and
i = 3, polder (
Figure 2),
is the failure function of the ith element, and
is the reliability function of the ith element.
For the specific case shown in
Figure 2, the equations for
and
can be written, respectively, as:
In the case of some objects, such as hydrological systems, a reliability structure can be created by elements treated as events that can appear in the object, in addition to elements physically existing in the object. Accordingly, a convenient way to graphically represent and analyze the object’s reliability structure is the Fault Tree Method (FTM).
2.3. The Fault Tree Method (FTM) in the Reliability Analysis of Hydrological Systems
In assessing complex object reliability, if its elements—in particular its physical elements—are known, then a model of reliability for such an object is easily presented in qualitative form as a structure of reliability (
Figure 2) and quantitatively using measures of reliability (Equations (3)–(8)). For more complex hydrological systems, an FTM model can be used where the mathematical description of failure takes the form of probabilities of so-called
top events and
basic events. A
top event is an undesirable event leading to object failure, e.g., high flows leading to flooding, while a
basic (
original)
event is an event or failure the cause of which is not considered (e.g., heavy rainfall, sudden rise in hibernal air temperature with a heavy snow cover over a large area of the catchment, frozen soil, levee status, retention reservoir filled to capacity, high soil moisture content in catchment area, etc.).
One of the advantages of describing the reliability of the object structure using FTM (
Figure 3) is the possibility of placing the probabilities of occurrence of individual events on tree branches, leading up to the top event, thereby allowing a quantitative analysis of object reliability.
The probabilities
P(
Ai) of undesirable events
Ai found in FTM are dependent on the time (
t) of failure occurrence (e.g., of the undesirable event) and are equal to:
where,
For the hydrological system shown in
Figure 3, the probability
p(
A) of top event
A (flooding occurrence) can be calculated as follows (see also
Section 4):
All probabilities should be estimated by use of expert knowledge, i.e. team of specialists from different fields of interest (e.g., Ranking method, see
Section 4) or through statistical methods if sufficient data exists to perform statistical calculations.
Based on estimated probabilities p(Ai), the value of the reliability function Rl(t) of the lth element of the hydrological system, in which failure Fl(t) occurred as a result of undesirable events occurring at time t (Equation (9)), the reliability or failure of the entire hydrological system can be calculated.
2.4. Definition of Risk
Both the definition and mode of assessment of
risk varies widely in the literature from different scientific domains [
26,
27,
28,
29,
30,
31,
32,
33,
34,
35,
36]. While the term
risk is often used interchangeably with that of
uncertainty, these are two distinct concepts:
Uncertainty most commonly refers to a state in which future possibilities and chances are unknown;
risk refers to decision-making in situations of uncertainty. Negative associations tied to the term
risk due to its allusion to a lack of safety, impedes its social acceptance. Generally, the concept of risk is a complement to the closely related concept of safety.
Given that a (hydrological) system’s safety level can be quantified, one hydrological system and its elements can be deemed
safer than another. Given that a functioning hydrological system implies a certain level of risk, its level of safety can be assessed through its level of risk. The three categories of risk or levels of safety (e.g., acceptable, tolerable and inacceptable) have fuzzy boundaries, determined through qualitative rather than quantitative methods of risk assessment. The level of risk tolerance should be the lowest in accordance with the principle of
As Low as Reasonably Practicable (ALARP) [
13,
37]. The level of tolerable risk depends primarily on the legal provisions in force, policies adopted for the environment and cultural goods, as well as on the approval of the local communities according to their unique cultural traditions and ethical values. The European Union Flood Directive [
1,
38] defined the risk of flooding as the combined probability of flood occurrence and the potential, negative flood-related consequences for human health, natural environment, cultural heritage and economic activity.
2.5. Qualitative and Quantitative Assessment of Risk
The qualitative analysis of risk in a probabilistic sense involves the identification of threats and assessment of the sequence of events leading to an undesirable event, i.e., an extreme hydrological event. Such an analysis can be performed by the Event Tree Method (ETM) [
24,
39], a graphical representation of a chronological scenario of events that have a significant impact on the system’s operation, but are ultimately caused by an initiating or ‘basic hazardous event’. This approach assumes that for system failure to occur one undesirable event is not sufficient, but rather a series of events is required.
In contrast to block diagrams of system structure and the FTM, ETM is not used to describe an system’s reliability structure (e.g., physical elements or undesirable events), but rather for risk analysis. Nevertheless, risk analysis does require knowledge of system structure, so it is reasonable to combine the two methods to comprehensively describe an system’s operation and its elements. Therefore, in creating a hydrological system’s event tree, all elements of such a system and their interrelations should be considered.
After building an event tree to represent foreseeable secondary event scenarios, a probability can be assigned to every secondary event branch, allowing the probability of entire sequences of events leading to object failure to be calculated. In this way, a quantitative model of threat (risk) induced by an initial event can be generated.
In the concepts of FTM and ETM presented in this paper, the reliability function (and/or failure function) and the extent of risk are considered in a probability domain, as described below.
2.6. Relationship between Measures of Hydrological Risk and Measures of Reliability (Failure)—Threat and Losses
While the concepts are defined in fundamentally different ways, a close relationship exists between measures of risk, reliability (failure)—threat (hazard) and losses, and can be written as:
Drawn from the relationship between the hydrological system’s object failure function,
F(
t), and its object reliability function,
R(
t), the probability of occurrence of an undesirable event
(
Figure 4), is quantified in terms of the undesirable event ‘
A’ causing losses greater or equal to
l. The relationship in Equation (11), between measures of hydrological risk
MHR, failure
F (reliability
R)—threat and losses
T, can be expressed mathematically as:
where,
is a measure of risk of emergence of losses l in the hydrological system at time t of the system’s functioning,
F(t) is the system failure function—probability of occurrence of event A at time t,
is the system reliability function—probability of non-occurrence of event A at time t,
T(l) is the probability that the occurrence of an undesirable event A causes losses greater or equal to l, ,
is the probability of occurrence of the undesirable event, A, viewed as a measure of failure F(t) (or reliability R(t)) of the hydrological system,
is the probability of occurrence of losses greater or equal to l under the condition that undesirable event A occurred. It serves as the measure of threat of the occurrence of losses in the hydrological system resulting from its malfunctioning.
Equation (12) shows that the risk of occurrence of loss within the hydrological system depends not only on undesirable event A, which creates the threat of occurrence of losses, but also on the failure or reliability of the complete system or its elements. Failure of the system or its elements has a direct impact on the possibility of occurrence of losses and their magnitude, i.e., T(l) in Equation (12). The level of risk also depends to a large extent on the system’s readiness to counteract a threat, both before and after its occurrence. Emergency and risk management systems include the monitoring/forecasting of extreme hydro-meteorological events, implementation of warning systems and involvement of fire departments and medical emergency systems. Factors influencing the safety of hydrological systems fall into two main categories: (i) Those relating to the reliability of operation of the system and its elements, and those related to the failure-free functioning of risk management systems, and (ii) those associated with the occurrence of undesirable events. Even if a complex object’s elements show low reliability, the object can still be safe if in the planning, design and operational phases, engineers have ensured that potential damage does not generate large risks.
The proposed approach (Equation (12)) differs from the classical approach because it accounts for the probabilistic nature of losses, not only the size of losses in the form of a single value, and simultaneously takes into consideration the reliability (or failure) of the structure of the hydrological system as a probability of threat. Accordingly, hydrological risk should be expressed by a unit of probability, and not by a unit of losses expressed in monetary units and/or as a number of human victims. In the new approach, rather than calculating the extent of losses based on the configuration of the terrain, flood water velocity, flood timing, volume, and depth, land-use, nature of the resident human population, and value of human property, the probability of occurrence of losses equal to or exceeding a certain assumed value (magnitude) is considered. Accordingly, the hydrological system failure function or the hydrological system reliability function is expressed as the probability of occurrence or non-occurrence of the undesirable event. Given knowledge regarding the reliability of the system, as illustrated in a block diagram, and a description of the system developed using FTM, one can build an event tree (ETM). This graphical representation of the foreseeable course-of-events brought on by the occurrence of the initialization event allows the assignment to specific branches of the event tree of probabilities of occurrence for every secondary event’s occurrence. Then the probability of the entire sequence of secondary events leading to the failure of the system can be calculated (
Figure 4). One can thereby create (build) a quantitative (probability) model of risk induced by the occurrence of the initialization event.
2.7. Identification of Risk
The probability of an individual incident’s occurrence is assessed and then the sequence of events leading to system failure is calculated. Using an event tree, a given sequence’s probability of occurrence and level of risk (RL) can be calculated. This allows one to create a system risk model, which by considering possible system element failures and their mutual relationships (e.g., intermediate events, secondary events), evaluates the risk of losses resulting from the occurrence of a given undesirable event.
A system’s risk level,
, in response to
k undesirable events can be expressed as:
where,
m is the number of secondary events sequences,
n is the number of secondary events in the jth sequence,
is the probability of occurrence of the jth sequence caused by the occurrence of the kth undesirable event,
is the probability of occurrence of the ith secondary event in the jth sequence caused by the kth undesirable event
is the risk level associated with the jth sequence of secondary events caused by occurrence of the kth undesirable event.
The overall risk to the system from all sequences of secondary events arising from an undesirable event is given in Equation (13), and represents the risk which may arise when considering a particular scenario of secondary events seen as the most likely threat posed by m occurrences of an undesirable event.
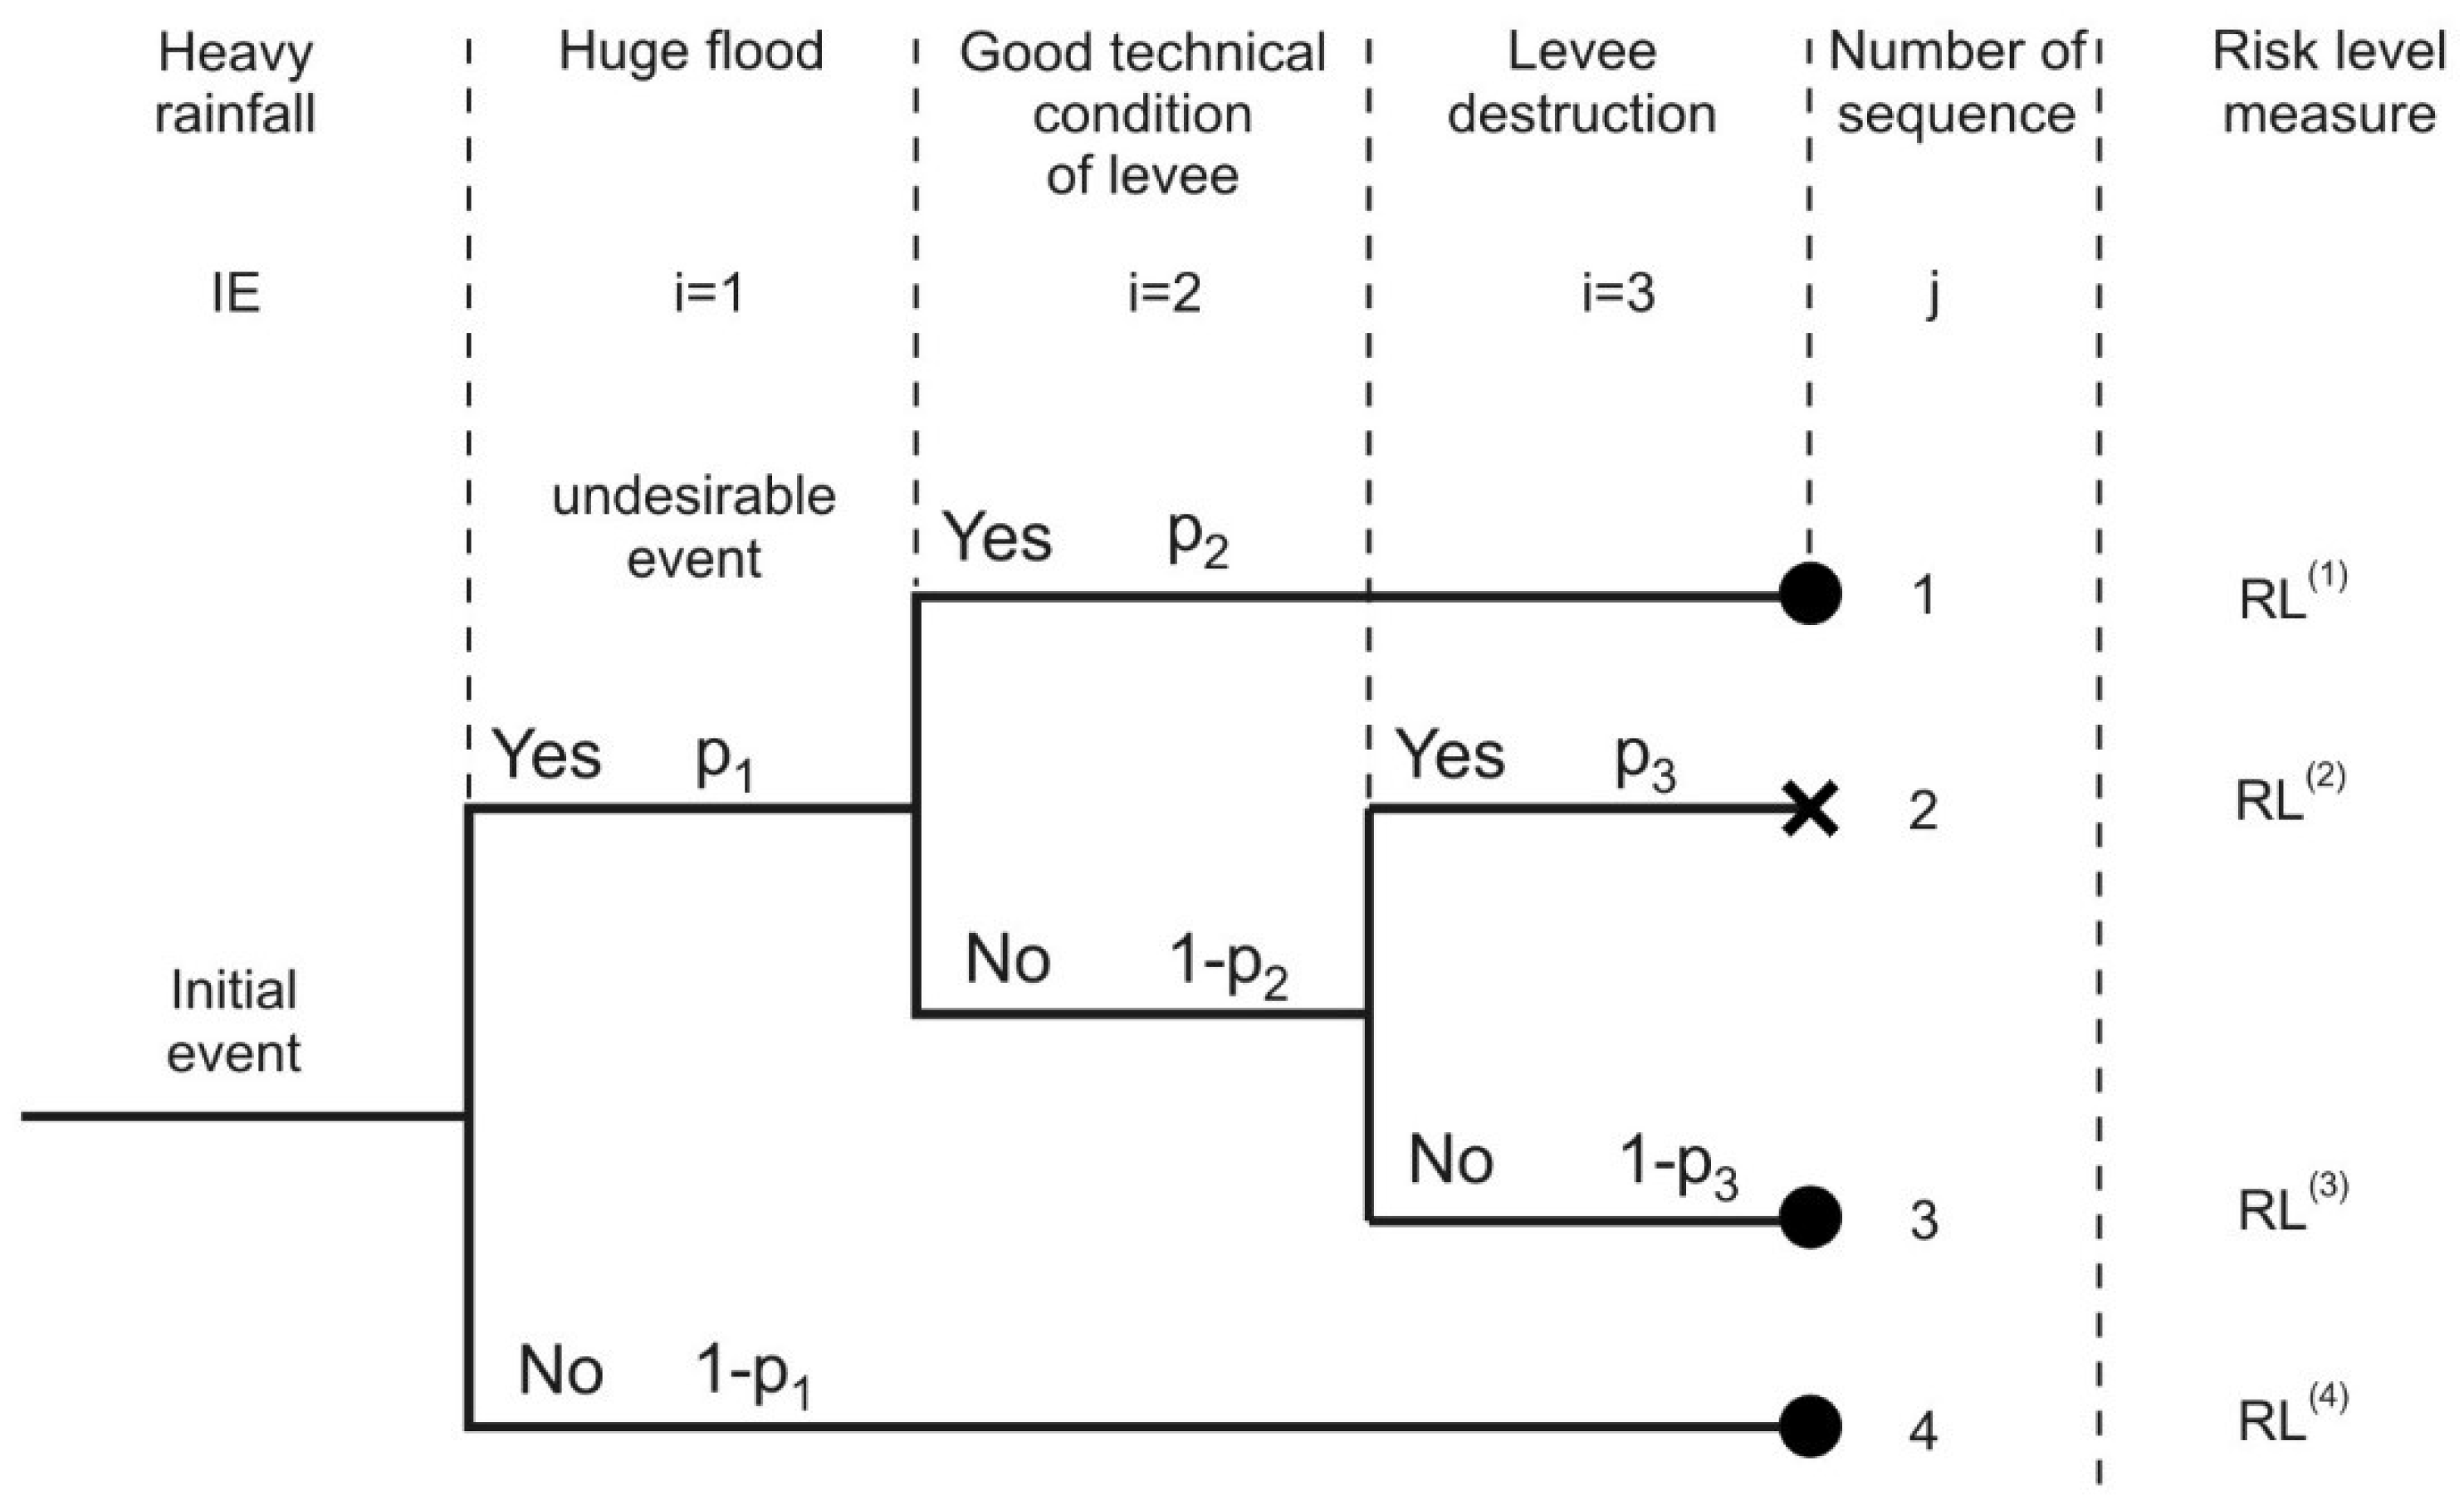
For the part of Sola River catchment system in Zywiec, the event tree, which considers measures of risk level for this object (
Figure 4), can be used to calculate the risk associated with initial event
IE in the form of heavy rainfall, as:
where
Because numbered sequences
j = 1, 3 and 4 do not lead to interruption of levee function and attendant flooding disaster, measures of risk level for these sequences are equal to zero (i.e.,
); therefore Equation (15) takes on the form:
Both the measure of risk level,
RL(2) of sequence no. 2 initiated by initial event
IE, as well as probabilities of every secondary event,
p1,
p2 and
p3, would be estimated by experts or statistical methods (see
Section 4).
4. Results and Discussion
4.1. Place and Data for Case Study
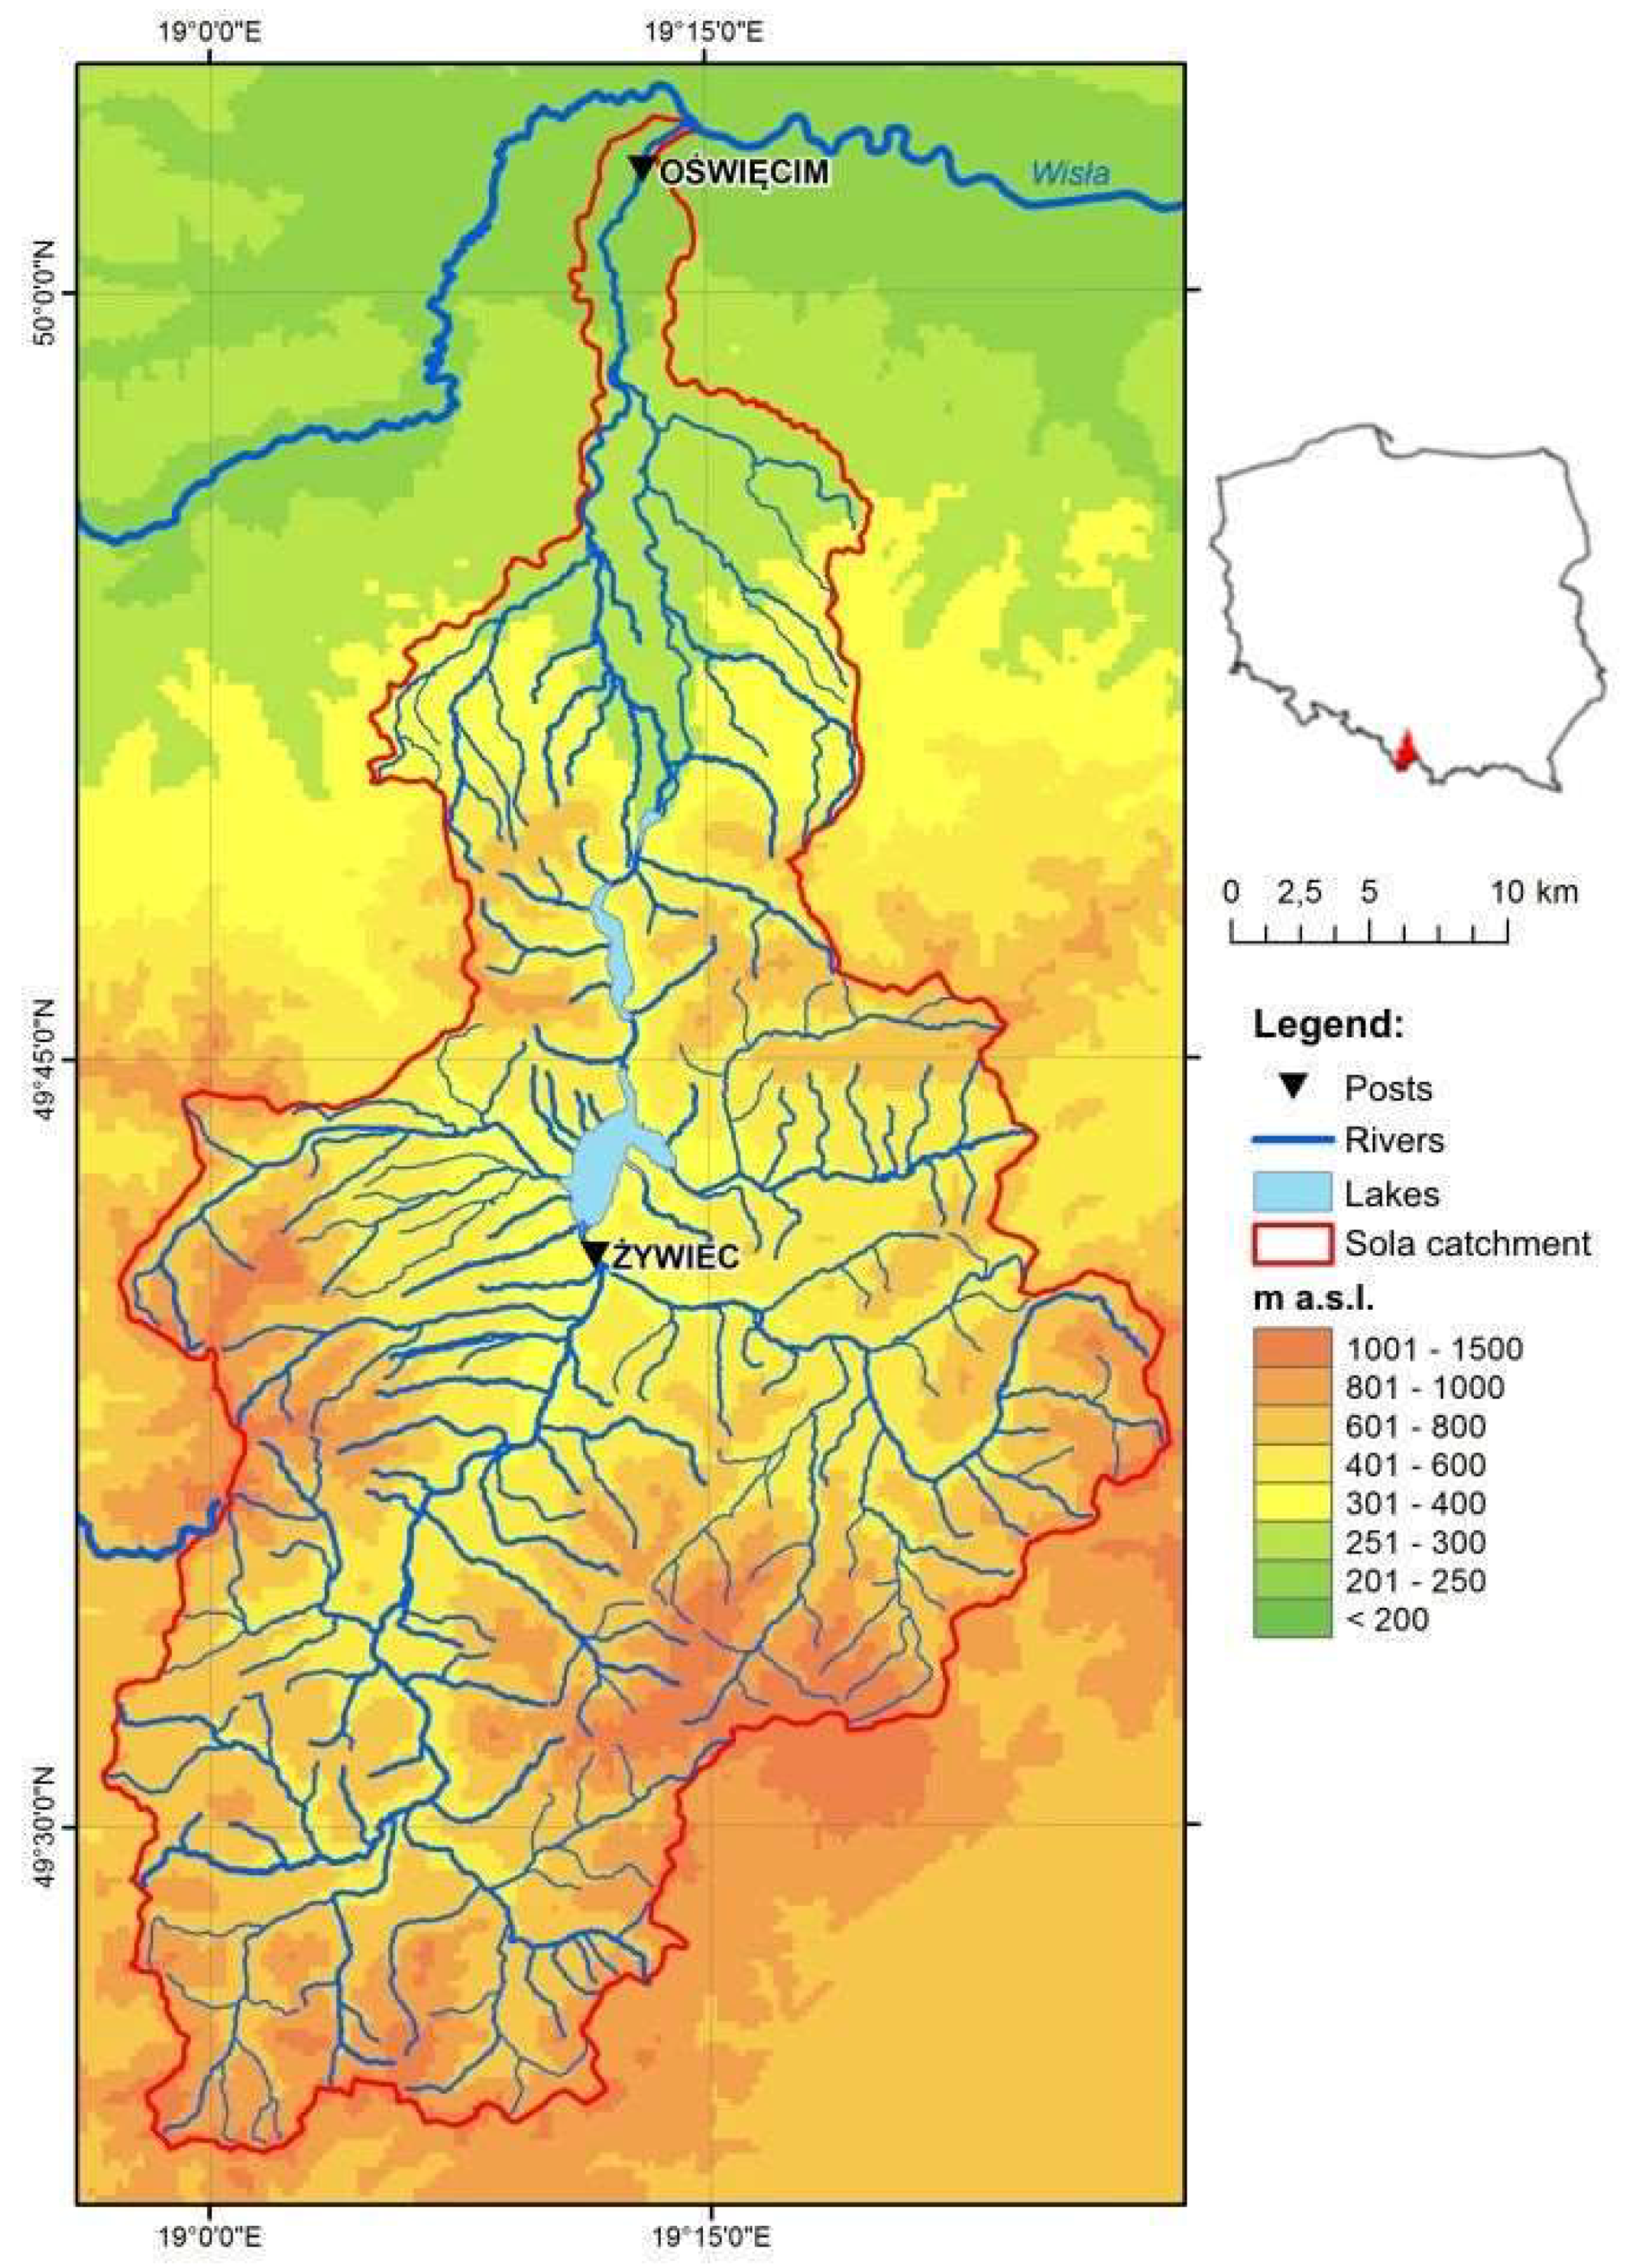
A case study was undertaken for the portion of the Sola River catchment with its outlet at the Zywiec post (
Figure 5). Including three geographical units (Zywiec Beskid, Silesian Beskid and Makowski Beskid) this Western Carpathian catchment extends over 785 km
2 of flysch—thick layers of sandstone partitioned by layers of slate. The river network is relatively dense. The highest point in the catchment is Pilsko (1557 m a.m.s.l.), and the lowest Zywiec (342 m a.m.s.l.), with an overall mean altitude of 683 m a.m.s.l. Land use in the Sola River catchment includes forest (55% by area), arable farming and grassland (44%), and urban areas (1%).
Conditions of outflow from its drainage area are closely related to its hypsometry. Maximum flow series from winter and summer seasons over a monitoring period of 1956 to 2012 (
t = 57 years) were used for calculations. Using the analysis of heterogeneity employed in [
40], both winter and summer season series of maximum flows were identified a statistically homogeneous ones.
The calculation of maximum annual floods with a
T-year return period (exceedance probability
p) followed the Alternative Events Method [
40,
41] using English version of FFA Software by [
42].
The Maximum Credible Flood (MCF) is the largest flood which may occur under extreme conditions conducive to the simultaneous occurrence of the Maximum Credible Precipitation (
) and extremely favorable conditions for run-off, i.e., the smallest possible loss of surface waters depending on local physiographic conditions and catchment land-use patterns. Arising from a
event, the peak discharge at the catchment outlet during an MCF (
) event was calculated [
43]. Therefore, the
represents the upper limit of flooding which may occur in a catchment where
fell. The value of
is defined as the theoretically greatest precipitation within a duration of minutes, hours, days, etc. which is physically possible to occur over a given area, under given geographical conditions and in each season. The
is therefore an upper limit of precipitation depth and is determined based on physical characteristics of precipitation formation mechanisms.
The
and selected flow characteristics of the Sola River monitored at the Zywiec post station over the observation period of 1956–2012 are listed in
Table 1. Under economic criteria for flood protection, the boundary flow of river flooding which may result in flooding losses,
, was adopted. According to the catchment’s topography and land-use,
was deemed equivalent to: (i) The maximum flow not causing flood losses,
, (ii) the mean flow of annual maximum floods periods for a given observation period,
, or the
i.e., the maximum flood with probability of exceedance
p = 50%.
For the period of 1956–2012,
, and
at the catchment outlet (Zywiec monitoring station). In this example, the set of undesirable events was limited to the largest annual floods monitored at Zywiec between 1956 and 2012 (
Figure 6). Therefore, for the accepted threshold
, the number of largest undesirable events, which might result in losses was calculated [
. This represents the number of floods, during 57 years of operation of the Sola River catchment’s hydrological system, which potentially could have caused losses greater or equal to
l. For
, the number of undesirable events resulting in losses was equal to 27. The largest undesirable events are understood as floods, whose peak flows were the biggest over a given year. This means that all the largest undesirable events,
N, total 57, since the peak flows of maximum annual floods are considered over 57 years. These are the peak flows of all maximal floods whose values are equal or exceed
.
4.2. General Measures of Reliability, Failure, Risk and Safety
For all occurrences of yearly maximal floods in the observation period (
N = 57) and
maximal floods that could cause losses of
l (system failure), the reliability function
R(
t) for the hydrological system is given as:
where,
n(t) is the number of events that cause system failure, and
N is the total number of events of the phenomenon affecting the system.
In the present case, and therefore the failure function . This indicates that the Sola River catchment area above the Zywiec post, given its physico-geographical properties, land-use, etc., functioned reliably in only 63% of occasions when undesirable events occurred, i.e., in 37% of occurrences of the biggest floods with the potential to cause losses from 1956 to 2012, the system was unreliable. This represents a general evaluation of the reliability structure of the Sola River catchment’s hydrological system, without considering the reliability properties of the elements that compose it.
The general and empirical hydrologic risk measure,
MHR, of maximal floods can be approximately given as:
where,
n(l, t) is the number of undesirable events that occurred at time t of system function and caused losses greater or equal to l,
N is the number of all events occurring at time t.
Accordingly, is .
The above-said measure can provide insight into potential risk, expressing the probability of occurrence of losses L(t) not less than l in the period t = 57 years of system functioning. However, the hydrological risk measure should be calculated using Equation (12); its reliable assessment is much more complex. The threshold value l of losses is not explicitly adopted for this example, but can be specified depending on type of losses (human individual or collective or economic).
In order to check the impact of the adoption of threshold Qb on the system’s R(t) and F(t) and risk, , caused by maximal floods, the same calculation for Qb = Qaf = Qmax50% = 285 m3s−1 was performed, for which the number of biggest undesirable events that may cause losses was equal to n(l,t) = 27, and R(t) = 0.53 and F(t) = 0.47 and = 0.47. Obviously, with a reduction in the threshold Qb, the risk of losses as a result of extreme flood occurrence increases, and the Sola River catchment’s reliability of operation decreases. The adoption of a given threshold level, under which phenomena will be judged as undesirable events, has a significant impact on the assessment of the hydrological system’s failure, and consequently on its safety.
The town of Zywiec’s flood protection infrastructure consists of a levee, which protects the city from flooding. The levee is a class II construction intended for flood protection and was designed for a flood
according to Polish design standards [
44].
The town of Zywiec had 31815 residents on 31 December, 2015 [
45]. For the purposes of this example, it was estimated that 10% of the population lived in areas at risk of flooding in the event of destruction or overflow of the levee. Therefore, the number of endangered people,
nhr, was 3182. It was also estimated that the population living in areas at risk, might suffer losses in category
l5—fatalities as a result of undesirable event
A. Should the levee fail or overflow, the
nl5 = 43 would be the number of potential deaths. The number
nA of all occurrences of event
A is equal to the number of flood appearances, where peak flow is greater than the design flood
, for which the levee was designed and built. Thus far, over the period of 1956–2012, only one flood with
was greater than the design flood,
Qd, then
nA = 1. Accordingly, the probability that casualties,
L, is greater than or equal to
l in category
l5 is:
In addition, accordingly, the measure of the hydrological risk of the occurrence of fatalities as a result of event
A is given as:
These indicators and measures give the overall picture of possible threats connected with the occurrence of big floods and the local flood protection existing in the form of a levee in Zywiec.
Using the following formula for the function of intensity of damage (failure)
, is given as:
where,
n(t, t + Δt) is the number of events causing system failure within the time interval from t to t + Δt,
Δt is the width of the time interval,
N(t) is the number of events impacting the system at time t minus the number of events causing system failure within the time interval from t to t + Δt, i.e., the number of events impacting the system at the beginning of each period Δt [N(t = 0) = N],
N is the total number of events affecting the system throughout the period of its operation.
The value of
λ(
t) for the hydrological system under study was calculated for intervals of
(
Table 2).
For the hydrological system studied, the failure intensity can be approximated as a λ(t) value that is constant in time and equal to the mean intensity .
If and t are small, they can be used to approximate the reliability function: , and the failure function: . Approximate values of reliability and failure functions are close to calculated values of these functions for floods defined by threshold of .
The reliability function
R(
t) for consecutive decades of the observation period of 1956–2012 were calculated as (
Table 3):
The analysis of Equation (26) and the results of calculations reported in
Table 2 show that
R(
t) depends on the duration that the hydrological system functions and the failure intensity
λ(
t). At a constant value of
λ(
t), the system’s reliability depends on the adopted time of its functioning, and it becomes increasingly unreliable as the time the system continues to function increases. However, when
λ(
t) decreases, a system’s
R(
t) grows, and the failure intensity of the hydrological system can be reduced by taking actions that reduce the occurrence and impact of extreme hydrological events. These are activities related to land-use within the catchment area, increasing the catchment’s capacity for retention both in the catchment area and in the riverbed (river valley retention), as well as construction of flood protection infrastructure, e.g., water reservoirs, polders, etc. If the river catchment does not naturally restore its potentiality of retention and man does not take any action to improve protection against flooding and reducing flood risk through specific activities, mainly in the field of technical flood protection, hydrological systems will lose their functional reliability within a certain time (decreasing value of reliability function over time at constant failure intensity (
Table 2)). However, this does not happen because, despite the occurrence of initial events (e.g., heavy rainfall or sudden increases of air temperature in spring in the presence of thick snow cover), not all floods—although they are undesirable events—cause failure of the hydrological system by flooding. Values of the reliability function for the Sola River catchment at the Zywiec station for respective decades are relatively large (
Table 2), averaging 0.930.
The expected value of time the system functions without failure,
ET, is given as:
Thus, for
,
ET =
, a value not credible in view of the occurrence of failure during the 57 years of Sola River system monitoring. A better measure of the time of hydrological system function would be the cumulative damage intensity,
Λ(
t), given as:
which for
is
Λ(
t) = 0.439 year
−1. Accordingly, the expected time of the system operating without failure for the Sola River watershed at Zywiec, is
.
4.3. Fault Tree and Event Tree Methods for Quantitative Estimation Threat and Risk
To illustrate the employment of Fault Tree and Event Tree Methods in the evaluation of safety and reliability of hydrological system functioning, it was assumed for purposes of this example, that the structure of reliability of the Sola River watershed above Zywiec consisted of retention by the river valley, as well as a levee and polder (
Figure 2). This structure can be described using FTM (
Figure 3), in which the following basic undesirable events were identified:
A11—river bed heavily developed,
A12—bad river regulation,
A13—too small a spacing of levee. The latter caused undesirable event
A1—lack of river valley retention, as well as basic events
A21—catastrophic flood,
A22—bad technical condition of levee and
A23—polder misuse. All these together were the cause of occurrence of undesirable event
A2—insufficient security of protected land when exposed to flooding.
Events
A1 and
A2 (
Figure 3), which together led to the occurrence of top event
A (i.e., flooding in the town of Zywiec) call for the calculation of the probability of occurrence in the case of a serially structured system:
where:
While in the case of a parallel structure:
where:
The probability of occurrence of the top event for the system structures presented in
Figure 2 and
Figure 3 is then:
where
Without prior knowledge of the probabilities of their occurrence, the probabilities of individual basic undesirable events
A11,
A12 and
A13 as well as
A21,
A22 and
A23, were ranked by a group of five experts using the Ranking Method. Based on measured data and using statistical methods, the head of the team of five experts estimated the probability of events
A12 and
A21 as
p(
A12) = 0.03 and
p(
A21) = 0.001. These events were denoted
B1 and
B2 and used to calibrate the equation:
where,
To calculate a
0 and a
1 in this case, we know from
Table 3 that
,
,
, and
. Accordingly, we can write:
Then, subtracting Equation (35) from Equation (36), we obtain:
Rearranging and substituting we obtain:
Substituting the value of
in Equation (36), we obtain:
The probability of the top event, p(A) = 0.049 was obtained by inserting into Equation (32) the estimated values of the probability of events A11, A13, A22 and A23, respectively p(A11) = 0,011, p(A13) = 0.0027, p(A22) = 0.0012 and p(A23) = 0.005 as well as the known values of probabilities p(A12) = 0.03 and p(A21) = 0.001.
The value of the reliability function
R(
t), for the hydrological system with the structure presented in
Figure 2 is calculated as:
The reliability function of hydrological system element
j,
Rj(
t), can be estimated from the estimated probabilities
p(
Ai), as can the failure function,
Fj(
t):
This value of
is close in value to that of
obtained for subsequent decades of the observation period of maximum floods at Zywiec (
Table 2).
A qualitative and quantitative identification of threat and related risk of flooding as result of levee breakage at Zywiec was made using ETM (
Figure 4). The risk level of the hydrological system,
RL, was then calculated (Equations (15) and (20)):
where
SGI and
FRI are defined, respectively, as Safety Guarantee Indicator and Flood Risk Indicator. Considering the flood protection infrastructure and flooding risk in Zywiec, they are calculated as [
43]:
Accordingly, the received risk level RL appears to be small. A higher level of risk to the system is not equivalent to a rise of losses in it upon failure. Generally, it can be assumed that the higher the level of risk, the greater the probability of a shift from a state of risk into a state of system losses. Nevertheless, losses may be zero even at a high risk level and greater than zero even if the risk level is small. Everything depends on the reliability properties of the elements from which the hydrological system is built and the nature of the undesirable event.
The measure of loss risk in a hydrological system as per Equation (12) is:
It should be noted that the system under study was highly reliable (R(t) = 0.951); its failure function was estimated at only 4.9%, i.e., the low level of the risk of losses in this occurrence yields a low probability of losses in this system.
4.4. Qualitative Method of Risk Assessment
On the basis of the magnitude of the probability of occurrence of an undesirable event and the category of losses and risk matrix (
Table 4,
Table 5,
Table 6 and
Table 7), the level of risk with respect to the safety needs of the concerned hydrological system—for which the probability of occurrence of an undesirable top event
A, i.e., flooding, is
p(
A) = 0.049—is unlikely to lead to significant losses. It can be assumed as a tolerable level of controlled risk, i.e., tolerable only when the costs of its reduction are adequate to an established given level of safety, i.e., level of heavy individual losses or light collective losses and/or economic losses within the range of 10
4–10
5 Euros. One should keep in mind that when determining weights of scale of the probability category (
Table 4) in the process of a quantitative assessment of probability (frequency) of undesirable event occurrence, the average return period
T must be considered and associated with the probability of exceedance
p, i.e., the probability of achieving or exceeding the value of
p in each year the hydrological system functions.
The values of scales in
Table 4,
Table 5 and
Table 7 are contractual and may be accepted depending on current legal, social and economic conditions, i.e., depending on the adopted policy on safety including protection of the natural environment and cultural goods (property) and approval by potentially affected communities.
Depending on the difference between the level of risk arising from potential threat and the level of unacceptable risk adopted in accordance with ALARP principles, methods for risk assessment adequate to the size of threats should be applied. If the difference is smaller, the chosen method of risk assessment should be more accurate. In cases of major threats and small differences, the principle should be to apply quantitative methods such as ETM (
Figure 4). In the case of a significant difference between the unacceptable level of risk and level of risk arising from a potential small threat, qualitative methods can be used, e.g., Risk Matrix (
Table 6).
5. Summary and General Conclusions
An attempt to provide a mathematical description of the reliable functioning of a river catchment was undertaken using reliability engineering tools drawn from practical aspects of reliability and safety theory. The river catchment was treated as a hydrological system, in which various kinds of threats could arise from interactions between objects (elements) that together constitute the system and affect human safety and the environment in which man functions. Relationships between these elements were described from the point of view of extreme hydrological events occurring in a river catchment, i.e., flooding as result of extreme meteorological events.
Extreme hydrological phenomena leading to flooding were treated as undesirable events from the point of view of human safety (e.g., threat to life, health and property), and as a manifestation of the hydrological system’s lack of fitness for reliable operation. Mechanisms of extreme hydrological threats and the technical and non-technical measures to meet them should be identified first. The hydrological system’s reliability structure should then be specified and described by a mathematical model. A Fault Tree Method was proposed which would allow for a probabilistic description of undesirable events occurring in a hydrologic system. Using an Event Tree Method to develop a hydrological system reliability model, one can evaluate probability of threats and related risk resulting from extreme hydrological events. Measures of reliability and threats were used to make a quantitative assessment of risk probability. Having identified the measure of risk of hydrological extreme events, one can manage it, i.e., knowingly (consciously, deliberately) diagnose and control this risk to ensure the safety of people and the hydrological system itself [
38].
Threats occurring within the hydrological system can be of natural origin or of anthropogenic origin. The occurrence of natural hazards is independent of man and, in principle, man can only monitor and attempt to mitigate their effects. While the presence of anthropogenic hazards is associated with human activities in the river valley and in the catchment area, humans also build all sorts of technical objects. Therefore, these threats can largely be controlled and their risk of occurrence may be managed. In the case of natural hazards, including extreme hydrological and meteorological events, managing risk is much more difficult.
Safety and reliability of river catchment operation and its application to flood protection depends on comprehensive and sustainable human activities in the riverbed and catchment area; i.e., investments in water engineering infrastructure undertaken by humans, civil objects infrastructure (spatial planning) and land-use of catchment area (development of natural catchment retention and river valley retention). Poorly planned investments, particularly in the field of technical defense against floods, will deteriorate effectiveness of flood protection instead of improve it, and will thereby generate social costs in addition to investment costs, which may significantly exceed potential benefits and cause the level of protection against flooding to fall below public expectations.
It should be stressed that the approach to flood risk assessment proposed in the present paper should be considered as complementary to the procedures outlined in the Flood Directive. The intention of the authors is not to replace methods currently in use, but rather to present a different perspective on the evaluation of hazard, risk and reliability of the hydrological system itself as a whole and its elements separately, as affected by extreme events such as floods. As all calculations are made in the probability domain, they do not take into account the time, velocity and depth of flooding, as is done in the classical approach, which is very important when losses are assessed. However, the proposed approach answers the following crucial questions: What is (i) the probability of flooding, taking into account the structure of the particular hydrological system (reliability block diagram), (ii) the possible risk of secondary events and of the peak event engendered by the initial event, and (iii) what is the probability of occurrence of losses equal to or greater than a certain threshold value that decision-makers and affected community agree on. According to the Flood Directive’s so-called classical (traditional) approach: Flood risk means the combination of the probability of a flood event and of the potential adverse consequences, and the flood hazard maps, shall cover the geographical areas which could be flooded according to the following scenarios:
- (i)
Floods of low probability, or extreme event scenarios; representing, as per [
46], areas where the probability of flooding is low and is ≤0.2% (return period
T = 500 years), or there is a non-zero probability of occurrence of extreme events in the area;
- (ii)
floods with a medium probability (likely return period≥100 years); areas where the probability of floods is average and is 1% (T = 100 years);
- (iii)
floods with a high probability, where appropriate; areas where the probability of flooding is high and is 10% (T = 10 years).
The approach proposed in the present paper considers not only the probability of an initial event but also the probabilities of secondary events that lead to failure of hydrological system elements and that of the whole system. In the first stage of analysis (termed initialization) the initial event is identified, i.e., the event that can potentially trigger scenarios of secondary events leading to system failure. At this stage, the analysis also considers the conditions that must be met for the initial event to occur. In a further stage, termed ‘response’, all possible (probable) scenarios (sequences) of events are analyzed, regardless of whether they lead to failure of the system or not. In a third stage, termed ‘implications’, the probability of losses caused by the lack of efficiency of the system and its elements is assessed. Finally, the last stage consists of a risk assessment that allows for recognition of risk in quantitative terms (in a probabilistic sense). Therefore, the authors’ opinions presented in the present paper fit into a holistic approach to flood-reliable operation of a hydrologic system and its elements [
36].


