Factors Affecting the Choice, Intensity, and Allocation of Irrigation Technologies by U.S. Cotton Farmers


1
Texas Institute for Applied Environmental Research (TIAER), Tarleton State University, Tarleton, TX 76401, USA
2
Department of Agricultural Economics and Agribusiness, Louisiana State University (LSU) and LSU Agricultural Center, Baton Rouge, LA 70803, USA
3
Department of Agricultural Economics, Texas Tech University, Lubbock, TX 79409, USA
*
Author to whom correspondence should be addressed.
Water 2018, 10(6), 706; https://doi.org/10.3390/w10060706
Submission received: 23 April 2018
/
Revised: 25 May 2018
/
Accepted: 27 May 2018
/
Published: 30 May 2018
(This article belongs to the Section Water Resources Management, Policy and Governance)
Abstract
:We use the 2013 cotton precision farming survey data to study the adoption of irrigation technologies by cotton farmers in 14 states of the United States. We find that farmers with a higher irrigated yield, and who are from the Southern Plains (Texas and Oklahoma), adopt water-efficient irrigation technologies, such as sub-surface drip and trickle irrigation technologies. There are 10 irrigation technologies that farmers can adopt for cotton production in these 14 cotton-growing states. The intensity of the irrigation technologies, as measured by the number of irrigation technologies adopted in cotton production, is affected by the irrigated cotton yield realized, land holding (total land owned), education, computer use, and the origin of the cotton farmer being from the Southern Plains. We use a multivariate fractional regression model to identify land allocation by the different irrigation technologies used. Our results indicate that significant variables affecting land allocation with different irrigation technologies are the age of the operator, the cover crop, the information sources used, the per acre irrigated yield, the education, and the cotton farmer being from the Southern Plains.
1. Introduction
Frequent drought and inconsistent rainfall patterns necessitate the wise use of limited water resources. Cotton farmers can increase their yield and net returns by adopting an irrigation technology. The choice of an irrigation technology depends on geographical location, land area, and various socioeconomic variables. Cotton farmers have multiple irrigation technologies at their disposal; some farmers use only one technology while others use multiple technologies. The adoption of trickle and subsurface irrigation technologies, such as drip irrigation, helps to increase water use efficiency.
A farmer’s choice to adopt new technologies depends on various factors: education, access to the technologies, age, size of land, and proximity to an urban area [1,2]. Farmers adopt a new technology to maximize utility and this utility maximization may come from increased profit, increased leisure, cost reduction, improved environment quality and being in the forefront of technology [3]. Other factors affect irrigation technology adoption as well. Some farmers adopt an irrigation technology based on whether it is appropriate for their field and how technology helps them to increase profit potential and avoid the risk associated with fluctuating and unpredictable weather patterns. Farmers have been concerned about decreasing aquifer levels, a dwindling surface water supply, and inconsistent rainfall patterns. In many areas, farmers want to be a steward of water resources. This has led to them switching from furrow irrigation and the center pivot system to a more water-efficient system such as subsurface drip or other precision mounted irrigation systems [4,5]. Farmers consider one or more technologies, evaluate their usefulness, and then decide to adopt the technology that they perceive will meet their economic and environmental goals [6,7]. A farmer’s positive experience with one technology is likely to affect their decision to adopt other similar technologies [8].
Scarce water, and the associated high cost of extraction, encourage farmers to adopt more water-efficient technologies [9,10,11,12]. Advanced irrigation technologies such as subsurface drip irrigation, low energy precision application systems, and variable rate irrigation systems require a much higher investment than a traditional irrigation system. The invention of efficient irrigation technologies helps optimize ground water use although it does not necessarily reduce the total water withdrawal from aquifers [12]. Pfeiffer and Lin [12] explain this as a consequence of farmers extending irrigation to marginal land or to increase the proportion of area under irrigation thereby mitigating the water saving benefits of water-efficient technology.
Farmers prefer to adopt efficient irrigation technologies due to escalating energy costs and a declining water table. Physical factors that affect the choice of irrigation technologies are the terrain (slope), soil type, and the type of crops planted. Farmers adopt an irrigation technology if a given irrigation technology needs little maintenance and provides the necessary water for crop growth and maximum yield efficiency. Farmers can utilize water more prudently by using water-efficient irrigation technologies in water deficient areas. In fact, in these water deficient areas, cotton farmers are shifting from conventional to more efficient irrigation technologies [13]. Additionally, farmers are laser land leveling so that water movement occurs more efficiently from one end to the other end of the field.
Farmers are not necessarily restricted to one irrigation technology. Some land, such as land with a lower soil quality or with various levels of slope, may require a combination of irrigation technologies for farmers to maximize profit. Likewise, investing money in installing water saving irrigation technologies in better soil and flat land may not be profitable [9,10,14,15,16]. Farmers may decide to adopt a center pivot irrigation technology on one land parcel whereas they may choose to adopt a furrow irrigation technology on another land parcel. Fractions of land one allocates under each irrigation system may be impacted by several physical and socioeconomic characteristics. When making decisions, fractional dependent variables with a value between 0 and 1 in a continuum are frequently encountered [17,18]. Explanatory variables affecting a fractional dependent variable require analysis by using a fractional regression model. We follow the method developed by Murteira and Ramalho [19] to identify the impact of explanatory variables for the allocation of land using multiple irrigation technologies.
The objectives of this study are three-fold. First, we identify the variables that affect the adoption of water-efficient irrigation technologies in cotton farming. Second, we identify why farmers adopt multiple irrigation technologies and the variables that affect their decision to adopt these technologies. Third, we use a fractional regression model to determine the allocation of land under different irrigation technologies.
The remainder of this paper is structured as follows. First, we describe the methods used in the paper. The methods used include probit, Poisson, and fractional multivariate specification with a multinomial logit link and a multivariate Bernoulli distribution [19]. Next, we describe the survey data collection procedure and explanatory variables included in the model. We then provide the results and conclude the paper.
2. Material and Methods
2.1. Farmers’ Decisions to Adopt Drip or Trickle Water-Efficient Irrigation Technologies
Farmers adopt a technology if technology adoption generates higher utility than non-adoption, and vice versa. Suppose Y is a binary (0 or 1) variable; in our case whether farmers use efficient irrigation technologies or not and explanatory variables X influence the outcome of Y, which is explained by the following expression:
where represents probability, is the cumulative distribution function (CDF) of the standard normal distribution, and we estimate parameter by maximum likelihood. We can estimate this model by using a limited dependent variable model such as a probit model.
2.2. Farmers’ Decisions to Adopt Multiple Irrigation Technologies
Let be the observed number of irrigation technologies used by the cotton farmer. Assume to be independent with a Poisson distribution. The parameters depend on explanatory variables X, which affect the number of irrigation technologies farmers adopt. We express the conditional mean as where denotes the intensity parameter. We represent the Poisson density function as
We can estimate this type of model using a Poisson, a negative binomial, or zero-inflated Poisson models.
2.3. Farmers’ Decisions to Adopt Different Proportions of Land under Different Irrigation Technology
Cotton farmers may use one, or a combination of different irrigation technologies, to cover 100% of the irrigated areas on their farms. Suppose represents the fraction of an area that one irrigates using irrigation technology. These dependent variables possess fractional values that lie between 0 and 1, which we explain by a 1 × K vector of explanatory variables . We address the solution of these type of variables with the nonlinear function satisfying , where is a non-linear model [17]. The conditional mean of the dependent variable is:
where is a known function satisfying condition, is a k × 1 vector and is a matrix of independent variables. The following function estimates by maximizing Bernoulli log-likelihood
where N is the number of cotton farmers. The estimated parameter will only be consistent and asymptotically normal if is correctly defined. For a univariate case, a fractional regression model based on the quasi-likelihood and logistic conditional mean functions is useful [18,19]. Here, regression is done simultaneously by adopting a multivariate specification as cotton farmers select multiple irrigation technologies and those are correlated.
The following functional form of generalization of univariate specification to a multivariate specification with multinomial logit link and multivariate Bernoulli distribution [19] is useful for the fractional regression.
Let be the M vector of the conditional mean function with its components , with where conditional mean varies for all m and = 1. The following multinomial logit specification is used:
where is the fraction of the component of irrigation technology used by producers and subsequently it follows the multivariate Bernoulli (MB) distribution [17]. Therefore, the individual contribution to the log-likelihood is as follows:
where = 1 − . Then the quasi-maximum likelihood estimator is found by maximizing the log-likelihood of all cotton farmers (N):
where is consistent and asymptotically normal.
3. Data, Variables Used and Their Justification
We use data from the 2013 Southern Cotton Farm Survey from fourteen states (Alabama, Arkansas, Florida, Georgia, Kansas, Louisiana, Mississippi, Missouri, North Carolina, Oklahoma, South Carolina, Tennessee, Texas, and Virginia) [20]. Data regarding location, the number of years cotton has been grown on the land, the age of the farmer, the type of livestock, the details of crop rotation and cover crops, the education of the farmer, computer usage for farm management, accessibility of precision equipment, irrigation technology, cotton yield, and household income information were collected through the questionnaire. We adopted the survey procedure suggested by Dillman [21] to collect comprehensive information through the questionnaire, a postage-paid return envelope, and a cover letter describing the purpose of this survey. These questionnaires were sent to the 13,566 selected producers after removing 272 duplicate addresses from the 2011-marketing year. The pre-notification letter was sent on 18 January 2013 to each producer and mentioned that the survey questionnaire about precision farming was coming in two weeks and that we were requesting their participation. On 1 February 2013 the initial mailing of the survey questionnaire was sent followed by a reminder postcard on 8 February 2013. Again, a follow-up was sent to the non-respondents after three weeks, i.e., 22 February 2013. The second, and final round of mail, was sent to the producers explaining the importance of the survey, the questionnaire, and included another prepaid envelope and a reminder that producers did not have to respond if they did not grow cotton during the period from 2008 to 2012. Out of 13,566 mailed questionnaires, 75 were non-respondent, 66 were returned due to incorrect addresses, and a remaining 263 were either farming other crops, retired, or deceased. The final response rate was 13.36% with 1812 usable surveys for analysis.
Table 1 indicates that most of the surveyed cotton farmers adopted center pivot irrigation technology (633 producers), 259 producers had adopted furrow irrigation, 133 adopted sub-surface drip, 28 adopted big or travelling gun, 24 adopted flood, 12 adopted hand move, 11 adopted slide roll, and 4 cotton producers each using equally solid set/fixed and trickle irrigation technologies. We generate new water-efficient irrigation technologies of sub-surface drip and trickle irrigation for the probit regression. The dependent variable for the probit model is one if a cotton farmer adopts the water-efficient irrigation technologies; it is zero if the farmer has not.
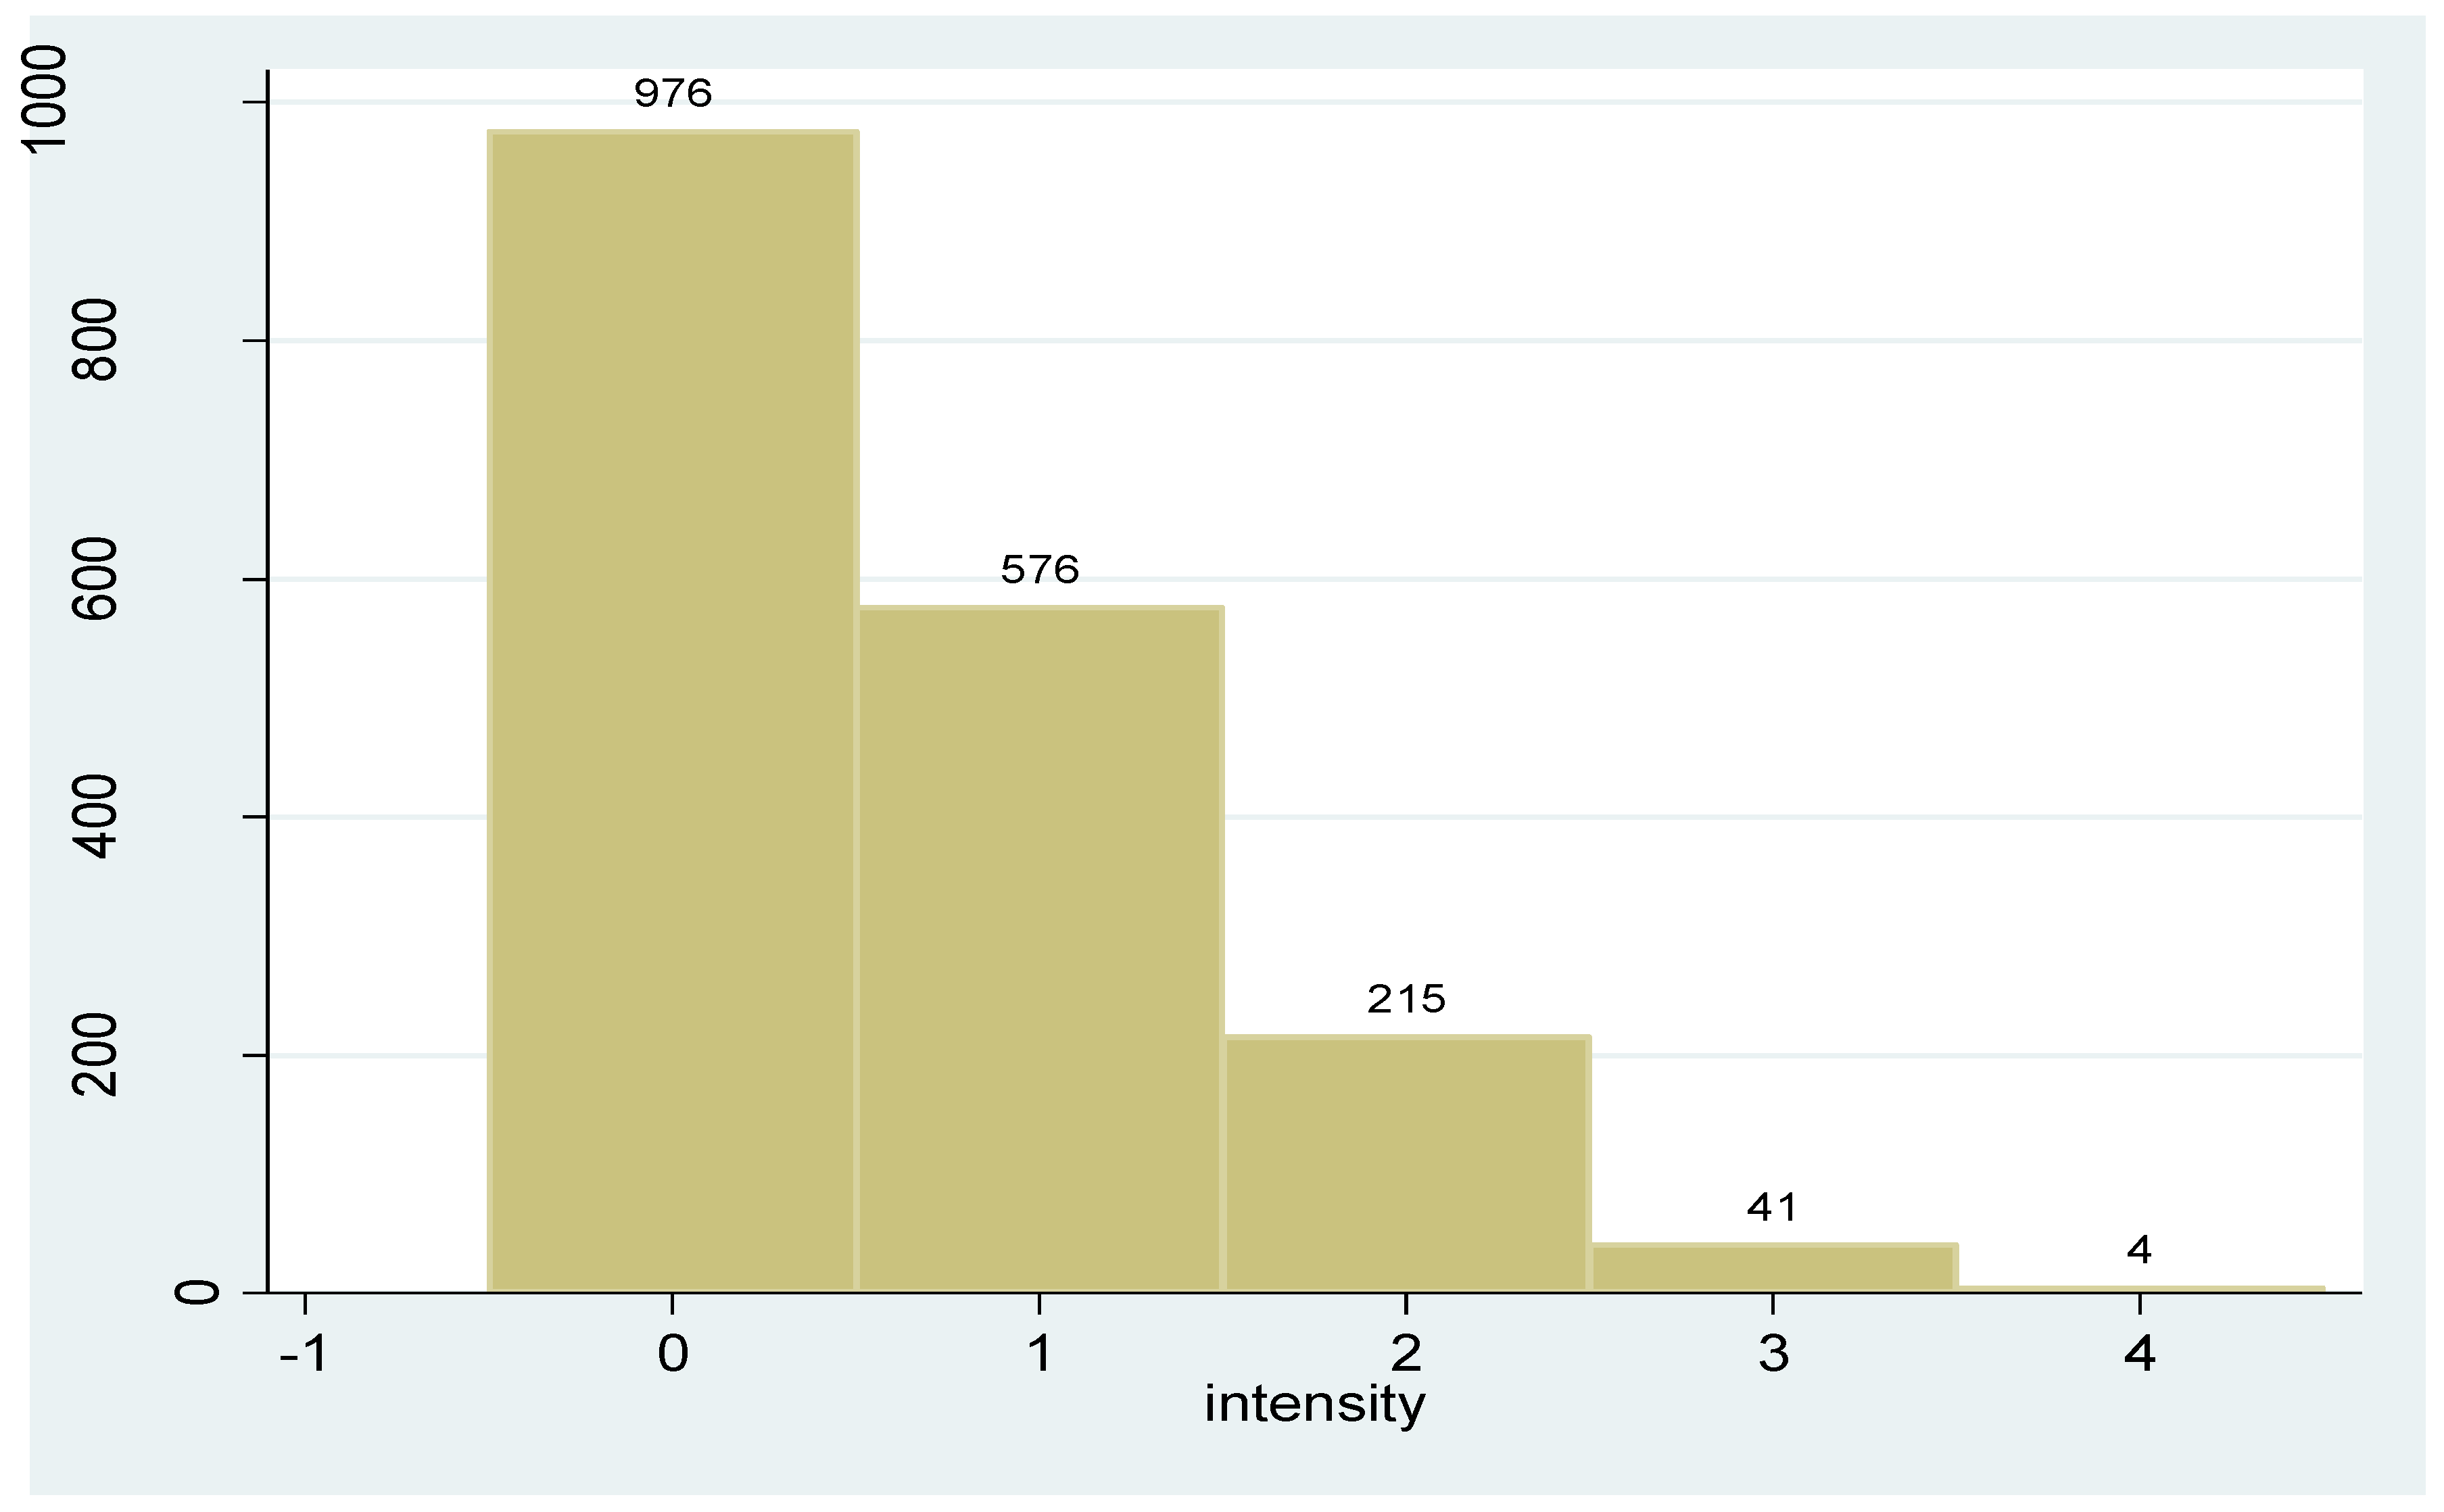
There are in total 10 different irrigation technologies used by cotton farmers in the study region. We count these irrigation technologies and their intensity as the number of total irrigation technologies farmers adopt (Figure 1). This number becomes the dependent variable for the count data regression model. Similarly, we analyze four irrigation technologies: the three major and then the fourth, including all others combined (Table 1). The fraction of total areas (a continuous variable with values between 0 and 1) under these four categories of irrigation technologies, serve as dependent variables for the multivariate fractional regression analysis. The definition of each variable used in the models and their descriptive statistics are presented in Table 2.
In this paragraph, we introduce explanatory variables and justifications for including those in regression models used in this paper. Farm size is an important variable to determine the adoption of technologies [22]. Producer age is also an important variable for determining technology adoption rates [23]. Younger producers are more likely to adopt a new technology than their older counterparts because they are handier with new technologies and believe the new technologies help them to reduce time spent on farming [24]. It is also expected that producers with college education (bachelor or above degree) are likely to adopt a new technology because of the human capital and technological skills one acquires through education [25]. Wealthier producers are likely to adopt technologies such as irrigation technology, particularly drip or trickle, requiring heavy investment. We expect that higher cotton yields are an indicator of land quality and have a positive impact on irrigation technology adoption. Computer use is important in keeping financial records on the farm. Farmers who use computers are more likely to be successful [26]. Computer access helps to find efficient technologies more readily which is useful for finding water-efficient irrigation technologies. It is expected that cover crops preserve moisture [27]. Therefore, producers who plant cover crops are less likely to invest money in adopting water-efficient irrigation technologies in cotton farming.
Our data come from several U.S. states. These states have varying soil and climatic conditions. McCunn and Huffman [28] divide these various states into different ecological regions to analyze agriculture total factor productivity differences produced from investment in research and development. We adopt their ecological region definition in our study. We generate dummy variables for each region: Appalachia, Southeast, Delta States, Southern Plains, Northern Plains, and Mountain regions. Substantial numbers of farmers located in the Southern Plains (Texas and Oklahoma) adopt water-efficient irrigation technologies. Since the Southern Plains frequently face water shortages, farmers in the region are pioneers in adopting modern irrigation technologies for cotton production.
4. Results
We estimate three separate models based on the data and methods that we described in earlier sections.
4.1. Farmers’ Decision to Adopt Drip or Trickle Irrigation Technologies
Results are shown in Table 3. The estimated coefficient of the variable “irrigated yield” is positive and statistically significant at a 1% level, which indicates that yield from the irrigated portion of land is an important reason for choosing drip/trickle irrigation technologies for cotton farming. It is generally true that more yield generates more income for the farmers, so they search for efficient water-efficient irrigation technologies to maximize farm production and profit. The marginal effects of “irrigated yield” are positive, which indicates that adoption of drip/trickle irrigation technologies is increased by 0.06 percent if the irrigated cotton yield increases by one pound.
“Farm location” is another variable that affects the adoption of drip/trickle irrigation technologies. The variable “Southplain”, comprised of Texas and Oklahoma, has the positive and statistically significant coefficient at one percent level. This result indicates that cotton producers from this region realize a higher profit (from yield) from adopting drip/trickle irrigation technologies. The positive marginal effect implies that cotton farmers in the region increase drip/trickle irrigation technology adoption by 191% as compared to cotton farmers in other regions.
Masseroni et al. (2018) [29] have studied the performance of first automatic system for paddy irrigation in Europe. There finding is consistent with previous literature that the automatic system does not reduce water consumption. The major benefit of advance technology such as the automatic system is that it helps to reduce time spent in the field, so farmers are willing to adopt the technology. Masseroni et al. (2017) [30] also indicate that efficiency is a big concern in almost all gravity-based irrigation system in Europe. Similarly, Bekchanov et al. (2016) [31] emphasize the role of drip irrigation in improving water efficiency in Aral Sea Basin of Central Asia. Although we did not find the education variable significant, in other countries such as in China, educated farmers tend to adopt water saving technologies [32].
4.2. Farmers’ Decisions to Adopt Multiple Irrigation Technologies
We estimated negative binomial and zero inflated negative binomial models. The test statistics were not strong to reject a Poisson model. Therefore, results from a Poisson model is interepreted here (see Table 4). Four explanatory variables are statistically significant at a 1 to 10 percent level of significance. The coefficient of the variable “irrigated yield” is positive and significant at one percent level. The marginal effects of the irrigated yield for irrigation intensity is positive, which shows 0.06 percent more chances of increased intensity as irrigated yield increases by one percent. The coefficient of landholding is positive and statistically significant at a level 10 percent. These marginal effects indicate that the intensity of irrigation technology adoption increases by 0.0028 percent as land holding increases by one acre. Education shows a negative but statistically significant coefficient at a 10 percent level. This result implies an inverse relationship between education and irrigation technology intensity. Its marginal effects indicate that an additional level of education decreases irrigation intensity by three percent. Computer use is another important determinant for selecting irrigation intensity for cotton farming, which shows a positive and significant coefficient at a level of 5 percent. Additionally, this result implies 17 percent more intensity of irrigation technology if a farm household uses a computer in decision-making processes. Its marginal effects indicate that the producers who use computers for cotton farm management use 11 percent more irrigation technologies than those who do not use computers. Similarly, the location specific dummy explanatory variable shows a positive relationship with intensity, and it is statistically significant at a 1 percent level. It indicates that Texas and Oklahoma producers adopt more irrigation technologies (56.6 percent) compared to cotton farmers from other regions. Its marginal effects imply that cotton farmers from this region are likely to adopt 37 percent more irrigation technologies than those who are not from this region.
4.3. Farmers’ Decisions to Adopt Different Proportions of Land under Each Irrigation Technology
Marginal effects from the multivariate fractional regression model are shown in Table 5. Results show that a one-year increase in a farmer’s age increases the proportion of land allocated to furrow irrigation by 0.03 percent. This result is supported by the fact that older farmers are not willing to adopt a new or improved technology because they are at the end of their planning horizon [21]. Cotton farmers in the Southern Plains allocate 14.55 percent less land under a furrow irrigation system. This finding is understandable because most of the farmers use water-efficient technologies in the Southern Plains where water is in short supply, and evaporation loss due to the sun exposure is quite high when one uses furrow irrigation. Cotton farmers who use cover crops allocate 0.36 percent more land to a center pivot irrigation technology. Similarly, farmers who use more information sources are more likely to use a center pivot irrigation technology. One more use of information sources increases the proportion of land allocation to center pivot irrigation technology by two percent. In contrast, cotton farmers who are in the Southern Plains allocate 14 percent less land to a center pivot irrigation technology.
The use of cover crops has a negative impact on the allocation of land with water-efficient irrigation technologies. The explanation is that if farmers are using drip or trickle irrigation technology, they may not need or want to use additional moisture conserving cover crop expenses in the farming system. Cover crop planting decreases the proportion of land allocation for drip or trickle irrigation technologies by 0.08%. A higher irrigated yield increases the proportion of land allocation for drip/trickle irrigation technologies. For each pound increase in an irrigated cotton yield, the proportion of land allocated to drip/trickle irrigation increases by 0.002%.
Education also increases the proportion of land allocation using drip or trickle irrigation. Those farmers who are educated are more conscious of natural resources and are likely to choose water conserving irrigation technologies. Farmers in the Southern Plains allocate 29% more land to sub-surface drip or trickle irrigation in comparison to farmers in the other regions.
5. Concluding Remarks
The 2013 Southern Cotton Farm Survey data were used for this research. We considered three objectives; the first objective was to assess variables that affect water-efficient irrigation technology adoption using a probit model. The second objective was to identify the impacts of selected explanatory variables on the adoption intensity of irrigation technologies using a Poisson model. Similarly, a multivariate fractional regression model was used to determine variables that affect the allocation of land under different irrigation technologies. These objectives were explored by using different explanatory variables based on the technology adoption literature, viz., Age, Cover, Information, Irrigated yield, Landholding, Education, Income, Agshare, Compuse, and Southplain.
The two explanatory variables: “Southern plains” and “Irrigated yield,” were statistically significant in the probit model. Because of the Southern Plains’ weather situation and water shortages, farmers generally used more efficient irrigation technologies. In the intensity analysis, we found “irrigated yield,” “landholding,” “education,” “computer use,” and “Southern Plains” to be significant in the model. Only one variable, “education,” showed a negative sign. As the education level increases, farmers can process information more effectively and decide to adopt technologies that meet their profit and environmental goals. It is likely that they reduce the number of irrigation technologies to only those that can generate sufficient profit for them. If the land has various slopes, they may land-level and use only furrow irrigation instead of both furrow and center pivot irrigation technologies. Cotton farmers who use computers for farm management and are also from the Southern Plains are more likely to adopt multiple irrigation technologies. Again, this has to do with understanding the field’s topography and implementing irrigation system based on respective needs.
Results from the multinomial fractional regression model indicated that older farmers are more likely to allocate a higher proportion of land to the furrow irrigation technology. The use of a cover crop increases the proportion of land using a center pivot irrigation system but decreases the amount of land using the drip or trickle irrigation system. A higher irrigated yield enhances farmers’ chances of allocating a higher proportion of land under drip or trickle irrigation technology but decreases the chances of allocating land under the other irrigation technologies (other than furrow, center pivot, and drip irrigation technologies). Education increases the chances of allocating a higher proportion of land to drip or trickle irrigation technologies. Farmers in the Southern Plains allocate more land to drip or trickle irrigation but less land to other irrigation technologies.
This paper provided knowledge of factors affecting land allocation under different irrigation technologies. The major contributions of this paper were twofold: researchers so far have not looked at why farmers adopt multiple irrigation technologies in cotton production systems. Also, there lacks a study on land allocation decision under different irrigation systems. The goal of technology adoption is to maximize utility either by maximizing profit, reducing cost, or adopting better environmental practice such as water-efficient technology. We believe that farmers adopting multiple irrigation technologies have to do with utility maximization and it may come from one of these alternatives. As quality irrigation water becomes a more constrained resource, farmers would use technology that is conducive to their farm and farming situations. This study could have been strengthened further if irrigation related price and cost (per unit water price, per unit extraction cost) information were available. There is also a concern regarding reverse causality between irrigation technology and yield which could be a subject of future research.
Research findings indicate that special emphasis should be placed on educating farmers through cooperative extension service and in the Southern Plains region to improve more effective irrigation technology adoption by farmers. Encouraging farmers to adopt a cover crop may help to preserve soil moisture, but it may have an unintended consequence of reducing the proportion of land allocated to drip/trickle irrigation technologies. The cost of technology, the price of water, and the physical features of the land are also important factors in irrigation technology adoption. Unfortunately, data limitation prevented us from identifying the role of these variables in the decision to adopt irrigation technologies.
Author Contributions
K.P.P. and B.P.K. conceived the idea; B.P.K. did the economic analysis and wrote the first draft under K.P.P.’s guidance, K.P.P. and E.S. prepared the final manuscript.
Funding
This research was partially funded by Cotton Incorporated, Grant number 09-623. Paudel’s time in this paper was supported by United States Department of Agriculture, Hatch project #94358 “Management and Policy Challenges in a Water Scarce World.”
Conflicts of Interest
Cotton Incorporated partially supported this research but it had no role in the design of the study; in the collection, analyses, or interpretation of data; in the writing of the manuscript, and in the decision to publish the results.
References
- Koundouri, P.; Nauges, C.; Tzouvelekas, V. Technology adoption under production uncertainty: Theory and application to irrigation technology. Am. J. Agric. Econ. 2006, 88, 657–670. [Google Scholar] [CrossRef]
- Pannell, D.J.; Marshall, G.R.; Barr, N.; Curtis, A.; Vanclay, F.; Wilkinson, R. Understanding and promoting adoption of conservation practices by rural landholders. Aust. J. Exp. Agric. 2006, 46, 1407–1424. [Google Scholar] [CrossRef]
- Pandit, M.; Mishra, A.K.; Paudel, K.P.; Larkin, S.L.; Rejesus, R.M.; Lambert, D.M.; English, B.C.; Larson, J.A.; Velandia, M.M.; Roberts, R.K.; et al. Reasons for adopting precision farming: A case study of U.S. cotton farmers. In Proceedings of the 2011 Annual Meeting, Corpus Christi, TX, USA, 5–8 February 2011; No. 98575. Southern Agricultural Economics Association: Griffin, GA, USA, 2011. [Google Scholar]
- Lichtenberg, E.; Majsztrik, J.; Saavoss, M. Grower demand for sensor-controlled irrigation. Water Resour. Res. 2015, 51, 341–358. [Google Scholar] [CrossRef]
- Taylor, R.; Zilberman, D. Diffusion of Drip Irrigation: The Case of California. Appl. Econ. Perspect. Policy 2017, 39, 16–40. [Google Scholar] [CrossRef]
- Byerlee, D.; De Polanco, E.H. Farmers’ stepwise adoption of technological packages: Evidence from the Mexican Altiplano. Am. J. Agric. Econ. 1986, 68, 519–527. [Google Scholar] [CrossRef]
- Leathers, H.D.; Smale, M. A Bayesian approach to explaining sequential adoption of components of a technological package. Am. J. Agric. Econ. 1991, 73, 734–742. [Google Scholar] [CrossRef]
- Weber, J.G. Social learning and technology adoption: The case of coffee pruning in Peru. Agric. Econ. 2012, 43, 73–84. [Google Scholar] [CrossRef]
- Dinar, A.; Yaron, D. Influence of quality and scarcity of inputs on the adoption of modern irrigation technologies. West. J. Agric. Econ. 1990, 15, 224–233. [Google Scholar]
- Green, G.; Sunding, D.; Zilberman, D.; Parker, D. Explaining irrigation technology choices: A microparameter approach. Am. J. Agric. Econ. 1996, 78, 1064–1072. [Google Scholar] [CrossRef]
- Peterson, J.M.; Ding, Y. Economic adjustments to groundwater depletion in the high plains: Do water-saving irrigation systems save water? Am. J. Agric. Econ. 2005, 87, 147–159. [Google Scholar] [CrossRef]
- Pfeiffer, L.; Lin, C.-Y.C. Does efficient irrigation technology lead to reduced groundwater extraction? Empirical evidence. J. Environ. Econ. Manag. 2014, 67, 189–208. [Google Scholar] [CrossRef]
- Weinheimer, J.; Johnson, P.; Mitchell, D.; Johnson, J.; Kellison, R. Texas High Plains initiative for strategic and innovative irrigation management and conservation. J. Contemp. Water Res. Educ. 2013, 151, 43–49. [Google Scholar] [CrossRef]
- Lichtenberg, E. Land quality, irrigation development, and cropping patterns in the northern high plains. Am. J. Agric. Econ. 1989, 71, 187–194. [Google Scholar] [CrossRef]
- Negri, D.H.; Brooks, D.H. Determinants of irrigation technology choice. West. J. Agric. Econ. 1990, 15, 213–223. [Google Scholar]
- Shrestha, R.B.; Gopalakrishnan, C. Adoption and diffusion of drip irrigation technology: An econometric analysis. Econ. Dev. Cult. Chang. 1993, 41, 407–418. [Google Scholar] [CrossRef]
- Papke, L.E.; Wooldridge, J.M. Econometric methods for fractional response variables with an application to 401 (k) plan participation rates. J. Appl. Econ. 1996, 11, 619–632. [Google Scholar] [CrossRef]
- Papke, L.E.; Wooldridge, J.M. Panel data methods for fractional response variables with an application to test pass rates. J. Econ. 2008, 145, 121–133. [Google Scholar] [CrossRef]
- Murteira, J.M.R.; Ramalho, J.J.S. Regression analysis of multivariate fractional data. Econ. Rev. 2016, 35, 515–552. [Google Scholar] [CrossRef]
- Zhou, X.; English, B.C.; Boyer, C.N.; Roberts, R.K.; Larson, J.A.; Lambert, D.M.; Velandia, M.; Falconer, L.L.; Martin, S.W.; Larkin, S.L.; et al. Precision Farming by Cotton Producers in Fourteen Southern States; Results from the 2013 Southern Cotton Farm Survey, Research Series 15-001; Department of Agricultural Economics, The University of Tennessee Agricultural Experiment Station: Knoxville, TN, USA, 2015. [Google Scholar]
- Dillman, D.A. Mail and Telephone Surveys: The Total Design Method; Wiley: New York, NY, USA, 1978; Volume 19. [Google Scholar]
- Banerjee, S.; Martin, S.W.; Roberts, R.K.; Larkin, S.L.; Larson, J.A.; Paxton, K.W.; English, B.C.; Marra, M.C.; Reeves, J.M. A binary logit estimation of factors affecting adoption of GPS guidance systems by cotton producers. J. Agric. Appl. Econ. 2008, 40, 345–355. [Google Scholar] [CrossRef]
- Paudel, K.P.; Gauthier, W.M.; Westra, J.V.; Hall, L.M. Factors influencing and steps leading to the adoption of best management practices by Louisiana dairy farmers. J. Agric. Appl. Econ. 2008, 40, 203–222. [Google Scholar] [CrossRef]
- Feder, G.; Just, R.E.; Zilberman, D. Adoption of agricultural innovations in developing countries: A survey. Econ. Dev. Cult. Chang. 1985, 33, 255–298. [Google Scholar] [CrossRef]
- Caswell, M.; Fuglie, K.; Ingram, C.; Jans, S.; Kascak, C. Adoption of Agricultural Production Practices; AER-792; Economic Research Service; USDA: Washington, DC, USA, 2001.
- Mishra, A.K.; El-Osta, H.S.; Johnson, J.D. Factors contributing to earnings success of cash grain farms. J. Agric. Appl. Econ. 1999, 31, 623–637. [Google Scholar] [CrossRef]
- Lu, Y.-C.; Watkins, K.B.; Teasdale, J.R.; Abdul-Baki, A.A. Cover crops in sustainable food production. Food Rev. Int. 2000, 16, 121–157. [Google Scholar] [CrossRef]
- McCunn, A.; Huffman, W.E. Convergence in US productivity growth for agriculture: Implications of interstate research spillovers for funding agricultural research. Am. J. Agric. Econ. 2000, 82, 370–388. [Google Scholar] [CrossRef]
- Masseroni, D.; Moller, P.; Tyrell, R.; Romani, M.; Lasagna, A.; Sali, G.; Facchi, A.; Gandolfi, C. Evaluating performances of the first automatic system for paddy irrigation in Europe. Agric. Water Manag. 2018, 201, 58–69. [Google Scholar] [CrossRef]
- Masseroni, D.; Ricart, S.; de Cartagena, F.R.; Monserrat, J.; Gonçalves, J.M.; de Lima, I.; Facchi, A.; Sali, G.; Gandolfi, C. Prospects for improving gravity-fed surface irrigation systems in Mediterranean European contexts. Water 2017, 9, 20. [Google Scholar] [CrossRef]
- Bekchanov, M.; Ringler, C.; Bhaduri, A.; Jeuland, M. Optimizing irrigation efficiency improvements in the Aral Sea Basin. Water Resour. Econ. 2016, 13, 30–45. [Google Scholar] [CrossRef]
- Tang, J.; Folmer, H.; Xue, J. Adoption of farm-based irrigation water-saving techniques in the Guanzhong Plain, China. Agric. Econ. 2016, 47, 445–455. [Google Scholar] [CrossRef] [Green Version]
Figure 1.
Number of irrigation technologies (intensity) adopted by cotton farmers in the sample of 14 U.S. cotton production states.
Figure 1.
Number of irrigation technologies (intensity) adopted by cotton farmers in the sample of 14 U.S. cotton production states.


Table 1.
Irrigation technology adopted by cotton farmers in the study region.
| Irrigation Technologies | Number of Cotton Farmers | Percentage of Total Farmers |
|---|---|---|
| Furrow | 259 | 23.06 |
| Flood | 24 | 2.14 |
| Center Pivot | 633 | 56.37 |
| Hand Move | 12 | 1.07 |
| Solid Set/Fixed | 4 | 0.36 |
| Linear Move | 15 | 1.34 |
| Big or Travelling Gun | 28 | 2.49 |
| Slide Roll | 11 | 0.98 |
| Subsurface Drip | 133 | 11.84 |
| Trickle | 4 | 0.36 |
Table 2.
Definition and summary of variables.
| Variable | Variable Definition | Obs. | Mean | SD | Min | Max |
|---|---|---|---|---|---|---|
| DEPENDENT | ||||||
| Prcenter | Fraction of farmers using center pivot irrigation technology | 832 | 0.659 | 0.422 | 0 | 1 |
| Prdrip | Fraction of farmers using drip or trickle irrigation technology | 832 | 0.073 | 0.221 | 0 | 1 |
| Prfurrow | Fraction of farmers using furrow irrigation technology | 832 | 0.204 | 0.362 | 0 | 1 |
| Prother | Fraction of farmers using other than furrow, center pivot, or water-efficient irrigation technologies | 832 | 0.063 | 0.222 | 0 | 1 |
| Waterefficient | Farmers adopting either drip or trickle irrigation technologies = 1 if trickle otherwise = 0 | 1812 | 0.074 | 0.262 | 0 | 1 |
| INDEPENDENT | ||||||
| Age | Producer’s age in year | 1783 | 55.486 | 13.399 | 18 | 98 |
| Agshare | Share of income from agriculture source | 1607 | 73.479 | 28.342 | 0 | 100 |
| Cover | Whether farmer has planted cover crops, =1 for yes; 0 otherwise | 1812 | 20.750 | 35.089 | 0 | 100 |
| Compuse | Computer use for cotton production | 1731 | 0.561 | 0.496 | 0 | 1 |
| Education | Producers final education level | 1780 | 3.374 | 1.259 | 1 | 6 |
| Landholding | Total land owned (acres) | 1812 | 661.582 | 1154.129 | 0 | 11,000 |
| Information | Source of information used | 1718 | 2.091 | 1.428 | 0 | 8 |
| Irrigated yield | Average irrigation cotton yield (pounds/acre) | 1812 | 357.162 | 550.206 | 0 | 2573 |
| Income | Household income from both farm and non-farm sources | 1657 | 3.028 | 1.495 | 1 | 6 |
| Southplain | If a farm is in TX or OK = 1, otherwise = 0 | 1812 | 0.348 | 0.476 | 0 | 1 |
Table 3.
Parameter and marginal effects of variables affecting the adoption of water-efficient irrigation technologies (subsurface/drip).
Table 3.
Parameter and marginal effects of variables affecting the adoption of water-efficient irrigation technologies (subsurface/drip).
| Variables | Coefficients | Marginal Effects |
|---|---|---|
| Age | −0.002 | 0.000 |
| (0.005) | (0.001) | |
| Cover | −0.002 | 0.000 |
| (0.002) | (0.000) | |
| Information | 0.005 | 0.001 |
| (0.048) | (0.005) | |
| Irrigated yield | 0.000 *** | 0.001 *** |
| (0.000) | (0.001) | |
| Landholding | 0.000 | 0.000 |
| (0.000) | (0.000) | |
| Education | 0.039 | 0.004 |
| (0.050) | (0.005) | |
| Income | 0.004 | 0.000 |
| (0.039) | (0.004) | |
| Agshare | 0.002 | 0.000 |
| (0.002) | (0.000) | |
| Compuse | 0.203 | 0.020 |
| (0.145) | (0.014) | |
| Southplain | 1.908 *** | 0.191 *** |
| (0.214) | (0.021) |
Note: Standard errors in parentheses. *** p < 0.01.
Table 4.
Factors affecting the number of irrigation technologies adoption (intensity) by cotton farmers.
Table 4.
Factors affecting the number of irrigation technologies adoption (intensity) by cotton farmers.
| Variables | Coefficients | Marginal Effects |
|---|---|---|
| Age | 0.002 | 0.001 |
| (0.003) | (0.002) | |
| Cover | 0.001 | 0.001 |
| (0.001) | (0.001) | |
| Information | −0.007 | −0.004 |
| (0.024) | (0.016) | |
| Irrigated yield | 0.010 *** | 0.000 *** |
| (0.000) | (0.000) | |
| Landholding | 0.000 * | 0.000 * |
| (0.027) | (0.000) | |
| Education | −0.049 | 0.030 * |
| (0.022) | (0.018) | |
| Income | −0.001 | −0.001 |
| (0.001) | (0.015) | |
| Agshare | 0.002 | 0.001 |
| (0.001) | (0.001) | |
| Compuse | 0.017 ** | 0.111 ** |
| (0.073) | (0.048) | |
| Southplain | 0.566 *** | 0.375 *** |
| (0.067) | (0.046) |
Note: Standard errors in parentheses. * p < 0.10, ** p < 0.05, *** p < 0.01.
Table 5.
Marginal effects of land allocation under alternative irrigation technologies using a multivariate fractional regression model.
Table 5.
Marginal effects of land allocation under alternative irrigation technologies using a multivariate fractional regression model.
| Variables | Furrow | Center Pivot | Drip/Trickle | Others |
|---|---|---|---|---|
| Age | 0.000 *** | 0.001 | 0.000 | −0.001 |
| (0.001) | (0.001) | (0.001) | (0.001) | |
| Cover | −0.003 | 0.004 *** | −0.001 ** | 0.000 |
| (0.000) | (0.000) | (0.000) | (0.000) | |
| Information | −0.005 | 0.020 * | −0.003 | −0.011 |
| (0.010) | (0.012) | (0.006) | (0.007) | |
| Irrigated yield | 0.000 | 0.000 | 0.000 * | −0.000* |
| (0.000) | (0.000) | (0.000) | (0.000) | |
| Education | −0.014 | 0.003 | 0.011 * | −0.001 |
| (0.010) | (0.012) | (0.006) | (0.007) | |
| Income | −0.001 | 0.003 | 0.000 | −0.002 |
| (0.009) | (0.011) | (0.005) | (0.006) | |
| Agshare | −0.001 | 0.001 | 0.000 | 0.000 |
| (0.001) | (0.001) | (0.000) | (0.000) | |
| Compuse | −0.036 | 0.053 | 0.000 | −0.018 |
| (0.029) | (0.034) | (0.020) | (0.017) | |
| Southplain | −0.146 *** | −0.137 *** | 0.290 *** | −0.008 |
| (0.025) | (0.042) | (0.048) | (0.014) |
Note: Standard errors in parentheses. * p < 0.10, ** p < 0.05, *** p < 0.01.
© 2018 by the authors. Licensee MDPI, Basel, Switzerland. This article is an open access article distributed under the terms and conditions of the Creative Commons Attribution (CC BY) license (http://creativecommons.org/licenses/by/4.0/).
Share and Cite
MDPI and ACS Style
Pokhrel, B.K.; Paudel, K.P.; Segarra, E. Factors Affecting the Choice, Intensity, and Allocation of Irrigation Technologies by U.S. Cotton Farmers. Water 2018, 10, 706. https://doi.org/10.3390/w10060706
AMA Style
Pokhrel BK, Paudel KP, Segarra E. Factors Affecting the Choice, Intensity, and Allocation of Irrigation Technologies by U.S. Cotton Farmers. Water. 2018; 10(6):706. https://doi.org/10.3390/w10060706
Chicago/Turabian StylePokhrel, Bijay K., Krishna P. Paudel, and Eduardo Segarra. 2018. "Factors Affecting the Choice, Intensity, and Allocation of Irrigation Technologies by U.S. Cotton Farmers" Water 10, no. 6: 706. https://doi.org/10.3390/w10060706
Note that from the first issue of 2016, this journal uses article numbers instead of page numbers. See further details here.