Article

Coastal Aquifer Contamination and Geochemical Processes Evaluation in Tugela Catchment, South Africa—Geochemical and Statistical Approaches

by
Badana Ntanganedzeni
1,
Vetrimurugan Elumalai
1,* and
Natarajan Rajmohan
2
1
Department of Hydrology, University of Zululand, Kwa Dlangezwa 3886, South Africa
2
Water Research Center, King Abdulaziz University, Jeddah 21598, Saudi Arabia
*
Author to whom correspondence should be addressed.
Water 2018, 10(6), 687; https://doi.org/10.3390/w10060687
Submission received: 7 March 2018 / Revised: 29 March 2018 / Accepted: 5 April 2018 / Published: 25 May 2018
(This article belongs to the Section Water Quality and Contamination)

Abstract

:
Assessment of groundwater quality, contamination sources and geochemical processes in the coastal aquifer of Tugela Catchment, South Africa were carried out by the geochemical and statistical approach using major ion chemistry of 36 groundwater samples. Results suggest that the spatial distribution pattern of EC, TDS, Na, Mg, Cl and SO4 are homogenous and elevated concentrations are observed in the wells in the coastal region and few wells near the Tugela River. Wells located far from the coast are enriched by Ca, HCO3 and CO3. Durov diagrams, Gibbs plots, ionic ratios, chloro alkaline indices (CAI1 and CAI2) and correlation analysis imply that groundwater chemistry in the coastal aquifer of Tugela Catchment is regulated by the ion exchange, mineral dissolution, saline sources, and wastewater infiltration from domestic sewage; septic tank leakage and irrigation return flow. Principle component analysis also ensured the role of saline and anthropogenic sources and carbonates dissolution on water chemistry. Spatial distributions of factor score also justify the above predictions. Groundwater suitability assessment indicates that around 80% and 90% of wells exceeded the drinking water standards recommended by the WHO and South African drinking water standards (SAWQG), respectively. Based on SAR, RSC, PI, and MH classifications, most of the wells are suitable for irrigation in the study region. USSL classification suggests that groundwater is suitable for coarse-textured soils and salt-tolerant crops. The study recommends that a proper management plan is required to protect this coastal aquifer efficiently.

1. Introduction

Groundwater in the coastal aquifer is generally affected by the complex geochemical processes and multiple contamination sources [1,2,3]. Increasing population rates, intense irrigation activities, drainage patterns for industries and domestic sewage systems in the urban coastal areas resulted in severe damages to the groundwater quality [4,5,6]. Identification of individual factors responsible for groundwater contamination is often challenging [6]. Geochemical processes in the aquifer are strongly related to geological formations, climatic conditions, groundwater flow, residence time, etc. [7,8]. In the arid and semi-arid climatic condition, evaporation, ion exchange reactions, oxidation-reduction processes, dissolution and precipitation of minerals takes place in the aquifer, which alters groundwater chemistry [9,10,11]. In the coastal aquifer, surface contamination sources play a major role on water pollution due to shallow depth compared to natural processes. Intensive irrigation practices, domestic sewage, septic tank effluents, dumping sites, etc. are reported as major root causes for groundwater contamination worldwide [12,13]. Geochemistry and multivariate statistics are broadly used in groundwater contamination assessment and several researchers applied major ion chemistry and multivariate statistics to assess the geochemical processes and groundwater contamination in the aquifer [9,14,15,16,17]. Even though multivariate statistics do not directly identify the geochemical characterization, it establishes data redundancy through key factors [18,19,20].
The present study was executed in the coastal aquifer of Tugela Catchment to evaluate the contamination sources and geochemical processes responsible for water chemistry and water suitability for drinking and irrigation uses. The coastal aquifer of Tugela river catchment is one of the largest catchments where intensive irrigation is being practiced. This catchment is a significant one among the 19 water catchments in this region. The surface water resources are depleting due to uneven and infrequent rainfall. Consequently, the water allocation and management has seldom achieved its goal. The approximate amount of groundwater consumption from the Tugela region is about 513 (million m³/a) and it can be utilized during normal and drought conditions [21]. However, several developmental expansions and intensive irrigation practices have resulted over exploitation of this aquifer, which caused severe damages to both groundwater quantity and quality [22,23]. These impose a stress on the future water allocation and management if the proper management is not implemented in the study area. Thus, detailed knowledge about the groundwater quality, contamination sources and relevant geochemical processes in the coastal aquifer can help improve groundwater management and planning in the study area.
Previous studies carried out in the various parts of the world including South Africa [24,25,26,27,28,29,30,31,32,33], do not involve the detailed investigation of geochemical processes and contaminations sources in the study area. Therefore, a comprehensive investigation in the coastal aquifer of Tugela Catchment was carried out through an integrated approach with an intention to gain thorough knowledge about the groundwater regime. The purpose of this study is to evaluate the groundwater chemistry and its associated geochemical processes and to evaluate the contamination sources in this coastal aquifer. In addition, groundwater suitability for drinking and irrigation purposes are also assessed using major ion chemistry.

2. Materials and Methods

2.1. Description of Study Area

The River Tugela is one of the largest rivers in the country flowing 405 km long with the headwater originating in the Mont-aux-Sources of the Drakensberg Mountains at 3109 m elevation near Bergville flowing predominantly in the KwaZulu-Natal province and drains into the Indian Ocean approximately 85 km north of Durban [34]. The study area comprises the costal aquifers of the Tugela Catchment and covers approximately 840 km2 from the confluence of Bushmans River and until it reaches the river mouth at the Indian Ocean flowing through Mandini town and Isithebe industrial area (Figure 1). Generally, areas around Drakensberg Mountains experience wet and cold climate while the areas covering from Colenso down towards the coast experience dry to hot climate, however the climate in the coastal areas does not vary with space predominantly exhibiting hot and humid conditions at the coast. The average rainfall in the catchment ranges approximately 1500 mm/year in and around the mountains and about 650 mm/year in the central parts of the catchment [35]. A slight increase in rainfall can be observed towards the coast contributing 30% of total rainfall received in which predominant rainfall (>80%) is received during the wet summer season between October and March [36]. Runoff at Tugela River is generally substantial and estimated mean annual runoff is reported to be 3900 × 106 m3 [37]. The mean annual discharge is between 184 and 226 m3/s with an average discharge rate high in summer due to very high rainfall during the summer season.
The land use in the study region is under commercial dry land agriculture with high stock rates [38]. According to the Tugela Water Management area report [39], the estimation of total irrigation area is around 276 km2. Commercial timber, sugarcane and dry land maize cultivations are practiced utilizing the water resources from the coastal Tugela Catchment. The SAPPI, which is the biggest paper industry, is situated in the region. Isithebe industrial area is located near to the coast. Geologic formations identified in the catchment areas include Basaltic lava of the Drakensberg, Stormberg and Beaufort beds, old granites and gneisses, sandstone, and rocks of Dwyka and Ecca series. Though the geology of the entire Tugela Catchment is very complex, the coastal aquifer is underlain by hard rocks of the basement complex and complicated sedimentary strata of the Natal Group Sandstone (NGS) and Karoo super group. The aquifer system in the study area is composed of diverse rocks with high porosity due to fracturing and weathering processes. All lithological units identified in the study area are inter-granular and fractured aquifers. The groundwater occurs in these inter-granular, fractured karst aquifers and some occur in quaternary alluvial sediments. Typical depths of the groundwater level ranges from 10 to 30 m below ground level (BGL).

2.2. Methods

Groundwater samples were collected from 36 bore wells in the coastal aquifer on the either sides of Tugela River (riverbed) starting from areas near the river mouth of Indian Ocean during the month of March 2017. Before collecting the groundwater samples, stagnant groundwater in the bore well was removed through pumping to ensure the fresh water representing aquifer. Electrical Conductivity (EC), temperature, dissolved oxygen (DO), total dissolved solids (TDS), oxidation-reduction potential (ORP) and pH were measured in the field using YSI multi-probe digital meter (Aquaprobe A-700). Portable water level indicator was used to measure the groundwater level in the field. Samples were filtered in the field using 0.45 µm Millipore membrane filter and stored in HDPE bottles. The collected samples were transported to the University of Zululand for further analysis. The filtered samples were analyzed for major cations (Ca, Mg, Na, K) and Si using Inductively Coupled Plasma (ICP-41) in the Department of Agriculture and anions (Cl, CO3, HCO3 and SO4) by standard titration methods [40] in the Department of Hydrology, University of Zululand.
The water quality data were utilized in various calculations and interpretations. All the spatial maps were prepared using ArcGIS 10.1 with Ordinary kriging (OK) model. This model is widely accepted and is employed in several pieces of research ([41,42,43]. The Geochemist’s Workbench was employed to understand the hydrochemical facies in the groundwater. Statistical analyses were carried out using SPSS V 21. The data were compared with national (SAWQG) and international standards (WHO) to assess the suitability of water for drinking. Likewise, the irrigational suitability of groundwater in the study region is assessed using EC, sodium adsorption ratio, Kelley’s ratio, sodium percentage, residual sodium carbonate, Magnesium hazard, Permeability Index and USSL classifications.

3. Results

Descriptive statistics of analyzed parameters in the water samples are reported in Table 1. Groundwater pH in the study area ranges from 6.5 to 7.89 with an average of 7.13. Around 68% of samples are neutral to alkaline in nature (pH > 7) and 38% is acidic in nature (pH < 7) in Tugela Catchment. EC of groundwater in this region varies from 408 to 29,240 µS/cm with an average value of 2687 µS/cm. Likewise, TDS in groundwater ranges from 261 to 18,714 mg/L with an average of 1720 mg/L. The groundwater is fresh to brackish in nature (TDS > 1000 mg/L in 21 samples) [44]. High level of TDS in most samples is due to high levels of sodium, chloride and sulfate ions. In addition, wells located near the coast (i.e., N28 and N29) have very high TDS due to the influences of saline sources. In the study region, Na and Cl are dominant cation and anion, respectively found in the groundwater. To understand the hydrochemical facies and related processes Piper and Durov [45,46] diagrams are employed. Figure 2 depicts that all samples plotted in the NaCl zone and imply the water type as NaCl. In addition, all samples have high Na + K and Cl as observed in the cation and anion triangles. Likewise, in the Durov diagram, all samples clustered on the simple mixing line with high Na and Cl (Figure 3).

3.1. Spatial Variation of Major Ion

Figure 4 and Figure 5 illustrate the spatial distribution of Ca, Mg, Na, K, HCO3, CO3, Cl, and SO4 in the study area. Spatial distribution maps indicate that high concentrations of Na, K, Cl and SO4 are observed in the coastal wells. In the study area, sodium concentration ranges from 48 to 6971 mg/L with an average of 491 mg/L. In addition to coastal wells, high sodium is observed in the wells located along the river Tugela.
Potassium occurs naturally in groundwater and its concentration is generally lower than calcium, magnesium, and sodium. In this study, it varies from 2 to 10 mg/L with a mean value of 5 mg/L. Potassium is mostly high in the middle of the study area particularly near Tugela River and close to the sea (Figure 4). Potassium is usually released by silicate weathering and/or clay-water interaction and retain in the clay materials. Hence, it is lower in the groundwater system. Spatial distribution of calcium indicates that low concentration is recorded all along the coast and from northeast to southeast region (Figure 4). Reverse is true in the remaining area and high concentration is observed far from coast. The concentration of calcium in the study area is between 13 and 147 mg/L with an average of 49 mg/L (Table 1). Likewise, the concentration of magnesium in the study area is from 8 to 112 mg/L with a mean value of 27 mg/L. Spatial distribution indicates that only few pockets show high Mg concentrations and extreme values is noted in the coastal wells.
The spatial distribution pattern of Na and Cl are comparable and high chloride is recorded at coastal wells and the wells near Tugela River. Chloride is a dominant anion and it varies from 95 to 9926 mg/L with a mean value of 753 mg/L. The concentration of sulfate in the study area ranges from 5 to 1330 mg/L with an average of 89 mg/L. It is important to note that the standard deviations of Na, Cl and SO4 are higher than the mean values, which suggests that these elements are likely originated from multiple sources in the study area. The spatial distribution of SO4 also behaves similar to Cl and wells near the coast and river Zinkwazi have high concentrations.
Spatial distribution of bicarbonate and carbonate apparently shows that wells in the center and western part of the study area have high concentration compared to coastal wells (Figure 5). Bicarbonate ranges from 49 to 311 mg/L with an average of 159 mg/L. Bicarbonate and carbonate behave similar to calcium and low concentration is observed in the coastal region and from northeast to southeast direction.

3.2. Source of Contamination and Geochemical Processes

3.2.1. Geochemical Approach

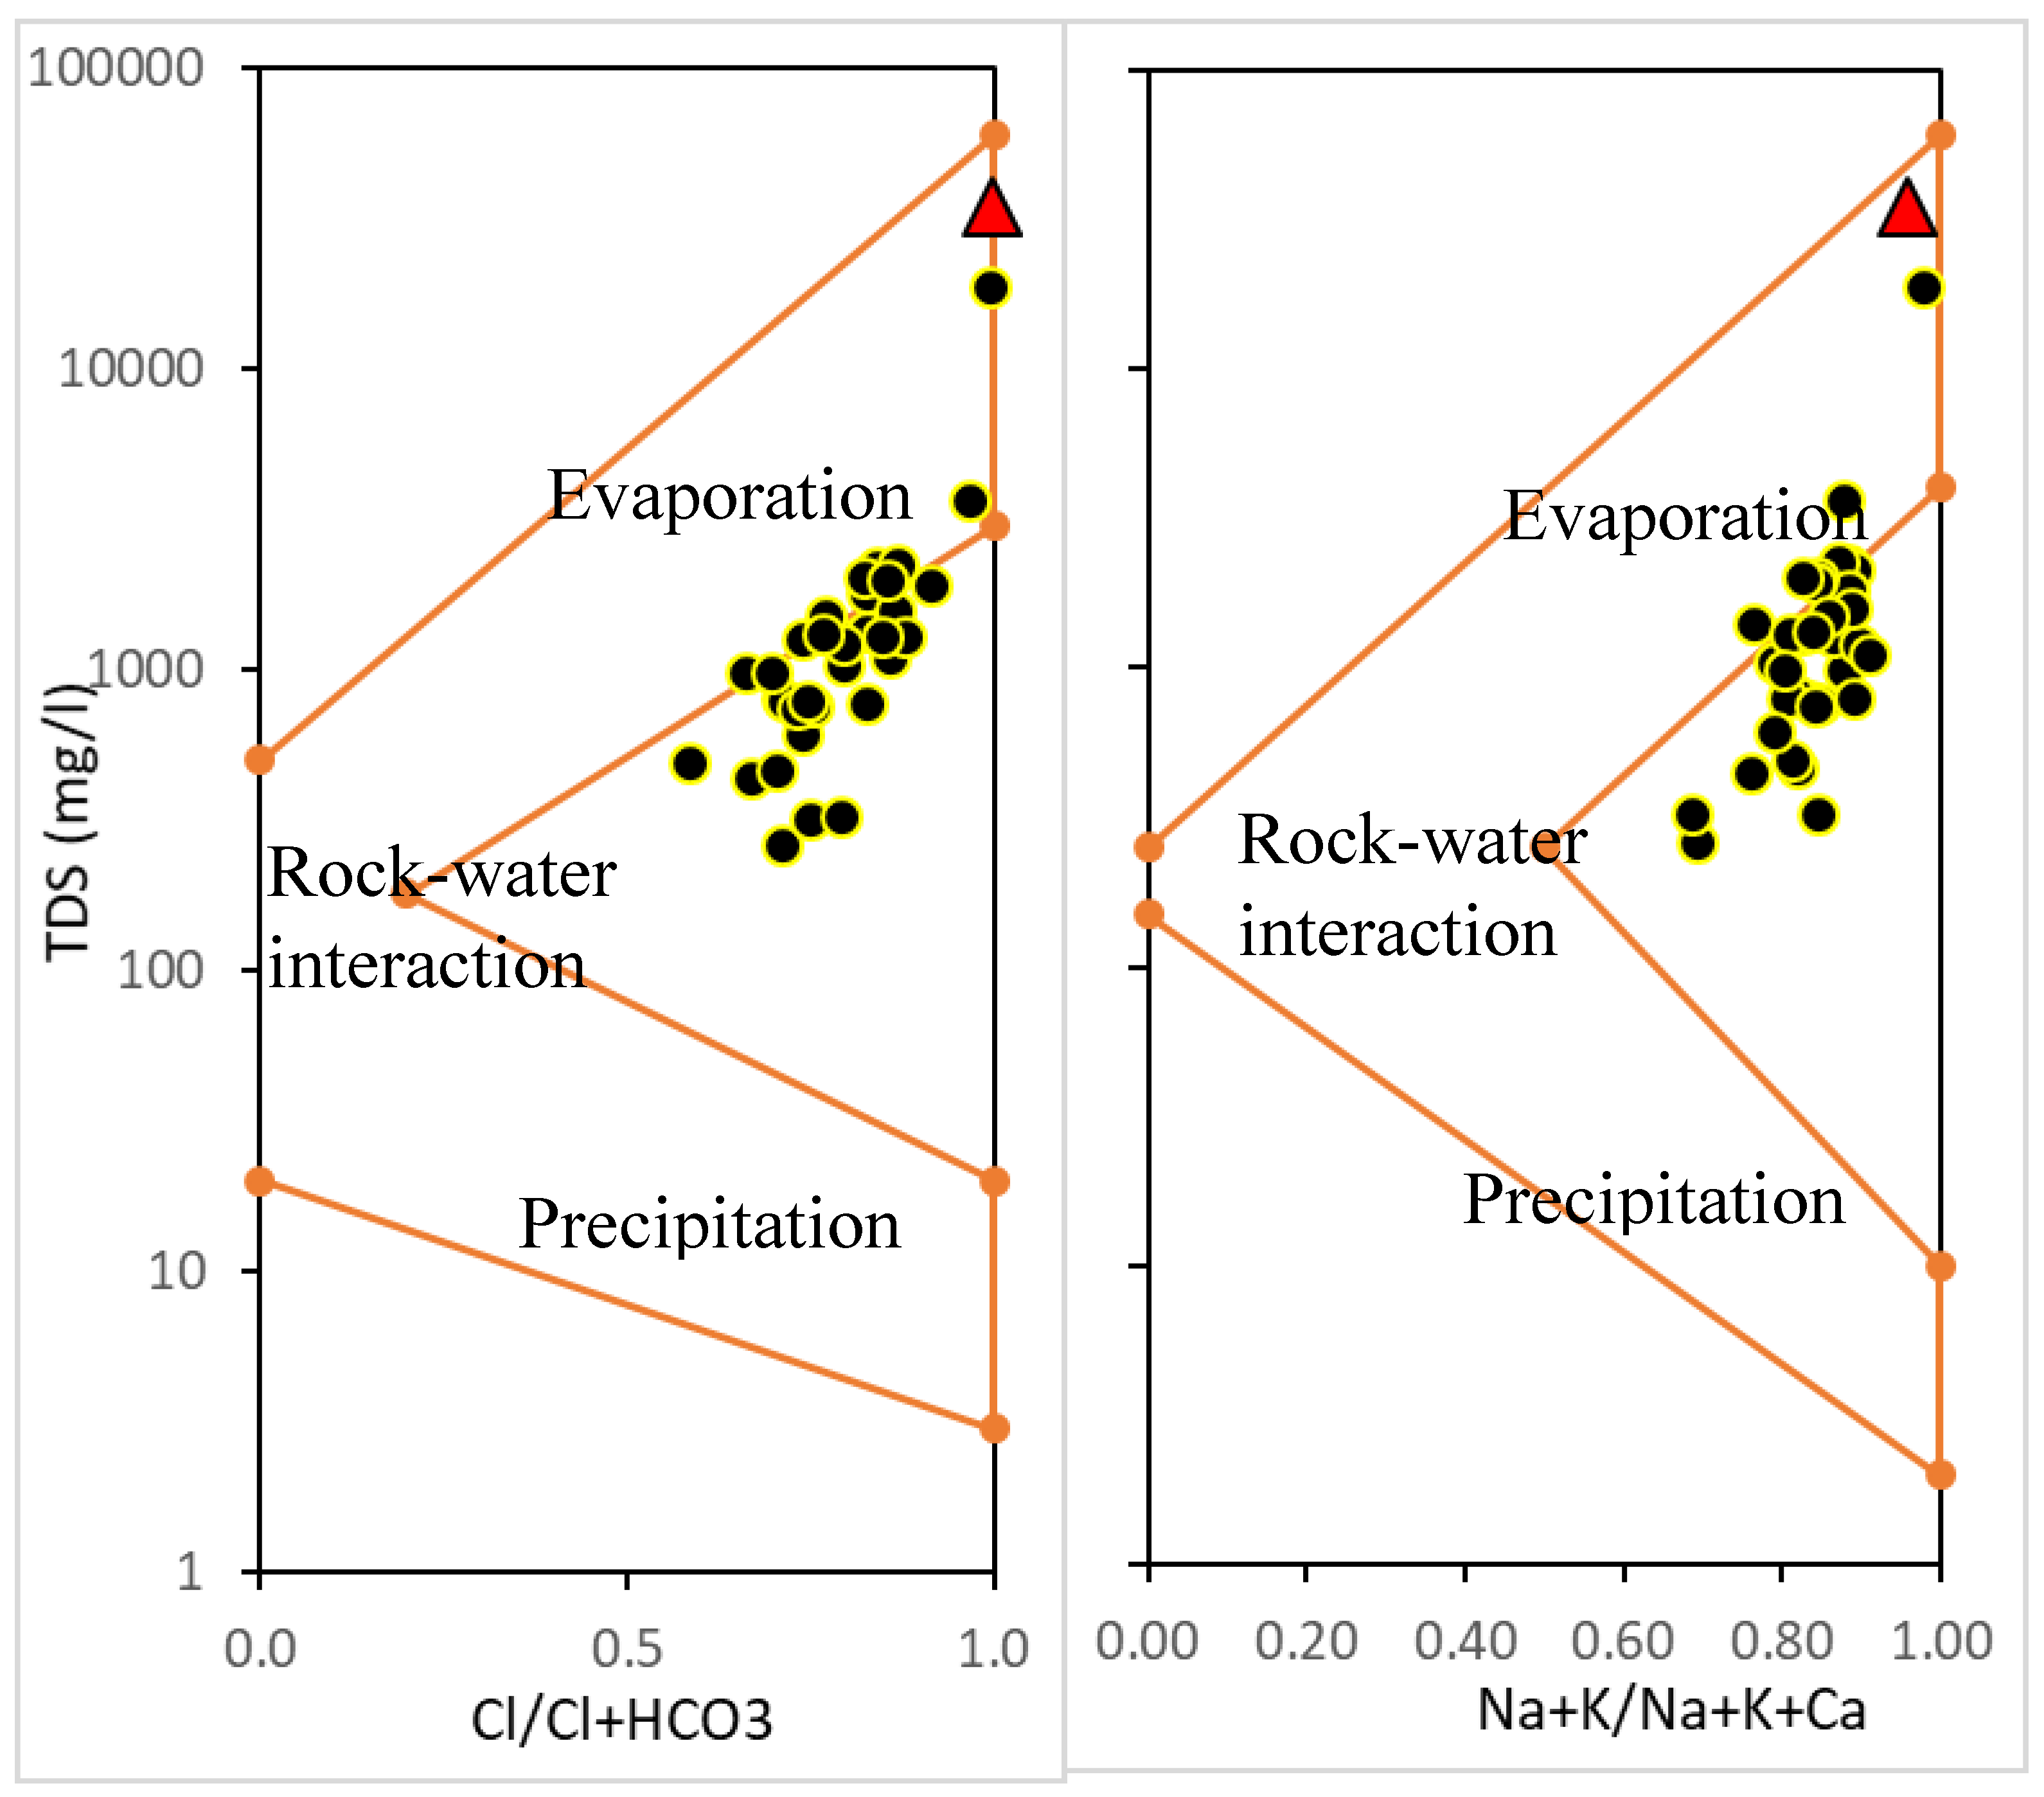
The chemistry of groundwater is controlled by a variety of processes in the aquifer. To identify these processes, groundwater quality data were plotted in the Gibbs diagrams to understand the process regulates water chemistry in the coastal aquifer of Tugela Catchment [47]. Gibbs diagrams show the relative importance of three natural mechanisms controlling water chemistry, namely rock water interaction, precipitation, and evaporation. Figure 6 depicts that groundwater samples mostly clustered on the rock-water interaction zone followed by the evaporation zone. Figure 6 also highlights that well no N28 (EC = 29,240 µS/cm) is plotted close to seawater. In the Gibbs plots, wells affected by the saline sources also plot in the evaporation zone with high TDS (Figure 6). In the study site, the water chemistry is influenced by the ion exchange, rock-water interaction, and evaporation/saline sources. Other researchers also reported similar processes in various countries [48,49,50]. However, wells located far from the coastal region also have NaCl type water, which seems to be due to infiltration of wastewater from domestic and irrigational activities. Spatial distribution pattern also implies that wells located near or along the river Tugela have high concentrations of Na and Cl.
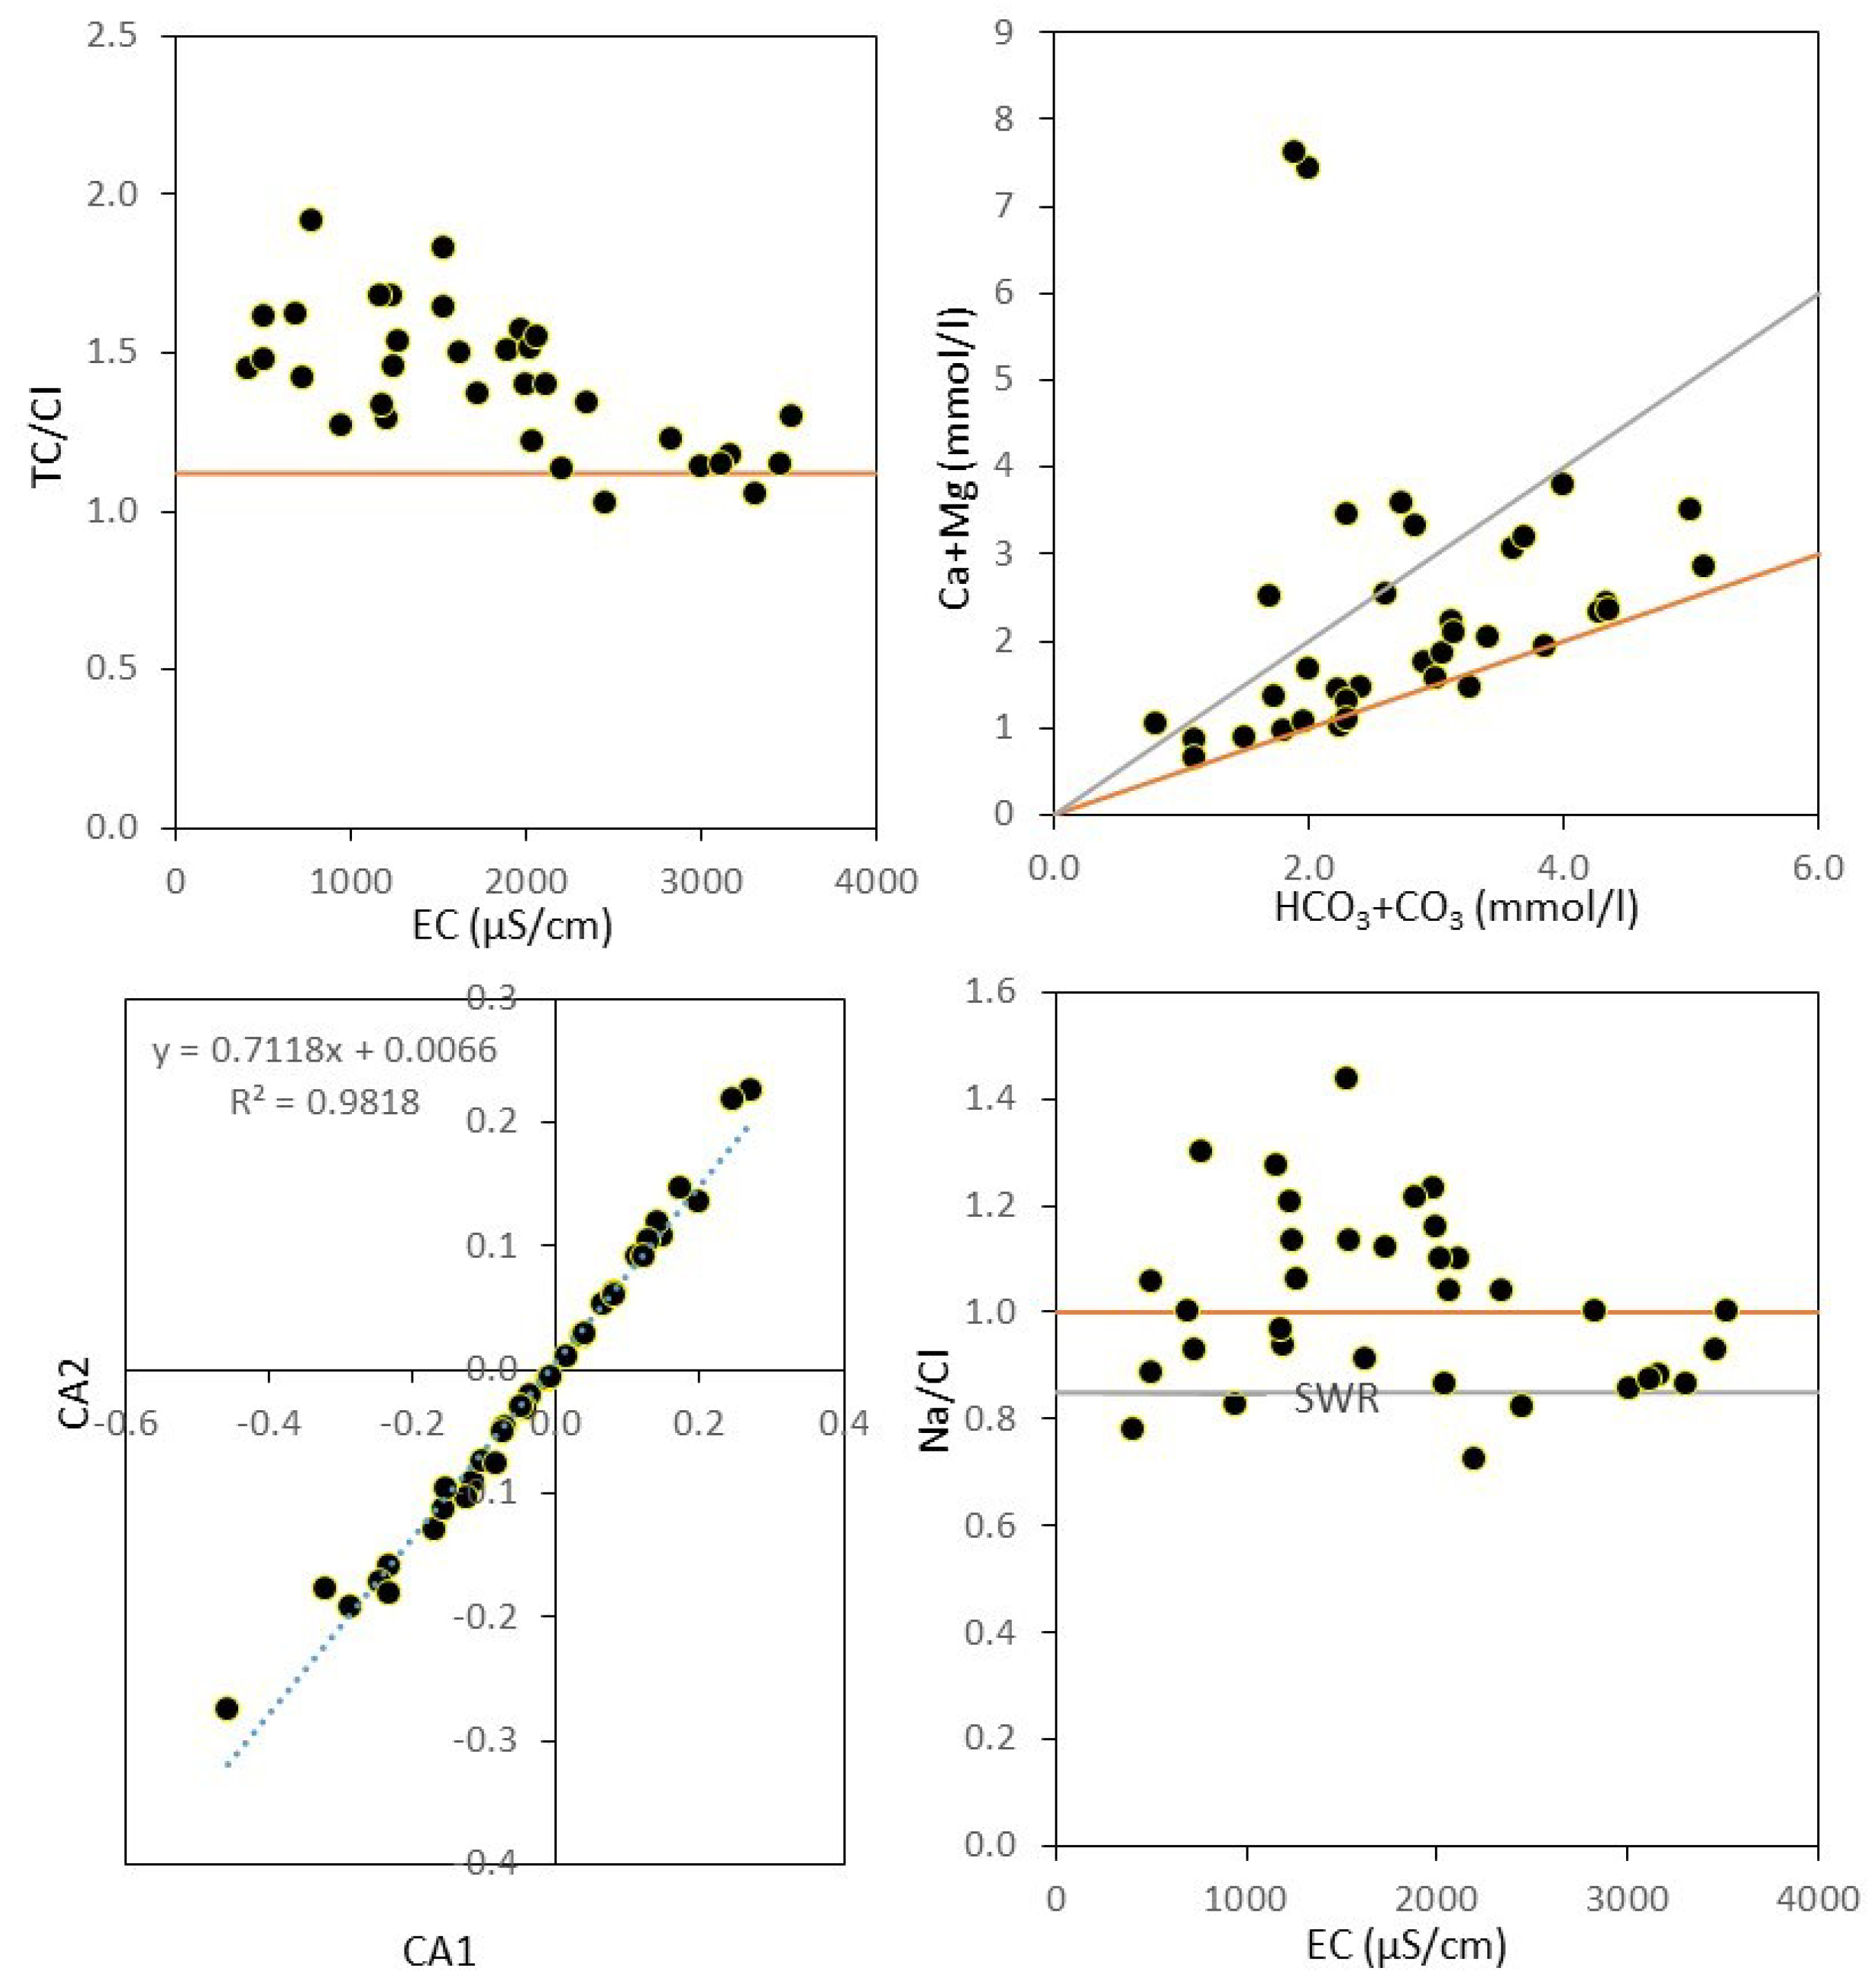
Ionic ratios are commonly used to explain various processes in the aquifer. The ratio of (Ca + Mg)/(HCO3 + CO3 + SO4) is equal or close to one if the water chemistry is solely regulated by the dissolution of carbonates and sulfate minerals [16]. In this study, this ratio is greater than one in 15 wells and <1 in 21 wells. Excess Ca + Mg is likely originated from reverse ion reactions and balanced by Cl and other anions. Depletion of Ca + Mg over (HCO3 + CO3 + SO4) in 21 wells indicates that water chemistry is largely affected by the cation exchange reaction and/or silicate weathering. The molar Na/Cl ratio is also useful to differentiate mineral dissolution, saline sources, and ion exchange reactions. Dissolution of halite will approximately maintain mNa/Cl ratio equal to one whereas higher or lower ratios suggest ion exchange reactions and silicate weathering [16,51]. In this study, few wells plotted on mNa/Cl = 1 line and most of them deviated from this ratio (Figure 7). Around 20 wells, mNa/Cl is greater than one and suggests that high sodium is likely originated from cation exchange or silicate weathering process. However, wells with mNa/Cl < 1 reveal that the water chemistry is affected by reverse ion exchange reactions. Likewise, molar Ca/Mg ratio is employed to differentiate the influence of carbonate and silicate weathering on groundwater chemistry [9,16,52,53]. If the mCa/Mg equal to one, dissolution of dolomite dominates in the water chemistry whereas higher ratios (mCa/Mg > 2) suggest the impact of silicate weathering. Further, dissolution of calcite will maintain this ratio between 1 and 2. In this study, it ranges from 0.61 to 2.43 with an average of 1.25. The mCa/Mg ratio is less than two except two wells, which eliminates the major role of silicate weathering on water chemistry. Further, it is less than one in 9 samples and 2 < mCa/Mg > 1 in 25 samples, which suggests that the dissolution of calcite has major impact on water chemistry compared to dolomite and silicate minerals in this aquifer. Further, plot of mCa + Mg versus mHCO3 + CO3 also imply the contribution of carbonate mineral dissolution and most samples plotted on or near to Y = 2X line (Figure 7) [16].
Invading of saline water in the coastal aquifer is a serious issue in the coastal region due to the over exploitation of groundwater resources. Well no N28 (EC = 29,240 µS/cm) and N29 (5690 µS/cm) are good evident for this process in the study region and the water chemistry in these wells are modified by the seawater intrusion. Total cation (Ca + Mg + Na + K in meq/L)/Cl ratio is useful tool to assess the impact of saline sources and mineral dissolution in the groundwater because this ratio eliminates the influences of ion exchange reactions. TC/Cl ratio of well numbers N28 and N29 are 1.14 and 1.03, which are close to seawater ratio (1.12) [54]. Figure 7 shows that except few wells, most of the wells have high ratios that deviated from seawater ratio line. Higher ratios suggest that source of major ions in groundwater is other than saline sources. In addition, few wells located far from coastal region also have similar ratios (Well nos. N23 (1.03), N5 (1.05), N14 (1.13), N25 (1.14)) which likely affected by the surface contamination sources.
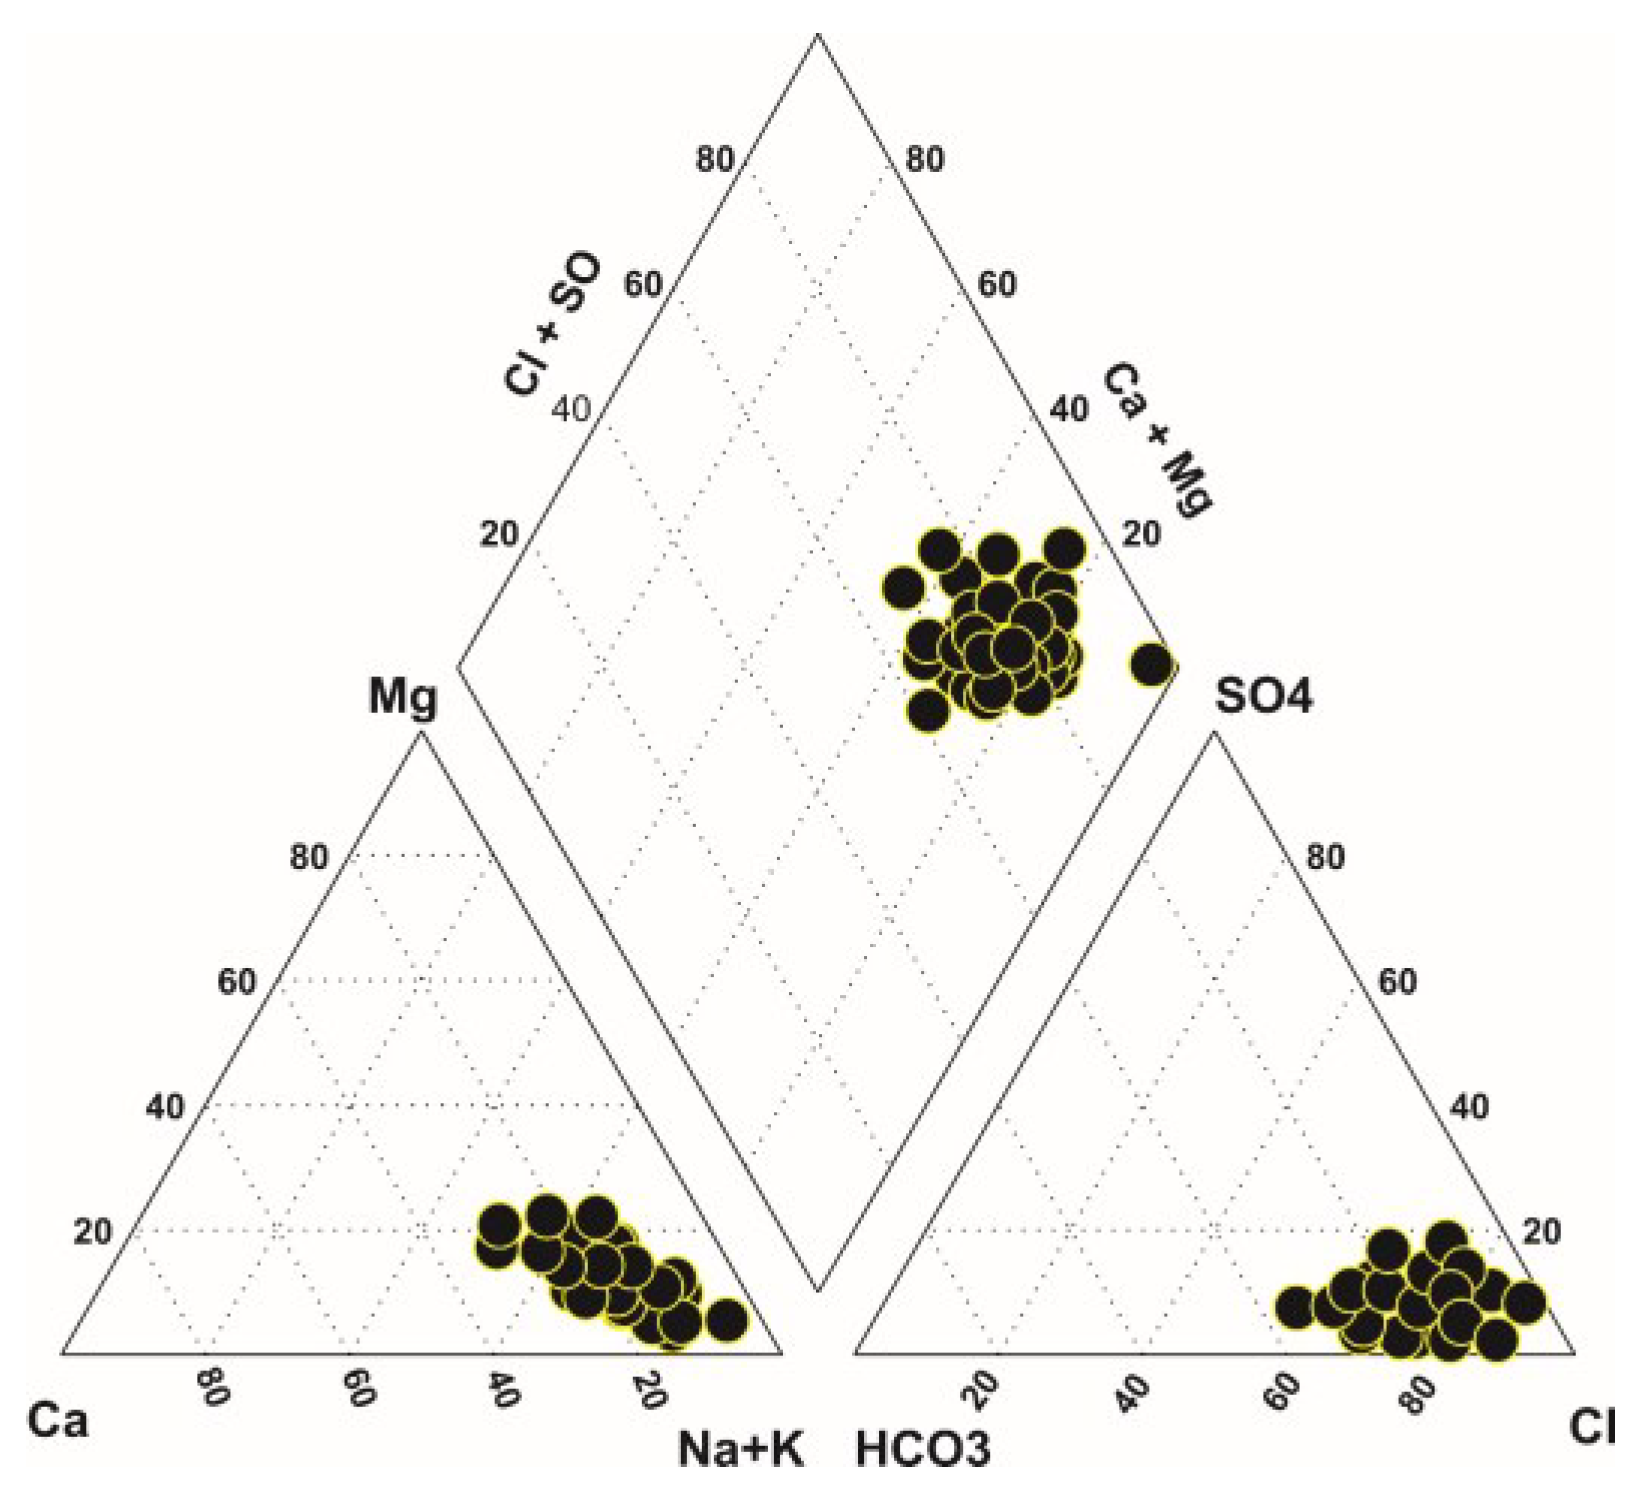
Aforementioned ion exchange reactions modified the water chemistry in the study area. Ion exchange reactions are broadly classified into cation and reverse ion exchange reactions. If the Ca (Mg) in the water is replaced by the Na(K) in the aquifer material, called cation exchange {Na(K)-Clay + Ca2+(Mg2+)aq = 2Na + (K+)aq + Ca(Mg)-Clay}. The reverse process, Na(K) in the water being replaced by the Ca(Mg) in the aquifer materials, is called reverse ion exchange (RIE) {Na + (K+)aq + Ca(Mg)-Clay = Na(K)-Clay + Ca2+(Mg2+)aq}. Ion exchange reactions are explained by chloro alkaline indices (CAI1 and CAI2) and calculated by the following equations [55].
CAI1 = [Cl − (Na + K)]/Cl
CAI2 = [Cl − (Na + K)]/[Cl + HCO3 + SO4 + NO3]
The negative and positive values of CAI1 and CAI2 explain cation exchange and RIE reactions, respectively. Figure 7 illustrates that the water chemistry in this aquifer is controlled by both cation exchange and RIE reactions. In this study, 20 wells show negative values (both CAI1 and 2) and 16 wells have positive values. Hence, cation exchange is predominant process compared to RIE. Groundwater types (NaCl) also support the cation exchange process in this aquifer.
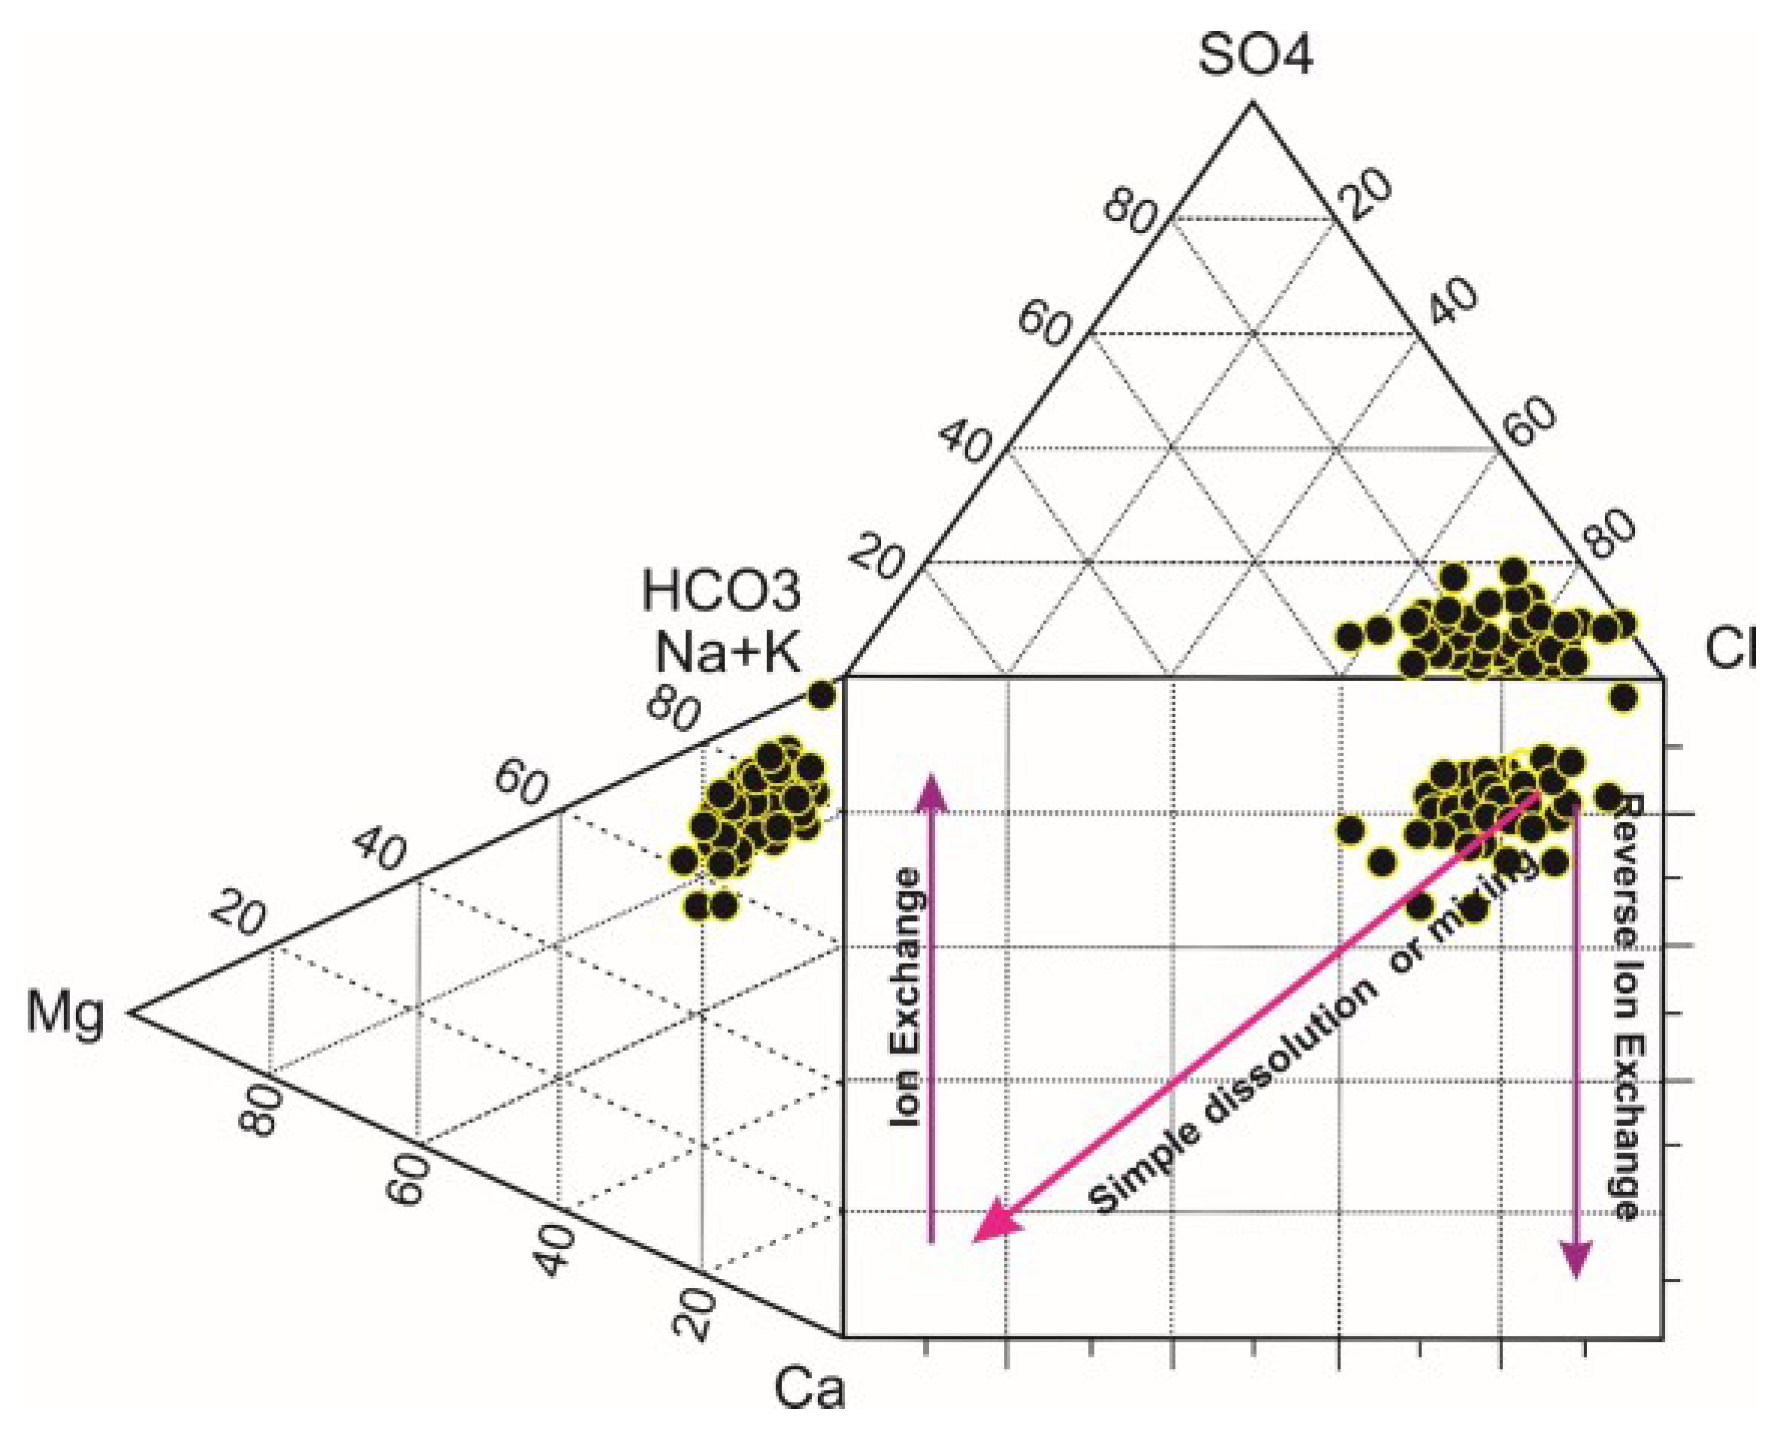
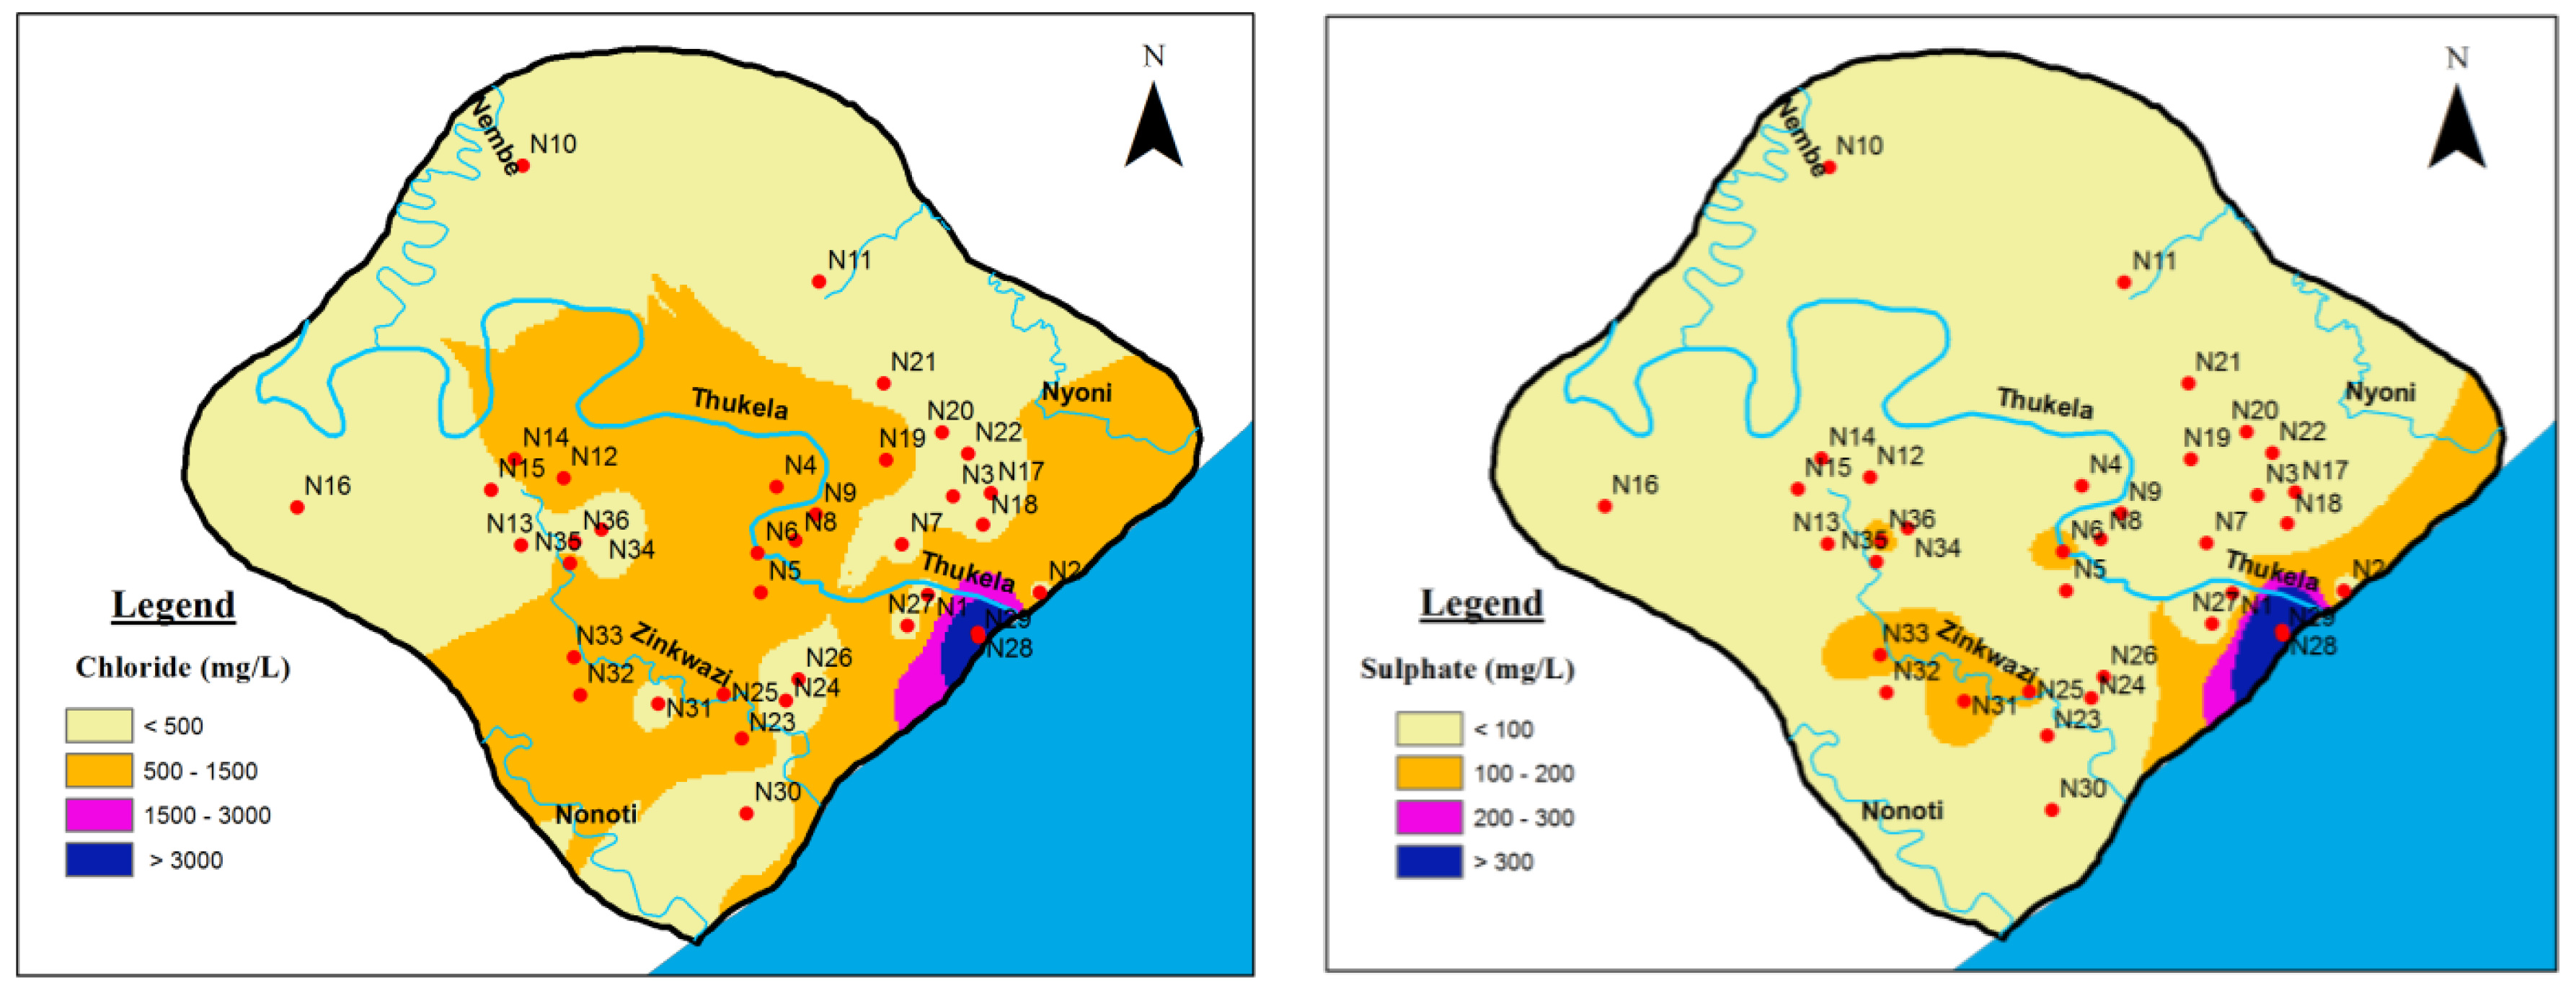
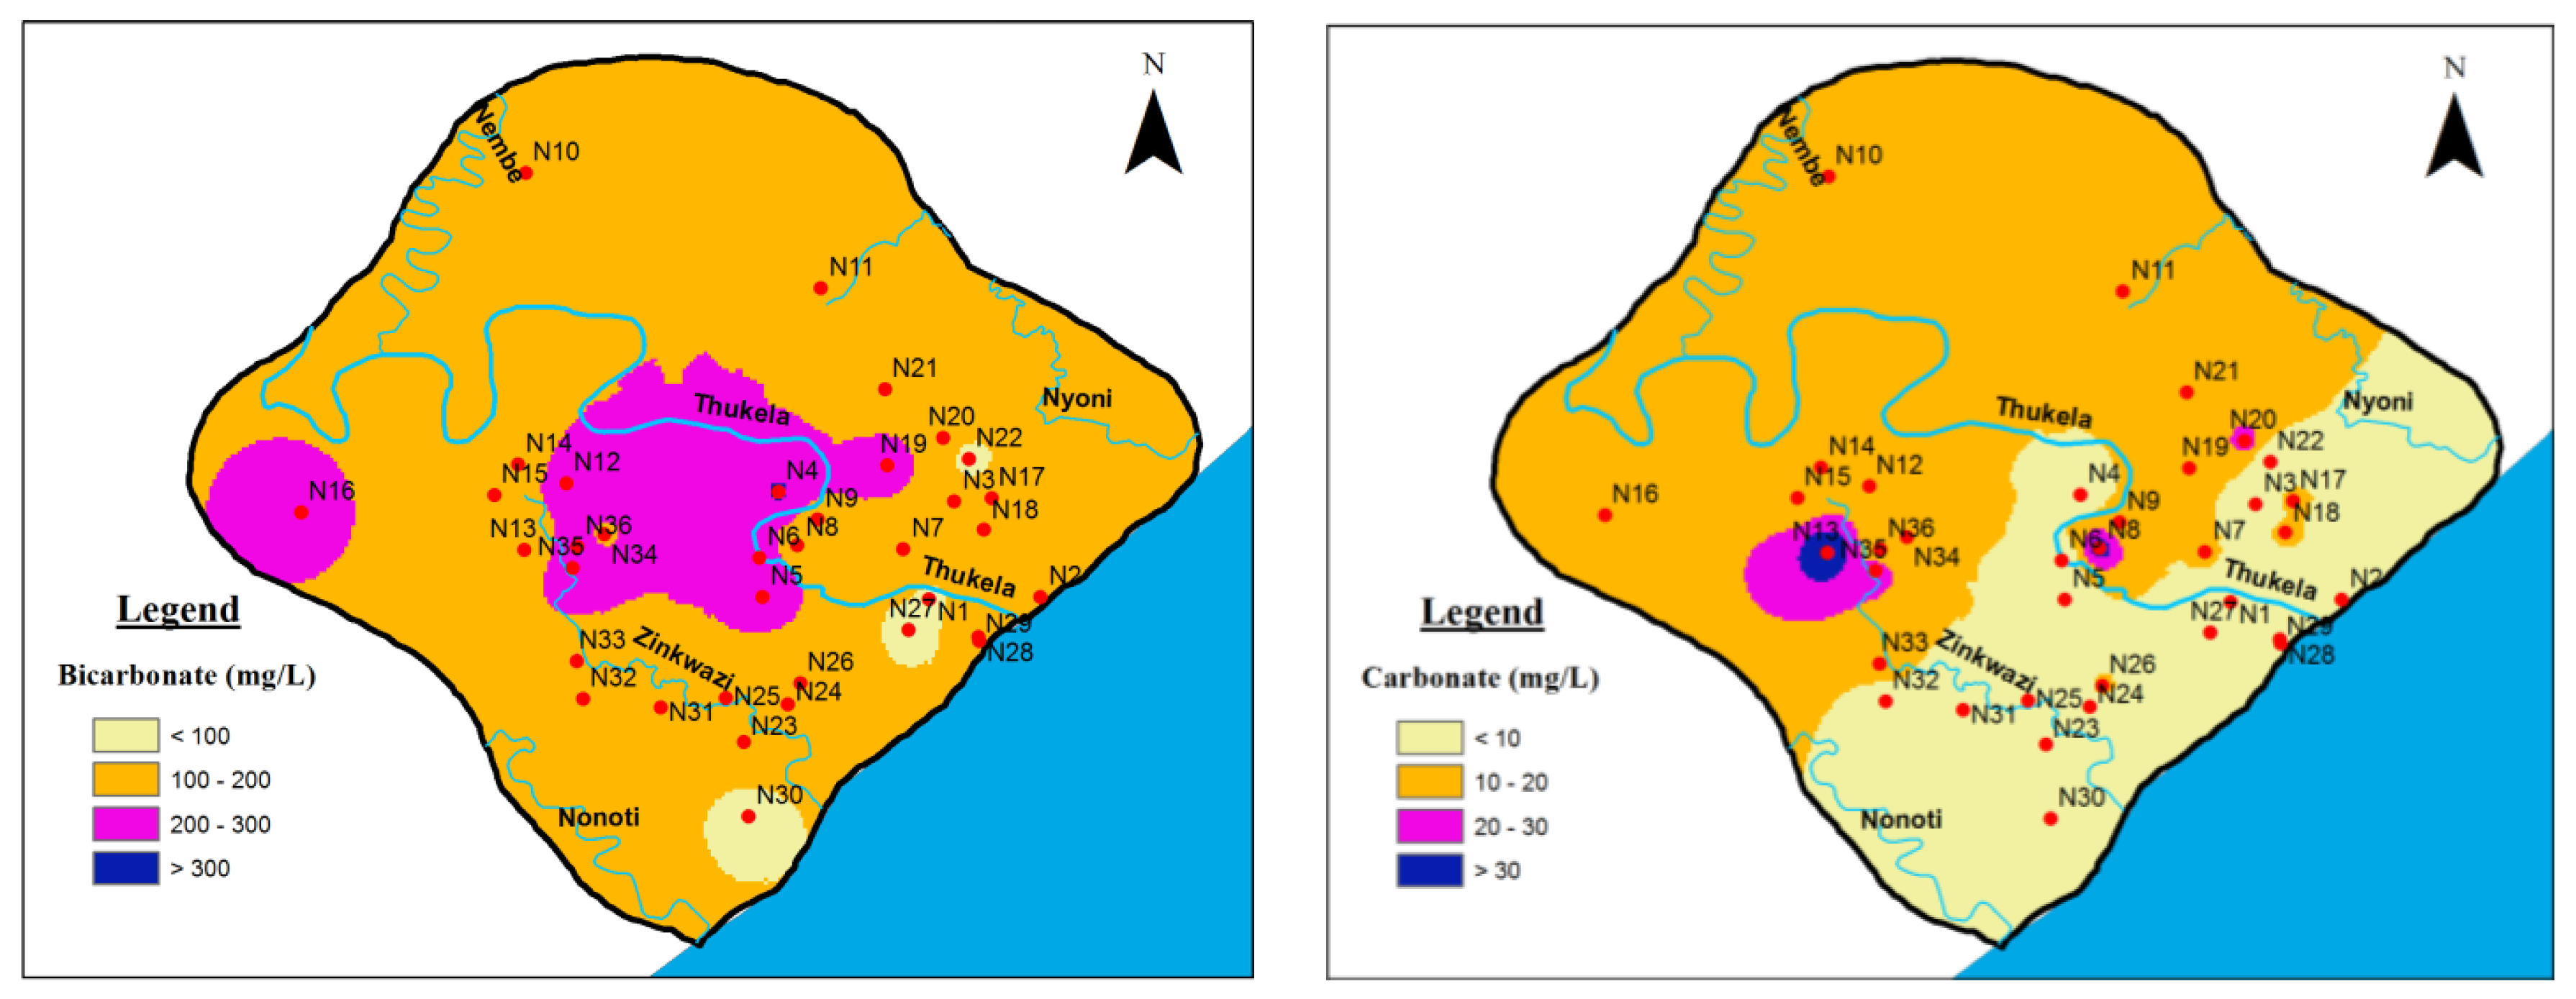
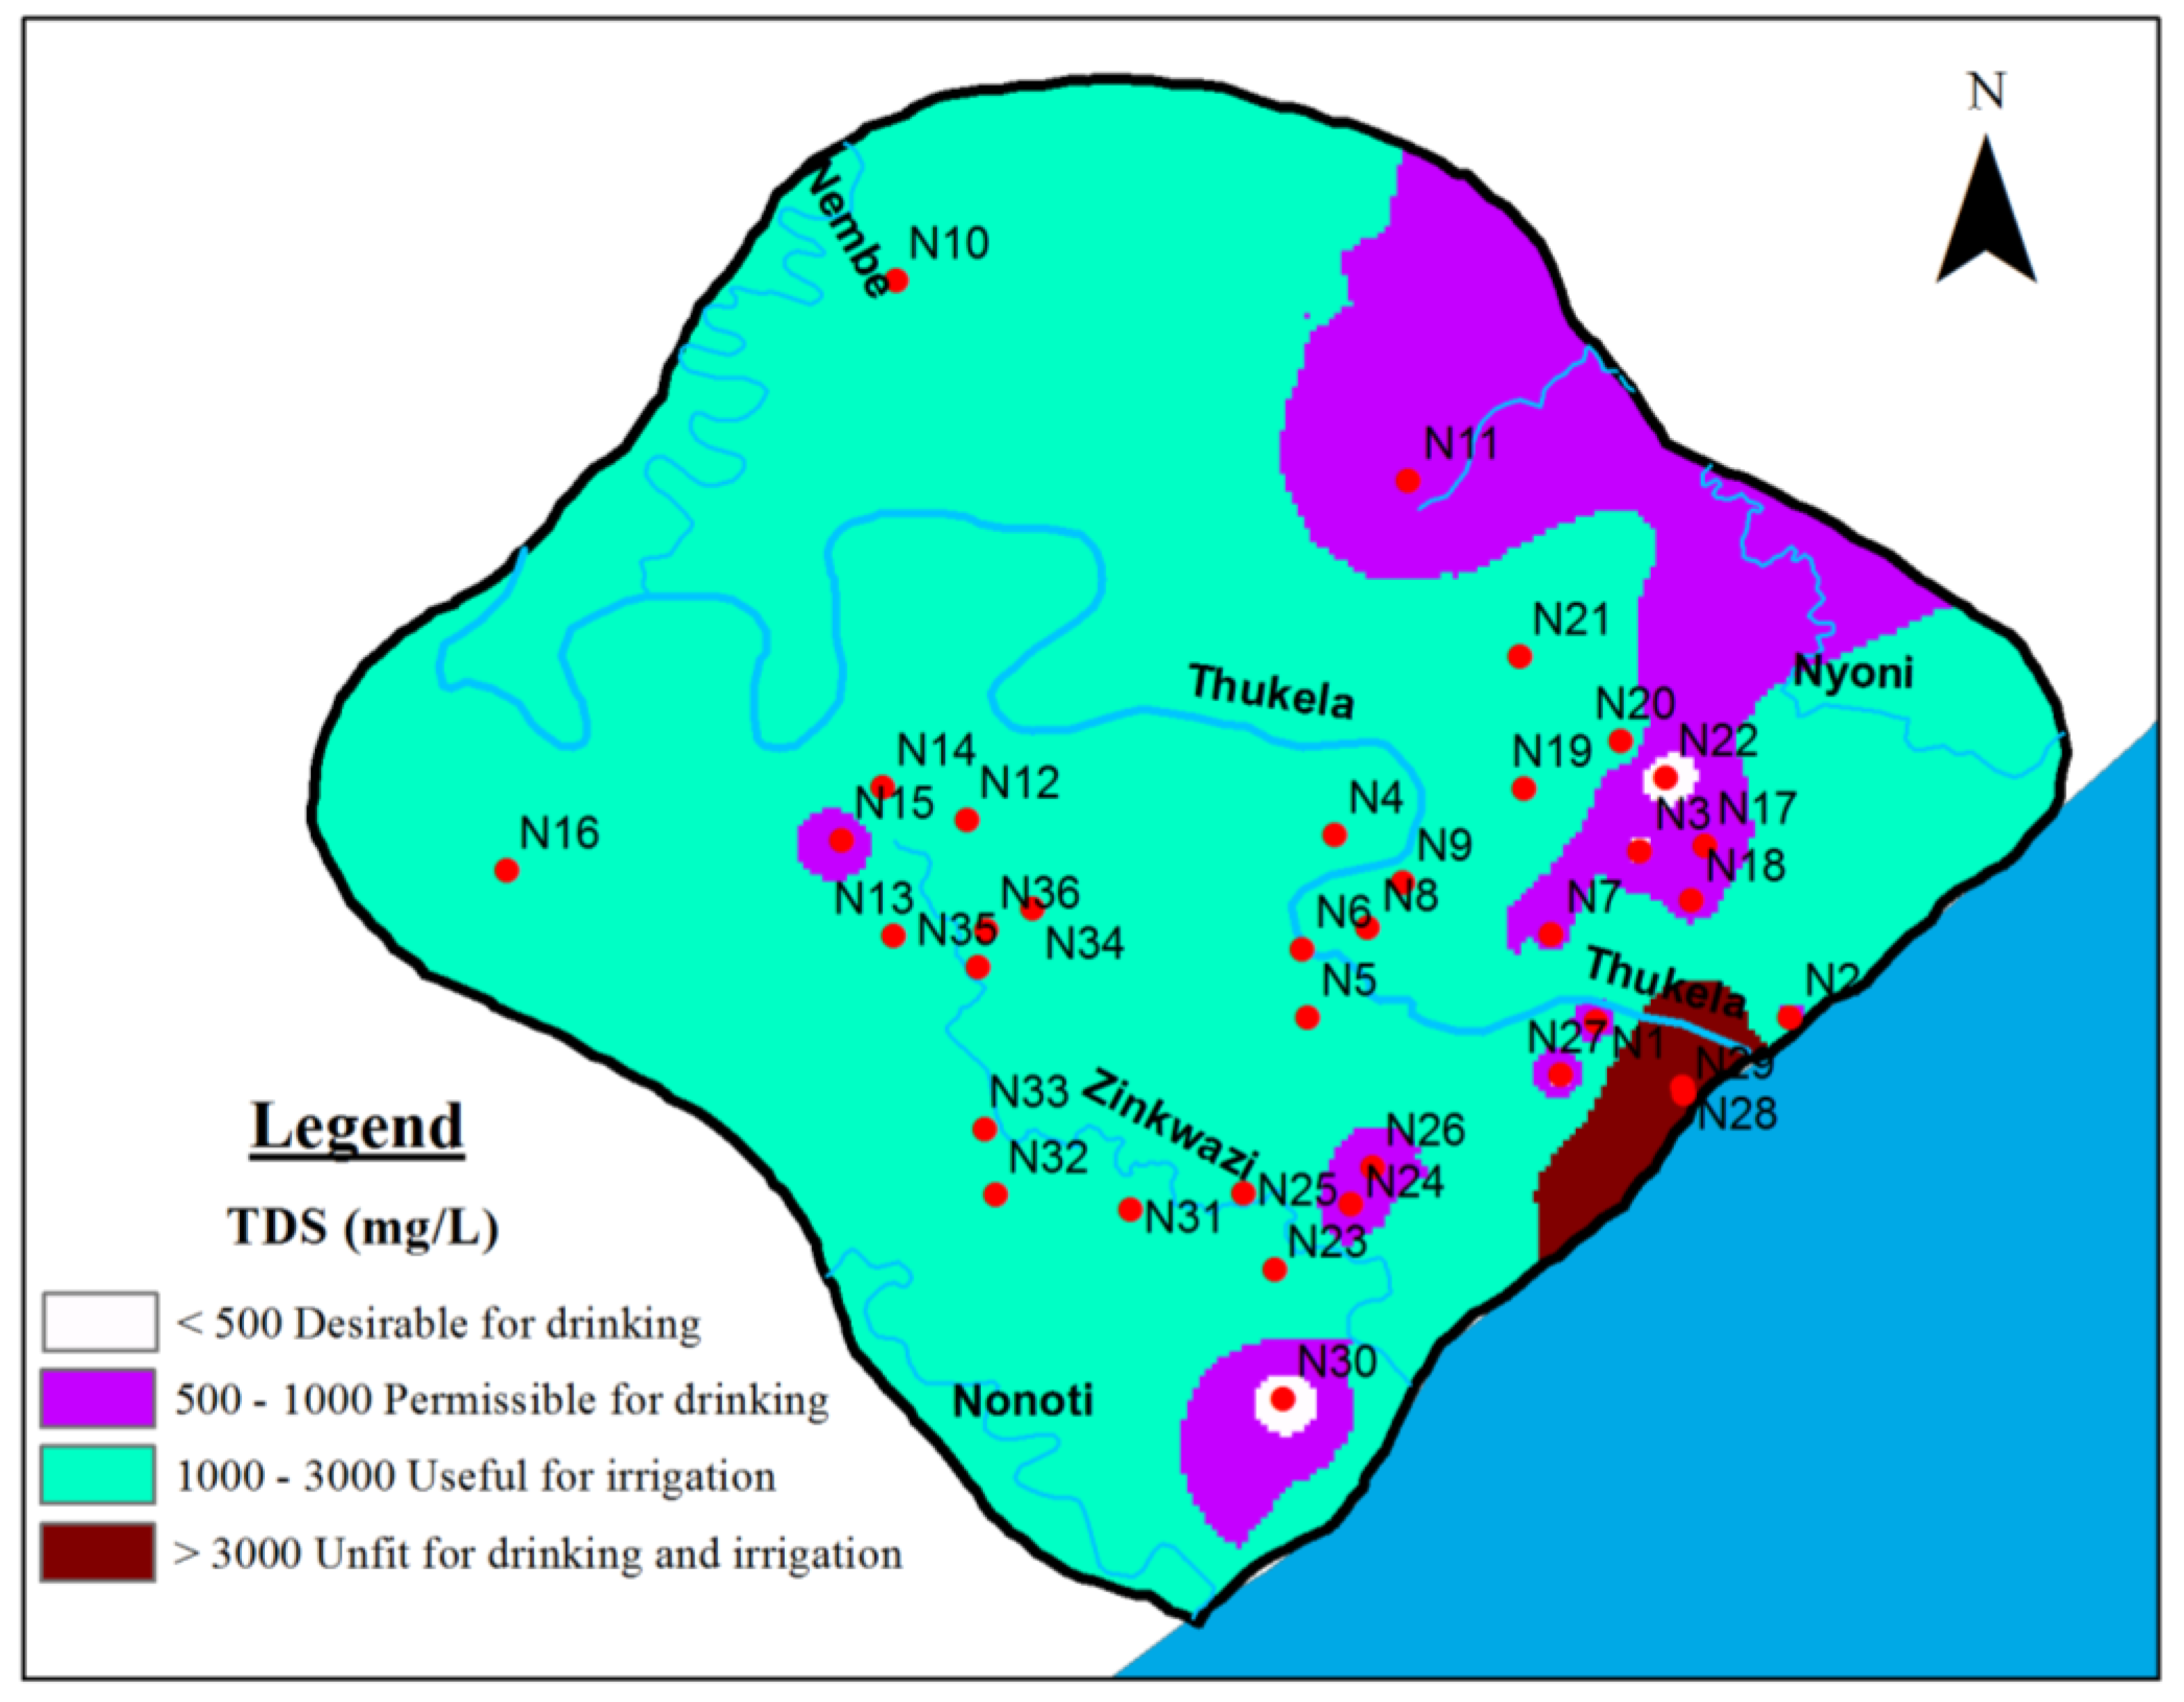
Although the chemistry of groundwater is affected by the natural processes and geology, the land use patterns also have significant role in altering the geochemical composition. The relationship between chloride and sulfate can be used to indicate the effect of surface contamination especially domestic sewage water and irrigation return flows on the groundwater chemistry. The observed average concentrations of chloride and sulfate are 753 ± 1613 mg/L (Mean ± STD) and 89 ± 220 mg/L, respectively (Table 1). The standard deviation of Cl and SO4 indicates that these are originated from multiple sources. In addition, Cl and SO4 have significant positive correlation and both ions are likely derived from various sources namely dissolution of halite and gypsum/anhydrite, saline sources, and surface contamination.
Dissolution of chloride and sulfate minerals may not be major sources in the study region since these are highly under saturated in the groundwater. Saturation index of gypsum and anhydrite vary from −4 to −1 and less than −1 in all samples. Likewise, the saturation index of halite ranges from −7 to −3 and less than −3 in all samples. These observations ruled out the contribution of geology. The saline sources affected the water quality only in the coastal region not in the interior area. High concentrations of chloride and sulfate are also observed in the wells located far from the coastal region (Figure 5). Hence, infiltration of contaminated wastewater through domestic sewage, septic tank leakage and irrigation return flow from sugarcane field has modified the water chemistry. Application of fertilizers in the sugarcane cultivation is very common and irrigation return flow seems to be major sources of these ions in groundwater in the study region.

3.2.2. Statistical Approach

Inter elemental correlation analysis was carried out in this study to understand the association of variables, possible sources, and their evolution pathways. Table 2 shows that there is a strong positive correlation between EC and TDS (r = 1.0), TH (r = 0.74), Na (r = 1.0), Ca (r = 0.74), Mg (r = 0.69), Cl (r = 1.0) and SO4 (r = 0.98). Likewise, TH expresses strong positive correlation with EC (r = 0.74), TDS (r = 0.74), Na (r = 0.69), Ca (r = 0.96), Mg (r = 0.97), Cl (r = 0.73) and SO4 (r = 0.72) and significant negative correlation with Si (r = −0.50). Dissolved silica indicates significant negative correlation with TH (r = −0.50) and Ca (r = −0.57). Variables namely Na, Ca, Mg, Cl, SO4, EC, TDS and TH have strong positive correlation each other. In contrast, pH, DO, ORP, K and HCO3 is not correlating with other variables. These results suggest that water is strongly affected by the saline and surface contamination sources as well as mineral weathering.
Principle component analysis (PCA) was performed to explore these processes in detail. Varimax rotation method with Kaiser Normalization was used. Three factors with Eigen values > 1 were selected for further interpretation (Table 3) [56]. Factor loading, % of variance and cumulative % of variance are given in Table 3. All these three factors explain 78% of total variance. PC1 explains 49.7% of total variance and is highly loaded on EC, TDS, Na, Cl, SO4, Ca and Mg. High loading of these variables justify that this factor is strongly related to saline contamination sources as well as surface input of elements. PC2 explains 16.8% of total variance and has strong positive loading of bicarbonate and moderate loading of Ca and Mg. In addition, this factor has significant negative loading of silica. PC2 represents the influences of mineral weathering on water chemistry especially dissolution of carbonates rather than silicates. Further, PC2 also suggests that Ca and Mg in groundwater are derived from multiple sources. PC3 has strong positive loading of pH, moderate loading of Mg and negative loading of ORP. As mentioned in the correlation analysis, pH and ORP are not correlating with other variables. PC3 is also likely related to mineral dissolution in the reducing environment. Spatial distribution of factor scores indicates that wells in the coastal are well affected by the PC1 (Figure 8). Wells located far from the coast and center of the study area are predominantly influenced by the mineral dissolution and show positive scores in PC2. PC3 shows positive scores on the isolated pockets and near Zinkwazi River. Some wells have positive scores of both PC2 and PC3. Overall, wells with positive score in the PC2 and/or 3 exhibit that the mineral dissolution process is predominantly influenced the water chemistry.

3.3. Groundwater Suitability Assessment

3.3.1. Suitability for Drinking Purposes

The DWAF [57] and WHO [58] have recommended standards for drinking water suitability for the coastal aquifers and those standards were used to evaluate the suitability of groundwater in the study area for drinking purposes. Table 4 reveals that the groundwater pH in the study region is within the recommended limit of WHO [58] and DWAF [54]. The average EC of groundwater is 2687 µS/cm and all samples fall outside the desirable limit (EC < 700 µS/cm) prescribed by the SAWQG [57]. The average concentration of TDS in the groundwater is 1720 mg/L. According to SAWQG, 32 samples are not palatable, which exceeded the recommended limit (TDS > 450 mg/L). Similarly, 21 samples exceeded the drinking water limit (1000 mg/L) recommended by the WHO [58]. According to Davis and DeWiest [59] classification, only 15 out of 36 samples come under desirable to permissible classes for drinking and remaining are unsuitable (Table 5). Table 6 reveals that 42% of samples are fresh while 55% is brackish in nature [44]. Hardness of water is an important parameter to decide the water suitability for various uses. Table 4 suggests that 89% of samples exceeded the HDL (TH = 100 mg/L) but most of the samples within the MAL recommended by the WHO for drinking uses. Sawyer and McCarty [60] classified groundwater based on total hardness (TH). Table 7 indicates that 72% of samples fall on moderately hard to hard classes and 25% of samples are very hard. Hard water causes health issues such as urolithiosis, cardio-vascular disorder, anencephaly parental mortality and cancer for consumers [61]. Calcium is one of the important elements for human body metabolism. High calcium concentration in drinking water can cause hypercalcemia kidney malfunctioning and malabsorption of iron, zinc, magnesium, and phosphorus [62]. In this study, the average concentration of calcium is 49 mg/L and 67% of samples exceeded the SAWQG DL (32 mg/L). Further, 19% of samples exceeded HDL (75 mg/L) recommended by the WHO for drinking water.
Generally, concentration of sodium is lesser in fresh water than calcium and magnesium. The mean sodium content in the groundwater is 491 mg/L. The MAL of sodium is 200 mg/L as recommended by WHO [58] and it reveals that 23 samples (64%) exceeded this threshold. An excess of Na can cause hypertension, congenial diseases, kidney disorders and nervous disorders in human body [63]. The concentration of potassium in the groundwater is generally low and the maximum permissible limit of K is 12 mg/L as assigned by WHO [58]. All the samples were found below this limit. Chloride in groundwater originates from variety of sources such as mineral dissolutions, intrusion of sea water, domestic and industrial waste discharges, municipal effluents, etc. [64,65]. In the study area, chloride content is perceived as high. Apart from sample number 22, all samples exceeded the DL (100 mg/L) specified by the SAWQG [66]. Around 81% and 31% of samples exceeded the HDL and MDL, respectively, recommended by the WHO [58]. In overall, EC, TDS, TH, Na and Cl is enriched in these wells and around 85 to 95% of samples exceeded the DL of these elements recommended by the SAWQG (Table 4). Likewise, TDS, TH, Na and Cl in most of these samples exceeded the drinking water limit recommended by the WHO.

3.3.2. Suitability for Irrigation Uses

Suitability of groundwater for irrigation is assessed using various parameters such as salinity hazard, sodium percent (Na %), sodium adsorption ratio, residual sodium carbonate, Kelly’s ratio, Permeability index and Magnesium ratio and results reported in Table 8.
Richards [67] classified the water for irrigation uses based on EC. According to this classification, five samples have medium salinity and 20 samples (56%) are classified as high salinity classes (Table 8). According to this classification, 30% of samples are not fit for irrigation. Sodium percentage (Na %) is also widely used to assess quality of water for irrigation purposes. Na % is calculated using Equation (3).
Na   % = ( Na + + K + ) × ( 100 ) ( Ca 2 + + Mg 2 + + Na + + K + )
Table 8 suggests that most of the samples (94%) come under doubtful to unsuitable classes. Na % varies from 55 to 95% with an average value of 74%. Wilcox [68] plot of Na % against EC was used to assess the irrigation water suitability. Figure 9 indicates that most of the samples were plotted on the permissible to doubtful and doubtful to unsuitable classes due to high Na.
The sodium adsorption ratio (SAR) focuses on the potential that water must induce sodic soils. SAR is estimated using following relation.
SAR = ( Na + )   ( Ca 2 + + Mg 2 + ) / 2
According to Richards [67], water samples with SAR < 10 is more desirable for irrigation. Table 8 indicates that 98% of samples fall low to medium sodium water and 56% of samples have SAR < 10, which are suitable for irrigation.
Groundwater samples with high residual sodium carbonate (RSC) can indirectly affect water quality and enhances carbonate precipitation followed by the Na enrichment in the water. RSC is calculated using Equation (5).
RSC = (HCO3 + CO3) − (Ca2+ + Mg2+)
RSC varies from −13 to 1 with an average value of −2. RSC in the groundwater is less than 1.25 meq/L and all samples are suitable for irrigation.
Kelly [69] proposed a ratio to assess the water suitability for irrigation. Kelly’s ratio is obtained from Equation (6)
KR = ( Na + ) ( Ca 2 + + Mg 2 + )
Table 8 suggests that all samples in the study area have this ratio >1 and these are unsafe for irrigation uses.
Permeability index (PI) is developed by the Doneen [70] to explain the impact of irrigation water uses on soil permeability. Water with high bicarbonate and sodium causes permeability issues in soil. PI is estimated using
PI =   ( Na + +   HCO 3 ) ( Ca 2 + +   Mg 2 + +   Na 2 + )   × 100
PI in the study area ranges from 71 to 95% and it falls within the class I and class II. Almost 93% of samples are classified as class II, which are suitable for most soils (Figure 10).
Groundwater with high magnesium results calcium deficiency and reduce the crop yield [71]. Magnesium hazard (MH) is calculated by the equation
MH = ( Ma 2 + ) × 100 Ca 2 + + Mg 2 +
Water with high magnesium content (MH > 50%) is considered unsuitable for irrigation because it causes alkaline conditions in the soil and reduces infiltration capacity. According to this classification, 78% of samples are suitable for irrigation (Table 8).
U.S. Salinity laboratory [67] proposed a diagram to evaluate the irrigation water suitability using EC and SAR. Figure 11 indicates that water samples fall on C3S2 > C2S1= C3S3 = C4S3 > C4S4 > C3S1= C5S4 classes. Most of the samples clustered on C3, C4, S2 and S3 classes. C3 and C4 waters have high and very high salinity and are suitable mostly for high-permeability soils and salt-tolerant crops such as sugarcane, which is the major crop in the study area. Similarly, S2 (medium sodium) waters are suitable only for coarse-textured soils with high permeability. High sodium (S4) water is not suitable for regular irrigation. Irrigational water quality parameters such as SAR, RSC, PI, and MH recommend that most of the wells are suitable for irrigation in the study region. In contrast, salinity hazard, Na % and Kelly’s ratio suggest that water quality is permissible to unsuitable for irrigation.

4. Discussion

Groundwater quality in the study area is fresh to brackish and mostly neutral to alkaline in nature. Spatial distribution patterns of major ions indicate that wells in the coastal region are affected by the saline water intrusion. Spatial distribution maps suggest that distribution pattern of EC, TDS, Na, Mg, Cl and SO4 are homogenous and high concentrations are noticed in the coastal wells as well as few wells near to Tugela River. Likewise, spatial distributions of Ca, HCO3 and CO3 are comparable and wells located far from the coast have elevated concentrations in the groundwater.
Durov diagram, Gibbs plots, ionic ratios and chloro alkaline indices (CAI1 and CAI2) were employed to understand hydrogeochemical processes regulate water chemistry in the coastal aquifer of Tugela Catchment. Gibbs plots indicate that rock-water interactions followed by the evaporation are dominant processes in the study region. Ionic ratios such as (Ca + Mg)/(HCO3 + CO3 + SO4), mNa/Cl, mCa/Mg, and plot of mCa + Mg versus mHCO3 + CO3 imply that mineral dissolution, ion exchange reactions and saline sources are predominant processes in this aquifer. The mCa/Mg ratio and mCa + Mg vs mHCO3 + CO3 suggest that carbonate mineral dissolution is a dominate process compared to silicate weathering. mNa/Cl and chloro alkaline indices (CAI1 and CAI2) reveal that reverse ion exchange reactions are dominating over cation exchange in the study area. In addition, NaCl water types are noticed far from the coast, which indicates the impact of wastewater infiltration from domestic and irrigational activities (domestic sewage, septic tank leakage and irrigation return flow). Spatial distribution patterns also suggest that wells existing near or along the river Tugela have high concentrations of Na and Cl.
Inter-elemental correlation analysis implies that water is strongly affected by the saline and surface contamination sources as well as mineral weathering. Principle component analysis resulted three factors. PC1 is highly loaded on EC, TDS, Na, Cl, SO4, Ca and Mg and is strongly related to saline contamination sources as well as input of surface elements. PC2 has strong positive loading of bicarbonate, moderate loading of Ca and Mg and significant negative loading of silica and represents the influences of mineral weathering on water chemistry especially dissolution of carbonates rather than silicates. PC3 has strong positive loading of pH, moderate loading of Mg and negative loading of ORP, and related to mineral dissolution in the reducing environment. Spatial distributions of factor scores depict that wells in the coastal region is well affected by PC1 and wells located far from the coast and center of the study area are predominantly influenced by the mineral dissolution (PC2, PC3).
Groundwater suitability assessment suggests that the concentration of TDS, TH, Na, Ca, and Cl in 80% and 90% of wells exceeded the drinking water standards recommended by the WHO and South African drinking water standards (SAWQG), respectively. Irrigation suitability assessment suggests that most of the wells are suitable for irrigation in the study region based on SAR, RSC, PI, and MH. In contrast, salinity hazard, Na % and Kelly’s ratio reveal that water quality is permissible to unsuitable for irrigation. USSL classification shows that water samples fall on C3S2 > C2S1 = C3S3 = C4S3 > C4S4 > C3S1 = C5S4 classes. C3 and C4 waters have high and very high salinity and are suitable mostly for high-permeability soils and salt-tolerant crops. Similarly, S2 (medium sodium) waters are suitable only for coarse-textured soils with high permeability. Figure 12 depicts the wells suitable for drinking as well as irrigation in the study area. In addition, the map demarked the zones suitable for groundwater development in future through installation of new bore wells and dug wells for water supply. Figure 12 also suggests that groundwater in the study region is suitable for irrigation rather than drinking due to quality degradation, which imply a requirement of proper management plan to protect the valuable groundwater resources.

5. Conclusions

Groundwater quality, source of contamination and geochemical processes were evaluated in the coastal aquifer of Tugela Catchment, South Africa using geochemical and statistical approach. Wells in the coastal region as well as near Tugela River are affected by the saline water intrusion. Durov diagrams, Gibbs plots, ionic ratios and chloro alkaline indices (CAI1 and CAI2) imply that the groundwater chemistry in the coastal aquifer of Tugela Catchment is regulated by the ion exchange (Cation exchange >> Reverse ion exchange), mineral dissolution (Carbonate >>> Silicate), evaporation/saline sources and wastewater infiltration from domestic sewage, septic tank leakage and irrigation return flow. Pearson correlation analysis and principle component analysis also suggest that saline contamination sources, anthropogenic activities, and mineral weathering control the water chemistry in the study region. Spatial distribution maps of factor scores illustrate that wells in the coastal region are well affected by saline sources (PC1) and wells in the interior region and center of the study area are predominantly influenced by the mineral dissolution (PC2, PC3). Groundwater suitability assessment suggests that 80% to 90% of wells exceeded the drinking water standards (WHO and South African drinking water standards (SAWQG)). Based on SAR, RSC, PI, and MH, most of the wells are suitable for irrigation in the study region. According to USSL classification, groundwater is mostly suitable for high-permeability soils and salt-tolerant crops. The study concludes that the groundwater quality in the coastal aquifer of Tugela Catchment is degraded. The Tugela Catchment itself is one among the 9 water management areas in South Africa, therefore, the study insists on further monitoring and improvement plans to manage and protect the groundwater quality in the region.

Author Contributions

E.V. designed the study and drafted the manuscript. E.V. and B.N. carried out the field investigation, collected and analyzed the samples. N.R. performed the statistical analysis, E.V., N.R. and B.N. prepared the figures, and interpreted the data. All the authors read and approved the final manuscript.

Funding

This research was funded by National Research Foundation (NRF) of South Africa, grant number [110773].

Acknowledgments

Authors from the University of Zululand express their gratitude to National Research Foundation (NRF), South Africa (NRF/NSFC 2018) for providing grants and Department of Research and Innovation, the University of Zululand for supporting this research. Thanks to Department of Hydrology for their support in the chemical analysis and for the support in the successful completion of this work.

Conflicts of Interest

The authors declare no conflicts of interest.

References

  1. Rajmohan, N.; Al-Futaisi, A.; Al-Touqi, S. Geochemical process regulating groundwater quality in a coastal region with complex contamination sources: Barka, Sultanate of Oman. Environ. Earth Sci. 2009, 59, 385–398. [Google Scholar] [CrossRef]
  2. Comte, J.-C.; Cassidy, R.; Obando, J.; Robins, N.; Ibrahim, K.; Melchioly, S.; Mjemah, I.; Shauri, H.; Bourhane, A.; Mohamed, I.; et al. Challenges in groundwater resource management in coastal aquifers of East Africa: Investigations and lessons learnt in the Comoros Islands, Kenya and Tanzania. J. Hydrol. Reg. Stud. 2016, 5, 179–199. [Google Scholar] [CrossRef]
  3. Kumar, P.J. Deciphering the groundwater–saline water interaction in a complex coastal aquifer in South India using statistical and hydrochemical mixing models. Model. Earth Syst. Environ. 2016. [Google Scholar] [CrossRef]
  4. Cheema, M.J.; Immerzeel, W.W.; Bastiaanssen, W.G. Spatial quantification of groundwater abstraction in the irrigated Indus basin. Ground Water 2014, 52, 25–36. [Google Scholar] [CrossRef] [PubMed]
  5. MacDonald, A.M.; Bonsor, H.C.; Ahmed, K.M.; Burgess, W.G.; Basharat, M.; Calow, R.C.; Dixit, A.; Foster, S.S.D.; Gopal, K.; Lapworth, D.J.; et al. Groundwater quality and depletion in the Indo-Gangetic Basin mapped from in situ observations. Nat. Geosci. 2016, 9, 762–766. [Google Scholar] [CrossRef]
  6. Shia, X.; Wang, Y.; Jiao, J.J.; Zhongd, J.; Wend, H.; Donga, R. Assessing major factors affecting shallow groundwater geochemical evolution in a highly urbanized coastal area of Shenzhen City, China. J. Geochem. Explor. 2017, 184, 17–27. [Google Scholar] [CrossRef]
  7. Belkhiri, L.; Boudoukha, A.; Mouni, L. Application of multivariate statistical methods for characterization of groundwater—A case study: Ain Azel Plain (Algeria). J. Appl. Sci. Eng. Technol. 2010, 159, 390–398. [Google Scholar]
  8. L-Ruiz, R.; Zapata, E.P.; Parra, R.; Harter, T.; Mahlkencht, J. Investigation of the geochemical evolution of groundwater under agricultural land: A case study in northeastern Mexico. J. Hydrol. 2015, 521, 410–423. [Google Scholar] [CrossRef]
  9. Rajmohan, N.; Elango, L. Identification and evolution of hydrogeochemical process in groundwater environment in a part of Palar and Cheyyar river basins, South India. Environ. Geol. 2004, 46, 47–61. [Google Scholar]
  10. Russoniello, C.J.; Fernandez, C.; Bratton, J.F.; Banaszak, J.F.; Krantz, D.E.; Andres, A.S.; Konikow, L.F.; Michael, H.A. Geologic effects on groundwater salinity and discharge into an estuary. J. Hydrol. 2013, 498, 1–12. [Google Scholar] [CrossRef]
  11. Tahoora, S.N.; Ramli, M.F.; Aris, A.Z.; Sulaiman, W.N.A.; Juahir, H.; Fakharian, K. Identification of the Hydrogeochemical Processes in Groundwater Using Classic Integrated Geochemical Methods and Geostatistical Techniques, in Amol-Babol Plain, Iran. Sci. World J. 2014, 2014, 419058. [Google Scholar]
  12. Ganesan, G.; Ramachandran, C.; Sudha, R.R.; Vetrimurugan, E.; Saravanan, D.; Karthikeyan, B.; Usha, A.; Lakshmanan, E. Chemical, microbial and antibiotic susceptibility analyses of groundwater after a major flood event in Chennai. Sci. Data 2017. [Google Scholar] [CrossRef]
  13. Vetrimurugan, E.; Brindha, K.; Elango, L.; Ndwandwe, O.M. Human exposure risk to heavy metals through groundwater used for drinking in an intensively irrigated river delta. Appl. Water Sci. 2016, 7, 3267–3280. [Google Scholar] [CrossRef]
  14. Machiwal, D.; Jha, M.K. Identifying sources of groundwater contamination in a hard-rock aquifer system using multivariate statistical analyses and GIS-based geostatistical modeling techniques. J. Hydrol. 2015, 4, 80–110. [Google Scholar] [CrossRef]
  15. Gil-Márquez, J.M.; Barberá, J.A.; Andreo, B.; Mudarra, M. Hydrological and geochemical processes constraining groundwater salinity in wetland areas related to evaporitic (karst) systems. A case study from Southern Spain. J. Hydrol. 2016, 544, 538–554. [Google Scholar] [CrossRef]
  16. Rajmohan, N.; Patel, N.; Singh, G.; Amarasinghe, U. Hydrochemical evaluation and identification of geochemical processes in the shallow and deep wells in the Ramganga Sub-Basin, India. Environ. Sci. Pollut. Res. 2017, 24, 21459–21475. [Google Scholar] [CrossRef] [PubMed]
  17. Vetrimurugan, E.; Elango, L. Groundwater chemistry and quality in an intensively cultivated river delta. Water Qual. Expo. Health 2015, 7, 125–141. [Google Scholar] [CrossRef]
  18. Guler, C.; Thyne, D.G.; McCray, J.E.; Turner, A.K. Evaluation of graphical and multivariate statistical methods for classification of water chemistry data. Hydrogeol. J. 2002, 10, 455–474. [Google Scholar] [CrossRef]
  19. Cloutier, V.; Lefebvre, R.; Therrien, R.; Savard, M.M. Multivariate statistical analysis of geochemical data as indicative of the hydrogeochemical evolution of groundwater in a sedimentary rock aquifer system. J. Hydrol. 2008, 353, 294–313. [Google Scholar] [CrossRef]
  20. Viero, A.P.; Roisenberg, C.; Roisenberg, A.; Vigo, A. The origin of fluoride in the granitic aquifer of Porto Alegre, Southern Brazil. Environ. Geol. 2009, 56, 1707–1719. [Google Scholar] [CrossRef]
  21. Middleton, B.J.; Bailey, A.K. Water Resources of South Africa, 2005 Study (WR2005); WRC Report Number TT380/08; Water Research Commission: Pretoria, South Africa, 2009. [Google Scholar]
  22. Campbell, E.; Bate, G. Groundwater in the Alexandria dune field and its potential influence on the adjacent surf-zone. Water SA 1992, 17, 155–160. [Google Scholar]
  23. Vetrimurugan, E.; Brindha, K.; Elango, L. Regional and temporal variation in minor ions in groundwater of a part of a large river delta, southern India. Environ. Monit. Assess. 2017, 189, 305. [Google Scholar]
  24. Vetrimurugan, E.; Brindha, K.; Elango, L. Human Exposure Risk Assessment Due to Heavy Metals in Groundwater by Pollution Index and Multivariate Statistical Methods: A Case Study from South Africa. Water 2017, 9, 234. [Google Scholar]
  25. Edmunds, M.; Smedley, P. Fluoride in natural waters. In Essentials of Medical Geology; Springer: Dordrecht, The Neverland, 2013; pp. 311–336. [Google Scholar]
  26. Wanda, E.; Monjerezi, M.; Mwatseteza, J.F.; Kazembe, L.N. Hydro-geochemical appraisal of groundwater quality from weathered basement aquifers in Northern Malawi. Phys. Chem. Earth 2011, 36, 1197–1207. [Google Scholar] [CrossRef]
  27. He, J.; An, Y.; Zhang, F. Characteristics and fluoride distribution in the groundwater of the Zhangye Basin in Northwestern China. J. Geochem. Explor. 2013, 135, 22–30. [Google Scholar] [CrossRef]
  28. Vetrimurugan, E.; Brindha, K.; Sithole, B.; Elango, L. Spatial interpolation methods and geostatistics to map groundwater contamination in a coastal area, Kwazulu-Natal, South Africa. Environ. Sci. Pollut. Res. 2017, 24, 11601–11617. [Google Scholar]
  29. Singh, C.K.; Kumari, R.; Singh, N.; Mallik, J.; Mukherjee, S. Fluoride enrichment in aquifers of the Thar Desert: Controlling factors and its geochemical modelling. Hydrol. Process. 2013, 27, 2462–2474. [Google Scholar] [CrossRef]
  30. Vetrimurugan, E.; Elango, L.; Rajmohan, N. Sources of contaminants and groundwater quality in the coastal part of a river delta. Int. J. Environ. Sci. Technol. 2013, 10, 473–486. [Google Scholar] [CrossRef]
  31. Singh, C.K.; Mukherjee, S. Aqueous geochemistry of fluoride enriched groundwater in arid part of Western India. Environ. Sci. Pollut. Res. 2015, 22, 2668–2678. [Google Scholar] [CrossRef] [PubMed]
  32. Fadili, A.; Najib, S.; Mehdi, K.; Riss, J.; Makan, A.; Boutayeb, K.; Guessir, H. Hydrochemical features and mineralization processes in coastal groundwater of Oualidia, Morocco. J. Afr. Earth Sci. 2016, 116, 233–247. [Google Scholar] [CrossRef]
  33. Dehbandi, R.; Moore, F.; Keshavarzi, B. Geochemical sources, hydrogeochemical behavior, and health risk assessment of fluoride in an endemic fluorosis area, central Iran. Chemosphere 2017, 193, 763–776. [Google Scholar] [CrossRef] [PubMed]
  34. Perry, J.E. Basic Physical Geography/Hydro Data for Natal ‘Estuaries’; NRIO Data Report No. D 8607; CSIR: Western Cape, South Africa, 1986; 6p. [Google Scholar]
  35. Broderick, D.M. An Examination of Changes in the Extent of Erosion in Agricultural Areas in the Tugela Basin. Master’s Thesis, University of Natal, Durban, South Africa, 1987. [Google Scholar]
  36. Schulze, R.E. Hydrology and Water Resources of the Drakensberg; Natal Town and Regional Planning Commission: Pietermaritzbur, South Africa, 1979. [Google Scholar]
  37. Midgley, D.C.; Pitman, W.V.; Middleton, B.J. Surface Water Resources of South Africa 1990; WRC Report 298/6.1/94; Water Research Commission: Pretoria, South Africa, 1994; Volume VI. [Google Scholar]
  38. Quinn, N. Tugela Estuarine Freshwater Requirements: An Initial Assessment; Department of Water Affairs and Forestry (DWAF): Pretoria, South Africa, 1997.
  39. Department of Water Affairs and Forestry (DWAF). Thukela Water Project Feasibility Study: Main Report; Report No. V000/00/9600; Department of Water Affairs and Forestry (DWAF): Pretoria, South Africa, 2002.
  40. APHA. Standard Methods for the Examination of Water and Wastewater, 22nd ed.; American Water Works Association: Denver, CO, USA, 2012. [Google Scholar]
  41. Masoud, A.A. Groundwater quality assessment of the shallow aquifers west of the Nile Delta (Egypt) using multivariate statistical and geostatistical techniques. J. Afr. Earth Sci. 2014, 95, 123–137. [Google Scholar] [CrossRef]
  42. Rahman, M.S.; Saha, N.; Islam, A.R.M.T.; Shen, S.; Bodrud-Doza, M. Evaluation of Water Quality for Sustainable Agriculture in Bangladesh. Water Air Soil Pollut. 2017, 228, 385. [Google Scholar] [CrossRef]
  43. Tapoglou, E.; Karatzas, G.P.; Trichakis, J.C.; Varouchakis, E.A. A spatio-temporal hybrid neural network-kriging model for groundwaterlevel simulation. J. Hydrol. 2014, 519, 3193–3203. [Google Scholar] [CrossRef]
  44. Freez, R.A.; Cherry, J.A. Groundwater; Prentice Hall Inc.: Bergen County, NJ, USA, 1979. [Google Scholar]
  45. Piper, A.M. A graphic procedure in the geochemical interpretation of water analyses. Am. Geophys. Union Trans. 1944, 25, 914–928. [Google Scholar] [CrossRef]
  46. Durov, S.A. Classification of natural waters and graphical representation of their composition. Dokl. Akad. Nauk. USSR 1948, 59, 87–90. [Google Scholar]
  47. Gibbs, R.J. Mechanisms controlling world water chemistry. Science 1970, 170, 1088–1090. [Google Scholar] [CrossRef] [PubMed]
  48. Elango, L.; Kannan, R. Rock–water interaction and its control on chemical composition of groundwater. Dev. Environ. Sci. 2007, 5, 229–243. [Google Scholar]
  49. Sivasubramanian, P.; Balasubramanian, N.; Soundranayagam, J.P.; Chandrasekar, N. Hydrochemical characteristics of coastal aquifers of Kadaladi, Ramanathapuram District, Tamilnadu, India. Appl. Water Sci. 2013, 3, 603–612. [Google Scholar] [CrossRef]
  50. Ravikumar, P.; Somashekar, R.K.; Prakash, K.L. A comparative study on usage of Durov and Piper diagrams to interpret hydrochemical processes in groundwater from SRLIS hydrochemical processes in groundwater from SRLIS river basin, Karnataka India. Elixir Earth Sci. 2015, 80, 31073–31077. [Google Scholar]
  51. Meybeck, M. Global chemical weathering from surficial rocks estimated from river dissolved loads. Am. J. Sci. 1987, 287, 401–428. [Google Scholar] [CrossRef]
  52. Mayo, A.L.; Loucks, M.D. Solute and isotopic geochemistry and groundwater flow in the Central Wasatch Range. Utah. J. Hydrol. 1995, 172, 31–59. [Google Scholar] [CrossRef]
  53. Katz, B.G.; Coplen, T.B.; Bullen, T.D.; Davis, J.H. Use of chemical and isotopic tracers to characterize the interaction between groundwater and surface water in mantled karst. Groundwater 1998, 35, 1014–1028. [Google Scholar] [CrossRef]
  54. Hem, J.D. Study and Interpretation of the Chemical Characteristics of Natural Water. In US Geological Survey Water Supply Paper, 3rd ed.; U.S. Geological Survey: Reston, VA, USA, 1985; p. 2254. [Google Scholar]
  55. Schoeller, H. Geochemistry of groundwater. In Groundwater Studies—An International Guide for Research and Practice; UNESCO: Paris, France, 1977; Volume 15, pp. 1–18. [Google Scholar]
  56. Usman, U.N.; Toriman, M.E.; Juahir, H.; Abdullahi, M.G.; Rabiu, A.A.; Isiyaka, H. Assessment of Groundwater Quality Using Multivariate Statistical Techniques in Terengganu. Sci. Technol. 2014, 4, 42–49. [Google Scholar]
  57. Department of Water Affairs and Forestry (DWAF). South African Water Quality Guidelines, 2nd ed.; Department of Water Affairs and Forestry: Pretoria, South Africa, 1996.
  58. World Health Organization (WHO). Guidelines for Drinking-Water Quality, 4th ed.; WHO Library Cataloguing-in-Publication Data; World Health Organization: Geneva, Switzerland, 2011; 564p. [Google Scholar]
  59. Davis, S.N.; DeWiest, R.J.M. Hydrogeology; John Wiley & Sons: New York, NY, USA, 1966; p. 463. [Google Scholar]
  60. Sawyer, C.N.; McCarty, P.L. Chemistry for Sanitary Engineers, 2nd ed.; McGraw-Hill: New York, NY, USA, 1967. [Google Scholar]
  61. Sengupta, P. Potential Health Impacts of Hard Water. Int. J. Prev. Med. 2013, 4, 866–875. [Google Scholar] [PubMed]
  62. NIHCC (National Institute of Health Clinical Center). Dietary Supplement Fact Sheet: Calcium. Office of Dietary Supplement, 2009. Available online: https://ods.od.nih.gov/factsheets/list-all/Calcium/ (accessed on 20 May 2018).
  63. World Health Organization (WHO). Sodium in Drinking Water; Background Document for Development of WHO Guidelines for Drinking-Water Quality; World Health Organization: Geneva, Switzerland, 2003. [Google Scholar]
  64. Karanth, K.R. Ground Water Assessment, Development and Management; Tata McGraw Hill: New Delhi, India, 1987. [Google Scholar]
  65. Vetrimurugan, E.; Elango, L. Seasonal and spatial variation in magnesium and chloride concentration in groundwater of deltaic regions of Kumbakonam, Nannilam and Karaikal, Tamil Nadu. J. Environ. Prot. 2007, 27, 987–995. [Google Scholar]
  66. South African Water Quality Guidelines (SAWQG). Domestic Water Use, 2nd ed.; Department of Water Affairs and Forestry: Pretoria, South Africa, 1996; Volume 4.
  67. Richards, L.A. Diagnosis and Improvement of Saline and Alkali Soils; US Department of Agriculture: Washington, DC, USA, 1954; p. 60.
  68. Wilcox, L.V. Classification and Use of Irrigation Waters 19; USDA Circular No. 969; Department of Agriculture: Washington, DC, USA, 1955.
  69. Kelly, W.P. Permissible Composition and Concentration of Irrigation Water. Proc. Am. Soc. Civ. Eng. 1957, 66, 607–609. [Google Scholar]
  70. Doneen, L.D. Notes on Water Quality in Agriculture; Water Science and Engineering Paper 4001; Department of Water, Science and Engineering, University of California: Davis, CA, USA, 1964. [Google Scholar]
  71. Ayers, R.S.; Westcot, D.W. Water Quality for Agriculture; M-56-ISBN 92-5-102263-1; Food and Agriculture Organization of the United Nations: Rome, Italy, 1985. [Google Scholar]
  72. Eaton, F.M. Significance of carbonates in irrigation waters. Soil. Sci. V 1950, 69, 123–133. [Google Scholar] [CrossRef]
Figure 1. Location of study with monitoring wells.
Water 10 00687 g001
Figure 2. Piper plot shows hydrochemical facies in the study area.
Water 10 00687 g002
Figure 3. Durov plot explains water types and hydrochemical processes.
Water 10 00687 g003
Figure 4. Spatial distribution of major cations.
Water 10 00687 g004
Figure 5. Spatial distribution of major anions.
Water 10 00687 g005aWater 10 00687 g005b
Figure 6. Gibb’s plots—Mechanism controlling water chemistry.
Water 10 00687 g006
Figure 7. Bivariate plots of selected variables. SWR—Seawater ratio; RIE—Reverse ion exchange.
Water 10 00687 g007
Figure 8. Spatial distribution of factor scores.
Water 10 00687 g008
Figure 9. Wilcox diagram explains irrigation water suitability.
Water 10 00687 g009
Figure 10. Permeability index vs. total ions.
Water 10 00687 g010
Figure 11. USSL classification.
Water 10 00687 g011
Figure 12. Groundwater suitability zone for drinking and irrigation.
Water 10 00687 g012
Table 1. Descriptive statics of analyzed parameters in the groundwater.
ParametersMinMaxMeanSTD
PH6.57.97.10.3
ORP−8.3−0.2−3.01.6
DO0.251.20.70.3
EC40829,24026874681
TDS26118,71417202996
TH65763233155
Na4869714911126
K21052
Ca131474928
Mg81122722
Si3.2126.62.4
Cl9599267531613
HCO34931115963
CO30451011
SO45133089220
Table 2. Correlation among water quality parameters.
ParameterECTDSTHSiNaCaMgClSO4
EC1.001.000.74−0.291.000.740.691.000.98
p value 0.000.000.090.000.000.000.000.00
TDS1.001.000.74−0.291.000.740.691.000.98
p value0.00 0.000.090.000.000.000.000.00
TH0.740.741.00−0.500.690.960.970.730.72
p value0.000.00 0.000.000.000.000.000.00
Si−0.29−0.29−0.501.00−0.26−0.57−0.39−0.27−0.27
p value0.090.090.00 0.130.000.020.110.11
Na1.001.000.69−0.261.000.700.641.000.98
p value0.000.000.000.13 0.000.000.000.00
Ca0.740.740.96−0.570.701.000.860.730.72
p value0.000.000.000.000.00 0.000.000.00
Mg0.690.690.97−0.390.640.861.000.690.67
p value0.000.000.000.020.000.00 0.000.00
Cl1.001.000.73−0.271.000.730.691.000.98
p value0.000.000.000.110.000.000.00 0.00
SO40.980.980.72−0.270.980.720.670.981.00
p value0.000.000.000.110.000.000.000.00
n363636363636363636
Note: Significant correlation is marked in bold italic (r ≥ 0.5; p < 0.05).
Table 3. Principle component analysis.
VariablesComponent
PC1PC2PC3
Cl0.990.090.07
Na0.990.060.06
EC0.990.110.07
TDS0.990.110.07
SO40.980.050.08
Ca0.700.590.19
Mg0.660.400.41
HCO3−0.100.86−0.09
Si−0.210.760.00
pH−0.01−0.210.75
ORP−0.10−0.130.68
K0.330.310.28
Eigen value5.962.021.34
% of Variance49.6716.8311.19
Cumulative %49.6766.577.69
Note: Extraction Method: Principal Component Analysis. Rotation Method: Varimax with Kaiser Normalization. Bold—High loading (> 0.5).
Table 4. Groundwater suitability assessment.
ParameterSAWQG [66]WHO [58]SAWQG [66]WHO [58]
Desirable limit (DL)Maximum Allowable Limit (MAL)Highest Desirable Limit (HDL)Maximum Allowable Limit (MAL)No. of Samples (%) Exceeded DLNo. of Samples (%) Exceeded MALNo. of Samples (%) Exceeded HDLNo. of Samples (%) Exceeded MAL
PH6.09.06.58.50000
EC7001500--32 (89)23 (64)--
TDS4501000500100032 (89)21 (58)30 (83)21 (58)
TH5010010050036 (100)32 (89)32 (89)2 (6)
Na100200-20031 (86)23 (64)-23 (64)
K-50-12-0-0
Ca32807520024 (67)4 (11)7 (19)0
Mg30100501508 (22)1 (3)2 (6)0
Cl10060020060035 (97)11 (31)29 (81)11 (31)
SO42004002004002 (6)1 (3)2 (6)1 (3)
Table 5. Davis and De Wiest [59] Classification based on TDS.
TDS (mg/L)ClassificationNumber of Samples (%)
<500Desirable for drinking water6 (17)
500–1000Permissible for drinking water9 (25)
1000–3000Useful for irrigation water21 (58)
>3000Unfit for drinking and irrigation2 (6)
Table 6. Water classification based on TDS [44].
TDS (mg/L)ClassificationNo. of Samples (%)
<1000Fresh water15 (42)
1000–10,000Brackish water type20 (55)
10,000–100,000Saline water type1 (3)
>100,000Brine water type0
Table 7. Water classification based on TH [60].
TH (mg/L)ClassificationNo. of Samples (%)
<75Soft1(3)
75–150Moderately hard12 (33)
150–300Hard14 (39)
>300Very hard9 (25)
Table 8. Classification of groundwater samples for irrigation.
ParametersRangeIrrigation SuitabilityNo. of Samples (%)References
Salinity hazard (EC (µS/cm))<250C1—Excellent (Low)-[67]
250–750C2—Good (Medium)5 (14)
750–2250C3—Permissible (High)20 (56)
>2250C4—Unsuitable (V. High)11 (30)
Na %<20Excellent-[68]
20–40Good-
40–60Permissible2 (6)
60–80Doubtful27 (75)
>80Unsuitable7 (19)
SAR<10S1—Low20 (56)[67]
18–10S2—Medium15 (42)
18–26S3—High-
>26S4—Very High1 (2)
RSC (meq/L)<1.25Safe36 (100)[72]
1.25–2.5Moderate-
>2.5Unsuitable-
Kelly’s ratio<1Safe-[69]
>1Unsafe36 (100)
PIClass IGood3 (7)[70]
Class IIPermissible33 (93)
Class IIIUnsuitable-
MH (%)<50Suitable28 (78)[71]
>50Unsuitable8 (22)

