Detention and Retention Behavior of Four Extensive Green Roofs in Three Nordic Climate Zones

1
Department of Civil and Environmental Engineering, Norwegian University of Science and Technology (NTNU), N-7491 Trondheim, Norway
2
Department of Water and Wastewater, The City of Oslo, N-0506 Oslo, Norway
*
Author to whom correspondence should be addressed.
Water 2018, 10(6), 671; https://doi.org/10.3390/w10060671
Submission received: 26 April 2018
/
Revised: 11 May 2018
/
Accepted: 18 May 2018
/
Published: 23 May 2018
(This article belongs to the Special Issue Hydrological Performance of Green Roofs)
Abstract
:Climate change coupled with increasing urbanization has made extensive green roofs, both for retrofitting and new developments, an attractive way to bring nature back to cities, while managing stormwater. This study has investigated extensive green roof retention and detention performance based on 3–8 years of field data from four Norwegian locations representing typical cold and wet Nordic climates, also comparing several different commercial configurations. Accumulated retention was found to be 11–30% annually and 22–46% in May through October. The performance was found to be strongly dependent in evapotranspiration and less dependent on material storage capacities. Estimates for available storage capacities for precipitation events larger than 5 mm are given and can be useful for design purposes. Median observed peak attenuation compared to the precipitation ranged from 65–90% depending on locations and configurations. The event-based approach for evaluating detention was found to be challenging due to the nature of the precipitation in the studied locations. An alternative approach using flow duration curves based on the observed time series was tested and found to give valuable information on runoff patterns from green roofs and to be useful for evaluating green roof performance in relation to local requirements.
1. Introduction
In the last few decades, green roofs have gained increasing interest as a blue-green stormwater solution that contributes multiple benefits to urban environments and building envelopes. Green roofs reduce temperature fluctuations and protect the roof membranes from UV light, giving increased membrane longevity, while the increased insulation contributes to reduced energy consumption for heating and cooling, especially beneficial for warmer climates, where buildings are less insulated [1,2,3,4]. Benefits to urban environments include a reduction in urban heat and an increase in urban habitats for insects, birds and plants [1,5]. Green roofs have also been found to have a positive public perception [6]. This study investigates the hydrological performance of green roofs and its dependency on both roof configuration and local climate. Green roofs often serve as the first step in stormwater treatment trains. The main objective is to reduce runoff volumes from the daily precipitation events by retention and to detain runoff from larger events to reduce capacity problems in downstream stormwater and combined sewer systems [7]. For this purpose, good estimates of both retention and detention performance are important.
1.1. Background
Green roofs’ hydrological performance is linked to the ability to delay and attenuate stormwater runoff [8]. This effect can be explained by two simultaneous processes taking place. Retention is the ability to permanently hold back (retain) water by storing the water for subsequent removal by evapotranspiration. This is the first process taking place when a green roof is exposed to precipitation. If the precipitation depth exceed the storage capacity, runoff will occur. Detention is the ability to temporarily hold back (detain) the water, resulting in a reduced and delayed peak runoff with a prolonged runoff period compared to a conventional roof. In field studies, the observed effect will often be a combination of retention and detention [9].
The hydrological performance of a green roof is influenced by several different factors connected to the applied configuration (materials and layer build-up), roof geometry (size, shape and slope), climate and plant-species and development. The relevant factors for this study are introduced here.
1.1.1. Green Roof Materials
Green roofs are based on a set of layers with the main objectives to provide water storage and nutrients for plants and to regulate water transport through the system. The main component is the substrate layer providing a foundation for the plant roots. The most widespread plants used in extensive green roofs are succulent species (especially sedum), due to their high tolerance towards drought, high temperatures and wind, low maintenance needs and slow growth, but also, other species like grasses and forbs are used [10].
Green roof substrates are comprised mainly of an inorganic component with the addition of an organic component (5–20 v/v %). The vegetation can be planted directly into the substrate from seeds, cuttings or plug plants, but for a quicker establishment of plants, pregrown vegetation mats reinforced with coconut fibers or plastic spirals are commonly applied [11].
The green roof substrates’ ability to store water has commonly been expressed by the maximum water capacity (MWC) as defined in the German Green Roofing Guideline [11], but studies have confirmed that the MWC overestimates the substrates’ water storage capacity and better illustrates maximum structural loadings. Fassman and Simcock [12] found agronomic measurements, corresponding to the water stored between field capacities (FC) and wilting point (WP), to better represent the green roof substrates’ water holding capacity (WHC).
Under the plant and substrate layer, a set of different combinations of layers can be applied. Textile retention layers can provide water storage, regulate water transport and serve as a protection layer for the roof membrane. Conjugated (bent, curved) plastic or polystyrene plates, in this paper referred to as drainage layers, improve drainage by providing almost free passage for water and can also provide volumes for water storage in cuplike shapes. The layers can be put together in a variety of different combinations often with geotextiles to separate different layers when needed.
1.1.2. Water Transport in Green Roofs in General
Water transport through green roofs consists of two main components, a vertical and a horizontal component. Green roofs are designed with high infiltration rates where water is expected to first percolate vertically through the green roof layers before travelling almost horizontally along the drainage layer close to the roof surface.
The vertical percolation process is governed by the hydraulic conductivity, or the infiltration capacity, of the applied materials. Green roofs are commonly based on substrates with high infiltration properties. The German green roof guideline [11] recommends that the saturated hydraulic conductivity be higher than maximum precipitation intensities (requires 0.6–70 mm/min) to avoid surface ponding and surface erosion, which means that unsaturated flow conditions dominate for green roofs. Unsaturated flow can either appear as uniform flow, based on a stable downwards wetting front, or as preferential flow with an irregular wetting front and non-uniform flow through the media profile. Liu and Fassman-Beck [13] investigated the flow mechanisms in column experiments with different green roof substrates without plants. They found uniform flow to be the dominant flow mechanism, but observed preferential flow in three tested green roof media with a bimodal pore structure combined with low initial soil moisture. De-Ville, et al. [14] investigated undisturbed sample cores of planted green roof substrates in X-ray microtomography image analysis and observed the formation of flow paths through the substrate mixes, possibly being caused by root decay. Few other studies have discussed the flow conditions in green roofs, although it is of importance for the detention process, as preferential flow will increase the transport of water and make it less predictable.
The horizontal transport component is governed by the configuration and properties of the bottommost layers. Drainage layers as the bottommost layers can provide an almost free flow along the roof membrane, leading to high water speed, mainly governed by the roof membrane friction and the slope. Depending on the shape of the drainage layer and the size and numbers of openings for water to travel through the drainage layer, transport of water might also happen on top of the drainage layer instead of under. Textile retention mats, substrates or other crushed materials as the bottommost layer will, on the other hand, probably increase the friction and reduce the water speed. Vesuviano and Stovin [15] compared runoff profiles from different drainage layers and found that the tested drainage boards performed quite similar to the bare channel, while the drainage board with a textile retention mat underneath showed the largest runoff delay. They also observed that different drainage boards made of the same material showed the same runoff behavior, possibly due to the same material surface roughness.
Detention processes depend on an increased transport time for water through the green roof configuration compared to a conventional roof. Which of the vertical and the horizontal transport components will be of most importance for detention is dependent on green roof layer build-up, roof size, slope and transport path to the gutter. In general terms, detention performance can be improved by increasing depths, decreasing hydraulic conductivities, applying high friction textile retention mats, increasing transport distance to the outlet, lower slopes or by applying restricted orifice outlets.
1.1.3. Green Roof Configuration and Geometry
Increasing media depths have been found to increase detention with prolonged runoff, higher peak attenuation and longer peak lag times [16,17,18,19], due to longer vertical transport distances. Others have not found this to be significant and have emphasized the importance of the horizontal flow path to the gutter and physical resistance in the drainage layer for observed detention performance [20,21]. Bengtsson [22] studied peak flows in a thin sedum-moss roof and found the vertical percolating process through the vegetation and the soil to dominate, but that the presence of a gravel drainage layer resulted in faster runoff and increased runoff peaks compared to no drainage layer with the vegetation mat placed directly on the roof. Increasing media depths have also been found to give increased retention [17,18,23], while other have found no significant effect of increased media depth on retention [24].
Increasing slopes have been found to give increased peak runoffs in extensive green roofs [23,25] and in drainage layers alone [15]. Several studies have also investigated the effect of slope on green roof retention and found that retention decreases as slope increases [23,25,26].
Hakimdavar, et al. [21] investigated the scale effect on detention performance with three green roofs (0.1, 100 and 310 m2 drainage area to one downspout) with similar layer build-up and found that peak reduction increased with green roof scale. Similar findings were found for drainage layers alone by Vesuviano and Stovin [15].
1.1.4. Climate
Retained water in green roof systems is removed by evapotranspiration (ET), the combined effect of plant transpiration and direct evaporation from plant and substrate surfaces. These effects are highly dependent on the local climate (temperature, air humidity, wind and radiation). Actual evapotranspiration (AET) is defined as the observed evapotranspiration and is limited by type of vegetation and available substrate moisture, in addition to the climatic variables. Exact values for AET are difficult to measure and require other methods than assessed in this study. This paper applies a simplified approach where AET refers to the stored water removed between each precipitation event. In this context, retention performance of a given green roof will be a result of the total balance between water storage capacities, precipitation input and AET.
Water storage capacity, and retention, is a finite measure. This is confirmed by several studies showing that the fraction of water retained decreases as the event sum precipitation increases [21,26,27] and that retention increases as substrate initial moisture decreases [28]. Significant improvements in detention performance are also found at lower initial substrate moistures [29], mainly due to the effect of initial losses by retention, but possibly also affected by the fact that hydraulic conductivity increases as soil moisture content increases.
1.1.5. Retention Performance
Reported accumulated retention performance in different field studies shows large variation due to variations in layer build up and storage capacities, but probably most important due to variation in local climate with respect to precipitation and AET. The large variations are illustrated by the reported accumulated annual retention performance for extensive green roofs in northern parts of Europe and comparable climates varying from 18–59% (Table 1). Few actual field studies, and especially long duration studies, are available from cold and wet climates comparable to the Nordic climates, and design estimates for retention are needed.
Most studies from locations with large seasonal variation in evapotranspiration report lower retention in winter and higher in summer [27,31,38,39,40]. Some studies does also explain part of the observed seasonal variations as a result of seasonal variations in precipitation patterns [34,41].
There is a large inter-event variability shown in most reported studies with reported retention from 0–100%, showing a decrease in retention with increasing event sum precipitation [9,21,26,27], but also, other factors such as antecedent soil moisture content are found to be important.
Due to the high variability in extensive green roof retention performance, both on an annual, seasonal and event basis, caution must be exercised when estimating the expected effect. Material WHC alone is not enough to predict green roof retention, as it is dependent on interactions amongst multiple factors like initial moisture conditions, AET, the size of precipitation events, etc. When used for design purposes, material properties should be combined with long-term observations and/or well-performing models for the specific climate.
1.1.6. Detention Performance
For a given precipitation event, detention can be expressed with several different metrics like peak attenuation and lag times between precipitation and runoff describing time delays (start, stop, peak, centroid, etc.) [9]. Detention performance in the field is closely linked to the retention performance, as the initial losses by retention will be included in the detention metrics. Stovin, et al. [9] studied four different U.K. climates with a green roof detention model and showed that locations that experienced higher levels of retention also demonstrated improved detention. Feitosa and Wilkinson [42] modelled green roofs in the HYDRUS-1D software modelling water flow in porous media and showed that runoff peak attenuation was severely reduced at high antecedent soil moisture conditions.
Improved detention performance in extensive green roofs compared to precipitation and reference roofs is observed in a large number of studies worldwide [7,34,43]. Observed green roof detention performance shows high variability due to variations in precipitation intensity, volumes and duration, green roof configuration, initial conditions and performance metrics (Table 2).
The concept of dividing data into events based on minimum antecedent dry periods and comparing different event metrics is widely applied and efficient when handling large time series [21,27,34]. For the evaluation of retention performance, this is useful since it allows for a closed water balance, but only if event duration is short enough not to include any significant AET. Evaluating detention performance using event metrics like lag times from start, stop, peak or centroid precipitation to runoff and peak attenuation is based on the assumption that the precipitation follows a simplified pattern with one distinct peak and a limited duration. This is suited well for climates where most precipitation comes as defined showers with long intermediate dry periods. However, this approach is challenging in climates with irregular precipitation patterns, long duration precipitation events and large intra-event variability in intensity and with several peaks [34]. There is also a lack of a single descriptive detention metric. Altogether, this makes detention performance of green roofs hard to compare, predict and communicate, and green roof implementation suffers from this. Several studies have suggested modelling as an important tool to understand green roof detention, but so far, no satisfactorily-performing generic model without site-specific calibration is available [7,46].
Further development of tools is needed to find better ways of presenting observed green roof detention and to estimate expected detention performance for a given roof configuration. Preferable tools should incorporate the total variability of the performance, while still being able to relate this to relevant performance standards or design precipitation. Stovin, et al. [9] applied probability density functions (PDF) as a probabilistic approach to compare performance against design standards, like the regulatory greenfield runoff rate, still based on event metrics. Another possible probabilistic approach to evaluate performance without using event metrics is the use of flow duration curves (FDC). FDC show the relationship between the magnitude and frequency of precipitation and discharge flows [47,48]. This approach is based on all runoff data, not only the event maximum, including the effect of the precipitation length and variability of intensity. This would especially be useful in locations experiencing long and variable precipitation events. FDC have been applied successfully by Avellaneda, et al. [49] to evaluate the efficiency of green infrastructure on a basin scale by studying the shift in curves from pretreatment to treatment situation and by studying flow reductions in discharges with given return periods.
1.2. Objectives
The main objectives of this study are to:
- Investigate cumulative retention performance for extensive green roofs as a function of local climate, seasons and green roof configuration.
- Investigate event-based retention performance relevant from a design perspective, as a function of local climate and green roof configuration.
- Investigate event-based peak detention performance as a function of green roof configuration and geometry.
- Investigate if flow duration curves can be used as a tool to describe green roofs’ effect on runoff patterns.
2. Materials and Methods
2.1. Site Descriptions
This study includes 3–8 years of continuous measurements from extensive green roofs at 4 different Norwegian locations and 16 different small-scale plots (8–15 m2) (Figure 1). Bergen (BER) is situated on the west coast with steep mountains surrounding the city, giving 3110 mm of annual precipitation, while Sandnes (SAN) is situated further south with a flatter landscape and has 1690 mm of annual precipitation. Both locations are classified as a temperate oceanic climate (Cfb) and experience relatively mild winters with few frost days and precipitation as mainly rain throughout the winter. Oslo (OSL) has more of an inland climate with 970 mm of annual precipitation (140 mm as snow), warmer summers and colder winters and is classified as a warm-summer humid continental climate (Dfb). Trondheim (TRD) is the northernmost location with 1070 mm of annual precipitation (100 mm as snow) and the winter condition in the same range as Oslo, but with cooler summer temperatures, and is classified as subpolar oceanic climate (Dfc). Climate classifications are according to the Köppen–Geiger climate classification [30]. The locations represent a variety of typical Nordic climates and represent the most densely-populated areas of Norway, where green roof benefits are of high interest.
The tested slopes vary from 5.5% in OSL, corresponding to a typical flat roof, to 16% in TRD and BER and 27% in SAN, representing normal sloped roofs.
A variety of different extensive green roof configurations with building depths of 33–160 mm have been tested (Table 3, Figure 1), based on materials donated by the Norwegian green roof industry. Roof water lining were based on black bitumen membranes at all locations. All green roofs were supplied with 30-mm pre-grown reinforced vegetation mats with a variety of sedum species supplied from four different manufacturers. All reported data were collected a minimum of 6 months after installation. Two basic configurations, called Basic1 and Basic2, with only a textile retention fabric under the vegetation mat have been tested, where Basic1 has a thinner fabric than Basic2. A substrate mat (SM) configuration, which is a 50-mm mineral wool plate placed under the vegetation mat, has been tested in three locations. Extra substrates have been applied to the thick configurations, called Thick1, Thick2 and Thick3. The Thick1 configuration has been tested at all sites with 50 mm of extra Leca and brick-based green roof substrate, with plastic drainage layers of high density polyethylene (HDPE) or expanded polystyrene (EPS) of varying depth, shape and water storage capacity and a textile retention fabric as the bottommost layer. The Thick2 configuration has only been applied in TRD with 50 mm of extra lava and pumice-based green roof substrate over a HDPE drainage layer. The Thick3 configuration has only been applied in BER where a layer of pumice was filled in a grass reinforcement in HDPE, placed over a textile retention fabric. In the OSL location, variations of the basic solution have been tested. First, a vegetation mat over a HDPE drainage layer (DL), called Basic+DL. Later, a textile retention mat was placed between the vegetation mat and the drainage layer, called Basic2+DL. A conventional black roof has also been monitored in OSL for parts of the experimental period serving as a reference, while the other locations had no black roof and used the onsite precipitation measurements for comparison.
The roofs in TRD, BER and SAN were monitored in the period 2015–2017. The total available data period includes 36 months of data for all configurations in TRD, 36 months for all configurations in BER, except Basic2, which has 34 months, and Thick3, which has 32 months. All configurations in SAN have 32 months of data. The Basic2 configuration in OSL has 96 months of data (2010–2017), Basic2+DL 77 months (August 2011–2017), Basic+DL 19 months (2010–August 2011), the reference black roof 53 months (2010–June 2014) and the Thick2 configuration 43 months of data (June 2014–2017).
2.2. Data Collection
Precipitation measurements were measured with a precipitation gauge mounted on the roof at each location at 1-min registration intervals. Precipitation gauges in TRD, BER and SAN were calibrated annually. Precipitation measurement were corrected for measured calibration errors, precipitation intensity according to the manufacturer’s procedure [50], wetting and evaporation and undercatch due to wind effects around the gauge according to the procedure given by Førland, et al. [51]. For the Oslo location, no wind correction was carried out due to a lack of onsite wind observations. Runoff from the green roofs was collected in separate spherical or rectangular tanks for each plot where the depth was measured with a pressure transducer at 1-min resolution (5 min for Oslo). Air temperature and relative humidity (not for OSL) were measured at 15-min resolution on site. Wind speed was measured on site, as a 10-min average every hour, for a limited period in TRD (410 days), BER (120 days) and SAN (140 days). Site measurements were correlated to observations at the nearest meteorological station and used to calculate wind speed for the remaining period (TRD R2 = 0.53, BER R2 = 0.47, SAN R2 = 0.52). No wind data were available for OSL. The roof in TRD was the most wind exposed. The manually-measured precipitation distribution on the roof showed that Plot 1 (Basic2) experienced significantly less precipitation than the other plots and the precipitation gauge [52]. Precipitation measurements were therefore corrected with a factor of 0.92 for this plot only. Details on roof and collection tank sizes, together with instrument types, ranges and accuracy are given in Table 4.
Vegetation cover registrations were carried out for TRD, BER and SAN in August 2016 and July 2017 and for OSL in August 2016. Registrations were carried out inside a 1 m2 frame divided into 100 subdivisions of 10 × 10 cm, where the percentage of cover of different sedum species, mosses, weeds (other vegetation) and bare substrate was recorded. Registrations were carried out at one level only, as there was little vegetation under the tall sedum species. Two replicates (3 for TRD) were investigated per plot.
Missing meteorological data (precipitation, temperature, relative humidity and wind) were replaced with data from the nearest available meteorological station. Missing runoff data were replaced with zero in periods with no precipitation or excluded from the dataset.
2.3. Data Processing
Time series with 1-min resolution (5 min for Oslo) were created from observed data. Runoff was calculated from changes in tank depth and the ratio between roof area and tank area. Ratios for TRD were 93.6 before 15 October 2015 and 86.4 after this date. Ratios for the whole experimental period were for BER 28.5 for SAN 33.5 and for OSL 33.0. For periods where tanks were emptied by pumping, runoff data were found by interpolation. Remaining data were interpolated from hourly observations (wind speed) and 15-min observations (air temperature and RH) to time series resolution.
Events were defined by a minimum dry period of 6 h. At first, separate events for precipitation (P) and runoff (R) were found. Only events with a sum P or R larger than 0.2 mm were included. Start was defined as the first observed time step with P or R; the time and value for the maximum 5-min intensity for the event were found; and the stop event was defined as when the sum P or R during the next 6 h was less than 0.2 mm. Secondly, P- and R-events were put together. An R-event was connected to the previous P-event event if it started before the next P-event started. If a new P-event started before the added R-event stopped, this was also added to the event. Thirdly, the events observed at parallel test plots at the same locations were made comparable by combining events such that the precipitation in each event at all plots was the same. For each event, the following metrics were used in the processing of the data:
- Absolute retention from sum precipitation minus sum runoff
- Fraction of precipitation retained
- 5-min peak intensity precipitation
- Peak reduction from 5-min peak intensity precipitation to 5-min peak intensity runoff
- Number of precipitation events combined to create each combined event.
Data were divided into the cold and temperate season. The cold season was defined as months where precipitation could fall as snow and accumulate on the roof and melt at a later time and included data from November–April. The rest of the months were defined as the temperate season (May–October). All year data were used for calculating accumulated retention, while only temperate season data were included in the event evaluations to avoid including snow accumulation and melt.
Overall retention performance was evaluated based on accumulated retention. Event-based retention for different configurations at the same location were compared. To avoid small precipitation events, where all configurations are expected to perform quite similar, from dominating the data, only events with sum precipitation higher than 5 mm were included. Average available retention capacities were estimated for all temperate season events giving runoff, since only these events utilize the total available storage capacity. The frequent precipitation pattern led to parts of the events being a combination of many precipitation events with durations up to one week. To avoid evapotranspiration to appear within each event, only runoff events based on one precipitation event were included in this analysis. Median, 25 and 75% quartile (Q1 and Q3) retention capacities were extracted to represent retention capacity for a random event, while the 95% percentiles were extracted as a measure for maximum observed retention capacities. Detention performance was estimated for all temperate season events giving runoff and with sum precipitation higher than 5 mm, and only runoff events based on one precipitation event. Comparisons were done statistically between different configurations at the same location. Statistical comparisons between different configurations at the same location were done with the Friedman test, a nonparametric alternative to one-way ANOVA, with a significance level of 0.05 and Bonferroni comparisons. Statistical comparisons between different locations were done with the nonparametric Kruskal–Wallis test, a significance level of 0.05 and Bonferroni comparisons.
Frequency information derived from the temperate season data in the complete observed time series was plotted as flow duration curves (FDC), showing the relationship between the magnitude and frequency of precipitation and runoff flows [47,48]. The performance difference between the FDCs for precipitation and the reference black roof was evaluated by calculating the average error defined by the difference between the reference black roof runoff curve and the precipitation curve and averaging for all time steps with precipitation or runoff.
2.4. Laboratory Analysis
Substrate water holding capacity was analyzed by the porous plate apparatus method [53] and defined as the available water between the field capacity (FC), water retained at 10 kPa suction, and the wilting point (WP), water retained at 1500 kPa suction. Four replicates were analyzed of the two extra substrates applied under the vegetation mats in configurations Thick1 and Thick2.
Maximum water holding capacities (MWC) were analyzed according to the methods presented in the German Green Roofing Guideline [11]. Materials were saturated for 24 h and then drained for 2 h, and a comparison was made to dry material. Three replicates were analyzed for the two extra substrates applied under the vegetation mats in configuration Thick1 and Thick2 in addition to the substrate mat and all applied water retention fabrics.
3. Results and Discussion
The green roof hydrological performance is presented and discussed in terms of retention and detention. Retention is evaluated both in terms of an accumulated and an event-based approach. Detention is first evaluated based on an event definition before the challenges with this approach are discussed and an alternative evaluation method, flow duration curves (FDC), is applied. All results, except the accumulated retention, are presented for temperate season data only to avoid the interference of snow accumulation and melt. The section starts with a presentation of temperate season climates in the studied locations as background information for the presented results.
3.1. Climate at the Studied Locations
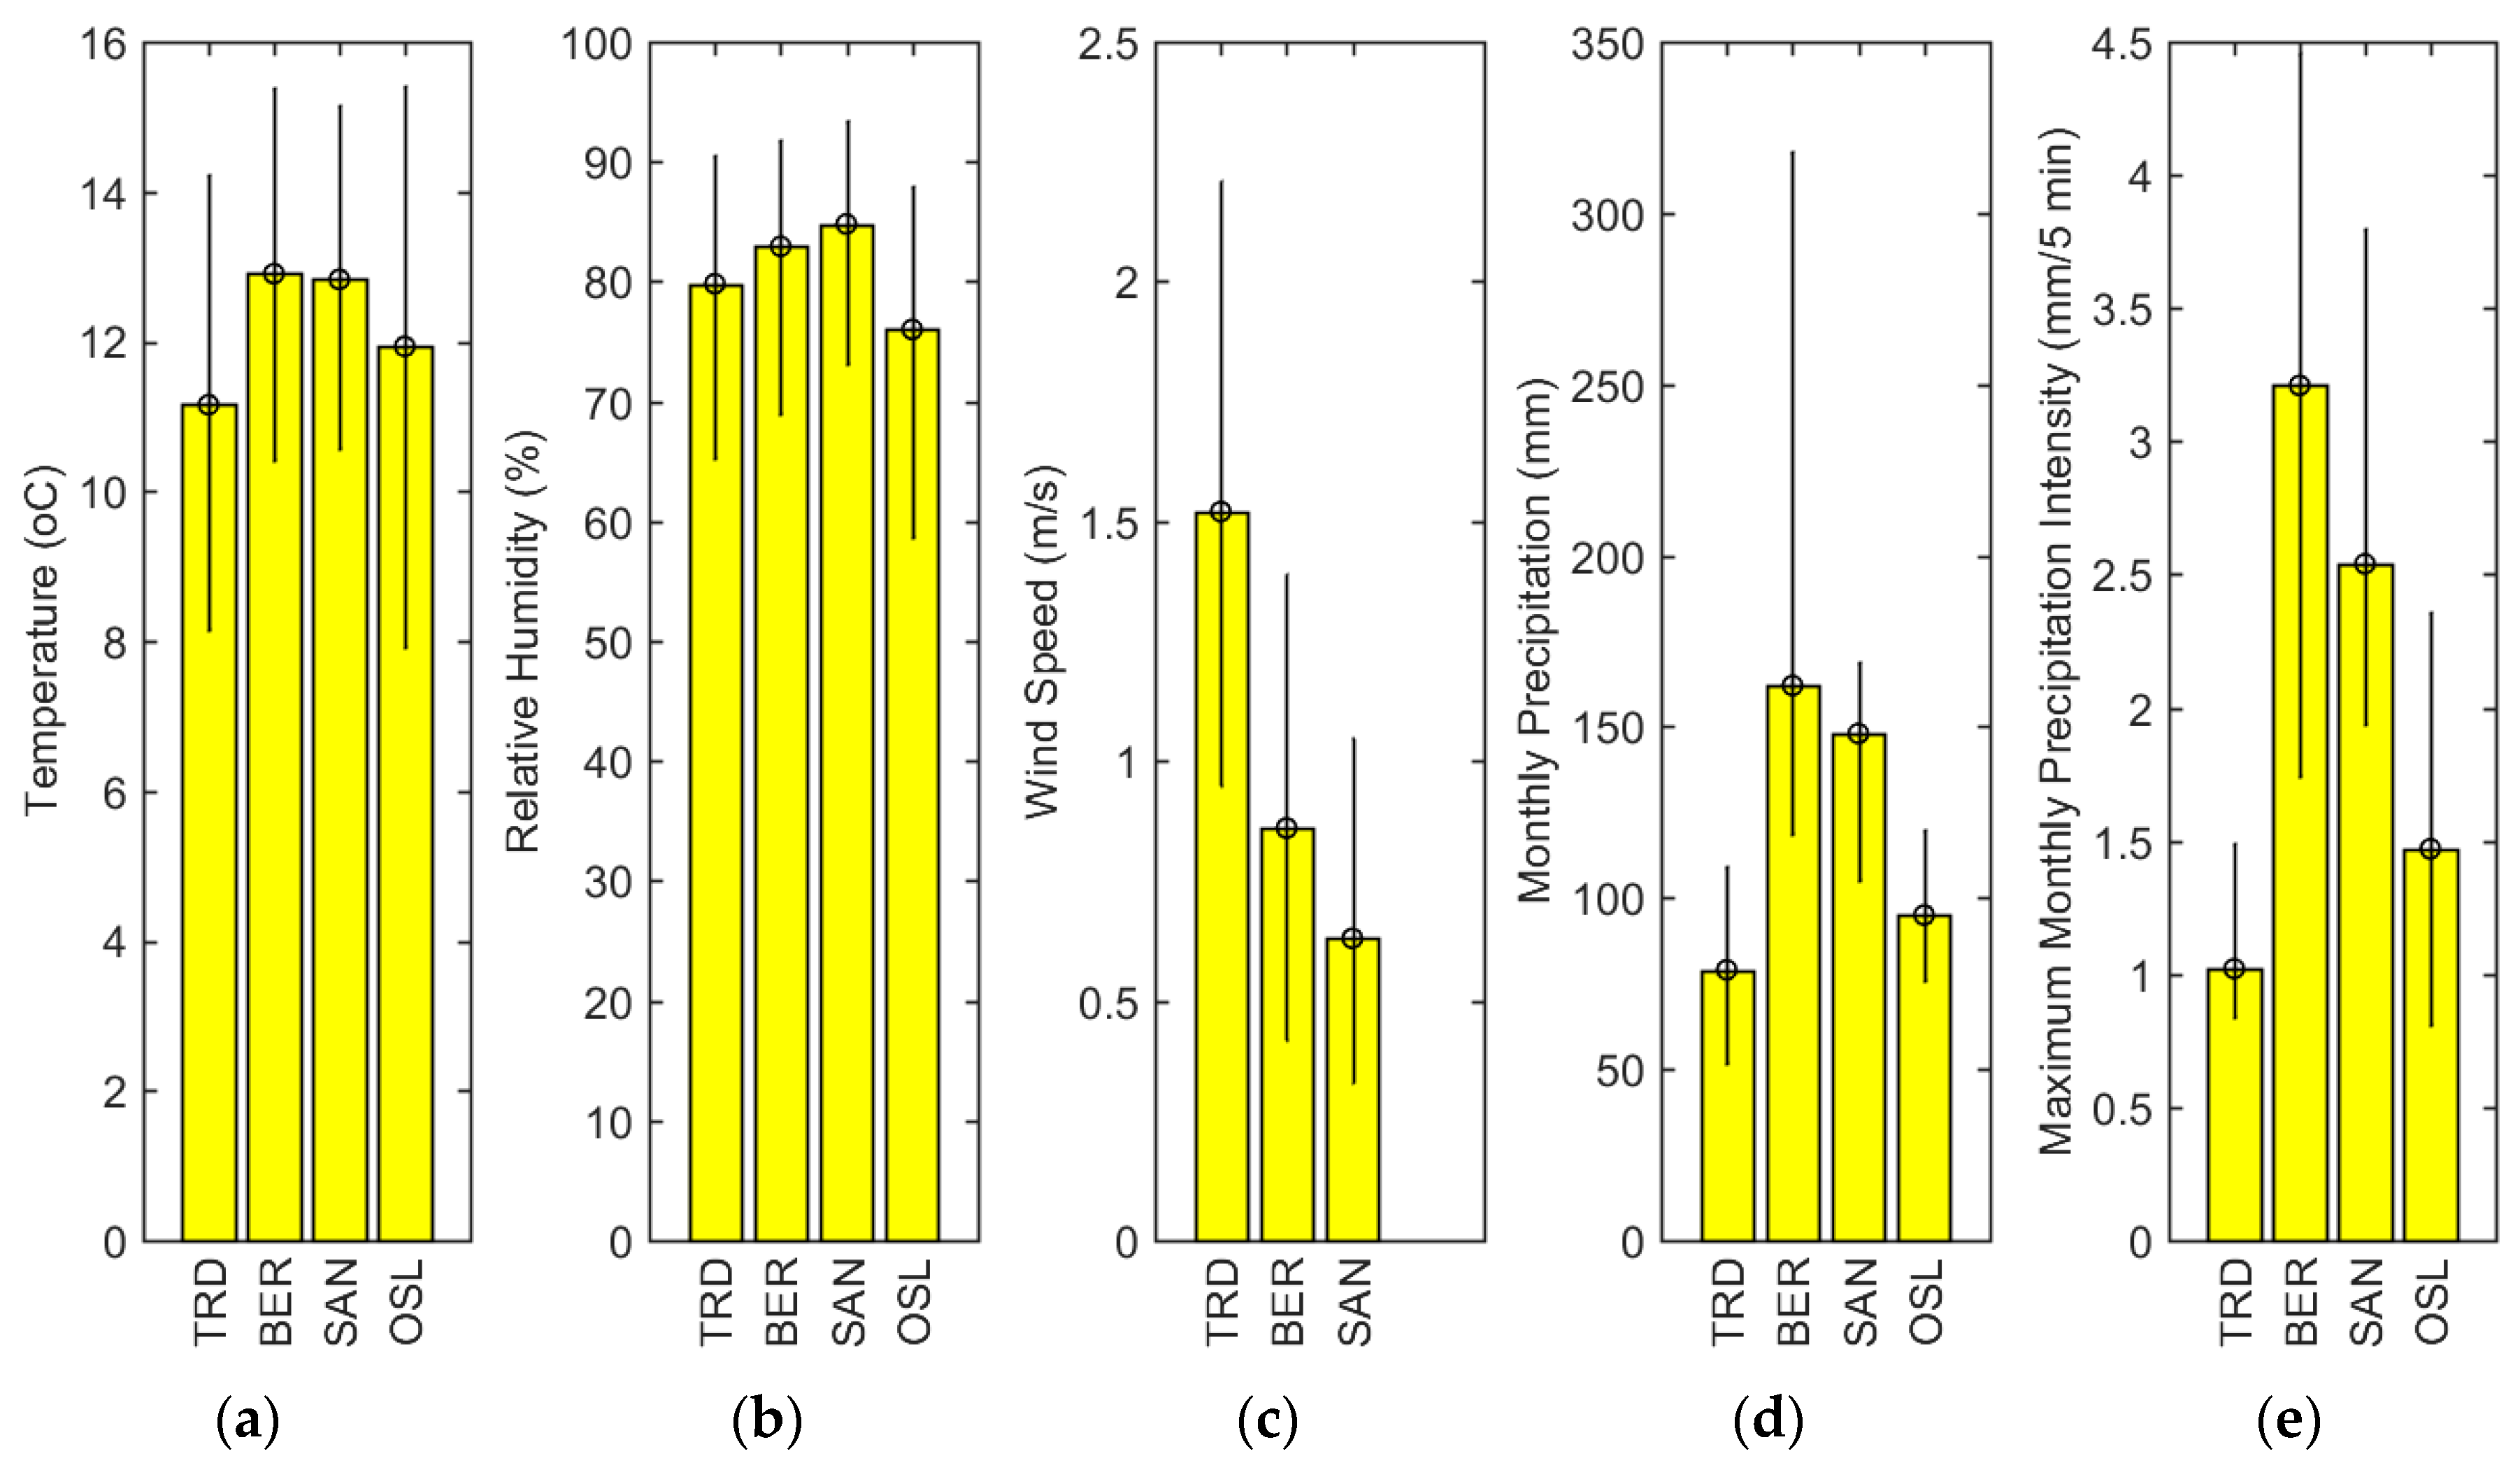
The temperate season climate for the years 2015–2017 in the four locations is presented as median (Q1 and Q3) values in Figure 2. There were large variations in precipitation amounts with the highest precipitation in BER (162 mm/month) followed by SAN (148 mm/month), OSL (95 mm/month) and the lowest values for TRD (79 mm/month). There were large variations in monthly maximum precipitation intensity with more than three-times as high median intensity observed in BER (3.2 mm/5 min) as in TRD (1.0 mm/5 min), while SAN (2.5 mm/5 min) had higher median intensities than OSL (1.5 mm/5 min). However, the highest observed intensity was in OSL with 7.1 mm/5 min compared to 6.7 in BER, 4.3 in SAN and 3.7 in TRD. Temperate season temperatures were highest in BER and SAN, but this parameter showed less variation between the locations. Relative air humidity was observed to be highest in SAN followed by BER and lowest in OSL. There was large variation in observed median wind speed at the roofs with the most wind in TRD (1.5 m/s) and less in BER (0.9 m/s) and SAN (0.6 m/s). Unfortunately, no wind measurements were available for the OSL location, but wind exposure was assumed to be low based on roof location and observations.
There observed climatic variations between the locations were quite large and were expected both to influence retention and detention performance. Retention would particularly be influenced by the AET that removed stored water between the events, and which increased with increasing wind exposure, temperature and sun exposure and decreased with increasing air humidity. Detention, on the other hand, was expected to be more dependent on precipitation amounts and intensities.
3.2. Retention
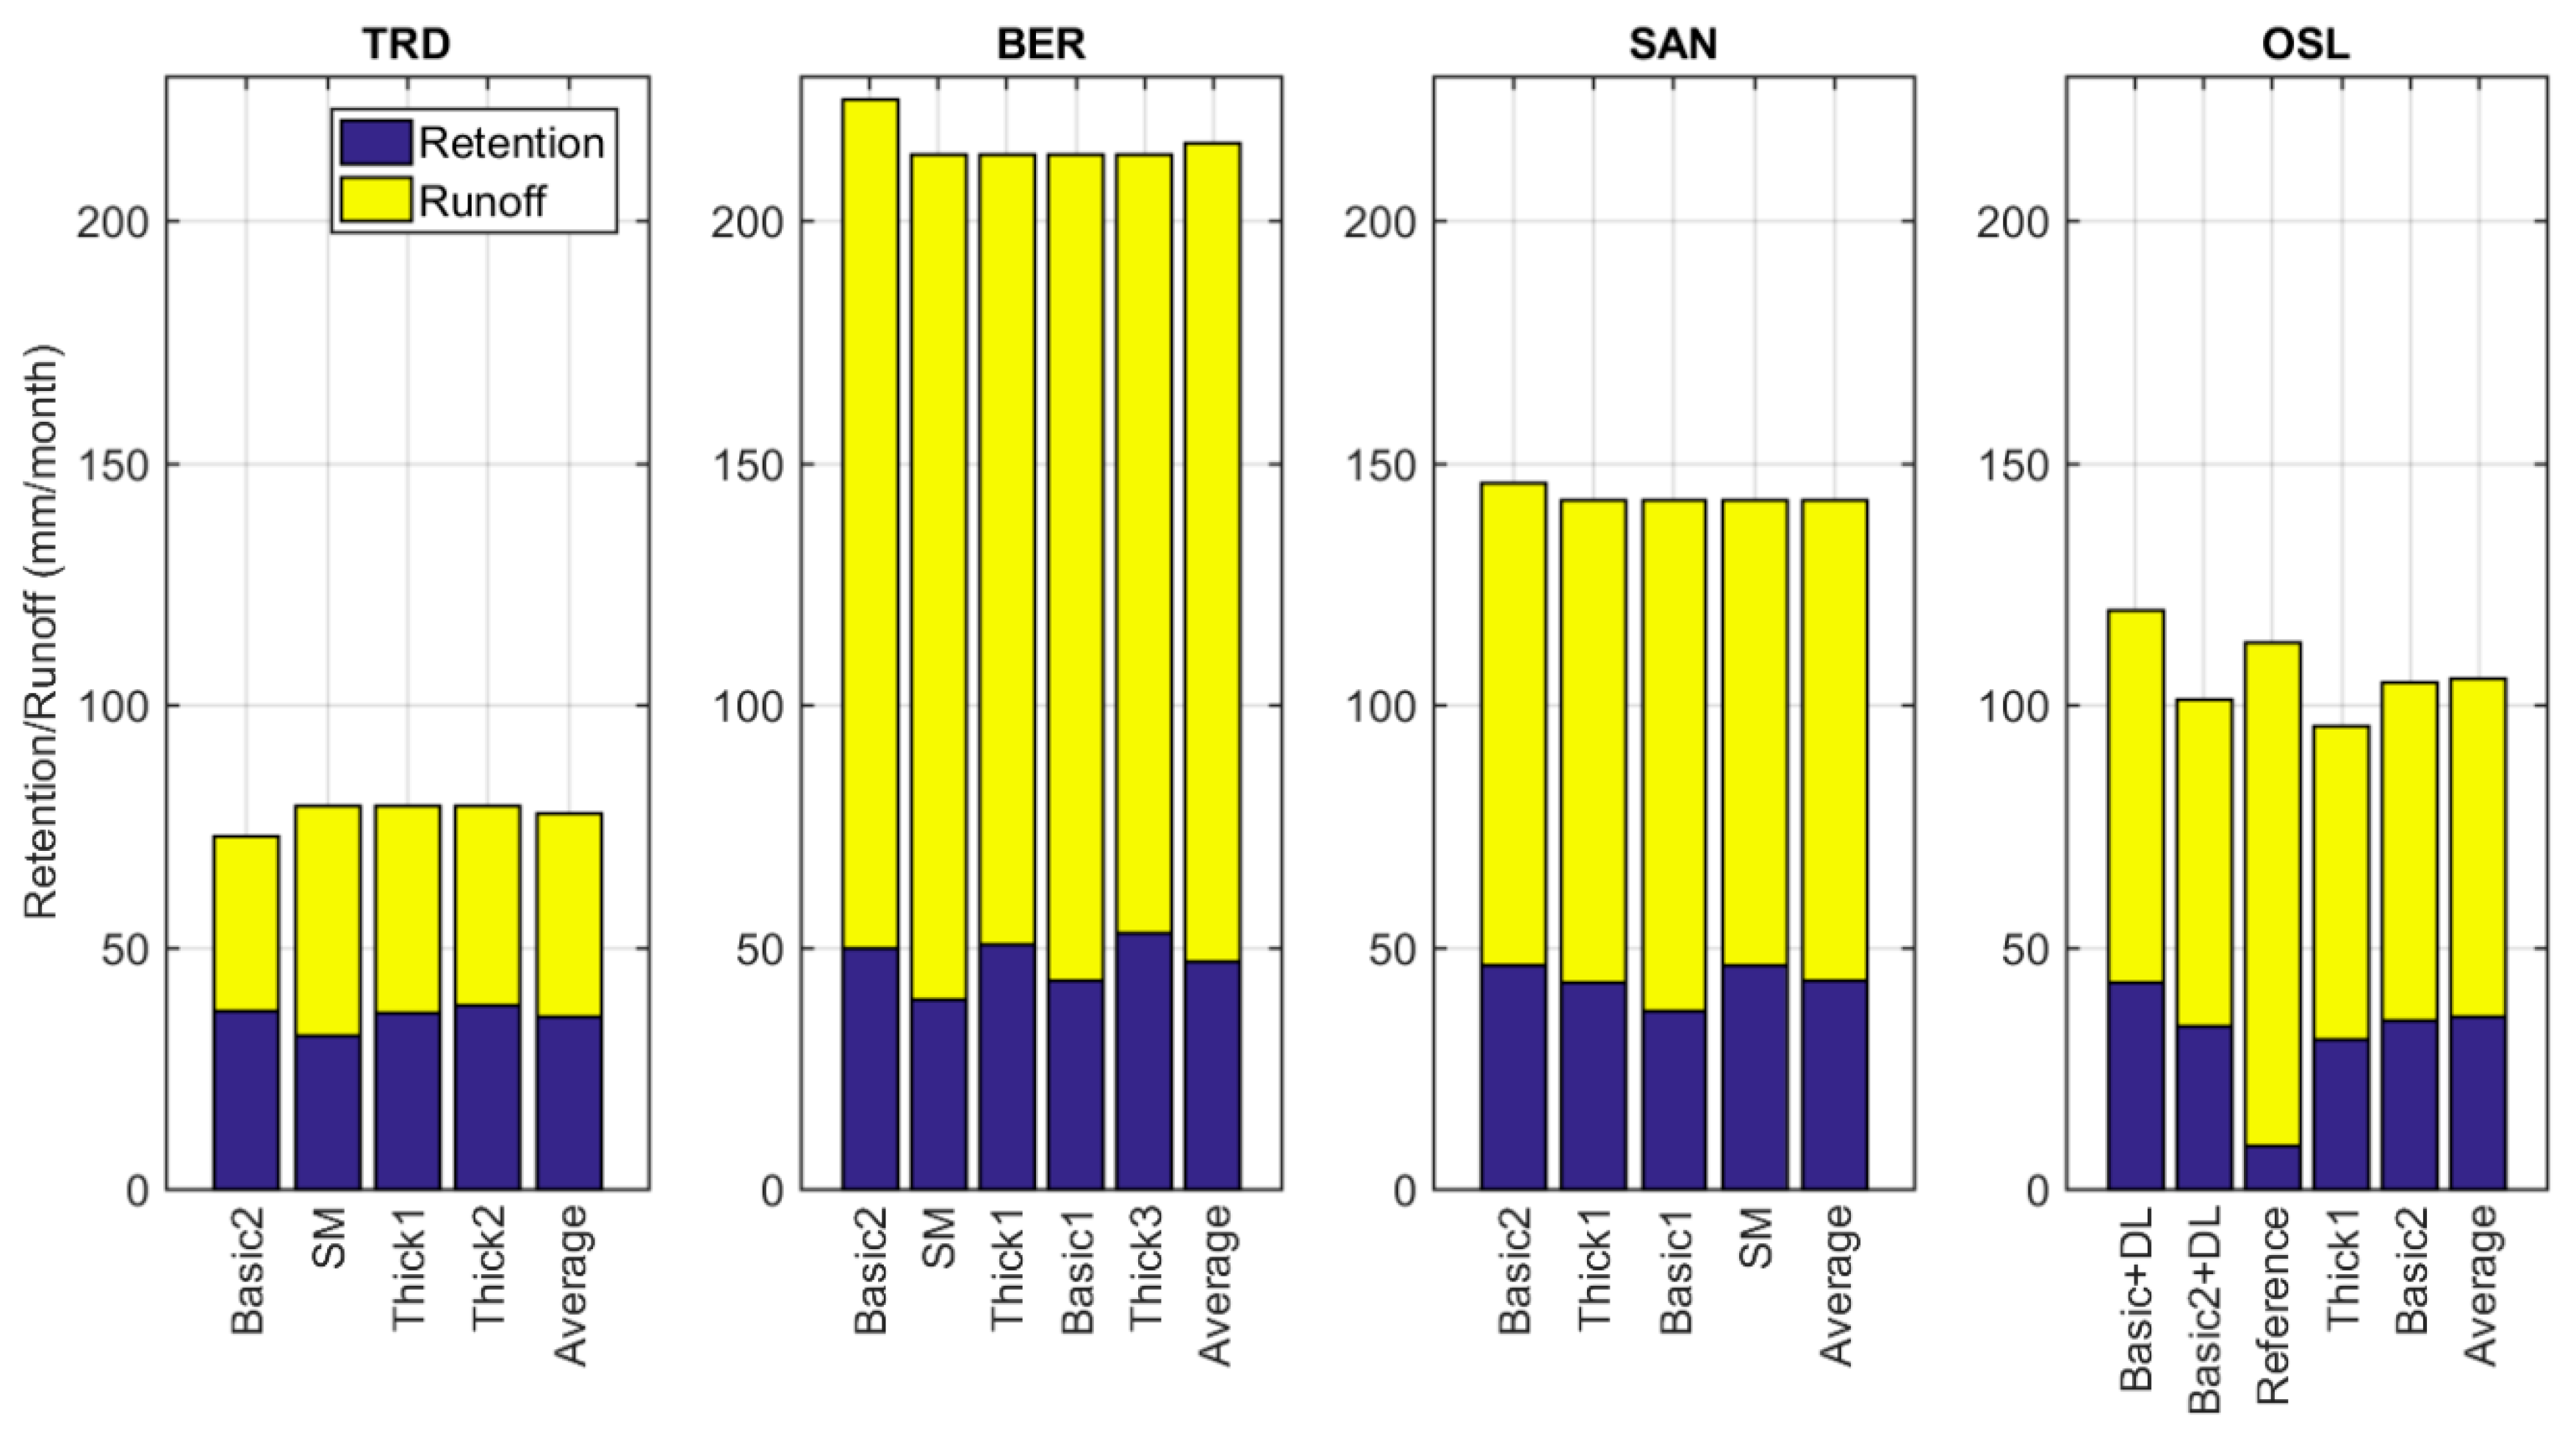
Accumulated retention showed a large variation in the fraction of precipitation retained at the different locations (Table 5), while the average temperate season absolute retentions were in the range 36–47 mm/month and did not vary that much between the locations. (Figure 3). The highest observed absolute retention was found in BER (average of 47 mm/month in temperate season), but due to the high precipitation amounts, this location showed the lowest fraction retained (average of 22% in temperate season). TRD on the contrary showed the highest fraction retained (average of 46% in temperate season) and poorest with respect to absolute retention together with OSL (average of 36 mm/month in temperate season). Observed retention differences between the locations were most likely explained by variations in precipitation amounts, precipitation pattern and AET [38], but also local conditions like roof configuration and vegetation development might have influenced the results. AET in green roofs was found to increase with increasing soil moisture [54]. Higher precipitation in BER would lead to a generally higher soil moisture content, which would increase the observed AET and could be part of the explanation for higher absolute retention in BER. Absolute retention was lowest in TRD and OSL. Generally, OSL has a warmer climate and more temperate season precipitation than TRD, and in general terms, one would expect green roof retention (and AET) to be higher in OSL. The reason that this was not observed was most likely due to local climate conditions at the green roof sites. The green roof in TRD was highly wind and sun exposed, while the roof in OSL was located at a quite high altitude, facing north, partly shaded from the sun and was expected to have little wind exposure. The results from the OSL roof can therefore be expected to represent the “worst case” for this part of the country. There was also higher uncertainty connected to the precipitation observation in OSL since no annual calibration or wind correction of measured precipitation were carried out.
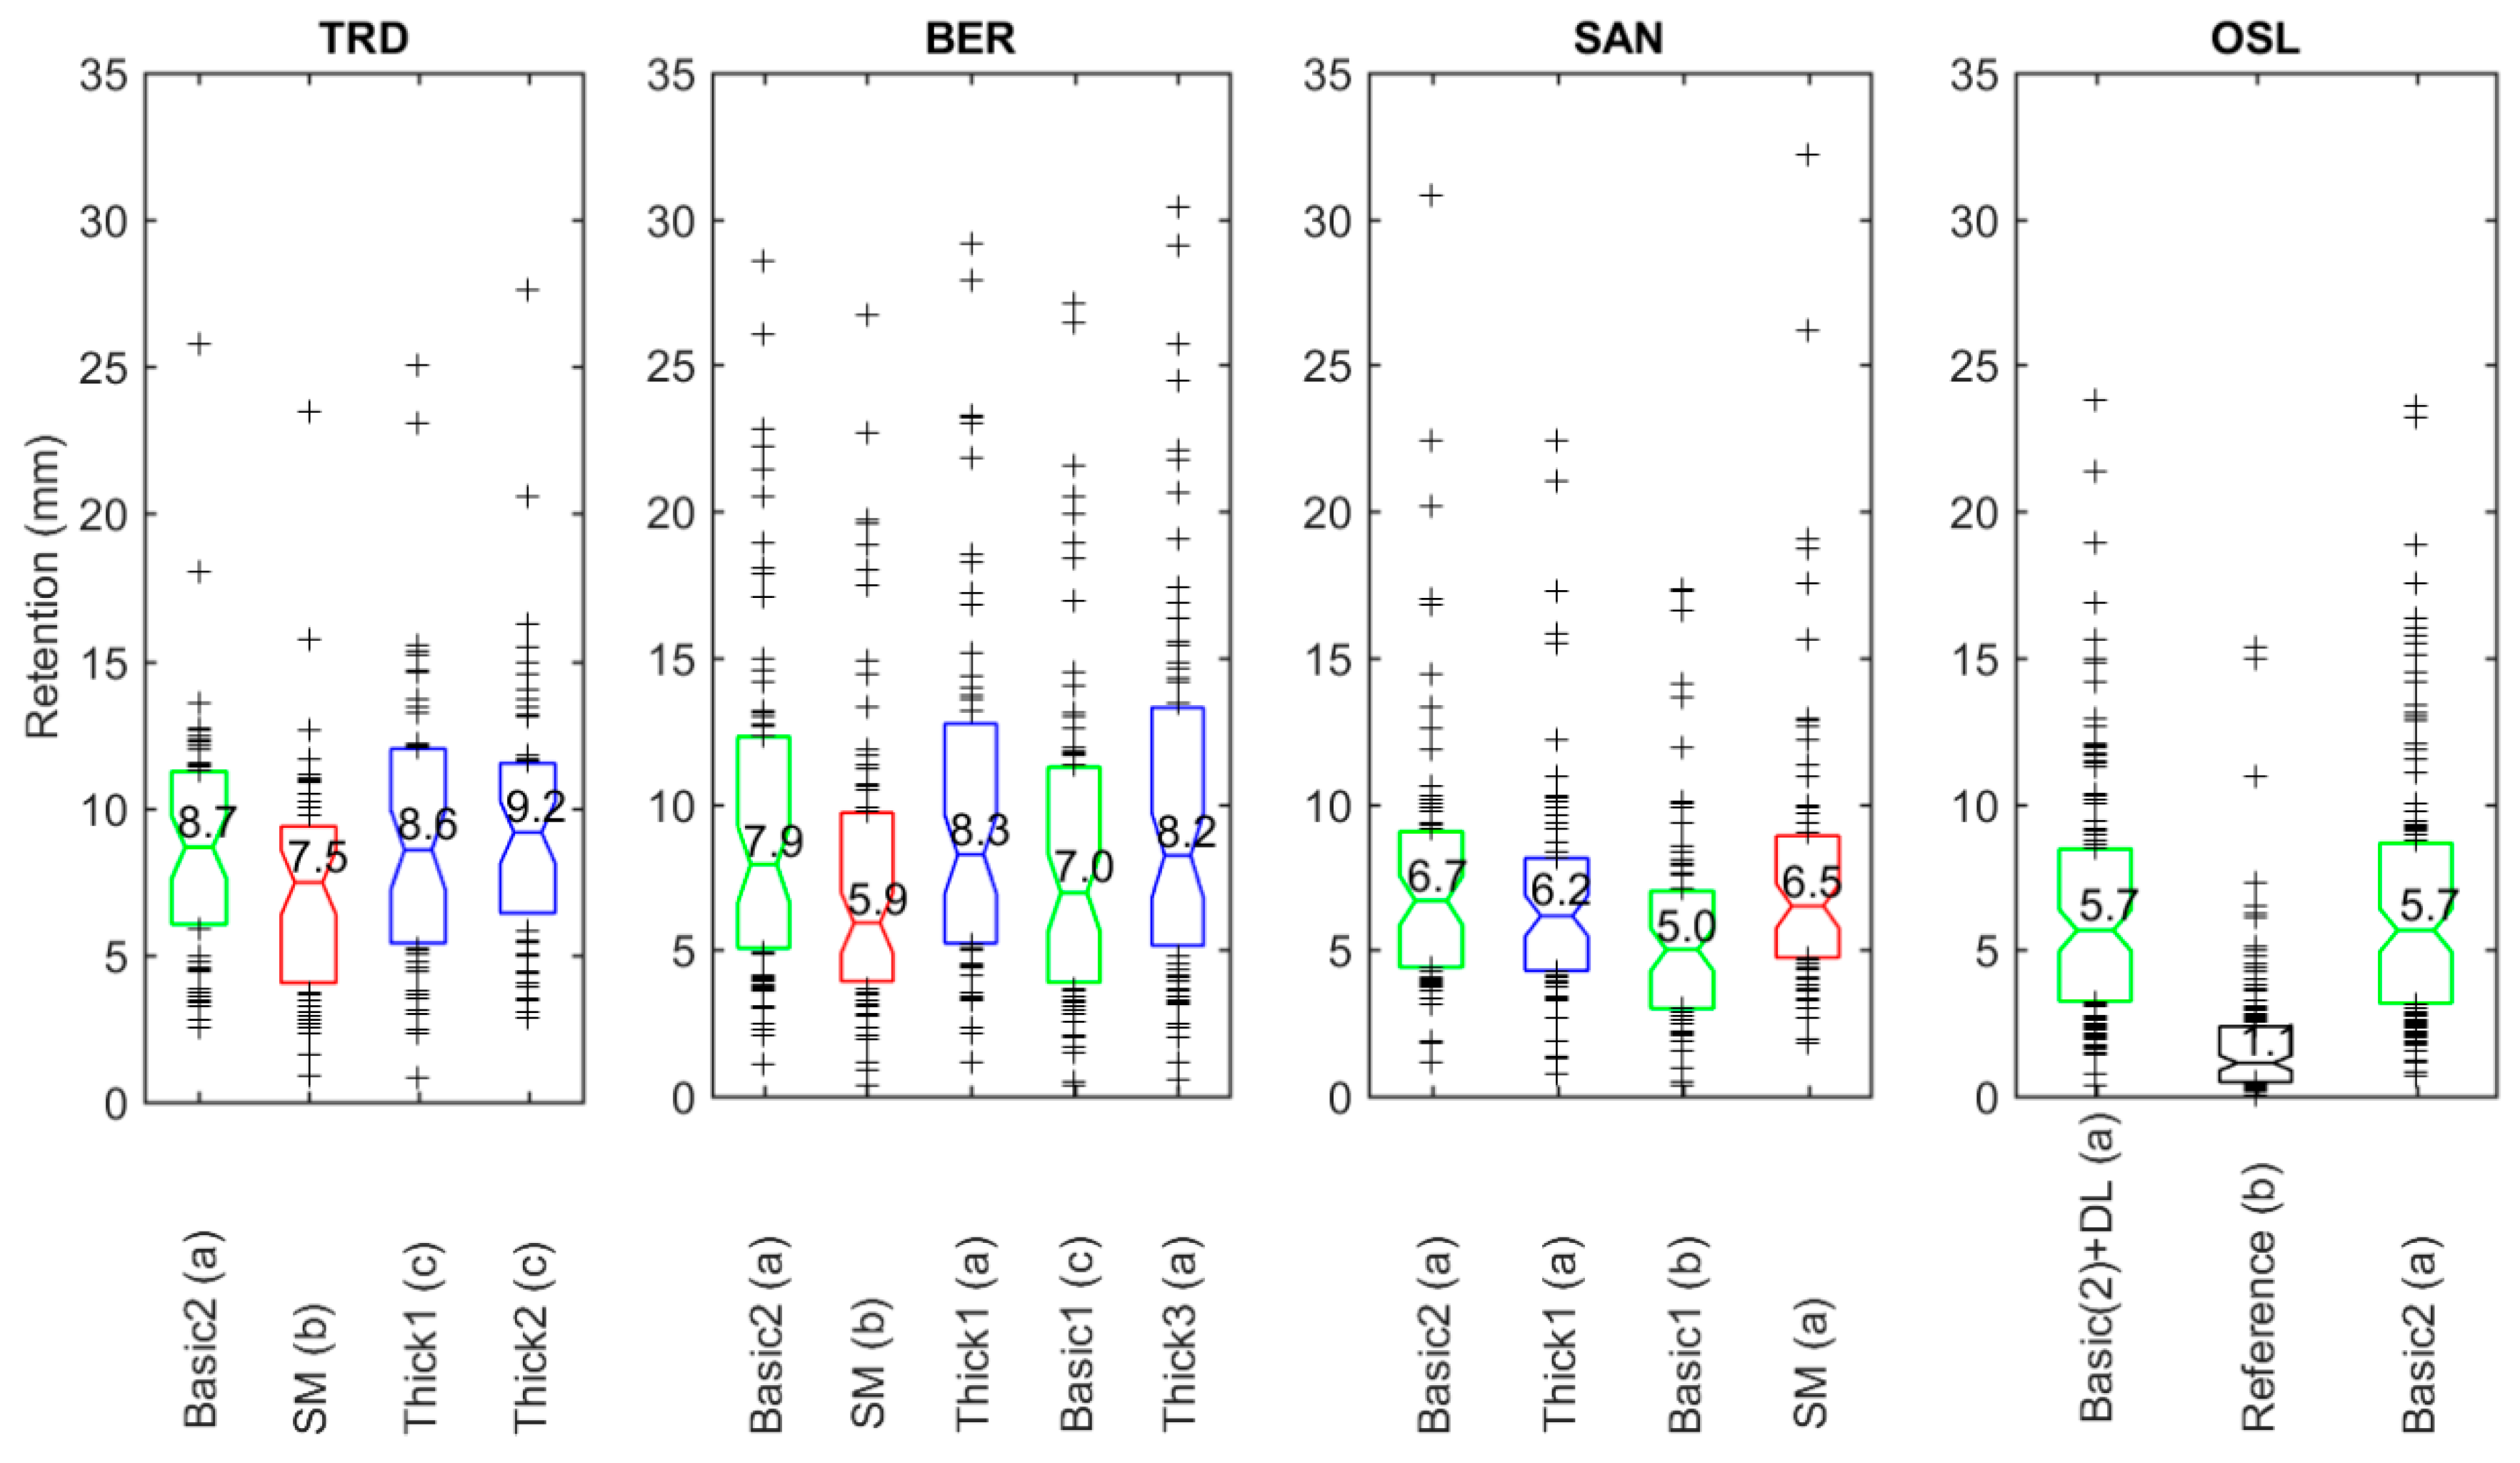
Generally, small differences were observed in event-based retention between the tested configurations at each location (Figure 4) although the different configurations varied greatly in estimated total storage capacity (Table 3). AET rates and available time was the main driving force when it came to regeneration of storage capacity between precipitation events. This could lead to only a fraction of the storage capacity being activated under normal conditions. If that were the case, this explains the comparable observed retention performances even though the estimated total storage capacity varied from 9–36 mm between the different configurations. This corresponds to the findings in Johannessen, et al. [38], where retention performance as a function of storage capacity in the same locations was modelled for a 30-year period.
Green roofs with substrate mats (SM) showed significantly lower retention in TRD and BER than the other configurations, while in SAN, the performance was comparable to the best configuration (Figure 4). The substrate mat has a great potential to store water (Table 3), but the poor performance in two out of three locations might indicate that the stored water was not as available for plants and evaporation as the water stored in the other configurations. The difference was largest in TRD where the poor performance might be partly explained by a lower vegetation cover (Table A1, Table A2, Table A3 and Table A4 in Appendix A), as this was the only configuration with a vegetation cover as low as 64% (compared to >90% for all other configuration), leading to less plant water use. The following discussion focuses on the more traditional configurations based on green roof substrates, drainage layers and textile retention mats.
The thinnest basic configuration (Basic1) with the lowest (9 mm) estimated storage capacity showed lower accumulated retention (Table 5) and significantly lower event-based retention than the thicker configurations (Figure 4) at the same location. The basic configurations with slightly higher (13 mm) estimated storage capacities, Basic2, showed comparable event-based retention to the standard thick solutions (Thick1) with higher (19–24 mm) estimated storage capacities in BER and SAN. For TRD, the best accumulated performance was found for the Basic2 configuration, while the Thick1 and Thick2 configurations performed slightly, but statistically-significantly better for event-based retention. However, the observed differences between these plots have a higher degree of inaccuracy due to the wind effect on precipitation observed at Basic2, which might not have been properly accounted for in the data processing. For OSL, no significant improvement in event-based retention was found by adding a drainage layer with storage capacity to the basic solution.
The results indicate that for green roofs in Nordic, relatively cold and wet climates, retention performance was improved when increasing the estimated storage capacities from 9 (Basic1) to 13 mm (Basic2). No significant increase in event-based retention was found by increasing thickness and storage capacities further. This shows that retention was more dependent on the inter-event regenerating AET process than available storage capacity, as long as the storage capacity was above a minimum value. For other aspects concerning green roof performance, such as plant performance and stormwater detention, thickness, material properties and storage capacity are expected to play a more important role.
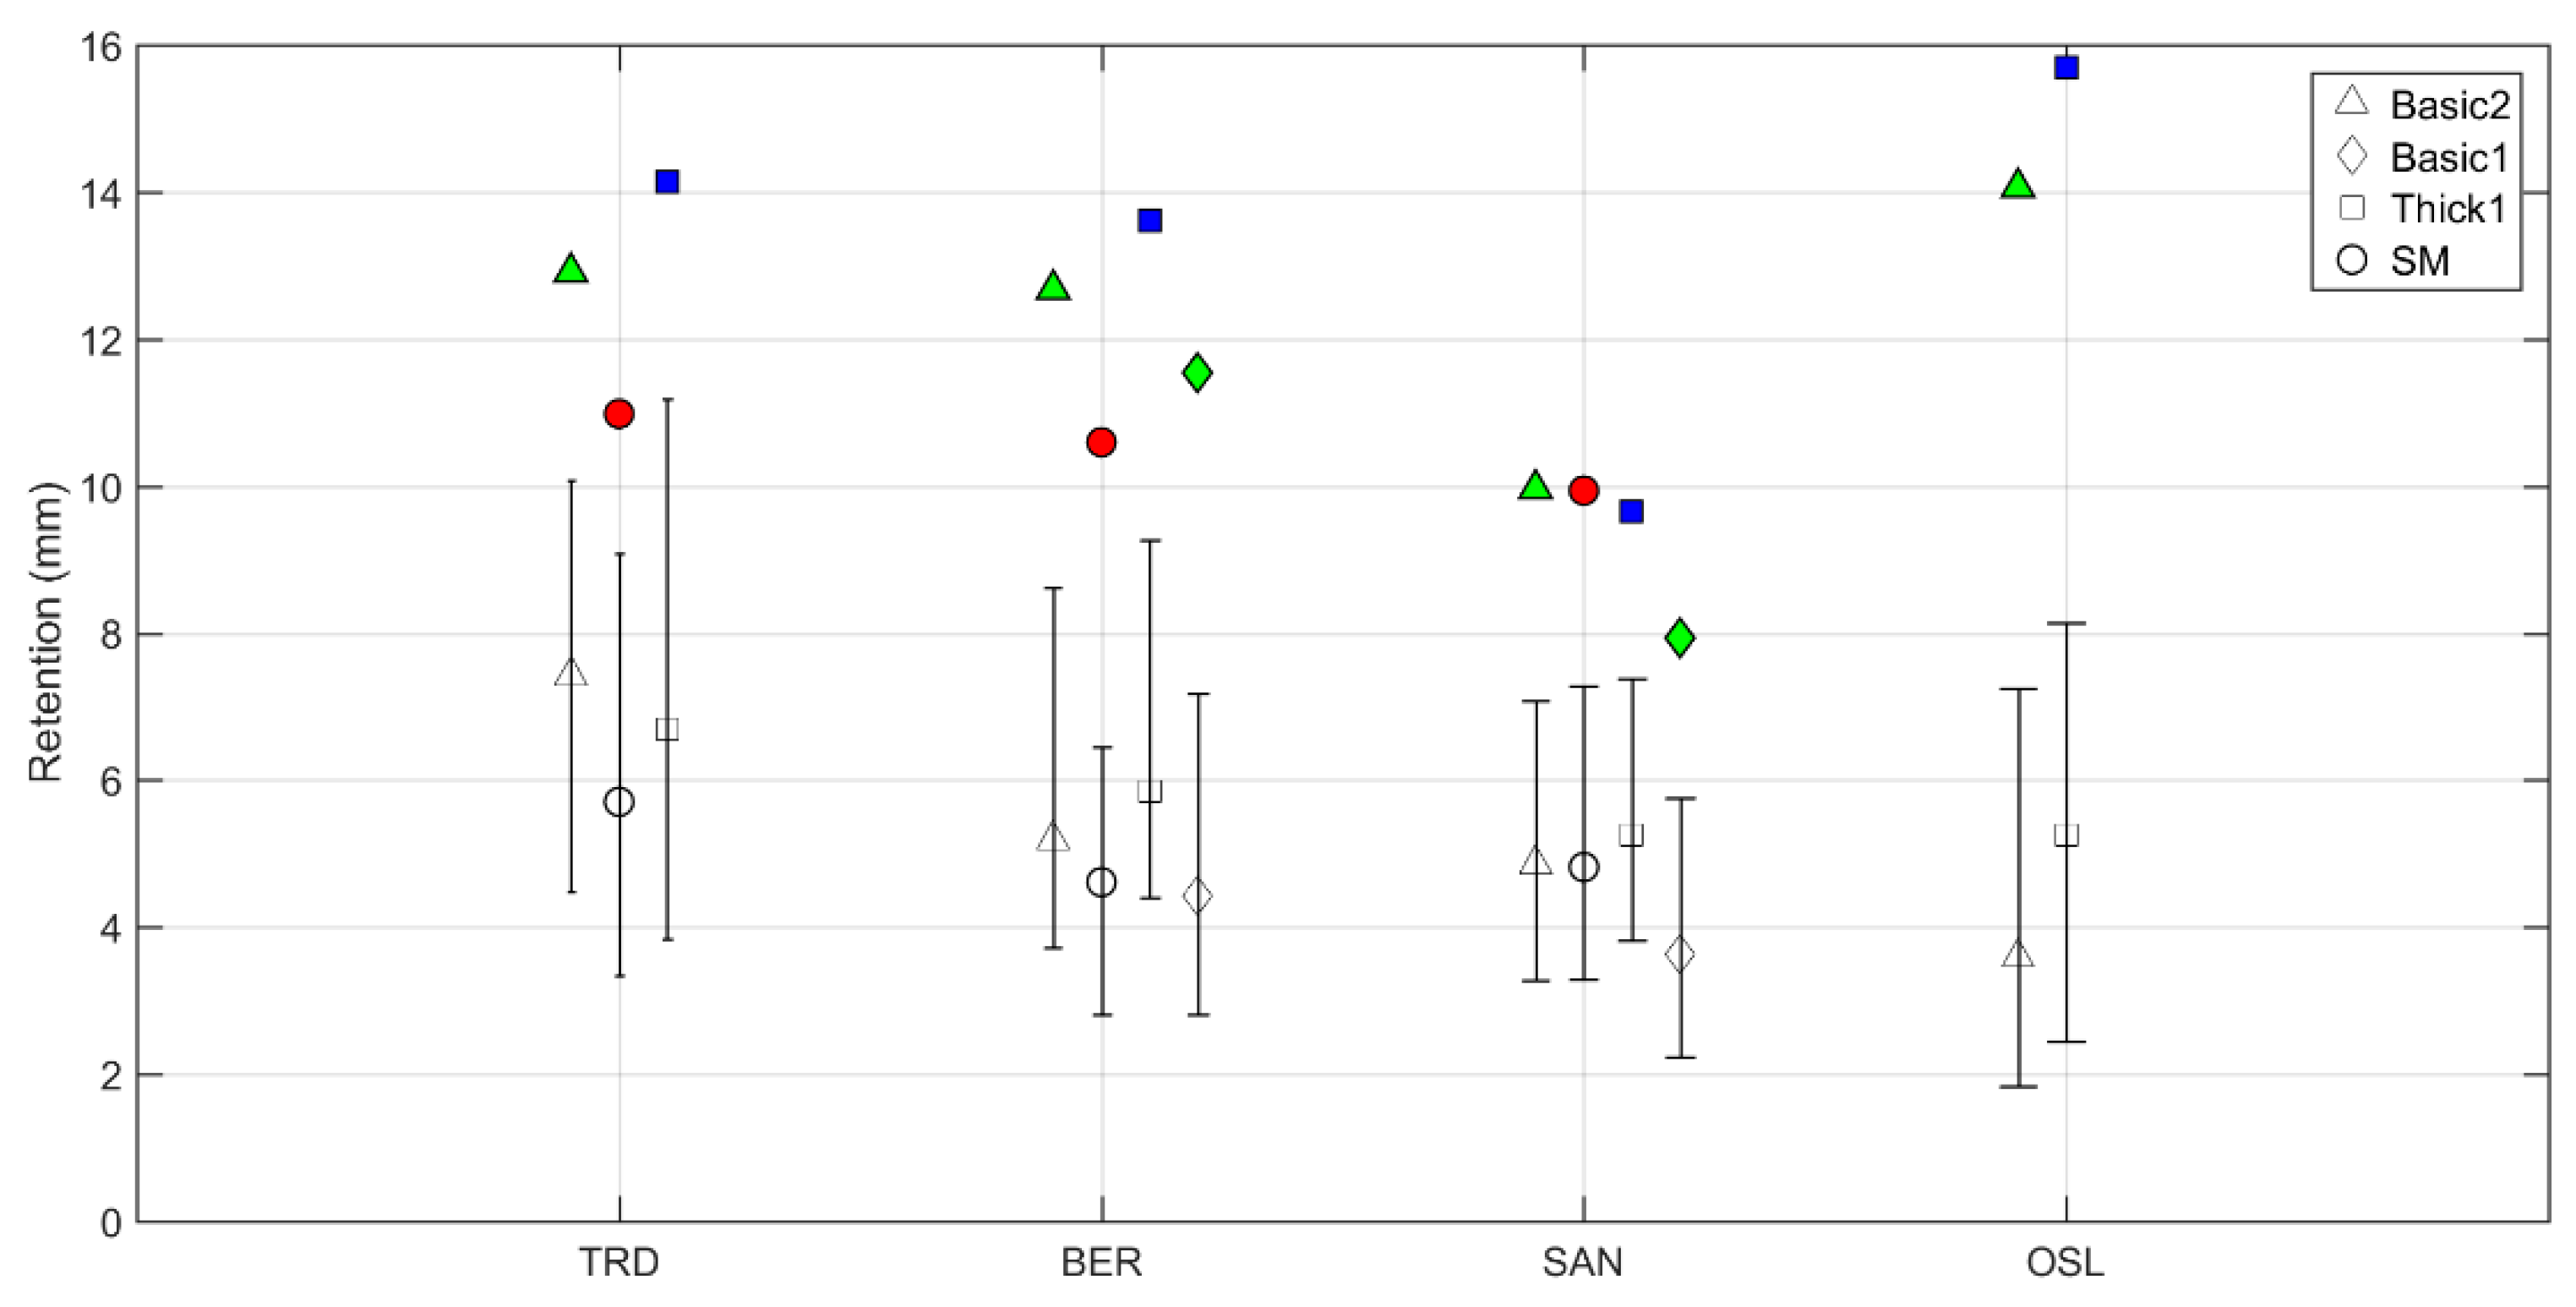
The retention performance of a green roof at any random precipitation event is interesting from a design perspective, as an engineer would like to know how much of the incoming precipitation is most likely to never run off the green roof. There is the reason to believe that this will deviate largely from the estimated storage capacities of the applied materials, which are commonly misinterpreted as the actual retention capacity of a green roof [9]. This was investigated by studying the median (Q1 and Q3) observed retention for all temperate season events with runoff (open markers in Figure 5). Figure 5 show lower retention estimates than Figure 4, due to the fact that Figure 5 only includes shorter duration events where evapotranspiration was less likely to take place during the event. The results indicates that if a roof configuration like Thick1 were built, with an estimated storage capacity of 19–24 mm, one could only expect 5.2 mm in OSL, 5.3 mm in SAN, 5.8 mm in BER and 6.7 mm in TRD to be available for retention at the median precipitation event. Likewise, a Basic1 solution, with an estimated storage capacity of 9 mm, could give 3.6 mm in SAN and 4.4 mm in BER available for retention, and a Basic2 solution, with an estimates storage capacity of 13 mm, could give 3.6 mm in OSL, 4.9 mm in SAN and 5.2 mm in BER available for retention. The Basic2 solution performed surprisingly well for TRD with 7.4 mm and was probably overestimated as discussed earlier. The observations confirm the findings of Stovin, et al. [9] for four U.K. locations where retention depth rarely reached the maximum retention capacity. Median available retention capacities increased 1–1.2 mm by moving from the Basic1 to the Basic2 configuration and a further 0.4–1.6 mm by moving from the Basic2 to the Thick1 configuration (excluding TRD). The best effect of increasing the storage capacity was found in OSL. This could be explained by the nature of the precipitation where OSL experiences more showers with dry periods between due to the inland climate, while the other locations experience more days with precipitation [38].
Maximum observed retention capacities were found from the 95% percentiles of the observed retention (filled markers in Figure 5). This measure could be used to estimate the total storage capacities, but only if the data include events following antecedent dry periods that are sufficiently long enough, and with a high enough AET to use all stored available water (approach the wilting point). For the Thick1 solution maximum, observed retention capacities ranged from 13.5–15.5 mm for TRD, BER and OSL, while as low as 9.5 mm was observed for SAN. All values were considerably lower than the estimated storage capacities of 19–24 mm. This could indicate that the estimates were too high, but a more likely explanation is that the total available storage capacities were never activated due to the cold and wet climate in the studied locations. For the Basic2 solution, maximum observed retention capacities, 12.5–14.0 mm for TRD, BER and OSL, were close to the estimated storage capacities of 13 mm, indicating that available storage capacities were utilized during the experimental period of3three years and that drought episodes probably have taken place. This is also assumed to be the case for the even thinner Basic1 configuration. OSL showed the highest maximum retention capacity, which corresponds to the precipitation pattern as described above and which makes this location more vulnerable to drought. The lowest observed maximum retention capacities were found in SAN in general, probably due to relatively high precipitation amounts, less wind and higher humidity, resulting in lower AET.
3.3. Event Detention
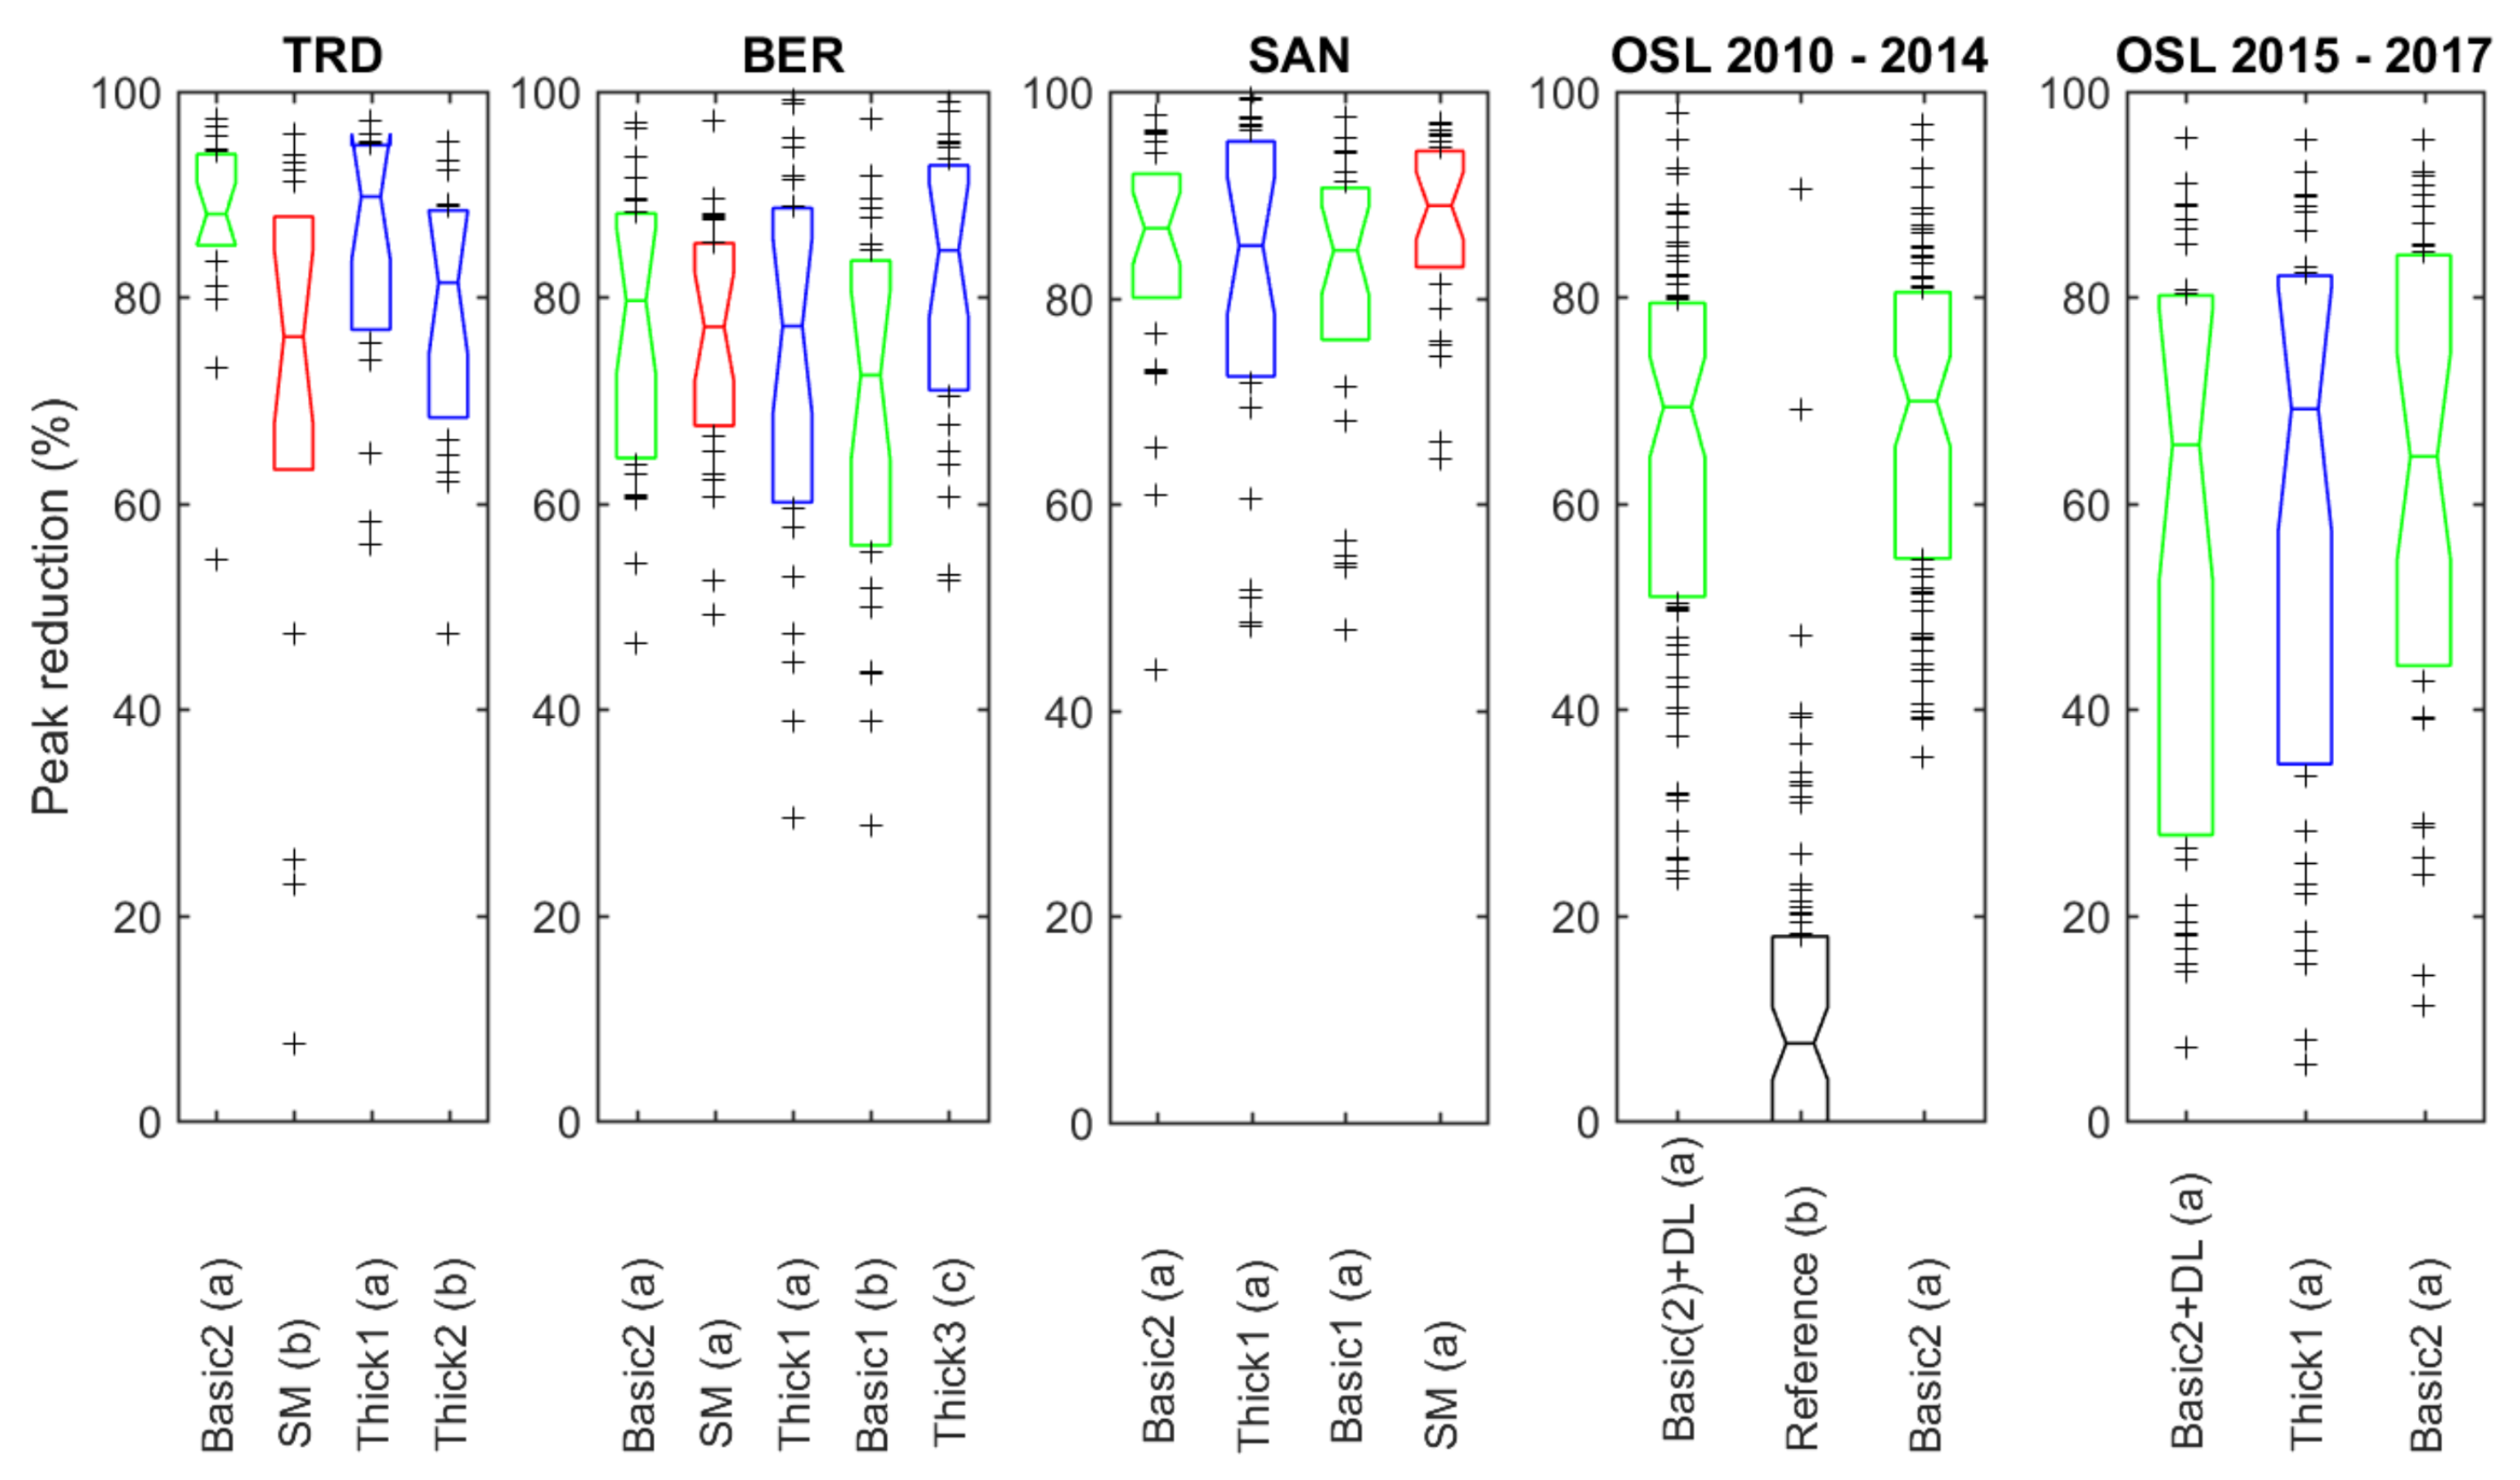
Event detention performances were investigated by calculating event statistics for different lag times and peak reductions. The studied climates typically experience frequent low intensity evenly distributed precipitation leading to long duration events with 75% of the events having a duration of 10 h or more. Typical events would have large inter-event variation in intensity, often with several peaks. This gave large variation in observed detention performance for a given configuration and location, and evaluation of lag times did not bring any meaningful results transferable to a design perspective. The following evaluation of event detention performance is based on studying peak reductions. A comparison between 5-min peak intensity for precipitation and runoff showed that median peak reductions ranged from 65–90% with the lowest reductions in OSL and highest in TRD and SAN (Figure 6).
OSL had the smallest plots with shortest transport length, which might have led to lower peak reduction [15,21]. However OSL also had the lowest slope, which could have decreased the runoff peaks [15,23,25], and there was not an obvious answer to why OSL performed the poorest. Poorer performance in BER could be explained by both the highest intensity precipitation experienced (Figure 2) and the shorter transport length compared to TRD and SAN. SAN had the highest slope of the tested locations, but it was not possible to see if this influenced the detention performance due to the large variation in precipitation events both at each location and between the locations.
The comparison between the reference black roof and green roof configuration in OSL showed statistically-significantly higher peak reductions for the green roofs compared to the reference. Even this small-scale green roof with a runoff length of 4 m gave median peak attenuation of 70% compared to 8% for the reference black roof.
The use of a textile retention fabric as the bottommost layer can be a tool to increase friction to reduce the horizontal water transport speed and improve detention performance [15]. A comparison between the Thick1 and Thick2 configuration in TRD showed a statistically-significantly lower peak reduction for the Thick2 configuration. The Thick2 configuration had a perforated drainage board placed directly on the roof membrane, while the Thick1 solution had the drainage board placed on a textile retention fabric. No significant differences in retention performance that could affect the detention performance based on available storage were found between these two configurations. Another comparison between a textile retention fabric (Basic2) and a drainage board (Basic2 + DL) as the bottommost layer was carried out in OSL, but in this case, no statistically-significant differences were found in peak reductions.
The effect of a thicker substrate on detention was investigated by comparing the Basic2 to the Thick1 configuration. Both solutions have a textile retention mat at the bottom, while the Thick1 configuration had added a thicker substrate and a drainage board over the textile retention mat. Results showed no significant differences in peak reductions, indicating that the horizontal transport was more important than the vertical for the detention process in the studied configurations and locations. If preferential flow occurred in the green roof substrates, as indicated in the case by Liu and Fassman-Beck [13] and De-Ville, et al. [14], this could explain that no difference was found in peak reductions even with increased thickness of the substrate.
The SM configuration showed significantly lower peak reductions in TRD, but the same differences were not observed at the other locations. This might be due to the retention performance, which also was also poorer for the SM configuration in TRD.
The evaluation of event detention performance is challenging due to the large variability of the data. Other analytical approaches are needed to better present the detention performance of green roofs, especially in wet climates with distributed precipitation.
3.4. Detention Presented with Flow Duration Curves
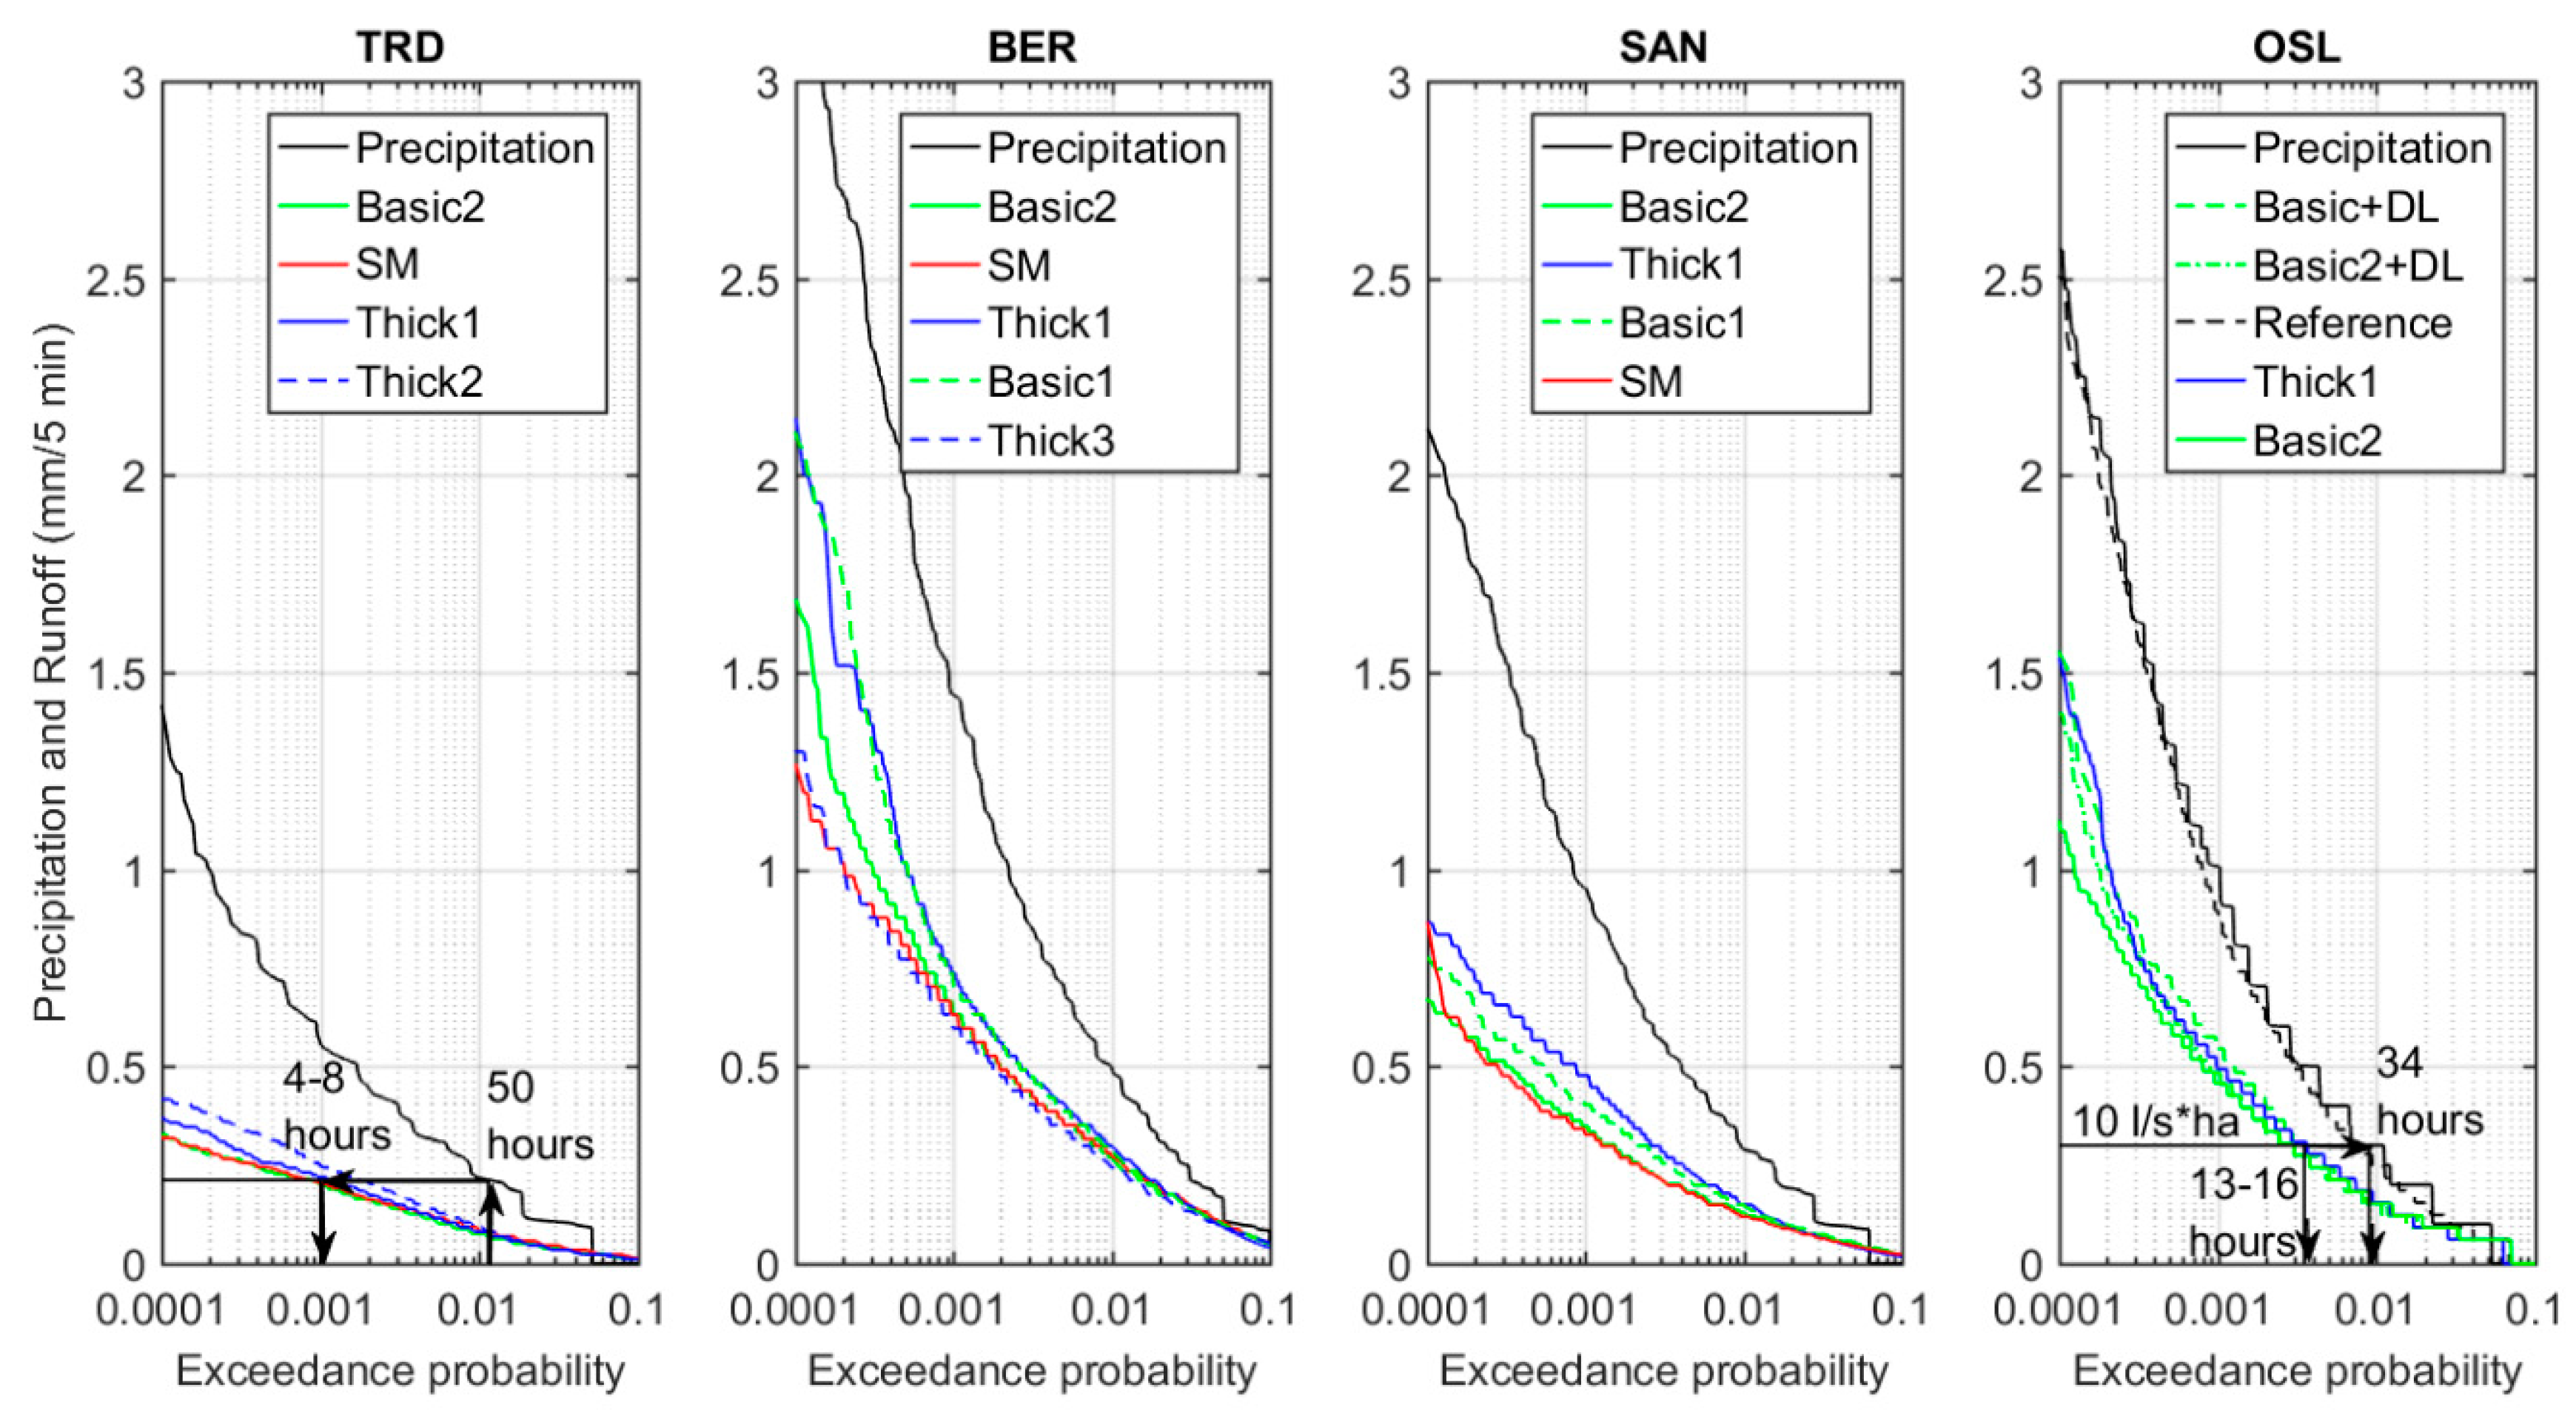
To evaluate green roofs’ ability to attenuate peak runoff and to prolong runoff duration, flow duration curves (FDC) based on 5-min time series have been plotted and compared to relevant runoff thresholds (Figure 7). The advantage of FDC is the ability to include runoff from all time steps, not being influenced by the event definition and subdivision of the data.
In this study, FDC have been applied directly to precipitation measurements, reference black and green roof runoff, which is a smaller scale than the basin-scale FDC normally applied. The method was applied to compare the runoff pattern for different configurations and to investigate if it can be useful for evaluating the exceedance probability of discharge limits and to investigate possible reductions in time with capacity problems or combined sewer overflow (CSO) operation.
The upper, left part of an FDC shows the magnitude and extent of high intensity precipitation and runoff and will be strongly dependent on the climate and precipitation pattern, while the lower, right part of the curve gives information on the low flow conditions and the temporary storage capacities of the system. The reference black roof applied in OSL showed runoff FDC similar to the precipitation FDC (average error was −0.014 mm/5 min). This roof had a drainage length of 4 m and a slope of 5.5%. An increased drainage length, as found on a real scale roof, would probably lower the runoff curve and increase the time of runoff slightly compared to the precipitation, but a reference roof runoff would still be expected to perform quite similar to the precipitation. All green roof configurations tested showed a shift towards lower runoff flows compared to the precipitation (and reference black roof) in the high intensity part of the curve and prolonged time of runoff compared to the precipitation and the reference roof runoff in the right part of the curve. The different configurations performed similarly in the right end of the curves, and it is not possible to argue that there was any observable difference in how the different configuration prolonged the time of runoff. All configurations prolonged the time of runoff to 2–4-times the time with measured precipitation. In the left, high intensity part of the plot, there is an observable difference between the runoff curves from the different configurations.
One way to evaluate the curves is to assume that the configurations with the lowest curves showed better detention performance than the configurations placed above in the same plot. When comparing these observations to the results from the event peak reductions, these did not necessarily show the same pattern. The x-axis had a log-scale, and the area where the largest differences can be observed constituted only 1% of the observed time, giving comparable runoff performance from the different green roof configurations for the majority of the time of runoff.
Regulations for discharging stormwater from properties to the public sewers vary between different Norwegian cities, according to local conditions as precipitation statistics, separated or combined systems or downstream pipe capacity. In the City of Oslo, the main priority is to handle stormwater locally and only allow discharge into the public sewer if needed. The maximum accepted discharge to a public sewer ranges from 10–20 L/s * ha total developed area [55]. The FDC can be used to study the exceedance of different thresholds (Table 6). With OSL as an example, the runoff threshold of 10 L/s * ha was exceeded 34 h each temperate season from the reference black roof in OSL, while the runoff from the green roofs only exceeded this threshold less than half of this time (13–16 h) (se OSL in Figure 7). The results indicate that green roofs alone cannot reduce runoff values enough to fulfill a requirement of a maximum of 10 L/s * ha runoff from rooftops, but in combination with other stormwater measures, green roofs can do a substantial part of the required detention. Furthermore, if runoff from rooftop areas were combined with runoff from other pervious areas (gardens or other), the total performance per area would improve.
FDC could also be used to illustrate what might happen if a system is experiencing 50 h of CSO operation or exceedance of capacity in the downstream system (see TRD in Figure 7). By introducing green roofs, the CSO operation can be reduced to 2–8 h. In real systems, no area draining to a CSO is completely covered by rooftops, and detention would also take place in pipes and remaining areas. This approach would therefore be more useful for larger catchments. However, the example illustrates how the FDC can be used as a tool to evaluate reduction in CSO operation by the introduction of green infrastructure.
These results are from small-scale plots with short transport distances to the gutter and can be expected to be conservative. For full-scale roofs, one can expect a further attenuation of the highest runoff flows and an increased difference between a reference roof and a green roof. The data series used have quite long durations (32–36 months for TRD, BER and SAN and 19–96 months in OSL), but still representative extreme events might not be included. If used as a design tool for events with high return periods, this must be taken into account. The authors would however argue that green roofs are better suited for handling the “daily” precipitation events, in combination with other downstream stormwater measures designed for the extreme events, and in such a context that the FDC based on observed data could give valuable information on green roof runoff patterns.
4. Conclusions
The study has investigated extensive green roof retention and detention performance based on 3–8 years of field data from four Norwegian locations representing typical cold and wet Nordic climates.
Observed accumulated retention performance given as fractions of precipitation varied greatly between the studied locations (11–30% in annual performance and 22–46% in temperate season performance), mainly explained by large variations in precipitation amounts, while the absolute temperate season monthly retention varied less (36–47 mm/month). Configurations with different water storage capacities were compared at the same location giving small variations in performance, showing that the retention performance was mainly restricted by actual evapotranspiration.
From a design perspective, estimates of available retention capacity for a given precipitation event are of high interest. Observations showed median values from 3.6–6.7 mm. The highest values were found in the location with the least precipitation (TRD). An increase in green roof estimated storage capacity from 9–13 mm increased the median available retention capacity by 1–1.2 mm, while an increase in green roof estimated storage capacity from 13 to around 20 mm increased the median available retention capacity by 0.4–1.6 mm. The best effect of increasing the storage capacity was found in OSL, which has a precipitation pattern more based on showers compared to the other locations with more evenly-distributed precipitation. For the thin basic configurations tested in TRD, BER and OSL, events had taken place where all estimated storage capacities were utilized, indicating that storage capacities above 13 mm would be preferable to avoid drought situations, which could affect the wellness of the vegetation.
Green roofs showed significant detention performance with high peak intensity reductions compared to a reference black roof. Median observed peak attenuation compared to the precipitation ranged from 65–90% depending on locations and configurations. The event-based approach is especially challenging, resulting in large variability in calculated metrics due to long duration, low intensity precipitation characterizing the studied cold and wet locations.
Flow duration curves based on the observed time series give valuable information on runoff patterns from green roofs and can be used to evaluate green roof performance in relation to local requirements. They provided a good alternative to the typical event-based metrics used for evaluating green roofs’ detention performance. The results indicate that green roofs could fulfill part of the required stormwater detention, but need to be combined with other stormwater measures to meet local runoff requirements in the city of Oslo.
Author Contributions
The building of the experimental sites was initiated by B.C.B., who also was responsible for the experimental design and collection of data from the Oslo site. B.G.J. was responsible for the instrumentation, operation and monitoring of the Trondheim, Bergen and Sandnes sites, and she wrote the paper and performed the data analysis with valuable contributions from B.C.B. and T.M.M.
Acknowledgments
This study was founded by The Research Council of Norway (Grant No 241827) and The Municipality of Trondheim, Norway. Field study sites have been provided by the Municipality of Sandnes, Municipality of Bergen, Risvollan housing cooperative and B.C. Braskerud. The field stations was built with support and contributions from the Norwegian governmental program “Cities of the Future”, the cities of Trondheim, Bergen and Sandnes, The Norwegian Water Resources and Energy Directorate (NVE), The Norwegian University of Science and Technology (NTNU), Anlegg og Utemiljø AS, Bergknapp AS, Sempergreen®, Veg Tech, Vital Vekst AS and ZinCo Norge AS. The authors would also like to thank Elizabeth Fasmann-Beck for introducing the flow duration curve concept and inspiring the testing on green roof data, as well as the Klima 2050 Centre for Research-based Innovation as a collaborative partner.
Conflicts of Interest
The authors declare no conflict of interest.
Appendix A

Table A1.
Vegetation registrations in TRD. Average values for 3 × 1 m2 per configuration and 2016 and 2017.
Table A1.
Vegetation registrations in TRD. Average values for 3 × 1 m2 per configuration and 2016 and 2017.
| Configuration | Basic2 | SM | Thick1 | Thick2 |
|---|---|---|---|---|
| Sedum | 79% | 48% | 57% | 62% |
| Vegetation | 91% | 64% | 92% | 94% |
| Bare substrate | 9% | 36% | 8% | 6% |
Table A2.
Vegetation registrations in BER. Average values for 2 × 1 m2 per configuration and 2016 and 2017.
Table A2.
Vegetation registrations in BER. Average values for 2 × 1 m2 per configuration and 2016 and 2017.
| Configuration | Basic2 | SM | Thick1 | Basic1 | Thick3 |
|---|---|---|---|---|---|
| Sedum | 64% | 48% | 41% | 42% | 36% |
| Vegetation | 90% | 90% | 99% | 93% | 96% |
| Bare substrate | 10% | 10% | 2% | 7% | 5% |
Table A3.
Vegetation registrations in SAN. Average values for 2 × 1 m2 per configuration and 2016 and 2017.
Table A3.
Vegetation registrations in SAN. Average values for 2 × 1 m2 per configuration and 2016 and 2017.
| Configuration | Basic2 | Thick1 | Basic1 | SM |
|---|---|---|---|---|
| Sedum | 98% | 85% | 90% | 89% |
| Vegetation | 98% | 96% | 94% | 92% |
| Bare substrate | 3% | 4% | 7% | 8% |
Table A4.
Vegetation registrations in OSL. Average values for 2 × 1 m2 per configuration in 2016 [56].
Table A4.
Vegetation registrations in OSL. Average values for 2 × 1 m2 per configuration in 2016 [56].
| Configuration | Basic2 + DL | Thick1 | Basic2 |
|---|---|---|---|
| Sedum | 96% | 86% | 86% |
| Vegetation | 100% | 98% | 100% |
| Bare substrate | 0% | 2% | 0% |
References
- Oberndorfer, E.; Lundholm, J.; Bass, B.; Coffman, R.R.; Doshi, H.; Dunnett, N.; Gaffin, S.; Kohler, M.; Liu, K.K.Y.; Rowe, B. Green roofs as urban ecosystems: Ecological structures, functions, and services. Bioscience 2007, 57, 823–833. [Google Scholar] [CrossRef]
- Teemusk, A.; Mander, U. Greenroof potential to reduce temperature fluctuations of a roof membrane: A case study from Estonia. Build. Environ. 2009, 44, 643–650. [Google Scholar] [CrossRef]
- Saadatian, O.; Sopian, K.; Salleh, E.; Lim, C.H.; Riffat, S.; Saadatian, E.; Toudeshki, A.; Sulaiman, M.Y. A review of energy aspects of green roofs. Renew. Sustain. Energy Rev. 2013, 23, 155–168. [Google Scholar] [CrossRef]
- Andenæs, E.; Kvande, T.; Muthanna, T.; Lohne, J. Performance of Blue-Green Roofs in Cold Climates: A Scoping Review. Buildings 2018, 8, 55. [Google Scholar] [CrossRef]
- Besir, A.B.; Cuce, E. Green roofs and facades: A comprehensive review. Renew. Sustain. Energy Rev. 2018, 82, 915–939. [Google Scholar] [CrossRef]
- Lee, K.E.; Williams, K.J.H.; Sargent, L.D.; Farrell, C.; Williams, N.S. Living roof preference is influenced by plant characteristics and diversity. Landsc. Urban Plan. 2014, 122, 152–159. [Google Scholar] [CrossRef]
- Li, Y.L.; Babcock, R.W. Green roof hydrologic performance and modeling: A review. Water Sci. Technol. 2014, 69, 727–738. [Google Scholar] [CrossRef] [PubMed]
- Stovin, V. The potential of green roofs to manage Urban Stormwater. Water Environ. J. 2010, 24, 192–199. [Google Scholar] [CrossRef]
- Stovin, V.; Vesuviano, G.; De-Ville, S. Defining green roof detention performance. Urban Water J. 2017, 14, 574–588. [Google Scholar] [CrossRef]
- Cook-Patton, S.O. Plant diversity on Green Roofs. In Green Roof Ecosystems; Sutton, R.K., Ed.; Springer: Cham, Switzerland, 2015; Volume 223, pp. 193–209. [Google Scholar]
- Forschungsgesellschaft Landschaftsentwickung Landschaftsbau (FLL). Guidelines for the Planning, Construction and Maintenance of Green Roofing; FLL: Bonn, Germany, 2008. [Google Scholar]
- Fassman, E.; Simcock, R. Moisture Measurements as Performance Criteria for Extensive Living Roof Substrates. J. Environ. Eng. 2012, 138, 841–851. [Google Scholar] [CrossRef]
- Liu, R.F.; Fassman-Beck, E. Hydrologic response of engineered media in living roofs and bioretention to large rainfalls: Experiments and modeling. Hydrol. Process. 2017, 31, 556–572. [Google Scholar] [CrossRef]
- De-Ville, S.; Menon, M.; Jia, X.; Reed, G.; Stovin, V. The impact of green roof ageing on substrate characteristics and hydrological performance. J. Hydrol. 2017, 547, 332–344. [Google Scholar] [CrossRef]
- Vesuviano, G.; Stovin, V. A generic hydrological model for a green roof drainage layer. Water Sci. Technol. 2013, 68, 769–775. [Google Scholar] [CrossRef] [PubMed]
- Alfredo, K.; Montalto, F.; Goldstein, A. Observed and modeled performances of prototype green roof test plots subjected to simulated low- and high-intensity precipitations in a laboratory experiment. J. Hydrol. Eng. 2010, 15, 444–457. [Google Scholar] [CrossRef]
- Buccola, N.; Spolek, G. A Pilot-Scale Evaluation of Greenroof Runoff Retention, Detention, and Quality. Water Air Soil Pollut. 2011, 216, 83–92. [Google Scholar] [CrossRef]
- Soulis, K.X.; Ntoulas, N.; Nektarios, P.A.; Kargas, G. Runoff reduction from extensive green roofs having different substrate depth and plant cover. Ecol. Eng. 2017, 102, 80–89. [Google Scholar] [CrossRef]
- Yio, M.H.N.; Stovin, V.; Werdin, J.; Vesuviano, G. Experimental analysis of green roof substrate detention characteristics. Water Sci. Technol. 2013, 68, 1477–1486. [Google Scholar] [CrossRef] [PubMed]
- Fassman-Beck, E.; Voyde, E.; Simcock, R.; Hong, Y.S. 4 Living roofs in 3 locations: Does configuration affect runoff mitigation? J. Hydrol. 2013, 490, 11–20. [Google Scholar] [CrossRef]
- Hakimdavar, R.; Culligan, P.J.; Finazzi, M.; Barontini, S.; Ranzi, R. Scale dynamics of extensive green roofs: Quantifying the effect of drainage area and rainfall characteristics on observed and modeled green roof hydrologic performance. Ecol. Eng. 2014, 73, 494–508. [Google Scholar] [CrossRef]
- Bengtsson, L. Peak flows from thin sedum-moss roof. Hydrol. Res. 2005, 36, 269–280. [Google Scholar] [CrossRef]
- VanWoert, N.D.; Rowe, D.B.; Andresen, J.A.; Rugh, C.L.; Fernandez, R.T.; Xiao, L. Green roof stormwater retention: Effects of roof surface, slope, and media depth. J. Environ. Qual. 2005, 34, 1036–1044. [Google Scholar] [CrossRef] [PubMed]
- Voyde, E.; Fassman, E.; Simcock, R. Hydrology of an extensive living roof under sub-tropical climate conditions in Auckland, New Zealand. J. Hydrol. 2010, 394, 384–395. [Google Scholar] [CrossRef]
- Villarreal, E.L.; Bengtsson, L. Response of a Sedum green-roof to individual rain events. Ecol. Eng. 2005, 25, 1–7. [Google Scholar] [CrossRef]
- Getter, K.L.; Rowe, D.B.; Andresen, J.A. Quantifying the effect of slope on extensive green roof stormwater retention. Ecol. Eng. 2007, 31, 225–231. [Google Scholar] [CrossRef]
- Carson, T.B.; Marasco, D.E.; Culligan, P.J.; McGillis, W.R. Hydrological performance of extensive green roofs in New York City: Observations and multi-year modeling of three full-scale systems. Environ. Res. Lett. 2013, 8, 13. [Google Scholar] [CrossRef]
- Loiola, C.; Mary, W.; Pimentel da Silva, L. Hydrological performance of modular-tray green roof systems for increasing the resilience of mega-cities to climate change. J. Hydrol. 2018. [Google Scholar] [CrossRef]
- Brandao, C.; Cameira, M.D.; Valente, F.; de Carvalho, R.C.; Paco, T.A. Wet season hydrological performance of green roofs using native species under Mediterranean climate. Ecol. Eng. 2017, 102, 596–611. [Google Scholar] [CrossRef]
- Peel, M.C.; Finlayson, B.L.; McMahon, T.A. Updated world map of the K¨oppen-Geiger climate classification. Hydrol. Earth Syst. Sci. Discuss. 2007, 4, 439–473. [Google Scholar] [CrossRef]
- Locatelli, L.; Mark, O.; Mikkelsen, P.S.; Arnbjerg-Nielsen, K.; Bergen Jensen, M.; Binning, P.J. Modelling of green roof hydrological performance for urban drainage applications. J. Hydrol. 2014, 519, 3237–3248. [Google Scholar] [CrossRef]
- Bengtsson, L.; Grahn, L.; Olsson, J. Hydrological function of a thin extensive green roof in southern Sweden. Hydrol. Res. 2005, 36, 259–268. [Google Scholar] [CrossRef]
- Mentens, J.; Raes, D.; Hermy, M. Green roofs as a tool for solving the rainwater runoff problem in the urbanized 21st century? Landsc. Urban Plan. 2006, 77, 217–226. [Google Scholar] [CrossRef]
- Stovin, V.; Vesuviano, G.; Kasmin, H. The hydrological performance of a green roof test bed under UK climatic conditions. J. Hydrol. 2012, 414, 148–161. [Google Scholar] [CrossRef]
- Hill, J.; Drake, J.; Sleep, B.; Margolis, L. Influences of four extensive green roof design variables on stormwater hydrology. J. Hydrol. Eng. 2017, 22. [Google Scholar] [CrossRef]
- Krebs, G.; Kuoppamaki, K.; Kokkonen, T.; Koivusalo, H. Simulation of green roof test bed runoff. Hydrol. Process. 2016, 30, 250–262. [Google Scholar] [CrossRef]
- Stovin, V.; Poe, S.; Berretta, C. A modelling study of long term green roof retention performance. J. Environ. Manag. 2013, 131, 206–215. [Google Scholar] [CrossRef] [PubMed]
- Johannessen, B.G.; Hanslin, H.M.; Muthanna, T.M. Green roof performance potential in cold and wet regions. Ecol. Eng. 2017, 106, 436–447. [Google Scholar] [CrossRef]
- Elliot, R.M.; Gibson, R.A.; Carson, T.B.; Marasco, D.E.; Culligan, P.J.; McGillis, W.R. Green roof seasonal variation: Comparison of the hydrologic behavior of a thick and a thin extensive system in New York City. Environ. Res. Lett. 2016, 11. [Google Scholar] [CrossRef]
- Graceson, A.; Hare, M.; Monaghan, J.; Hall, N. The water retention capabilities of growing media for green roofs. Ecol. Eng. 2013, 61, 328–334. [Google Scholar] [CrossRef]
- Nawaz, R.; McDonald, A.; Postoyko, S. Hydrological performance of a full-scale extensive green roof located in a temperate climate. Ecol. Eng. 2015, 82, 66–80. [Google Scholar] [CrossRef]
- Feitosa, R.C.; Wilkinson, S. Modelling green roof stormwater response for different soil depths. Landsc. Urban Plan. 2016, 153, 170–179. [Google Scholar] [CrossRef]
- Villarreal, E.L. Runoff detention effect of a sedum green-roof. Hydrol. Res. 2007, 38, 99–105. [Google Scholar] [CrossRef]
- Palla, A.; Sansalone, J.J.; Gnecco, I.; Lanza, L.G. Storm water infiltration in a monitored green roof for hydrologic restoration. Water Sci. Technol. 2011, 64, 766–773. [Google Scholar] [CrossRef] [PubMed]
- Hathaway, A.M.; Hunt, W.F.; Jennings, G.D. Afield study of green roof hydrologic and water quality performance. Trans. ASABE 2008, 51, 37–44. [Google Scholar] [CrossRef]
- Peng, Z.; Stovin, V. Independent validation of the SWMM green roof module. J. Hydrol. Eng. 2017, 22, 22. [Google Scholar] [CrossRef]
- Smakhtin, V.U. Low flow hydrology: A review. J. Hydrol. 2001, 240, 147–186. [Google Scholar] [CrossRef]
- Searcy, J.K. Flow-Duration Curves. In Manual of Hydrology, Part 2. Low-Flow Tecniques; United States Government Printing Office: Washington, DC, USA, 1959. [Google Scholar]
- Avellaneda, P.M.; Jefferson, A.J.; Grieser, J.M.; Bush, S.A. Simulation of the cumulative hydrological response to green infrastructure. Water Resour. Res. 2017, 53, 3087–3101. [Google Scholar] [CrossRef]
- Lambrecht. Operating Instructions Heated Precipitation Sensor (1518 H3++); Lambrecht: Göttingen, Germany, 2014. [Google Scholar]
- Førland, E.J.; Allerup, P.; Dahlström, B.; Elomaa, E.; Jonsson, T.; Madsen, H.; Perälä, J.; Rissanen, P.; Vedin, H.; Vejen, F. Manual for Operational Correction of Nordic Precipitaion Data; Report nr. 24/96; Det Norske Meterologiske Institutt: Oslo, Norway, 1996. [Google Scholar]
- Mjønes, T. Detektering av snø- og Vindfordelingen over Grønne Tak; Norwegian University og Science and Technology: Trondheim, Norway, 2016. [Google Scholar]
- Richards, L.A. Porous Plate Apparatus for Measuring Moisture Retention and Transmission by Soil. Soil Sci. 1948, 66, 105–110. [Google Scholar] [CrossRef]
- Poë, S.; Stovin, V.; Berretta, C. Parameters influencing the regeneration of a green roof’s retention capacity via evapotranspiration. J. Hydrol. 2015, 523, 356–367. [Google Scholar] [CrossRef]
- The City of Oslo Stormwater Management. A Guideline for Developers. Version 1.3; The City of Oslo Stormwater Management: Oslo, Norway, 2017. [Google Scholar]
- Hanslin, H.M.; Johannessen, B.G. Oppfølging av Grønne tak fra Fremtidens Byer. 2016. Available online: http://www.miljodirektoratet.no/no/Publikasjoner/2017/Mars/Oppfolging-gronne-tak-fra-Fremtidens-byer-2016/ (accessed on 20 May 2018).
Figure 1.
Field sites and applied roof configurations; (a) Trondheim (TRD); (b) Bergen (BER); (c) Sandnes (SAN); (d) Oslo (OSL).
Figure 1.
Field sites and applied roof configurations; (a) Trondheim (TRD); (b) Bergen (BER); (c) Sandnes (SAN); (d) Oslo (OSL).

Figure 2.
Comparison of the temperate season meteorology in the period 2015–2017 for the four locations, median (Q1 and Q3) values given; (a) temperature; (b) relative humidity; (c) wind speed; (d) monthly precipitation; (e) maximum monthly precipitation intensity.
Figure 2.
Comparison of the temperate season meteorology in the period 2015–2017 for the four locations, median (Q1 and Q3) values given; (a) temperature; (b) relative humidity; (c) wind speed; (d) monthly precipitation; (e) maximum monthly precipitation intensity.

Figure 3.
Monthly average retention (blue), runoff (yellow) and precipitation (total column), temperate season data. SM, substrate mat.
Figure 3.
Monthly average retention (blue), runoff (yellow) and precipitation (total column), temperate season data. SM, substrate mat.

Figure 4.
Observed event-based retention (median, Q1 and Q3) for temperate season events with more than 5 mm of precipitation. Median values given. Letters in parenthesis show significant differences between configurations at the same site.
Figure 4.
Observed event-based retention (median, Q1 and Q3) for temperate season events with more than 5 mm of precipitation. Median values given. Letters in parenthesis show significant differences between configurations at the same site.

Figure 5.
Observed maximum retention capacities shown as the 95% percentile of observed retention (filled), together with the median observed retention with whiskers showing Q1 and Q3 (open) for different tested configurations and locations. Based on temperate season events where runoff occurred, with more than 5 mm of precipitation and only one precipitation event included to restrict the total duration of events.

Figure 6.
Observed peak reduction (median, Q1 and Q3) for temperate season events with runoff, more than 5 mm of precipitation and only events based on one precipitation event included. Letters in parenthesis show significant differences between configurations at the same location.
Figure 6.
Observed peak reduction (median, Q1 and Q3) for temperate season events with runoff, more than 5 mm of precipitation and only events based on one precipitation event included. Letters in parenthesis show significant differences between configurations at the same location.

Figure 7.
Flow duration curves based on time series of temperate season data.

Table 1.
Reported retention performance of sedum-based extensive green roofs in cold and wet locations. WHC, water holding capacity.
Table 1.
Reported retention performance of sedum-based extensive green roofs in cold and wet locations. WHC, water holding capacity.
| Location | Köppen–Geiger Climate [30] * | Precipitation (mm/year) | Annual (Summer) Retention | Type of Study |
|---|---|---|---|---|
| Odense, Denmark [31] | Dfb | 800 | 44 (53)% | 80 mm with substrate mat |
| Malmö, Sweden [32] | Cfb | 705 | 46 (55)% | 40 mm substrate |
| German studies [33] | Cfb-Dfb | 554–1347 | 50% | Average depth 100 mm |
| Sheffield, U.K. [34] | Cfb | 825 | 50% | 80-mm substrate and drainage |
| Toronto, Canada [35] | Dfb | 77 * | (70%) | 100–150-mm substrate |
| Lahti, Finland [36] | Dfb | 60 ** | (42%) | 100 mm substrate |
| NW Scotland, U.K. [37] | Cfb | 2708 | 19% | 30-year model, 20-mm WHC |
| East Midlands, U.K. [37] | Cfb | 496 | 59% | 30-year model, 20-mm WHC |
| Bergen, Norway [38] | Cfb | 2715 | 18% | 30-year model, 30-mm WHC |
| Reykjavik, Iceland [38] | Cfc | 861 | 28% | 30-year model, 30-mm WHC |
| Oslo, Norway [38] | Dfb | 861 | 45% | 30-year model, 40-mm WHC |
* 1st letter; C: Temperate climate, D: Cold climate. 2nd letter; f: Without dry season. 3rd letter; b: Warm summer, c: Cold summer. Temperate oceanic climate (Cfb), subpolar oceanic climate (Cfc), Warm-summer humid continental climate (Dfb), ** (mm/month).
Table 2.
Reported detention performances in terms of peak reduction and peak delay of the 5-min peak and centroid delay. The median (min/max) or the mean (bold) ± the standard deviation given.
Table 2.
Reported detention performances in terms of peak reduction and peak delay of the 5-min peak and centroid delay. The median (min/max) or the mean (bold) ± the standard deviation given.
| Type of Study | Peak Reduction (%) | Peak Delay (min) | Centroid Delay (min) |
|---|---|---|---|
| 3 m2, 1.5° slope 80-mm substrate, drainage layer [34] 1,3 | 59 (20/100)% | 18 (−49/283) | 75 (5/261) |
| 50–150-mm substrate, 4–171 m2 [20] 1,4 | 62–90% | ||
| 2.5 m2, 2.5% slope, 150-mm substrate, drainage layer, varying vegetation [29] 1,5 | 84–94% | 10–16 | |
| 171 m2, 20-mm substrate and 15-mm drainage layer, Period I [44] 1 | 89 ± 15% | 407 ± 435 | |
| Period II [44] 1 | 72 ± 20% | 149 ± 72 | |
| 70 m2, flat, 75-mm substrate, drainage layer [45] 2 | 77% | ||
| 27 m2, 3% slope, 100-mm substrate, drainage layer [45] 2 | 88% |
1 Compared to the control roof, 2 compared to precipitation, 3 >1 year return period, 4 sum precipitation greater than 2 mm, 5 intensity >0.5 mm/5 min, duration >6 h, 10-min peak.
Table 3.
Applied roof configurations. Depth and water storage capacity for each layer tested and total depth and estimated storage capacity for the tested combinations (bold). Water storage given by the manufacturer 1, measured in the laboratory after 24 h of saturation and 2 h of draining (maximum water capacity (MWC)) 2, based on agronomic measurements (WHC) 3 or assumed from reported literature values 4. EPS, expanded polystyrene.
| Configuration | Type | Depth (mm) | Water Storage (mm) |
|---|---|---|---|
| Basic1 | Vegetation mat, Substrate 1 | 30 | 6 4 |
| Basic1 | Textile retention fabric | 3 | 2.7 2 |
| Basic1 | Applied configuration | 33 | 9 |
| Basic2 | Vegetation mat, Substrate 2 | 30 | 6 4 |
| Basic2 | Textile retention fabric | 10 | 7.2 2 |
| Basic2 | Applied configuration | 40 | 13 |
| Basic+DL | Vegetation mat, Substrate 2 | 30 | 6 4 |
| Basic+DL | Drainage layer (HDPE) | 25 | 5.8 1 |
| Basic+DL | Applied configuration | 55 | 12 |
| Basic2+DL | Vegetation mat, Substrate 2 | 30 | 6 4 |
| Basic2+DL | Textile retention fabric | 10 | 7.2 2 |
| Basic2+DL | Drainage layer (HDPE) | 25 | 5.8 1 |
| Basic2+DL | Applied configuration | 65 | 19 |
| SM | Vegetation mat, Substrate 3 | 30 | 6 4 |
| SM | Substrate mat | 50 | 30 1 |
| SM | Applied configuration | 80 | 36 |
| Thick1 TRD | Vegetation mat, Substrate 4 | 30 | 6 4 |
| Thick1 TRD | Separate Substrate 4 | 50 | 10 3 |
| Thick1 TRD | Drainage layer (HDPE) | 25 | 3 1 |
| Thick1 TRD | Textile retention fabric | 5 | 3.3 2 |
| Thick1 TRD | Applied configuration | 110 | 22 |
| Thick1 BER | Vegetation mat, Substrate 4 | 30 | 6 4 |
| Thick1 BER | Separate Substrate 4 | 50 | 10 3 |
| Thick1 BER | Drainage layer (EPS) | 75 | 3 1 |
| Thick1 BER | Textile retention fabric | 5 | 3.3 2 |
| Thick1 BER | Applied configuration | 160 | 22 |
| Thick1 SAN | Vegetation mat, Substrate 4 | 30 | 6 4 |
| Thick1 SAN | Separate Substrate 4 | 50 | 10 3 |
| Thick1 SAN | Drainage layer (EPS) | 75 | 0 1 |
| Thick1 SAN | Textile retention fabric | 5 | 3.3 2 |
| Thick1 SAN | Applied configuration | 160 | 19 |
| Thick1 OSL | Vegetation mat, Substrate 4 | 30 | 6 4 |
| Thick1 OSL | Separate Substrate 4 | 50 | 10 3 |
| Thick1 OSL | Drainage layer (HDPE) | 40 | 5 1 |
| Thick1 OSL | Textile retention fabric | 5 | 3.3 2 |
| Thick1 OSL | Applied configuration | 125 | 24 |
| Thick2 | Vegetation mat, Substrate 3 | 30 | 6 4 |
| Thick2 | Separate Substrate 3 | 50 | 13 3 |
| Thick2 | Drainage layer (PE) | 21 | 4 1 |
| Thick2 | Applied configuration | 110 | 23 |
| Thick3 | Vegetation mat, Substrate 1 | 30 | 6 4 |
| Thick3 | Pumice | 50 | 15 4 |
| Thick3 | Textile retention fabric | 3 | 2.7 2 |
| Thick3 | Applied configuration | 83 | 22 |
Table 4.
Roof plot and collection tank sizes, together with instrumentation applied at each location. Type and resolution/accuracy is given.
Table 4.
Roof plot and collection tank sizes, together with instrumentation applied at each location. Type and resolution/accuracy is given.
| Component/Instrument | TRD | BER | SAN | OSL |
|---|---|---|---|---|
| Roof plot area (m2) | 15.0 | 7.84 | 8.48 | 8.00 |
| Collection tank, area (m2) | 0.160 0.173 1 | 0.270 | 0.250 | 0.240 |
| Collection tank, depth (m) | 0.50 0.85 1 | 0.80 | 0.80 | 0.80 |
| Pressure transducer (m) | Impress S12C 0–10/±2% | AquiStar 3C160 0–3.5/±0.1% | AquiStar 3C160 0–3.5/±0.1% | 4tech MiniBar 0–1/±0.3% |
| Precipitation Gauge | Lambrecht 1518H3 heated tipping bucket 0.1 mm (resolution)/±2% | |||
| Air temperature, type | Campbell Scientific CS215 −40–+70 °C/±0.9 °C | Young PT-100 −50–+50 °C/±0.3 °C | ||
| Relative humidity (%) | Campbell Scientific CS215 0–100/±4% | - | ||
| Wind speed (m/s) | WindSonic, heated ultrasonic wind sensor 0–60/±2% | Wind Monitor Young 5106–45 Alpine 0–100/±1% | Wind Monitor Young 5103 0–100/±1% | - |
1 Size changed 15 October 2015.
Table 5.
Accumulated annual (and temperate season) retention for all locations and configurations together with average values for each location (excluding the reference).
Table 5.
Accumulated annual (and temperate season) retention for all locations and configurations together with average values for each location (excluding the reference).
| Configuration | TRD | BER | SAN | OSL |
|---|---|---|---|---|
| Reference black roof | 0% (8%) | |||
| Basic1 | 9% (20%) | 17% (26%) | ||
| Basic2 | 35% (50%) | 10% (22%) | 24% (33%) | 24% (33%) |
| Basic+DL | 28% (36%) | |||
| Basic2+DL | 23% (33%) | |||
| SM | 24% (40%) | 8% (18%) | 26% (33%) | |
| Thick1 | 27% (46%) | 11% (24%) | 21% (30%) | 26% (32%) |
| Thick2 | 33% (48%) | |||
| Thick3 | 14% (25%) | |||
| Average | 30% (46%) | 11% (22%) | 22% (30%) | 26% (34%) |
Table 6.
Exceedance time in hours/year (only temperate season data included) for precipitation, reference black roof (for OSL) and green roof runoff for different thresholds (5, 10 and 25 L/s * ha).
Table 6.
Exceedance time in hours/year (only temperate season data included) for precipitation, reference black roof (for OSL) and green roof runoff for different thresholds (5, 10 and 25 L/s * ha).
| Runoff threshold | 5 L/s * ha | 10 L/s * ha | 25 L/s * ha | |||
|---|---|---|---|---|---|---|
| Location | Precipitation/Reference | Runoff | Precipitation/Reference | Runoff | Precipitation/Reference | Runoff |
| TRD | 82 | 12–19 | 27 | 1–3 | 2 | 0 |
| BER | 223 | 105–132 | 97 | 29–42 | 18 | 2–4 |
| SAN | 122 | 26–41 | 42 | 5–11 | 8 | 0–1 |
| OSL | 96 | 47–56 | 34 | 13–16 | 6 | 1–2 |
© 2018 by the authors. Licensee MDPI, Basel, Switzerland. This article is an open access article distributed under the terms and conditions of the Creative Commons Attribution (CC BY) license (http://creativecommons.org/licenses/by/4.0/).
Share and Cite
MDPI and ACS Style
Johannessen, B.G.; Muthanna, T.M.; Braskerud, B.C. Detention and Retention Behavior of Four Extensive Green Roofs in Three Nordic Climate Zones. Water 2018, 10, 671. https://doi.org/10.3390/w10060671
AMA Style
Johannessen BG, Muthanna TM, Braskerud BC. Detention and Retention Behavior of Four Extensive Green Roofs in Three Nordic Climate Zones. Water. 2018; 10(6):671. https://doi.org/10.3390/w10060671
Chicago/Turabian StyleJohannessen, Birgitte Gisvold, Tone Merete Muthanna, and Bent Christen Braskerud. 2018. "Detention and Retention Behavior of Four Extensive Green Roofs in Three Nordic Climate Zones" Water 10, no. 6: 671. https://doi.org/10.3390/w10060671
Note that from the first issue of 2016, this journal uses article numbers instead of page numbers. See further details here.