An Ameliorative Whale Optimization Algorithm for Multi-Objective Optimal Allocation of Water Resources in Handan, China


1
School of Water Conservancy and Hydroelectric Power, Hebei University of Engineering, Handan 056021, China
2
School of Earth Science and Engineering, Hebei University of Engineering, Handan 056038, China
3
Research Center for Water Ecological Civilization & Social Governance of Hebei Province, Handan 056021, China
*
Authors to whom correspondence should be addressed.
Water 2018, 10(1), 87; https://doi.org/10.3390/w10010087
Submission received: 15 November 2017
/
Revised: 4 January 2018
/
Accepted: 16 January 2018
/
Published: 19 January 2018
Abstract
:With the deepening discrepancy between water supply and demand caused by water shortages, alleviating water shortages by optimizing water resource allocation has received extensive attention. How to allocate water resources optimally, rapidly, and effectively has become a challenging problem. Thus, this study employs a meta-heuristic swarm-based algorithm, the whale optimization algorithm (WOA). To overcome drawbacks like relatively low convergence precision and convergence rates, when applying the WOA algorithm to complex optimization problems, logistic mapping is used to initialize swarm location, and inertia weighting is employed to improve the algorithm. The resulting ameliorative whale optimization algorithm (AWOA) shows substantially enhanced convergence rates and precision than the WOA and particle swarm optimization algorithms, demonstrating relatively high reliability and applicability. A water resource allocation optimization model with optimal economic efficiency and least total water shortage volume is established for Handan, China, and solved by the AWOA. The allocation results better reflect actual water usage in Handan. In 2030, the p = 50% total water shortage is forecast as 404.34 × 10⁶ m3 or 14.8%. The shortage is mainly in the primary agricultural sector. The allocation results provide a reference for regional water resources management.
1. Introduction
Water is one of the most indispensable natural resources for human survival and development [1]. Rapid social and economic development and population growth, along with climate change, have aggravated water shortages [2,3,4,5,6,7,8]. The recent situation is unlike early water supply management. There are fewer exploitable water resources and exploitation costs are increasingly expensive, often leading to more serious environmental problems. By optimizing water resource allocation, water resources are transferred from low- to high-value uses, and the efficiency of water usage is enhanced. These are important ways to solve water shortages.
Optimal allocation of water resources has been studied for years all over the world. The first research focused on single-objective water allocation management in an irrigation area. However, it has grown to cover areas like mega-scale multi-objective regional water resource allocation optimization. The coverage and scope of water resource allocation have expanded greatly. The earliest research on water resource allocation optimization dates to Masse et al.’s study on reservoir optimization in the 1940s [9]. In 1962, Maass et al. established a single-objective non-linear static planning model and considered the maximum total net benefit in regional water resource exploitation and utilization as the objective function [10]. In 1962, Buras constructed a dynamic programming model to determine the magnitudes of surface and underground water reservoirs and water supply strategies for each irrigation area [11]. It is more common to describe problems in water resource systems using mathematical models because of advancements in mathematical programming and simulation techniques [12]. Linear [13], non-linear [14], random linear [15], and dynamic [16] programming types are among the methods extensively employed in optimizing water resource allocation. In the 1990s, the United Nations published the Guidebook to Water Resources, Use and Management in Asia and the Pacific [17], signifying the relative maturity of development of water resource allocation optimization.
Optimal allocation is a dynamic and challenging area that researchers have been studying for a long time. For recent multi-objective, multi-variable, and high-dimensional allocation models, traditional optimization algorithms are not satisfactory in their convergence, calculation efficiency, and parameter sensitivity. For large-scale allocation optimization models, the curse of dimensionality often makes solutions for optimization difficult or leads to results that are inconsistent with reality. Nature provides great inspiration for mechanisms, principles, and concepts to solve complex optimization problems [18]. By simulating biological evolution processes—food-hunting behavior of organisms in nature, or physical rules—more efficient optimization algorithms can be designed to better tackle multi-objective optimization problems. This has attracted attention from various researchers.
Nature-inspired meta-heuristic optimization algorithms, including evolution-, physics-, and swarm-based methods, have become increasingly popular in engineering applications. This is because their principles are simple and easily implementable. There is no requirement for gradient information and they can avoid local optima. In particular, nature-inspired swarm-based meta-heuristic algorithms are more favorable than their evolution- and physics-based counterparts when they are applied to optimization problems [19]. The most popular swarm-based algorithm is the particle swarm optimization (PSO) algorithm proposed by Kennedy and Eberhart in 1995 [20]. PSO is derived by simulating the social behavior of flocks of birds when they hunt for food [20]. The concept is as follows: Each solution for the optimization problem is considered a particle. A fitness function is defined to measure the extent to which each particle solution is optimal. Each particle flies in the search space according to its own “flight experiences” and those of other particles, which subsequently achieves an overall optimal solution. Another widely used swarm-based algorithm is the ant colony optimization (ACO) algorithm, first proposed by Dorigo et al. [21]. The concept is as follows: Pathways of ants denote possible solutions to an optimization problem while all the pathways of the entire ant colony give the solution space of the problem. Ants that take shorter pathways release more pheromones. The pheromone concentrations along the shorter pathways accumulate, and hence, increase with time, as more ants choose these pathways. Eventually, due to the positive feedback mechanism, all ants will travel along the optimal pathway. This corresponds to the optimal solution to the optimization problem. The artificial fish swarm algorithm (AFSA) is another popular swarm-based algorithm, first suggested by Li et al. in 2002 [22]. This algorithm is fundamentally based on the phenomenon wherein, in order to seek the optimal solution, “maximum fish survival takes place in localities where nutrients are the most concentrated in the water”. The AFSA mainly simulates how fish swarms look for food, swarm, and chase. Other representative swarm-based algorithms include the firefly algorithm(FA) [23], fruit fly optimization algorithm [24], termite algorithm [25], and wasp swarm algorithm [26], as well as dolphin echolocation [27]. Although swarm-based algorithms yield well-known advantages, there is no single algorithm capable of handling all optimization problems. Currently, the PSO [28,29,30], ACO [31,32], AFSA [33,34], and FA [35] have been successfully applied to water resource allocation optimization problems and their effectiveness has been well proven.
Recently, a new swarm algorithm, namely, the whale optimization algorithm (WOA), has been introduced [19]. It is easy to operate, with less parameters to be adjusted. The WOA is highly capable of avoiding local optima [36]. Nevertheless, for complex optimization problems, the WOA has relatively low convergence precision and convergence rates. In order to overcome these issues, this study proposes the ameliorative whale optimization algorithm (AWOA), and compares its performance to WOA and PSO’s performance in solving multi-objective water resource allocation optimization models. The results indicate that the AWOA yields higher convergence precision and rates.
2. Materials and Methods
2.1. Whale Optimization Algorithm
The WOA is a novel swarm intelligence optimization algorithm proposed by Australian researchers Mirjalili and Lewis in 2016 [19]. This algorithm is inspired by the hunting mechanism of humpback whales in nature, and simulates the shrinking encircling, spiral updating position, and random hunting mechanisms of humpback whale pods. This model consists of the following three stages: Encircling prey, bubbling-net attacking, and search for prey [19].
2.1.1. Encircling Prey
For encircling prey, the WOA optimization algorithm assumes that the current best solution is the target prey. Other individual whales then try to update their positions toward the optimal position. This behavior is represented by the following equations:
where represents the current iteration, is the position vector at iteration , is the position vector of the best solution obtained so far, D represents the distance between the position of and , and are coefficient vectors, is an element-by-element multiplication operator (e.g., ), is a random vector in , is a control parameter that is linearly decreased from 2 to 0 over the course of iterations, and is the maximum number of iterations.
2.1.2. Bubble-Net Attacking Method (Exploitation Phase)
The bubble-net behavior of humpback whales includes the shrinking, encircling, and spiral updating position.
• Shrinking encircling mechanism
This mechanism is mainly achieved by decreasing the value of control parameter . is a random value in the interval ( is linearly decreased from 2 to 0). When random values for are in the interval , the new position of the individual whales can be defined anywhere between the original position and the current best position. The mathematical modeling is expressed by Equations (1) and (2).
• Spiral updating position
For the spiral updating position, a logarithmic spiral equation is created between the position of the whales and the current best solution to simulate the spiral movement of humpback whales. The mathematical model is shown as
where represents the distance between the i-th whale and its prey (current best solution), is a constant for defining the shape of the logarithmic spiral, and is a random number in .
When humpback whales attack their prey, they move simultaneously within a shrinking encircling circle and along a spiral-shaped path. The WOA assumes there is a 50% probability of choosing between the shrinking encircling mechanism and the spiral model to update the position of whales during optimization. The mathematical model is as follows:
where is a random probability in .
2.1.3. Search for Prey (Exploration Phase)
In the search for prey or exploration phase, the positions of other individual whales are updated according to a randomly chosen individual whale. By setting , individual whales are forced to move far away from the reference whale in search of other better prey, thereby allowing the WOA algorithm to perform a global search. The model can be expressed as
where is a position vector randomly selected from the current whale population.
2.2. Ameliorative Whale Optimization Algorithm
Compared to other optimization algorithms, the advantages of the WOA are its simple operation and limited number of adjustment parameters, as there are only two adjustment parameters ( and ). Through the adjustment of , the algorithm can achieve a good balance between the capabilities of exploration and exploitation, thereby increasing the possibility of getting away from the local optimum. However, the exploitation phase in the WOA is completely dependent on randomness, thereby resulting in low convergence accuracy and slow convergence speed.
In response to the aforementioned drawbacks of the WOA, the AWOA is proposed in this study. The improved method is described in detail below.
First, in order to effectively improve the quality of the initial population position, the logistic map [37] is used to obtain the initial solution.
where [0, 1] and μ is a control parameter, μ = 4.
Second, after analyzing the weaknesses of the PSO algorithms, Shi and Eberhart [38] introduced the inertia weight to facilitate rapid convergence to a global optimal solution. Their analysis indicated that a larger inertia weight facilitates a global search, while a smaller one facilitates a local search. In order to improve local search capability, increase convergence accuracy, and speed up convergence, inertia weight is introduced in the WOA to improve the algorithm. The inertia weight introduced is expressed as follows:
is the maximum value of inertia weight, is the minimum value of inertia weight, t is the current iteration number, and is the maximum number of iterations. The improved position vector update formula is shown as
is progressively decreased with the number of iterations, thereby making it useful for global search and local optimization at the start and end of the iteration process, respectively. As the rate of decrement in the introduced is large, it facilitates local optimization in the algorithm, increases convergence accuracy, and speeds up convergence.
2.3. Best Individual Selection Based on Pareto
In a single-objective problem, the fitness function value is the objective function value. In a multi-objective problem, based on the solution strategy of the Pareto solution set, all individuals in the population can be sorted into different non-inferior frontiers using a fast non-dominated sorting algorithm. With a crowded-comparison operator, the best individual can be selected by setting the crowding distance as the winning standard among the same level groups after sorting.
2.3.1. Fast Non-Dominated Sorting
With fast non-dominated sorting, relatively good individuals in the population can be selected, thereby reflecting the superiority or inferiority of the individuals. The population size is assumed to be ; is an individual within ; and two parameters of the individual , namely, (the number of dominating individuals in the population) and (the set of individuals dominated by individual in the population), have to be calculated. First, all individuals in the population with are sorted into , and is taken as the current set. For each individual in set , those dominated by individual are sorted into . For each individual in the set , 1 is subtracted from each value, if , and then, the corresponding individual is saved into set . Finally, all individuals in set are recorded as the first level of non-dominating frontiers, while set is taken as the current set. Then, the steps mentioned above are repeated until the entire population has been sorted [39,40,41,42].
2.3.2. Crowding Distance and Crowded-Comparison Operator
• Crowding distance
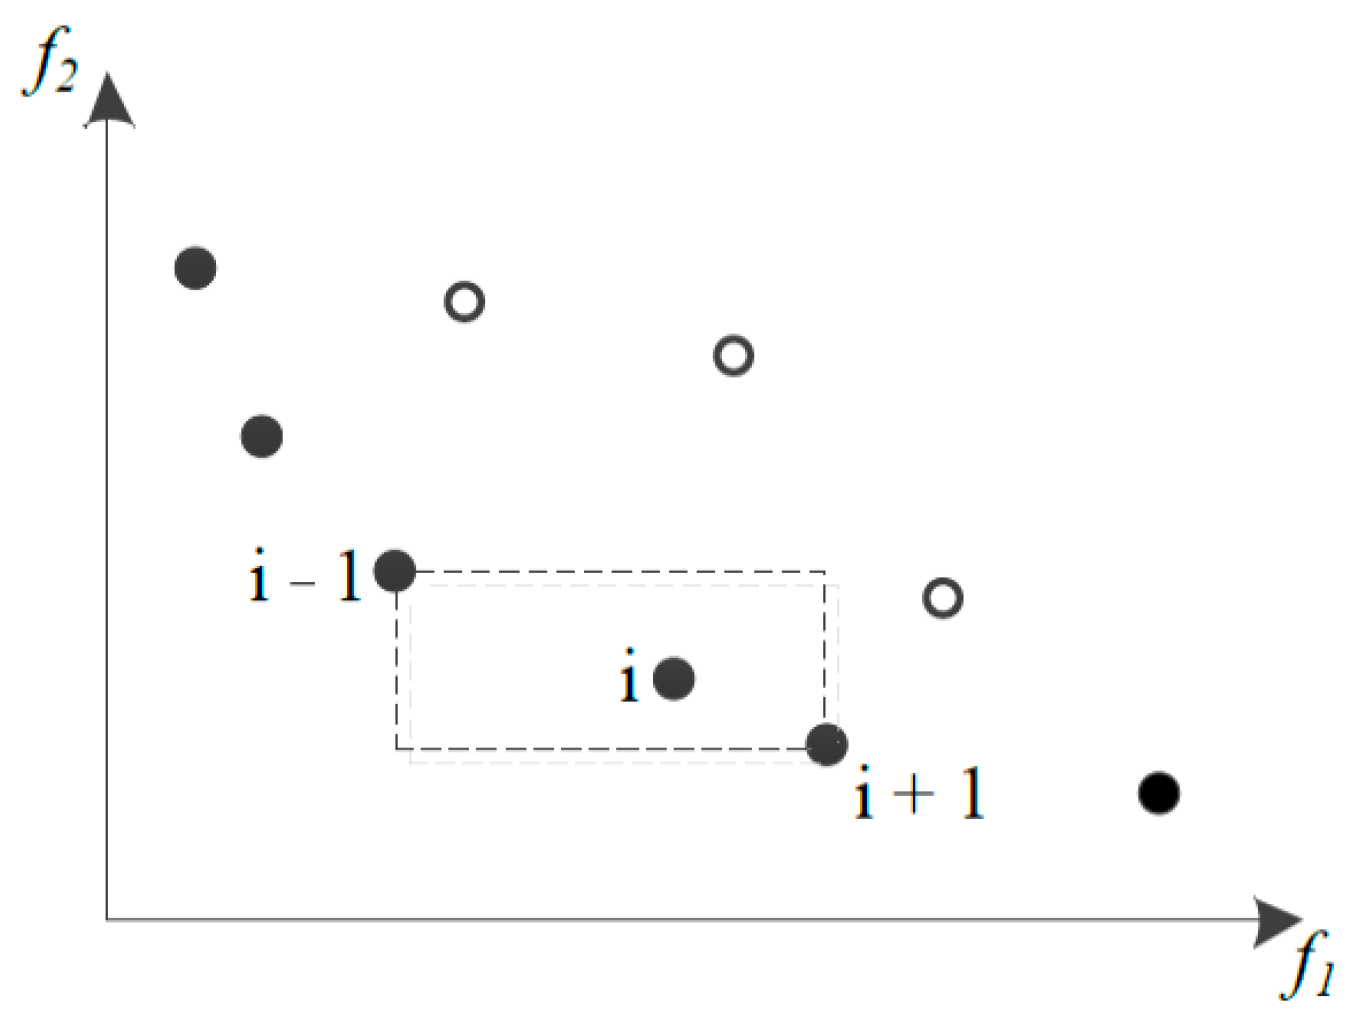
To improve the diversity and distribution of a population, the concept of crowding distance was proposed by Srinivas and Deb [43]. Crowding distance indicates the density surrounding an individual in the population. The available space around individual is represented by the length of the largest rectangle-containing individual , which is expressed as . As shown in Figure 1, the formula for calculating the crowding distance of individual i [39] is
where represents the objective function value of individual i. M is the number of objective functions. The objective function corresponding to individual i needs to be normalized because of its different units. According to [44], Equation (16) can be rewritten as
where represents the maximum value obtained by all individuals in the population in the i-th objective function, and represents the minimum value obtained by all individuals in the population in the i-th objective function. For each objective function, after all individuals in the population have undergone fast non-dominated sorting, the crowding distance of two individuals at the boundary of each level is infinite.
• Crowded-comparison operator
After carrying out the fast non-dominated sorting operations and calculation of crowding degree for each individual i in the population, each individual acquires two attributes, (non-dominated rank) and (crowding degree). and can be used to differentiate between the dominance and non-dominance relationship of any two individuals in the population. The crowded-comparison operator is expressed as :
When the non-dominated ranks between two individuals are different, the individual with the lower rank is considered superior; when the non-dominated ranks between two individuals are the same, the individual with the greater crowding distance is considered superior [39].
2.4. AWOA Solving Steps
- Initialization of parameters: Whale population size: N, with random generation of the initial population; maximum number of iterations: Tmax; maximum value of inertia weight: ; minimum value of inertia weight: .
- The location of whale population is initialized using logistic mapping, and initial variables are transformed into a range of values corresponding to initial variables of the objective function.
- Fast non-dominated sorting and calculation of individual crowding degree are carried out for all individuals in the population, and the best individual is then selected as the optimal position based on Equation (18).
- When and , the current position of individual whales are updated with Equation (14); when , a random individual whale is selected, and the current positions of individual whales are updated with Equations (10) and (11).
- When , the current positions of individual whales are updated with Equation (15).
- All individual whales are checked to determine if their updated locations are beyond the search space, and whale locations beyond the search space are corrected.
- The number of iterations is checked. If the maximum number of iterations has been reached, the algorithm is stopped; otherwise, proceed to step (3) to continue the algorithm.
3. Case Study
3.1. Background of Study Area
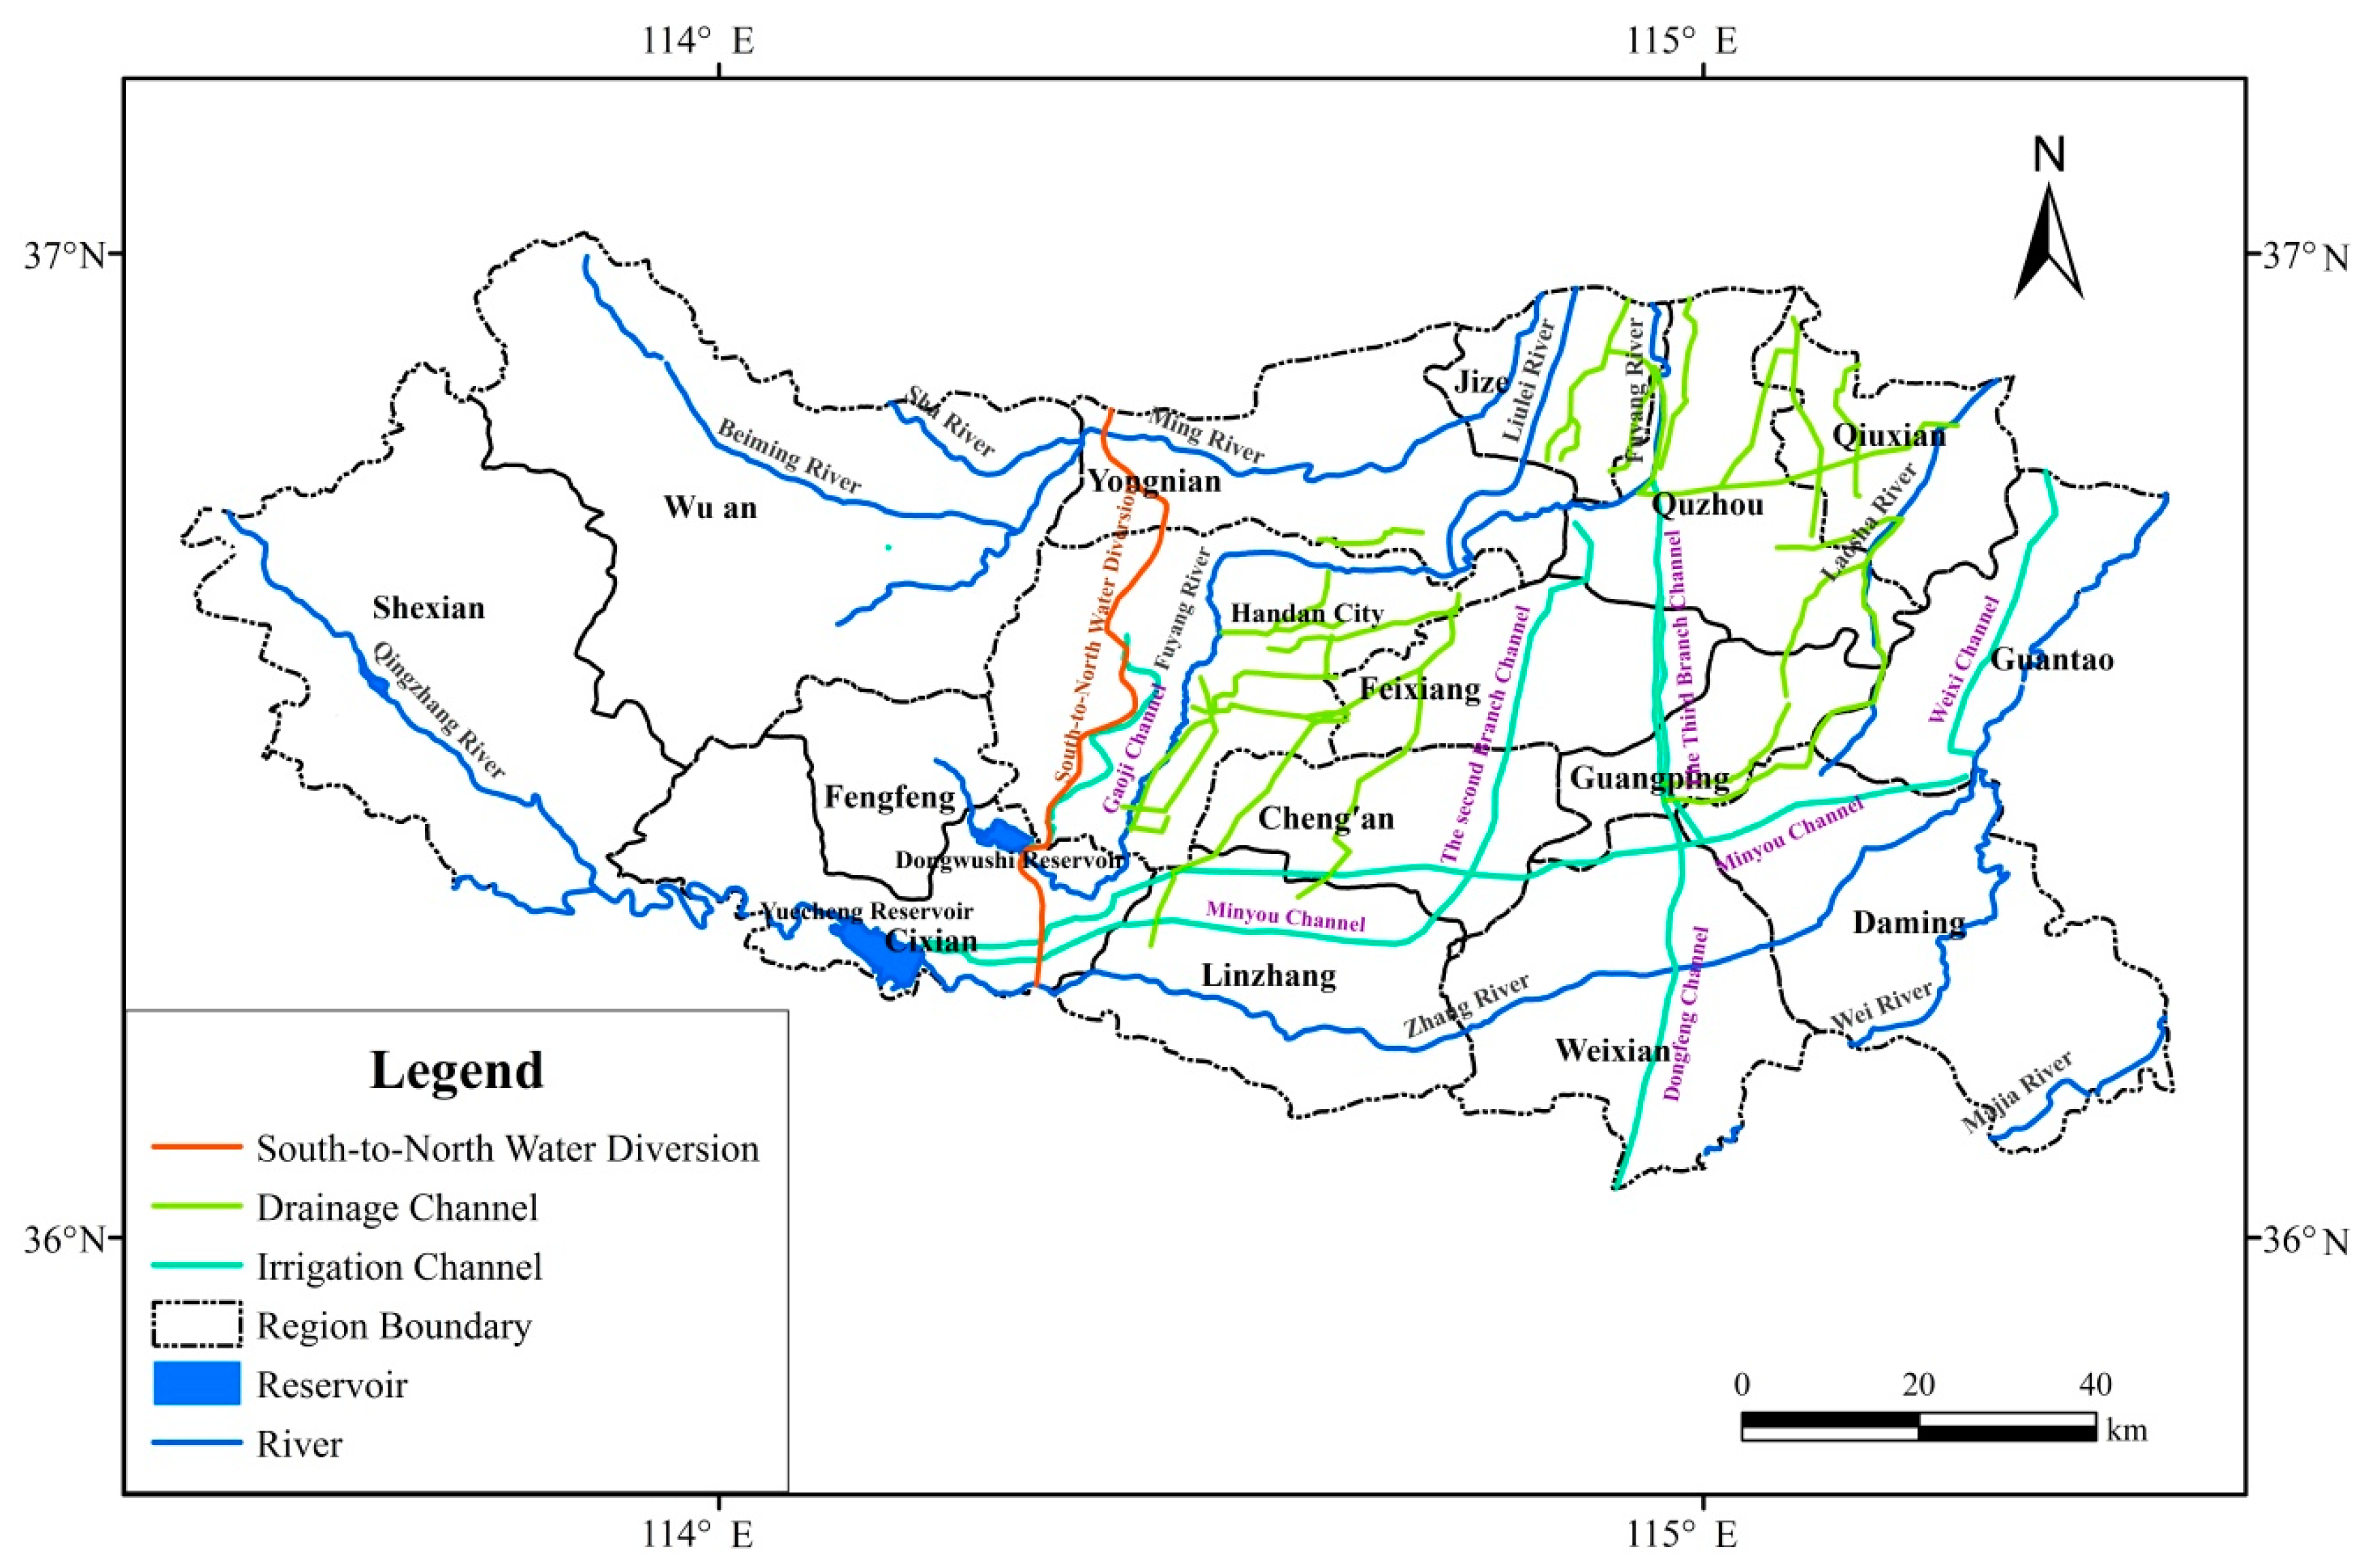
Handan is located in the south of Hebei Province (latitude 36°04′–37°01′ N, longitude 113°28′–115°28′ E), and covers an area of 12,047 km2. Taking 100 m contours as the boundary, the western part is covered by middle to low mountains, hills, and basins over an area of 4460 km2, while the eastern part consists of plains, over an area of 7587 km2. Handan has a temperate semi-humid and -arid continental monsoon climate with an average annual precipitation of 548.9 mm concentrated in June to September. Handan is divided into 16 administrative divisions (Figure 2)—Handan city, Shexian, Wu’an, Fengfeng, Cixian, Yongnian, Quzhou, Jize, Linzhang, Cheng’an, Weixian, Guangping, Feixiang, Daming, Guantao, and Qiuxian.
Handan is a region with water shortages because of insufficient water resources. Average water resources per capita are less than 180 m3, equivalent to only one-twelfth of the national average and far lower than the global average. With the rapid socioeconomic developments in the region, water demand has surged. Reduced precipitation and uneven spatial and temporal distribution of precipitation due to climate change have intensified regional water shortages, which can be alleviated only by over-exploitation of groundwater. Groundwater over-exploitation causes associated levels to drop continuously, and cones of depression to expand. Other severe consequences are scrapped wells, ground subsidence, and earth fissures. To safeguard economic development, apart from the South–North Water Transfer Project, Handan has imported large amounts of water from the Yellow River to alleviate regional water shortages problem. In order to ensure water supply for the public, industry, and ecology, as well as attain maximum socioeconomic benefits, it is necessary to examine how imported water can be rationally utilized and coordinated with the local water supply.
Sources for the water supply in Handan include local surface water, groundwater, recycled water, the Yuecheng reservoir, the Dongwushi reservoir, water transferred through the South–North Water Transfer Project, and water imported from the Yellow River. Medium- and small-scale reservoirs, impoundment, and ponds in the administrative divisions support the local surface water supply. Groundwater refers to the exploitable groundwater in the divisions. Recycled water is the water supply that sewage treatment plants in all divisions can provide. The Yuecheng reservoir and the Dongwushi reservoir are two essential water supply sources in the region. They are responsible mainly for the agricultural, industrial, and ecological water supply in the eastern plain area. In particular, the Yuecheng reservoir supplies water to eight counties, including Cixian, Linzhang, Cheng’an, Weixian, Guangping, Feixiang, Daming, and Guantao, while the Dongwushi reservoir supplies water to Handan city and five counties, namely, Yongnian, Quzhou, Jize, Feixiang, and Qiuxian. Water transferred through the South–North Water Transfer Project is relatively expensive because it is transported over a long distance. According to the project requirements, this water can be used only as domestic and industrial water. It is supplied to Handan city and 12 counties—Cixian, Yongnian, Quzhou, Jize, Linzhang, Cheng’an, Weixian, Guangping, Feixiang, Daming, Guantao, and Qiuxian. Water imported from the Yellow River is sourced through the Dongfeng drainage in the eastern plains, with an average volume of 100 × 106 m3. Due to the water quality, this water source is mainly used as agricultural water and supplements industrial and ecological water. It is supplied to seven counties: Quzhou, Weixian, Guangping, Feixiang, Daming, Guantao, and Qiuxian.
3.2. Optimal Water Resource Allocation Model
According to the characteristics of the Handan water resources system, the region is divided into 16 sub-regions based on administrative divisions. Socioeconomic benefits are selected as objective functions, and are combined with corresponding constraint conditions to establish a regional multi-objective water resource allocation optimization model. Water sources in the region can be classified into public water and independent sources according to the scope of their supplies. Public water sources can supply water to two or more sub-regions simultaneously, like the Yuecheng reservoir, the Dongwushi reservoir, water transferred via the South–North Water Transfer Project, and water imported from the Yellow River. Independent water sources are only capable of supplying water in their own sub-regions (e.g., local surface water, groundwater, and recycled water). Water uses in Handan include those of urban and rural domestic use; primary, secondary, and tertiary sector use; and ecological uses. The primary sector covers agriculture, forestry, livestock farming, and fisheries; the secondary sector comprises industries that produce finished and usable products and construction industries; the tertiary sector includes catering and services.
3.2.1. Objective Functions
• Social benefits target
Since it is difficult to measure social benefits, the least regional water shortage volume is used to represent social benefits indirectly in this study.
where is the water demand of user in sub-region (×106 m3).
• Economic benefits target
Economic benefits are expressed by the maximum sum of net efficiency yielded through the supplies by regional independent and public water sources.
where and denote the water supplies by independent source and public source to user in sub-region (×106 m3), respectively; and are the coefficients of efficiency per unit water supply by independent source and public source to user in sub-region , respectively, (CNY/m3); and are the coefficients of cost per unit water supply by independent source and public source to user in sub-region , respectively (CNY/m3); and denote coefficients of water supply sequence by independent source and public source in sub-region , respectively; and is the coefficient of water supply fairness of user in sub-region .
3.2.2. Constraint Conditions
• Water supply capacity constraints by the water supply system
where and are the available water supplies by independent source and public source in sub-region , respectively.
• Water delivery capacity constraints by the water delivery system
where and denote the maximum water delivery capacities of independent source and public source in sub-region , respectively.
• Users’ water demand constraints
where and are the minimum and maximum water demands of user in sub-region , respectively.
• Non-negative variables
3.3. Water Demand and Supply Forecasting
Taking the situations in 2015 as the status quo, according to the long-term development planning of Handan, the water demand of six user types in the region in 2030 under a guaranteed rate of p = 50% is predicted. The results are presented in Table 1. The prediction was carried out using the quota method. The quotas were determined with reference to Hebei Province Water Use Quota DB13/T 1161-2016 [44]. The upper limit of the water demand of each user in different sub-regions in the target year is taken as the predicated water demand. The lower limit is 80% of the predicted volume.
The available water supply in Handan in 2030 is estimated using the prediction on three types of independent water sources and four types of public water sources. For independent sources, the available water supply forecast on local surface water and groundwater is based on the results of the Second Water Resources Evaluation in Handan [45]. The recycled water is calculated by multiplying the urban domestic and industrial water use volumes by their corresponding sewage conversion factor, followed by the sewage collection factor and then the recycled water conversion factor. For public sources, the available supply by the South–North Water Transfer Project directly uses the results in Supporting Works Plan in Handan for the South–North Water Transfer Project (Middle Line) in Hebei Province [46]. The available supply from water imported from the Yellow River uses the available allocated volume listed in the Proposal for the Yellow River-to-Baiyangdian Water Transfer Project [47]. The available supplies by the Yuecheng reservoir and Dongwushi reservoir are based on research by Wang and Li [48]. The amount of available water supply in Handan is shown in Table 2.
3.4. Model Parameter Determination
3.4.1. Coefficient of Water Supply Efficiency
The efficiency coefficients for domestic and environmental water uses are, in general, difficult to determine. Since domestic water use is given the highest priority, the efficiency coefficients for urban and rural domestic water use are taken as 600 and 500 CNY/m3, respectively. Those for primary sector water use are defined by multiplying the yield increase efficiency by the water allocation coefficient and are assumed to be 10 CNY/m3 in this study. Those for secondary and tertiary sector water use are based on the reciprocals of the water quotas and are 450 and 400 CNY/m3, respectively. To maintain sustainable development, a relatively high value is assigned for the efficiency coefficient for ecological water use; in this study, it is 350 CNY/m3 [49,50].
3.4.2. Coefficient of Water Supply Cost
According to the latest water cost in Handan, the water supply coefficient is defined. The coefficients for urban and rural domestic water use are 3.75 and 1.2 CNY/m3, respectively. The coefficients for primary, secondary, and tertiary sector water use are 0.38, 9.2, and 5.8 CNY/m3, respectively, and 1.8 CNY/m3 for ecological water use.
3.4.3. Coefficient of Water Supply Sequence
The water supply sequence coefficient reflects the water supply priority of water source i in sub-region k, relative to other sources. The priority of each source is converted into a coefficient in the interval, that is, the coefficient of water supply sequence. denotes the water supply order of source i in sub-region k and represents the maximum order in sub-region k. The determination of is based on the following formula [51]:
There are seven types of water supply sources in the Handan water resource allocation optimization model. Different users in each sub-region have different needs for the water supply sequence of these seven sources. First, the supply sequences of these seven sources for different users are determined. Second, the sequence coefficients are calculated using Equation (28). The coefficients for different water users are shown in Table 3.
3.4.4. Coefficient of Water Supply Fairness
The water supply fairness coefficient measures the priority of user j receiving water supply in sub-region k relative to other users. and are similar; both are associated with the water supply sequence of users. First, according to the nature and importance of a user, the corresponding water supply sequence is obtained. Then, the coefficient is determined through the formula for .
According to the water supply sequence, the supply order for urban domestic, rural domestic, secondary sector, tertiary sector, ecological, and primary sector water uses are 1, 2, 3, 4, 5, and 6, respectively. Using Equation (28), the fairness coefficients for urban domestic, rural domestic, secondary sector, tertiary sector, ecological, and primary sector water uses are 0.29, 0.24, 0.19, 0.14, 0.10, and 0.05, respectively.
4. Results and Discussions
4.1. Results Analysis
The AWOA is employed to solve the Handan water resource allocation optimization model. The initialization swarm size is 150 and there are 180 iterations. There are 20 runs, and each run starts with a different random initialization swarm. Through numerous simulation experiments, the maximum and minimum inertia weights of the AWOA are finally determined to be and , respectively.
The aforementioned parameters are entered into the MATLAB (MATLAB 9.0, R2016a, MathWorks, Natick, MA, USA) for solving in order to obtain the Pareto front. Nine solutions are included on the Pareto front, as shown in Table 4. The Pareto optimal solution set cannot explain further how to choose a scenario as the final decision on the Pareto front. For any non-inferior solution of multi-objective models, there is no other possibility that the two objective function values corresponding to the non-inferior solutions can be improved from the two objective functions corresponding to other non-inferior solutions. Policymakers can sacrifice only one goal in a certain range in return for another goal improvement. They show their preferences in the alternative tradeoff between such goals. After one operation, a number of Pareto optimal solutions are obtained under the AWOA, which results in higher solution efficiency, and provides greater choices for policymakers. Table 4 shows that if there is a special preference for the minimum amount of water, we can choose scenario 1; if there is a special preference for the best economic benefits, we can choose scenario 9; and if we consider the minimum amount of water shortage and the best economic benefits, we can choose one of the scenarios from 2 to 8. As there is a serious shortage of water resources in Handan, meeting the water demand of different water sectors is an urgent challenge, which must be solved to improve current water resources management. Thus, scenario 1 better reflects the fairness of water consumption among different households. Therefore, it is chosen as an effective scenario, and this study analyzes it in detail.
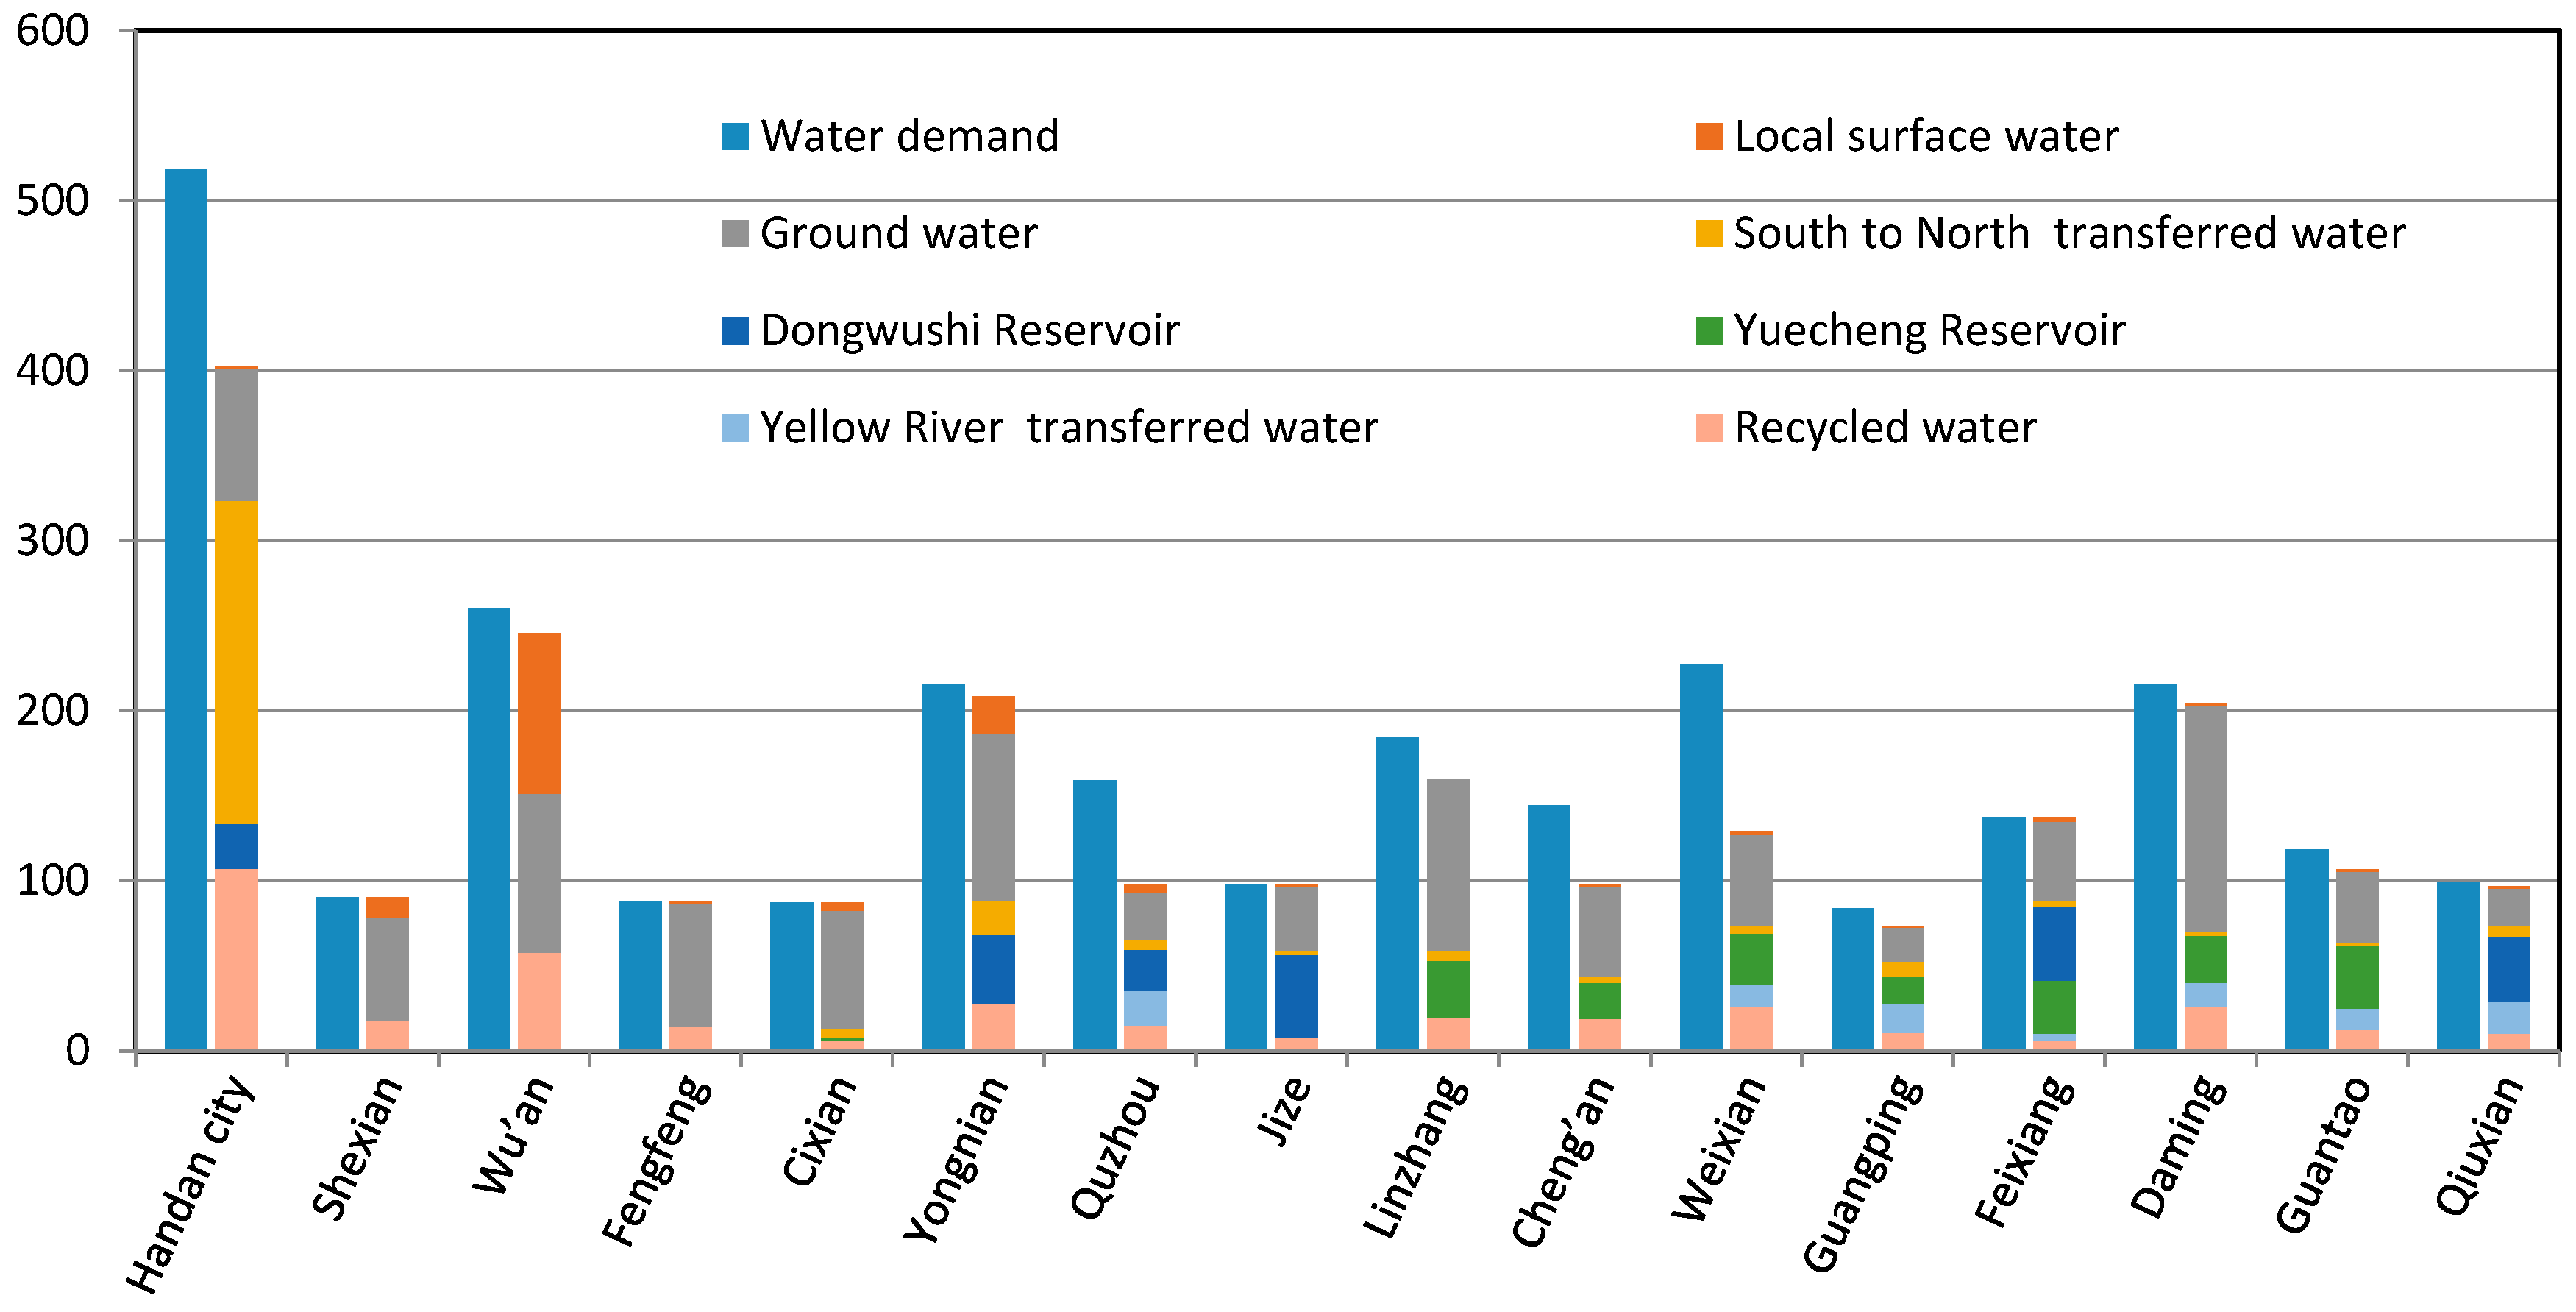
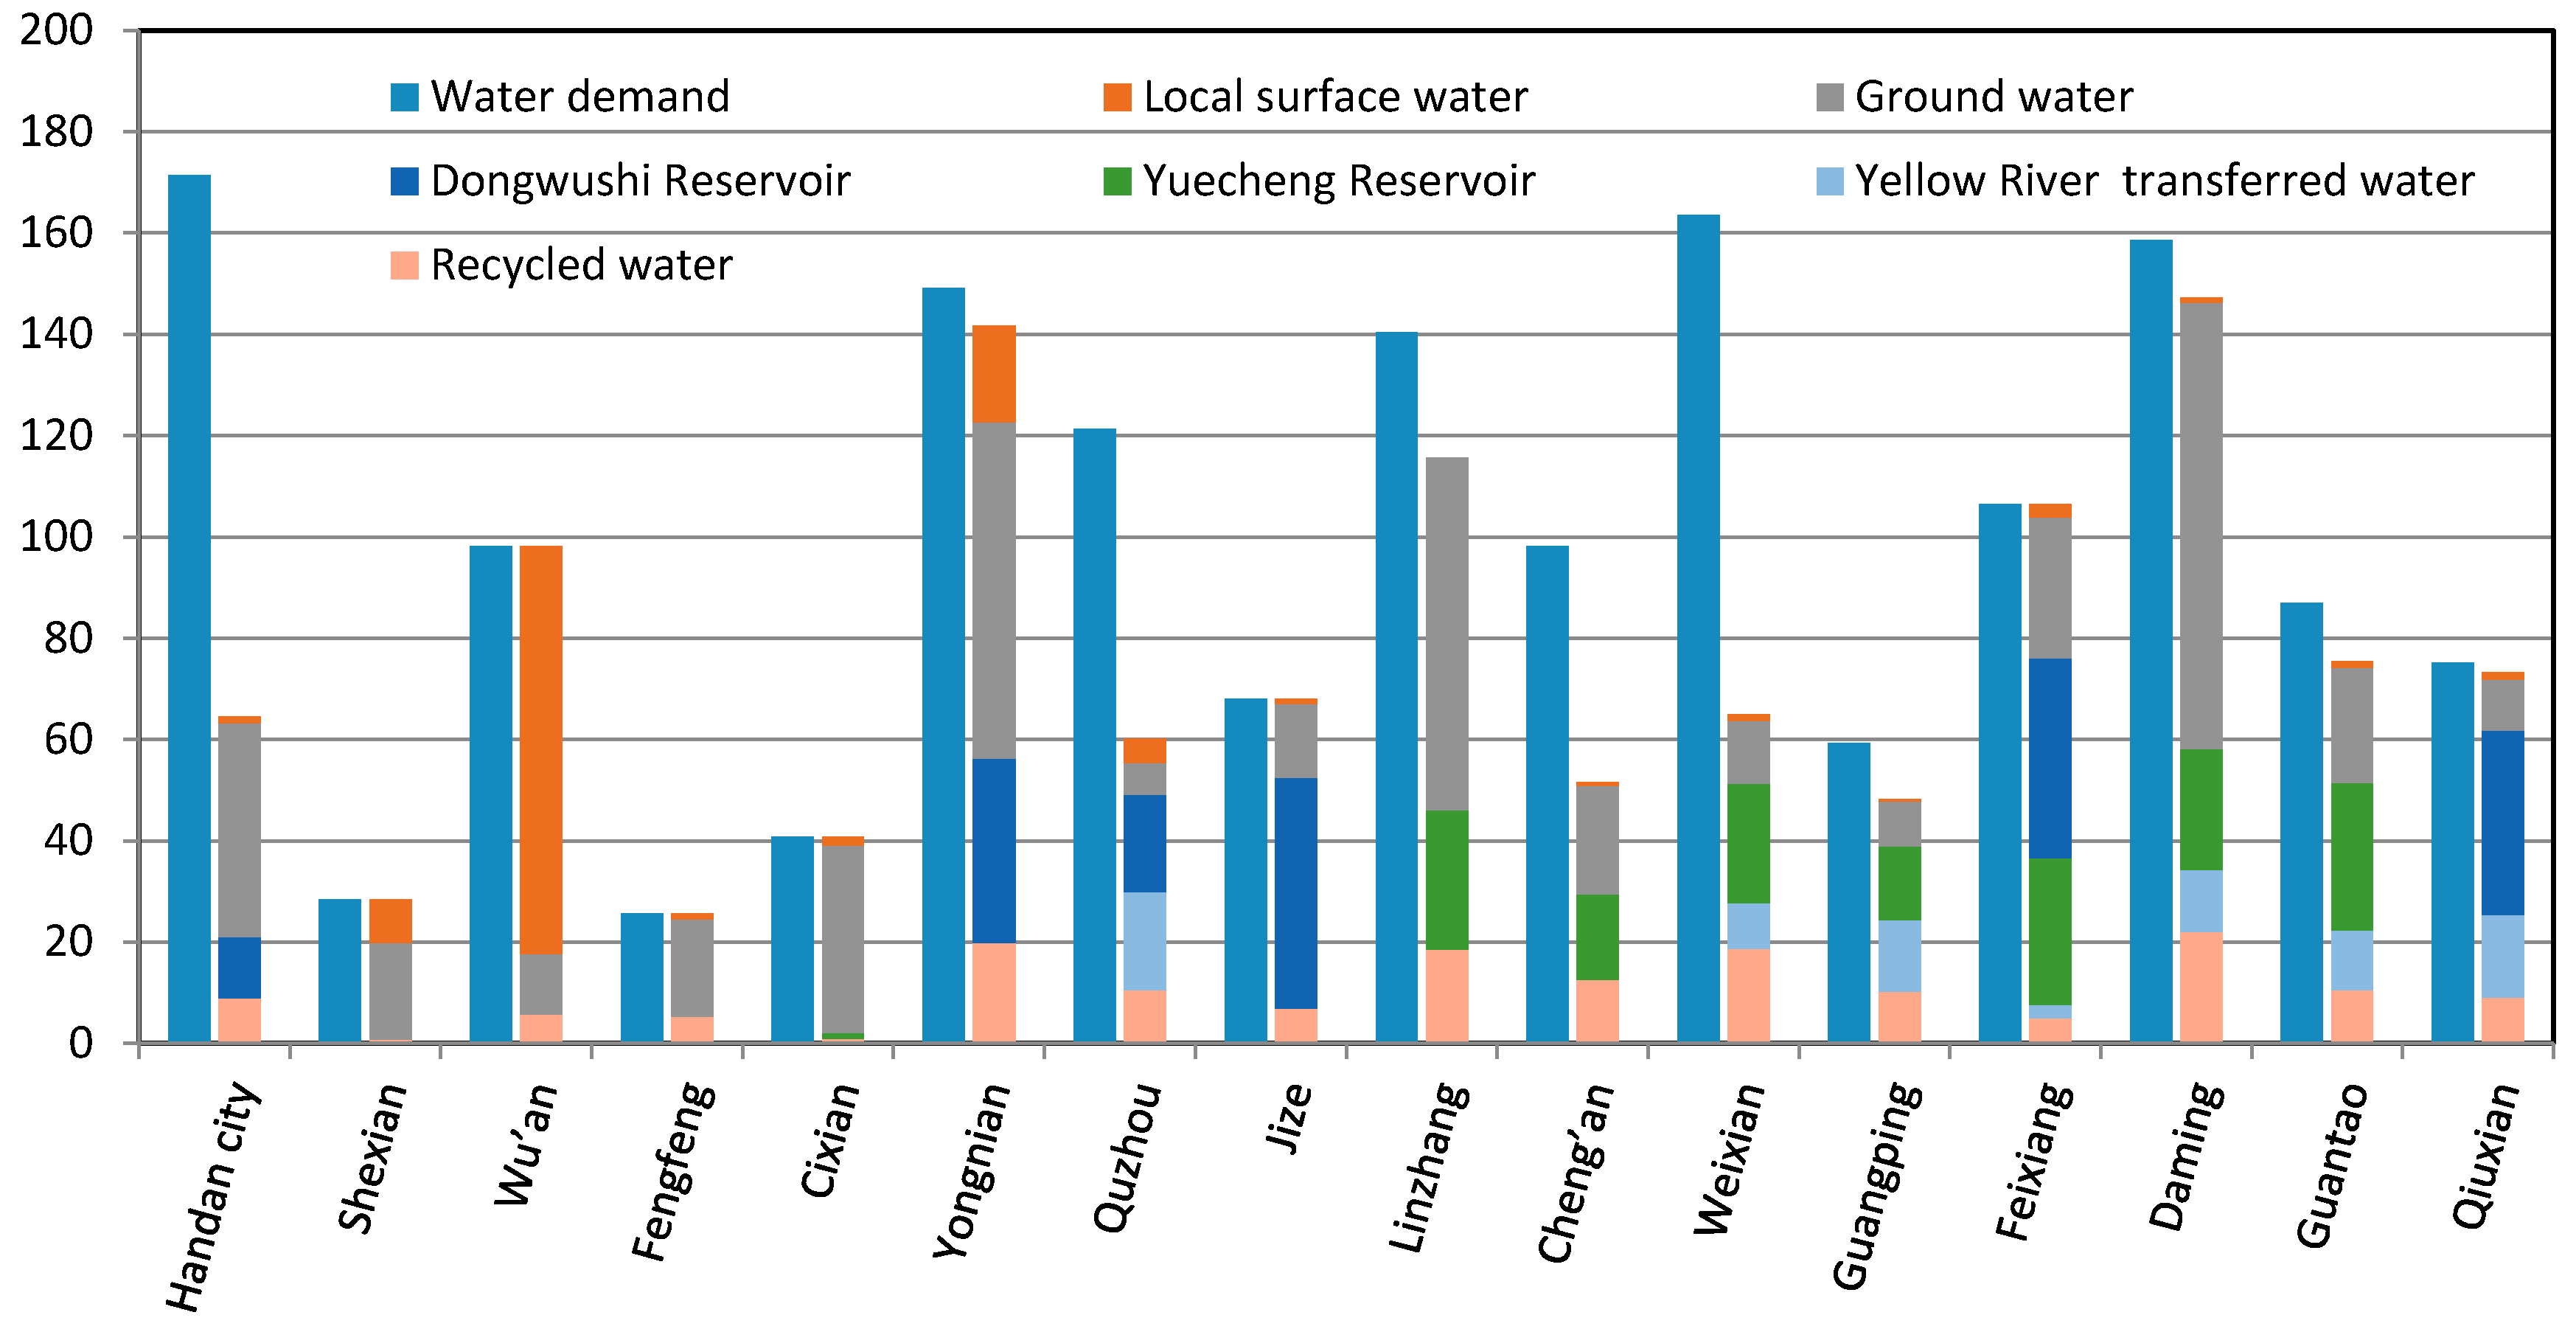
The optimal water resource allocation results in each sub-region in Handan are shown in Figure 3. The total water demand for all users in the region is 2726.08 × 106 m3, and the total allocated volume is 2321.74 × 106 m3, resulting in a total water shortage of 404.34 × 10⁶ m3 and a shortage rate of 14.8%. The four sub-regions with relatively high shortage rates are Weixian, Quzhou, Cheng’an, and Handan city, with rates of 43.3%, 38.5%, 32.4%, and 22.3%, respectively. In Shexian, Fengfeng, Cixian, Jize, and Feixiang, the allocated volume can meet the water demand, and there is no water shortage. The allocated volumes by local surface water, groundwater, water transferred through the South–North Water Transfer Project, the Dongwushi reservoir, the Yuecheng reservoir, imported water from the Yellow River, and recycled water in Handan are 153.06 × 10⁶ m3, 1007.32 × 106 m3, 259.11 × 10⁶ m3, 221.79 × 10⁶ m3, 197.56 × 10⁶ m3, 100.00 × 10⁶ m3, and 382.90 × 10⁶ m3, respectively. They account for 6.6%, 43.4%, 11.2%, 9.6%, 8.5%, 4.3%, and 16.5%, respectively, of the total water allocation in the region. It is noteworthy that groundwater resources are the main water source of Handan.
Figure 4 illustrates the urban domestic water allocation in each sub-region in Handan. The total urban domestic water demand is 387.16 × 10⁶ m3 while the total allocated volume is 387.16 × 10⁶ m3. The water supply can fully satisfy the urban domestic water demand in all sub-regions. The water demand is mainly supported by groundwater and water transferred through the South–North Water Transfer Project, the allocated volumes of which are 263.07 × 10⁶ m3 and 124.09 × 10⁶ m3, respectively, accounting for 67.9% and 32.1%, respectively, of the total supply. It is noteworthy that groundwater is the dominant water source for urban domestic water demand.
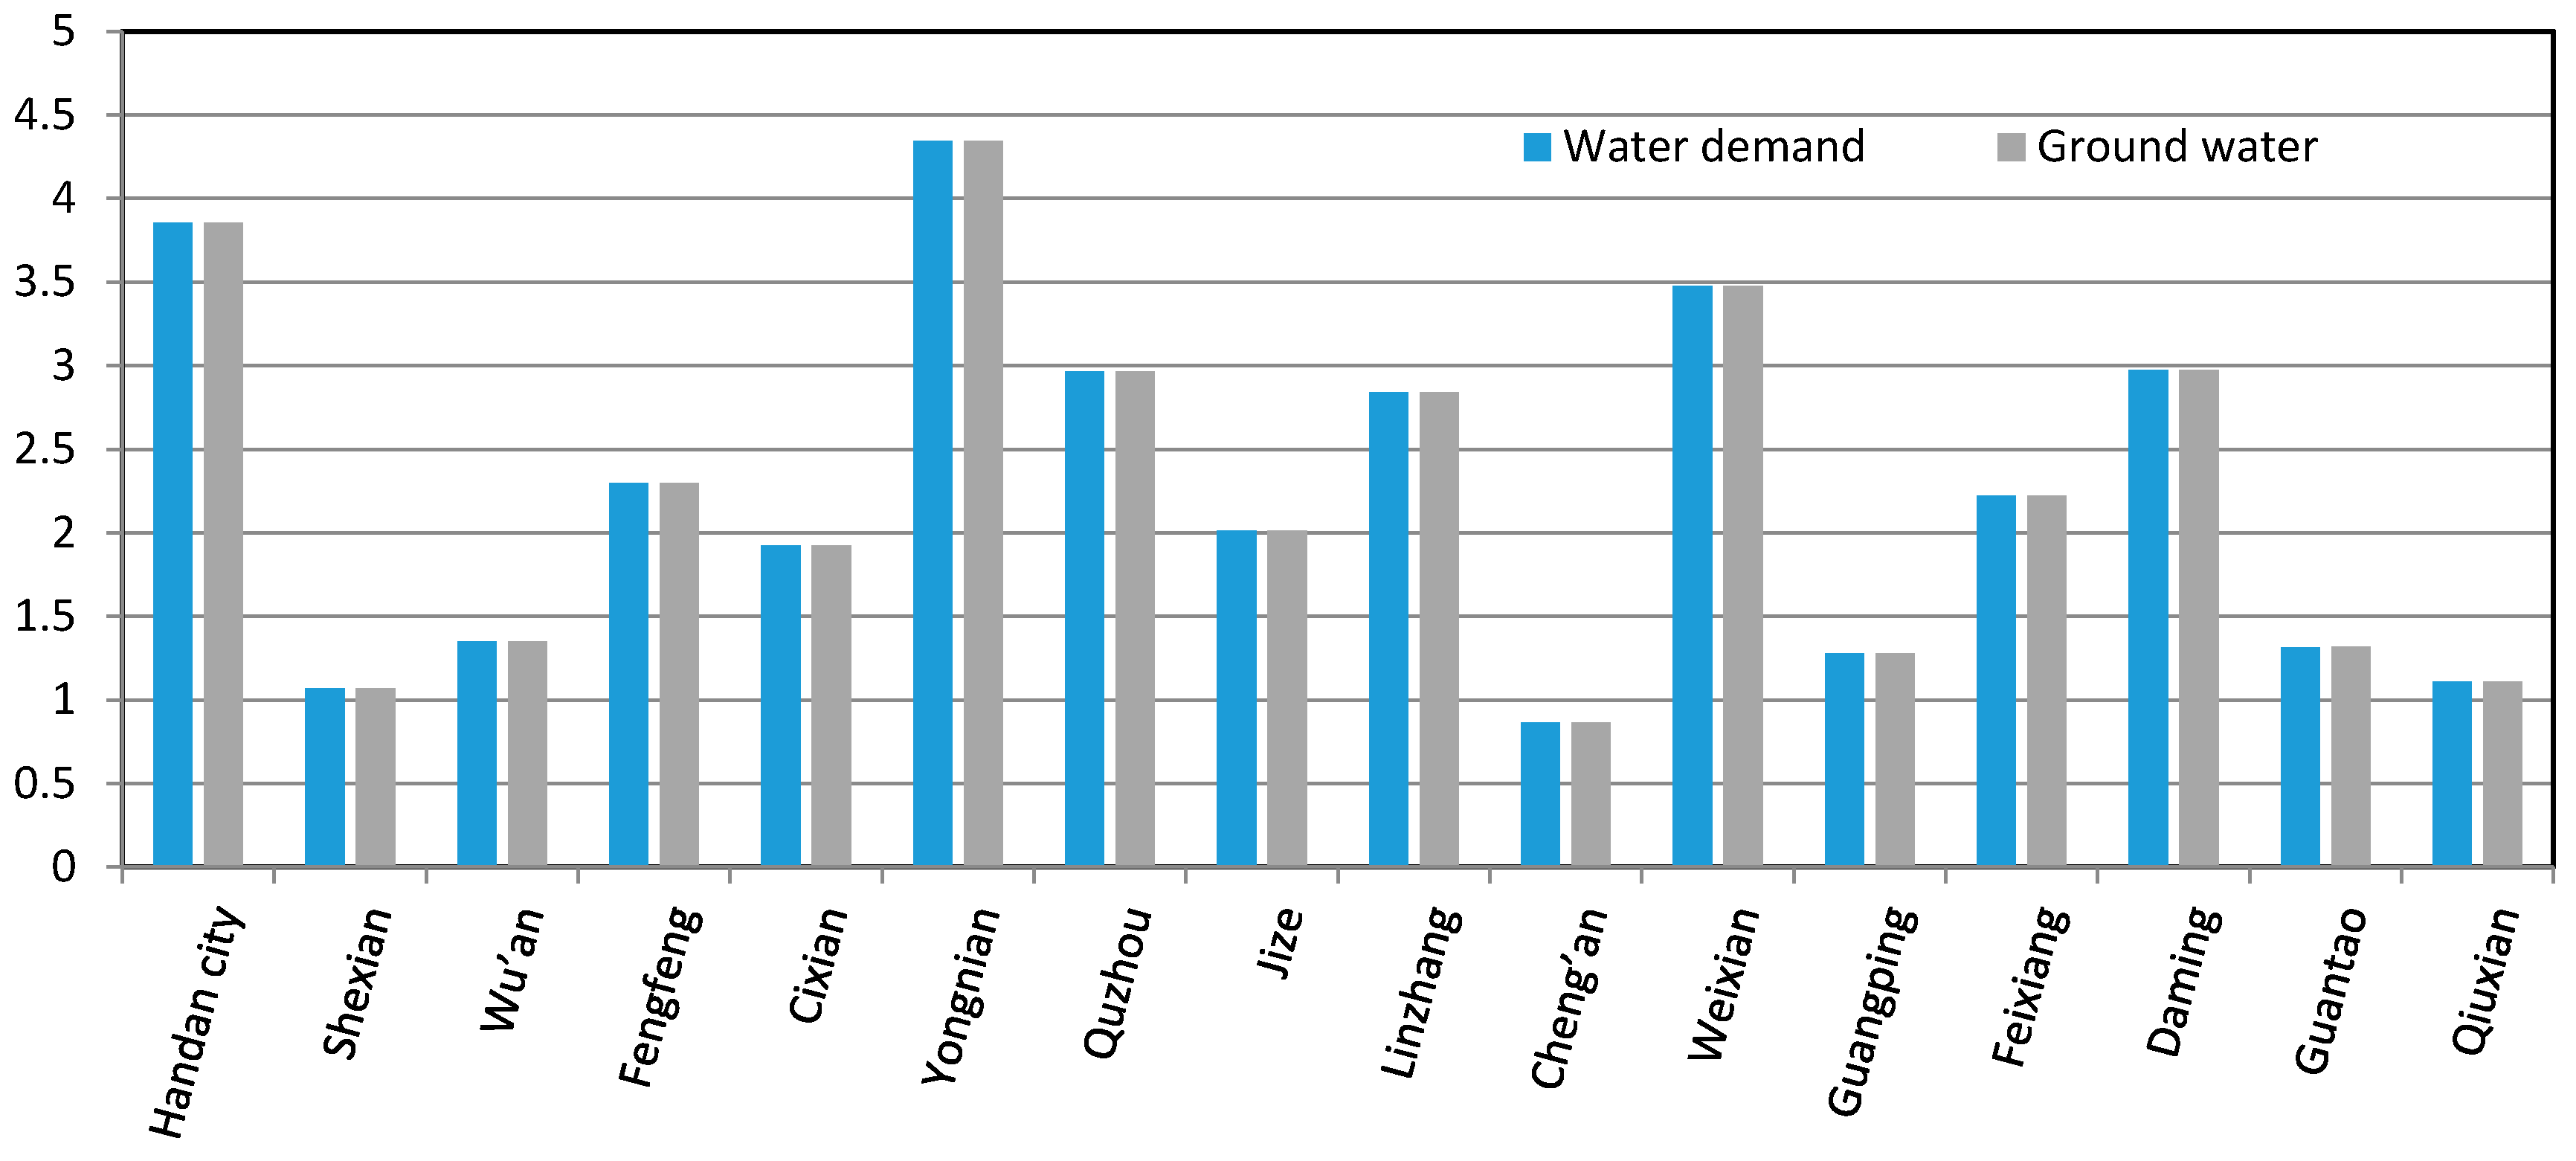
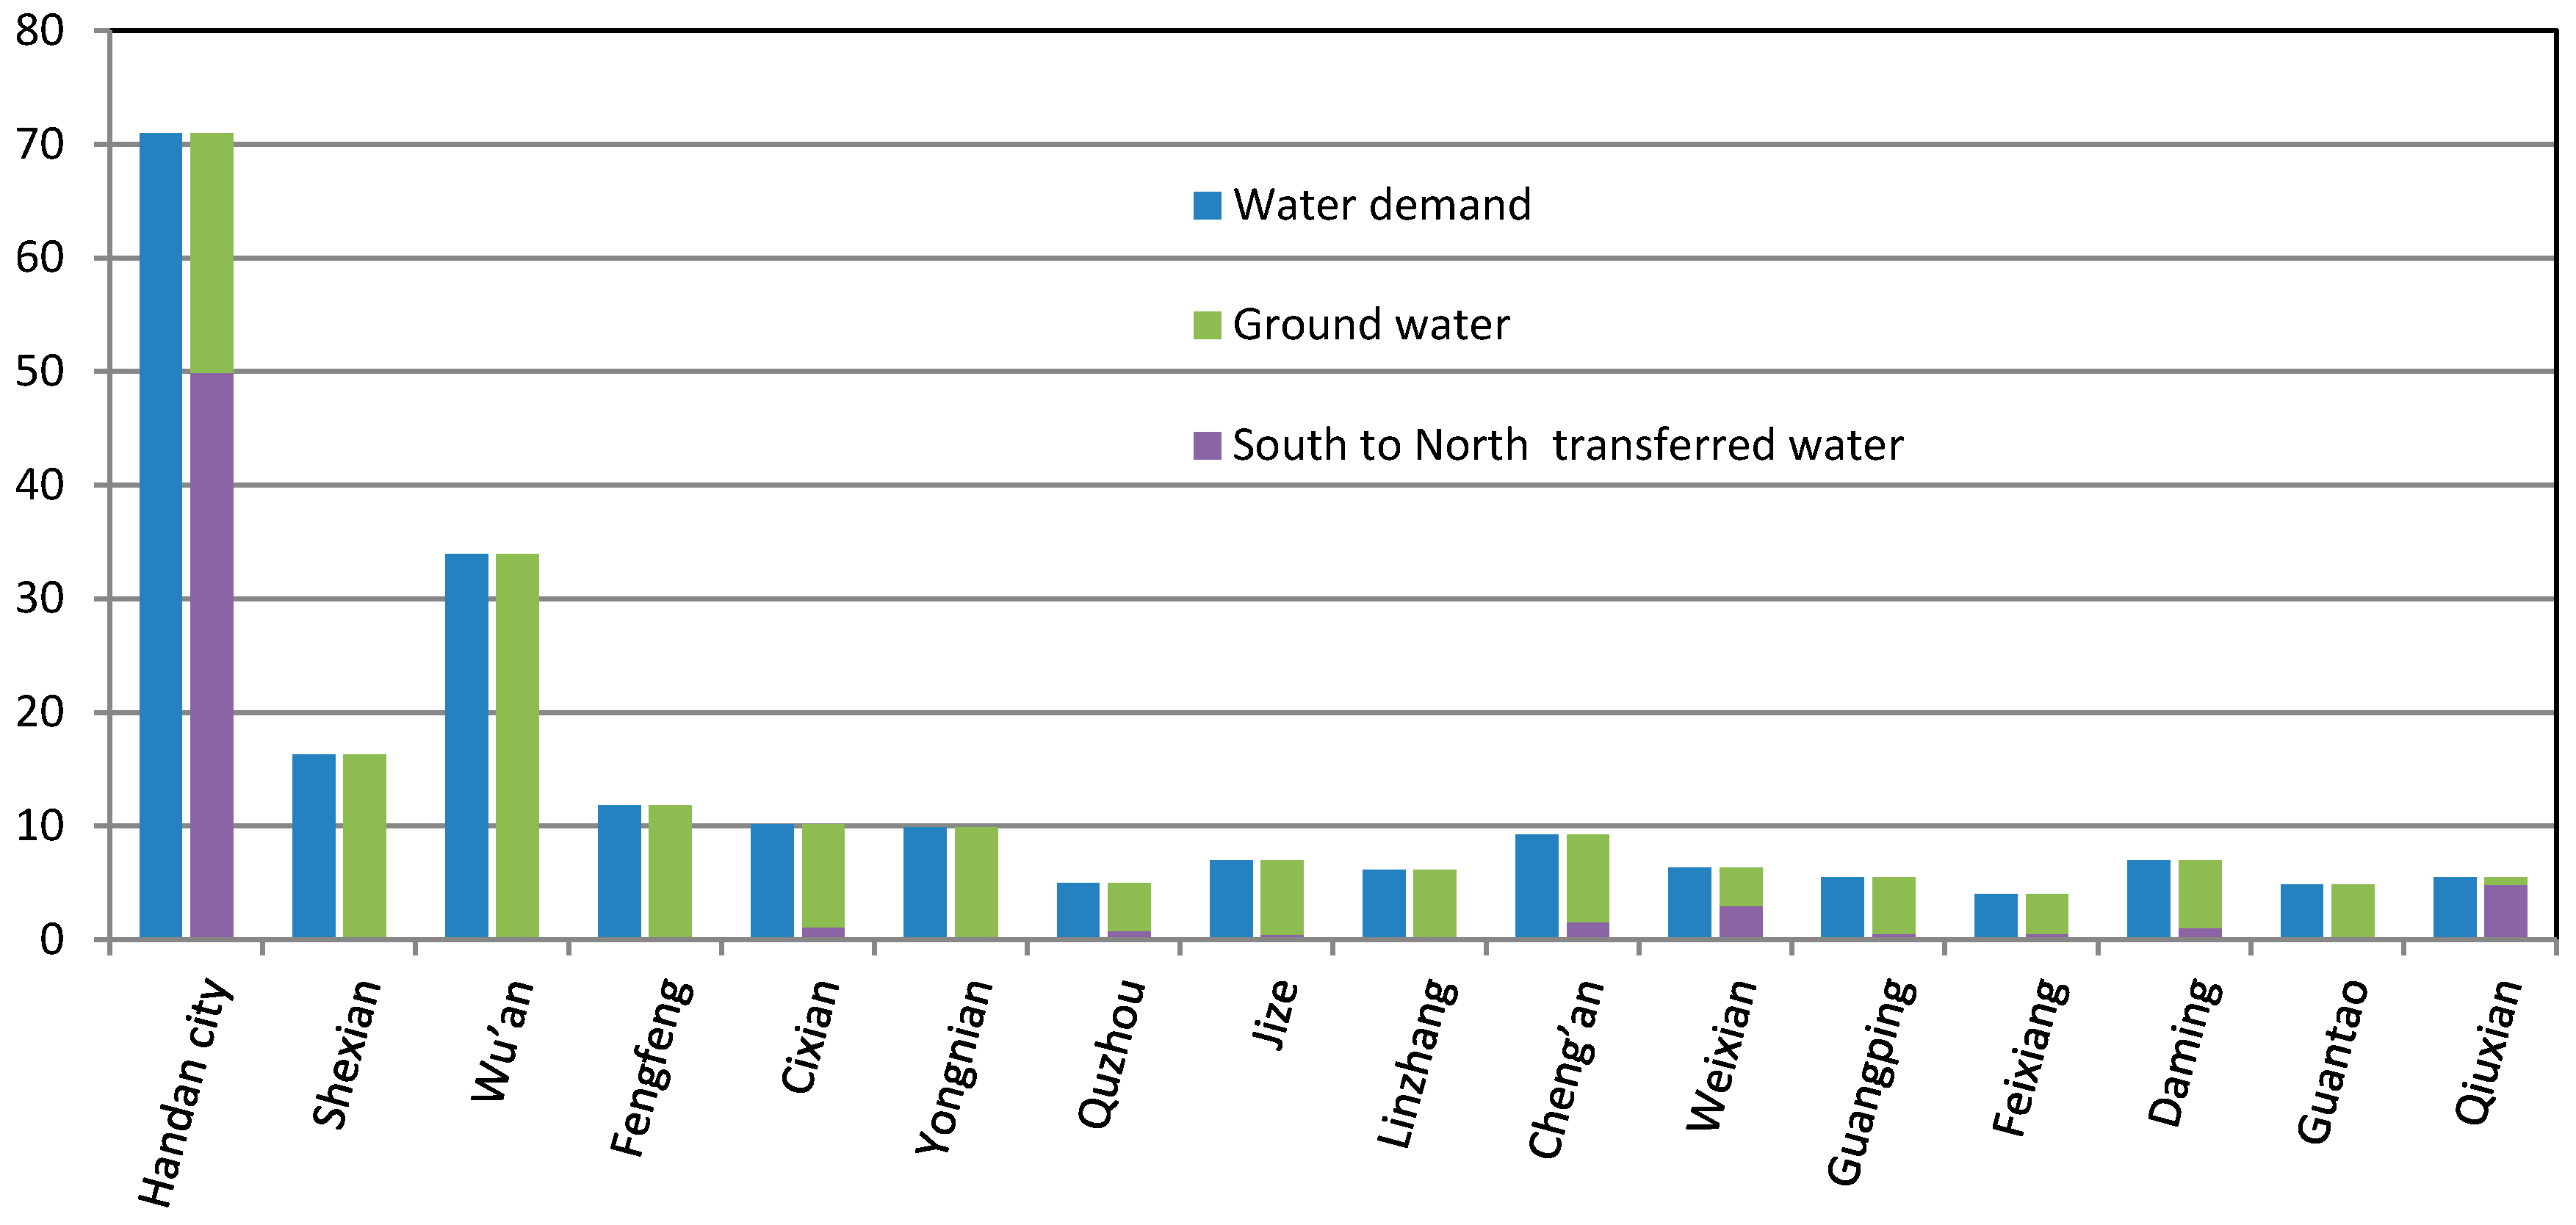
Figure 5 gives the rural domestic water allocation in each sub-region in Handan. The rural domestic water supply is able to meet the demand in all sub-regions. The total rural domestic water demand is 35.91 × 10⁶ m3 while the total allocated volume is 35.91 × 10⁶ m3, supported wholly by groundwater.
Figure 6 shows the primary sector water allocation in each sub-region in Handan. The total water demand of the primary sector in the region is 1591.82 × 106 m3, whereas the total allocated volume is 1210.66 × 106 m3, with a shortage of 381.15 × 10⁶ m3, and an average shortage rate of 23.9%. The four sub-regions with relatively great shortages are Handan city, Weixian, Quzhou, and Cheng’an and their shortage rates are 62.4%, 60.3%, 50.4%, and 47.5%, respectively. In Shexian, Wu’an, Fengfeng, Cixian, Jize, and Feixiang, water supply can meet the primary sector water demand. The allocated volume supported by local surface water, groundwater, the Dongwushi reservoir, the Yuecheng reservoir, imported water from the Yellow River, and recycled water are 127.18 × 10⁶ m3, 477.69 × 10⁶ m3, 189.08 × 10⁶ m3, 165.70 × 10⁶ m3, 85.83 × 10⁶ m3, and 165.19 × 10⁶ m3, respectively, accounting for 10.5%, 39.5%, 15.6%, 13.7%, 7.1%, and 3.6% of the total supply, respectively. Again, groundwater is the main water source for the primary sector.
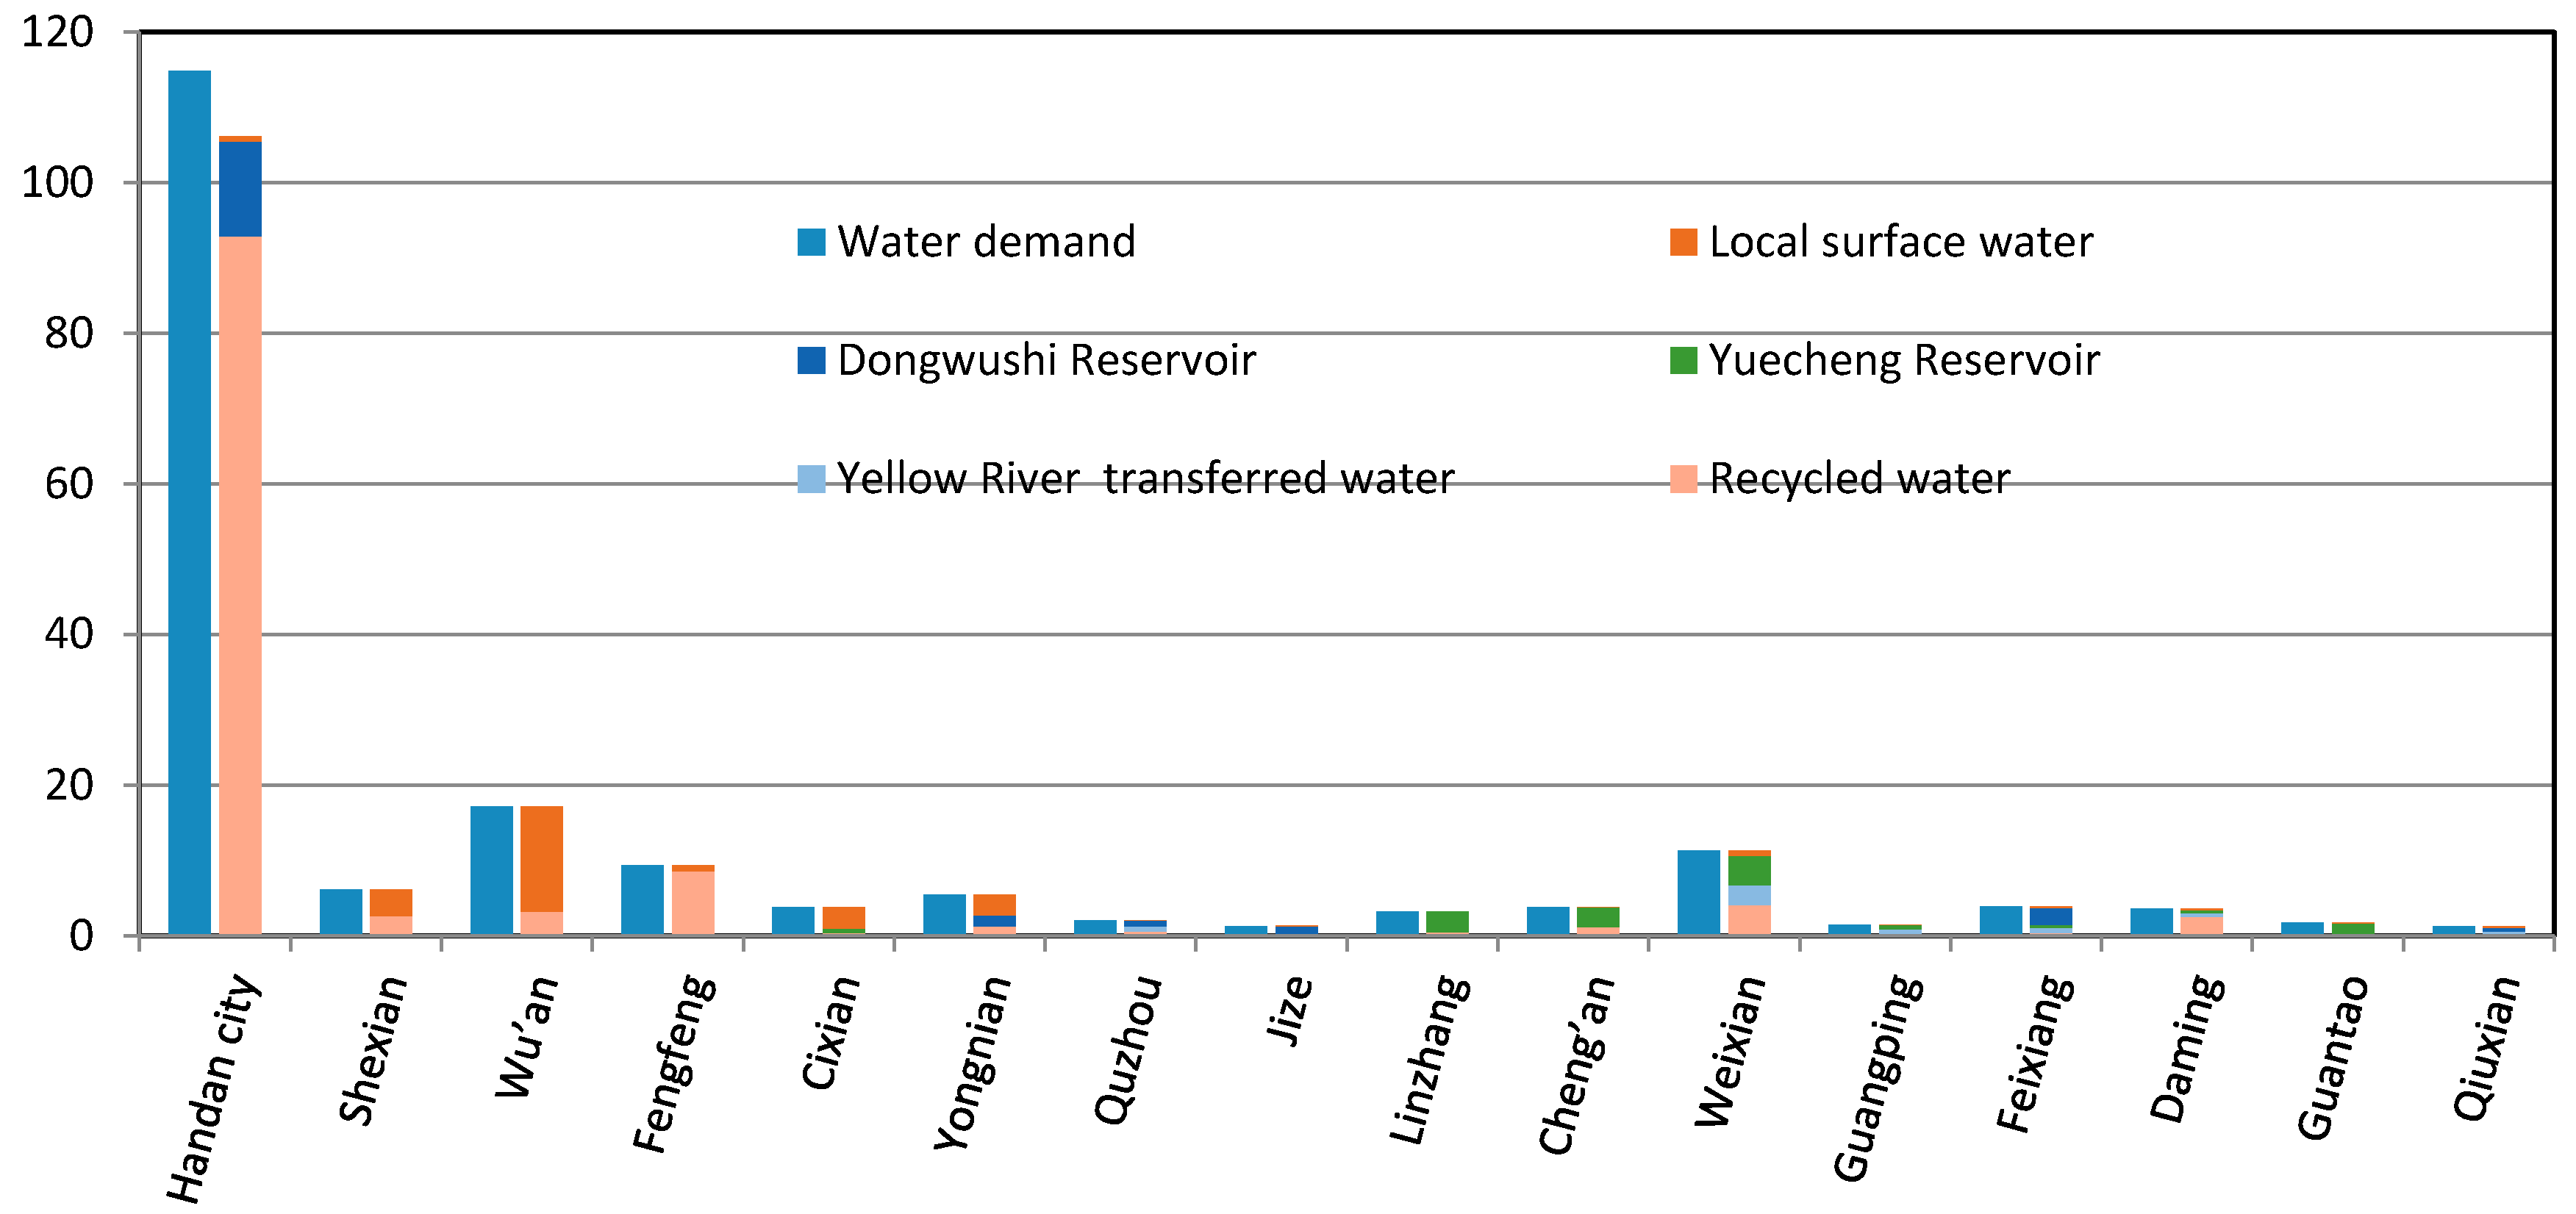
The secondary sector water allocation in each sub-region in Handan is shown in Figure 7. The total water demand of the secondary sector is 307.06 × 10⁶ m3, and the total allocated volume is 292.60 × 10⁶ m3, leading to a shortage of 14.46 × 10⁶ m3, and an average shortage rate of 4.7%. In all sub-regions except Wu’an, the supply meets the demand. In Wu’an, the demand is 71.00 × 10⁶ m3, and the allocated volume is 56.54 × 10⁶ m3. There is a shortage of 14.46 × 10⁶ m3. Water sources for the secondary sector water supply include groundwater, water transferred through the South–North Water Transfer Project, the Dongwushi reservoir, the Yuecheng reservoir, imported water from the Yellow River, and recycled water. Their allocated volumes are 81.02 × 10⁶ m3, 71.26 × 10⁶ m3, 14.03 × 10⁶ m3, 19.35 × 10⁶ m3, 8.40 × 10⁶ m3, and 98.55 × 10⁶ m3, and contribute to total supply by 26.4%, 23.2%, 4.6%, 6.3%, 2.7%, and 32.1%, respectively. The main water source for the secondary sector is recycled water.
Figure 8 shows the tertiary sector water allocation in each sub-region in Handan. As shown in Figure 8, the total water demand and allocated volume are 213.41 × 10⁶ m3 and 213.41 × 10⁶ m3, respectively. In all sub-regions, the supply can satisfy the demand. The tertiary sector water demand is wholly supported by groundwater and water transferred through the South–North Water Transfer Project, the supplies of which are 8.40 × 10⁶ m3 and 98.55 × 10⁶ m3, respectively, and account for 70.1% and 29.9% of the total, respectively. Groundwater is the dominant water source for the tertiary sector.
Figure 9 shows the ecological water allocation in each sub-region in Handan. The total water demand and total allocated volume are 190.72 × 10⁶ m3 and 182.00 × 10⁶ m3, respectively. The shortage is 8.72 × 10⁶ m3, and the shortage rate is 4.6%. In all sub-regions, except Handan city, the supply can satisfy the demand. In Handan city, the demand is 114.84 × 10⁶ m3, while the allocated volume is 106.12 × 10⁶ m3, resulting in a deficiency of 8.72 × 10⁶ m3. The supplies by local surface water, the Dongwushi reservoir, the Yuecheng reservoir, imported water from the Yellow River, and recycled water are 25.88 × 10⁶ m3, 18.68 × 10⁶ m3, 12.50 × 10⁶ m3, 5.77 × 10⁶ m3, and 119.17 × 10⁶ m3, respectively, accounting for 14.2%, 10.3%, 6.9%, 3.2%, and 65.5%, respectively, of the total. Recycled water is the main source for the ecological water demand.
Table 5 lists the volumes of local surface water allocated to each user in each sub-region in Handan. Due to the water quality, local surface water is allocated only to the primary sector and ecology. The corresponding allocated volumes are 127.18 × 10⁶ m3 and 25.88 × 10⁶ m3, respectively, and the total is 153.06 × 10⁶ m3. Since the total available water supply by local surface water in the region is 236.58 × 10⁶ m3, 83.52 × 10⁶ m3 of water not utilized. From Figure 6 and Figure 9, local surface water accounts for 10.5% and 14.2% of the total volumes allocated to the primary sector and ecology, respectively. In Wu’an, the highest volumes of local surface water are allocated to the primary sector and ecology. The corresponding volumes are 80.68 × 10⁶ m3 and 13.93 × 10⁶ m3, which account for 63.4% and 53.8%, respectively, of the total volumes of local surface water allocated. This is because Wu’an has abundant local surface water, or 48.6% of the total in Handan.
Table 6 shows the volumes of groundwater allocated to each user in each sub-region in Handan. Groundwater is allocated to urban domestic, rural domestic, primary sector, secondary sector, and tertiary sector uses in volumes of 263.07 × 10⁶ m3, 35.91 × 10⁶ m3, 477.69 × 10⁶ m3, 81.02 × 10⁶ m3, and 149.63 × 10⁶ m3, respectively. These account for 26.1%, 3.6%, 47.4%, 8.0%, and 14.9% of the total volume of groundwater allocated, respectively. Groundwater is mostly supplied to the primary sector. This is in line with actual local groundwater usage. The total available water supply by groundwater and total allocated volume are 1130.42 × 106 m3 and 1007.32 × 106 m3, respectively. There is 123.10 × 10⁶ m3 of unallocated water remaining.
The allocation results of water transferred through the South–North Water Transfer Project to each user in each sub-region in Handan are listed in Table 7. The transferred water is mostly supplied for urban domestic, secondary, and tertiary sector uses. The total available water supply and total allocated volumes are 388.62 × 10⁶ m3 and 259.11 × 10⁶ m3, respectively, resulting in a surplus of 129.51 × 10⁶ m3 not allocated for any use. The allocated volumes for urban domestic, secondary, and tertiary sector uses are 124.09 × 10⁶ m3, 71.26 × 10⁶ m3, and 63.77 × 10⁶ m3, respectively. These account for 47.9%, 27.5%, and 24.6%, respectively, of the total allocated volume of water transferred through the South–North Water Transfer Project. The transferred water is mainly supplied for urban domestic use, since its quality is relatively high and consequently, it is able to fulfill the quality requirements for urban domestic water.
The total available water supply by the Dongwushi reservoir and the total allocated volume are both 221.79 × 10⁶ m3, signifying that the total available supply is completely allocated for different uses. The results are listed in Table 8. The Dongwushi reservoir is a public water source and mainly supplies water to Handan city, Yongnian, Quzhou, Jize, Feixiang, and Qiuxian. The Dongwushi reservoir mostly supports the primary and secondary sector and ecological water uses. From Table 8, the allocated volumes to the primary sector, secondary sector, and ecology are 189.08 × 10⁶ m3, 14.03 × 10⁶ m3, and 18.68 × 10⁶ m3, respectively, accounting for 85.3%, 6.3%, and 8.4%, respectively, of the total allocated volume from the Dongwushi reservoir. Most of the water from the reservoir is supplied to the primary sector because the water quality is not high enough to satisfy domestic requirements, but is suitable for irrigation in the primary sector. The allocation results are consistent with the current allocation situation of the reservoir.
The Yuecheng reservoir is a public water source mainly supplied to Cixian, Linzhang, Cheng’an, Weixian, Guangping, Feixiang, Daming, and Guantao. The main users are primary sector, secondary sector, and ecology. The allocation results are shown in Table 9. The total available water supply equals the total allocated volume, which is 197.56 × 10⁶ m3. Thus, the total available supply is completely allocated. The volumes allocated to the primary sector, secondary sector, and ecology are 165.70 × 10⁶ m3, 19.35 × 10⁶ m3, and 12.50 × 10⁶ m3, respectively. These account for 83.9%, 9.8%, and 6.3% of the total allocated volume, respectively, indicating that the main user of the Yuecheng reservoir is the primary sector.
Imported water from the Yellow River is a public water source. The imported water is mainly supplied to Quzhou, Weixian, Guangping, Feixiang, Daming, Guantao, and Qiuxian. It is mostly allocated for the primary sector, secondary sector, and ecological uses. From Table 10, the allocated volumes to the primary sector, secondary sector, and ecology are 85.83 × 10⁶ m3, 8.40 × 10⁶ m3, and 5.77 × 10⁶ m3, respectively, accounting for 85.8%, 8.4%, and 5.8%, respectively, of the total allocated volume of 100.00 × 10⁶ m3. All imported water is allocated completely, and mostly to the primary sector.
The allocation results for recycled water in Handan are listed in Table 11. Recycled water is mostly allocated to the primary sector, secondary sector, and ecology in volumes of 165.19 × 10⁶ m3, 98.55 × 10⁶ m3, and 119.17 × 10⁶ m3, respectively. These account for 43.1%, 25.7%, and 31.1% of the total allocated volume, respectively. The total available supply by recycled water is 421.75 × 10⁶ m3 and the total allocated volume is 382.90 × 10⁶ m3, resulting in a surplus of 38.85 × 10⁶ m3 not utilized.
In Handan, the total water demand of all users, the total available water supply, and the total allocated volume are 2726.07 × 106 m3, 2696.71 × 106 m3, and 2321.74 × 106 m3, respectively. There is a surplus of 374.97 × 10⁶ m3 not allocated, and the volumes are listed in Table 12. Water from the Dongwushi reservoir, Yuecheng reservoir, and water imported from the Yellow River are fully allocated for different uses. Moreover, 83.52 × 10⁶ m3 of local surface water, 123.10 × 10⁶ m3 of groundwater, 129.51 × 10⁶ m3 of water transferred through the South–North Water Transfer Project, and 38.84 × 10⁶ m3 of recycled water are not used. In five sub-regions, namely, Shexian, Fengfeng, Cixian, Jize, and Feixiang, the allocated volume can completely satisfy the water demand, and there is a surplus of 223.23 × 10⁶ m3 of water. In Handan city, the water demand of the primary sector and ecology are not satisfied, while that of other users is entirely met. In Handan city, 106.30 × 10⁶ m3 of water transferred through the South–North Water Transfer Project is not utilized. Since the water transferred can only be allocated to urban domestic, secondary sector, or tertiary sector uses, the surplus cannot be used to make up the shortage in the primary sector and ecology. In Wu’an, the water demand of the secondary sector is not satisfied while that of other users is fully met. Although 20.29 × 10⁶ m3 of local surface water remains unutilized, it cannot supplement the insufficient supply to the secondary sector, as the local surface water is supplied only to the primary sector and ecology. In Yongnian, Quzhou, Linzhang, Cheng’an, Weixian, Guangping, Daming, Guantao, and Qiuxian, the water demand of the primary sector is not satisfied. The surplus in these nine sub-regions consists solely of water transferred through the South–North Water Transfer Project. Due to the relatively high cost of the transferred water, it cannot be used to make up the shortage in the primary sector. Lastly, 9.91 × 10⁶ m3 of groundwater is not utilized in Weixian and Guangping.
4.2. Comparison with WOA and PSO
In order to test and verify the performance of the AWOA, the WOA and PSO algorithms are employed to solve the model. The results by the three algorithms are compared and analyzed. To ensure a fair comparison, all the parameters are set the same in the AWOA, WOA, and PSO algorithms. The initialization swarm size is 150, and there are 180 iterations. There are 20 runs and each run starts with a different random initialization swarm. Through numerous simulation experiments, other parameters in PSO are as follows: , , , and .
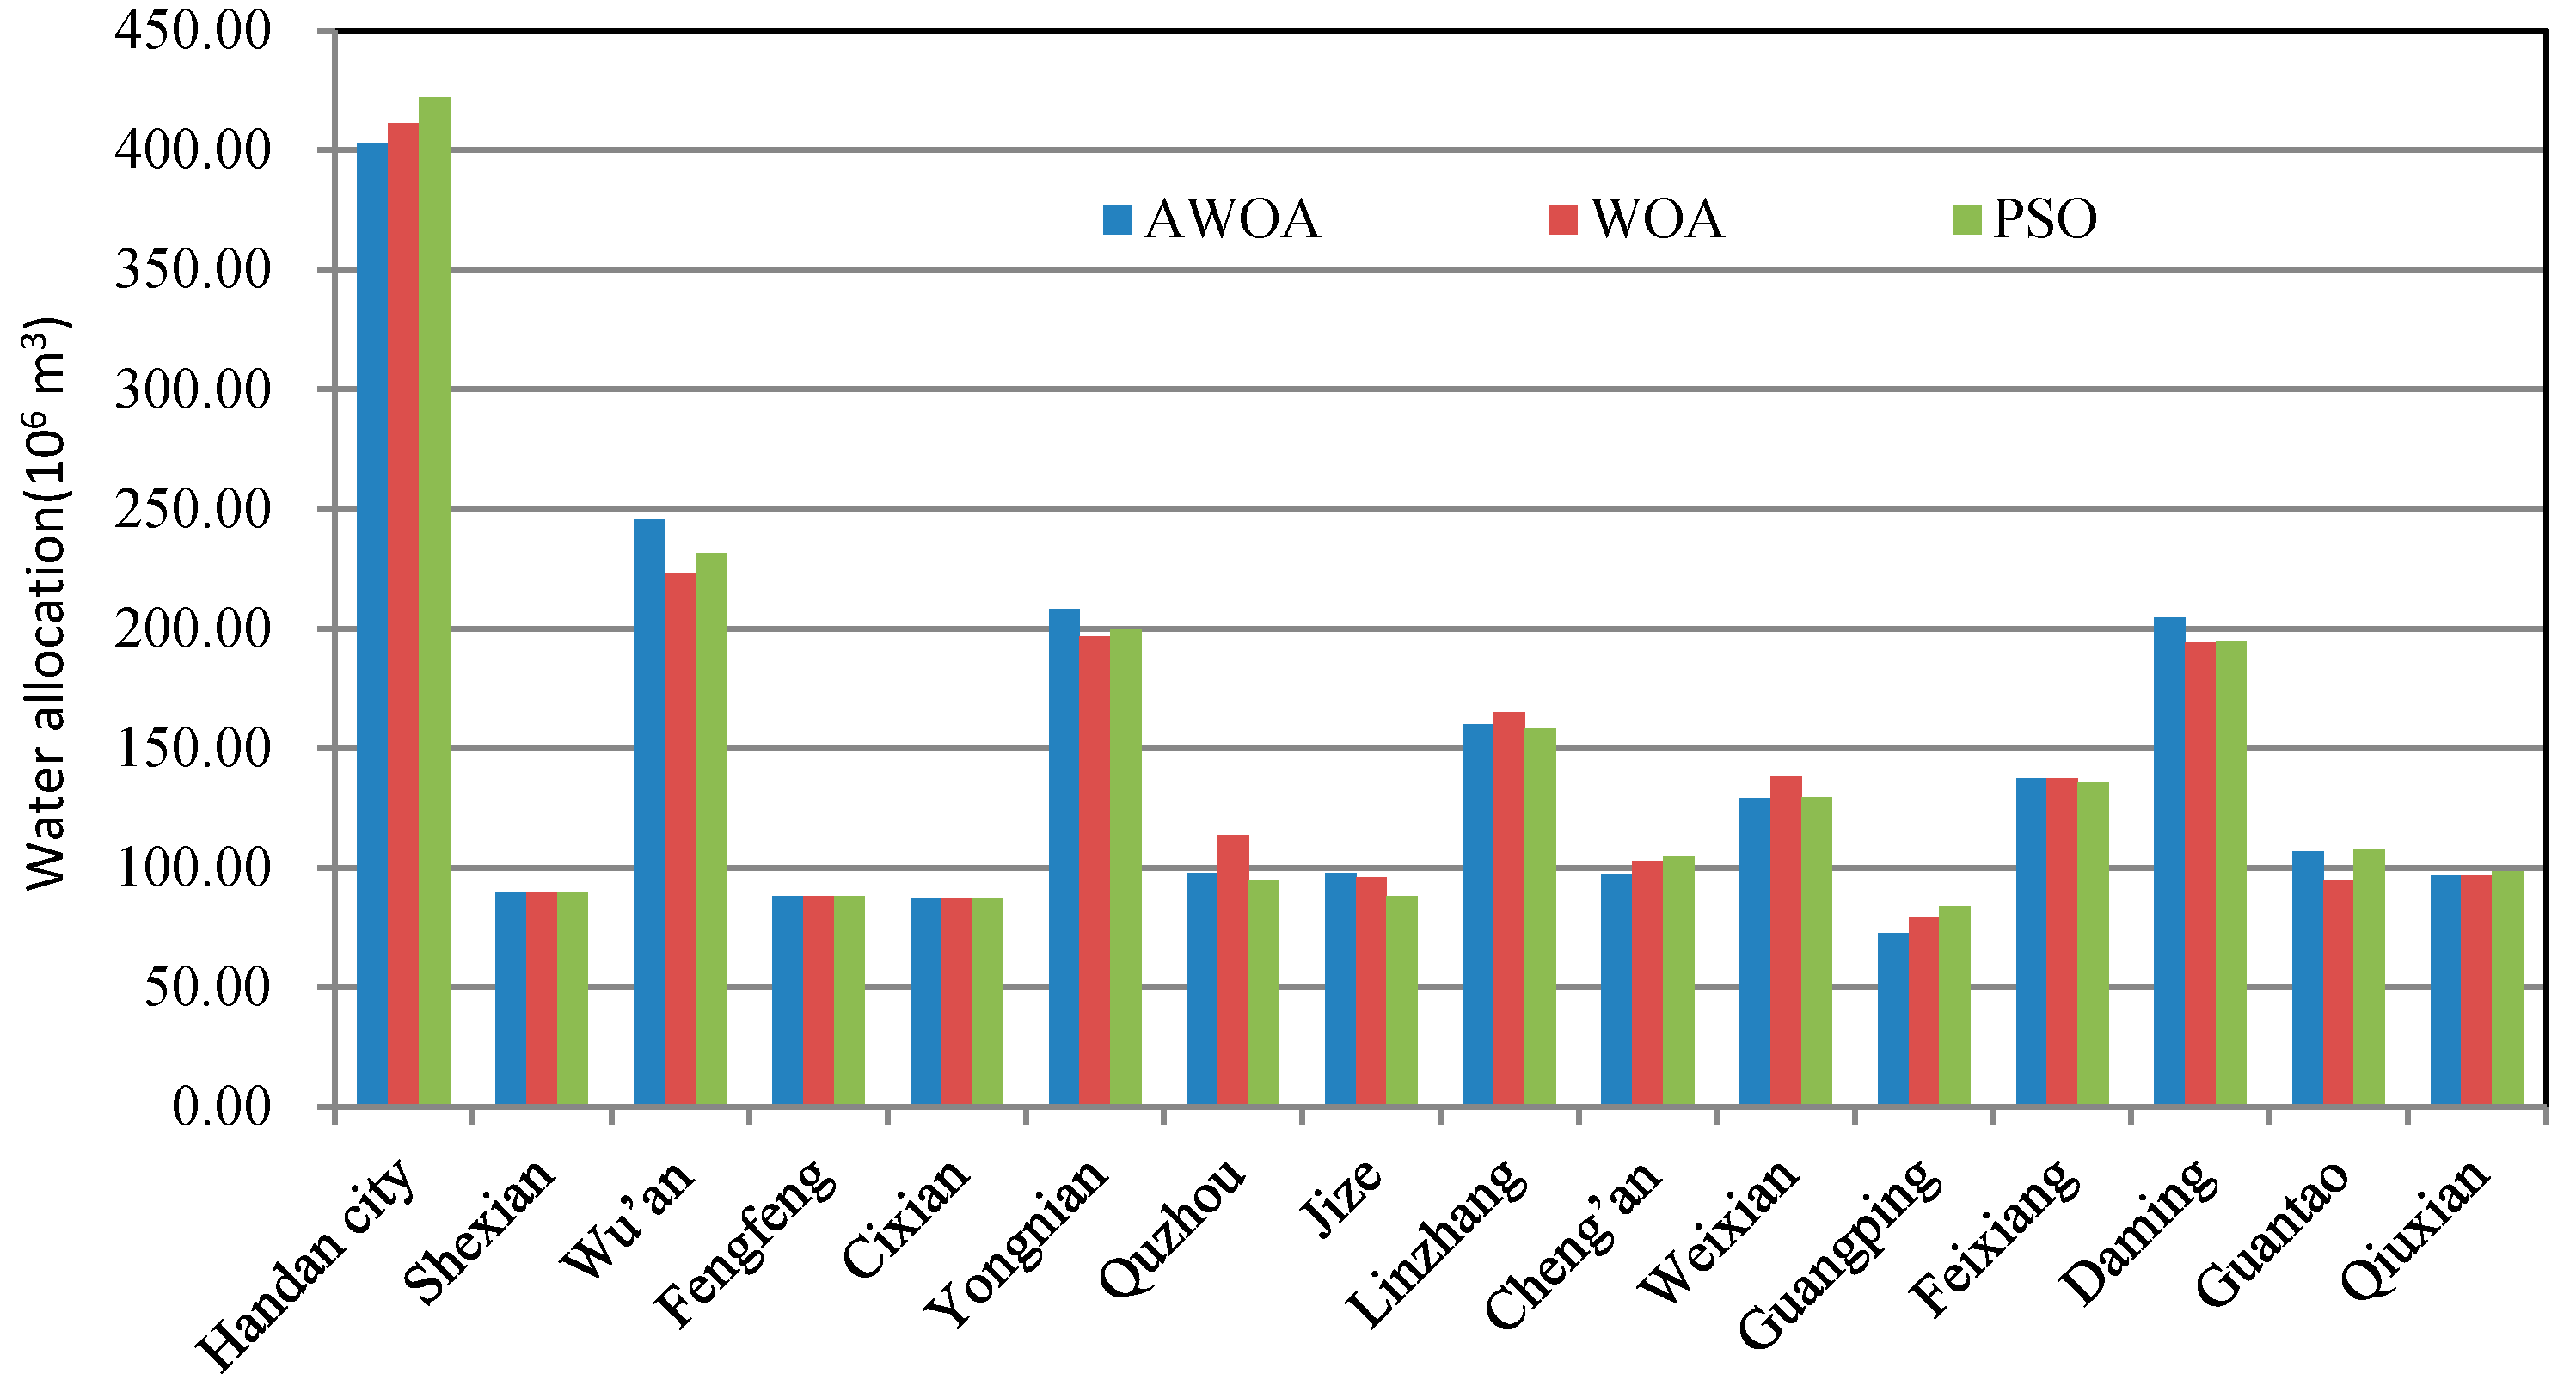
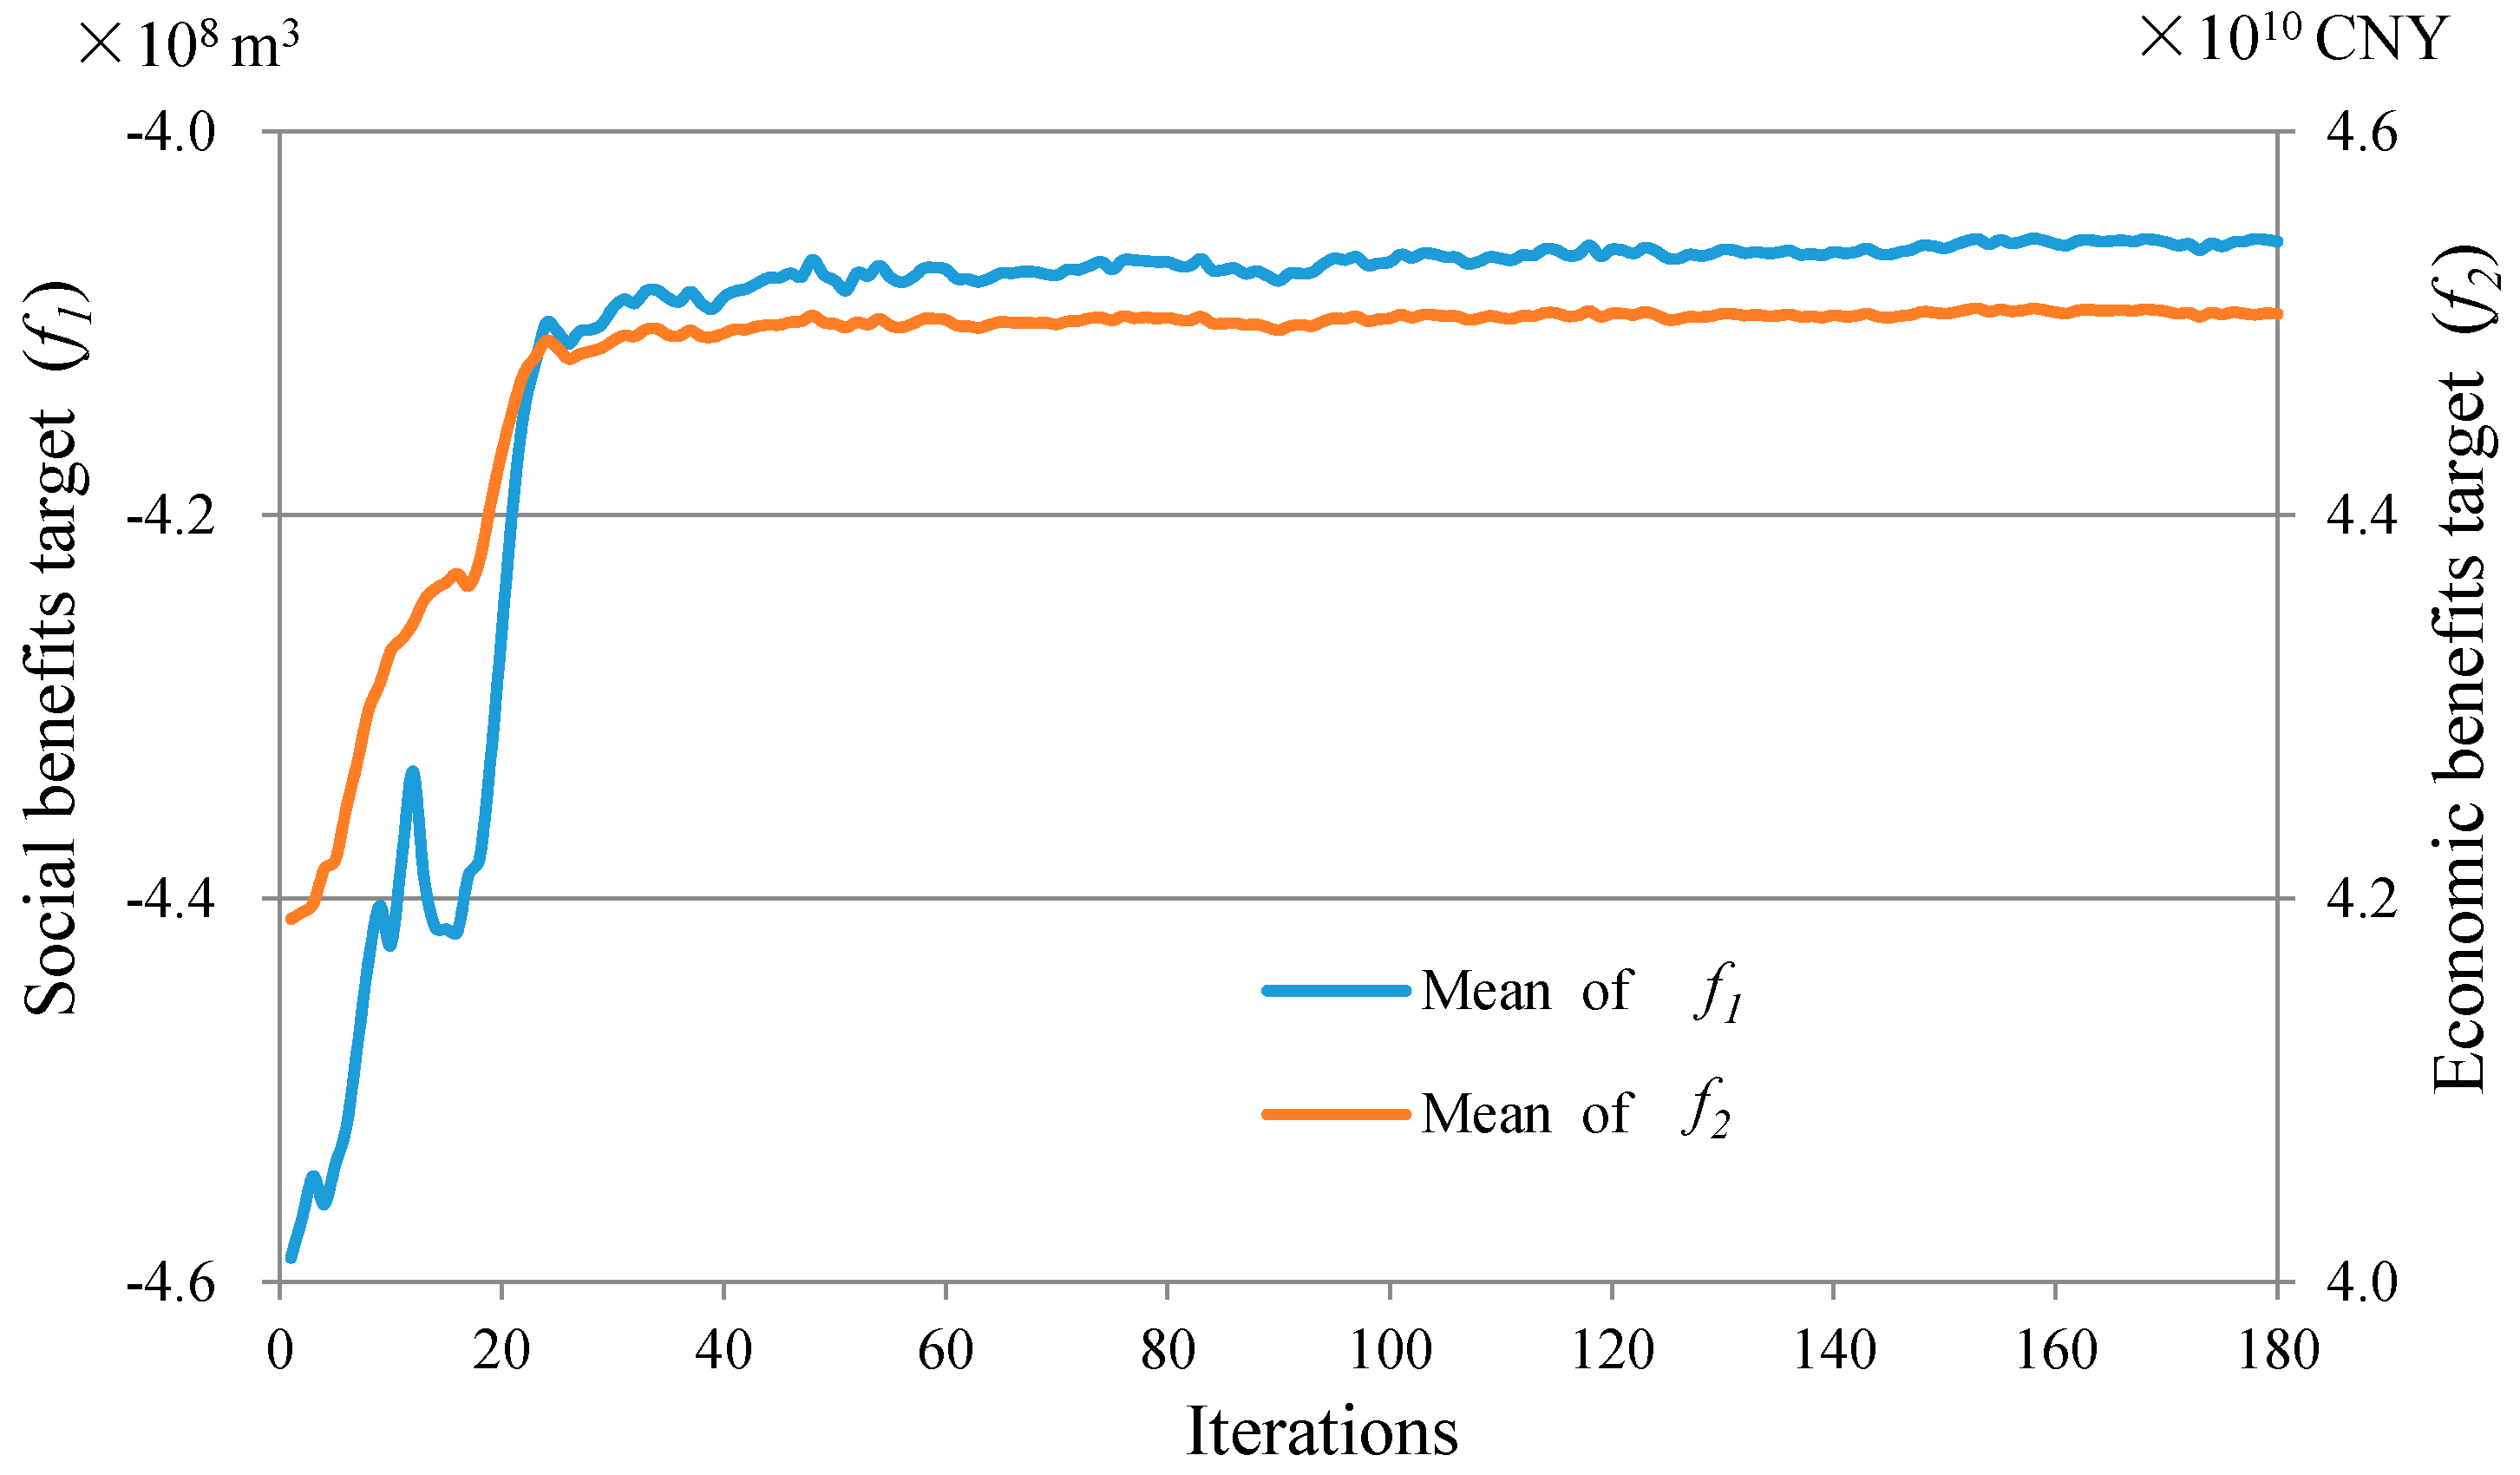
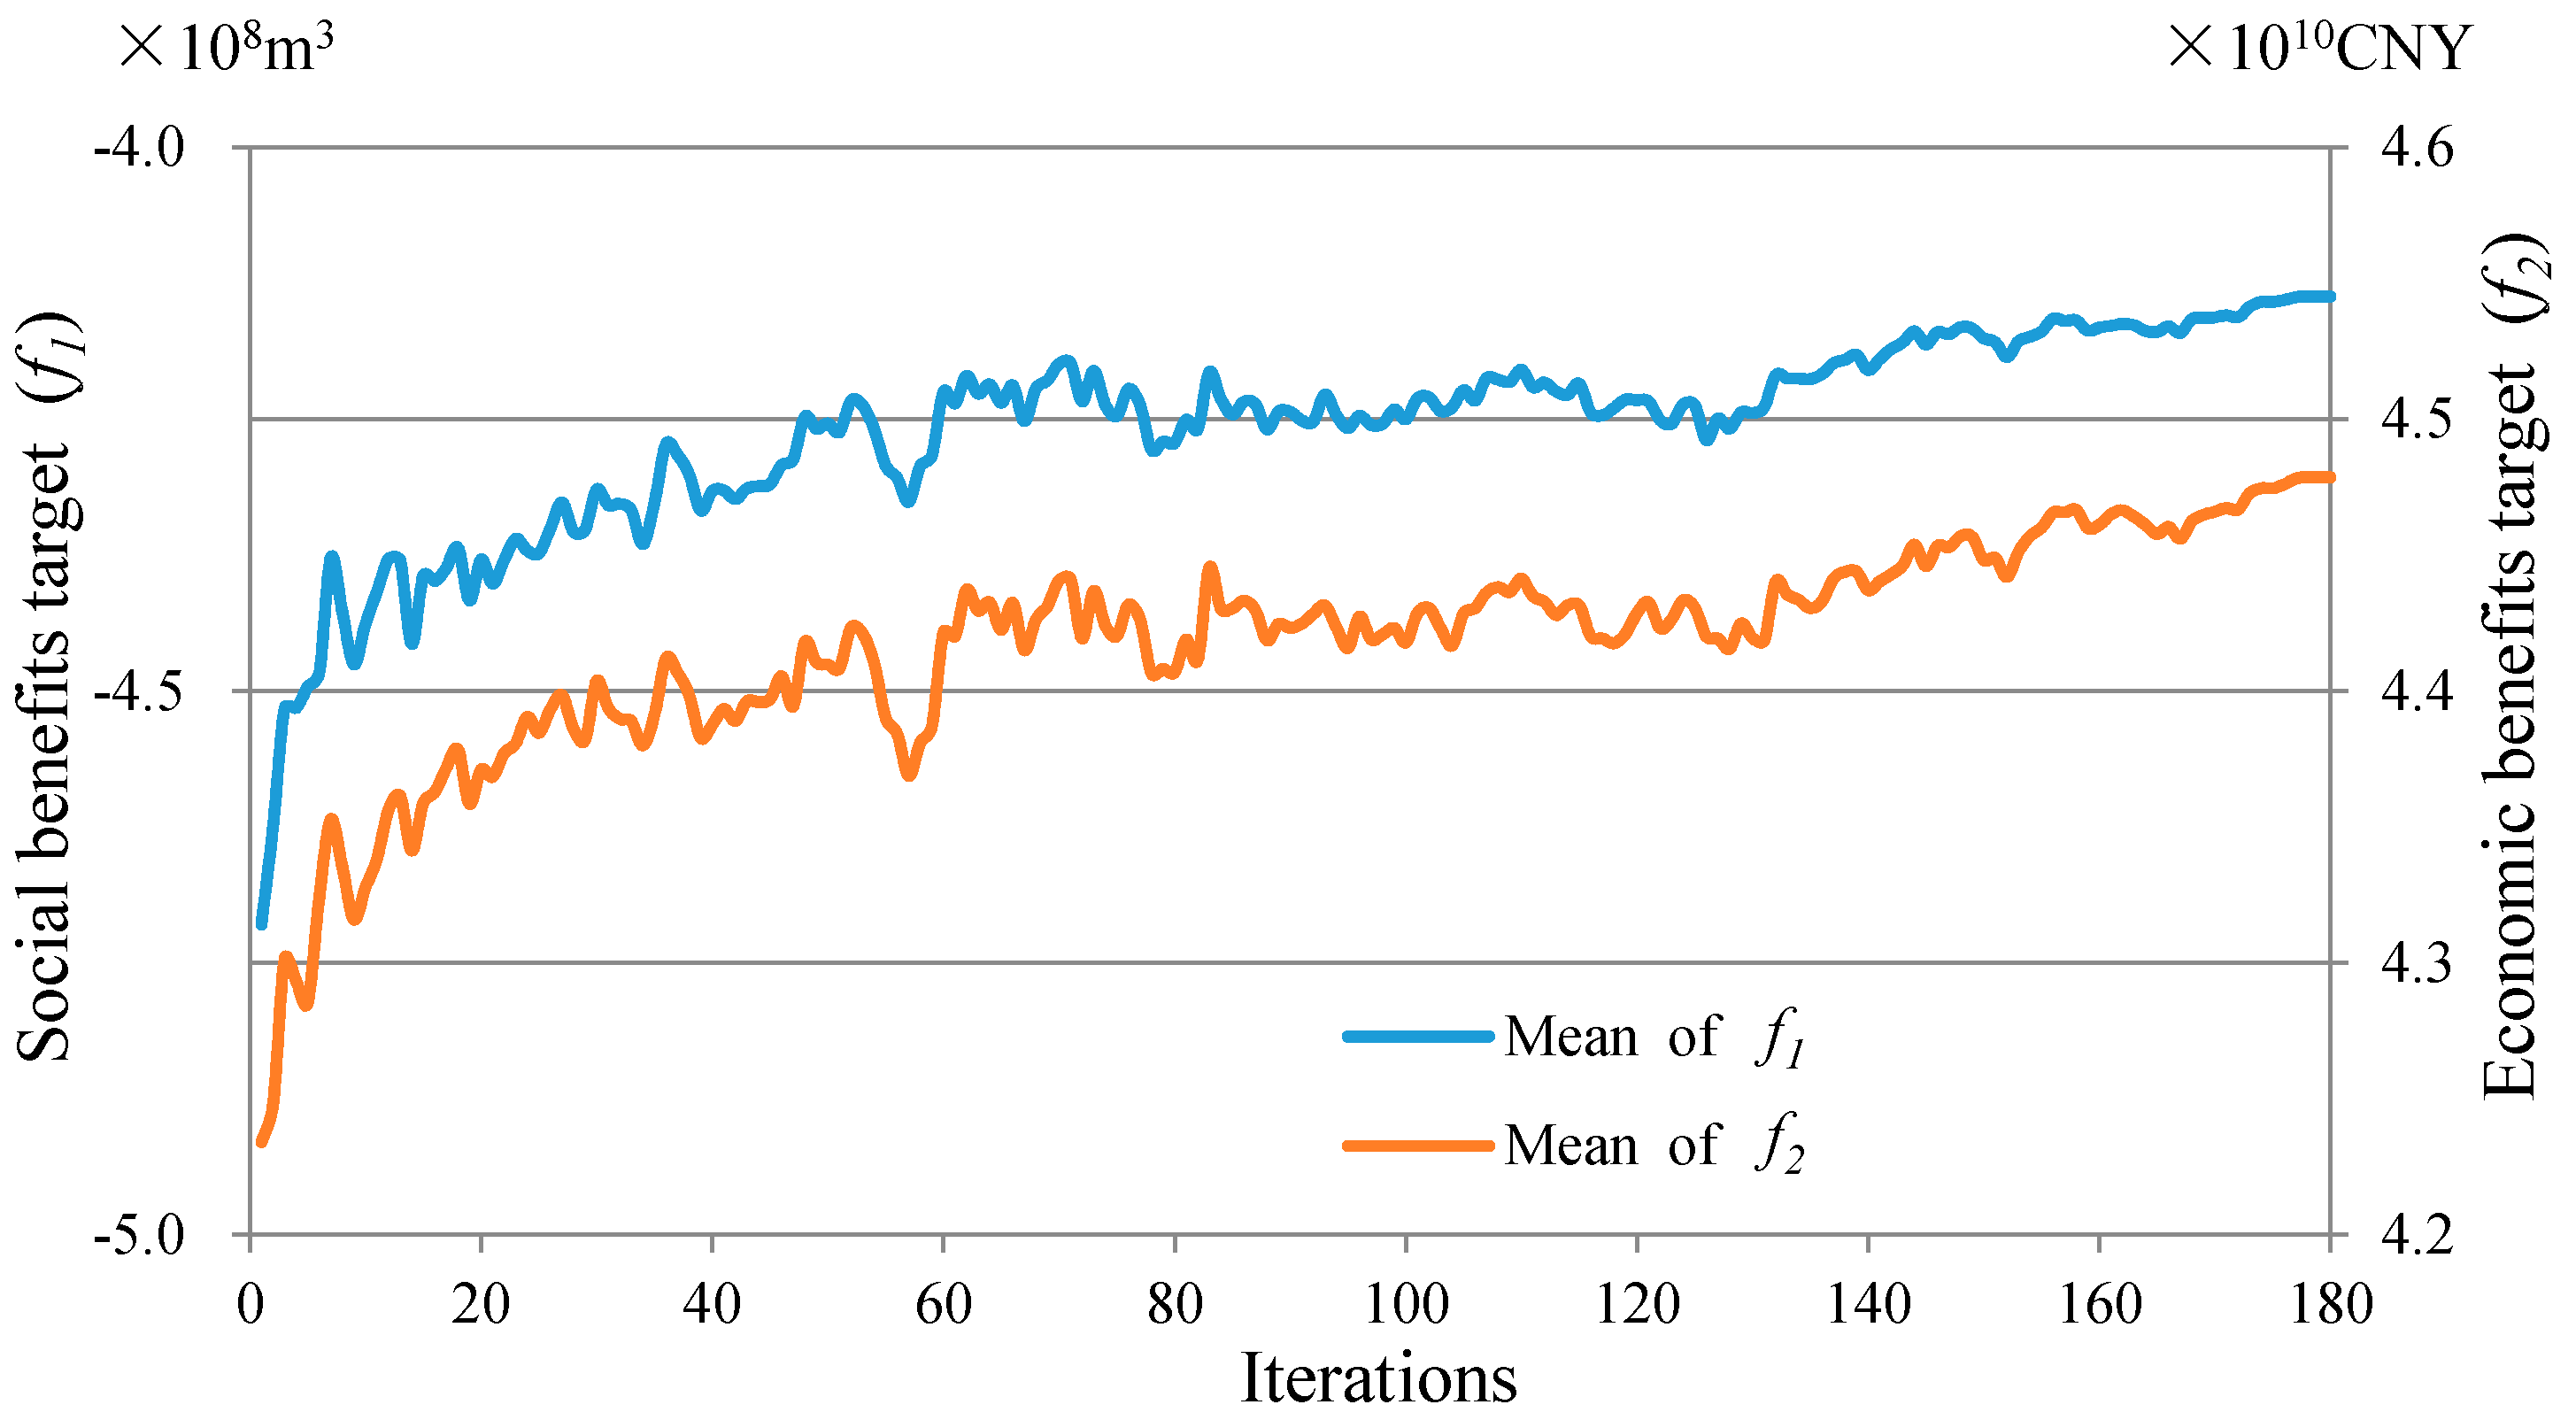
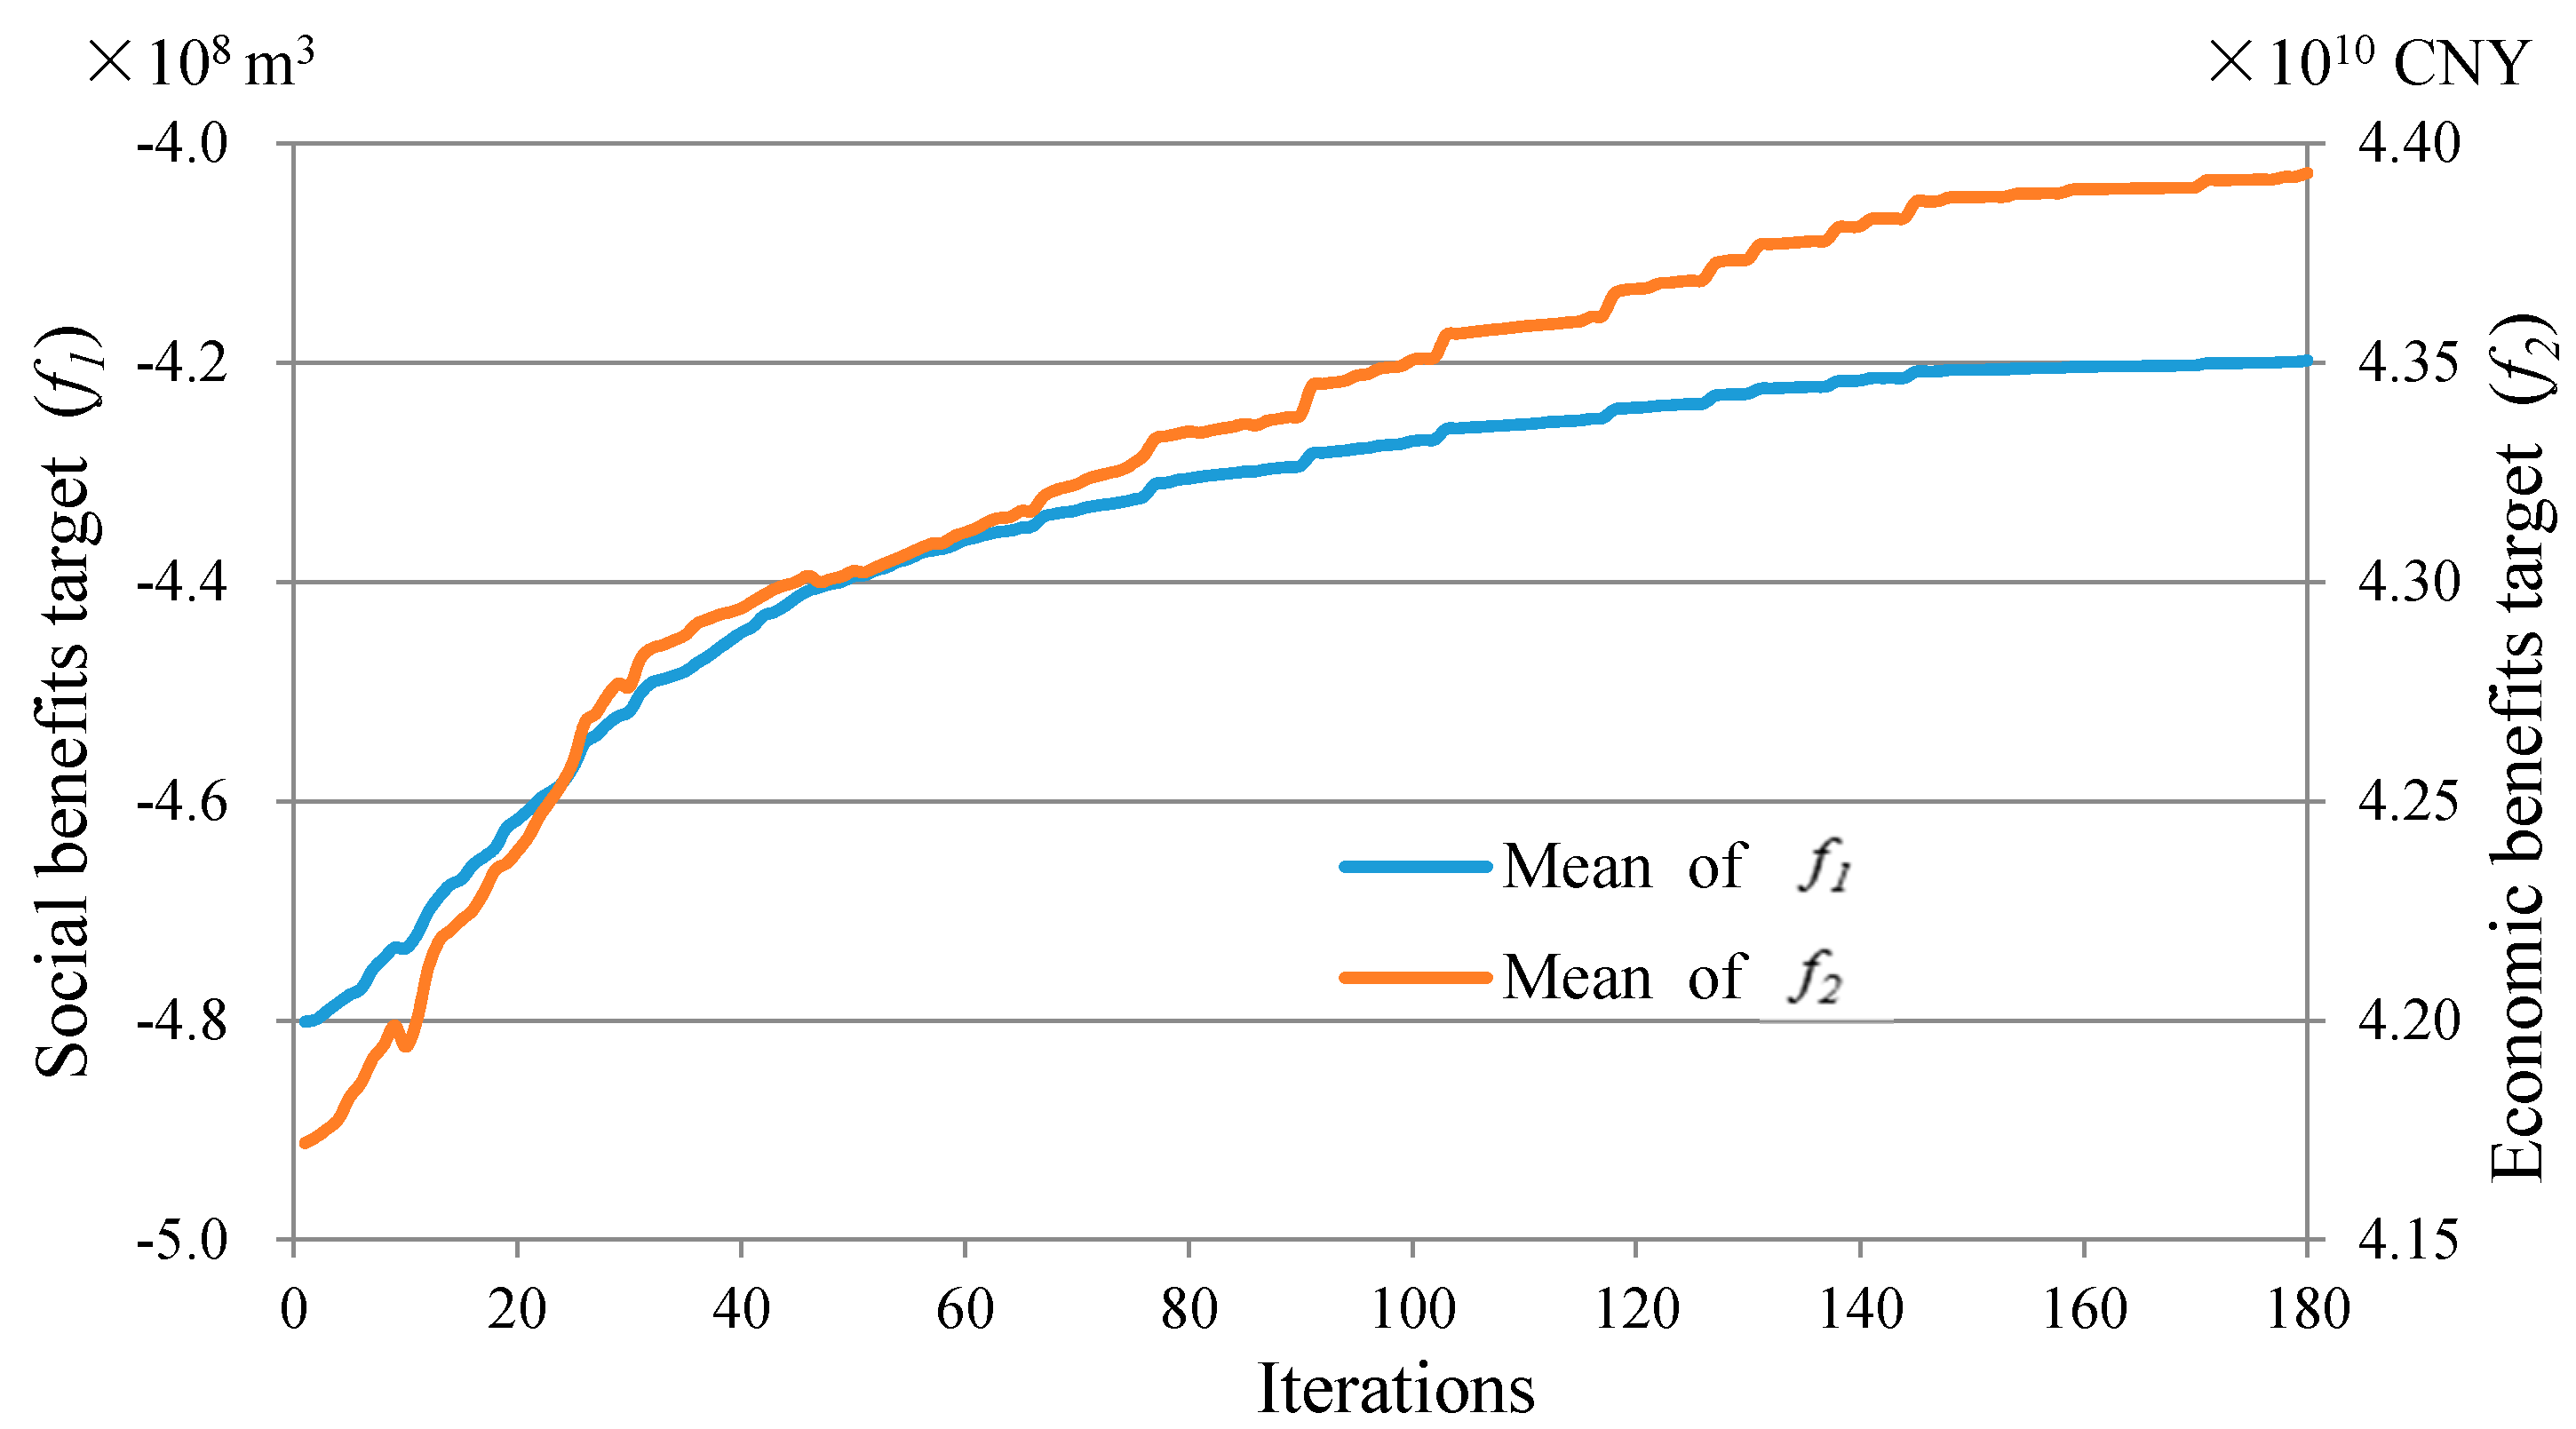
The three algorithms of the AWOA, WOA, and PSO all reach the Pareto front through MATLAB software programming. The AWOA obtained nine non-inferior solutions on the Pareto front, five of which resulted from the WOA, and four from the PSO algorithm. For all three algorithms, the scenarios are chosen with preference for the minimum water shortage as the efficient solution, and to proceed with the comparative analysis. The calculation results by the three algorithms are presented in Table 13. The AWOA results in the greatest social benefit of −404.34 × 10⁶ m3, while the PSO algorithm ranks second, with a social benefit of −412.75 × 10⁶ m3. The WOA has the smallest social benefit at −413.50 × 10⁶ m3. Meanwhile, the economic benefit of the AWOA is highest at 45,148.03 × 106 CNY, followed the WOA (44,804.69 × 106 CNY). The PSO algorithm creates the least economic benefit of 44,426.78 × 106 CNY. The detailed allocation results are listed in Table 14, Table 15 and Table 16, and are illustrated in Figure 10. The iterative processes of the three algorithms are obtained by taking the average of all individuals after each multi-objective optimization algorithm runs 20 times, each with 180 iterations, as shown in Figure 11, Figure 12 and Figure 13. The comparison of the iterative processes of the three algorithms demonstrates that, although the iteration curve of the AWOA fluctuates, the fluctuation amplitude is relatively small, and the curve converges relatively quickly. The swarm in the WOA does not converge at the 180th iteration, while the PSO algorithm becomes stable at the 180th iteration. In summary, the AWOA has a better convergence rate and precision than the WOA and improved PSO algorithm.
4.3. Discussion
The WOA, proposed by Mirjalili and Lewis in 2016, has less application to water resources management The WOA was used to solve long-term optimal operation of a single reservoir and cascade reservoirs by Cui Donglai [52] in 2017. The results were compared with those obtained from six algorithms, including the cuckoo search algorithm, differential evolution algorithm, shuffled frogleaping algorithm, PSO algorithm, firefly algorithm, and SCE-UA algorithm. The results show that the WOA for the optimal operation of a single reservoir and cascade reservoirs is superior to the other six algorithms. The WOA is feasible and effective for reservoir optimal operation [52]. This study applied the WOA to the multi-objective optimization of water resources allocation model for the first time in the literature. When the number of iterations is set to 180 times, the algorithm cannot converge, and attempts to run 300 times, 500 times, 1000 times, 1500 times, and 2000 times while the WOA still cannot converge. In order to solve this problem, an AWOA is proposed in this study, where by logistic mapping is used to initialize swarm location, and inertia weighting is employed to strengthen local search capability. It can be concluded from Figure 11 and Table 13 that after the AWOA is applied to the multi-objective optimization of water resources allocation model in Handan, it speeds up the algorithm convergence and improves the accuracy of the algorithm.
The AWOA is compared with the PSO to verify which is superior when applied to the multi-objective water resources allocation model. As a mature swarm-based algorithm, PSO has obtained a large number of successful applications to the optimal allocation of water resources [29,30,53,54,55,56,57,58,59,60]. According to previous research results, efficiency of the water resources allocation problem can be effectively improved under PSO. The AWOA out performs the PSO in terms of convergence rate and solution accuracy through Figure 11 and Figure 13, and Table 13. The AWOA provides a new way to solve the complex multi-objective optimization of water resources allocation model.
5. Conclusions
Due to population growth and rapid socio-economic development, regions with water shortages are expanding, making shortages increasingly severe in China. This has developed into a critical issue that significantly hinders social and economic development. Alleviating water shortages by optimizing water resource allocation has become increasingly important. Water resource allocation optimization is a multi-objective problem, which cannot be solved easily with traditional programming methods. Based on previous research, this study introduces the WOA into multi-objective water resource allocation optimization models. To overcome drawbacks like relatively low convergence precision and convergence rate when applying the WOA algorithm to complex optimization problems, logistic mapping is used to initialize swarm location, and enhance the quality of initialization swarm location. In addition, inertia weighting is employed to strengthen the local search capability. Compared to the WOA and PSO algorithm, the AWOA shows substantially enhanced convergence rates and precision.
The AWOA is utilized to solve the Handan water resource allocation optimization model. The results indicate that the total water demand for all users in the city is 2726.08 × 106 m3, and the total allocated volume is 2321.74 × 106 m3, resulting in a total water shortage of 404.34 × 10⁶ m3, and a shortage rate of 14.8%. Water shortages occur mainly in the primary sector (agriculture), with a shortage volume of 381.15 × 10⁶ m3. This accounts for 94.3% of the total shortage. The allocation optimization results show good agreement with the reality of water resource exploitation and utilization. This verifies the relatively high reliability and applicability of the AWOA in solving multi-objective multi-source multi-user water resource allocation optimization models.
The AWOA proposed in this study can effectively solve multi-objective water resource allocation optimization models. It provides a Pareto non-inferior solution set and hence, several reliable multi-source joint control plans. According to the preferences for the objective functions, the authority can select the appropriate plan to control and manage multiple water sources jointly.
Since the sewage disposal data are not complete, this study establishes only a water resource allocation optimization model that aims for the greatest economic benefit and smallest shortage volume. In future, with complete sewage disposal data, a water resource allocation optimization model targeting relatively optimal economic, environmental, and social benefits should be constructed and solved using the AWOA. This could verify the applicability of the AWOA to more multi-objective water resource allocation optimization problems.
Acknowledgments
This work was supported by the Science and Technology Project of Hebei Province (Grant No. 15227005D) and Scientific Research Project of Hebei Provincial Education Department (QN2016233, ZD2016131, ZD2014020).
Author Contributions
This paper is a joint effort by several authors. Z.Y. and B.L. conceived and designed the paper’s structure; B.L. performed the AWOA; Z.Y. compiled the code of the optimization algorithm; J.S. analyzed the data; W.T. forecasted water demand; J.L. forecasted water supply; and Z.Y. wrote the paper.
Conflicts of Interest
The authors declare no conflict of interest.
References
- Vörösmary, C.J.; McIntyre, P.B.; Gessner, M.O.; Dudgeon, D.; Prusevich, A.; Green, P.; Glidden, S.; Bunn, S.E.; Sullivan, C.A.; Liermann, C.R.; et al. Global threats to human water security and river biodiversity. Nature 2010, 467, 555–561. [Google Scholar] [CrossRef] [PubMed]
- Frederick, K.D.; Major, D.C. Climate change and water resources. Clim. Chang. 1997, 37, 7–23. [Google Scholar] [CrossRef]
- Vörösmary, C.J.; Green, P.; Salisbury, J.; Lammers, R.B. Global water resources: Vulnerability from climate change and population growth. Science 2000, 289, 284–288. [Google Scholar] [CrossRef]
- Lu, H.W.; Huang, G.H.; Zeng, G.M.; Maqsood, I.; He, L. An inexact two-stage fuzzy-stochastic programming model for water resources management. Water Resour. Manag. 2008, 22, 991–1016. [Google Scholar] [CrossRef]
- Forsee, W.J.; Ahmad, S. Evaluating urban storm water infrastructure design in response to projected climate change. Hydrol. Eng. 2011, 16, 865–873. [Google Scholar] [CrossRef]
- Wang, J.; Cai, Y.; Zhou, Y.; Wang, R.; Li, C. Discrete particle swarm optimization based on estimation of distribution for terminal assignment problems. Comput. Ind. Eng. 2011, 60, 566–575. [Google Scholar] [CrossRef]
- Dawadi, S.; Ahmad, S. Evaluating the impact of demand-side management on water resources under changing climatic conditions and increasing population. Environ. Manag. 2013, 114, 261–275. [Google Scholar] [CrossRef] [PubMed]
- DeNicola, E.; Aburizaiza, O.S.; Siddique, A.; Khwaja, H.; Carpenter, D.O. Climate change and water scarcity: The case of Saudi Arabia. Ann. Glob. Health 2015, 81, 342–353. [Google Scholar] [CrossRef] [PubMed]
- Maier, H.R.; Kapelan, Z.; Kasprzyk, J.; Kollat, J.; Matott, L.S.; Cunha, M.C.; Dandy, G.C.; Gibbs, M.S.; Keedwell, E.; Marchi, A.; et al. Evolutionary algorithms and other metaheuristics in water resources: Current status, research challenges and future directions. Environ. Model. Softw. 2014, 62, 271–299. [Google Scholar] [CrossRef] [Green Version]
- Maass, A.; Hufschmidt, M.M.; Dorfman, R.; Thomas, H.A.; Marglin, S.A.; Fair, G.M. Design of Water Resource Systems; Harvard University Press: Boston, MA, USA, 1962. [Google Scholar]
- Buras, N. Dynamic programming methods applied to watershed management problems. Trans. ASABE 1962, 5, 0003–0005. [Google Scholar] [CrossRef]
- Wang, H.; You, J.J. Advancements and development course of research on water resources deployment. J. Hydraul. Eng. 2008, 39, 1168–1175. (In Chinese) [Google Scholar]
- Joeres, E.F.; Liebman, J.C. Operating rules for joint operation of raw water resources. Water Resour. Res. 1971, 7, 225–235. [Google Scholar] [CrossRef]
- Mulvihill, W.E.; Dracup, J.A. Optimal timing and sizing of a conjunctive urban water supply treatment facilities. Water Resour. Res. 1971, 7, 463–478. [Google Scholar]
- Dudley, N.J.; Burt, O.R. Stochastic reservoir management and system design for irrigation. Water Resour. Res. 1973, 9, 507–522. [Google Scholar] [CrossRef]
- Meredith, D.D. Design and planning of engineering systems. Molecules 1973, 9, 705–712. [Google Scholar]
- United Nations (UN). Guidebook to Water Resources, Use and Management in Asia and the Pacific, Water Resources and Water Use; Water Resources Series No. 74; United Nations: New York, NY, USA, 1995. [Google Scholar]
- Yang, X.S. Nature-Inspired Meta-Heuristic Algorithms; Luniver Press: Frome, UK, 2010. [Google Scholar]
- Mirjalili, S.; Lewis, A. The whale optimization algorithm. Adv. Eng. Softw. 2016, 95, 51–67. [Google Scholar] [CrossRef]
- Kennedy, J.; Eberhart, R. Particle Swarm Optimization. In Proceedings of the 1995 IEEE International Conference on Neural Networks, Perth, WA, Australia, 27 November–1 December 1995; Volume 4, pp. 1942–1948. [Google Scholar]
- Dorigo, M.; Birattari, M.; Stutzle, T. Ant colony optimization. IEEE Comput. Intell. 2006, 1, 28–39. [Google Scholar] [CrossRef]
- Li, X.L.; Shao, Z.J.; Qian, J.X. An optimizing method based on autonomous animats: Fish-swarm algorithm. Syst. Eng. Theory Pract. 2002, 22, 32–38. (In Chinese) [Google Scholar]
- Yang, X.S. Firefly algorithm, stochastic test functions and design optimisation. Int. J. Bio-Inspired Comput. 2010, 2, 78–84. [Google Scholar] [CrossRef]
- Pan, W.T. A new fruit fly optimization algorithm: Taking the financial distress model as an example. Knowl.-Based Syst. 2012, 26, 69–74. [Google Scholar] [CrossRef]
- Roth, M.; Stephen, W. Termite: A Swarm Intelligent Routing Algorithm for Mobile Wireless Ad-Hoc Networks. Stigmergic Optimization; Springer: Berlin/Heidelberg, Germany, 2006; pp. 155–184. [Google Scholar]
- Pinto, P.C.; Runkler, T.A.; Sousa, J.M. Wasp swarm algorithm for dynamic MAXSAT problems. Adaptive and natural computing algorithms. In Proceedings of the International Conference on Adaptive and Natural Computing Algorithms, Warsaw, Poland, 11–14 April 2007; Beliczynski, B., Dzielinski, A., Iwanowski, M., Ribeiro, B., Eds.; Springer: Berlin/Heidelberg, Germany, 2007; pp. 350–357. [Google Scholar]
- Kaveh, A.; Farhoudi, N. A new optimization method: Dolphin echolocation. Adv. Eng. Softw. 2013, 59, 53–70. [Google Scholar] [CrossRef]
- Wu, Z.N. Integrated Optimal Distribution of Water Quality and Quantity in a Region Based on Ecology Economy. Ph.D. Thesis, HoHai University, Nanjing, China, December 2004. (In Chinese). [Google Scholar]
- Sha, J.X.; Liu, B.; Xie, X.M.; Lu, H.Y. Study of water resources optimal allocation based on particle swarm optimization. Water Resour. Power 2012, 30, 35–37, 69. (In Chinese) [Google Scholar]
- Yan, Z.H.; Liu, B.; Zhang, T.; Sha, J.X.; Nie, H.-J. Study of water resources optimal allocation based on multi-objective particle swarm optimization. Water Resour. Power 2014, 32, 35–37, 45. (In Chinese) [Google Scholar]
- Wu, A.H. Research and application of multi-objective ant-genetic algorithm for region water resources optimal allocation. Comput. Knowl. Technol. 2007, 23, 1392–1393, 1398. (In Chinese) [Google Scholar]
- Xie, J.C.; Wang, W.B.; Zhang, C.; Zhu, J.W. A benefit model for dynamic water rights soluted by ant colony algorithm. J. Hydraul. Eng. 2012, 6, 659–666. (In Chinese) [Google Scholar]
- Shi, C.Y. Study on the Sustainable Utilization Water Resources Assessment Method and Its Application of River Basin. Ph.D. Thesis, Xi’an University of Technology, Xi’an, China, February 2009. (In Chinese). [Google Scholar]
- Zhang, Z.Y.; Si, H.; Feng, B.P.; Hu, C.; Lv, M.X. An optimal model for agriculture water and soil resources configuration in water shortage irrigation area. J. Hydraul. Eng. 2014, 403–409. (In Chinese) [Google Scholar]
- Zhang, K.; Shen, J. Optimal allocation of water resources based on firefly algorithm and entropy method. Water Resour. Prot. 2016, 32, 50–53, 63. (In Chinese) [Google Scholar]
- Niu, P.F.; Wu, Z.L.; Ma, Y.P.; Shi, C.J.; Li, J.B. Prediction of steam turbine heat consumption rate based on whale optimization algorithm. CIESC J. 2017, 68, 1049–1057. (In Chinese) [Google Scholar]
- May, R.M. Simple mathematical models with very complicated dynamics. Nature 1976, 261, 459–467. [Google Scholar] [CrossRef] [PubMed]
- Shi, Y.; Eberhart, R. A Modified Particle Swarm Optimizer. In Proceedings of the 1998 IEEE World Congress on Computational Intelligence Evolutionary Computation Proceedings, Anchorage, AK, USA, 4–9 May 1998; pp. 69–73. [Google Scholar]
- Deb, K.; Agrawal, S.; Pratap, A.; Meyarivan, T. A Fast Elitist Non-dominated Sorting Genetic Algorithm for Multi-objective Optimization: NSGA-II. In Proceedings of the Parallel Problem Solving from Nature VlConf, Paris, France, 18–20 September 2000; Volume 1917, pp. 849–858. [Google Scholar]
- Zheng, Q. Elitist Non-Dominated Sorting Genetic Algorithm and Its Application. Master’s Thesis, Zhejiang University, Zhejiang, China, May 2006. (In Chinese). [Google Scholar]
- Ju, H.H. Research on Job-Shop Scheduling Based on the Elitist Non-dominated Sorting Genetic Algorithm. Master’s Thesis, Shandong University, Jinan, China, May 2008. (In Chinese). [Google Scholar]
- Cui, Q.Y. The Study on Multi-objective FJSP Based on Improved NSGA-II. Master’s Thesis, Kunming University of Science and Technology, Kunming, China, April 2015. [Google Scholar]
- Srinivas, N.; Deb, K. Multi-objective optimization using non-dominated sorting in genetic algorithms. Evol. Comput. 1994, 2, 221–248. [Google Scholar] [CrossRef]
- Hebei Provincial Water Resources Department; Hebei Provincial Administration of Quality and Technical Supervision. Hebei Province Water Use Quota; Hebei Provincial Water Resources Department: Shijiazhuang, China, 2016. (In Chinese)
- Water Conservancy Bureau of Handan. Assessment of Water Resources in Handan, Hebei Province; Academy Press: Beijing, China, 2008; pp. 47–132. (In Chinese)
- Handan Water Resources and Hydropower Survey and Design Institute. The Planning of Handan in the South to North Water Transfer Project (Middle Line) of Hebei Province; Handan Water Resources and Hydropower Survey and Design Institute: Handan, China, 2002; pp. 102–110. (In Chinese) [Google Scholar]
- Handan Water Resources and Hydropower Survey and Design Institute. The Proposal for the Yellow River Water Diversion into Hebei to Supplement Baiyangdian Transfer Project; Handan Water Resources and Hydropower Survey and Design Institute: Handan, China, 2013; pp. 281–284. (In Chinese) [Google Scholar]
- Wang, S.Q.; Li, X.L.; Hao, B.Y. Study on countermeasure and present situation of water resources for Handan city. Hebei Inst. Archit. Sci. Technol. 2005, 21, 50–51. (In Chinese) [Google Scholar]
- Lei, X. Optimal Al location of water resources in Yangling demonstration zone based on multi-objective programming. J. Water Resour. Water Eng. 2009, 20, 96–100, 103. (In Chinese) [Google Scholar]
- Hou, J.W.; Kong, Y.F.; Sun, J.L. Optimal allocation of water resources based onthe multi-objective fish-ant colony algorithm. Resour. Sci. 2011, 33, 2255–2261. (In Chinese) [Google Scholar]
- Zeng, F.C. Research on Supply-Requirement Analysis and Optimized Allocation of Water Resources in Xi’an City. Master’s Thesis, Chang’an University, Xi’an, China, May 2008. (In Chinese). [Google Scholar]
- Cui, D.L. Application of whale optimization algorithm in reservoir optimal operation. Adv. Sci. Technol. Water Res. 2017, 37, 72–76, 94. (In Chinese) [Google Scholar]
- Qu, G.D.; Lou, Z.H. Application of particle swarm algorithm in the optimal allocation of regional water resources based on immune evolutionary algorithm. J. Shanghai Jiaotong Univ. Sci. 2013, 18, 634–640. [Google Scholar] [CrossRef]
- Guo, H.F.; Ma, H.B.; Dong, Z.C.; Qin, X.B. The application of improved multi-objective particle swarm optimization algorithm to water resources allocation of Poyang Lake. China Rural Water Hydropower 2012, 10, 61–64. (In Chinese) [Google Scholar]
- Ma, J.Q.; Wei, R.; Zhang, P. Application of particle swarm optimization based on immune evolution to optimizing allocation of water resources in irrigated areas. J. North China Inst. Water Conserv. Hydroelectr. Power 2011, 32, 35–38. (In Chinese) [Google Scholar]
- Wang, Z.P.; Tian, J.C. Research on optimal allocation of regional water resources based on particle swarm optimization. China Rural Water Hydropower 2013, 1, 7–10. (In Chinese) [Google Scholar]
- Chen, X.N.; Duan, Q.C.; Qiu, L.; Huang, Q. Application of large scale system model based on particle swarm optimization to optimal allocation of water resources in irrigation areas. Trans. CSAE 2008, 24, 103–106. (In Chinese) [Google Scholar]
- Zhang, L.; Xu, Z.X.; Zhang, Z.G. Rational allocation of water resources based on particle swarm optimization. J. China Hydrol. 2009, 29, 41–45. (In Chinese) [Google Scholar]
- Qu, G.D. Study on Rational Regional Water Resources Allocation and Its Program Comprehensive Benefits Evaluation of Resources in Irrigation Areas. Ph.D. Thesis, Zhejiang University, Zhejiang, China, June 2013. (In Chinese). [Google Scholar]
- Song, J.J.; Zhao, H.L.; Jiang, Y.Z. Application of particle swarm optimization in the optimal water allocation of Miyun Reservoir. South-North Water Transf. Water Sci. Technol. 2015, 13, 378–381. (In Chinese) [Google Scholar]
Figure 1.
Crowding degree of individual i.

Figure 2.
The map of administrative division and water supply system in Handan.

Figure 3.
Optimal water resource allocation results in Handan (106 m3).

Figure 4.
Urban domestic water allocation results in each sub-region in Handan (106 m3).

Figure 5.
Rural domestic water allocation in each sub-region in Handan (106 m3).

Figure 6.
Primary sector water allocation in each sub-region in Handan (106 m3).

Figure 7.
Secondary sector water allocation in each sub-region in Handan (106 m3).

Figure 8.
Tertiary sector water allocation in each sub-region in Handan (106 m3).

Figure 9.
Ecological water allocation in each sub-region in Handan (106 m3).

Figure 10.
Water allocation based on three algorithms for each sub-region in Handan.

Figure 11.
Iterative process of AWOA.

Figure 12.
Iterative process of WOA.

Figure 13.
Iterative process of PSO.


Table 1.
Water demand of different water users in each sub-region of Handan in 2030 (p = 50%) (106 m3).
Table 1.
Water demand of different water users in each sub-region of Handan in 2030 (p = 50%) (106 m3).
| Administrative Division | Urban Domestic | Rural Domestic | Primary Sector | Secondary Sector | Tertiary Sector | Ecology | Total |
|---|---|---|---|---|---|---|---|
| Handan city | 82.53 | 3.86 | 171.48 | 74.78 | 70.98 | 114.84 | 518.47 |
| Shexian | 18.45 | 1.07 | 28.35 | 19.61 | 16.29 | 6.20 | 89.97 |
| Wu’an | 38.38 | 1.35 | 98.27 | 71.00 | 33.92 | 17.19 | 260.12 |
| Fengfeng | 21.01 | 2.30 | 25.66 | 17.99 | 11.82 | 9.41 | 88.18 |
| Cixian | 17.00 | 1.92 | 40.81 | 13.27 | 10.15 | 3.81 | 86.95 |
| Yongnian | 30.54 | 4.35 | 149.06 | 16.35 | 9.88 | 5.47 | 215.63 |
| Quzhou | 15.54 | 2.97 | 121.42 | 12.04 | 4.97 | 2.09 | 159.03 |
| Jize | 9.79 | 2.02 | 68.09 | 9.57 | 6.99 | 1.32 | 97.77 |
| Linzhang | 24.33 | 2.84 | 140.34 | 7.75 | 6.14 | 3.27 | 184.67 |
| Cheng’an | 17.06 | 0.86 | 98.20 | 14.98 | 9.22 | 3.82 | 144.14 |
| Weixian | 33.85 | 3.48 | 163.49 | 8.87 | 6.31 | 11.37 | 227.37 |
| Guangping | 10.93 | 1.28 | 59.34 | 5.29 | 5.49 | 1.47 | 83.80 |
| Feixiang | 13.38 | 2.22 | 106.48 | 7.37 | 4.01 | 3.90 | 137.35 |
| Daming | 32.33 | 2.97 | 158.61 | 11.30 | 6.95 | 3.62 | 215.79 |
| Guantao | 12.81 | 1.32 | 87.06 | 10.53 | 4.81 | 1.72 | 118.25 |
| Qiuxian | 9.24 | 1.11 | 75.15 | 6.39 | 5.48 | 1.24 | 98.61 |
| Total | 387.16 | 35.91 | 1591.82 | 307.06 | 213.41 | 190.72 | 2726.08 |
Table 2.
The amount of water supply in 2030 (106 m3).
| Administrative Division | Local Surface Water | Ground Water | South-To-North Transferred Water | Dongwushi Reservoir | Yuecheng Reservoir | Yellow River Transferred Water | Recycled Water |
|---|---|---|---|---|---|---|---|
| Handan city | 1.93 | 77.44 | √ | 107.06 | |||
| Shexian | 51.05 | 81.56 | 24.76 | ||||
| Wu’an | 114.90 | 93.46 | 57.58 | ||||
| Fengfeng | 1.95 | 126.03 | 23.29 | ||||
| Cixian | 28.77 | 106.95 | 10.06 | √ | 18.94 | ||
| Yongnian | 21.76 | 98.56 | 19.63 | √ | 27.52 | ||
| Quzhou | 4.92 | 27.88 | 6.12 | √ | √ | 14.72 | |
| Jize | 1.05 | 37.71 | 4.07 | √ | 11.98 | ||
| Linzhang | 0.00 | 101.13 | 5.94 | √ | 19.83 | ||
| Cheng’an | 0.73 | 53.54 | 6.26 | √ | 18.76 | ||
| Weixian | 2.03 | 58.64 | 6.96 | √ | √ | 25.87 | |
| Guangping | 0.47 | 24.54 | 9.00 | √ | √ | 10.91 | |
| Feixiang | 2.70 | 46.48 | 4.53 | √ | √ | √ | 11.91 |
| Daming | 1.28 | 133.00 | 6.28 | √ | √ | 25.83 | |
| Guantao | 1.36 | 41.53 | 4.47 | √ | √ | 12.68 | |
| Qiuxian | 1.67 | 21.97 | 8.96 | √ | √ | 10.11 | |
| Total | 236.58 | 1130.42 | 388.62 | 221.79 | 197.56 | 100.00 | 421.75 |
Note: √ indicates that the administrative division can be allocated a certain amount of water.
Table 3.
Coefficients of water supply sequence for different water users.
| Water Supply | Urban Domestic | Rural Domestic | Primary Sector | Secondary Sector | Tertiary Sector | Ecology |
|---|---|---|---|---|---|---|
| Local surface water | 0.29 | 0.27 | ||||
| Ground water | 0.33 | 1.00 | 0.05 | 0.05 | 0.33 | |
| South-to-North transferred water | 0.67 | 0.29 | 0.67 | |||
| Dongwushi Reservoir | 0.14 | 0.19 | 0.13 | |||
| Yuecheng Reservoir | 0.10 | 0.14 | 0.07 | |||
| Yellow River transferred water | 0.19 | 0.10 | 0.20 | |||
| Recycled water | 0.24 | 0.24 | 0.33 |
Table 4.
Results of Pareto front under AWOA.
| Scenarios | Social Benefit (106 m3) | Economic Benefit (106 CNY) |
|---|---|---|
| 1 | −404.340 | 45,148.03 |
| 2 | −404.342 | 45,148.10 |
| 3 | −404.344 | 45,148.17 |
| 4 | −404.348 | 45,148.26 |
| 5 | −404.350 | 45,148.33 |
| 6 | −404.351 | 45,148.39 |
| 7 | −404.354 | 45,148.45 |
| 8 | −404.356 | 45,148.49 |
| 9 | −404.368 | 45,148.51 |
Table 5.
Results for local surface water allocated to every user (106 m3).
| Administrative Division | Primary Sector | Ecology | Total |
|---|---|---|---|
| Handan city | 1.29 | 0.64 | 1.93 |
| Shexian | 8.48 | 3.57 | 12.05 |
| Wu’an | 80.68 | 13.93 | 94.61 |
| Fengfeng | 1.17 | 0.78 | 1.95 |
| Cixian | 1.75 | 2.79 | 4.54 |
| Yongnian | 19.04 | 2.72 | 21.76 |
| Quzhou | 4.88 | 0.04 | 4.92 |
| Jize | 1.02 | 0.03 | 1.05 |
| Linzhang | 0.00 | 0.00 | 0.00 |
| Cheng’an | 0.70 | 0.03 | 0.73 |
| Weixian | 1.31 | 0.72 | 2.03 |
| Guangping | 0.44 | 0.03 | 0.47 |
| Feixiang | 2.54 | 0.16 | 2.70 |
| Daming | 1.08 | 0.20 | 1.28 |
| Guantao | 1.27 | 0.09 | 1.36 |
| Qiuxian | 1.53 | 0.14 | 1.67 |
| Total | 127.18 | 25.88 | 153.06 |
Table 6.
Results for groundwater allocated to every user (106 m3).
| Administrative Division | Urban Domestic | Rural Domestic | Primary Sector | Secondary Sector | Tertiary Sector | Total |
|---|---|---|---|---|---|---|
| Handan city | 7.50 | 3.86 | 42.22 | 2.76 | 21.11 | 77.44 |
| Shexian | 18.45 | 1.07 | 19.11 | 5.17 | 16.29 | 60.09 |
| Wu’an | 38.38 | 1.35 | 11.84 | 7.97 | 33.92 | 93.46 |
| Fengfeng | 21.01 | 2.30 | 19.25 | 17.59 | 11.82 | 71.96 |
| Cixian | 15.45 | 1.92 | 36.99 | 5.88 | 9.06 | 69.29 |
| Yongnian | 10.92 | 4.35 | 66.48 | 6.94 | 9.88 | 98.56 |
| Quzhou | 11.89 | 2.97 | 6.23 | 2.57 | 4.23 | 27.88 |
| Jize | 8.90 | 2.02 | 14.54 | 5.72 | 6.54 | 37.71 |
| Linzhang | 18.41 | 2.84 | 69.53 | 4.22 | 6.13 | 101.13 |
| Cheng’an | 15.51 | 0.86 | 21.49 | 8.02 | 7.66 | 53.54 |
| Weixian | 32.11 | 3.48 | 12.38 | 1.60 | 3.33 | 52.89 |
| Guangping | 3.00 | 1.28 | 8.93 | 2.21 | 4.96 | 20.38 |
| Feixiang | 10.70 | 2.22 | 27.90 | 2.17 | 3.49 | 46.48 |
| Daming | 30.76 | 2.97 | 88.03 | 5.29 | 5.94 | 133.00 |
| Guantao | 11.69 | 1.32 | 22.73 | 1.14 | 4.65 | 41.53 |
| Qiuxian | 8.40 | 1.11 | 10.05 | 1.78 | 0.63 | 21.97 |
| Total | 263.07 | 35.91 | 477.69 | 81.02 | 149.63 | 1007.32 |
Table 7.
Results for South to North transferred water allocated to every user (106 m3).
| Administrative Division | Urban Domestic | Secondary Sector | Tertiary Sector | Total |
|---|---|---|---|---|
| Handan city | 75.03 | 65.16 | 49.87 | 190.06 |
| Shexian | 0.00 | 0.00 | 0.00 | 0.00 |
| Wu’an | 0.00 | 0.00 | 0.00 | 0.00 |
| Fengfeng | 0.00 | 0.00 | 0.00 | 0.00 |
| Cixian | 1.55 | 2.20 | 1.09 | 4.84 |
| Yongnian | 19.62 | 0.00 | 0.00 | 19.62 |
| Quzhou | 3.65 | 1.01 | 0.74 | 5.41 |
| Jize | 0.89 | 1.29 | 0.45 | 2.63 |
| Linzhang | 5.92 | 0.00 | 0.01 | 5.93 |
| Cheng’an | 1.55 | 0.36 | 1.56 | 3.47 |
| Weixian | 1.74 | 0.08 | 2.99 | 4.81 |
| Guangping | 7.93 | 0.14 | 0.53 | 8.60 |
| Feixiang | 2.68 | 0.03 | 0.52 | 3.23 |
| Daming | 1.57 | 0.05 | 1.01 | 2.63 |
| Guantao | 1.12 | 0.62 | 0.16 | 1.90 |
| Qiuxian | 0.84 | 0.32 | 4.85 | 6.01 |
| Total | 124.09 | 71.26 | 63.77 | 259.11 |
Table 8.
Results of Dongwushi reservoir allocated to every user (106 m3).
| Administrative Division | Primary Sector | Secondary Sector | Ecology | Total |
|---|---|---|---|---|
| Handan city | 12.07 | 1.61 | 12.58 | 26.26 |
| Shexian | 0.00 | 0.00 | 0.00 | 0.00 |
| Wu’an | 0.00 | 0.00 | 0.00 | 0.00 |
| Fengfeng | 0.00 | 0.00 | 0.00 | 0.00 |
| Cixian | 0.00 | 0.00 | 0.00 | 0.00 |
| Yongnian | 36.35 | 3.03 | 1.45 | 40.83 |
| Quzhou | 19.20 | 4.31 | 0.77 | 24.27 |
| Jize | 45.61 | 1.35 | 1.18 | 48.14 |
| Linzhang | 0.00 | 0.00 | 0.00 | 0.00 |
| Cheng’an | 0.00 | 0.00 | 0.00 | 0.00 |
| Weixian | 0.00 | 0.00 | 0.00 | 0.00 |
| Guangping | 0.00 | 0.00 | 0.00 | 0.00 |
| Feixiang | 39.46 | 1.98 | 2.23 | 43.67 |
| Daming | 0.00 | 0.00 | 0.00 | 0.00 |
| Guantao | 0.00 | 0.00 | 0.00 | 0.00 |
| Qiuxian | 36.39 | 1.75 | 0.46 | 38.61 |
| Total | 189.08 | 14.03 | 18.68 | 221.79 |
Table 9.
Results for Yuecheng reservoir allocated to every user (106 m3).
| Administrative Division | Primary Sector | Secondary Sector | Ecology | Total |
|---|---|---|---|---|
| Handan city | 0.00 | 0.00 | 0.00 | 0.00 |
| Shexian | 0.00 | 0.00 | 0.00 | 0.00 |
| Wu’an | 0.00 | 0.00 | 0.00 | 0.00 |
| Fengfeng | 0.00 | 0.00 | 0.00 | 0.00 |
| Cixian | 1.17 | 0.60 | 0.58 | 2.35 |
| Yongnian | 0.00 | 0.00 | 0.00 | 0.00 |
| Quzhou | 0.00 | 0.00 | 0.00 | 0.00 |
| Jize | 0.00 | 0.00 | 0.00 | 0.00 |
| Linzhang | 27.57 | 2.77 | 2.74 | 33.08 |
| Cheng’an | 16.88 | 1.48 | 2.65 | 21.01 |
| Weixian | 23.56 | 2.96 | 3.91 | 30.43 |
| Guangping | 14.58 | 0.46 | 0.50 | 15.54 |
| Feixiang | 28.94 | 1.54 | 0.44 | 30.92 |
| Daming | 23.85 | 3.24 | 0.36 | 27.45 |
| Guantao | 29.15 | 6.30 | 1.32 | 36.77 |
| Qiuxian | 0.00 | 0.00 | 0.00 | 0.00 |
| Total | 165.70 | 19.35 | 12.50 | 197.56 |
Table 10.
Results for Yellow River transferred water allocated to every user (106 m3).
| Administrative Division | Primary Sector | Secondary Sector | Ecology | Total |
|---|---|---|---|---|
| Handan city | 0.00 | 0.00 | 0.00 | 0.00 |
| Shexian | 0.00 | 0.00 | 0.00 | 0.00 |
| Wu’an | 0.00 | 0.00 | 0.00 | 0.00 |
| Fengfeng | 0.00 | 0.00 | 0.00 | 0.00 |
| Cixian | 0.00 | 0.00 | 0.00 | 0.00 |
| Yongnian | 0.00 | 0.00 | 0.00 | 0.00 |
| Quzhou | 19.45 | 0.47 | 0.73 | 20.64 |
| Jize | 0.00 | 0.00 | 0.00 | 0.00 |
| Linzhang | 0.00 | 0.00 | 0.00 | 0.00 |
| Cheng’an | 0.00 | 0.00 | 0.00 | 0.00 |
| Weixian | 9.06 | 1.12 | 2.63 | 12.81 |
| Guangping | 14.19 | 2.09 | 0.59 | 16.86 |
| Feixiang | 2.63 | 1.29 | 0.65 | 4.57 |
| Daming | 12.22 | 1.49 | 0.51 | 14.22 |
| Guantao | 11.88 | 0.29 | 0.27 | 12.44 |
| Qiuxian | 16.40 | 1.65 | 0.40 | 18.45 |
| Total | 85.83 | 8.40 | 5.77 | 100.00 |
Table 11.
Results for recycled water allocated to every user (106 m3).
| Administrative Division | Primary Sector | Secondary Sector | Ecology | Total |
|---|---|---|---|---|
| Handan city | 8.92 | 5.25 | 92.89 | 107.06 |
| Shexian | 0.76 | 14.44 | 2.62 | 17.82 |
| Wu’an | 5.75 | 48.57 | 3.26 | 57.58 |
| Fengfeng | 5.24 | 0.40 | 8.63 | 14.27 |
| Cixian | 0.90 | 4.59 | 0.44 | 5.93 |
| Yongnian | 19.84 | 6.38 | 1.30 | 27.52 |
| Quzhou | 10.48 | 3.68 | 0.56 | 14.72 |
| Jize | 6.92 | 1.21 | 0.11 | 8.24 |
| Linzhang | 18.54 | 0.76 | 0.53 | 19.83 |
| Cheng’an | 12.50 | 5.12 | 1.14 | 18.76 |
| Weixian | 18.67 | 3.11 | 4.10 | 25.87 |
| Guangping | 10.17 | 0.39 | 0.35 | 10.91 |
| Feixiang | 5.01 | 0.36 | 0.41 | 5.78 |
| Daming | 22.05 | 1.23 | 2.55 | 25.83 |
| Guantao | 10.46 | 2.18 | 0.04 | 12.68 |
| Qiuxian | 8.98 | 0.89 | 0.24 | 10.11 |
| Total | 165.19 | 98.55 | 119.17 | 382.90 |
Table 12.
Surplus volumes not allocated (106 m3).
| Administrative Division | Local Surface Water | Ground Water | South-To-North Transferred Water | Recycled Water | Sum |
|---|---|---|---|---|---|
| Handan city | 106.30 | 106.30 | |||
| Shexian | 39.00 | 21.47 | 6.94 | 67.41 | |
| Wu’an | 20.29 | 20.29 | |||
| Fengfeng | 54.07 | 9.02 | 63.09 | ||
| Cixian | 24.23 | 37.66 | 5.22 | 13.01 | 80.12 |
| Yongnian | 0.01 | 0.01 | |||
| Quzhou | 0.71 | 0.71 | |||
| Jize | 1.44 | 3.74 | 5.18 | ||
| Linzhang | 0.01 | 0.01 | |||
| Cheng’an | 2.79 | 2.79 | |||
| Weixian | 5.75 | 2.15 | 7.90 | ||
| Guangping | 4.16 | 0.40 | 4.56 | ||
| Feixiang | 1.30 | 6.13 | 7.43 | ||
| Daming | 3.65 | 3.65 | |||
| Guantao | 2.58 | 2.58 | |||
| Qiuxian | 2.95 | 2.95 | |||
| Total | 83.52 | 123.10 | 129.51 | 38.85 | 374.97 |
Table 13.
Results for objective function values of AWOA, WOA, and PSO.
| Algorithm | Social Benefit (106 m3) | Economic Benefit (106 CNY) |
|---|---|---|
| AWOA | −404.34 | 45,148.03 |
| WOA | −413.50 | 44,804.69 |
| PSO | −412.75 | 44,426.78 |
Table 14.
Results for water allocation of AWOA (106 m3).
| Administrative Division | Urban Domestic | Rural Domestic | Primary Sector | Secondary Sector | Tertiary Sector | Ecology | Total |
|---|---|---|---|---|---|---|---|
| Handan city | 82.53 | 3.86 | 64.50 | 74.78 | 70.98 | 106.12 | 402.76 |
| Shexian | 18.45 | 1.07 | 28.35 | 19.61 | 16.29 | 6.20 | 89.97 |
| Wu’an | 38.38 | 1.35 | 98.27 | 56.54 | 33.92 | 17.19 | 245.65 |
| Fengfeng | 21.01 | 2.30 | 25.66 | 17.99 | 11.82 | 9.41 | 88.18 |
| Cixian | 17.00 | 1.92 | 40.81 | 13.27 | 10.15 | 3.81 | 86.95 |
| Yongnian | 30.54 | 4.35 | 141.71 | 16.35 | 9.88 | 5.47 | 208.29 |
| Quzhou | 15.54 | 2.97 | 60.23 | 12.04 | 4.97 | 2.09 | 97.84 |
| Jize | 9.79 | 2.02 | 68.09 | 9.57 | 6.99 | 1.32 | 97.77 |
| Linzhang | 24.33 | 2.84 | 115.64 | 7.75 | 6.14 | 3.27 | 159.96 |
| Cheng’an | 17.06 | 0.86 | 51.57 | 14.98 | 9.22 | 3.82 | 97.51 |
| Weixian | 33.85 | 3.48 | 64.98 | 8.87 | 6.31 | 11.37 | 128.85 |
| Guangping | 10.93 | 1.28 | 48.31 | 5.29 | 5.49 | 1.47 | 72.76 |
| Feixiang | 13.38 | 2.22 | 106.48 | 7.37 | 4.01 | 3.90 | 137.35 |
| Daming | 32.33 | 2.97 | 147.23 | 11.30 | 6.95 | 3.62 | 204.40 |
| Guantao | 12.81 | 1.32 | 75.49 | 10.53 | 4.81 | 1.72 | 106.68 |
| Qiuxian | 9.24 | 1.11 | 73.35 | 6.39 | 5.48 | 1.24 | 96.81 |
| Total | 387.16 | 35.91 | 1210.66 | 292.60 | 213.41 | 182.00 | 2321.74 |
Table 15.
Results for water allocation of WOA (106 m3).
| Administrative Division | Urban Domestic | Rural Domestic | Primary Sector | Secondary Sector | Tertiary Sector | Ecology | Total |
|---|---|---|---|---|---|---|---|
| Handan city | 82.53 | 3.86 | 117.51 | 74.78 | 70.98 | 61.44 | 411.09 |
| Shexian | 18.45 | 1.07 | 28.35 | 19.61 | 16.29 | 6.20 | 89.97 |
| Wu’an | 38.38 | 1.35 | 98.27 | 51.39 | 16.15 | 17.19 | 222.73 |
| Fengfeng | 21.01 | 2.30 | 25.66 | 17.99 | 11.82 | 9.41 | 88.18 |
| Cixian | 17.00 | 1.92 | 40.81 | 13.27 | 10.15 | 3.81 | 86.95 |
| Yongnian | 30.54 | 4.35 | 130.13 | 16.35 | 9.88 | 5.47 | 196.71 |
| Quzhou | 15.54 | 2.97 | 75.88 | 12.04 | 4.97 | 2.09 | 113.49 |
| Jize | 9.79 | 2.02 | 66.11 | 9.57 | 6.99 | 1.32 | 95.79 |
| Linzhang | 24.33 | 2.84 | 120.53 | 7.75 | 6.14 | 3.27 | 164.86 |
| Cheng’an | 17.06 | 0.86 | 56.72 | 14.98 | 9.22 | 3.82 | 102.66 |
| Weixian | 33.85 | 3.48 | 74.24 | 8.87 | 6.31 | 11.37 | 138.12 |
| Guangping | 10.93 | 1.28 | 54.50 | 5.29 | 5.49 | 1.47 | 78.96 |
| Feixiang | 13.38 | 2.22 | 106.48 | 7.37 | 4.01 | 3.90 | 137.35 |
| Daming | 32.33 | 2.97 | 136.86 | 11.30 | 6.95 | 3.62 | 194.03 |
| Guantao | 12.81 | 1.32 | 63.69 | 10.53 | 4.81 | 1.72 | 94.88 |
| Qiuxian | 9.24 | 1.11 | 73.35 | 6.39 | 5.48 | 1.24 | 96.81 |
| Total | 387.16 | 35.91 | 1269.10 | 287.45 | 195.63 | 137.32 | 2312.58 |
Table 16.
Results for water allocation of PSO (106 m3).
| Administrative Division | Urban Domestic | Rural Domestic | Primary Sector | Secondary Sector | Tertiary Sector | Ecology | Total |
|---|---|---|---|---|---|---|---|
| Handan city | 82.53 | 3.86 | 115.43 | 74.78 | 70.98 | 74.28 | 421.85 |
| Shexian | 18.45 | 1.07 | 28.35 | 19.61 | 16.29 | 6.20 | 89.97 |
| Wu’an | 38.38 | 1.35 | 98.27 | 58.96 | 17.28 | 17.19 | 231.43 |
| Fengfeng | 21.01 | 2.30 | 25.66 | 17.99 | 11.82 | 9.41 | 88.18 |
| Cixian | 17.00 | 1.92 | 40.81 | 13.27 | 10.15 | 3.81 | 86.95 |
| Yongnian | 30.54 | 4.35 | 133.05 | 16.35 | 9.88 | 5.47 | 199.63 |
| Quzhou | 15.54 | 2.97 | 56.73 | 12.04 | 4.97 | 2.09 | 94.34 |
| Jize | 9.79 | 2.02 | 58.41 | 9.57 | 6.99 | 1.32 | 88.09 |
| Linzhang | 24.33 | 2.84 | 113.97 | 7.75 | 6.14 | 3.27 | 158.29 |
| Cheng’an | 17.06 | 0.86 | 58.61 | 14.98 | 9.22 | 3.82 | 104.55 |
| Weixian | 33.85 | 3.48 | 65.52 | 8.87 | 6.31 | 11.37 | 129.40 |
| Guangping | 10.93 | 1.28 | 59.34 | 5.29 | 5.49 | 1.47 | 83.80 |
| Feixiang | 13.38 | 2.22 | 105.01 | 7.37 | 4.01 | 3.90 | 135.89 |
| Daming | 32.33 | 2.97 | 137.58 | 11.30 | 6.95 | 3.62 | 194.75 |
| Guantao | 12.81 | 1.32 | 76.41 | 10.53 | 4.81 | 1.72 | 107.60 |
| Qiuxian | 9.24 | 1.11 | 75.15 | 6.39 | 5.48 | 1.24 | 98.61 |
| Total | 387.16 | 35.91 | 1248.31 | 295.02 | 196.76 | 150.16 | 2313.33 |
© 2018 by the authors. Licensee MDPI, Basel, Switzerland. This article is an open access article distributed under the terms and conditions of the Creative Commons Attribution (CC BY) license (http://creativecommons.org/licenses/by/4.0/).
Share and Cite
MDPI and ACS Style
Yan, Z.; Sha, J.; Liu, B.; Tian, W.; Lu, J. An Ameliorative Whale Optimization Algorithm for Multi-Objective Optimal Allocation of Water Resources in Handan, China. Water 2018, 10, 87. https://doi.org/10.3390/w10010087
AMA Style
Yan Z, Sha J, Liu B, Tian W, Lu J. An Ameliorative Whale Optimization Algorithm for Multi-Objective Optimal Allocation of Water Resources in Handan, China. Water. 2018; 10(1):87. https://doi.org/10.3390/w10010087
Chicago/Turabian StyleYan, Zhihong, Jinxia Sha, Bin Liu, Wei Tian, and Jipan Lu. 2018. "An Ameliorative Whale Optimization Algorithm for Multi-Objective Optimal Allocation of Water Resources in Handan, China" Water 10, no. 1: 87. https://doi.org/10.3390/w10010087
Note that from the first issue of 2016, this journal uses article numbers instead of page numbers. See further details here.