Article

How Does Changing Ice-Out Affect Arctic versus Boreal Lakes? A Comparison Using Two Years with Ice-Out that Differed by More Than Three Weeks

1
Climate Change Institute and School of Biology and Ecology, University of Maine, Orono, ME 04469, USA
2
Rhithron Associates, Inc., 33 Fort Missoula Rd., Missoula, MT 59804, USA
*
Author to whom correspondence should be addressed.
Water 2018, 10(1), 78; https://doi.org/10.3390/w10010078
Submission received: 15 December 2017 / Revised: 10 January 2018 / Accepted: 14 January 2018 / Published: 17 January 2018

Abstract

:
The timing of lake ice-out has advanced substantially in many regions of the Northern Hemisphere, however the effects of ice-out timing on lake properties and how they vary regionally remain unclear. Using data from two inter-annual monitoring datasets for a set of three Arctic lakes and one boreal lake, we compared physical, chemical and phytoplankton metrics from two years in which ice-out timing differed by at least three weeks. Our results revealed regional differences in lake responses during early compared to late ice-out years. With earlier ice-out, Arctic lakes had deeper mixing depths and the boreal lake had a shallower mixing depth, suggesting differing patterns in the influence of the timing of ice-out on the length of spring turnover. Differences in nutrient concentrations and dissolved organic carbon between regions and ice-out years were likely driven by changes in precipitation and permafrost thaw. Algal biomass was similar across ice-out years, while cell densities of key Cyclotella sensu lato taxa were strongly linked to thermal structure changes in the Arctic lakes. Our research provides evidence that Arctic and boreal regions differ in lake response in early and late ice-out years, however ultimately a combination of important climate factors such as solar insolation, air temperature, precipitation, and, in the Arctic, permafrost thaw, are key drivers of the observed responses.

1. Introduction

Lakes throughout the Northern Hemisphere are experiencing changes in the timing of ice-on, ice-out and the duration of ice cover [1,2,3,4,5]. Changes in the timing of ice-out are of particular interest for understanding plankton dynamics, as ice-out marks the onset of spring conditions and the period leading to the peak of the growing season. Ice-out timing also has stronger direct connection to climate change than ice-on because individual lake properties influence the freezing process more strongly than the thawing process [6,7]. The timing of ice-out has advanced substantially, occurring up to 21 days earlier over the past 40 to 100 years at mid-latitudes [8,9,10,11] and up to 13 days earlier since 2000 in the Arctic [12].
Correlations suggest that the timing of ice-out is an important driver of phytoplankton community structure and biomass. Paleolimnological studies have inferred that earlier ice-out has triggered changes in lake properties that caused shifts in diatom communities at both high and mid-latitudes and that the taxon-specific shifts occurred earlier in Arctic lakes (ca. 1870) than in boreal lakes (ca. 1970) due to expansion of planktonic diatom habitat and lengthening of the growing season [13,14,15]. Specifically, it has been hypothesized that shorter periods of ice cover induced by warming air temperatures favor small Cyclotella taxa due to increased water column stability throughout the growing season [15,16]. However, based on neo- and paleolimnological approaches, small Cyclotella sensu lato taxa can be more abundant during early [14,17] or late [18,19] ice-out years. Similarly, monitoring of a boreal lake over a 14-year period and a temperate lake over a 15-year period both revealed that the timing of ice-out does not clearly influence total phytoplankton biomass during the growing season [20,21]. Collectively, these studies reveal that the links between ice-out and phytoplankton dynamics vary in pattern and strength across systems.
This regional variation is well illustrated by comparing Arctic and boreal lakes. The rate of warming is at least twice the global average at high Arctic latitudes above 60° North compared to other latitudes [22,23,24], which will influence seasonal light patterns, the length of the growing seasons, timing of ice-out relative to phytoplankton blooms [25] and the onset of stratification [26] differently than at lower latitudes that contain boreal regions. The relationship between air temperature and the actual timing of ice-out is also not linear among different latitudes and differs greatly between Arctic and boreal regions within the Northern Hemisphere [27]. With both Arctic and boreal regions experiencing rapid climate change, questions remain regarding the magnitude of effect between the regions. In Arctic lakes, ice-out occurs between May to July depending on latitude, while in boreal lakes it occurs between March to May. Therefore, Arctic lakes experience a shorter ice-free season during which there is higher light exposure and rapid onset of stratification shortly after ice-out compared to boreal lakes, which have a longer spring turnover period, longer growing season and a gradual increase in light exposure and temperatures. These differences suggest that the strength of effects of changes in the timing of ice-out may differ between Arctic and boreal lakes.
Changes in ice-out are an important physical change in lake ecosystems and there are several potential pathways by which the timing of ice-out can affect phytoplankton ecology (Figure 1). These pathways, however, are not only affected by the timing of ice-out but also by other climatic factors including precipitation, wind and cloud cover (i.e., incoming solar radiation). For example, while there are assertions in much of the limnological literature that earlier ice-out will lead to earlier onset and strengthening of thermal stratification [28,29,30], there is not extensive evidence to support an exclusive relationship. Dependent on elevation, precipitation can be more influential than temperature in driving ice-out [31]. However, the timing of ice-out is also strongly related to air temperatures in the month or two prior to ice breakup [3,32], and these months vary by region, with ice-out dates in mid-latitudes reflecting February to March air temperatures and at higher latitudes April to May air temperatures. While air temperatures during those months will be important for lake stratification via effects on ice-out timing, many additional factors (e.g., air temperatures during open water months, wind, cloud cover, water clarity) will affect thermal stratification patterns, potentially weakening any links with ice-out timing. Changes in the length of spring turnover and the length of the open water season are additional physical changes in lake ecosystems that are altered by climatic factors and affect phytoplankton ecology through similar pathways (Figure 1). Earlier ice-out will likely lengthen spring turnover and increase the length of the open water season, potentially altering phytoplankton growth and succession [19]. A subsequent physical implication from earlier ice-out and changes in thermal stratification and the length of the open water season, is a change in light exposure (Figure 1). The light environment plays an important role in phytoplankton abundance and composition [21] and will change variably in boreal and Arctic regions based on changes in ice-out timing, thus clear links between ice-out timing and light climate are still being investigated. It is also important to note that under-ice algal growth is greater than previously understood [33], raising questions about the extent to which earlier ice-out will strongly affect seasonal phytoplankton dynamics.
These pathways that drive physical changes in lake ecosystems may also contribute to chemical changes that influence phytoplankton (Figure 1). Earlier ice-out may lead to increased nutrient loading [34], or conversely, reductions in the duration of winter ice cover may contribute to reduced under-ice nitrate production [35], thus links between ice-out and changes in nutrients remain unclear. In addition, increased light exposure from earlier ice-out can alter dissolved organic carbon concentrations and quality [36]. It is important to note that changes in ice-out have effects on chemical pathways in lakes, but that climate factors also influence chemical pathways independent of ice-out. For example, in the Arctic, warming promotes thawing of permafrost, which may increase nutrient loading to lakes [37] and further affect aquatic ecosystems, making it important to distinguish links between ice-out and phytoplankton to better resolve how future climate will alter aquatic ecosystems.
To address the extent to which ice-out affects phytoplankton dynamics requires a better understanding of how spring and summer lake conditions vary between early and late ice-out years and how they compare in different regions. How different are lake conditions in an early versus late ice-out year? To improve mechanistic understanding of the influence of ice-out on Arctic and boreal lake ecosystems, we evaluated the effects of ice-out timing on thermal stratification and differences in biological and biogeochemical characteristics in an early and late ice-out regime. We analyzed data from two inter-annual monitoring datasets, one from the Arctic (a set of 3 lakes in West Greenland) and one from the boreal zone (a lake in Maine, USA). These datasets were collected over multiple years to assess changing lake conditions over time and were originally collected for two different studies. We chose two years from each of these datasets for which monitoring data were available and that had the largest differences in ice-out dates (Table A1). Ice-out timing differed by at least three weeks and we compared a suite of physical, chemical and phytoplankton metrics between the years in each area.

2. Materials and Methods

2.1. Study Design

To compare the responses of Arctic and boreal lakes to the timing of ice-out, we used data from two inter-annual monitoring datasets that were originally collected for two different studies. In the Arctic, a set of three lakes was monitored, while in the boreal region, one lake was monitored. For the boreal lake, we chose two years from the dataset in which ice-out timing differed by 41 days (2012 early ice-out and 2015 late ice-out; Table 1). Data were available for both years to compare lake parameters during late spring (hereafter referred to simply as spring), as well as during the peak of summer stratification (hereafter referred to as summer). For the Arctic lakes, data were available to compare spring lake parameters during two years in which ice-out timing differed by 30 days (2016 early ice-out and 2015 late ice-out; Table 1). Summer data were not available for 2015 but were available for 2013, a year in which ice-out was 22 days later than in 2016 (Table 1). As a result, for the Arctic lakes, the comparisons of spring lake parameters are from one set of years (2016 versus 2015) and for a different set of years (2016 versus 2013) for summer responses. This limits our ability in the Arctic lakes to address questions about whether ice-out effects on spring conditions are sustained into summer.

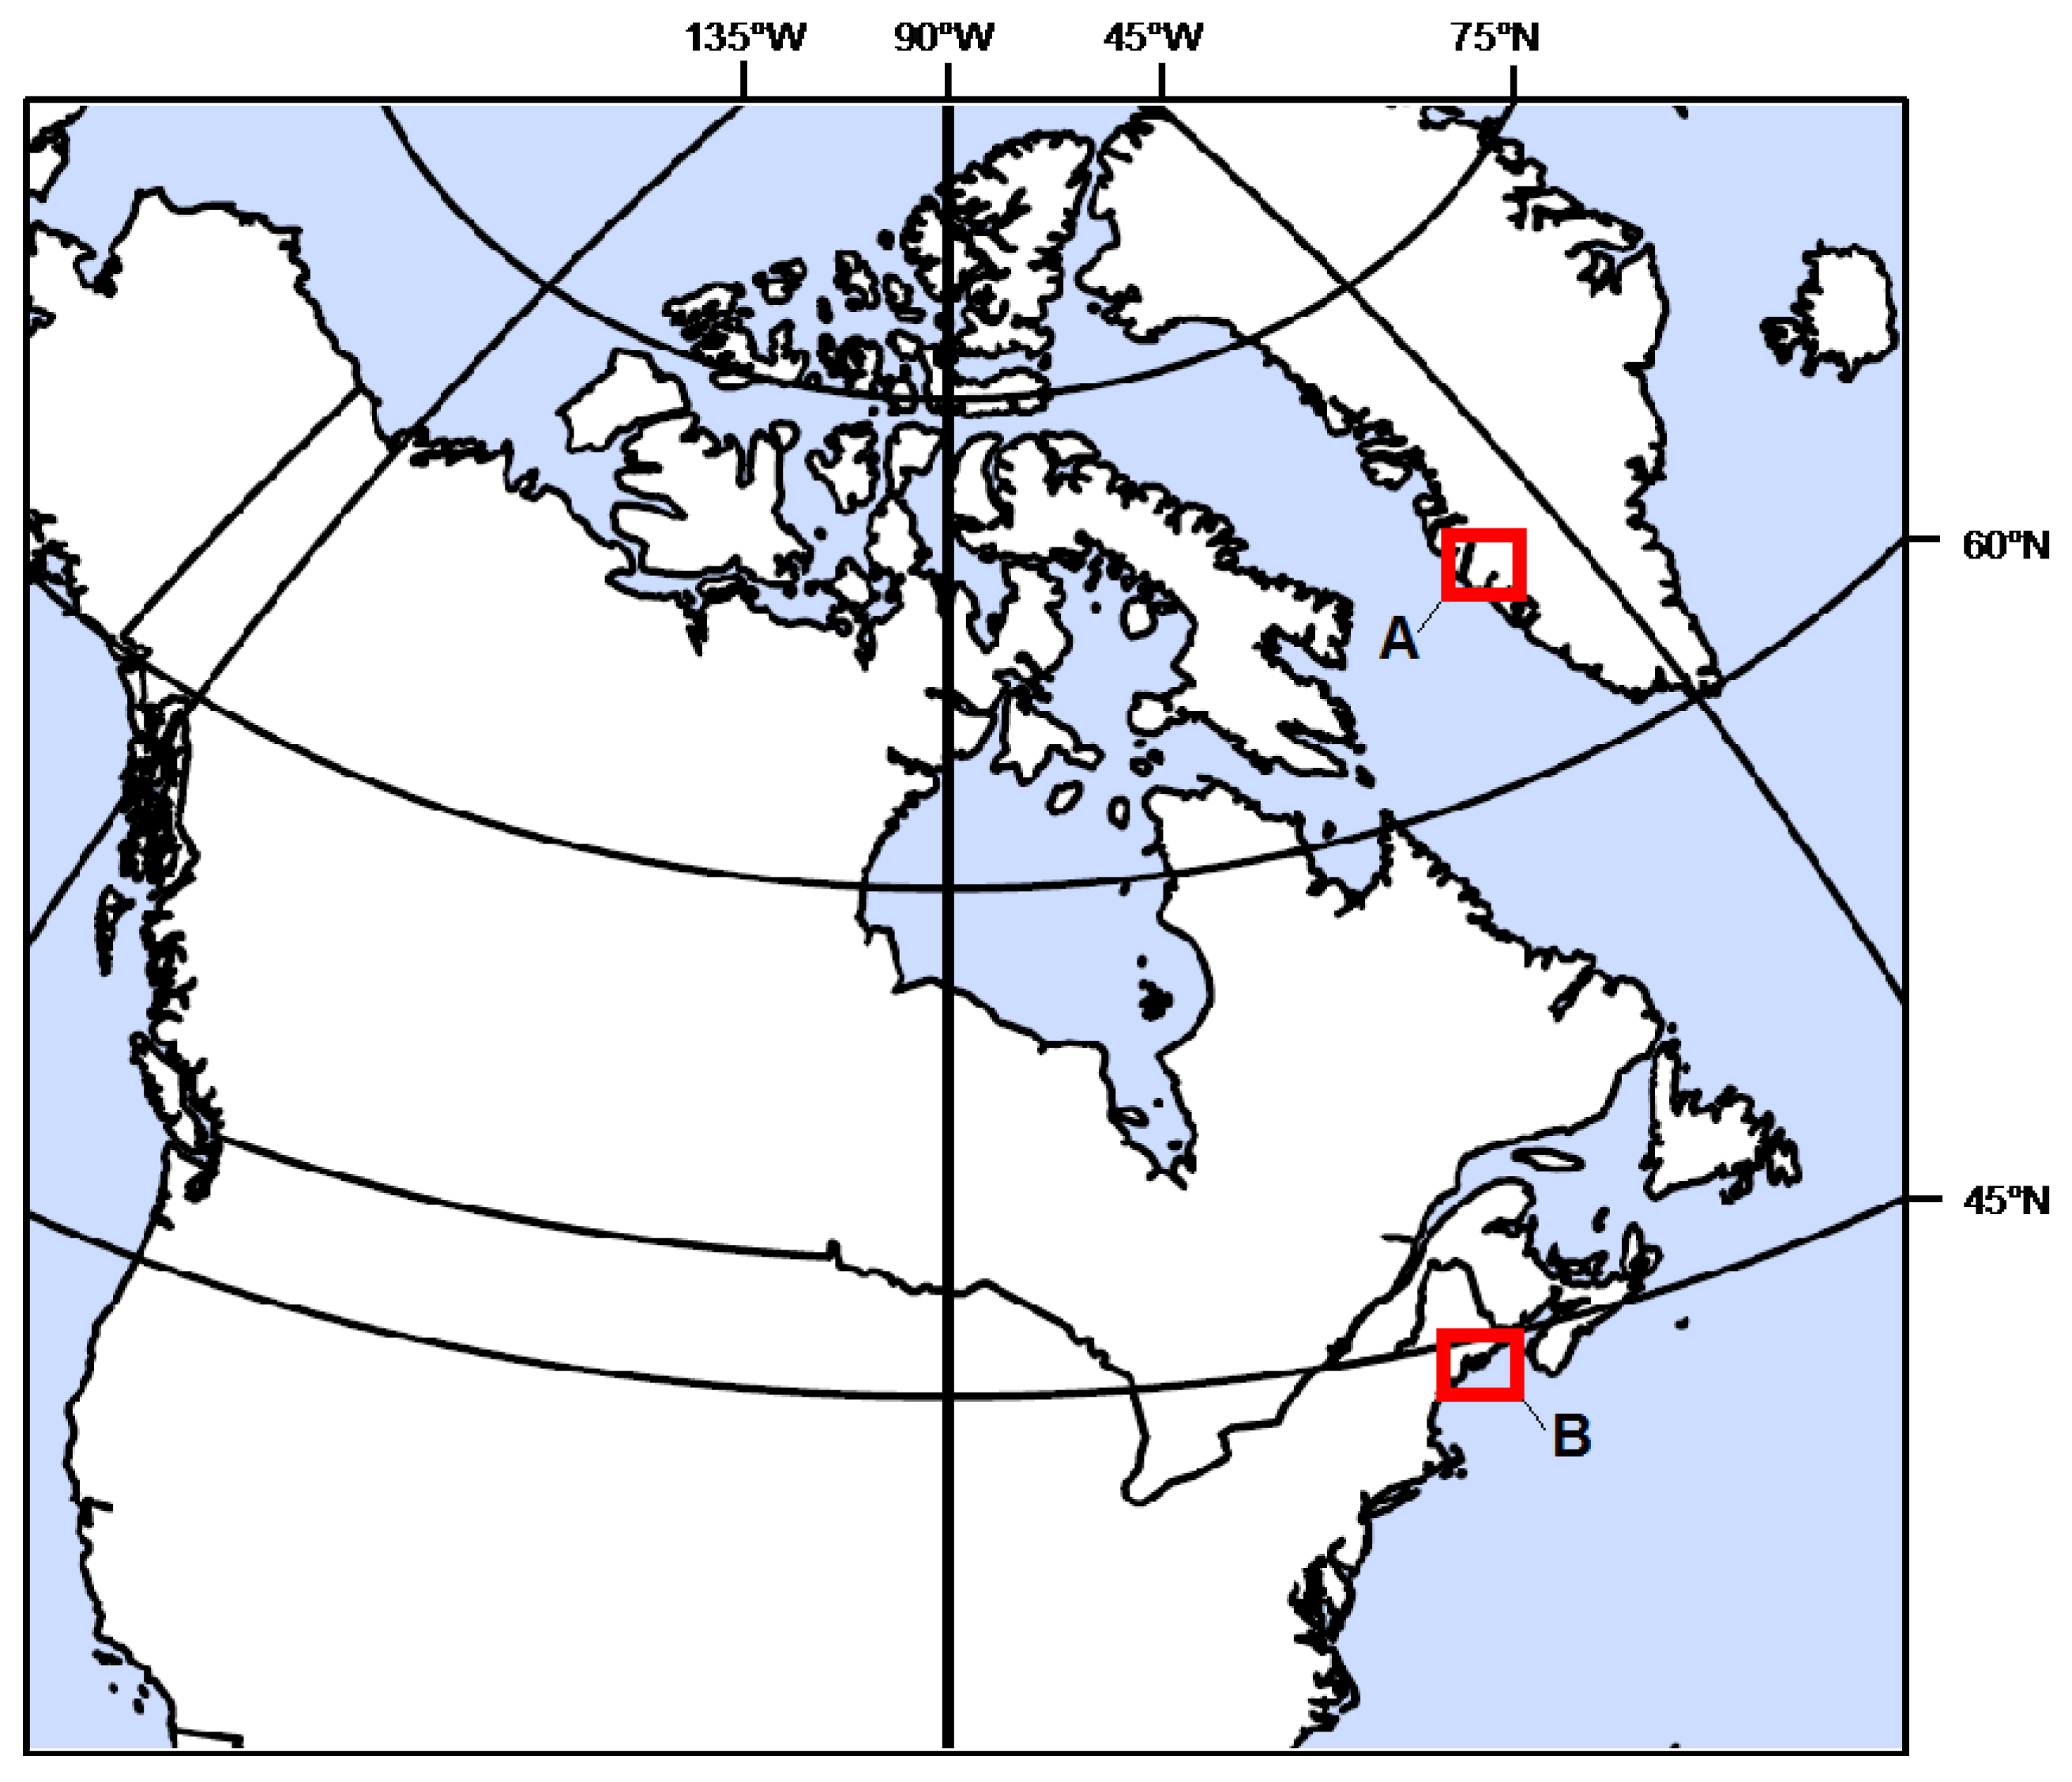
2.2. Site Description

The Arctic lakes in this study are located adjacent to Kangerlussuaq, southwest Greenland, which is situated within the Arctic Circle and spans from the Greenland Ice Sheet to midway to the coast (Figure 2). Soils are derived from weathered granidoritic gneisses [38] and vegetation is variable but consists largely of woody shrubs around the lakes in this study. Continuous permafrost underlies the region [38] and surface inflow and outflow are not typically apparent [39]. Mean summer temperature is 10.2 °C from June to August and precipitation averages 173 mm per year [40]. Ice-out typically occurs between late May and late June with thermal stratification occurring very quickly thereafter [41]. This region contains approximately 20,000 lakes that are mostly chemically dilute and oligotrophic [42]. The three lakes selected for this study are all located in the Kellyville region to the east of Kangerlussuaq (Table 2). The lakes are generally small and similar in depth and surface area (Table 2). These lakes are not fed by the Greenland Ice Sheet, therefore turbidity is low.
The boreal lake in this study, Jordan Pond, is located in Acadia National Park in Maine, USA (Figure 2; Table 2). Lakes in Acadia National Park cover 2600 acres of the approximately 35,000-acre park. Soils in Acadia are derived from granite and schist tills, and granite dominates the landscape throughout the park [43]. Representative of northern boreal forest, spruce-fir forests persist in Acadia with stands of oak, maple and beech dominant in some areas that were burned in a fire in 1947. Data from Acadia National Park’s weather station suggests average summer temperature from June through August is 19 °C and average annual precipitation is 1455 mm. Ice-out timing is variable but typically occurs between late March and late April. Jordan Pond is an oligotrophic lake with a maximum depth of 45 m and is somewhat larger than the Arctic lakes in this study.

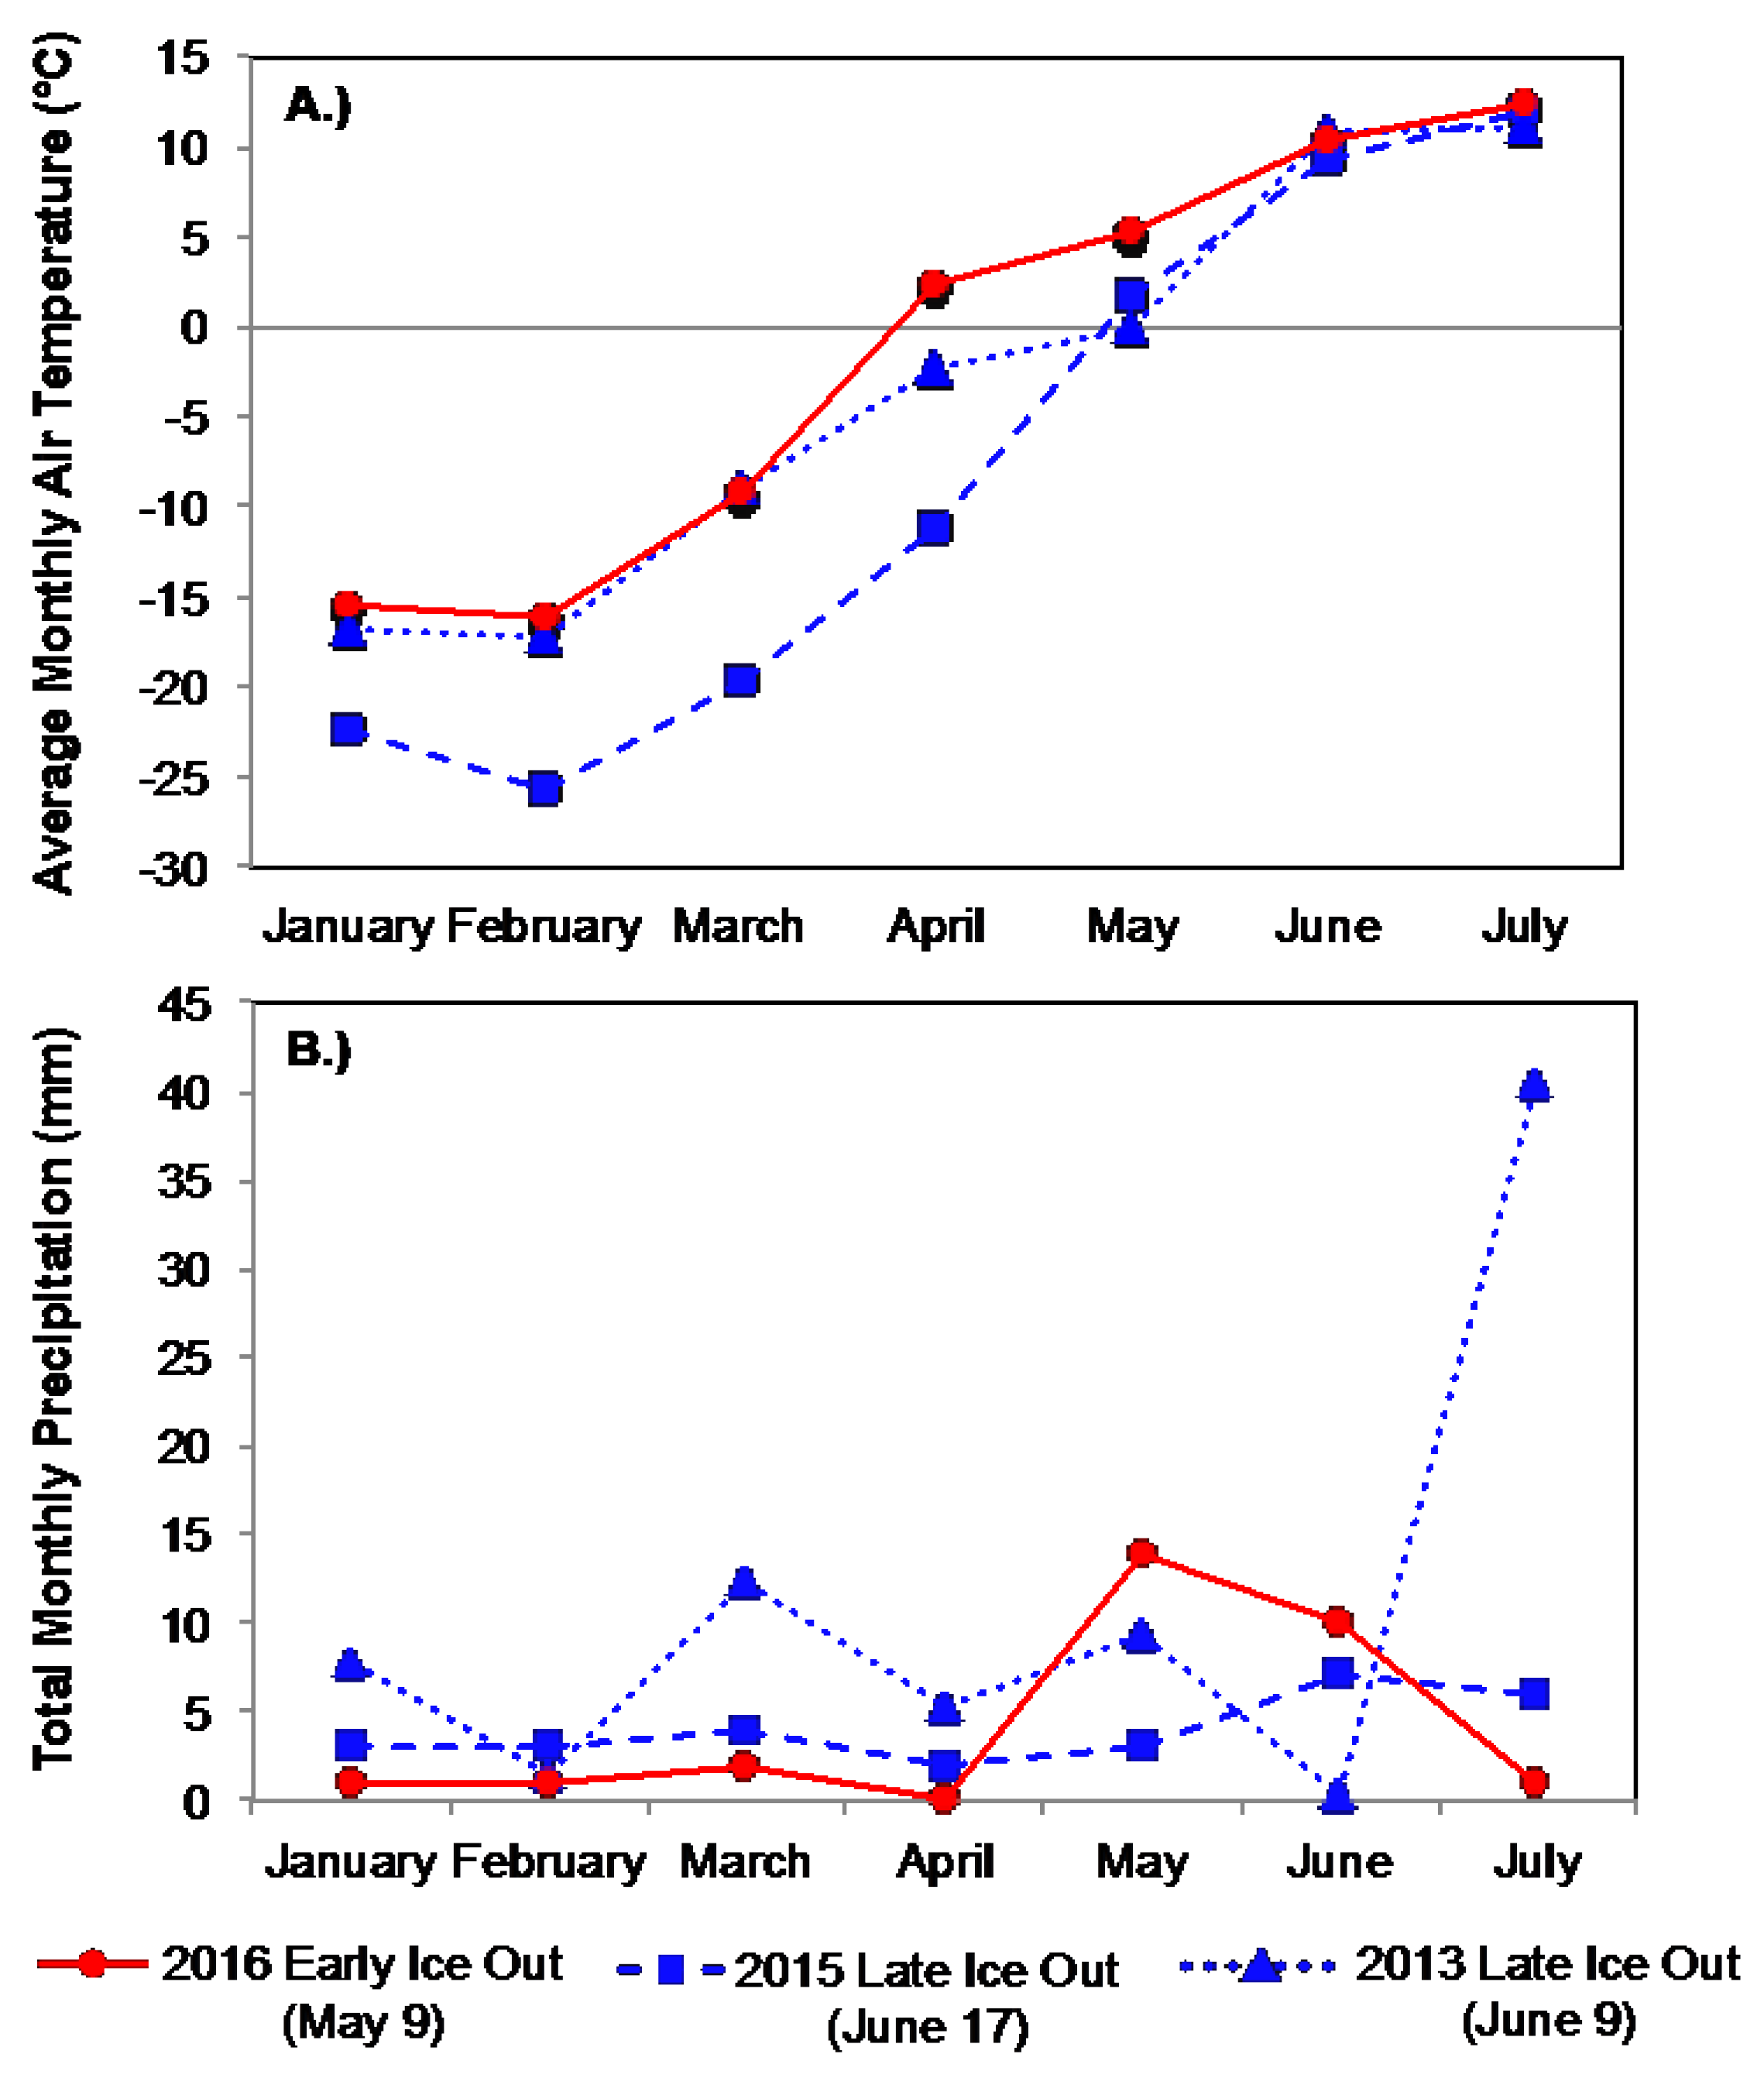
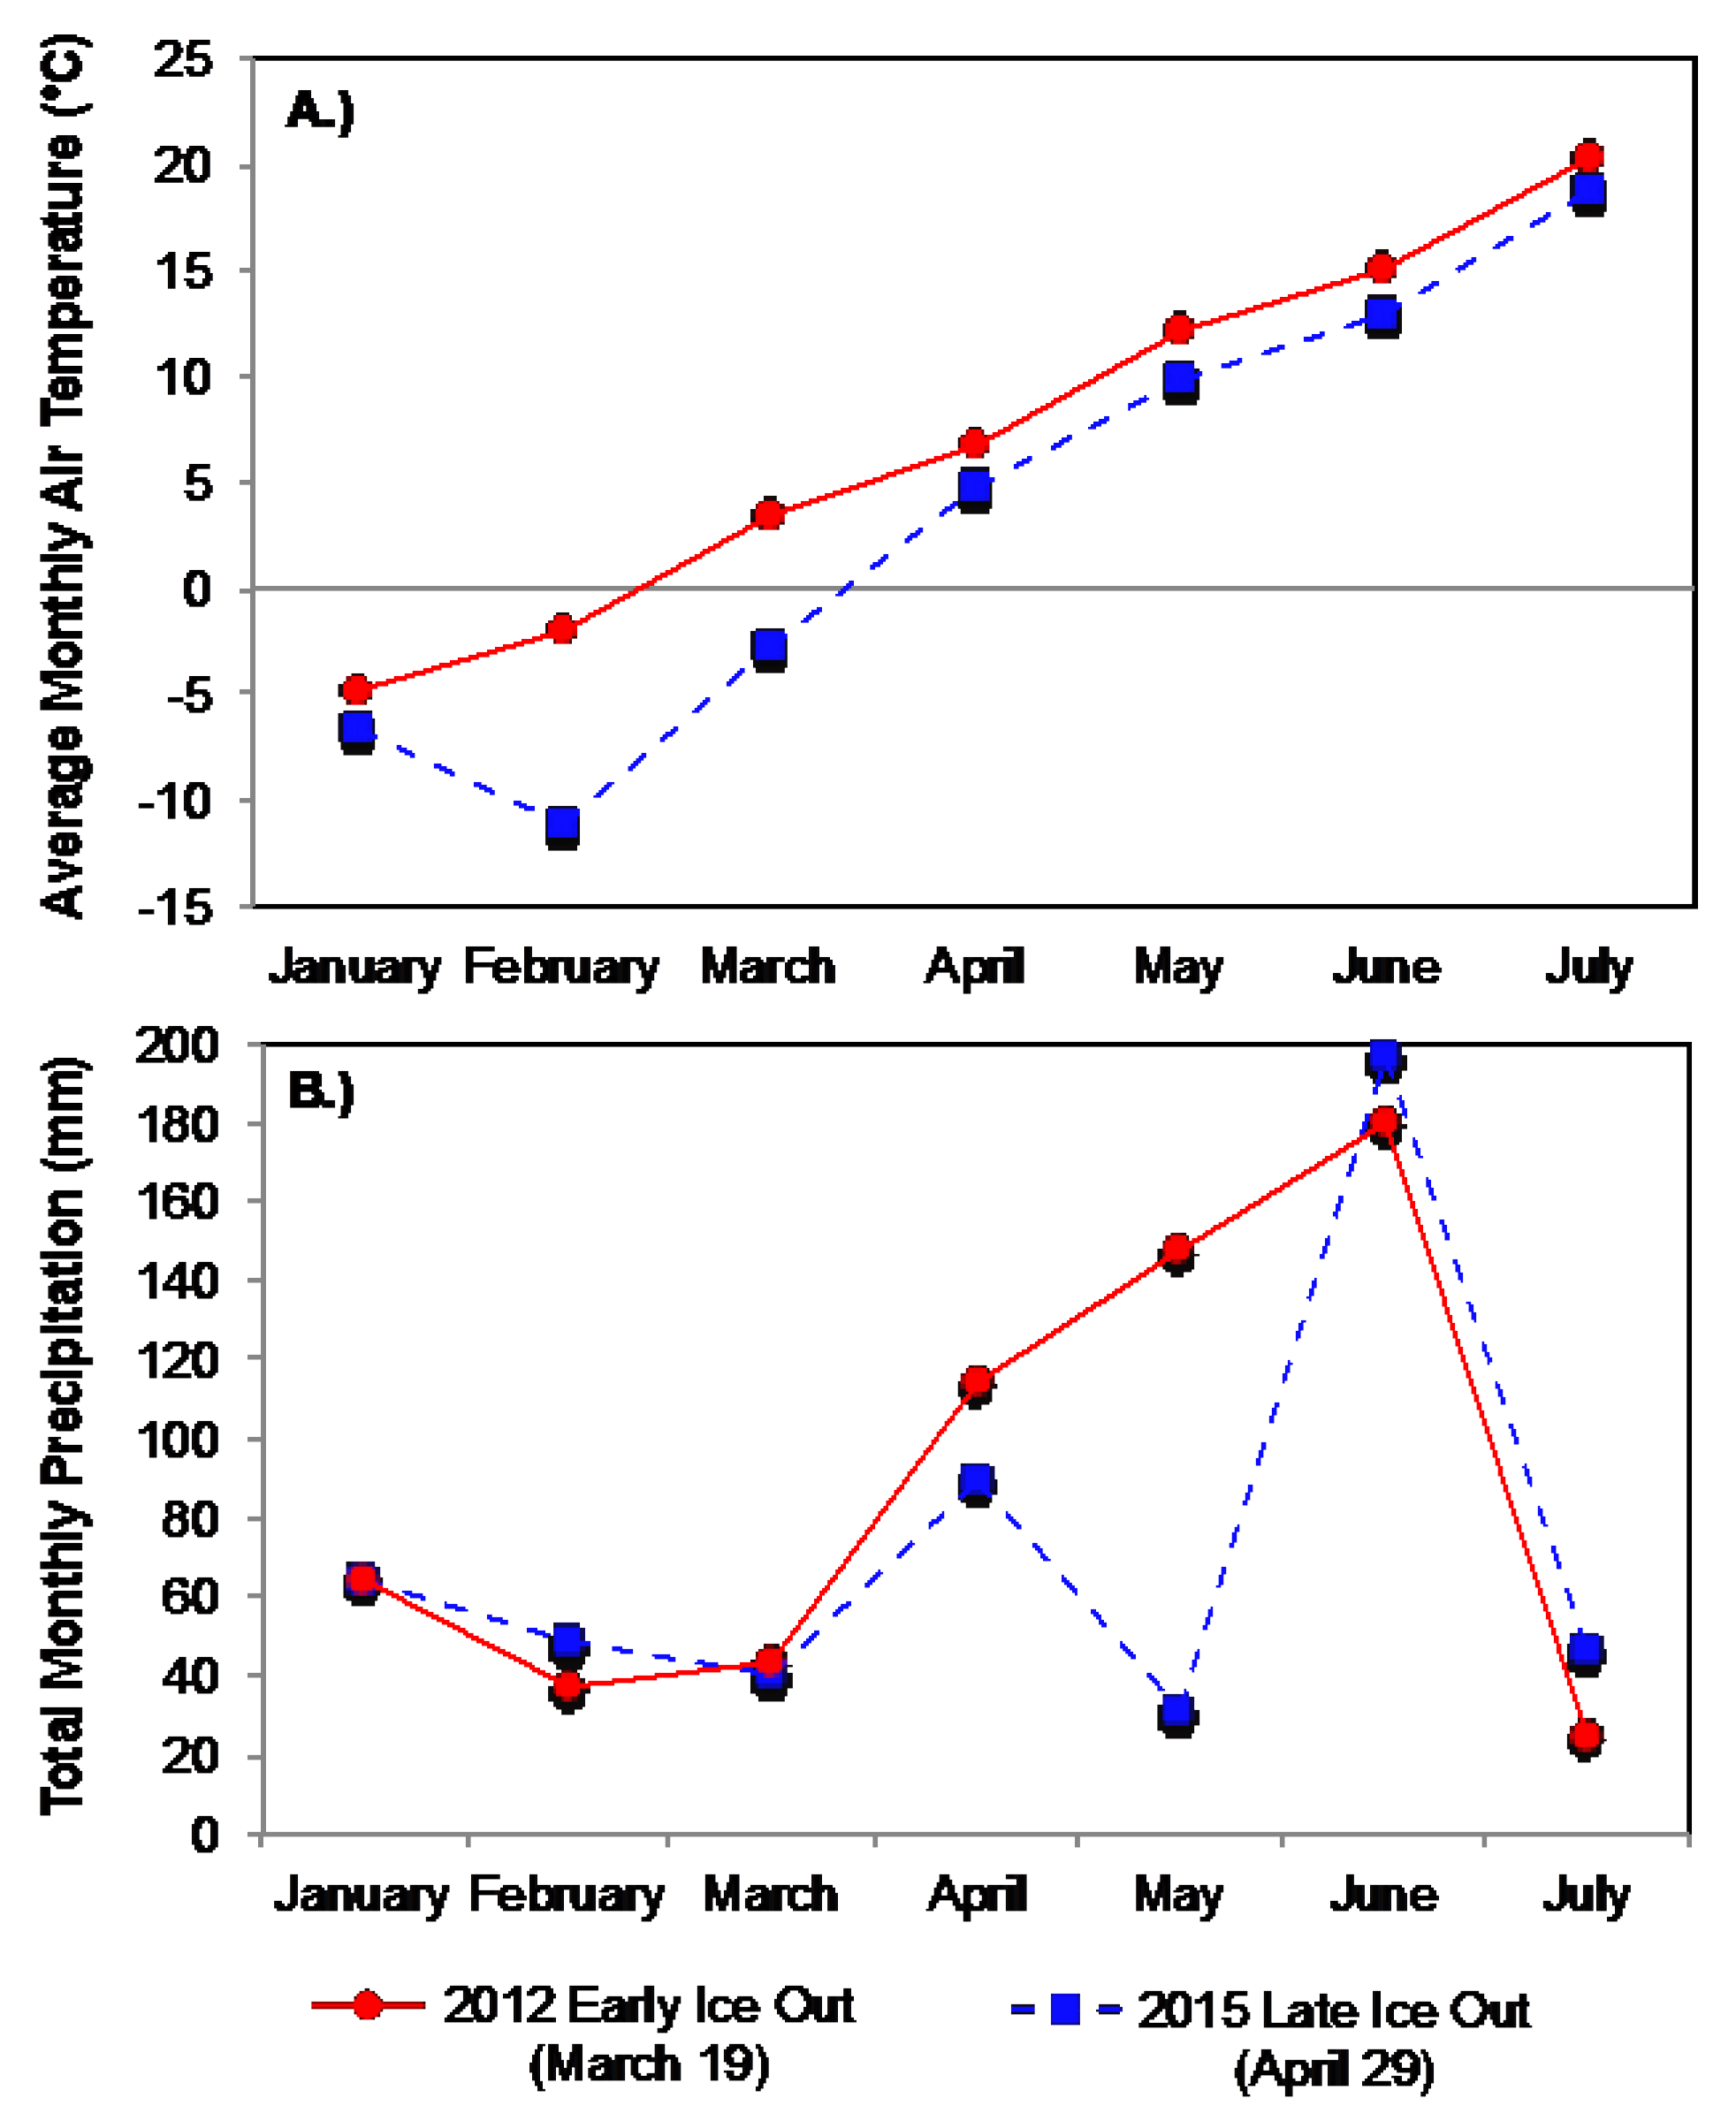
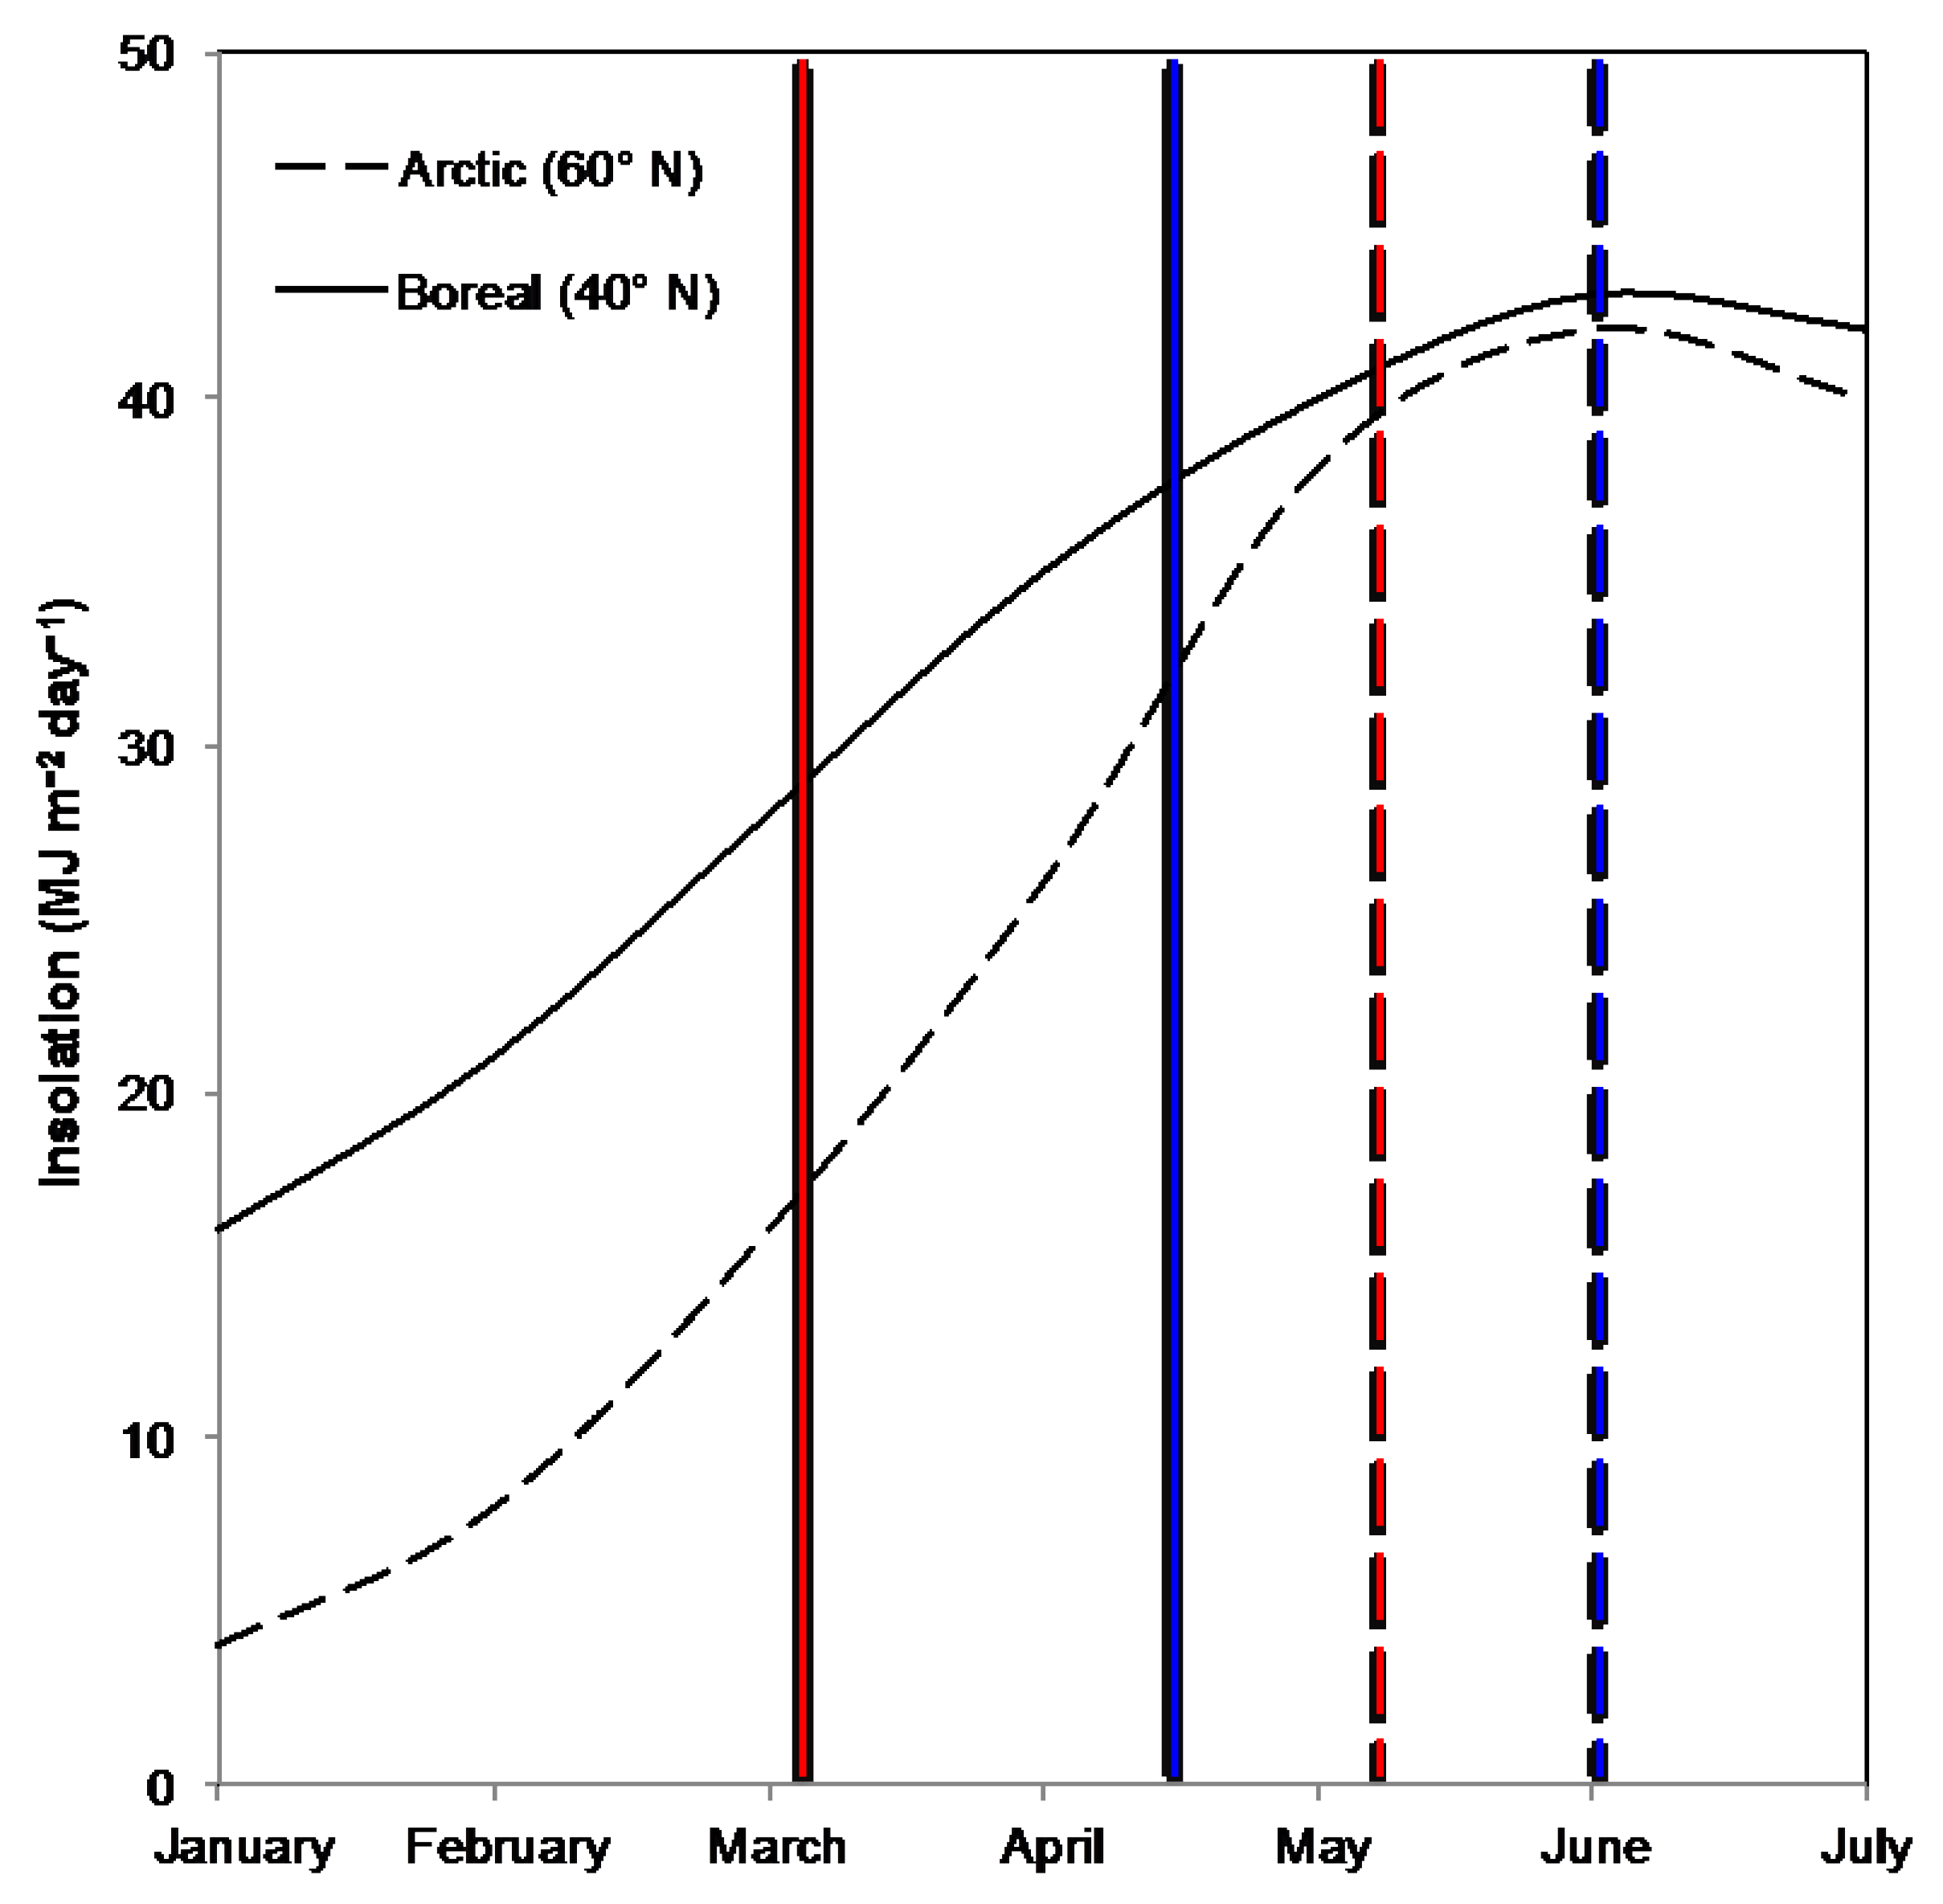
2.3. Climate Variables

Air temperature and precipitation data for Jordan Pond were collected from the Acadia National Park McFarland Hill (ACAD-MH) weather station. Air temperature and precipitation data for Kangerlussuaq and the Arctic lakes were collected from the Kangerlussuaq airport (DMI 04231) weather station.

2.4. Comparative Lake Sampling

2.4.1. Physical

Sampling across all four of the study lakes was conducted using the same methods during each of the dates listed in Table 1. Secchi depth was measured on the shady side of the boat using a black and white disc. Temperature profiles consisted of measurements at each meter down to 25 m using a YSI EXO2 Sonde (Xylem Inc., Yellow Springs, OH, USA). Epilimnion thickness was calculated based on temperature profiles and defined as the first depth at which there was ≥1 °C change per meter. Water column stability (Schmidt stability) was calculated from temperature profiles and lake bathymetry using the rLakeAnalyzer package in R [44]. The onset of stratification for the boreal lake was determined as the first day there was a ≥1 °C difference per meter in the water column.

2.4.2. Chemical

Water was collected from the epilimnion, metalimnion and hypolimnion using a van Dorn bottle at each lake for analysis of total phosphorus (TP) and dissolved inorganic nitrogen (DIN), which is the sum of nitrate (NO3) and ammonium (NH4+). For analysis of DIN, NO3 and NH4+, samples were filtered through Whatman GF/F filters pre-rinsed with deionized water. Flow injection analysis using the phenate (NH4-N) and cadmium reduction (NO3-N) methods [45] on a Lachat Quikchem 8500 (Hach Company, Loveland, CO, USA) flow injection analyzer (FIA) were used to quantify NO3 and NH4+. TP was determined from whole-water samples using persulfate digestion followed by the ascorbic acid method on a Lachat Quickchem 8500 (Hach Company, Loveland, CO, USA) flow injection analyzer [45]. After analysis, TP and DIN samples from the epilimnion, metalimnion and hypolimnion were averaged for comparison. Nutrient limitation status was identified by the ratio of DIN:TP, with DIN:TP < 1.5 indicating N limitation, DIN:TP > 3.4 indicating P limitation and values from 1.5 to 3.4 suggesting co-limitation [46].
Water from the epilimnion was used for analysis of dissolved organic carbon (DOC) concentrations and specific ultraviolet absorbance at 254 nm (SUVA254). All DOC concentration and SUVA254 samples were filtered through Whatman GF/F filters pre-rinsed with deionized water. A Shimadzu Total Organic Carbon Analyzer (Shimadzu Corporation, Kyoto, Japan) was used to analyze DOC concentrations and a Varian Carey UV-VIS spectrophotometer (Agilent Technologies, Santa Clara, CA, USA) was used to analyze SUVA254 by measuring dissolved absorbance property at 254 nm. To provide corrected dissolved absorbance values, a Milli-Q deionized water blank was subtracted from the raw absorbance values and Naperian dissolved absorption coefficients were calculated using the following equation [47]:
a d   = 2.303   ×   D r
where D is the decadal optical density value from the spectrophotometer and r (measured in meters) is the path length of the quartz cuvette. The DOC-specific absorption coefficient, SUVA254, was calculated by dividing ad (254 nm) by the DOC concentration (mg C L−1).

2.4.3. Biological

Water was also collected from the epilimnion, metalimnion and hypolimnion at each lake using a van Dorn bottle to determine phytoplankton biomass (as chlorophyll a). Chlorophyll samples from each depth were filtered through 25 mm Whatman GF/F filters, wrapped in aluminum foil and frozen until analysis. All chlorophyll a samples were analyzed within three weeks of filtration and processed using standard methods [45]. Filters were ground and 90% acetone was used to extract chlorophyll overnight, then samples were centrifuged and a Varian Cary UV-VIS spectrophotometer (Agilent Technologies, Santa Clara, CA, USA) was used to analyze chlorophyll a concentrations. After analysis, chlorophyll a values from all three depths were averaged on each date to capture a water column average.
We also assessed the response of key diatom taxa that are demonstrated indicators of climate-driven lake ecosystem changes. The relative abundances of Cyclotella sensu lato taxa are often correlated with changes in the timing of ice-out [15] and mechanistically have been linked to thermal structure [48]. Two 50-mL centrifuge tubes were collected from the epilimnion, metalimnion and hypolimnion from each of the four study lakes on all samples dates. In the boreal lake, phytoplankton samples were available for many dates over the two years of interest; we present results across the entire study period for this lake to demonstrate how the two focal spring and summer dates fit into the full seasonal pattern for this lake. All samples were preserved with Lugol’s solution, settled in Utermohl chambers and counted using a Nikon Eclipse TS-100 (Nikon Instruments Inc., Tokyo, Japan) inverted microscope at 400× magnification.

2.5. Data Analysis

To evaluate patterns in lake metrics in each region, responses of the three Arctic lakes were averaged (mean ± standard error) on each date. Qualitative comparisons were made across all data, as the limited sample size and the unequal number of sites between the two regions did not provide enough power to conduct more advanced statistical analyses.

3. Results

3.1. Arctic Region

In the Arctic lakes, ice-out occurred 30 days earlier in 2016 (18 May) compared to 2015 (17 June) and 22 days earlier compared to 2013 (9 June). Air temperatures differed between early and late ice-out years. During the early ice-out year, monthly average air temperatures were 6.9 to 13.7 °C higher from January to April with the biggest temperature differences in March (10.5 °C higher) and April (13.7 °C higher) compared to the 2015 late ice-out year (Figure 3). Average May temperature was 3.7 °C higher in the early ice-out year compared to the 2015 late ice-out year (Figure 3). Air temperatures in the early ice-out year were 0 to 1.5 °C higher from January to March compared to the 2013 late ice-out year (Figure 3). The largest temperature differences between the early ice-out year and the 2013 late ice-out year were in April (4.7 °C higher) and May (5.5 °C higher). Air temperatures were similar in June and July between the early ice-out year and the 2013 and 2015 late ice-out years (Figure 3).
Precipitation varied among early and late ice-out years. Precipitation during the early ice-out year was 2 mm lower in each month from January to April, however in May precipitation was 11 mm higher in the early compared to the 2015 late ice-out year (Figure 3). During the early ice-out year, precipitation in June was 3 mm higher and precipitation in July was 5 mm lower than the 2015 late ice year (Figure 3). Precipitation from January to April was lower in the early ice-out year compared to the 2013 late ice-out year with precipitation differences ranging from 0 to 10 mm less (Figure 3). During the early ice-out year, May precipitation was 5 mm higher and in June precipitation was 10 mm higher compared to the 2013 late ice-out year. In July, precipitation was 39 mm lower in the early ice-out year compared to the 2013 late ice-out year (Figure 3).

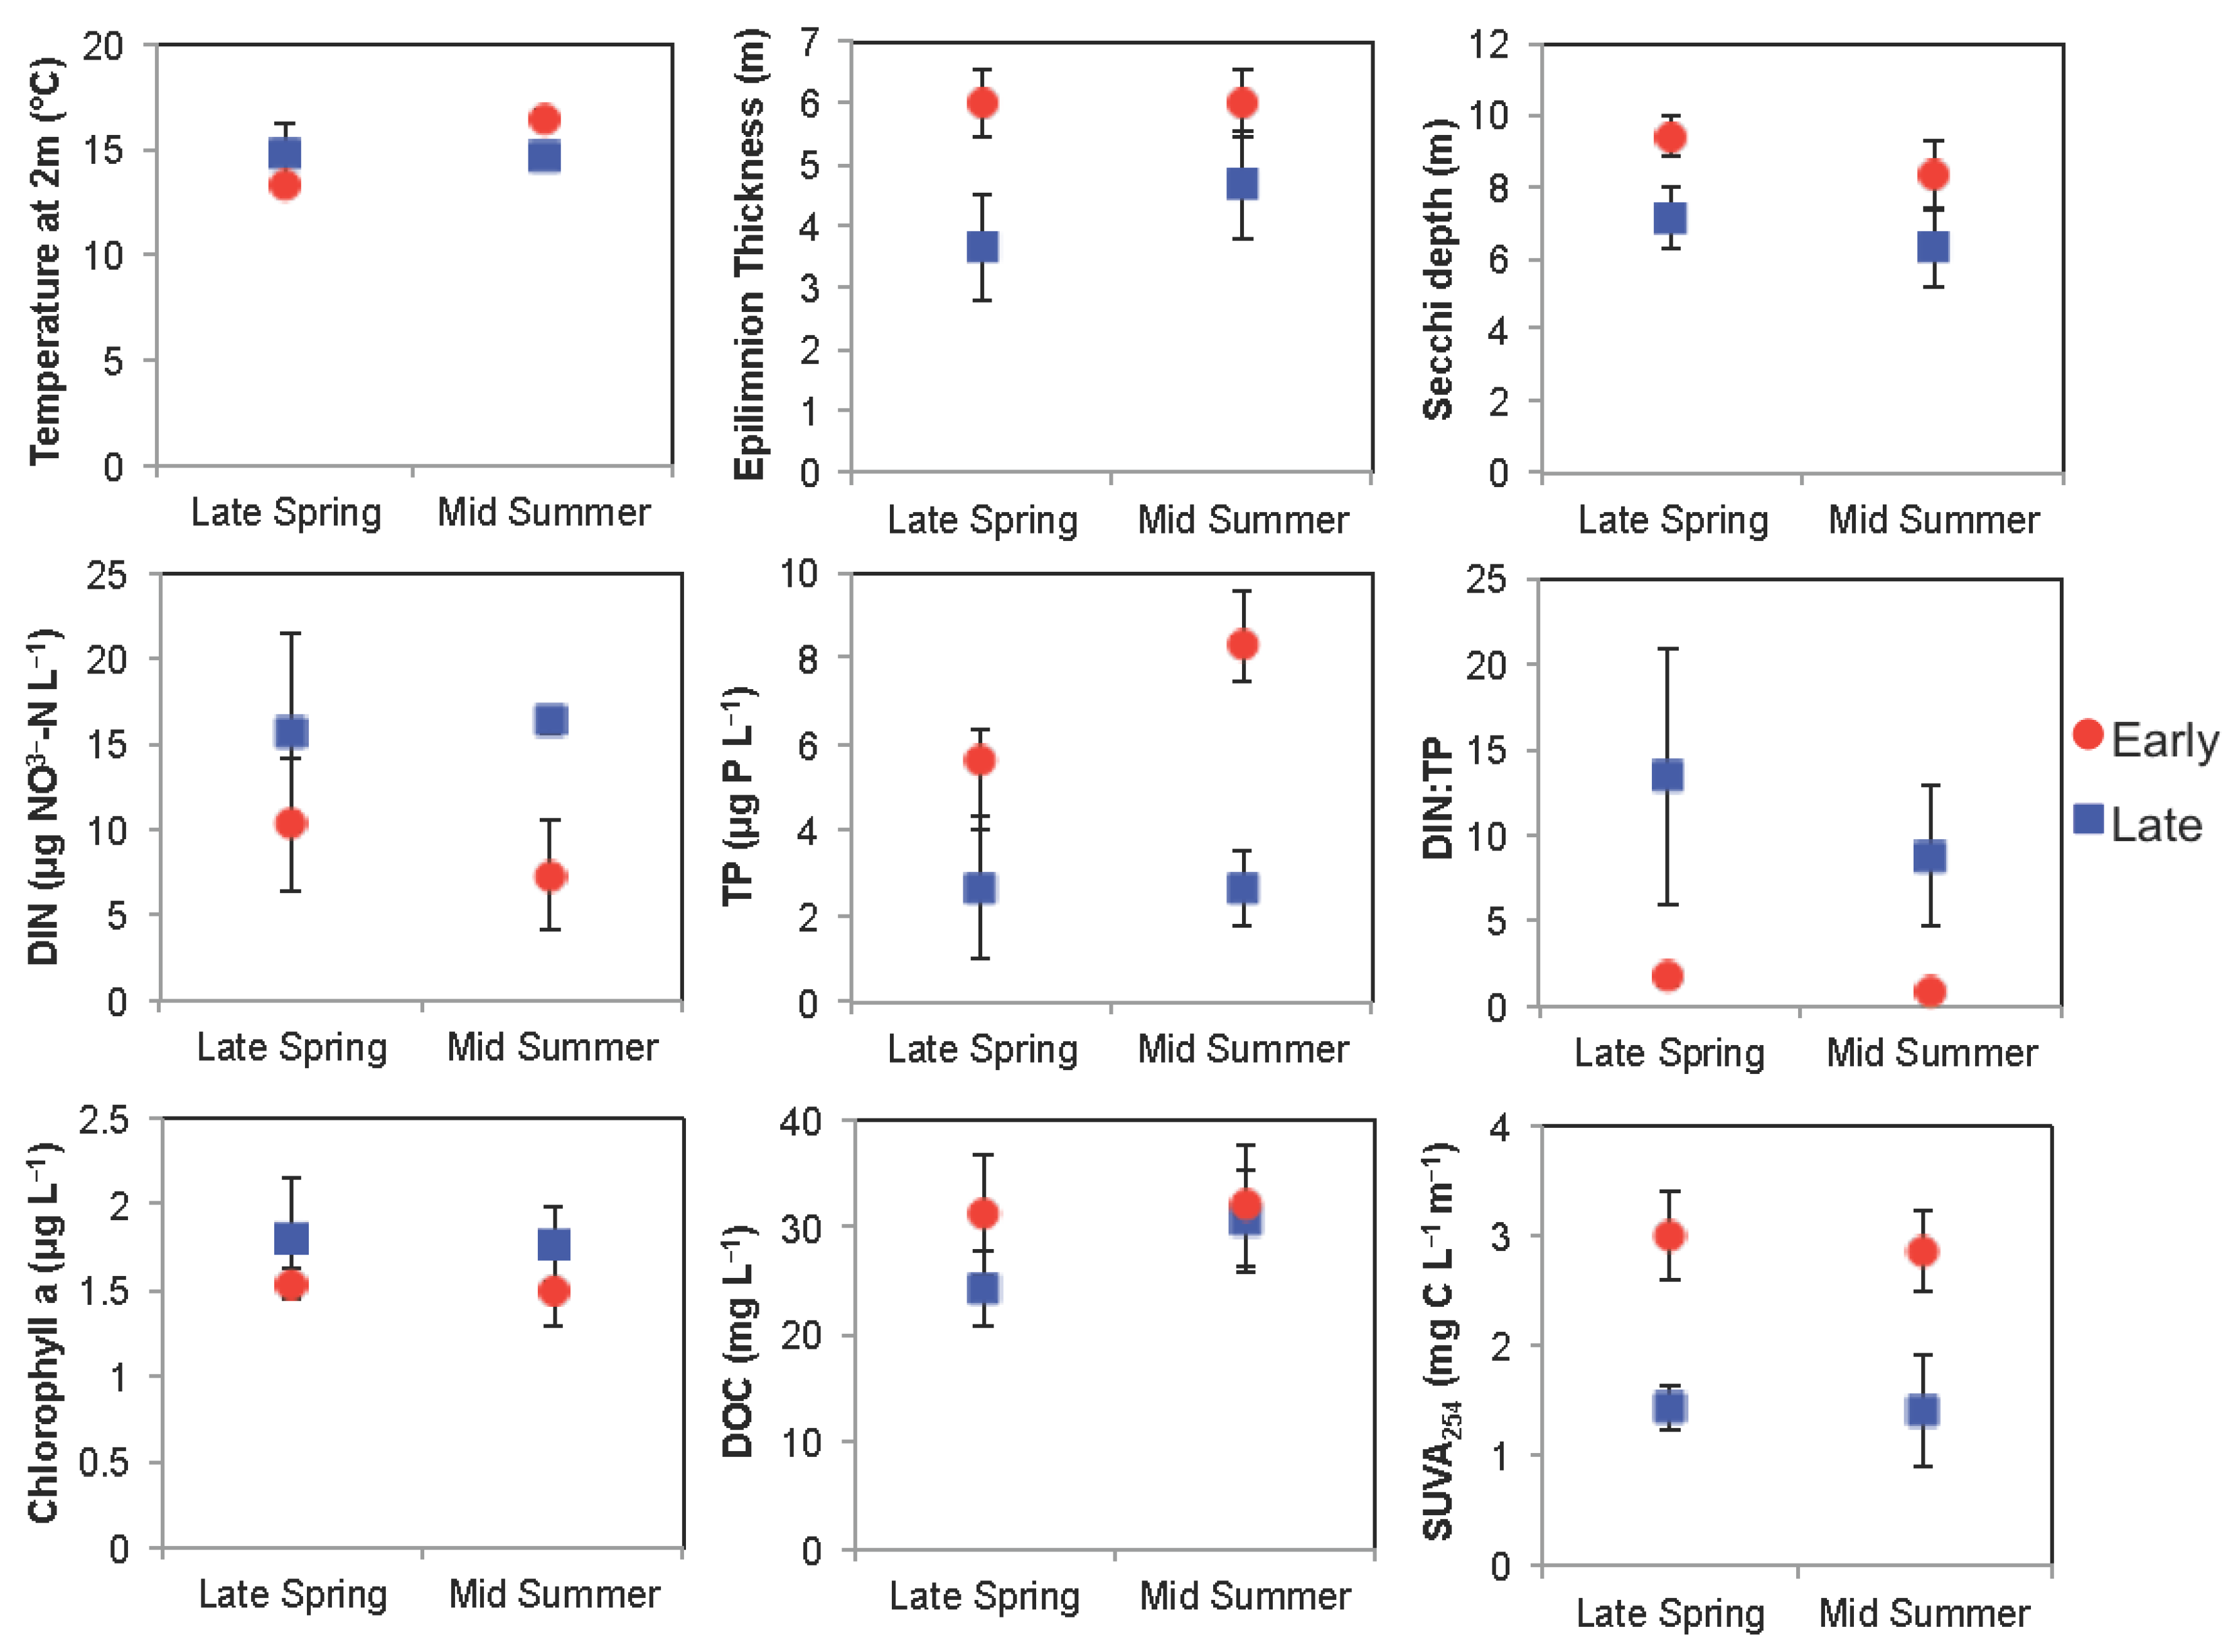
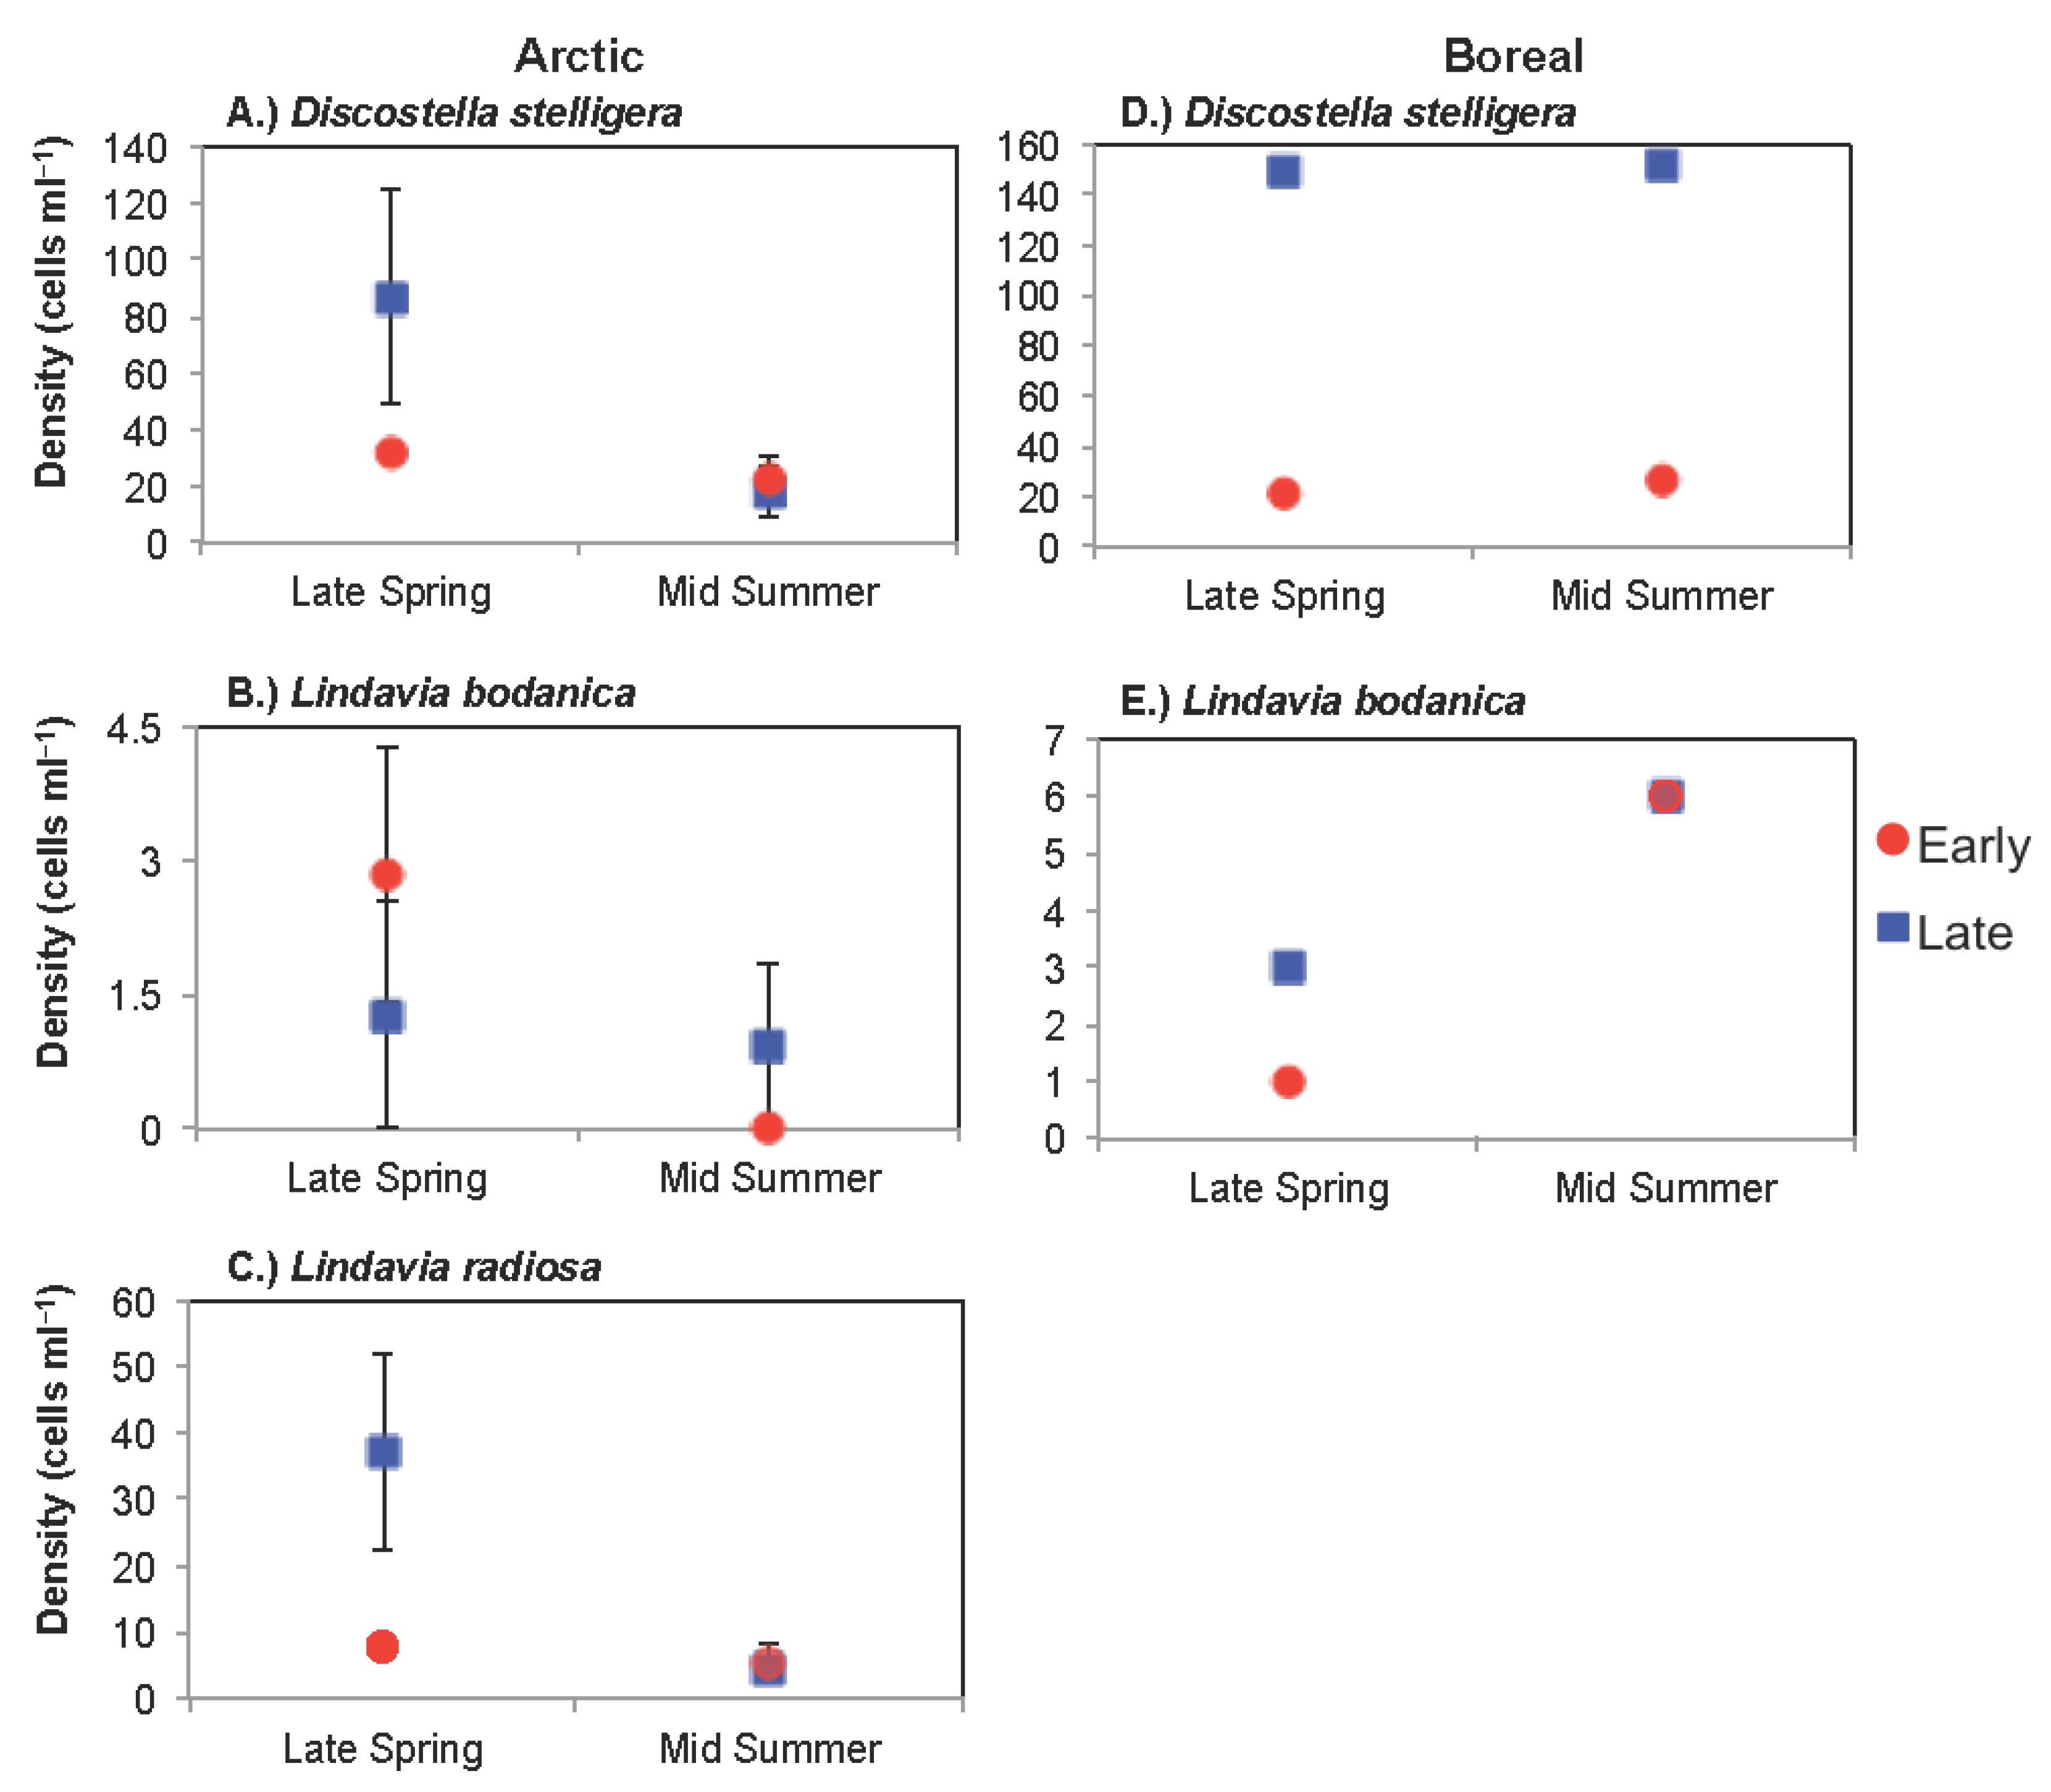
3.1.1. Comparison of Spring Response across Early and Late Ice-out Years

Physical variables of lakes differed in spring between the two years. Water temperature at 2 m was 1.4 °C lower during the early ice-out year compared to the late ice-out year (2015; Figure 4). In the early ice-out year, mixing depths were deeper and water clarity was greater compared to the late ice-out year, with epilimnion thickness 2.3 m greater and Secchi depth 2.3 m deeper in the early ice-out year compared to the late ice-out year (Figure 4). Water column stability was 20 J m−2 lower during the early ice-out compared to late ice-out year.
Differences across biogeochemical metrics in Arctic lakes in the spring season were variable across early and late ice-out years. DIN and TP had opposite responses in the spring for the two ice-out years. DIN was 5 μg N L−1 lower and TP was 3 μg P L−1 greater in the early ice-out year compared to the late ice-out year. DIN:TP was 1.7 (indicative of co-limitation by N and P) in the early ice-out year compared to 13 (indicative of P limitation) in the late ice-out year (Figure 4). DOC concentration was higher in the early ice-out year by 6.8 mg L−1 and SUVA254 was higher by 1.6 mg C L−1 m−1 during early ice-out compared to late ice-out (Figure 4).
In terms of algal response, algal biomass was similar in early and late ice-out years. Average integrated chlorophyll a concentration was 0.3 μg L−1 lower in the early ice-out compared to the late ice-out year (Figure 4). Diatom cell densities of the three centric species were different in spring for early and late ice-out years. D. stelligera was three times lower in the early ice-out year (by 55 cells mL−1) compared to late ice-out. L. bodanica was 1.6 cells mL−1 higher in the early ice-out year compared to the late ice-out year. L. radiosa was five times lower (29 cells mL−1) in the early ice-out year compared to late ice-out (Figure 5).

3.1.2. Comparison of Summer Response across Early and Late Ice-Out Years
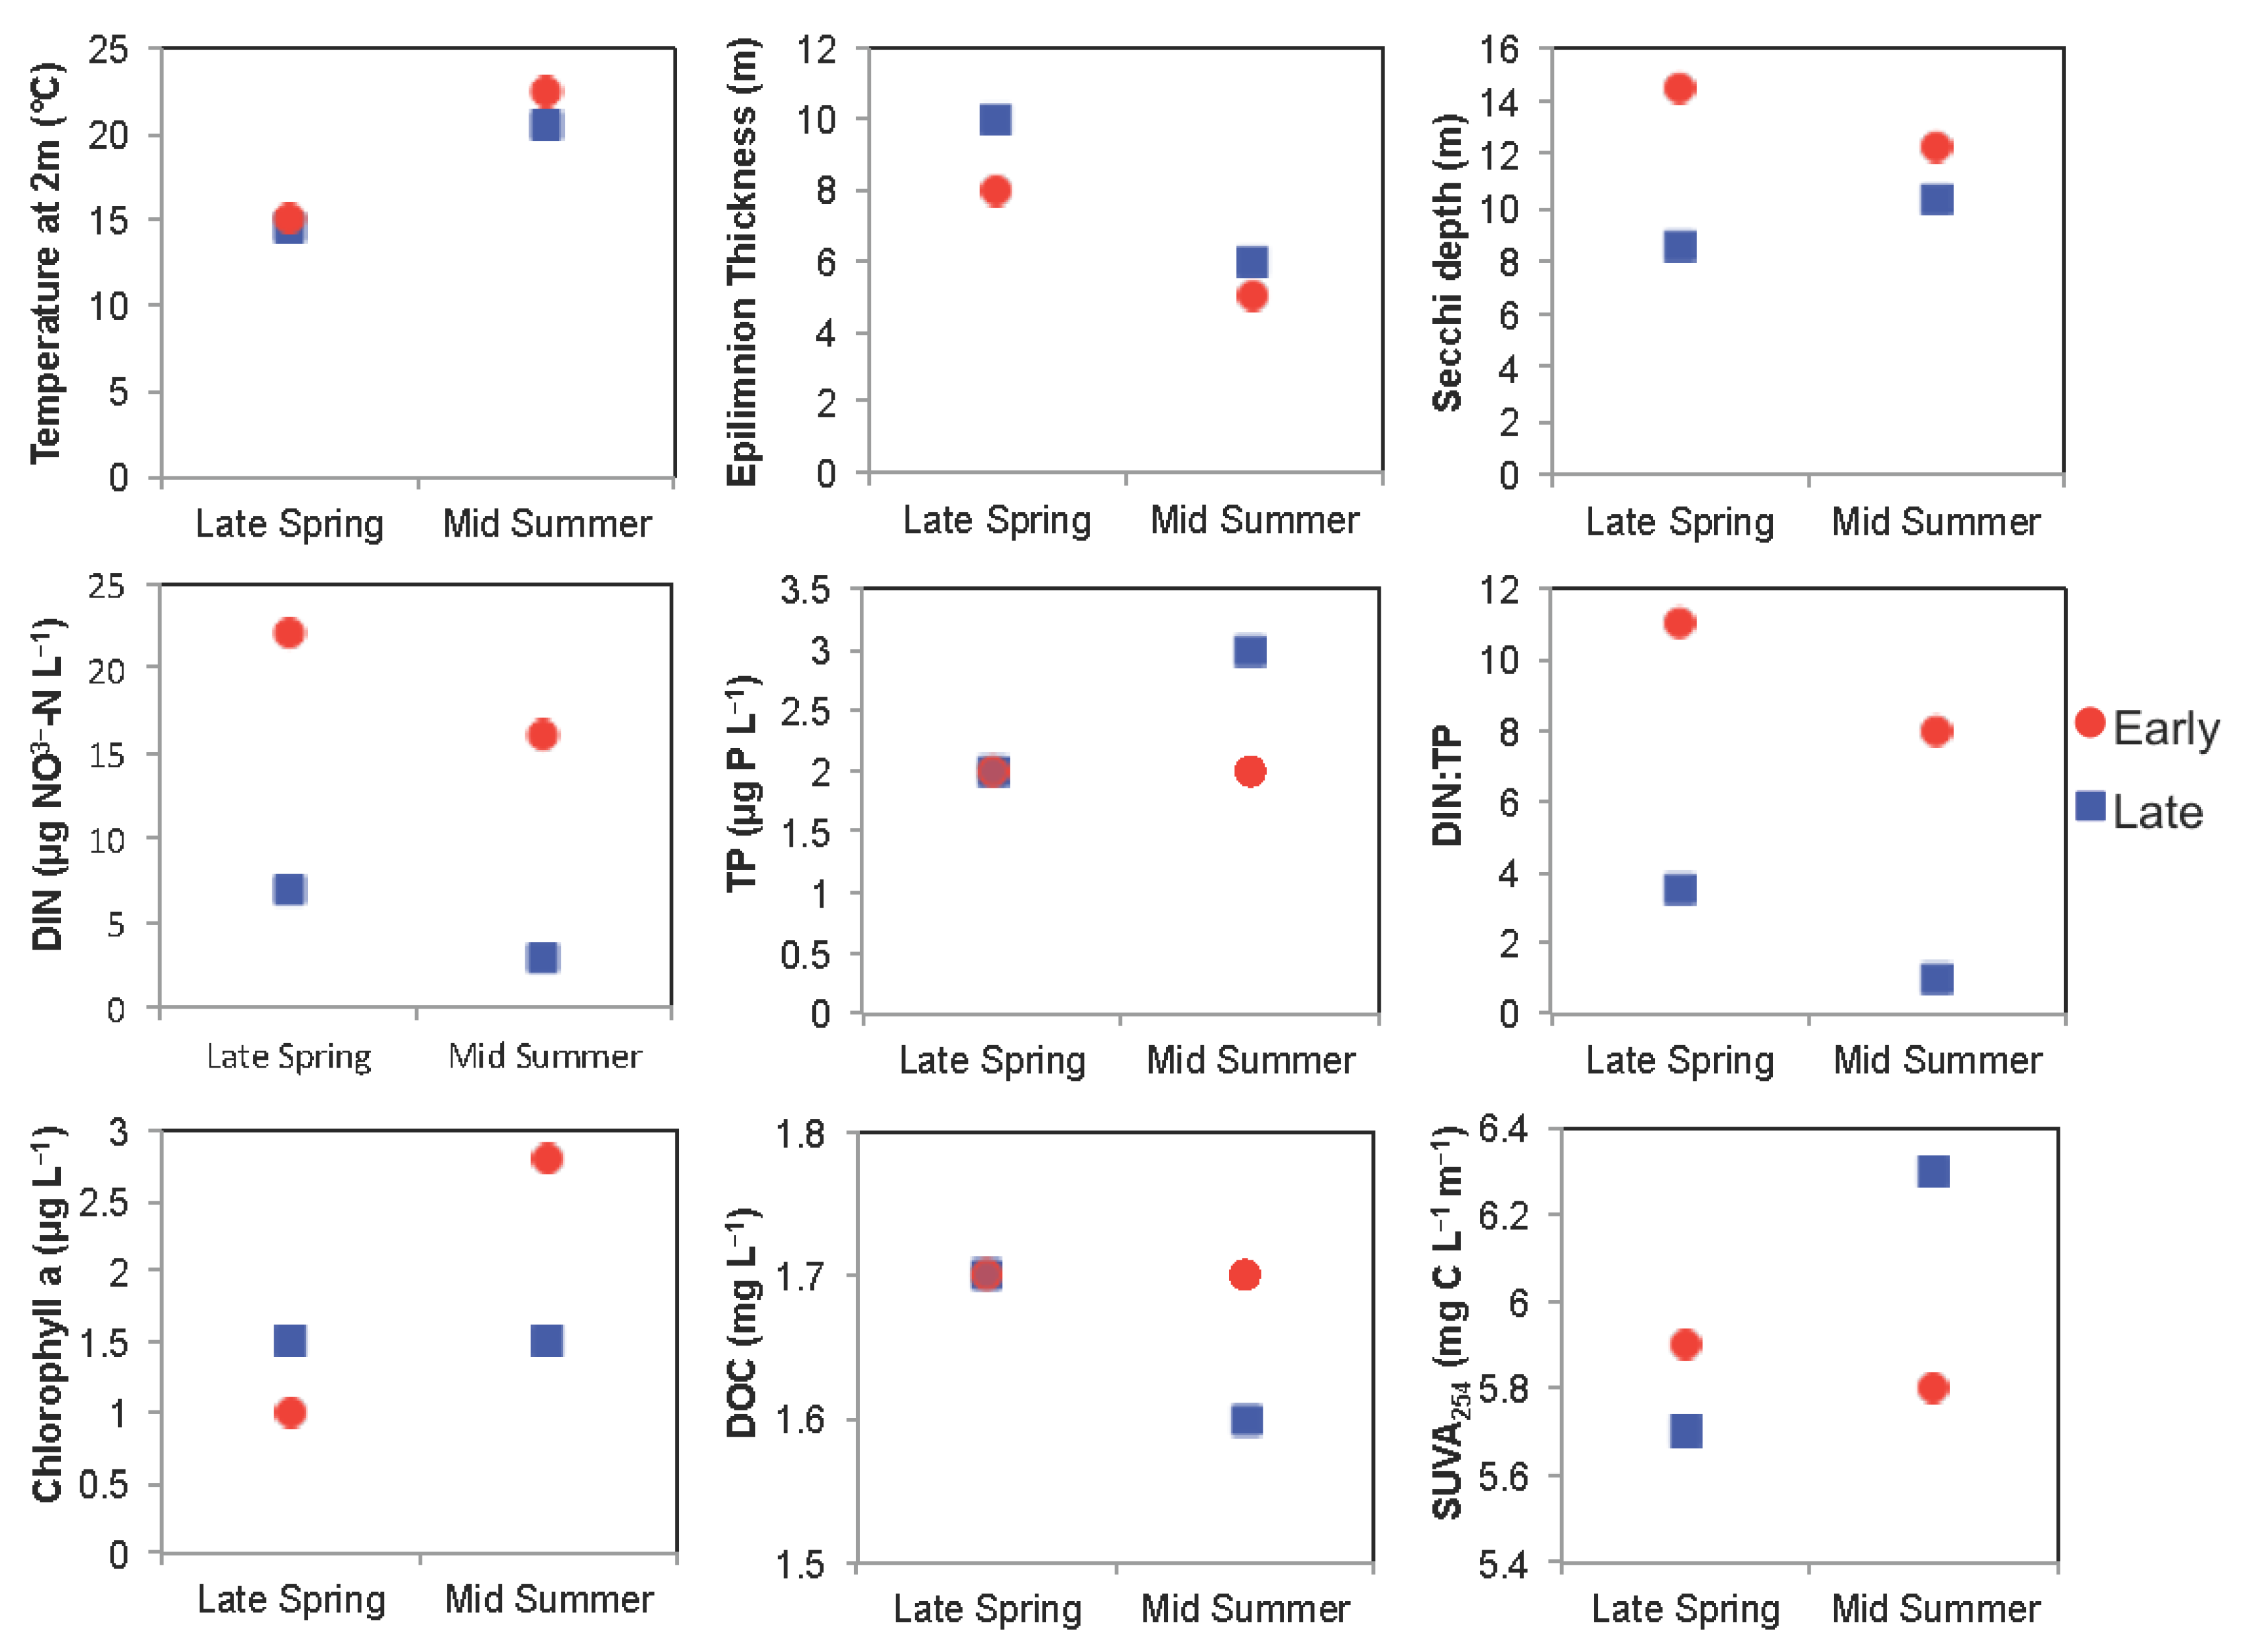
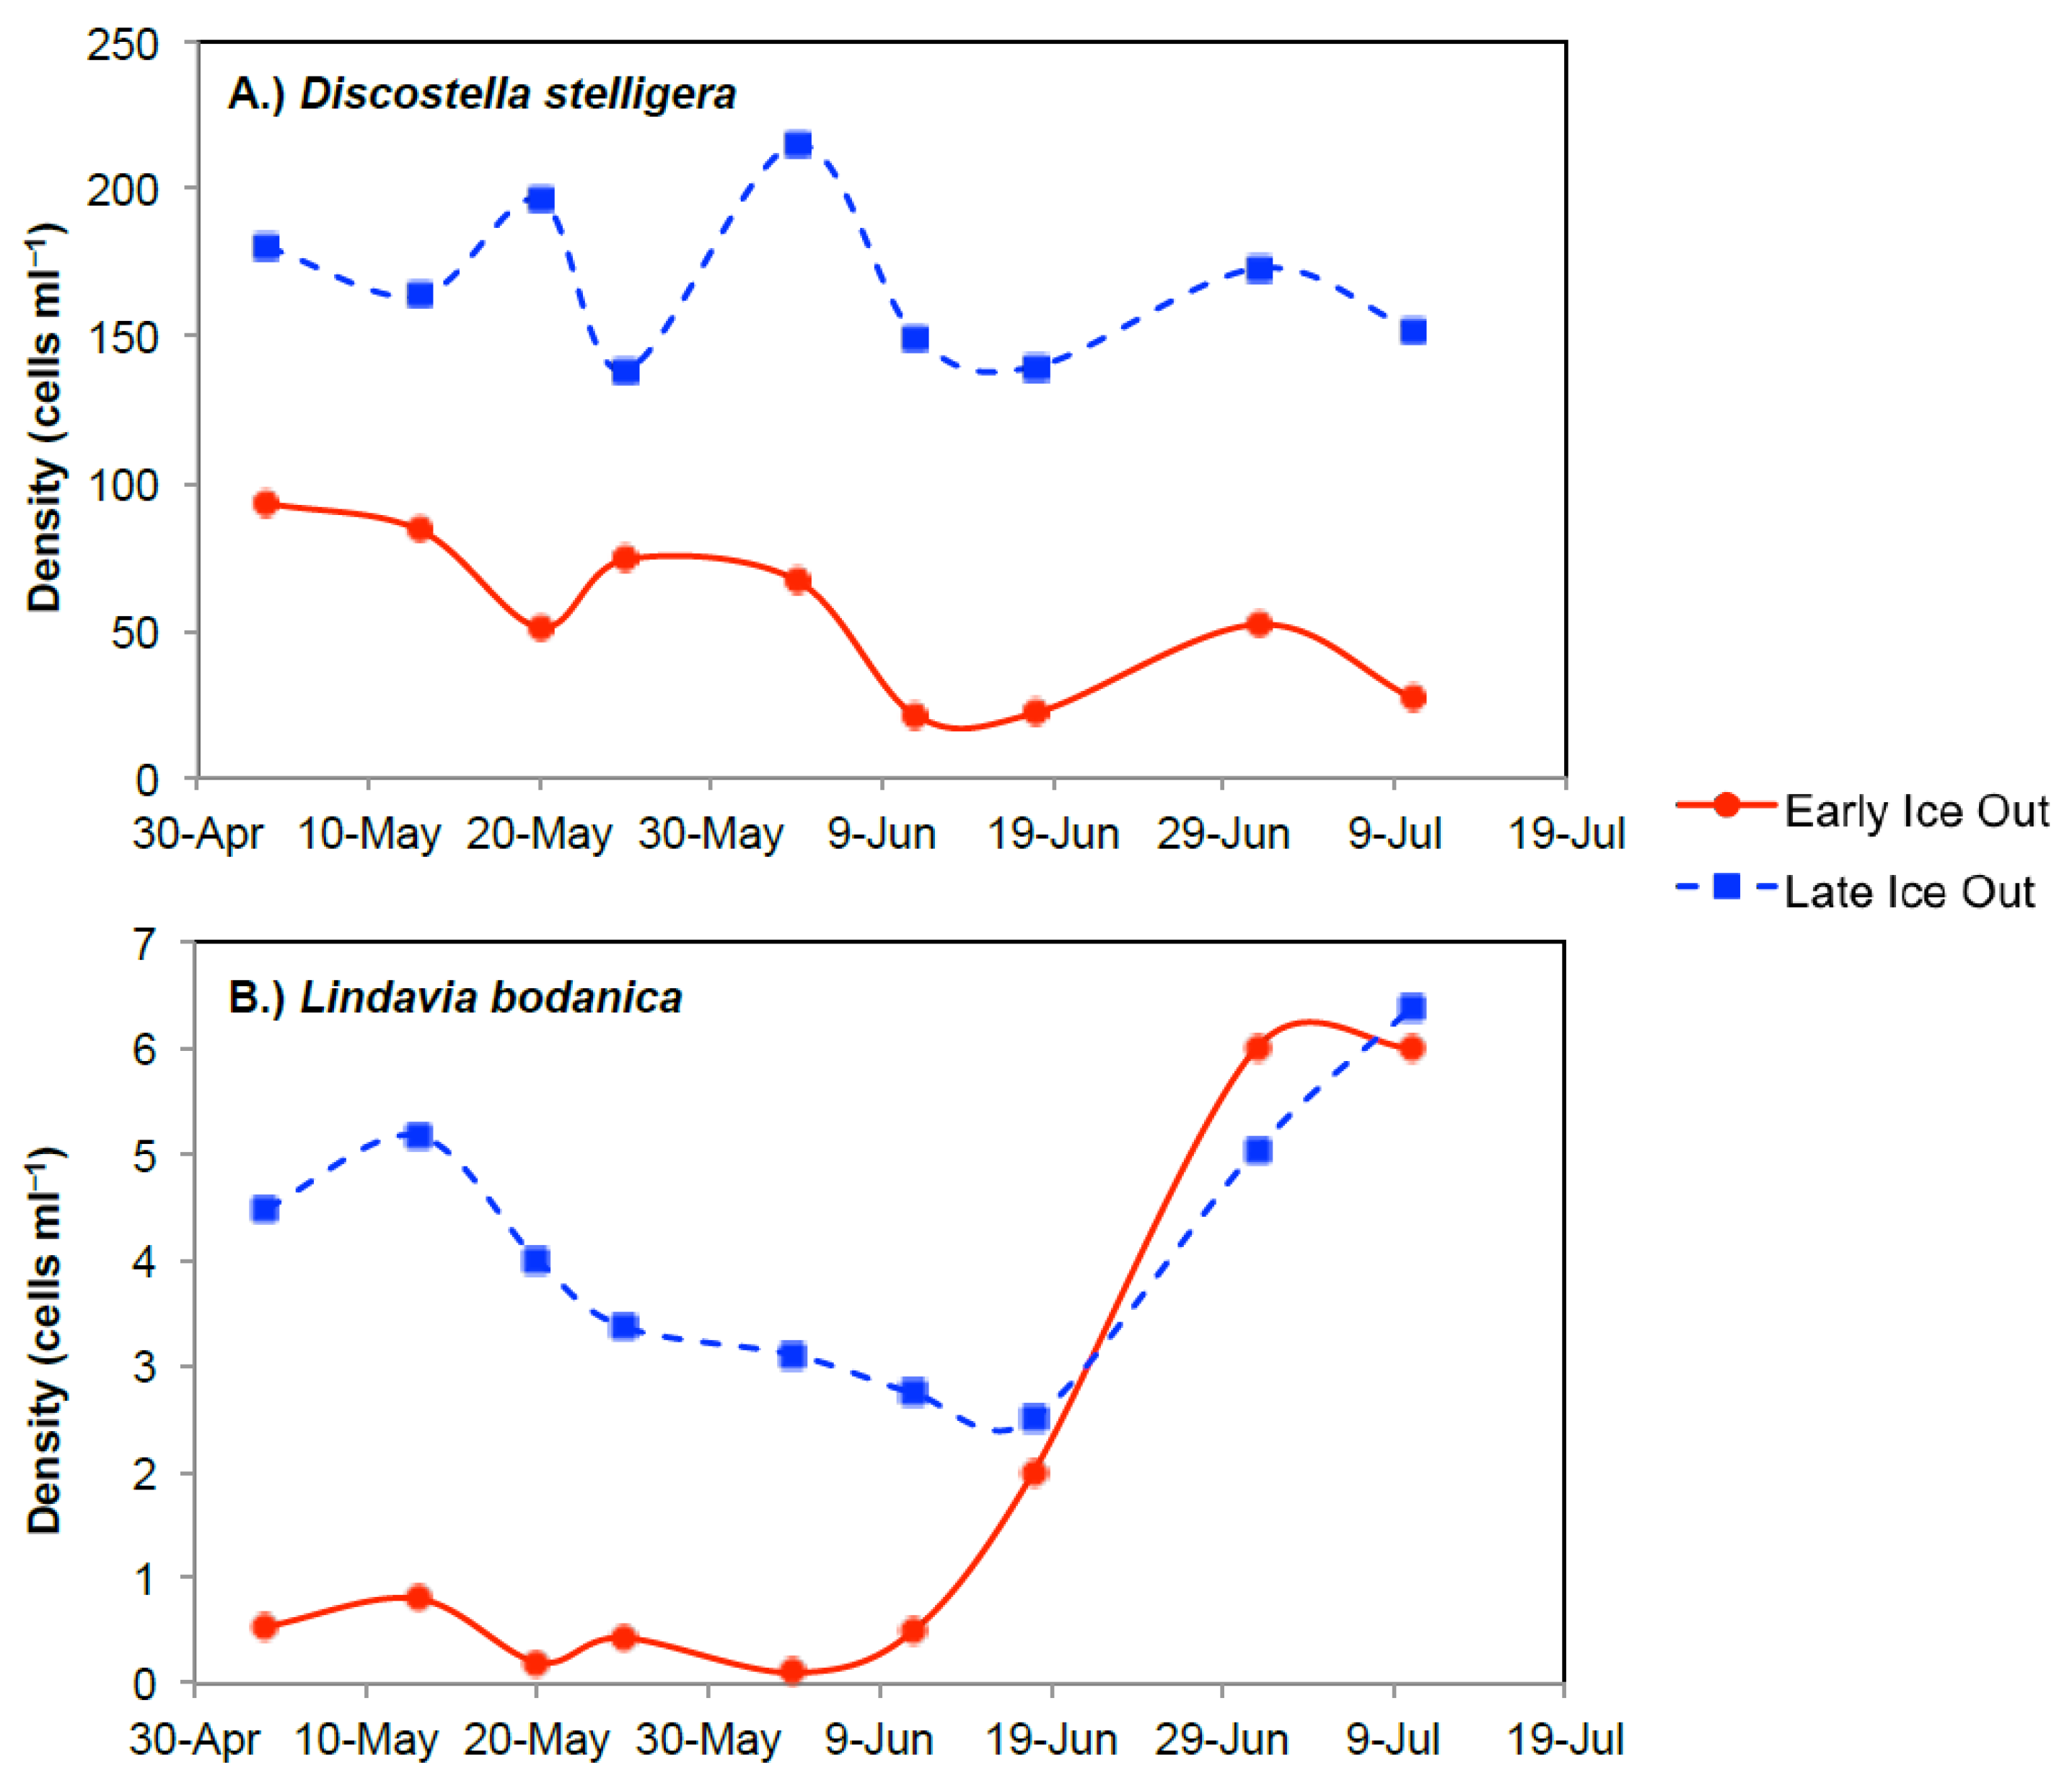
Water temperature at 2 m was 1.8 °C higher in the early ice-out year compared to the late ice-out year (2013), the opposite of spring conditions (Figure 4). The deeper mixing depths and greater water clarity in the early ice-out year were sustained from spring, with epilimnion thickness 1.3 m greater and Secchi depth 2 m deeper in the early ice-out year compared to the late ice-out year (Figure 4). Stability was 14 J m−2 higher in the early ice-out year compared to the late ice-out year; the opposite of spring conditions (Figure 4).
Biogeochemical metrics were variable in the summer season between early and late ice-out years. DIN and TP responded the same as during spring conditions. DIN was 9 μg N L−1 lower and TP was 6 μg P L−1 greater in the early ice-out year compared to the late ice-out year and DIN:TP was 0.9 (indicating N limitation) in the early ice-out year compared to 8.8 (indicating P limitation) in the late ice-out year (Figure 4). DOC concentration was higher in the early ice-out year by 1.3 mg L−1 and SUVA254 was higher by 1.5 mg C L−1m−1 during early ice-out compared to late ice-out (Figure 4).
For algal biomass, average integrated chlorophyll a was 0.3 μg L−1 lower in the early ice-out year compared to late ice-out, the same as during spring conditions (Figure 4). Diatom cell densities of the three centric species were similar between early and late ice-out years in summer, demonstrating a different response from spring conditions (Figure 5).

3.2. Boreal Region

In Jordan Pond, ice-out occurred 41 days earlier in the early ice-out year, on 19 March 2012 compared to the late ice-out year in which ice-out occurred on 29 April 2015. Air temperature differences between the two years were largest in February and March and the largest precipitation differences occurred in May. In the early ice-out year, air temperatures were 9.3 °C higher in February and 6.2 °C higher in March compared to the late ice-out year (Figure 6). In January and from April to May, air temperature was 1.9 °C higher and ranged from 1.5 °C to 2.3 °C higher in the early ice-out year in comparison to the late ice-out year (Figure 6). Precipitation in April and May was 25 mm and 116 mm higher in the early ice-out year compared to the late ice-out year (Figure 6). In January and March, precipitation was similar during both early and late ice-out years and in February, June and July, precipitation was slightly lower in the early ice-out year compared to the late ice-out year (Figure 6).

3.2.1. Comparison of Spring Response across Early and Late Ice-Out Years

Physical parameters of Jordan Pond varied between early and late ice-out years in spring. Water temperature at 2 m was 0.5 °C higher in the early ice-out year compared to the late ice-out year (Figure 7). In the early ice-out year, mixing depths were shallower and water clarity was greater. Epilimnion thickness was 2 m shallower and Secchi depth was 5.9 m deeper in the early ice-out year compared to the late ice-out year (Figure 7). Water column stability was 51 J m−2 higher in the early ice-out year compared to the late ice-out year (Figure 7). The onset of stratification in the 2012 early ice-out year was on 18 May and on 20 May during the 2015 late ice-out year.
Biogeochemical metrics were variable in the spring between the two years. DIN concentration was higher by 15 μg N L−1 and TP concentration was the same (2 μg P L−1) in the early ice-out year compared to the late ice-out year and DIN:TP was 11 (indicating P limitation) in the early ice-out year compared to 3.5 (also P limitation) in the late ice-out year (Figure 7). DOC concentrations were equal for early and late ice-out (1.7 mg L−1) and SUVA254 was higher by 0.2 mg C L−1 m−1 for early ice-out compared to late ice-out (Figure 7).
Algal biomass was similar in early and late ice-out years during the spring. The average integrated chlorophyll a concentration was 1.0 μg L−1 in the early ice-out year compared to 1.5 μg L−1 in the late ice-out year (Figure 7). Diatom cell densities in spring of the two centric species present, D. stelligera and L. bodanica, were both lower in the early ice-out compared to late ice-out year, however the magnitude of response of the two species varied. D. stelligera was seven times lower in the early ice-out year (129 cells mL−1) compared to late ice-out. L. bodanica was 2 cells mL−1 or three times lower in the early ice-out year compared to the late ice-out year (Figure 5).

3.2.2. Comparison of Summer across Early and Late Ice-Out Years

In summer, conditions of physical lake metrics were sustained from spring. In the early ice-out year, mixing depths remained shallower and water clarity was greater. Epilimnion thickness was 1 m shallower and Secchi depth was 2 m deeper in the early ice-out year compared to the late ice-out year (Figure 7). Stability in summer was 227 J m−2 higher in the early ice-out year compared to the late ice-out year (Figure 7).
Biogeochemical metrics varied in response between early and late ice-out years and also with season. DIN, TP and DIN:TP were similar across seasons. DIN was 13 μg N L−1 higher and TP was 1 μg P L−1 lower in the early ice-out year compared to the late ice-out year and DIN:TP was 8 (indicating P limitation) in the early ice-out year compared to 1 (indicating N limitation) in the late ice-out year (Figure 7). DOC quantity and quality differed across seasons during early and late ice-out years. DOC concentration was 0.1 mg L−1 higher and SUVA was lower by 0.5 mg C L−1m−1 for early ice-out compared to late ice-out (Figure 7).
Patterns in algal biomass switched from spring to summer during the early and late ice-out years. In contrast to spring, integrated summer chlorophyll a concentration was 1.3 μg L−1 higher in the early ice-out year compared to late ice-out (Figure 7). Cell density patterns of D. stelligera were sustained across seasons and were six times lower in the early ice-out year (by 125 cells mL−1) compared to late ice-out. Summer cell densities of L. bodanica were equal when comparing early and late ice-out years with concentrations of 6.6 cells mL−1 (Figure 5). Overall seasonal patterns of D. stelligera and L. bodanica suggest that the spring and summer measurements were representative of seasonal patterns. Figure 8 demonstrates similar changes in the two phytoplankton species throughout the spring and summer seasons. D. stelligera and L. bodanica had lower cell densities during the early ice-out compared to the late ice-out year from May to mid June. D. stelligera remained lower from mid June to mid July while L. bodanica became more similar between early and late ice-out years. D. stelligera were consistently lower throughout the spring and summer seasons in the early ice-out year compared to the late ice-out year, differences throughout the season ranged from 88 to 148 cells mL−1 (Figure 8). L. bodanica were consistently lower from early May to mid June with differences ranging from 0.5 to 4.4 cells mL−1, slightly higher in early July by 0.96 cells mL−1 and lower by 0.37 cells mL−1 in mid July during the late ice-out year compared to the early ice-out year (Figure 8).

4. Discussion

Our results reveal differences in the response of certain lake metrics in Arctic and boreal regions between early and late ice-out years. During early compared to late ice-out years, Arctic lakes had deeper mixing depths while the boreal lake had a shallower mixing depth. This supports an influence of the timing of ice-out on the length of spring turnover as well as the strength and stability of stratification but with differing effects between the two regions. Nutrient concentrations and inferred limitation patterns also differed across years and regions, though the effects of other factors that determine nutrient loading to lakes (precipitation, permafrost thaw) likely played a stronger role in driving these patterns than the timing of ice-out. Biological responses in the two years across the two regions also differed, with no differences in algal biomass in the Arctic lakes in relation to ice-out and variable effects over seasons in the boreal lake. The cell densities of key Cyclotella sensu lato taxa that respond to thermal structure also varied across the years and regions. Collectively, our results indicate that the timing of ice-out is one important driver among many that influence the physical, chemical and biological responses of lake ecosystems to climate, and that the effects of ice-out timing differ between the two regions.
Stratification patterns differed between ice-out years and regions, likely owing to how the timing of ice-out relates to solar insolation patterns. Ice-out occurs between May and June in Arctic lakes, when solar insolation is near its peak ([49], Figure 9) and air temperatures are higher, relative to the year, thus Arctic lakes stratify quickly after ice-out. The length of spring turnover is generally short but important for the timing, depth and stability of stratification [50]. The rapid warming of surface layers in the late ice-out year, when ice off occurred only four days before the annual peak insolation, likely led to the observed shallower stratification depths across Arctic lakes. In contrast, ice-out occurs between March and May in boreal lakes, when solar insolation is lower relative to peak insolation ([49], Figure 9), leading to longer spring turnover periods with extended homothermal mixing of the water column compared to that in Arctic lakes. In the boreal lake, earlier ice-out led to a longer period of spring turnover compared to late ice-out, as the date of the onset of stratification in Jordan Pond for both years was similar. Shallower mixing depths during the early ice-out year correspond with stronger stability, stronger stratification and warmer water temperature at 2 m, similar to observations from King et al. [51]. Compared to the Arctic lakes, the effects of ice-out on the depth and stability of stratification were not as large in the boreal lake, even though the length of the spring turnover period in the boreal lake was 39 days longer. This finding is supported by other work that suggests the timing of the onset of stratification is not directly linked to ice-out timing [52,53].
Precipitation amounts were greater in the Arctic and boreal regions during the spring months in the early ice-out years, likely contributing to increased lake water nutrient concentrations. In the early ice-out years, the Arctic region had higher precipitation in May and June and the boreal region had higher precipitation from March through May. Spring precipitation in the Arctic region falls predominantly as snow, including the high precipitation in May during the early ice-out year, which was 82% snow. In the boreal region, precipitation mostly falls as snow from January through March and falls as mostly rain for the remaining spring and summer months. The increased precipitation in May during the early ice-out year fell as rain. Precipitation is a strong driver of increased nutrient inputs to lakes [55,56] and has important effects on terrestrial-aquatic linkages. In both Arctic and boreal lakes, nutrient concentrations and ratios in lakes are affected by alterations in terrestrial export related to climate influences on weathering, precipitation and runoff [57,58]. A key variable further influencing terrestrial-aquatic linkages and consequently nutrient limitation patterns in the Arctic, is permafrost thawing. Permafrost thawing is accelerating the delivery of P to many Arctic lakes [59,60], in part owing to mobilization of P stored in thawing permafrost as well as to changes in groundwater flow paths. Patterns in nutrient concentrations across years in our study differed regionally. In Arctic lakes, DIN concentrations were lower and TP concentrations were higher during the early ice-out year compared to the late ice-out year. In contrast, DIN concentrations in the boreal lake were higher in the early ice-out year and TP concentrations were the same during the two years. These differences in nutrient concentrations led to varying spring nutrient limitation patterns across the regions. Arctic lakes were N and P co-limited in the early ice-out year and P limited in the late ice-out year, while the boreal lake was P limited during both early and late ice-out years. Overall, climate differences between the ice-out years likely drove changes in terrestrial-aquatic linkages that dominated the different lake nutrient conditions, independent of direct effects of ice-out.
While precipitation and permafrost thaw are primary drivers of nutrients in lakes, internal processes related to changes in thermal structure can also influence nutrient availability [61,62]. Ice-out occurs closer to peak solar insolation in the Arctic lakes, likely contributing to short, perhaps incomplete, turnover periods and rapid stratification with late ice-out, with reduced entrainment of P into the photic zone. In contrast, regardless of ice-out timing, the boreal lake has a longer period of spring turnover than Arctic lakes, leading to complete turnover. These differences, in addition to changes in precipitation and permafrost, may influence nutrient cycling and nutrient availability within the lakes. Changes in the depth of the mixed surface layer, or epilimnion, can also alter nutrient cycling [28,62]; however, our results do not provide direct links between nutrient availability and thermal structure or the timing of ice-out. In our study, more precipitation occurred during the early ice-out period, after ice-out and before stratification, which may have influenced DIN and TP concentrations due to runoff. It is possible that precipitation, temperature and epilimnion thickness all contributed to varying DIN concentrations and N:P ratios across all lakes, but direct links between nutrients and the timing of ice-out remain unclear. With continued changes in climate, the relationships between nutrient availability and length of spring turnover and lake thermal structure warrant further study.
Secchi depth was deeper during the early ice-out year in all lakes, while DOC concentrations and SUVA254 were variable in the Arctic and boreal regions. In the Arctic lake, DOC concentrations and SUVA254 were higher in the early ice-out year compared to the late ice-out year and in the boreal lake, DOC concentrations and SUVA254 showed little change between ice-out years. DOC strongly influences transparency in lakes and, similar to nutrients, is altered by many factors in addition to ice-out. In the Arctic region, these factors may include precipitation and permafrost thaw and the deepening of soil active layers [63,64], as well as photodegradation [34], which may increase with earlier ice-out. Cory et al. [36] found changes in DOC may be driven by photochemical oxidation of organic carbon and that sunlight may control the fate of DOC in Arctic surface waters. Our results are inconsistent with photodegradation as a primary mechanism controlling DOC, as DOC concentrations and SUVA254 were higher during the early ice-out year. Higher DOC and SUVA254 in the early ice-out year suggest that precipitation and permafrost thaw are likely important drivers in explaining our results. Precipitation was higher in May and June during the early ice-out year, which could increase inputs from terrestrial-aquatic linkages. It is important to note that the Arctic lakes in this study have low color DOC [65], therefore deep Secchi depths may be accompanied by high DOC concentrations. In the boreal region, DOC is usually dominated by allochthonous material and lake water DOC concentrations often increase with precipitation [66]. Similar DOC and SUVA254 values in early and late ice-out years do not provide evidence to support links between DOC and ice-out, nor do we have enough evidence to elucidate mechanisms in links between similar DOC and deeper Secchi depth in the early ice-out year based on our results. Based on our evidence, differences in climate have strong controls on changes in DOC, which are likely key contributors to the differences observed in this study, rather than direct effects from ice-out.
Algal biomass varied little between early and late ice-out years in both the Arctic lakes and the boreal lake, with algal biomass generally being slightly lower in the early ice-out years compared to the late ice-out years. An exception to this finding occurred during the summer season in the boreal lake, in which algal biomass was higher in the early ice-out year. This result contrasts with other work that suggests increases in algal biomass due to warming [67,68,69] and earlier ice-out regimes [34]; however, Kraemer et al. [70] found that there is not a direct relationship between warming and algal biomass. Instead, lake surface temperature and trophic state are important in determining algal biomass, thus nutrients and light may be key contributors in algal biomass response and not only lake warming or direct ice-out effects.
The responses of key diatom taxa that are often indicators of thermal structure conditions varied across the two regions. In the Arctic lakes, differences in thermal stratification depths across ice-out years affected cell densities of key diatom taxa in the spring. Cell densities of D. stelligera and L. radiosa were lower during the early ice-out year, with deeper mixing depths, compared to the late ice-out year. Discostella stelligera is more abundant in lakes with shallower mixing depths [40], and L. radiosa is more abundant under high light conditions typical of shallower mixing depths [71]. In contrast, cell densities of L. bodanica were higher during the early ice-out year with deeper mixing depths; this taxon has a deeper mixing depth optimum than other Cyclotella taxa [46]. Patterns for these species in Arctic lakes indicated a strong relationship with mixing depth, resulting in differences in cell densities across differing ice-out years. In contrast, links between these taxa and thermal structure were less clear in the boreal lake. Discostella stelligera was more abundant in the late ice-out year, which had deeper mixing depths; this pattern was sustained over the entire open-water season. The same pattern was observed for L. bodanica, even though mixing depths showed only small differences across the two ice-out years. Boeff et al. [18] also found that D. stelligera was more abundant in some Maine lakes in late ice-out years, in contrast to the early ice-out patterns found in some other areas [14,17]. The effects of the complex interactions between light and nutrients on Cyclotella taxa are well known and reviewed by Saros & Anderson [72], and are likely behind the weaker links between thermal structure and taxon responses in this boreal lake compared to those observed in Arctic lakes.
Identifying seasonal effects throughout the open water season provides important insights into the differences between lake responses in Arctic and boreal regions. In Arctic lakes, with the exception of temperature at 2 m, spring and summer response of lake metrics (Figure 4) are sustained between the seasons from the early ice-out year to both the 2013 and 2015 late ice-out years. The biggest difference between spring and summer was a decrease in overall cell densities of phytoplankton (Figure 5). The change in water temperature across the Arctic lakes was likely due to differences between the different late ice-out years used in this study. The boreal lake had larger differences in the lake metric values between spring and summer and a switch in algal biomass and SUVA254 concentrations between the early and late ice-out years (Figure 7). The use of two different late ice-out years for the Arctic region make comparisons between spring and summer difficult, however the variation in lake metric values, cell densities of phytoplankton and changes in lake characteristics between the Arctic and boreal regions are likely due to climate conditions at ice-out, which include differences in solar insolation, precipitation and temperature, as well as differences in the timing of stratification relative to ice-out between the two regions. Further investigation of how changes to lake variables are sustained throughout the season relative to ice-out and climate factors could provide important insights about drivers of change in phytoplankton community structure.
Our research provides evidence that lake responses in Arctic and boreal regions differ between early and late ice-out years. However, it is ultimately a combination of climate factors, importantly solar insolation, air temperature, precipitation, and, in the Arctic, permafrost thaw, that are key drivers of the observed responses. Key findings of this study include regional differences in mixing depths and the relationships between length of spring turnover and the strength and stability of stratification. These differences, in concert with climate factors, have further implications for nutrient and light availability and subsequent effects on phytoplankton community structure and biomass. Future work that explicitly examines the pathways and links between the physical and biological effects would strengthen the understanding of how the timing of ice-out influences the biological properties within lakes. Regional differences within the Northern Hemisphere can elicit contrasting lake responses, which will be altered with future climate changes, thus underscoring the importance of this research.

Acknowledgments

Collection of the Arctic dataset was funded by two grants from the US National Science Foundation (grants #1203434 and #1144423) and the Dan & Betty Churchill Fund. Collection of the boreal dataset was funded by the Maine Agricultural and Forest Experiment Station Project ME021409. We are grateful to Benjamin Burpee, Carl Tugend, Emily Rice, Steve Juggins and Andrea Nurse for field assistance and to CH2M Hill Polar Services for providing logistical support in the Arctic. We are also grateful to William Gawley who provided observed ice out dates for Jordan Pond, and also provided air temperature and precipitation data as well as logistical support in Acadia National Park.

Author Contributions

J.E.S. conceived the concept of the paper and organized sampling at all locations. K.A.W., J.E.S., R.A.F., R.M.N. and H.I.M. conducted fieldwork. J.M. conducted all Arctic phytoplankton identifications and counts and H.I.M. conducted all boreal phytoplankton analysis. All authors contributed initial data compilation and analyses. K.A.W. conducted further analyses and K.A.W. and R.A.F. generated figures. K.A.W. and J.E.S. wrote the paper. All authors read and approved the final manuscript.

Conflicts of Interest

The authors declare no conflict of interest. The founding sponsors had no role in the design of the study; in the collection, analyses, or interpretation of data; in the writing of the manuscript and in the decision to publish the results.

Appendix A

Table A1. Ice-out dates from 2010 to 2016 for the Arctic lakes and the boreal lake. Ice-out is defined as the first date that the lake is completely ice-free.
YearArctic (Greenland)Boreal (Jordan Pond)
201024 May22 March
201114 June16 April
20123 June19 March
20139 June4 April
201413 June14 April
201517 June29 April
201617 May17 March

References

  1. Kuusisto, E. An analysis of the longest ice observation series made on Finish lakes. Aqua Fenn 1987, 17, 123–132. [Google Scholar]
  2. Schindler, D.W.; Beaty, K.G.; Fee, E.J.; Cruikshank, D.R.; DeBruyn, E.R.; Findlay, D.L.; Linsey, G.A.; Shearer, J.A.; Stainton, M.P.; Turner, M.A. Effects of climatic warming on lakes of the central boreal forest. Science 1990, 250, 967–970. [Google Scholar] [CrossRef] [PubMed]
  3. Livingstone, D.M. Large-scale climatic forcing detected in historical observations of lake ice break-up. Verh. Int. Ver. Theor. Angew. Limnol. 2000, 27, 2775–2783. [Google Scholar] [CrossRef]
  4. Magnuson, J.J.; Robertson, D.M.; Benson, B.J.; Wynne, R.H.; Livingstone, D.M.; Arai, T.; Assel, R.A.; Barry, R.G.; Card, V.; Kuusisto, E.; et al. Historical trends in lake and river ice cover in the Northern Hemisphere. Science 2000, 289, 1743–1746. [Google Scholar] [CrossRef] [PubMed]
  5. Futter, M.N. Pattern and trends in Southern Ontario lake ice phenology. Environ. Monit. Assess. 2003, 88, 431–444. [Google Scholar] [CrossRef] [PubMed]
  6. Sporka, F.; Livingstone, D.M.; Stuchlik, E.; Turek, J.; Galas, J. Water temperatures and ice cover in lakes of the Tatra Mountains. Biologia 2006, 61, S77–S90. [Google Scholar] [CrossRef]
  7. Adrian, R.; O’Reilly, C.M.; Zagarese, H.; Baines, S.B.; Hessen, D.O.; Keller, W.; Livingstone, D.M.; Sommaruga, R.; Straile, D.; Van Donk, E.; et al. Lakes as sentinels of change. Limnol. Oceanogr. 2009, 54, 2283–2297. [Google Scholar] [CrossRef] [PubMed] [Green Version]
  8. Weyhenmeyer, G.A.; Meili, M.; Livingstone, D.M. Systematic differences in the trend towards earlier ice-out on Swedish lakes along a latitudinal temperature gradient. Verh. Int. Ver. Theor. Angew. Limnol. 2005, 29, 257–260. [Google Scholar] [CrossRef]
  9. Jensen, O.P.; Benson, B.J.; Magnuson, J.J.; Card, V.M.; Futter, M.N.; Soranno, P.A.; Stewart, K.M. Spatial analysis of ice phenology trends across the Laurentian Great Lakes region during a recent warming period. Limnol. Oceanogr. 2007, 52, 2013–2026. [Google Scholar] [CrossRef]
  10. Beier, C.M.; Stella, J.C.; Dovciak, M.; McNulty, S.A. Local climatic drivers of changes in phenology at a boreal-temperate ecotone in eastern North America. Clim. Chang. 2012, 115, 399–417. [Google Scholar] [CrossRef]
  11. Benson, B.J.; Magnuson, J.J.; Jensen, O.P.; Card, V.M.; Hodgkins, G.; Korhonen, J.; Livingstone, D.M.; Stewart, K.M.; Weyhenmeyer, G.A.; Granin, N.G. Extreme events, trends and variability in Northern Hemisphere lake-ice phenology (1855–2005). Clim. Chang. 2012, 112, 299–323. [Google Scholar] [CrossRef]
  12. Smejkalova, T.; Edwards, M.; Jadunandan, D. Arctic lakes show strong decadal trend in earlier spring ice-out. Sci. Rep. 2016, 6, 38449. [Google Scholar] [CrossRef] [PubMed]
  13. Rühland, K.; Smol, J.P. Diatom shifts as evidence for recent Subarctic warming in a remote tundra lake, NWT, Canada. Paleogeogr. Paleoclimatol. Paleoecol. 2005, 226, 1–16. [Google Scholar] [CrossRef]
  14. Rühland, K.; Paterson, A.M.; Smol, J.P. Hemispheric-scale patterns of climate-related shifts in planktonic diatoms from North American and European lakes. Glob. Chang. Biol. 2008, 14, 2740–2754. [Google Scholar] [CrossRef]
  15. Rühland, K.; Paterson, A.M.; Smol, J.P. Lake diatom response to warming: Reviewing the evidence. J. Paleolimnol. 2015, 54, 1–35. [Google Scholar] [CrossRef]
  16. Smol, J.P.; Douglas, M.S. Crossing the final ecological threshold in high Arctic ponds. Proc. Natl. Acad. Sci. USA 2007, 104, 12395–12397. [Google Scholar] [CrossRef] [PubMed]
  17. Wiltse, B.; Paterson, A.M.; Findlay, D.L.; Cumming, B.F. Seasonal and decadal patterns in discostella (Bacillariophyceae) species from bi-weekly records of two boreal lakes (Experimental Lakes Area, Ontario Canada). J. Phycol. 2016, 52, 817–826. [Google Scholar] [CrossRef] [PubMed]
  18. Boeff, K.A.; Strock, K.E.; Saros, J.E. Evaluating planktonic diatom response to climate change across three lakes with differing morphometry. J. Paleolimnol. 2016, 56, 33–47. [Google Scholar] [CrossRef]
  19. Kienel, U.; Kirillin, G.; Brademann, B.; Plessen, B.; Lampe, R.; Brauer, A. Effects of spring warming and mixing duration on diatom deposition in deep Tiefer See, NE Germany. J. Paleolimnol. 2017, 57, 37–49. [Google Scholar] [CrossRef]
  20. Meis, S.; Thackeray, S.J.; Jones, I.D. Effects of recent climate change on phytoplanton phenology in a temperate lake. Freshwater Biol. 2009, 54, 1888–1898. [Google Scholar] [CrossRef]
  21. Peltomaa, E.; Ojala, A.; Holopainen, A.L.; Salonen, K. Changes in phytoplankton in a boreal lake during a 14-year period. Boreal Environ. Res. 2013, 18, 387–400. [Google Scholar]
  22. McBean, G. Arctic Climate Impact Assessment—Scientific Report; Cambridge University Press: Cambridge, UK, 2005. [Google Scholar]
  23. Screen, J.A.; Simmonds, I. The central role of diminishing sea ice in recent Arctic temperature amplification. Nature 2010, 464, 1334–1337. [Google Scholar] [CrossRef] [PubMed] [Green Version]
  24. Jeong, J.H.; Kug, J.S.; Linderholm, H.W.; Chen, D.; Kim, B.M.; Jun, S.Y. Intensified Arctic warming under greenhouse warming by vegetation-atmosphere-sea ice interaction. Environ. Res. Lett. 2014, 9, 94007. [Google Scholar] [CrossRef]
  25. Peeters, F.; Straile, D.; Lorke, A.; Livingstone, D.M. Earlier onset of the spring phytoplankton bloom in lakes of the temperate zone in a warmer climate. Glob. Chang. Biol. 2007, 13, 1898–1909. [Google Scholar] [CrossRef]
  26. Livingstone, D.M. A change of climate provokes a change of paradigm: Taking leave of two tacit assumptions about physical lake forcing. Int. Rev. Hydrobiol. 2008, 93, 404–414. [Google Scholar] [CrossRef]
  27. Weyhenmeyer, G.A.; Meili, M.; Livingstone, D.M. Nonlinear temperature response of lake ice breakup. Geophys. Res. Lett. 2004, 31, L07203. [Google Scholar] [CrossRef]
  28. DeStasio, B.T.; Hill, D.K.; Kelinhans, J.M.; Nibbelink, N.P.; Magnuson, J.J. Potential effects of global climate change on small north-temperate lakes: Physics, fish and plankton. Limnol. Oceanogr. 1996, 41, 1136–1149. [Google Scholar] [CrossRef]
  29. Peeters, F.; Livingstone, D.M.; Goudsmit, G.H.; Kipfer, R.; Forster, R. Modeling 50 years of historical temperature profiles in a large central European lake. Limnol. Oceanogr. 2002, 47, 186–197. [Google Scholar] [CrossRef]
  30. Douglas, M.S.V.; Smol, J.P.; Pienitz, R.; Hamilton, P. Algal indicators of environmental change in Arctic and Antarctic lakes and ponds. In Long-Term Environmental Change in Arctic and Antarctic Lakes; Pienitz, R., Douglas, M.S.V., Smol, J.P., Eds.; Springer: Dordrecht, The Netherlands, 2004; pp. 117–157. [Google Scholar]
  31. Preston, D.L.; Caine, N.; McKnight, D.M.; Williams, M.W.; Hell, K.; Miller, M.P.; Hart, S.J.; Johnson, P.T.J. Climate regulates alpine lake ice cover phenology and aquatic ecosystem structure. Geophys. Res. Lett. 2016, 43, 5353–5360. [Google Scholar] [CrossRef]
  32. Beyene, M.T.; Jain, S. Wintertime weather-climate variability and its links to early spring ice-out in Maine lakes. Limnol. Oceanogr. 2015, 60, 1890–1905. [Google Scholar] [CrossRef]
  33. Hampton, S.E.; Galloway, A.W.E.; Powers, S.M.; Ozersky, T.; Woo, K.H.; Batt, R.D.; Labou, S.G.; O’Reilly, C.M.; Sharma, S.; Lotting, N.R.; et al. Ecology under lake ice. Ecol. Lett. 2017, 20, 98–111. [Google Scholar] [CrossRef] [PubMed]
  34. De Senerpont Domis, L.N.; Elser, J.J.; Gsell, A.S.; Huszar, V.L.M.; Ibelings, B.W.; Jeppesen, E.; Kosten, S.; Mooij, W.M.; Roland, F.; Sommer, U.; et al. Plankton dynamics under different climatic conditions in space and time. Freshwater Biol. 2013, 58, 463–482. [Google Scholar] [CrossRef]
  35. Powers, S.M.; Labou, S.G.; Baulch, H.M.; Hunt, R.J.; Lottig, N.R.; Hampton, S.E.; Stanley, E.H. Ice duration drives winter nitrate accumulation in north temperate lakes. Limnol. Oceanogr. Lett. 2017, 2, 177–186. [Google Scholar] [CrossRef]
  36. Cory, R.M.; Ward, C.P.; Crump, B.C.; Kling, G.W. Sunlight controls water column processing of carbon in Arctic freshwaters. Science 2014, 345, 925–928. [Google Scholar] [CrossRef] [PubMed]
  37. Levine, M.A.; Whalen, S.C. Nutrient limitation of phytoplankton production in Alaskan Arctic foothill lakes. Hydrobiologia 2001, 455, 189–201. [Google Scholar] [CrossRef]
  38. Nielsen, A.B. Present Conditions in Greenland and the Kangerlussuaq Area, Working Report. Geological Survey of Denmark and Greenland. 2010. Available online: http://www.posiva.fi/files/1244/WR_2010-07web.pdf (assessed on 30 October 2017).
  39. Hasholt, B.; Anderson, N.J. On the formation and stability of oligosaline lakes in the arid, low arctic area of Kangerlussuaq, south-west Greenland. In Proceedings of the Northern Research Basins-14th International Symposium and Workshop, Greenland, Denmark, 25–29 August 2003; C.A. Reitzel: Kobenhavn, Denmark, 2003; pp. 41–48. [Google Scholar]
  40. Saros, J.E.; Northington, R.M.; Anderson, D.S.; Anderson, N.J. A whole-lake experiment confirms a small centric diatom species as an indicator of changing lake thermal structure. Limnol. Oceanogr. Lett. 2016, 1, 27–35. [Google Scholar] [CrossRef]
  41. Brodersen, K.P.; Anderson, N.J. Subfossil insect remains (Chironomidae) and lake-water temperature inference in the Sisimiut-Kangerlussuaq region, southern West Greenland. Geol. Greenland Surv. Bull. 2000, 186, 78–82. [Google Scholar]
  42. Anderson, N.J.; Harriman, R.; Ryves, D.B.; Patrick, S.T. Dominant factors controlling variability in the ionic composition of West Greenland lakes. Arct. Antarct. Alp. Res. 2001, 33, 418–425. [Google Scholar] [CrossRef]
  43. Gilman, R.A.; Chapman, C.A.; Lowell, T.V.; Borns, H.W., Jr. The Geology of Mount Desert Island: A Visitors Guide to the Geology of Acadia National Park; Maine Geol. Surv., Department of Conservation: Augusta, GA, USA, 1988; pp. 1–50.
  44. Read, J.S.; Hamilton, D.P.; Jones, I.D.; Muraoka, K.; Winslow, L.A.; Kroiss, R.; Wu, C.H.; Gaiser, E. Derivation of lake mixing and stratification indices from high-resolution lake buoy data. Environ. Model Softw. 2011, 25, 1325–1336. [Google Scholar] [CrossRef]
  45. APHA (American Public Health Association). Standard Methods for the Examination of Water and Wastewater, 20th ed.; APHA: Washington, DC, USA, 2000. [Google Scholar]
  46. Bergström, A.K. The use of TN:TP and DIN:TP ratios as indicators for phytoplankton nutrient limitation in oligotrophic lakes affected by N deposition. Aquat. Sci. 2010, 72, 277–281. [Google Scholar] [CrossRef]
  47. Helms, J.R.; Stubbins, A.; Ritchie, J.D.; Minor, E.C.; Kieber, D.J.; Mopper, K. Absorption spectral slopes and slope ratios as indicators of molecular weight, source and photobleaching of chromophric dissolved organic matter. Limnol. Oceanogr. 2008, 53, 955–969. [Google Scholar] [CrossRef]
  48. Saros, J.E.; Stone, J.R.; Pederson, G.T.; Slemmons, K.E.H.; Spanbauer, T.; Schliep, A.; Cahl, D.; Williamson, C.E.; Engstrom, D.R. Climate-induced changes in lake ecosystem structure inferred from coupled neo- and paleoecological approaches. Ecology 2012, 93, 2155–2164. [Google Scholar] [CrossRef] [PubMed]
  49. Kirk, J.T.O. Light and Photosynthesis in Aquatic Ecosystems, 2nd ed.; Cambridge University Press: New York, NY, USA, 1994; pp. 40–45. ISBN 0521459664. [Google Scholar]
  50. Prowse, T.D.; Wrona, F.J.; Reist, J.D.; Gibson, J.J.; Hobbie, J.E.; Levesque, L.M.J.; Vincent, W.F. Climate change effects on hydroecology of Arctic freshwater ecosystems. AMBIO 2006, 35, 347–358. [Google Scholar] [CrossRef]
  51. King, J.R.; Shuter, B.J.; Zimmerman, A.P. Signals of climate trends and extreme events in thermal stratification pattern of multibasin Lake Opeongo, Ontario. Can. J. Fish. Aquat. Sci. 1999, 56, 847–852. [Google Scholar] [CrossRef]
  52. Weyhenmeyer, G.A.; Blenckner, T.; Pettersson, K. Changes of the plankton spring outburt related to the North Atlantic Oscillation. Limnol. Oceanogr. 1999, 44, 1788–1792. [Google Scholar] [CrossRef]
  53. Arvola, L.; George, G.; Livingstone, D.M.; Järvinen, M.; Blenckner, T.; Dokulil, M.T.; Jennings, E.; Aonghusa, C.N.; Nõges, P.; Nõges, T.; et al. The impact of the changing climate on the thermal characteristics of lakes. In The Impact of Climate Change on European Lakes; Aquatic Ecology Series; George, G., Ed.; Springer: Dordrecht, The Netherlands, 2009; Volume 4, pp. 85–102. ISBN 978-90-481-2944-7. [Google Scholar]
  54. Buffo, J.; Fritschen, L.J.; Murphy, J.L. Direct Solar Radiation on Various Slopes from 0 to 6 Degrees North Latitude; USDA Forest Service Research Paper, PNW-142; Pacific Northwest Forest and Range Experiment Station: Portland, OR, USA, 1972. [Google Scholar]
  55. Jeppesen, E.; Kronvang, B.; Olesen, J.E.; Larson, S.E.; Audet, J.; Søndergaard, M.; Hoffmann, C.C.; Andersen, H.E.; Lauridsen, T.L.; Liboriussen, L.; et al. Climate Change effects on nitrogen loading from cultivated catchments in Europe: Implications for nitrogen retention, ecological state of lakes and adaptation. Hydrobiologia 2011, 633, 1–21. [Google Scholar] [CrossRef]
  56. Fulton, R.S., III; Godwin, W.F.; Schaus, M.H. Water quality changes following nutrient loading reduction and biomanipulation in a large shallow subtropical lake, Lake Griffin, Florida, USA. Hydrobiologia 2015, 753, 243–263. [Google Scholar] [CrossRef]
  57. Bergström, A.-K.; Jannson, M. Atmospheric nitrogen deposition has cause nitrogen enrichment and eutrophication of lakes in the Northern Hemisphere. Glob. Chang. Biol. 2006, 12, 635–643. [Google Scholar] [CrossRef]
  58. Rip, W.J.; Ouboter, M.R.L.; Los, H.J. Impact of climatic fluctuations on Characeae biomass in a shallow, restored lake in the Netherlands. Hydrobiologia 2007, 584, 415–424. [Google Scholar] [CrossRef]
  59. Hobbie, J.E.; Peterson, B.J.; Bettez, N.; Deegan, L.; O’Brien, W.J.; Kling, G.W.; Kipphut, G.W.; Bowden, W.B.; Hershey, A.E. Impact of global change on the biogeochemistry and ecology of an Arctic freshwater system. Polar Res. 1999, 18, 207–214. [Google Scholar] [CrossRef]
  60. Frey, K.E.; McClelland, J.W. Impacts of permafrost degradation on Arctic river biogeochemistry. Hydrol. Process. 2009, 23, 169–182. [Google Scholar] [CrossRef]
  61. Jeppesen, E.; Søndergaard, M.; Jensen, J.P.; Havens, K.E.; Anneville, O.; Carvalho, L.; Coveney, M.F.; Deneke, R.; Dokulil, M.T.; Foy, B.; et al. Lake responses to reduced nutrient loading-an analysis of contemporary long-term data from 35 case studies. Freshwater Biol. 2005, 50, 1747–1771. [Google Scholar] [CrossRef]
  62. Wilhelm, S.; Adrian, R. Impact of summer warming on the thermal characteristics of a polymictic lake and consequences for oxygen, nutrients and phytoplankton. Freshwater Biol. 2008, 53, 226–237. [Google Scholar] [CrossRef]
  63. Frey, K.E.; Siegel, D.I.; Smith, L.C. Geochemistry of west Siberian streams and their potential response to permafrost degradation. Water Resour. Res. 2007, 43, W03406. [Google Scholar] [CrossRef]
  64. Tank, S.E.; Frey, K.E.; Striegl, R.G.; Raymond, P.A.; Holmes, R.M.; McClelland, J.W.; Peterson, B.J. Landscape-level controls on dissolved organic carbon flux from diverse catchments of the circumboreal. Glob. Biogeochem. Cycles 2012, 26, GB0E02. [Google Scholar] [CrossRef]
  65. Saros, J.E.; Northington, R.M.; Osburn, C.L.; Burpee, B.T.; Anderson, N.J. Thermal stratification in small Arctic lakes of southwest Greenland affected by water transparency and epilimnetic temperatures. Limnol. Oceanogr. 2016, 61, 1530–1542. [Google Scholar] [CrossRef]
  66. Parker, B.R.; Vinebrooke, R.D.; Schindler, D.W. Recent climate extremes alter alpine lake ecosystems. Proc. Natl. Acad. Sci. USA 2008, 105, 12917–12931. [Google Scholar] [CrossRef] [PubMed]
  67. Persson, L. Trophic interactions in temperate lake ecosystems: A test of food chain theory. Am. Nat. 1992, 140, 59–84. [Google Scholar] [CrossRef]
  68. Jeppesen, E. The impact of nutrient state and lake depth on top down control in the pelagic zone of lakes: A study of 466 lakes from the temperate zone to the Arctic. Ecosystems 2003, 6, 313–325. [Google Scholar] [CrossRef]
  69. Hansson, L. Food-chain length alters community responses to global change in aquatic systems. Nat. Clim. Chang. 2012, 2, 1–6. [Google Scholar] [CrossRef]
  70. Kraemer, B.M.; Mehner, T.; Adrian, R. Reconciling the opposing effects of warming on phytoplankton biomass in 188 large lakes. Sci. Rep. 2017, 7, 10762. [Google Scholar] [CrossRef] [PubMed]
  71. Malik, H.I.; Saros, J.E. Effects of temperature, light and nutrients on five Cyclotella sensu lato taxa assessed with in situ experiments in Arctic lakes. J. Plankton Res. 2016, 38, 431–442. [Google Scholar] [CrossRef]
  72. Saros, J.E.; Anderson, N.J. The ecology of the planktonic diatom Cyclotella and its implications for global environmental change studies. Biol. Rev. 2015, 90, 522–541. [Google Scholar] [CrossRef] [PubMed]
Figure 1. Conceptual diagram of a subset of the potential effects of ice-out on lake ecosystems.
Water 10 00078 g001
Figure 2. Map depicting the location of the (A) Arctic and (B) boreal study sites.
Water 10 00078 g002
Figure 3. Arctic (A) average monthly air temperature in °C and (B) total monthly precipitation in mm for early and late ice-out years.
Water 10 00078 g003
Figure 4. Comparison of lake metrics for early and late ice-out conditions during the spring and summer in Arctic lakes. Responses of the three Arctic lakes are averaged (mean ± standard error) on each date. For the 2016 early ice-out year, spring sampling occurred from 28–30 June and summer sampling was conducted from 15–17 July. For late ice-out years, spring sampling occurred from 27 June–1 July 2015 and summer sampling was conducted from 19–21 July 2013.
Water 10 00078 g004
Figure 5. Comparison of (A) Discostella stelligera; (B) Lindavia bodanica; and (C) Lindavia radiosa in Arctic lakes and (D) Discostella stelligera and (E) Lindavia bodanica in a boreal lake for early and late ice-out years. Phytoplankton collection occurred at the time of sampling for all lake metrics for spring and summer and early and late ice-out years. Responses of the three Arctic lakes are averaged (mean ± standard error) on each date. Purple points indicate overlapping results for early and late ice-out years.
Water 10 00078 g005
Figure 6. Boreal (A) average monthly air temperature in °C and (B) total monthly precipitation in mm for early and late ice-out years.
Water 10 00078 g006
Figure 7. Comparison of lake metrics for early and late ice-out conditions during the spring and summer in the boreal lake. Responses represent one sampling for each of the time periods. For the 2012 early ice-out year, spring sampling occurred on 11 June and summer sampling was conducted on 12 July. For the 2015 late ice-out year, spring sampling occurred on 11 June and summer sampling was conducted on 10 July. Purple points indicate overlapping results for early and late ice-out years.
Water 10 00078 g007
Figure 8. Seasonal comparison of (A) Discostella stelligera and (B) Lindavia bodanica in the boreal lake from May to mid-July during early and late ice-out years.
Water 10 00078 g008
Figure 9. Change in daily solar insolation from January through July for 60° N (representative of the Arctic region) and 40° N (representative of the boreal region). Vertical dashed lines indicate early (red) and late (blue) ice-out dates for the Arctic region and vertical solid lines indicate early (red) and late (blue) ice-out dates for the boreal region. Late ice-out is averaged between the 2013 and 2015 ice-out years. Data are plotted from Buffo et al. [54].
Water 10 00078 g009
Table 1. Dates of comparison for early ice-out versus late ice-out years in Arctic and boreal ecosystems. Comparisons were also made in the late spring (denoted Spring) and in mid-summer during peak thermal stratification (denoted Summer). Range of dates for Arctic includes sampling at all three lakes.
Region SpringSummer
Early Ice-OutLate Ice-OutEarly Ice-OutLate Ice-Out
ArcticYear2016201520162013
Ice-out date18 May17 June18 May9 June
Sampling dates28–30 June27 June–1 July15–17 July19–21 July
BorealYear2012201520122015
Ice-out date19 March29 April19 March29 April
Sampling dates11 June11 June12 July10 July
Table 2. Select characteristics of the four study lakes.
RegionLakeLatLongElevation (m)Surface Area (km2)Volume (×106 m3)Max Depth (m)
ArcticSS266.99−50.961900.3682.4912
SS8566.98−51.061950.2460.9411
SS159067.01−50.982000.2431.1618
BorealJordan44.33−68.26830.80017.445

